Attached files
| file | filename |
|---|---|
| 8-K - CHINA FUND INC | v237517_8-k.htm |
|
THE CHINA FUND, INC. (CHN)
MONTHLY INSIGHT
|
|
AT SEPTEMBER 30, 2011
|
IN BRIEF
|
|
|
Net asset value per share
|
US$26.67
|
|
Market price
|
US$23.00
|
|
Premium/(discount)
|
(13.76%)
|
|
Fund size
|
US$607.7m
|
|
Source: State Street Bank and Trust Company.
|
|
|
At September 30, 2011
|
US$ return
|
|||||||
|
China Fund
NAV
|
MSCI Golden
Dragon*
|
|||||||
|
%
|
%
|
|||||||
|
One month
|
(13.6 | ) | (14.8 | ) | ||||
|
Year to date
|
(24.5 | ) | (22.3 | ) | ||||
|
One year
|
(18.5
|
)
|
(17.3
|
)
|
||||
|
Three years % pa
|
12.2 | 7.1 | ||||||
Past performance is not a guide to future returns.
Source: State Street Bank and Trust Company.
NAV performance. *Source for index data: MSCI.
FUND MANAGER

Shifeng Ke
MANAGER’S COMMENTARY
Chinese equity markets plunged again in September, taking all benchmark indices into bear-market territory. Volatility spiked too, as investors engaged in another round of panic selling. Turnover in stocks fell, indicating weak liquidity in the stockmarkets.
The more the market fell, the more bearish the newsflow became. China’s inflation is proving resistant to official remedies; although the consumer price index slowed to 6.2% in August, down from a three-year high of 6.5% in July, it is still too high for comfort. Liquidity is getting tighter. In August, total new loans declined to Rmb548 billion. Borrowing costs for small and medium-sized companies are rising sharply, with local media reporting that the ‘underground’ lending rate in Wenzhou (the Chinese city with the most highly developed private economy) had hit 69% in September, with around 30 local entrepreneurs either fleeing or committing suicide over the past four months. Mounting concern over China’s underground banking system has translated into a general sell-off in offshore Chinese equities.
Meanwhile, constrained liquidity caused the volume of property transactions in first-tier cities to fall sharply in August. In Shanghai, home sales fell to a six-year low; in Beijing, they fell 22.9% year on year, to their lowest since 1999. Nevertheless, as the prices of new homes rose in August in all 70 of the major cities monitored by the authorities, the central government will continue to take measures to keep prices at reasonable levels. The home-appliance sector underperformed in September, on the news that the ‘go rural’ policy would be withdrawn at the end of this year. Shares of Huiyin Household (1280 HK) suffered, but our contacts with the company suggest that the impact will be negligible.
Further bad news came in the form of the large number of big IPOs being pumped out to suck up liquidity. In the A-share markets, Sinohydro, the mainland’s largest dam builder, reduced the size of its IPO on the Shanghai Stock Exchange. It now expects to raise US$2.7 billion, but could be eclipsed by China Communications Construction, the country’s largest constructor of ports, which plans to raise US$3 billion. In Hong Kong, the IPO market almost ground to a halt as XCMG Construction Machinery, China’s biggest crane-maker, scrapped plans to raise about US$1.1 billion. Construction-equipment firm Sany Heavy Industry has postponed the launch of a US$3.3 billion listing, and Xiao Nan Guo Restaurant Holdings said that it would pull its US$75 million offering.
Lastly, in this febrile market, the reaction to rumors is overwhelming: Chaoda, China’s largest vegetable grower, dropped 26% in one day on fears of misconduct; meanwhile, Ping An Insurance sold off in both the H-share and A-share markets on rumors of huge losses at Hong Kong property developer Greentown and Fortis Group. The rumors were denied by both companies.
There was, however, some encouraging news. Inflation may have already peaked, although it will not decline swiftly. Export growth accelerated to 24.5% year on year in August, up from 20.4% in July, while import growth rebounded strongly to 30.2%. China’s official purchasing managers’ index rose to 51.2%, which suggests that growth in manufacturing activity remained stable on a sequential basis. Inflation in Taiwan is still low, with the island’s consumer price index up just 1.34% in August. Taiwan’s unemployment rate edged down to 4.4% in August, and total employment continued to rise. And the Greater China stockmarkets are now very cheap!
Source: Martin Currie Investment Management.
INVESTMENT STRATEGY
The Fund is 94.3% invested with holdings in 58 companies.
During the month, we continued to take advantage of the sharp market correction to add stocks we have been watching for a while. We made two new investments. The first was Far East Horizon (3360 HK), the largest financial leasing company in China. This firm focuses on small and medium-sized companies, which have urgent need of financing given tight monetary policy. The second addition was Asian Citrus
MONTHLY INSIGHT
Holdings (73 HK), China’s biggest producer of oranges and tropical-fruit-juice concentrate. The sharp correction in its share price was triggered purely by speculation about misconduct at Chaoda Modern Agriculture, its second-largest shareholder. We also topped up our holdings in fast-food chain Ajisen China Holdings (538 HK).
On the sell side, we realized losses by exiting Boshiwa (children’s clothing) on disappointing first-half results and higher-than-expected marketing expenses for new shops. We have finally lost patience with Far East Energy, as the company seems to have no way of ramping up production of coal-bed methane.
Shifeng Ke, Martin Currie Inc*
|
FUND DETAILS
|
|
|
Market cap
|
US$524.0m
|
|
Shares outstanding
|
22,781,762
|
|
Exchange listed
|
NYSE
|
|
Listing date
|
July 10, 1992
|
|
Listing and direct investment manager
|
Martin Currie Inc
|
|
Source: State Street Bank and Trust Company.
|
ASSET ALLOCATION

Source: State Street Bank and Trust Company
|
INDUSTRY ALLOCATION
|
||||||||
|
The China Fund, Inc %
|
MSCI Golden Dragon %
|
|||||||
|
Healthcare
|
23.7 | 0.4 | ||||||
|
Consumer discretionary
|
16.8 | 6.6 | ||||||
|
Consumer staples
|
14.0 | 3.4 | ||||||
|
Financials
|
13.8 | 32.6 | ||||||
|
Information technology
|
8.5 | 20.2 | ||||||
|
Industrials
|
6.9 | 6.4 | ||||||
|
Utilities
|
3.7 | 4.7 | ||||||
|
Telecommunications
|
3.7 | 9.2 | ||||||
|
Materials
|
2.7 | 7.2 | ||||||
|
Energy
|
0.5 | 9.4 | ||||||
|
Other assets & liabilities
|
5.7 | — | ||||||
|
Source: State Street Bank and Trust Company. Source for index data: MSCI
|
||||||||
|
PERFORMANCE
|
(US$ RETURNS)
|
|||||||
|
NAV %
|
Market price %
|
|||||||
|
One month
|
(13.6 | ) | (18.4 | ) | ||||
|
Year to date
|
(24.5 | ) | (29.2 | ) | ||||
|
Three years % pa
|
12.2 | 8.4 | ||||||
|
Past performance is not a guide to future returns.
|
||||||||
|
Three year returns are annualized.
|
||||||||
|
Source: State Street Bank and Trust Company
|
||||||||
|
15 LARGEST HOLDINGS (49.6%)
|
Fund %
|
||||
|
China Medical System Holdings
|
Healthcare
|
9.9 | |||
|
Hand Enterprise Solutions
|
Information technology
|
4.7 | |||
|
Shandong Weigao Group
|
Healthcare
|
3.4 | |||
|
Ping An Insurance
|
Financials
|
3.3 | |||
|
Wumart Stores
|
Consumer discretionary
|
3.2 | |||
|
FamilyMart
|
Consumer discretionary
|
3.2 | |||
|
ENN Energy
|
Utilities
|
2.8 | |||
|
China Mobile
|
Telecommunications
|
2.7 | |||
|
Sinopharm Group
|
Healthcare
|
2.6 | |||
|
Far Eastern Department Stores
|
Consumer discretionary
|
2.6 | |||
|
China Bright
|
Healthcare
|
2.3 | |||
|
Zong Su Foods
|
Consumer staples
|
2.3 | |||
|
Uni-President Enterprises Corp.
|
Consumer staples
|
2.3 | |||
|
Wuliangye Yibin
|
Consumer staples
|
2.2 | |||
|
Hsu Fu Chi International
|
Consumer staples
|
2.1 |
*Martin Currie Ltd and Heartland Capital Management Ltd (‘HCML’) have established MC China Ltd (‘MCCL’), as a joint venture company, to provide investment consultancy services to the range of China investment products managed by Martin Currie and its affiliates. HCML has seconded Shifeng Ke to Martin Currie Inc. and its affiliates, on a full time basis. Chris Ruffle ceased to perform client management funtions for Martin Currie from July 29, 2011. Shifeng Ke, the co-manager of the Fund, took lead management responsibility on July 29, 2011.
The Fund announced that its Board of Directors has commenced a process to review investment manager alternatives for the Fund. The Board expects that this process will be completed by the end of November 2011.
|
DIRECT INVESTMENTS (6.1%)
|
Fund %
|
||||
|
China Bright
|
Healthcare
|
2.3 | |||
|
Zong Su Foods
|
Consumer staples
|
2.3 | |||
|
Qingdao Bright Moon
|
Industrials
|
1.5 | |||
|
China Silicon
|
Information technology
|
0.0 | |||
|
Hand Enterprise Solutions (preferred)
|
Information technology
|
0.0 | |||
|
Source: State Street Bank and Trust Company.
|
|||||
|
FUND PERFORMANCE (BASED ON NET ASSET VALUE)
|
(US$ returns)
|
|||||||||||||||||||||||||||
|
One month
|
Three months
|
Calendar year
|
One year
|
Three years
|
Five years
|
Since launch
|
||||||||||||||||||||||
|
%
|
%
|
to date %
|
%
|
% pa
|
% pa
|
% pa
|
||||||||||||||||||||||
|
The China Fund, Inc.
|
(13.6 | ) | (22.1 | ) | (24.5 | ) | (18.5 | ) | 12.2 | 14.5 | 10.8 | |||||||||||||||||
|
MSCI Golden Dragon
|
(14.8 | ) | (21.8 | ) | (22.3 | ) | (17.3 | ) | 7.1 | 4.4 | n/a | |||||||||||||||||
|
Hang Seng Chinese Enterprise
|
(18.5 | ) | (29.1 | ) | (29.8 | ) | (28.3 | ) | (0.7 | ) | 4.7 | n/a | ||||||||||||||||
|
Shanghai Stock Exchange 180
|
(9.1 | ) | (14.6 | ) | (14.4 | ) | (7.9 | ) | 4.6 | 15.8 | n/a | |||||||||||||||||
Past performance is not a guide to future returns. Source: State Street Bank and Trust Company. Launch date July 10, 1992. Three, five year and since launch returns are all annualized. Source for index data: MSCI for the MSCI Golden Dragon and Copyright 2011 Bloomberg LP for the Hang Seng China Enterprise and the Shanghai Stock Exchange 180. For a full description of each index please see the index descriptions section.
PERFORMANCE IN PERSPECTIVE

Past performance is not a guide to future returns.
Source: Martin Currie Inc as at September 30, 2011.
MONTHLY INSIGHT
THE CHINA FUND INC. PREMIUM/DISCOUNT
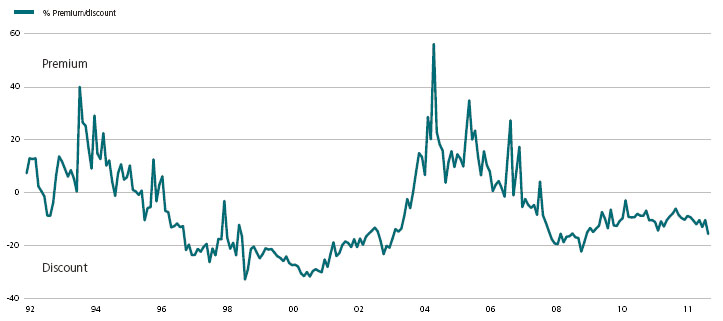
Past performance is not a guide to future returns.
Source: Martin Currie Inc as at September 30, 2011.
10 YEAR DIVIDEND HISTORY CHART

|
2000
|
2001
|
2002
|
2003
|
2004
|
2005
|
2006
|
2007
|
2008
|
2009
|
2010
|
||||||||||||||||||||||||||||||||||
|
Total
|
0.00 | 0.13 | 0.21 | 1.78 | 3.58 | 2.51 | 4.01 | 12.12 | 5.82 | 0.26 | 2.27 | |||||||||||||||||||||||||||||||||
|
Income
|
0.00 | 0.13 | 0.06 | 0.07 | 0.20 | 0.22 | 0.30 | 0.28 | 0.48 | 0.26 | 0.37 | |||||||||||||||||||||||||||||||||
|
Long-term capital
|
0.00 | 0.00 | 0.00 | 0.67 | 3.27 | 2.29 | 2.73 | 9.00 | 5.34 | 0.00 | 1.90 | |||||||||||||||||||||||||||||||||
|
Short-term capital
|
0.00 | 0.00 | 0.15 | 1.04 | 0.11 | 0.00 | 0.98 | 2.84 | 0.00 | 0.00 | 0.00 | |||||||||||||||||||||||||||||||||
Past performance is not a guide to future returns.
Source: State Street Bank and Trust Company.
|
Sector
|
Company (BBG ticker)
|
Price
|
Holding
|
Value US$
|
% of portfolio
|
|
|
HONG KONG H
|
21.9
|
|||||
|
China Medical System Holdings
|
867
|
HK
|
HK$5.2
|
90,442,200
|
$60,184,810
|
9.9
|
|
Shandong Weigao Group Medical Polymer
|
1066
|
HK
|
HK$8.8
|
18,352,000
|
$20,628,966
|
3.4
|
|
Wumart Stores
|
1025
|
HK
|
HK$15.5
|
9,810,750
|
$19,535,293
|
3.2
|
|
Sinopharm Group
|
1099
|
HK
|
HK$20.8
|
6,056,800
|
$16,028,632
|
2.6
|
|
ZTE Corp.
|
763
|
HK
|
HK$22.4
|
2,250,826
|
$6,491,488
|
1.1
|
|
Fook Woo
|
923
|
HK
|
HK$1.8
|
25,314,000
|
$5,821,030
|
1.0
|
|
Asian Citrus Holdings
|
73
|
HK
|
HK$3.6
|
9,120,000
|
$4,299,787
|
0.7
|
|
TAIWAN
|
19.0
|
|||||
|
FamilyMart
|
5903
|
TT
|
NT$132.0
|
4,501,652
|
$19,498,542
|
3.2
|
|
Far Eastern Department Stores
|
2903
|
TT
|
NT$40.2
|
11,922,460
|
$15,727,084
|
2.6
|
|
Uni-President Enterprises Corp.
|
1216
|
TT
|
NT$39.9
|
10,625,335
|
$13,911,431
|
2.3
|
|
Ruentex Development Co
|
9945
|
TT
|
NT$30.3
|
12,694,000
|
$12,621,106
|
2.1
|
|
Chinatrust Financial
|
2891
|
TT
|
NT$18.2
|
18,788,646
|
$11,220,783
|
1.9
|
|
Yuanta Financial Holdings
|
2885
|
TT
|
NT$15.5
|
19,305,684
|
$9,819,134
|
1.6
|
|
China Metal Products
|
1532
|
TT
|
NT$22.6
|
12,420,374
|
$9,210,843
|
1.5
|
|
KGI Securities
|
6008
|
TT
|
NT$11.0
|
17,321,078
|
$6,252,071
|
1.0
|
|
Test-Rite International
|
2908
|
TT
|
NT$22.0
|
8,457,000
|
$6,105,136
|
1.0
|
|
Fubon Financial Holdings
|
2881
|
TT
|
NT$32.1
|
5,454,608
|
$5,745,461
|
1.0
|
|
Taiwan Life 4percent Conv Bond*
|
n/a
|
NT$77.7
|
200,000,000
|
$5,100,705
|
0.8
|
|
|
HONG KONG
|
18.0
|
|||||
|
Enn Energy
|
2688
|
HK
|
HK$25.5
|
5,084,000
|
$16,752,473
|
2.8
|
|
China Mobile
|
941
|
HK
|
HK$77.1
|
1,636,500
|
$16,219,518
|
2.7
|
|
Huiyin Household Appliances
|
1280
|
HK
|
HK$0.6
|
160,413,750
|
$12,776,717
|
2.1
|
|
Ajisen China Holdings
|
538
|
HK
|
HK$9.0
|
6,945,000
|
$8,029,727
|
1.3
|
|
Ports Design
|
589
|
HK
|
HK$12.0
|
4,549,500
|
$7,130,328
|
1.2
|
|
Natural Beauty Bio-Technology
|
157
|
HK
|
HK$1.1
|
47,710,000
|
$6,925,863
|
1.2
|
|
Shangri-La Asia
|
69
|
HK
|
HK$15.0
|
3,316,683
|
$6,391,183
|
1.0
|
|
Tencent Holdings
|
700
|
HK
|
HK$164.2
|
291,000
|
$6,123,404
|
1.0
|
|
China Water Affairs
|
855
|
HK
|
HK$2.2
|
19,976,000
|
$5,697,017
|
0.9
|
|
China Innovationpay Group
|
8083
|
HK
|
HK$0.3
|
146,000,000
|
$5,533,003
|
0.9
|
|
Far East Horizon
|
3360
|
HK
|
HK$5.0
|
7,898,000
|
$5,093,389
|
0.8
|
|
Golden Meditech Co
|
801
|
HK
|
HK$1.0
|
35,040,000
|
$4,501,426
|
0.8
|
|
Chaoda Modern Agriculture (Holdings)
|
682
|
HK
|
HK$0.8
|
26,651,357
|
$3,766,153
|
0.6
|
|
China Shineway Pharmaceutical Group
|
2877
|
HK
|
HK$9.6
|
3,041,000
|
$3,765,993
|
0.6
|
|
Yorkey Optical International Cayman
|
2788
|
HK
|
HK$0.7
|
4,850,926
|
$436,223
|
0.1
|
|
FUJI Food & Catering Services
|
1175
|
HK
|
HK$0.0
|
5,462,000
|
$0
|
0.0
|
|
EQUITY LINKED SECURITIES (‘A’ SHARES)
|
14.7
|
|||||
|
Ping An Insurance
|
|
n/a
|
US$5.3
|
3,870,559
|
$20,347,118
|
3.3
|
|
Wuliangye Yibin
|
|
n/a
|
US$5.7
|
2,334,507
|
$13,309,007
|
2.2
|
|
Shanghai Qiangsheng
|
n/a
|
US$0.9
|
10,482,652
|
$9,685,027
|
1.6
|
|
|
Zhejiang China Commodities City Group
|
|
n/a
|
US$1.4
|
5,543,940
|
$7,683,901
|
1.3
|
|
Suning Appliance
|
n/a
|
US$1.6
|
4,607,872
|
$7,547,694
|
1.3
|
|
|
Jiangsu Yuyue Medical Equipment
|
n/a
|
US$3.9
|
1,936,000
|
$7,518,564
|
1.2
|
|
|
Tangshan Jidong Cement
|
n/a
|
US$2.5
|
2,837,087
|
$7,102,206
|
1.2
|
|
|
Shanghai Yuyuan Tourist
|
n/a
|
US$1.5
|
429,303,600
|
$6,272,259
|
1.0
|
|
|
Qinghai Salt Lake Potash
|
n/a
|
US$6.8
|
814,450
|
$5,535,184
|
0.9
|
|
|
China Railway Construction Group
|
n/a
|
US$0.7
|
6,582,600
|
$4,486,964
|
0.7
|
|
|
DIRECT
|
6.1
|
|||||
|
China Bright
|
n/a
|
HK$7.4
|
14,665,617
|
$14,017,136
|
2.3
|
|
|
Zong Su Foods
|
n/a
|
US$5,229.0
|
2,677
|
$13,998,033
|
2.3
|
|
|
Qingdao Bright Moon
|
n/a
|
US$0.3
|
31,827,172
|
$8,720,645
|
1.5
|
|
|
China Silicon Corp.
|
n/a
|
US$0.0
|
2,329,281
|
$0
|
0.0
|
|
|
Hand Enterprise Solutions (preferred)
|
n/a
|
US$0.0
|
500,000
|
$0
|
0.0
|
|
*This is an unlisted convertible bond. Shares in Taiwan Life are listed on the Taiwan Stock Exchange.
MONTHLY INSIGHT
|
Sector
|
Company (BBG ticker)
|
Price
|
Holding
|
Value US$
|
% of portfolio
|
|
|
USA
|
5.4
|
|||||
|
WuXi PharmaTech Cayman
|
WX US
|
US$11.6
|
883,490
|
$10,283,824
|
1.7
|
|
|
Mindray Medical International
|
MR US
|
US$23.6
|
291,700
|
$6,887,037
|
1.1
|
|
|
Hollysys Automation Technologies
|
HOLI US
|
US$5.8
|
925,700
|
$5,406,088
|
0.9
|
|
|
China New Borun Corp.
|
BORN US
|
US$3.3
|
1,202,859
|
$3,933,349
|
0.7
|
|
|
VanceInfo Technologies
|
VIT US
|
US$6.7
|
474,800
|
$3,195,404
|
0.5
|
|
|
Far East Energy
|
FEEC US
|
US$0.2
|
16,017,823
|
$3,043,386
|
0.5
|
|
|
CHINA ‘A’ SHARE
|
4.7
|
|||||
|
Hand Enterprise Solutions
|
300170 CH
|
Rmb16.4
|
11,238,137
|
$28,878,910
|
4.7
|
|
|
SINGAPORE
|
4.5
|
|||||
|
Hsu Fu Chi International
|
HFCI SP
|
SG$4.2
|
4,010,084
|
$12,912,890
|
2.1
|
|
|
China Fishery Group
|
CFG SP
|
SG$1.1
|
13,594,872
|
$11,597,224
|
1.9
|
|
|
CDW Holding
|
CDW SP
|
SG$0.1
|
48,208,000
|
$2,852,763
|
0.5
|
|
|
OTHER ASSETS & LIABILITIES
|
$35,102,913
|
5.7
|
||||
INDEX DESCRIPTIONS
MSCI Golden Dragon Index
The MSCI Golden Dragon is a free float-adjusted market capitalization index that is designed to measure equity market performance in the China region. As of May 2005 the MSCI Golden Dragon Index consisted of the following country indices: China, Hong Kong and Taiwan.
Hang Seng China Enterprise Index
The Hang Seng China Enterprise Index is a capitalization-weighted index comprised of state-owned Chinese companies (H-shares) listed on the Hong Kong Stock Exchange and included in Hans Seng Mainland China index.
Shanghai Stock Exchange 180 Index
The Shanghai Stock Exchange 180 ‘A’ Share Index is a capitalization-weighted index. The index tracks the daily price performance of the 180 most representative ‘A’ share stocks listed on the Shanghai Stock Exchange.
OBJECTIVE
The investment objective of the Fund is to achieve long term capital appreciation. The Fund seeks to achieve its objective through investment in the equity securities of companies and other entities with significant assets, investments, production activities, trading or other business interests in China or which derive a significant part of their revenue from China.
The Fund has an operating policy that the Fund will invest at least 80% of its assets in China companies. For this purpose, ‘China companies’ are (i) companies for which the principal securities trading market is in China; (ii) companies for which the principal securities trading market is outside of China or in companies organized outside of China, that in both cases derive at least 50% of their revenues from goods or services sold or produced, or have a least 50% of their assets in China; or (iii) companies organized in China. Under the policy, China will mean the People’s Republic of China, including Hong Kong, and Taiwan. The Fund will provide its stockholders with at least 60 days’ prior notice of any change to this policy.
CONTACTS
The China Fund, Inc.
c/o State Street Bank and Trust Company
2 Avenue de Lafayette
PO Box 5049
Boston, MA 02206-5049
Tel: (1) 888 CHN-CALL (246 2255)
www.chinafundinc.com
 |
IMPORTANT INFORMATION
This document is issued and approved by Martin Currie Inc (MC Inc), as investment adviser of The China Fund Inc (the Fund). MC Inc is authorised and regulated by the Financial Services Authority (FSA) and incorporated under limited liability in New York, USA. Registered in Scotland (No BR2575), registered address Saltire Court, 20 Castle Terrace, Edinburgh, EH1 2ES. Information herein is believed to be reliable but has not been verified by MC Inc. MC Inc makes no representation or warranty and does not accept any responsibility in relation to such information or for opinion or conclusion which the reader may draw from the newsletter.
Martin Currie Ltd and Heartland Capital Management Ltd (‘HCML’) have established MC China Ltd (‘MCCL’), as a joint venture company, to provide investment consultancy services to the range of China investment products managed by Marin Currie and its affiliates. HCML has seconded Shifeng Ke to Martin Currie Inc. and its affiliates, on a full time basis. Effective 29 July, 2011, Chris Ruffle ceased performing client portfolio management functions for Martin Currie.
Heartland Capital Investment Consulting (Shanghai) Ltd (‘HCIC’) is a wholly owned subsidiary of MC China Ltd. Research is undertaken by HCIC for MC China Ltd and provided to MC Inc (the investment manager of The China Fund, Inc.) and Martin Currie Investment Management Ltd., an affiliate of the investment manager. HCIC may change its opinions and views without prior notice. Any information provided within does not constitute investment advice nor is it an invitation to invest in this company.
The Fund is classified as a 'non-diversified' investment company under the US Investment Company Act of 1940 as amended. It meets the criteria of a closed ended US mutual fund and its shares are listed on the New York Stock Exchange. MC Inc has been appointed investment adviser to the Fund.
Investors are advised that they will not generally benefit from the rules and regulations of the United Kingdom Financial Services and Markets Act 2000 and the FSA for the protection of investors, nor benefit from the United Kingdom Financial Services Compensation Scheme, nor have access to the Financial Services Ombudsman in the event of a dispute. Investors will also have no rights of cancellation under the FSA's Conduct of Business Sourcebook of the United Kingdom.
This newsletter does not constitute an offer of shares. MC Inc, its ultimate and intermediate holding companies, subsidiaries, affiliates, clients, directors or staff may, at any time, have a position in the market referred to herein, and may buy or sell securities, currencies, or any other financial instruments in such markets. The information or opinion expressed in this newsletter should not be construed to be a recommendation to buy or sell the securities, commodities, currencies or financial instruments referred to herein.
The information provided in this report should not be considered a recommendation to purchase or sell any particular security. There is no assurance that any securities discussed herein will remain in an account's portfolio at the time you receive this report or that securities sold have not been repurchased.
It should not be assumed that any of the securities transactions or holdings discussed here were or will prove to be profitable, or that the investment recommendations or decisions we make in the future will be profitable or will equal the investment performance of the securities discussed herein.
Investing in the Fund involves certain considerations in addition to the risks normally associated with making investments in securities. The value of the shares issued by the Fund, and the income from them, may go down as well as up and there can be no assurance that upon sale, or otherwise, investors will receive back the amount originally invested. There can be no assurance that you will receive comparable performance returns, or that investments will reflect the performance of the stock examples contained in this document. Movements in foreign exchange rates may have a separate effect, unfavorable as well as favorable, on the gain or loss otherwise experienced on an investment. Past performance is not a guide to future returns. Accordingly, the Fund is only suitable for investment by investors who are able and willing to withstand the total loss of their investment. In particular, prospective investors should consider the following risks:
|
–
|
The companies quoted on Greater Chinese stock exchanges are exposed to the risks of political, social and religious instability, expropriation of assets or nationalisation, rapid rates of inflation, high interest rates, currency depreciation and fluctuations and changes in taxation, which may affect income and the value of investments.
|
|
–
|
At present, the securities market and the regulatory framework for the securities industry in China is at an early stage of development. The China Securities Regulatory Commission (CSRC) is responsible for supervising the national securities markets and producing relevant regulations. The Investment Regulations, under which the Fund invests in the People's Republic of China (PRC) and which regulate repatriation and currency conversion, are new. The Investment Regulations give CSRC and State Administration of Foreign Exchange (SAFE) wide discretions and there is no precedent or certainty as to how these discretions might be exercised, either now or in the future. The Fund may, from time to time, obtain access to the securities markets in China via Access Products. Such products carry additional risk and may be less liquid than the underlying securities which they represent.
|
|
–
|
During the past 15 years, the PRC government has been reforming the economic and political systems of the PRC, and these reforms are expected to continue, as evidenced by the recently announced changes. The Fund's operations and financial results could be adversely affected by adjustments in the PRC's state plans, political, economic and social conditions, changes in the policies of the PRC government such as changes in laws and regulations (or the interpretation thereof), measures which may be introduced to control inflation, changes in the rate or method of taxation, imposition of additional restrictions on currency conversion and the imposition of additional import restrictions.
|
|
–
|
PRC's disclosure and regulatory standards are in many respects less stringent than standards in certain Organisation for Economic Co-operation and Development (OECD) countries, and there may be less publicly available or less reliable information about PRC companies than is regularly published by or about companies from OECD countries.
|
|
–
|
The Shanghai Stock Exchange and Shenzhen Stock Exchange have lower trading volumes than most OECD exchanges and the market capitalisations of listed companies are small compared to those on more developed exchanges in developed markets. The listed equity securities of many companies in the PRC are accordingly materially less liquid, subject to greater dealing spreads and experience materially greater volatility than those of OECD countries. These factors could negatively affect the Fund's NAV.
|
|
–
|
The Fund invests primarily in securities denominated in other currencies but its NAV will be quoted in US dollars. Accordingly, a change in the value of such securities against US dollars will result in a corresponding change in the US dollar NAV.
|
|
–
|
The marketability of quoted shares may be limited due to foreign investment restrictions, wide dealing spreads, exchange controls, foreign ownership restrictions, the restricted opening of stock exchanges and a narrow range of investors. Trading volume may be lower than on more developed stockmarkets, and equities are less liquid. Volatility of prices can also be greater than in more developed stockmarkets. The infrastructure for clearing, settlement and registration on the primary and secondary markets may be underdeveloped. Under certain circumstances, there may be delays in settling transactions in some of the markets.
|
Martin Currie Inc registered in Scotland (no BR2575)
Registered office: Saltire Court, 20 Castle Terrace, Edinburgh EH1 2ES
Tel: 44 (0) 131 229 5252 Fax: 44 (0) 131 228 5959 www.martincurrie.com
North American office: 1350 Avenue of the Americas, Suite 3010, New York, NY
10019, USA Tel: (1) 212 258 1900 Fax: (1) 212 258 1919
Authorised and regulated by the Financial Services Authority and incorporated with
limited liability in New York, USA. Registered with the SEC as an investment adviser.
Please note: calls to the above numbers may be recorded.