Attached files
| file | filename |
|---|---|
| EX-23.2 - CONSENT OF ERNST AND YOUNG LLP - Xcerra Corp | d237925dex232.htm |
| EX-21.1 - SUBSIDIARIES OF THE REGISTRANT - Xcerra Corp | d237925dex211.htm |
| EX-32.1 - CERTIFICATION OF PEO AND PFO - Xcerra Corp | d237925dex321.htm |
| EX-23.1 - CONSENT OF BDO USA LLP - Xcerra Corp | d237925dex231.htm |
| EX-10.9 - FORM OF RESTRICTED STOCK UNIT AGREEMENT UNDER THE 2010 STOCK INCENTIVE PLAN - Xcerra Corp | d237925dex109.htm |
| EX-31.1 - CERTIFICATION OF PRINCIPAL EXECUTIVE OFFICER - Xcerra Corp | d237925dex311.htm |
| EX-31.2 - CERTIFICATION OF PRINCIPAL FINANCIAL OFFICER - Xcerra Corp | d237925dex312.htm |
Table of Contents
UNITED STATES
SECURITIES AND EXCHANGE COMMISSION
Washington, D.C. 20549
FORM 10-K
(Mark One)
| x | ANNUAL REPORT PURSUANT TO SECTION 13 OR 15(d) OF THE SECURITIES EXCHANGE ACT OF 1934 |
For the fiscal year ended July 31, 2011
OR
| ¨ | TRANSITION REPORT PURSUANT TO SECTION 13 OR 15(d) OF THE SECURITIES EXCHANGE ACT OF 1934 |
For the transition period from to
Commission File No. 000-10761
LTX-Credence Corporation
(Exact name of registrant as specified in its charter)
| MASSACHUSETTS | 04-2594045 | |
| (State or other jurisdiction of incorporation or organization) |
(I.R.S. Employer Identification No.) | |
| 825 University Ave Norwood, Massachusetts |
02062 | |
| (Address of principal executive offices) | (Zip code) | |
Registrant’s telephone number, including area code: (781) 461-1000
Securities registered pursuant to Section 12(b) of the Act:
| Title of each class |
Name of each exchange on which registered | |
| Common Stock, par value $0.05 per share | Nasdaq Global Market |
Securities registered pursuant to Section 12(g) of the Act:
None
Indicate by check mark if the registrant is a well-known seasoned issuer, as defined in Rule 405 of the Securities Act. Yes ¨ No x
Indicate by check mark if the registrant is not required to file reports pursuant to Section 13 or Section 15(d) of the Act. Yes ¨ No x
Indicate by check mark whether the registrant (1) has filed all reports required to be filed by Section 13 or 15(d) of the Securities Exchange Act of 1934 during the preceding 12 months (or for such shorter period that the registrant was required to file such reports) and (2) has been subject to such filing requirements for the past 90 days. Yes x No ¨
Indicate by check mark whether the registrant has submitted electronically and posted on its corporate Web site, if any, every Interactive Data File required to be submitted and posted pursuant to Rule 405 of Regulation S-T (§232.405 of this chapter) during the preceding 12 months (or for such shorter period that the registrant was required to submit and post such files). Yes ¨ No ¨
Indicate by check mark if disclosure of delinquent filers pursuant to Item 405 of Regulation S-K is not contained herein, and will not be contained, to the best of registrant’s knowledge, in definitive proxy or information statements incorporated by reference in Part III of this Form 10-K or any amendment to this Form 10-K. x
Indicate by check mark whether the registrant is a large accelerated filer, an accelerated filer, a non-accelerated filer or a smaller reporting company. See the definitions of “large accelerated filer,” “accelerated filer” and “smaller reporting company” in Rule 12b-2 of the Exchange Act.
Large Accelerated Filer ¨ Accelerated Filer x Non-Accelerated Filer ¨
Smaller Reporting Company Filer ¨
Indicate by check mark whether the registrant is a shell company (as defined in Rule 12b-2 of the Exchange Act.): Yes ¨ No x
The aggregate market value of the Common Stock held by non-affiliates of the registrant on January 31, 2011, the last business day of the registrant’s most recently completed second fiscal quarter was $421,068,870.
Number of outstanding shares of Common Stock as of October 13, 2011: 49,492,657
DOCUMENTS INCORPORATED BY REFERENCE
Portions of the Registrant’s Proxy Statement in connection with its 2011 Annual Meeting of Stockholders are incorporated by reference into Part III of this Form 10-K.
Table of Contents
LTX-CREDENCE CORPORATION
| Page | ||||||
| PART I |
||||||
| Item 1. |
1 | |||||
| 1 | ||||||
| 1 | ||||||
| 3 | ||||||
| 3 | ||||||
| 4 | ||||||
| 4 | ||||||
| 5 | ||||||
| 5 | ||||||
| 5 | ||||||
| 6 | ||||||
| 6 | ||||||
| 6 | ||||||
| 6 | ||||||
| 7 | ||||||
| 7 | ||||||
| Item 1A. |
7 | |||||
| Item 1B. |
14 | |||||
| Item 2. |
15 | |||||
| Item 3. |
15 | |||||
| Item 4. |
15 | |||||
| PART II |
||||||
| Item 5. |
16 | |||||
| Item 6. |
17 | |||||
| Item 7. |
Management’s Discussion and Analysis of Financial Condition and Results of Operations |
18 | ||||
| Item 7A. |
34 | |||||
| Item 8. |
36 | |||||
| Item 9. |
Changes in and Disagreements with Accountants on Accounting and Financial Disclosure |
71 | ||||
| Item 9A. |
71 | |||||
| Item 9B. |
75 | |||||
| PART III |
||||||
| Item 10. |
75 | |||||
| Item 11. |
75 | |||||
| Item 12. |
Security Ownership of Certain Beneficial Owners and Management and Related Stockholder Matters |
75 | ||||
| Item 13. |
Certain Relationships and Related Transactions, and Director Independence |
75 | ||||
| Item 14. |
75 | |||||
| PART IV |
||||||
| Item 15. |
76 | |||||
| 76 | ||||||
| 76 | ||||||
| 78 | ||||||
| 79 | ||||||
| Exhibits |
||||||
Table of Contents
PART I
| Item 1. | Business |
Formed by the August 2008 merger of LTX Corporation and Credence Systems Corporation, LTX-Credence Corporation (“LTX-Credence” or the “Company”), provides focused, cost-optimized automated test equipment (ATE) solutions. We design, manufacture, market and service ATE solutions that address the broad, divergent test requirements of the wireless, computing, automotive and consumer market segments. Semiconductor designers and manufacturers worldwide use our equipment to test their devices during two stages of the semiconductor manufacturing process; wafer probe and final package test. After testing, these devices are incorporated into a wide range of products, including computers; mobile internet equipment such as wireless access points and interfaces, broadband access products such as cable modems and DSL modems; personal communication products such as cell phones, smart phones and tablet devices; consumer products such as televisions, digital video recorders, videogame systems, digital cameras, navigation devices, and automobile electronics; and in portable electronics for power management.
LTX-Credence focuses its marketing and sales efforts on integrated device manufacturers (IDMs); outsource assembly and test providers (OSATs), which perform manufacturing services for the semiconductor industry; and fabless companies, which design integrated circuits but have no manufacturing capability. We offer our customers a comprehensive portfolio of test systems and provide a global network of strategically deployed applications and support resources.
LTX-Credence Corporation was incorporated in Massachusetts in 1976. Our principal executive offices and global headquarters are located at 825 University Avenue, Norwood, Massachusetts 02062 and our telephone number is 781-461-1000. Our common stock trades on the NASDAQ Global Market under the symbol “LTXC.” The terms “LTX-Credence” and the “Company” refer to LTX-Credence Corporation and its wholly owned subsidiaries unless the context otherwise indicates. We make available our annual reports on Form 10-K, quarterly reports on Form 10-Q, current reports on Form 8-K and all amendments to those reports, free of charge, in the “Investors” section of our website at www.ltxc.com as soon as reasonably practicable after such material is electronically filed with, or furnished to, the U.S. Securities and Exchange Commission.
Reverse Stock-Split
On September 15, 2010, our Board of Directors approved a one-for-three reverse stock split of our common stock, pursuant to previously obtained stockholder authorization. The reverse stock split, which became effective at the close of business on September 30, 2010, reduced the number of shares of our common stock issued and outstanding from approximately 147.2 million to approximately 49.2 million. All share and per share amounts herein as well as stock prices are presented on a post-reverse split basis.
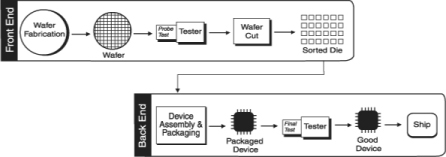
Today, most electronic products contain a combination of integrated circuits (ICs). Each of these ICs has electrical circuitry that requires validation or testing during and after the manufacturing process. The final usability of the IC is determined by automated test equipment. The testing of devices is a critical step during the semiconductor production process. Typically, semiconductor companies test each device at two different stages during the manufacturing process to ensure its functional and electrical performance prior to shipment to the device user. These companies use semiconductor testing equipment to first test a device after it has been fabricated but before it has been packaged to eliminate non-functioning parts. Then, after the functioning devices are packaged, they are tested again to determine if they fully meet performance specifications. Testing is an important step in the manufacturing process because it allows devices to be fabricated at both maximum density
1
Table of Contents
and performance—a key to the competitiveness of semiconductor manufacturers. Shown below is a schematic depiction of the major steps in the semiconductor fabrication and test process.
Three primary factors ultimately drive demand for semiconductor test equipment:
| • | increases in unit production of semiconductor devices; |
| • | increases in the complexity and performance level of devices used in electronic products; and |
| • | the emergence of next generation device technologies. |
Increases in unit production result primarily from the proliferation of the personal computer, growth of the telecommunications industry, consumer electronics, the mobile Internet, broadband network access, the increased use of digital signal processing (DSP) devices, and automotive and power management applications. These increases in unit production in turn lead to a corresponding increase in the need for test equipment.
Furthermore, demand is increasing worldwide for smaller, more highly integrated electronic products. This has led to the ever higher performance and increasing complexity of semiconductor devices, which, in turn, results in a corresponding increase in the demand for equally sophisticated test equipment.
Finally, the introduction and adoption of a new generation of end-user products requires the development of next generation device technologies. For example, access to information has migrated from the stand-alone desktop computer, which might be physically linked to a local network, to the seamless, virtual network of the Internet, which is accessible from anywhere by a variety of new portable electronic communication products including laptop, notebook, or netbook computers, smartphones, or tablet communication devices. A critical enabling technology for this network and multimedia convergence is system in package (SIP). SIP provides the benefits of lower cost, smaller size and higher performance by combining advanced digital, analog and embedded memory technologies on a single device. Historically, these discrete technologies were only available on several separate semiconductor devices, each performing a specific function. By integrating these functions in a single package, SIP enables lower cost, smaller size, higher performance, and lower power consumption.
The increases in unit production of devices, the increase in complexity of those devices, and, ultimately, the emergence of new semiconductor device technology have mandated changes in the design, architecture and complexity of such test equipment. Semiconductor device manufacturers must still be able to test the increasing volume and complexity of devices in a reliable, cost-effective, efficient and flexible manner. However, the increased pace of technological change, together with the large capital investments required to achieve economies of scale, are changing the nature and urgency of the challenges faced by device designers and manufacturers.
The combination of ever increasing price pressure and the fact that technology is not always cost effective to integrate into SIP has led to the need for testing solutions that cover multiple segments of the semiconductor market. There is a need to maximize utilization on the semiconductor test floor and at the same time have the most cost effective test solution for various points or integration levels in technology. This requires a suite of test
2
Table of Contents
solution products that are optimized in technology and cost for the segment they are addressing, thus maximizing efficiency and minimizing the overall cost of testing.
Our objective is to be the leading supplier of focused cost-optimized ATE solutions for the wireless, consumer, automotive and computing markets. Key elements of our business strategy include:
Advance our offering of focused, cost-optimized ATE solutions. We believe that providing a range of scalable test platforms targeted at the specific test requirements of individual market segments is the best approach to enable our customers to address the technical, business and cost requirements of their devices. Our customers’ focus on test costs demands this segment-focused approach. We are strongly positioned to address our customers’ requirements. We intend to leverage our proven technologies efficiently across our platforms to accelerate the availability of new capabilities, with a focus on optimizing the cost of our solutions for the individual market segments we address.
Concentrate our sales, applications consulting, and service efforts on key accounts. We recognize that large, diversified IDMs and OSATs, and certain fabless companies purchase most of the world’s test equipment and that the level of support we are able to provide to them has a direct impact on future business. We believe that focusing our sales and support resources on these key semiconductor companies is the most efficient way to maximize revenue. Therefore, we have organized our sales, field service, and field applications organizations around these key companies and located our resources close to their facilities. This has helped us to increase our responsiveness to customers’ needs and has enabled us to develop collaborative relationships that help guide us in developing future technologies.
Further improve the flexibility of our business model. In order to focus our resources, improve our responsiveness to customer needs, reduce fixed costs and working capital requirements, and manage the cyclicality of our industry more effectively, we have implemented a lean, flexible business model. Key to this business model is our outsourced manufacturing, with substantially all of our manufacturing functions outsourced to third parties. Through strategic alliances, we have also outsourced certain distribution, repair and support functions. In addition, we engage contract employees to address periods of peak demand. Our business model allows us to maintain tight control over all expense items. Overall, we intend to continue to identify and implement programs which enhance our ability to meet customers’ needs while reducing fixed costs.
Our product strategy is driven by our objective to be the leading supplier of focused, cost-optimized ATE solutions for the wireless, consumer, automotive and computing markets. We concentrate on the technical, business and cost requirements of the core technologies within those markets, which include: precision analog, Application Specific Standard Product (ASSP) and Application Specific Integrated Circuit (ASIC), microcontroller, mobility RF, power management and mixed signal.
To address the divergent, segmented requirements of these technologies, LTX-Credence offers three segment focused, scalable platforms to enable us to address our customers’ technical performance requirements, while at the same time providing cost-optimized solutions. This segment-focused approach allows prioritization of segment-specific test requirements, including:
| • | Capital cost and zero-pin infrastructure cost |
| • | Equipment size and footprint |
| • | Instrument capability and scope |
| • | Applications functionality and usage |
| • | Multi-site test capability |
3
Table of Contents
Each of our three platforms addresses a specific market segment with relatively little overlap in capability and pricing. The Diamond platform offers high density packaging for low cost testing of microcontrollers and cost sensitive consumer devices. The X-Series test platform offers configurations for optimal testing of ASSP and ASIC, power, automotive, mixed signal, precision analog, and RF applications. The ASL platform is a market leader for testing linear, low-end mixed signal and power management devices.
Our product portfolio consists of three segment focused, scalable platforms:
Diamond Platform
The Diamond platform offers high density packaging for low cost testing of microcontrollers and cost sensitive consumer devices. Diamond leverages electronics integration and air-cooling to produce a compact form factor and utilizes high density technology in a variety of instruments for digital and mixed signal addressing embedded analog testing. It is used for engineering as well as wafer sort and final production testing.
X-Series Platform
The X-Series platform offers configurations for optimal testing of ASSP and ASIC, power, automotive, mixed signal and RF applications. The X-Series offers four scalable, compatible configurations, each using common instrumentation and software, to enable flexible deployment while optimizing capital investment. It offers a wide range of digital, analog, RF and DSP test hardware coupled with our enVision software to provide a flexible, scalable test environment that addresses the test requirements of complex mixed signal and RF devices on a single system.
ASL Platform
The ASL platform is the market leader for testing linear, low-end mixed signal, precision analog, and power management devices. The ASL tests traditional analog function blocks such as amplifiers, regulators, switches and converters, either as individual ICs or as larger function ICs such as battery power management devices in portable electronics devices. It is highly configurable and relatively low cost, matching the test requirements of low ASP devices.
Our worldwide service organization is capable of performing installations and all necessary maintenance of test systems sold by us, including routine servicing of spare parts manufactured by third parties. We provide various parts and labor warranties on test systems or options designed and manufactured by us and warranties on components that have been purchased from other manufacturers and incorporated into our test systems. We also provide training on the maintenance and operation of test systems we sell.
Our service revenues were $41.7 million, or 16.7% of net sales, in fiscal 2011; $45.0 million, or 20.5% of net sales, in fiscal 2010; and $57.8 million, or 42.0% of net sales, in fiscal 2009.
We offer a wide range of service contracts, which gives our customers the flexibility to select the maintenance program best suited to their needs. Customers may purchase service contracts which extend maintenance beyond the initial warranty period. Many customers enter into annual or multiple-year service contracts over the life of the equipment. The pricing of contracts is based upon the level of service provided to the customer and the time period of the service contract. We believe that service revenues should be less affected
4
Table of Contents
by the cyclical nature of the semiconductor industry than sales of test equipment. We maintain service centers around the world, both directly and through strategic alliances with companies that are located in the United States, Europe and Asia.
Engineering and Product Development
The test equipment market is characterized by rapid technological change and new product introductions, as well as advancing industry standards. Our competitive position will depend upon our ability to successfully enhance our test platforms, develop new instrumentation, and introduce these new products on a timely and cost-effective basis. We seek to maintain close relationships with our customers in order to be responsive to their product development and production needs.
Our engineering strategy is to focus on development of our Diamond, X-Series and ASL platforms. Consolidation of platform technologies, both hardware and software, is a key focus moving forward as we leverage the combined company’s knowledge and expertise into cost-effective solutions.
Engineering and product development expenses were $52.7 million, $48.9 million, and $71.2 million during fiscal 2011, 2010, and 2009, respectively.
We sell our products through a combination of a worldwide direct sales organization and distributors. Our direct sales organization is structured around key accounts, with a sales force of 29 people as of July 31, 2011. We also use distributors to sell our products in certain markets such as in Taiwan/China (Spirox), Southeast Asia (UST), Japan (F-Brain) and Korea (Neosem).
Our sales to customers outside the United States are denominated in United States dollars. Our sales outside the United States comprised 85%, 76%, and 64% of total net sales in fiscal 2011, 2010, and 2009, respectively. See Note 9 to our Consolidated Financial Statements for additional information relating to revenues derived from sales to customers outside the United States.
Our customers include many of the world’s leading semiconductor device manufacturers. Our top customers in fiscal year 2011 were Texas Instruments, Spirox, and Atmel, which accounted for 23%, 14%, and 13% of our net sales, respectively. In fiscal year 2010, the top customers were Spirox, Atmel, and Texas Instruments which accounted for 24%, 13%, and 12% of our net sales, respectively. In fiscal year 2009, Texas Instruments accounted for 10% of our net sales. Net sales to the top ten customers were 80%, 77%, and 69%, of net sales in fiscal 2011, 2010, and 2009, respectively. A representative list of LTX-Credence customers follows:
| Advanced Micro Devices (AMD) | Intel | Skyworks Solutions | ||
| Amkor | KYEC | SMSC | ||
| Anadigics | Maxim Integrated Products | ST Ericsson | ||
| Atmel | Mediatek | STATSChipPac | ||
| Austriamicrosystems (AMS) | Melexis | Spirox | ||
| ASE | Novatek | STMicroelectronics | ||
| Carsem | Ralink | Texas Instruments | ||
| Elmos | Renesas | Triquint Semiconductor | ||
| Entropic Communications | RichTek | Unisem | ||
| Giga Solution | Sigurd | UTAC | ||
| Infineon Technologies | Silicon Laboratories | Volterra |
5
Table of Contents
Because a relatively small number of semiconductor companies purchase most of the world’s semiconductor test equipment, we have concentrated our sales and support efforts on these key customers. We believe that sales to a limited number of customers will continue to account for a high percentage of net sales for the foreseeable future.
During fiscal year 2011 we used Jabil Circuit and Plexus Corporation as our outsourced partners for final assembly, system integration, and testing operations of our X-Series, ASL and Diamond products. During the first quarter of fiscal year 2012, we began to consolidate these activities with Jabil Circuit. This consolidation is expected to be completed by the end of calendar year 2011. We outsource certain components and subassemblies to other contract manufacturers as well. We use standard components and prefabricated parts manufactured to our specifications. These components and subassemblies are used to produce testers in configurations specified by our customers. Some of the components for our products are available from a number of different suppliers; however, many components are purchased from a single supplier or a limited group of suppliers. Although we believe that all single source components currently are available in adequate amounts, we cannot be certain that shortages will not develop in the future. We are dependent on certain semiconductor device manufacturers, who are sole source suppliers of custom components for our products. We have no written supply agreements with these sole source suppliers and purchase our custom components through individual purchase orders. We continuously evaluate alternative sources for the manufacture of our custom components, however such alternative sources may not meet our required qualifications or have capacity that is available to us.
There are other domestic and foreign companies that participate in the markets for each of our products and the industry is highly competitive. We compete principally on the basis of product performance, cost of test, reliability, customer service, applications support, price and ability to deliver our products on a timely basis. Our primary competitors in the market for test systems include Advantest Corporation and Teradyne Inc. These companies have a substantially larger share of the ATE market, have greater financial and other resources, and a larger installed base of equipment than we do. These primary competitors also supply other types of ATE and other products to other markets. We expect our competitors to enhance their current products, which could lead to the introduction of new products with comparable or better price and performance than ours. In addition, new competitors, including semiconductor manufacturers themselves, may offer new technologies, which may in turn reduce the value of our product lines.
At July 31, 2011, our backlog of unfilled orders for all products and services was $53.3 million, compared with $67.2 million at July 31, 2010. Historically, test systems generally ship within twelve months of receipt of a customer’s purchase order. While backlog is calculated on the basis of firm orders, orders may be subject to cancellation or delay by the customer with limited or no penalty. Our backlog at any particular date, therefore, is not necessarily indicative of actual sales which may be generated for any succeeding period. Historically, our backlog levels have fluctuated based upon the ordering patterns of our customers and changes in our manufacturing capacity.
The development of our products is largely based on proprietary information. We rely upon a combination of contract provisions, copyright, trademark and trade secret laws to protect our proprietary rights in products. We also have a policy of seeking patents on technology considered of particular strategic importance. Our patents cover various technologies, including technology relating to proprietary instrumentation and pin electronics. Although we believe that the copyrights, trademarks and patents we own are of value, we also
6
Table of Contents
believe that they will not determine our success, which depends principally upon our management, engineering, applications, manufacturing, marketing and service skills. However, we intend to protect our rights when, in our view, these rights are infringed upon.
The use of patents to protect hardware and software has increased in the test equipment industry. We have at times been notified of claims that we may be infringing patents issued to others. Although there are no pending actions against us regarding any patents, no assurance can be given that infringement claims by third parties will not negatively impact our business and results of operations. As to any claims asserted against us, we may seek or be required to obtain a license under the third party’s intellectual property rights. There can be no assurance, however, that a license will be available under reasonable terms or at all. In addition, we could decide to engage in litigation to challenge such claims or a third party could engage in litigation to enforce such claims. Such litigation could be expensive and time consuming and could negatively impact our business and results of operations.
At July 31, 2011, we employed 631 employees and 32 temporary workers. None of our employees is represented by a labor union, and we have experienced no work stoppages. Many of our employees are highly skilled, and we believe our future success will depend in large part on our ability to retain these employees and attract new, highly skilled employees. We consider relations with our employees to be good.
Our facilities are subject to numerous laws and regulations designed to protect the environment. We do not anticipate that compliance with these laws and regulations will have a material effect on our capital expenditures, results of operations, or financial condition.
| Item 1A. | Risk Factors |
This report includes or incorporates forward-looking statements that involve substantial risks and uncertainties and fall within the meaning of Section 27A of the Securities Act of 1933 and Section 21E of the Securities Exchange Act of 1934. You can identify these forward-looking statements by our use of the words “believes,” “anticipates,” “plans,” “expects,” “may,” “will,” “would,” “should,” “intends,” “estimates,” “seeks” and similar expressions, whether in the negative or affirmative. We cannot guarantee that we actually will achieve these plans, intentions or expectations. Actual results or events could differ materially from the plans, intentions and expectations disclosed in the forward-looking statements we make. We have included below important factors that we believe could cause our actual results to differ materially from the forward-looking statements that we make. We do not assume any obligation to update any forward-looking statement we make.
Our sole market is the highly cyclical semiconductor industry, which causes a cyclical impact on our financial results.
We sell capital equipment to companies that design, manufacture, assemble, and test semiconductor devices. The semiconductor industry is highly cyclical, causing a cyclical impact on our financial results. Industry order rates increased in fiscal year 2010 and portions of fiscal year 2011. However industry conditions weakened as we entered fiscal year 2012. The timing and level of sustained industry recovery is uncertain at this time. The ability to forecast the business outlook for our industry is typically limited to a maximum of three months. As a result, our expectations for our business for the full fiscal 2012 remain uncertain. Regardless of our outlook and forecasts, any failure to expand in cycle upturns to meet customer demand and delivery requirements or contract in cycle downturns at a pace consistent with cycles in the industry could have an adverse effect on our business.
Any significant downturn in the markets for our customers’ semiconductor devices or in general economic conditions would likely result in a reduction in demand for our products and would negatively impact our
7
Table of Contents
business. Downturns in the semiconductor test equipment industry have been characterized by diminished product demand, excess production capacity, accelerated erosion of selling prices and excessive inventory levels. We believe the markets for newer generations of devices, including system in package “or SIP”, will also experience similar characteristics. Our market is also characterized by rapid technological change and changes in customer demand. In the past, we have experienced delays in commitments, delays in collecting accounts receivable and significant declines in demand for our products during these downturns, and we may not be able to maintain or exceed our current level of sales.
Additionally, as a capital equipment provider, our revenue is driven by the capital expenditure budgets and spending patterns of our customers who often delay or accelerate purchases in reaction to variations in their businesses. Because a high portion of our costs are fixed, we are limited in our ability to reduce expenses and inventory purchases quickly in response to decreases in orders and revenues. In a contraction, we may not be able to reduce our significant fixed costs, such as continued investment in research and development and capital equipment requirements and materials purchases from our suppliers.
The market for semiconductor test equipment is highly concentrated, and we have limited opportunities to sell our products.
The semiconductor industry is highly concentrated, and a small number of semiconductor device manufacturers and contract assemblers account for a substantial portion of the purchases of semiconductor test equipment generally, including our test equipment. Our top customers in fiscal year 2011 were Texas Instruments, Spirox, and Atmel, which accounted for 23%, 14%, and 13% of our net sales, respectively. In fiscal year 2010, the top customers were Spirox, Atmel, and Texas Instruments which accounted for 24%, 13%, and 12% of our net sales, respectively. In fiscal year 2009, Texas Instruments accounted for 10% of our net sales. Sales to the top ten customers were 80%, 77%, and 69%, of net sales in fiscal 2011, 2010, and 2009, respectively. Our customers may cancel orders with few or no penalties. If a major customer reduces orders for any reason, our revenues, operating results, and financial condition will be negatively affected.
Our ability to increase our sales will depend, in part, on our ability to obtain orders from new customers. Semiconductor manufacturers select a particular vendor’s test system for testing its new generations of a device and make substantial investments to develop related test program applications and interfaces. Once a manufacturer has selected a test system vendor for a new generation of a device, that manufacturer is more likely to purchase test systems from that vendor for that generation of the device, and, possibly, subsequent generations of that device as well. Therefore, the opportunities to obtain orders from new customers may be limited, which may impair our ability to grow our sales and revenue.
Our sales and operating results have fluctuated significantly from period to period, including from one quarter to another, and they may continue to do so.
Our quarterly and annual operating results are affected by a wide variety of factors that could have material and adverse effects on our financial condition and stock price or lead to significant variability in our operating results or our stock price, including the following:
| • | the fact that sales of a limited number of test systems may account for a substantial portion of our net sales in any particular fiscal quarter; |
| • | order cancellations by customers; |
| • | lower gross margins in any particular period due to changes in: |
| • | our product mix; |
| • | the configurations of test systems sold; |
| • | the customers to whom we sell our test systems; or |
| • | volume; |
8
Table of Contents
| • | a long sales cycle due to, the significant investment made by our customers in installing our test systems, and the time required to incorporate our systems into our customers’ design or manufacturing process; and |
| • | changes in the timing of product orders due to: |
| • | unexpected delays in the introduction of products by our customers, |
| • | shorter than expected lifecycles of our customers’ semiconductor devices, |
| • | uncertain market acceptance of products developed by our customers, or |
| • | our own research and development. |
We cannot predict the impact of these and other factors on our sales and operating results in any future period. Results of operations in any period, therefore, should not be considered indicative of the results to be expected for any future period. Because of this difficulty in predicting future performance, our operating results may fall below expectations of securities analysts or investors in some future quarter or quarters. Our failure to meet these expectations would likely adversely affect the market price of our common stock.
A substantial amount of the shipments of our test systems for a particular quarter may occur late in the quarter. Our shipment pattern may expose us to significant risks of not meeting our expected financial results for each quarter in the event of problems during the complex process of final integration, test and acceptance prior to shipment. If we were to experience problems of this type late in our quarter, shipments could be delayed and our operating results could fall below expectations.
Our dependence on subcontractors and sole source suppliers may prevent us from delivering an acceptable product on a timely basis.
We rely on one subcontractor to manufacture our test systems and multiple other subcontractors for the manufacture of the components and subassemblies for our products. Additionally we rely on sole source suppliers for certain components and subassemblies. We have no long term supply agreement with our contract manufacturers, and purchase products through individual purchase orders. We may be required to qualify new or additional subcontractors and suppliers due to capacity constraints, competitive or quality concerns or other risks that may arise, including as a result of a change in control of, or deterioration in the financial condition of, a supplier or subcontractor. The process of qualifying subcontractors and suppliers is a lengthy process. Our reliance on subcontractors gives us less control over the manufacturing process and exposes us to significant risks, especially inadequate capacity, late delivery, substandard quality, and high costs. In addition, the manufacture of certain of these components and subassemblies is an extremely complex process. If a supplier became unable to provide parts in the volumes needed or at an acceptable price, we would have to identify and qualify acceptable replacements from alternative sources of supply, or manufacture such components or subassemblies internally. The failure to qualify acceptable replacement subcontractors or suppliers quickly would delay the manufacturing and delivery of our products, which could cause us to lose revenues and customers.
We also may be unable to engage alternative production and testing services on a timely basis or upon terms favorable to us, if at all. If we are required for any reason to seek a new manufacturer of our test systems, an alternate manufacturer may not be available and, in any event, transitioning to a new manufacturer would require a significant lead time of nine months or more and would involve substantial expense and disruption of our business. Our test systems are highly sophisticated and complex capital equipment, with many custom components, and require specific technical know-how and expertise. These factors could make it more difficult for us to find a new manufacturer of our test systems if our relationship with our outsource suppliers is terminated for any reason, which would cause us to lose revenues and customers.
We are dependent on certain semiconductor device manufacturers as sole source suppliers of components manufactured in accordance with our proprietary design and specifications. We have no written supply agreement with these sole source suppliers and purchase our custom components through individual purchase orders.
9
Table of Contents
Compliance with current and future environmental regulations may be costly and disruptive to our operations.
We may be subject to environmental and other regulations due to our production and marketing of products in certain states and countries that limit or restrict the amount of hazardous material in certain electronic components such as printed circuit boards. One such directive is Directive 2002/95/EC of the European Parliament and of the Council of 27 January 2003 on the restriction of the use of certain hazardous substances in electrical and electronic equipment. “RoHS” is short for restriction of hazardous substances. The RoHS Directive banned the placing on the EU market of new electrical and electronic equipment containing more than agreed levels of lead, cadmium, mercury, hexavalent chromium, polybrominated biphenyl (PBB) and polybrominated diphenyl ether (PBDE), except where exemptions apply, from July 1, 2006. Manufacturers are required to ensure that their products, including their constituent materials and components, do not contain more than the minimum levels of the nine restricted materials in order to be allowed to export goods into the Single Market (i.e. of the European Community’s 27 Member States). Any interruption in supply due to the unavailability of lead free products could have a significant impact on the manufacturing and delivery of our products. If a supplier became unable to provide parts in the volumes needed or at an acceptable price, we would have to identify and qualify acceptable replacements from alternative sources of supply or manufacture such components internally. The failure to qualify acceptable replacements quickly would delay the manufacturing and delivery of our products, which could cause us to lose revenues and customers.
Future mergers and acquisitions may be difficult to integrate, disrupt our business, dilute stockholder value or divert management attention.
We have in the past, and may in the future, seek to acquire or invest in additional businesses, products, technologies or engineers. For example, in August 2008 we completed our merger with Credence Systems Corporation and in June 2003, we completed our acquisition of StepTech, Inc. We may have to issue debt or equity securities to pay for future mergers or acquisitions, which could be dilutive to then current stockholders or subject us to the risk described above in “We may need financing, which could be difficult to obtain.” We have also incurred and may continue to incur certain liabilities or other expenses in connection with acquisitions, which could materially adversely affect our business, financial condition and results of operations.
Mergers and acquisitions of high-technology companies are inherently risky, and no assurance can be given that future mergers or acquisitions will be successful and will not materially adversely affect our business, operating results or financial condition. Our past and future mergers and acquisitions may involve many risks, including:
| • | difficulties in managing our growth following mergers and acquisitions; |
| • | difficulties in the integration of the acquired personnel, operations, technologies, products and systems of the acquired companies; |
| • | uncertainties concerning the intellectual property rights we purport to acquire; |
| • | unanticipated costs or liabilities associated with the mergers and acquisitions; |
| • | diversion of managements’ attention from other business concerns; |
| • | adverse effects on our existing business relationships with our or our acquired companies’ customers; |
| • | potential difficulties in completing projects associated with purchased in-process research and development; and |
| • | inability to retain employees of acquired companies. |
Any of the events described in the foregoing paragraphs could have an adverse effect on our business, financial condition and results of operations and could cause the price of our common stock to decline.
10
Table of Contents
We may not be able to deliver custom hardware options and related applications to satisfy specific customer needs in a timely manner.
The success of our business relies in substantial part on our ability to develop and deliver customized hardware and applications to meet our customers’ specific test requirements. Our test equipment may fail to meet our customers’ technical or cost requirements and may be replaced by competitive equipment or an alternative technology solution. Our inability to provide a test system that meets requested performance criteria when required by a device manufacturer would severely damage our reputation with that customer. This loss of reputation together with the risks discussed above in, “The market for semiconductor test equipment is highly concentrated, and we have limited opportunities to sell our products” may make it substantially more difficult for us to sell test systems to that manufacturer for a number of years. We have, in the past, experienced delays in introducing some of our products and enhancements.
Our dependence on international sales and non-U.S. suppliers involves significant risk.
International sales have constituted a significant portion of our revenues in recent years, and we expect that this composition will continue. International sales accounted for 85% of our revenues for fiscal 2011, 76% of our revenues for fiscal 2010, and 64% of our revenues for fiscal 2009. In addition, we rely on non-U.S. suppliers for several components of the equipment we sell. As a result, a major part of our revenues and the ability to manufacture our products are subject to the risks associated with international commerce. These international relationships make us particularly sensitive to economic, political, regulatory and environmental changes in the countries from which we derive sales and obtain supplies. Our outsource manufacturing supplier in Malaysia increases our exposure to these types of international risks. International sales and our relationships with suppliers may be hurt by many factors, including:
| • | changes in law or policy resulting in burdensome government controls, tariffs, restrictions, embargoes or export license requirements; |
| • | political and economic instability in our target international markets; |
| • | longer payment cycles common in foreign markets; |
| • | difficulties of staffing and managing our international operations; |
| • | less favorable foreign intellectual property laws making it harder to protect our technology from appropriation by competitors; |
| • | difficulties collecting our accounts receivable because of the distance and different laws; |
| • | the impact of the Foreign Corrupt Practices Act of 1977 and other similar laws; and |
| • | adverse weather and climate events. |
In the past, we have incurred expenses to meet new regulatory requirements in Europe, experienced periodic difficulties in obtaining timely payment from non-U.S. customers, and been affected by economic conditions in several Asian countries. Our foreign sales are typically invoiced and collected in U.S. dollars. A strengthening in the dollar relative to the currencies of those countries where we do business would increase the prices of our products as stated in those currencies and could hurt our sales in those countries. Significant fluctuations in the exchange rates between the U.S. dollar and foreign currencies could cause us to lower our prices and thus reduce our profitability. These fluctuations could also cause prospective customers to push out or delay orders because of the increased relative cost of our products. In the past, there have been significant fluctuations in the exchange rates between the dollar and the currencies of countries in which we do business. From time to time we may enter into foreign currency hedging arrangements.
Our market is highly competitive, and we have limited resources to compete.
The test equipment industry is highly competitive in all areas of the world. There are other domestic and foreign companies that participate in the markets for each of our products, and the industry is highly competitive.
11
Table of Contents
Our competitors in the market for semiconductor test equipment include Advantest Corporation and Teradyne Inc. These major competitors have substantially greater financial resources and more extensive engineering, manufacturing, marketing, and customer support capabilities.
We expect our competitors to enhance their current products and to introduce new products with comparable or better price and performance. The introduction of competing products could hurt sales of our current and future products. In addition, new competitors, including semiconductor manufacturers themselves, may offer new testing technologies, which may in turn reduce the value of our product lines. Increased competition could lead to intensified price-based competition, which would hurt our business and results of operations. Unless we are able to invest significant financial resources in developing products and maintaining customer support centers worldwide, we may not be able to compete effectively.
We are exposed to the risks associated with the volatility of the U.S. and global economies.
The lack of visibility regarding whether there will be sustained growth periods for the sale of electronic goods and information technology equipment, and uncertainty regarding the amount of sales, underscores the need for caution in predicting growth in the semiconductor test equipment industry in general and in our revenues and profits specifically. Slow or negative growth in the domestic economy may continue to materially and adversely affect our business, financial condition and results of operations for the foreseeable future. Our results of operations would be further adversely affected if we were to experience lower than anticipated order levels, cancellations of orders in backlog, extended customer delivery requirements or pricing pressure as a result of a slowdown. At lower levels of revenue, there is a higher likelihood that these types of changes in our customers’ requirements would adversely affect our results of operations because in any particular quarter a limited number of transactions accounts for an even greater portion of sales for the quarter.
Development of our products requires significant lead-time, and we may fail to correctly anticipate the technical needs of our customers.
Our test systems are used by our customers to develop, test and manufacture their new devices. We therefore must anticipate industry trends and develop products in advance of the commercialization of our customers’ devices, requiring us to make significant capital investments to develop new test equipment for our customers well before their devices are introduced. If our customers fail to introduce their devices in a timely manner or the market does not accept their devices, we may not recover our capital investment through volume sales. In addition, even if we are able to successfully develop enhancements or new generations of our products, these enhancements or new generations of products may not generate revenue in excess of the costs of development, and they may be quickly rendered obsolete by changing customer preferences or the introduction of products embodying new technologies or features by our competitors. Furthermore, if we were to make announcements of product delays, or if our competitors were to make announcements of new test systems, these announcements could cause our customers to defer or forego purchases of our test systems, which would also hurt our business.
Our success depends on attracting and retaining key personnel.
Our success will depend substantially upon the continued service of our executive officers and key personnel, none of whom is bound by an employment or non-competition agreement. Our success will depend on our ability to attract and retain highly qualified managers and technical, engineering, marketing, sales and support personnel. Competition for such specialized personnel is intense, and it may become more difficult for us to hire or retain them. Our volatile business cycles only aggravate this problem. Layoffs in any industry downturn could make it more difficult for us to hire or retain qualified personnel. Our business, financial condition and results of operations could be materially adversely affected by the loss of any of our key employees, by the failure of any key employee to perform in his or her current position, or by our inability to attract additional skilled employees.
12
Table of Contents
We may not be able to protect our intellectual property rights.
Our success depends in part on our ability to obtain intellectual property rights and licenses and to preserve other intellectual property rights covering our products and development and testing tools. To that end, we have obtained certain domestic and international patents and may continue to seek patents on our inventions when appropriate. We have also obtained certain trademark registrations. The process of seeking intellectual property protection can be time consuming and expensive. We cannot ensure that:
| • | patents will issue from currently pending or future applications; |
| • | our existing patents or any new patents will be sufficient in scope or strength to provide meaningful protection or any commercial advantage to us; |
| • | foreign intellectual property laws will protect our intellectual property rights; or |
| • | others will not independently develop similar products, duplicate our products or design around our technology. |
If we do not successfully enforce our intellectual property rights, our competitive position could suffer, which could harm our operating results. We also rely on trade secrets, proprietary know-how and confidentiality provisions in agreements with employees and consultants to protect our intellectual property. Other parties may not comply with the terms of their agreements with us, and we may not be able to adequately enforce our rights against these people.
Third parties may claim we are infringing their intellectual property, and we could suffer significant litigation costs and licensing expenses or be prevented from selling our products.
Intellectual property rights are uncertain and involve complex legal and factual questions. We may be unknowingly infringing on the intellectual property rights of others and may be liable for that infringement, which could result in a significant liability for us. If we do infringe the intellectual property rights of others, we could be forced to either seek a license to intellectual property rights of others or alter our products so that they no longer infringe the intellectual property rights of others. A license could be very expensive to obtain or may not be available at all. Similarly, changing our products or processes to avoid infringing the rights of others may be costly or impractical.
We are responsible for any patent litigation costs. If we were to become involved in a dispute regarding intellectual property, whether ours or that of another company, we may have to participate in legal proceedings. These types of proceedings may be costly and time consuming for us, even if we eventually prevail. If we do not prevail, we might be forced to pay significant damages, obtain licenses, modify our products or processes, stop making products or stop using processes.
We may need financing, which could be difficult to obtain.
We expect that our existing cash, cash equivalents and marketable securities will be sufficient to meet our cash requirements to fund operations and expected capital expenditures for the foreseeable future. In the event we need to raise additional funds, we cannot be certain that we will be able to obtain such financing on favorable terms, if at all. Further, if we issue additional equity securities to obtain financing, stockholders may experience additional dilution or the new equity securities may have rights, preferences or privileges senior to those of existing holders of common stock and place restrictions on how we operate our business. If we incur substantial indebtedness in the future we may be required to dedicate a substantial portion of any cash flow from operations to our debt service obligations, thereby reducing the amount of cash flow available for other purposes, including capital expenditures, limit our flexibility in planning for, or reacting to changes in, our business and the industry in which we compete, make it more difficult for us to obtain any other necessary future financing and make us more vulnerable in the event of a further downturn in our business. If we cannot raise funds on acceptable terms,
13
Table of Contents
if and when needed, we may not be able to develop or enhance our products and services, take advantage of future opportunities, grow our business or respond to competitive pressures, which could seriously harm our business.
Our stock price is volatile.
In the twelve-month period ending on July 31, 2011, our stock price ranged from a low of $4.98 to a high of $9.83. The price of our common stock has been and likely will continue to be subject to wide fluctuations in response to a number of events and factors, such as:
| • | quarterly variations in operating results; |
| • | variances of our quarterly results of operations from securities analysts’ estimates; |
| • | changes in financial estimates and recommendations by securities analysts; |
| • | announcements of technological innovations, new products, or strategic alliances; and |
| • | news reports relating to trends in our markets. |
In addition, the stock market in general, and the market prices for semiconductor-related companies in particular, have experienced significant price and volume fluctuations that often have been unrelated to the operating performance of the companies affected by these fluctuations. These broad market fluctuations may adversely affect the market price of our common stock, regardless of our operating performance.
We may record impairment charges which would adversely impact our results of operations.
We review our goodwill, intangible assets and long-lived assets for impairment whenever events or changes in circumstances indicate that the carrying amounts of these assets may not be recoverable, and we also review goodwill annually in accordance with Financial Accounting Standards Board (“FASB”), Accounting Standards Codification (“ASC”), Topic 350, Intangibles—Goodwill and Other.
One potential indicator of goodwill impairment is whether our fair value, as measured by our market capitalization, has remained below our net book value for a significant period of time. Whether our market capitalization triggers an impairment charge in any future period will depend on the underlying reasons for the decline in stock price, the significance of the decline, and the length of time the stock price has been trading at such prices.
In the event that we determine in a future period that impairment exists for any reason, we would record an impairment charge in the period such determination is made, which would adversely impact our financial position and results of operations.
Internal control deficiencies or weaknesses that are not yet identified could emerge.
Over time we may identify and correct deficiencies or weaknesses in our internal controls and, where and when appropriate, report on the identification and correction of these deficiencies or weaknesses. However, the internal control procedures can provide only reasonable, and not absolute, assurance that deficiencies or weaknesses are identified. Deficiencies or weaknesses that have not been identified by us could emerge and the identification and correction of these deficiencies or weaknesses could have a material impact on our results of operations. If our internal controls over financial reporting are not considered adequate, we may experience a loss of public confidence, which could have an adverse effect on our business and stock price.
| Item 1B. | Unresolved Staff Comments |
None.
14
Table of Contents
| Item 2. | Properties |
We have achieved worldwide ISO 9001:2008 certification at our facilities. We maintain our principal executive offices and global headquarters in Norwood, Massachusetts, where corporate administration, sales and support, and research and development are located in a 56,380 square foot facility under a lease which expires in 2016. We lease a 90,068 square foot facility in Milpitas, California for research and development, sales and customer support and corporate administration pursuant to a lease that expires in 2017. Under the same lease, we lease another 88,145 square foot facility, which is currently being marketed to potential sub lessees. We also lease a 17,500 square foot facility in Beaverton, Oregon pursuant to a lease that expires in January 2015 for corporate administration, research and development, and certain finance functions. We also lease sales and customer support offices at various locations in the United States totaling approximately 25,000 square feet.
In addition, we own land in Hillsboro, Oregon that is currently being marketed for sale.
Our European headquarters is located in Munich, Germany, and our Asian headquarters is located in Singapore. We also maintain sales and support offices at other locations in Europe and in Asia. Office space leased in Asia and Europe totals approximately 80,000 square feet.
We believe that our existing facilities are adequate to meet our current and foreseeable future requirements.
| Item 3. | Legal Proceedings |
The disclosure from Note 10, Commitments and Contingent Liabilities, contained in the Notes to Consolidated Financial Statements included in this report is incorporated herein by reference.
| Item 4. | (Removed and Reserved) |
15
Table of Contents
PART II
| Item 5. | Market for Registrant’s Common Equity, Related Stockholder Matters and Issuer Purchases of Equity Securities |
Our common stock trades on the NASDAQ Global Market under the symbol “LTXC”. At the close of business on September 30, 2010, we effected a 1-for-3 reverse split of our common stock. The following table shows the high and low sale prices per share of our common stock, as reported on the NASDAQ Global Market, for the periods indicated. All amounts in the table have been adjusted to give effect to the reverse stock split:
| Period |
High | Low | ||||||
| Fiscal Year Ended July 31, 2011 |
||||||||
| First Quarter |
$ | 8.82 | $ | 4.98 | ||||
| Second Quarter |
9.07 | 5.90 | ||||||
| Third Quarter |
9.83 | 7.80 | ||||||
| Fourth Quarter |
9.52 | 7.19 | ||||||
| Fiscal Year Ended July 31, 2010 |
||||||||
| First Quarter |
$ | 5.70 | $ | 2.25 | ||||
| Second Quarter |
5.67 | 3.63 | ||||||
| Third Quarter |
11.34 | 5.34 | ||||||
| Fourth Quarter |
11.04 | 7.26 | ||||||
We have never declared or paid any dividends on our common stock. We currently intend to retain future earnings to fund the development and growth of our business and, therefore, we do not anticipate paying any cash dividends in the foreseeable future.
Stock Buyback
On September 15, 2011, we announced that our board of directors has authorized a stock repurchase program for up to $25 million. Under this program, the board of directors authorized us to repurchase shares of our common stock from time to time in open market transactions. We will determine the timing and amount of each transaction based on our evaluation of market conditions and other factors. The repurchase program may be suspended or discontinued at any time and has no expiration date.
As of September 27, 2011, we had approximately 203 stockholders of record of our common stock.
Securities Authorized for Issuance under Equity Compensation Plans
The following table shows information relating to our compensation plans as of July 31, 2011. All amounts in the table have been adjusted to give effect to the reverse stock split:
| Equity Compensation Plan Information | ||||||||||||
| Plan Category |
Number of securities to be issued upon exercise of outstanding options, warrants and rights |
Weighted average exercise price of outstanding options, warrants and rights |
Number of securities remaining available for future issuance under equity compensation plans (excluding securities in first column) |
|||||||||
| Equity compensation plans approved by security holders |
3,415,999 | $ | 15.52 | 6,307,075 | * | |||||||
| Equity compensation plans not approved by security holders |
— | — | — | |||||||||
|
|
|
|
|
|
|
|||||||
| Total |
3,415,999 | $ | 15.52 | 6,307,075 | * | |||||||
|
|
|
|
|
|
|
|||||||
| * | Includes 225,355 shares available for issuance under an employee stock purchase plan which is intended to qualify as such under Section 423 of the Internal Revenue Code. Under our equity compensation plans, we can issue options and restricted stock units. |
16
Table of Contents
This table excludes an aggregate of 6,611 shares issuable upon exercise of outstanding options assumed by us in connection with our acquisition of StepTech, Inc. The weighted average exercise price of the excluded options is $3.33.
| Item 6. | Selected Financial Data |
The following table contains our selected consolidated financial data and is qualified by the more detailed consolidated financial statements and notes thereto included elsewhere in this report. The selected consolidated financial data for and as of the end of each of the five fiscal years in the period ended July 31, 2011 are derived from our audited consolidated financial statements.
| Fiscal Years Ended July 31, (In thousands) |
||||||||||||||||||||
| 2011 | 2010 | 2009 (a) | 2008 | 2007 | ||||||||||||||||
| Consolidated Statements of Operations Data: |
||||||||||||||||||||
| Net sales |
$ | 249,530 | $ | 219,082 | $ | 137,378 | $ | 135,825 | $ | 147,639 | ||||||||||
| Cost of sales |
95,290 | 96,700 | 87,805 | 67,981 | 77,441 | |||||||||||||||
| Inventory-related provision |
— | — | 19,311 | — | 4,175 | |||||||||||||||
| Engineering and product development expenses |
52,697 | 48,943 | 71,165 | 46,020 | 50,044 | |||||||||||||||
| Selling, general and administrative expenses |
48,968 | 44,956 | 51,447 | 27,090 | 26,382 | |||||||||||||||
| Amortization of purchased intangible assets |
5,961 | 10,655 | 15,967 | — | — | |||||||||||||||
| Restructuring |
363 | 2,027 | 21,205 | — | (377 | ) | ||||||||||||||
| Impairment charges |
— | — | 5,799 | — | — | |||||||||||||||
| Acquired in-process research and development |
— | — | 6,300 | — | — | |||||||||||||||
|
|
|
|
|
|
|
|
|
|
|
|||||||||||
| Income (loss) from operations |
46,251 | 15,801 | (141,621 | ) | (5,266 | ) | (10,026 | ) | ||||||||||||
| Other income (expense) |
13,512 | 2,690 | 5,052 | 1,575 | (640 | ) | ||||||||||||||
|
|
|
|
|
|
|
|
|
|
|
|||||||||||
| Income (loss) before income taxes |
59,763 | 18,491 | (136,569 | ) | (3,691 | ) | (10,666 | ) | ||||||||||||
| Provision (benefit) for income taxes |
(315 | ) | 343 | 763 | (3,091 | ) | — | |||||||||||||
|
|
|
|
|
|
|
|
|
|
|
|||||||||||
| Net income (loss) |
$ | 60,078 | $ | 18,148 | $ | (137,332 | ) | $ | (600 | ) | $ | (10,666 | ) | |||||||
|
|
|
|
|
|
|
|
|
|
|
|||||||||||
| Net income (loss) per share: |
||||||||||||||||||||
| Basic |
$ | 1.22 | $ | 0.40 | $ | (3.38 | ) | $ | (0.03 | ) | $ | (0.52 | ) | |||||||
| Diluted |
$ | 1.19 | $ | 0.39 | $ | (3.38 | ) | $ | (0.03 | ) | $ | (0.52 | ) | |||||||
| Weighted average common shares used in computing net income (loss) per share: |
||||||||||||||||||||
| Basic |
49,398 | 45,198 | 40,646 | 20,870 | 20,710 | |||||||||||||||
| Diluted |
50,415 | 46,036 | 40,646 | 20,870 | 20,710 | |||||||||||||||
| Consolidated Balance Sheet Data: |
||||||||||||||||||||
| Working capital |
$ | 185,684 | $ | 110,984 | $ | 47,223 | $ | 86,506 | $ | 87,279 | ||||||||||
| Property and equipment, net |
20,827 | 26,277 | 38,301 | 27,213 | 32,483 | |||||||||||||||
| Total assets |
302,115 | 248,211 | 275,169 | 169,727 | 201,122 | |||||||||||||||
| Total debt |
— | 826 | 85,730 | 17,900 | 47,222 | |||||||||||||||
| Stockholders’ equity |
240,720 | 176,752 | 105,404 | 117,280 | 113,108 | |||||||||||||||
| Other Information: |
||||||||||||||||||||
| Current ratio |
5.08 | 3.02 | 1.39 | 3.43 | 2.32 | |||||||||||||||
| Asset turnover |
0.83 | 0.88 | 0.50 | 0.80 | 0.73 | |||||||||||||||
| Debt as a percentage of total capitalization |
— | 0.50 | % | 44.8 | % | 13.2 | % | 29.3 | % | |||||||||||
| Additions to property and equipment |
6,769 | 3,653 | 8,944 | 7,527 | 8,399 | |||||||||||||||
| Depreciation and amortization |
17,655 | 24,736 | 34,259 | 11,933 | 13,867 | |||||||||||||||
| (a) | 2009 includes the results of the combined company from the date of a merger completed August 29, 2008. Selected financial data presented for 2007-2008 does not include Credence’s results. |
17
Table of Contents
| Item 7. | Management’s Discussion and Analysis of Financial Condition and Results of Operations |
The following discussion should be read together with the Consolidated Financial Statements and Notes thereto appearing elsewhere in this annual report on Form 10-K. Certain statements in “Management’s Discussion and Analysis of Financial Condition and Results of Operations” are forward-looking statements that involve risks and uncertainties. Words such as may, will, should, would, anticipates, expects, intends, plans, believes, seeks, estimates and similar expressions identify such forward-looking statements. The forward-looking statements contained herein are based on current expectations and entail various risks and uncertainties that could cause actual results to differ materially from those expressed in such forward-looking statements. Factors that might cause such a difference include, among other things, those set forth under “Risk Factors” and those appearing elsewhere in this Form 10-K. Readers are cautioned not to place undue reliance on these forward-looking statements, which reflect management’s analysis only as of the date hereof. We assume no obligations to update these forward-looking statements to reflect actual results or changes in factors or assumptions affecting forward-looking statements.
Overview
We provide focused, cost-optimized automated test equipment (ATE) solutions. We design, manufacture, market and service ATE solutions that address the broad, divergent test requirements of the wireless, computing, automotive and consumer market segments. Semiconductor designers and manufacturers worldwide use our equipment to test their devices during two stages of the semiconductor manufacturing process; wafer probe and final package test. After testing, these devices are incorporated into a wide range of products, including computers; mobile internet equipment such as wireless access points and interfaces, broadband access products such as cable modems and DSL modems; personal communication products such as cell phones, smart phones and tablet devices; consumer products such as televisions, digital video recorders, videogame systems, digital cameras, navigation devices, and automobile electronics; and in portable electronics for power management.
We focus our marketing and sales efforts on integrated device manufacturers, (IDMs), outsource assembly and test providers, (OSATs), which perform manufacturing services for the semiconductor industry; and fabless companies, which design integrated circuits but have no manufacturing capability. We offer our customers with a comprehensive portfolio of test systems and provide a global network of strategically deployed applications and support resources.
On November 17, 2010, we entered into an Agreement and Plan of Merger (the “Merger Agreement”) with Verigy Ltd., a corporation organized under the laws of Singapore (“Verigy”). In March 2011, prior to the closing of our merger with Verigy, the board of directors of Verigy determined that a proposal from Advantest to acquire all of the outstanding ordinary shares of Verigy for $15.00 per share in cash, on the terms and conditions set forth in a definitive implementation agreement proposed by Advantest, constituted a “Superior Offer” within the meaning of the Merger Agreement, the Verigy board of directors withdrew its recommendation in favor of the pending merger transaction between Verigy and us and, as a result we then terminated the Merger Agreement. As a result of the termination of the Merger Agreement, on March 25, 2011Verigy paid us the $15,000,000 Verigy Termination Fee required pursuant to the terms and conditions of the Merger Agreement, which is classified as other income in our statement of operations.
In the twelve months ended July 31, 2011, we incurred approximately $4.9 million of expenses related to this terminated transaction, of which $3.6 million has been recorded in selling, general and administrative expenses on our consolidated statement of operations. The remaining $1.3 million was related to a break-up fee and was recorded as other income (expense).
Industry Conditions and Outlook
We sell capital equipment and services to companies that design, manufacture, assemble or test semiconductor devices. The semiconductor industry is highly cyclical, causing a cyclical impact on our financial results. As a capital equipment provider, our revenue is driven by the capital expenditure budgets and spending
18
Table of Contents
patterns of our customers, who often delay or accelerate purchases in reaction to variations in their business. The level of capital expenditures by these semiconductor companies depends on the current and anticipated market demand for semiconductor devices and the products that incorporate them. Therefore, demand for our semiconductor test equipment is dependent on growth in the semiconductor industry. In particular, three primary characteristics of the semiconductor industry drive the demand for semiconductor test equipment:
| • | increases in unit production of semiconductor devices; |
| • | increases in the complexity of semiconductor devices used in electronic products; and |
| • | the emergence of next generation device technologies, such as SIP. |
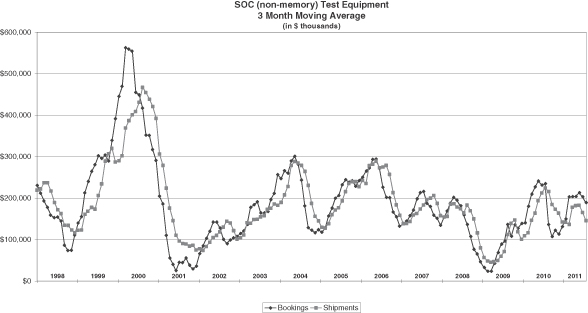
The following graph shows the cyclicality in semiconductor test equipment orders and shipments from fiscal 1998 through fiscal 2011 (using the three month moving average), as calculated by SEMI, an industry trade organization:
Consistent with our business strategy, we have continued to invest significant amounts in engineering and product development to develop and enhance our tester platforms during industry slowdowns. During these periods, we implement cost reduction measures, such as the strict oversight and reduction in discretionary travel and other variable overhead expenses. We believe that these reductions in operating costs preserve our ability to fund critical product research and development efforts and continue to provide our customers with the levels of responsiveness and service they require. In fiscal 2011, engineering and product development expenses were $52.7 million, or 21.1% of net sales, as compared to $48.9 million, or 22.3% of net sales, in fiscal 2010 and $71.2 million, or 51.8% of net sales, in fiscal year 2009.
We believe that our competitive advantage in the semiconductor test industry is primarily driven by the ability of our combined tester platforms to meet or exceed the cost and technical specifications required for the testing of advanced semiconductor devices. Our current investment in engineering and product development is focused on enhancements and additions to our product offerings with new options and instruments designed for specific market segments. We believe this will continue to differentiate our tester platforms from the product offerings of our competitors.
19
Table of Contents
In addition, we have transitioned the manufacture of certain components and subassemblies to contract manufacturers, thereby reducing our fixed manufacturing costs associated with direct labor and overhead. We believe that transforming product manufacturing costs into variable costs allows us to improve our performance in the highly cyclical semiconductor industry.
We are also exposed to the risks associated with the volatility of the U.S. and global economies. The lack of visibility regarding whether or when there will be sustained growth periods for the sale of electronic goods and information technology equipment, and uncertainty regarding the amount of sales, underscores the need for caution in predicting growth in the semiconductor test equipment industry in general and in our revenues and profits specifically. Slow or negative growth in the U.S. economy may materially and adversely affect our business, financial condition and results of operations for the foreseeable future. Our results of operations would be further adversely affected if we were to experience lower than anticipated order levels, cancellations of orders in backlog, extended customer delivery requirements or pricing pressure as a result of a slowdown. At lower levels of revenue, there is a higher likelihood that these types of changes in our customers’ requirements would adversely affect our results of operations because in any particular quarter a limited number of transactions accounts for an even greater portion of sales for the quarter.
Critical Accounting Policies and the Use of Estimates
The preparation of financial statements in conformity with generally accepted accounting principles requires management to make estimates and assumptions that affect the reported amount of assets, liabilities, revenues and expenses, and related disclosure of contingent assets and liabilities. We base these estimates and assumptions on historical experience and evaluate them on an ongoing basis to ensure they remain reasonable under current conditions. Actual results could differ from those estimates. We believe that our most critical accounting policies upon which our financial reporting depends and which involve the most complex and subjective decisions or assessments are as follows: revenue recognition, inventory reserves, income taxes, valuation of goodwill and other intangibles, warranty, impairment of long-lived assets other than goodwill and allowances for doubtful accounts.
A summary of those accounting policies and estimates that we believe to be most critical to fully understand and evaluate our financial results is set forth below. The summary should be read in conjunction with our Consolidated Financial Statements and related disclosures elsewhere in this Annual Report on Form 10-K.
Revenue Recognition
Our revenue recognition policy is described in Note 2, Summary of Significant Accounting Policies, contained in the Notes to Consolidated Financial Statements included in this report and is incorporated herein by reference. We recognize revenue when persuasive evidence of an arrangement exists, delivery and customer acceptance (if required) has occurred or services have been rendered, the seller’s price is fixed or determinable, and collectability is reasonably assured.
Inventory Reserves
We are exposed to a number of economic and industry factors that could result in portions of our inventory becoming either obsolete or in excess of anticipated usage. These factors include, but are not limited to, changes in our customers’ capital expenditures, technological changes in our markets, our ability to meet changing customer requirements, competitive pressures in products and prices, and the availability of key components from our suppliers. Our policy is to establish inventory reserves when conditions exist that suggest our inventory may be in excess of anticipated demand or is obsolete based upon our assumptions about future demand for our products or market conditions. We regularly evaluate the ability to realize the value of our inventory based on a combination of factors including the following: historical usage rates, forecasted sales or usage, estimated product end of life dates, estimated current and future market values and new product introductions. Purchasing
20
Table of Contents
and alternative usage options are also explored to mitigate inventory exposure. When recorded, our reserves are intended to reduce the carrying value of our inventory to its net realizable value. Such reserves are not reversed until the related inventory is sold or otherwise disposed.
For the year ended July 31, 2011, we recorded $20.4 million in sales of previously reserved inventory. We released reserves of $4.1 million related to these sales for the year ended July 31, 2011. For the year ended July 31, 2010, we recorded $1.9 million in sales of previously reserved inventory. We released reserves of $0.8 million related to these sales for the year ended July 31, 2010. The significant increase year over year for sales of previously reserved inventory was primarily driven by higher than expected demand for the Sapphire product, which was discontinued as part our product roadmap decision in fiscal year 2008. For the year ended July 31, 2009, we recorded $0.2 million in sales of previously written off inventory, with no reserves released related to these sales.
As of July 31, 2011, our inventory of $21.1 million is stated net of inventory reserves of $43.0 million. As of July 31, 2010, our inventory of $21.0 million is stated net of inventory reserves of $45.6 million. The inventory reserves consist of Fusion, X-Series, ASL, Sapphire, and Diamond products.
Of the $21.1 million inventory balance at July 31, 2011, $11.6 million consists of materials and components to support current requirements for Fusion HFi, X-Series, ASL and Diamond products, $6.6 million consists of evaluation inventory at customers, and $2.6 million consists of “last time buy” custom components primarily for Fusion HFi and ASL products. In addition, there is $0.3 million of deferred inventory costs related to shipment of inventory where revenue recognition is subject to product acceptance at July 31, 2011. If actual demand for our products deteriorates or market conditions are less favorable than those that we project, additional inventory reserves may be required. See Note 2, Summary of Significant Accounting Policies, contained in the Notes to Consolidated Financial Statements included in this report.
Income Taxes
In accordance with FASB ASC Topic 740, Income Taxes (“ASC 740”), we recognize deferred income taxes based on the expected future tax consequences of differences between the financial statement basis and the tax basis of assets and liabilities calculated using enacted tax rates for the year in which the differences are expected to be reflected in the tax return. Valuation allowances are established when necessary to reduce deferred taxes to the amount expected to be realized.
We have deferred tax assets resulting from tax credit carryforwards, net operating losses and other deductible temporary differences, which will reduce taxable income in future periods. ASC 740 requires that a valuation allowance be established when it is “more likely than not” that all or a portion of deferred tax assets will not be realized. A review of all available positive and negative evidence needs to be considered, including a company’s performance, the market environment in which it operates, the length of carryback and carryforward periods, existing sales backlog and future sales projections. Where there are cumulative losses in recent years, ASC 740 creates a strong presumption that a valuation allowance is needed. This presumption can be overcome in very limited circumstances. As a result of our cumulative net loss position in recent years and the increased uncertainty relative to the timing of profitability in future periods, we continue to maintain a valuation allowance for our entire net deferred tax assets. The valuation allowance for deferred tax assets decreased from $223.4 million at July 31, 2010, to $194.5 million at July 31, 2011. The decrease in our valuation allowance compared to the prior year was primarily due to a decrease in deferred tax assets associated with state net operating loss and credit carryforwards that are subject to annual limitations as defined in sections 382 and 383 of the Internal Revenue Code (IRC) and a decrease in deferred tax assets associated with an accounting method change for spare parts.
We expect to record a full valuation allowance on future tax benefits until we can sustain an appropriate level of profitability. Until such time, we would not expect to recognize any significant tax benefits in our future
21
Table of Contents
results of operations. We will continue to monitor the recoverability of our deferred tax assets on a periodic basis. As a result of the merger and (IRC) Section 382 guidance, the future utilization of our net operating loss deductions will be significantly limited. See Note 6 to our Consolidated Financial Statements.
Valuation of Goodwill
In accordance with Topic 350, Intangibles—Goodwill and Other, to the FASB ASC (“ASC 350”), we are required to review goodwill by reporting unit for impairment at least annually or more often if there are indicators of impairment present. We have determined our entire business represents one reporting unit. Historically, we have performed our annual impairment analysis during the fourth quarter of each year. The provisions of ASC 350 require that a two-step impairment test be performed for goodwill. In the first step, we compare the fair value of each reporting unit to which goodwill has been allocated to its carrying value. If the fair value of the reporting unit exceeds the carrying value of the net assets assigned to that reporting unit, goodwill is considered not impaired and we are not required to perform further testing. If the carrying value of the net assets assigned to the reporting unit exceeds the fair value of the reporting unit, then we must perform the second step of the impairment test in order to determine the implied fair value of the reporting unit’s goodwill. If the carrying value of a reporting unit’s goodwill exceeds its implied fair value, then we would record an impairment loss equal to the difference. As of July 31, 2011 the fair value of our reporting unit exceeded the carrying value of the reporting unit’s net assets and therefore no impairment exists as of that date.
Determining the fair value of a reporting unit, if applicable, requires us to make judgments and involves the use of significant estimates and assumptions. These estimates and assumptions include revenue growth rates and operating margins used to calculate projected future cash flows, risk-adjusted discount rates, future economic and market conditions and determination of appropriate market comparables. We base our fair value estimates on assumptions we believe to be reasonable but that are unpredictable and inherently uncertain. Actual future results may differ from those estimates.
As discussed in Note 2 to the consolidated financial statements, there were no impairment conditions present during the year and therefore we did not conduct an interim impairment test. During the quarter ending July 31, 2011, we conducted analyses of the potential impairment of goodwill and concluded that this asset was not impaired at that date. We will perform these analyses if indicators of potential impairment exist, or at least annually.
Valuation of Identifiable Intangible Assets
Our identifiable intangible assets include developed technology, distributor and key customer relationships and trade names. Our developed technology relates to patents, patent applications and know-how with respect to the technologies embedded in our currently marketed products.
We primarily used the income approach to value the existing technology and other intangible assets as the date of acquisition. This approach calculates fair value by estimating future cash flows attributable to each intangible asset and discounting them to present value at a risk-adjusted discount rate.
In estimating the useful life of the acquired assets, we considered paragraph 11 of ASC 350, which lists the pertinent factors to be considered when estimating the useful life of an intangible asset. These factors included a review of the expected use by the combined company of the assets acquired, the expected useful life of another asset (or group of assets) related to the acquired assets, legal, regulatory or other contractual provisions that may limit the useful life of an acquired asset or may enable the extension of the useful life of an acquired asset without substantial cost, the effects of obsolescence, demand, competition and other economic factors, and the level of maintenance expenditures required to obtain the expected future cash flows from the asset. We have been amortizing these intangible assets over their estimated useful lives using a method that is based on estimated future cash flows as we believe this approximates the pattern in which the economic benefits of the intangible assets will be derived.
22
Table of Contents
Impairment of Long-Lived Assets Other Than Goodwill
On an on-going basis, management reviews the value and period of amortization or depreciation of long-lived assets. In accordance with FASB ASC Topic 360, Property, Plant and Equipment, (“ASC 360”), we review whether impairment losses exist on long-lived assets when indicators of impairment are present. During this review, we reevaluate the significant assumptions used in determining the original cost of long-lived assets. Although the assumptions may vary, they generally include revenue growth, operating results, cash flows and other indicators of value. Management then determines whether there has been a permanent impairment of the value of long-lived assets based upon events or circumstances that have occurred since acquisition. The extent of the impairment amount recognized is based upon a determination of the impaired asset’s fair value. As of July 31, 2011 there were no indicators that required us to conduct a recoverability test at that date.
Warranty
We provide standard warranty coverage on our systems, providing labor and parts necessary to repair the systems during the warranty period. We account for the estimated warranty cost as a charge to cost of sales when the revenue is recognized. The estimated warranty cost is based on historical product performance and field service expenses. We use actual service hours and parts expense per system and apply the actual labor and overhead rates to estimate the warranty charge. The actual product performance and/or field service expense profiles may differ, and in those cases we adjust the warranty accrual accordingly.
Trade Accounts Receivable and Allowance for Doubtful Accounts
Trade accounts receivable are recorded at the invoiced amount and do not bear interest, and typically have a contractual maturity of ninety days or less. A majority of our trade receivables are derived from sales to large multinational semiconductor manufacturers throughout the world. The volatility of the industries that we serve can cause certain of our customers to experience shortages of cash, which can impact their ability to make required payments. In order to monitor potential credit losses, we perform ongoing credit evaluations of our customers’ financial condition. An allowance for doubtful accounts is maintained for potential credit losses based upon our assessment of the expected collectability of all accounts receivable. The allowance for doubtful accounts is reviewed periodically to assess the adequacy of the allowances. In any circumstances in which we are aware of a customer’s inability to meet its financial obligations, we provide an allowance, which is based on the age of the receivables, the circumstances surrounding the customer’s financial situation and our historical experience. If circumstances change, and the financial condition of our customers were adversely affected resulting in their inability to meet their financial obligations to us, we may need to record additional allowances. Account balances are charged off against the allowance when it is determined the receivable will not be recovered.
23
Table of Contents
Results of Operations
The following table sets forth for the periods indicated the principal items included in the Consolidated Statements of Operations data:
| Year Ended July 31, | ||||||||||||
| 2011 | 2010 | 2009 (a) | ||||||||||
| (in thousands, except per share data) | ||||||||||||
| Net sales |
$ | 249,530 | $ | 219,082 | $ | 137,378 | ||||||
| Cost of sales |
95,290 | 96,700 | 87,805 | |||||||||
| Inventory-related provision |
— | — | 19,311 | |||||||||
|
|
|
|
|
|
|
|||||||
| Gross profit |
154,240 | 122,382 | 30,262 | |||||||||
| Engineering and product development expenses |
52,697 | 48,943 | 71,165 | |||||||||
| Selling, general and administrative expenses |
48,968 | 44,956 | 51,447 | |||||||||
| Amortization of purchased intangible assets |
5,961 | 10,655 | 15,967 | |||||||||
| Restructuring |
363 | 2,027 | 21,205 | |||||||||
| Impairment charges |
— | — | 5,799 | |||||||||
| Acquired in-process research and development |
— | — | 6,300 | |||||||||
|
|
|
|
|
|
|
|||||||
| Income (loss) from operations |
46,251 | 15,801 | (141,621 | ) | ||||||||
| Other income (expense): |
||||||||||||
| Interest expense |
(309 | ) | (2,745 | ) | (6,077 | ) | ||||||
| Investment income |
349 | 224 | 2,271 | |||||||||
| Other income, net |
13,472 | 2,131 | 3,493 | |||||||||
| Gain on extinguishment of debt, net |
— | 3,080 | 2,387 | |||||||||
| Gain on liquidation of subsidiary |
— | — | 2,978 | |||||||||
|
|
|
|
|
|
|
|||||||
| Income (loss) before income taxes |
59,763 | 18,491 | (136,569 | ) | ||||||||
| Provision (benefit) for income taxes |
(315 | ) | 343 | 763 | ||||||||
|
|
|
|
|
|
|
|||||||
| Net income (loss) |
$ | 60,078 | $ | 18,148 | $ | (137,332 | ) | |||||
|
|
|
|
|
|
|
|||||||
| Net income (loss) per share: |
||||||||||||
| Basic |
$ | 1.22 | $ | 0.40 | $ | (3.38 | ) | |||||
| Diluted |
$ | 1.19 | $ | 0.39 | $ | (3.38 | ) | |||||
| (a) | 2009 includes the results of the combined company from the date of a merger completed August 29, 2008. |
24
Table of Contents
The following table sets forth for the periods indicated the principal items included in the Consolidated Statements of Operations as percentages of net sales:
| Percentage of Net Sales Year Ended July 31, |
||||||||||||
| 2011 | 2010 | 2009 | ||||||||||
| Net sales |
100.0 | % | 100.0 | % | 100.0 | % | ||||||
| Cost of sales |
38.2 | 44.1 | 63.9 | |||||||||
| Inventory related provision |
— | — | 14.1 | |||||||||
|
|
|
|
|
|
|
|||||||
| Gross profit |
61.8 | 55.9 | 22.0 | |||||||||
| Engineering and product development expenses |
21.1 | 22.3 | 51.8 | |||||||||
| Selling, general and administrative expenses |
19.6 | 20.5 | 37.5 | |||||||||
| Amortization of purchased intangible assets |
2.4 | 4.9 | 11.6 | |||||||||
| Restructuring |
0.1 | 1.0 | 15.4 | |||||||||
| Impairment charges |
— | — | 4.2 | |||||||||
| Acquired in-process research and development |
— | — | 4.6 | |||||||||
|
|
|
|
|
|
|
|||||||
| Income (loss) from operations |
18.6 | 7.2 | (103.1 | ) | ||||||||
| Other income (expense): |
||||||||||||
| Interest expense |
(0.1 | ) | (1.3 | ) | (4.4 | ) | ||||||
| Investment income |
0.1 | 0.1 | 1.7 | |||||||||
| Other income, net |
5.4 | 1.0 | 2.5 | |||||||||
| Gain on extinguishment of debt, net |
— | 1.4 | 1.7 | |||||||||
| Gain on liquidation of subsidiary |
— | — | 2.2 | |||||||||
|
|
|
|
|
|
|
|||||||
| Income (loss) before income taxes |
24.0 | 8.4 | (99.4 | ) | ||||||||
| Provision (benefit) for income taxes |
(0.1 | ) | 0.1 | 0.6 | ||||||||
|
|
|
|
|
|
|
|||||||
| Net income (loss) |
24.1 | % | 8.3 | % | (100 | )% | ||||||
|
|
|
|
|
|
|
|||||||
Fiscal 2011 Compared to Fiscal 2010
Net sales. Net sales consist of sales of semiconductor test equipment and system support and maintenance services. Net sales for the year ended July 31, 2011 increased 13.9% to $249.5 million as compared to $219.1 million in the prior year. The increase in net sales in the year ended July 31, 2011 as compared to the same period in the prior year was due to improvement in the overall economic environment and higher demand from certain customers.
For the year ended July 31, 2011, we recorded $20.4 million in sales of previously reserved inventory, as compared to $1.9 million of sales of previously reserved inventory for the year ended July 31, 2010. The significant increase year over year for sales of previously reserved inventory was primarily driven by higher than expected demand for the Sapphire product, which was discontinued as part our product roadmap decision in fiscal year 2008.
Sales to our ten largest customers accounted for 80% and 77% of revenues for the years ended July 31, 2011 and July 31, 2010, respectively. Net product sales were $207.8 million for the year ended July 31, 2011 as compared to $174.1 million for the year ended July 31, 2010.
Service revenue, included in net sales, accounted for $41.7 million, or 16.7% of net sales, and $45.0 million, or 20.5% of net sales, for the years ended July 31, 2011 and 2010, respectively. The decrease in service revenue is primarily a result of increased reliability of our test equipment and lower cost products, each of which reduce the demand for service.
Geographically, sales to customers outside of the United States were 85.1% and 76.4% of net sales for the years ended July 31, 2011 and 2010, respectively. The increase in sales to customers outside the United States was a result of increased demand primarily in Philippines, Singapore, and Europe.
25
Table of Contents
Gross profit margin. Gross profit margin was $154.2 million or 61.8% of net sales in the year ended July 31, 2011, as compared to $122.4 million or 55.9% of net sales in the same period in 2010. The increase in gross profit margin for the twelve months ended July 31, 2011 as compared to the same period in 2010 was driven by an increase in product revenue fueled by higher demand from certain customers as they increase their capital spending levels, sales of previously reserved inventory of $20.4 million as well as higher absorption of fixed cost of sales, and lower warranty expense due to product mix.
Engineering and product development expenses. Engineering and product development expenses were $52.7 million, or 21.1% of net sales, in the year ended July 31, 2011, as compared to $48.9 million, or 22.3% of net sales for the year ended July 31, 2010. The increase in engineering and product development expenses for the year ended July 31, 2011 as compared to the year ended July 31, 2010 is due primarily to increased temporary labor and consulting expense and non-recurring engineering work associated with ongoing projects throughout the year ended July 31, 2011.
Selling, general and administrative expenses. Selling, general and administrative expenses were $49.0 million, or 19.6% of net sales, in the year ended July 31, 2011, as compared to $45.0 million, or 20.5% of net sales for the year ended July 31, 2010. The dollar increase is principally a result of an increased profit sharing bonus expense for executives and employees associated with improved operating results as well as higher commissions associated with increase revenues, and approximately $3.6 million of expenses associated with the proposed merger with Verigy.
Amortization of purchased intangible assets. Amortization associated with intangible assets acquired from Credence was $6.0 million or 2.4% of net sales for the year ended July 31, 2011, as compared to $10.7 million or 4.9% of net sales for the year ended July 31, 2010. The underlying intangible assets relate to acquired technology, customer and distributor relationships. The intangible assets are being amortized over their estimated useful lives of between one and nine years, based on a pattern of estimated use.
Restructuring. Restructuring expense was $0.4 million or 0.1% of net sales for the year ended July 31, 2011, as compared to $2.0 million or 0.9% of net sales for the year ended July 31, 2010. For the year ended July 31, 2011, we recorded a charge of $0.4 million as a result of changing sublease assumptions and adjusting the liability for common area maintenance charges associated with previously restructured facilities. For the year ended July 31, 2010, we recorded a charge of $2.0 million related to additional square footage vacated, changes in sublease assumptions on previously vacated facilities, and severance obligations for headcount reductions in Europe and Oregon.
Interest expense. Interest expense was $0.3 million for the twelve months ended July 31, 2011 as compared to $2.7 million for the twelve months ended July 31, 2010. Interest expense included the recognition of the 3.5% interest due semi-annually on then outstanding convertible notes, as well as the ratable recognition of the premium due at maturity on the convertible notes due in May 2011, and interest incurred on borrowings from the secured revolving credit facility, which expired in February 2011.
Investment income. Investment income was $0.3 million for the year ended July 31, 2011, as compared to $0.2 million for the year ended July 31, 2010. The increase is due to higher investment balances.
Other income, net. Other income, net was $13.5 million for the year ended July 31, 2011, as compared to $2.1 million for the year ended July 31, 2010. The increase in other income, net is primarily related to the receipt of the $15.0 million break-up fee paid to us by Verigy as a result of the termination of the Merger Agreement with Verigy, partially offset by $1.3 million paid as part of our contractual obligation to one of our advisors in connection with our proposed merger with Verigy. During the year ended July 31, 2010, we collected $2.6 million of a receivable which had been acquired at the time of the merger with Credence and was fully reserved based upon significant uncertainty regarding collectability. Other income, net, also includes foreign exchange currency gains and losses.
26
Table of Contents
Gain on extinguishment of debt, net. There were no debt repurchases made during the year ended July 31, 2011. In the year ended July 31, 2010, we repurchased $33.1 million of principal amount of the outstanding Convertible Senior Subordinated Notes due May 2011 at a discount to their par value, which resulted in a net gain of approximately $0.9 million. We also recognized approximately $2.2 million of previously deferred gains from debt modifications executed in fiscal 2009.
Provision (benefit) for income taxes. We recorded an income tax benefit of $0.3 million for the year ended July 31, 2011 as compared to an income tax expense of $0.3 million for the year ended July 31, 2010 primarily due to refunds received and foreign tax on earnings generated in foreign jurisdictions.
As of July 31, 2011 and July 31, 2010, our liability for unrecognized income tax benefits was $9.1 million and $8.6 million, respectively. As of July 31, 2011 unrecognized tax benefits of $5.3 million, if recognized, would impact the effective income tax rate.
We expect to maintain a full valuation allowance on United States deferred tax assets until we can sustain an appropriate level of profitability to insure utilization of existing tax assets. Until such time, we would not expect to recognize any significant tax benefits in our results of operations.
Net income. Net income was $60.1 million, or $1.22 per basic share and $1.19 per diluted share, in the year ended July 31, 2011, as compared to $18.1 million, or $0.40 per basic share and $0.39 per diluted share, in the year ended July 31, 2010.
Fiscal 2010 Compared to Fiscal 2009
Net sales. Net sales for the year ended July 31, 2010 increased 59.5% to $219.1 million as compared to $137.4 million in the prior year. The increase in net sales in the year ended July 31, 2010 as compared to the prior year was due to higher demand from certain customers as their capital spending levels recovered from historically low amounts in prior years.
Sales to our ten largest customers accounted for 77% and 69% of revenues for the years ended July 31, 2010 and July 31, 2009, respectively. Net product sales were $174.1 million for the year ended July 31, 2010 as compared to $79.6 million for the year ended July 31, 2009.
Service revenue, included in net sales, accounted for $45.0 million, or 20.5% of net sales, and $57.8 million, or 42.0% of net sales, for the years ended July 31, 2010 and 2009, respectively. Service revenue for the twelve months ended July 31, 2009 included revenue from service contracts from Credence that were sold to a third party prior to the merger that did not recur in the twelve months ended July 31, 2010.
Geographically, sales to customers outside of the United States were 76.4% and 64.4% of net sales for the years ended July 31, 2010 and 2009, respectively. The increase in sales to customers outside the United States was a result of increased demand, primarily in Taiwan and Philippines, and change in product mix.
Inventory-related provision. We recorded an inventory-related provision of $19.3 million, or 14.1% of net sales in the year ended July 31, 2009 for excess and obsolete inventory as a result of the determination of the combined company product roadmap, as well as declining customer demand due to industry conditions for certain product lines. Approximately $5.9 million of the provision related to product roadmap decisions to eliminate the ASL3K RF and Diamond D-40 products. The provision also consisted of $0.8 million related to the implementation of product roadmap decisions related to the ASL3K MS line and $4.8 million related to future requirements of last time buy components related to the implementation of the product roadmap decisions. In addition, $6.6 million of the inventory related provision was a result of a significant reduction in the demand for the Sapphire products which have been negatively impacted by then existing business conditions. The balance of the provision of approximately $1.2 million was related to our Fusion CX product line which is being phased out in favor of our Fusion MXc product line.
27
Table of Contents
Gross profit margin. Gross profit margin was $122.4 million or 55.9% of net sales in the year ended July 31, 2010, as compared to $30.3 million or 22.0% of net sales in the same period in 2009. The increase in gross profit margin for the twelve months ended July 31, 2010, as compared to the same period in 2009, was driven by an increase in product revenue fueled by higher demand from certain customers as they increased their capital spending levels and the inventory-related provision that was recorded during the twelve months ended July 31, 2009 that did not recur during the twelve months ended July 31, 2010.
Engineering and product development expenses. Engineering and product development expenses were $48.9 million, or 22.3% of net sales, in the year ended July 31, 2010, as compared to $71.2 million, or 51.8% of net sales for the year ended July 31, 2009. The decrease in engineering and product development expenses for the year ended July 31, 2010 as compared to the year ended July 31, 2009 is principally a result of decreased payroll and operating expenses associated with our merger integration cost reduction plan.
Selling, general and administrative expenses. Selling, general and administrative expenses were $45.0 million, or 20.5% of net sales, in the year ended July 31, 2010, as compared to $51.4 million, or 37.5% of net sales for the year ended July 31, 2009. The decrease is principally a result of decreased payroll and operating expenses associated with our merger integration cost reduction plan, partially offset by an increase during the twelve months ended July 31, 2010 of sales commissions, primarily to distributors, related to the increase in revenue for the same period and increased profit sharing bonus expense for executives and employees associated with improved operating results.
Impairment charges. There were no impairment charges recorded during the year ended July 31, 2010. For the year ended July 31, 2009, we recorded impairment charges of $5.8 million. $5.0 million of the impairment charges was primarily related to write-offs of certain internal capital equipment acquired from Credence. The charge was based on our determination of the combined company product roadmap, as well as declining customer demand due to the industry environment. We initiated a phase out of the Diamond D-40 and ASL3K RF product lines and determined that the demonstration equipment and other equipment to support development of these products were no longer needed or useable in other products. The remaining $0.8 million of impairment charges related to the revaluation of our land in Hillsboro, Oregon, for the excess of book value over fair value.
Amortization of purchased intangible assets. Amortization associated with intangible assets acquired from Credence was $10.7 million or 4.9% of net sales for the year ended July 31, 2010, as compared to $16.0 million or 11.6% of net sales for the year ended July 31, 2009. The underlying intangible assets relate to acquired technology, as well as customer and distributor relationships. These intangible assets acquired in the Credence merger are being amortized over their estimated useful lives of between one and nine years, based on a pattern of estimated use.
Acquired in-process research and development. In connection with the Credence merger, we recorded a charge associated with the write-off of acquired in-process research and development of $6.3 million or 4.6% of net sales for the year ended July 31, 2009. The most significant acquired in-process research and development related to Credence’s ASL and Diamond tester product lines.
Restructuring. Restructuring expense was $2.0 million or 0.9% of net sales for the year ended July 31, 2010, as compared to $21.2 million or 15.4% of net sales for the year ended July 31, 2009. For the year ended July 31, 2010, we recorded a charge of $2.0 million related to additional square footage vacated, changes in sublease assumptions and future rental payments on previously vacated facilities, severance obligations for headcount reductions in Europe and downsizing of the Company’s Hillsboro, Oregon facility. The charges recorded in the year ended July 31, 2009 included $5.9 million related to costs of vacating several facilities that were no longer required. The remainder of the expense, $15.3 million, was related to employee termination-related severance and outplacement costs and post-employment benefits associated with three separate headcount reduction actions in October 2008, January 2009 and April 2009.
Interest expense. Interest expense was $2.7 million for the year ended July 31, 2010 as compared to $6.1 million for the year ended July 31, 2009. Interest expense relates primarily to our Convertible Senior
28
Table of Contents
Subordinated Notes due May 2010, which bear an interest rate of 3.5% and our Convertible Senior Subordinated Notes due May 2011, which bear an interest rate of 3.5% and carry a premium due at maturity of 7.5%. We also incurred interest expense associated with borrowings on our secured revolving credit facility which bears an interest rate between 4.0% and 4.5% and our bank term loan which bore an interest rate of the prime rate minus 1.25%, until we refinanced our bank debt in February 2009, after which the term loan began bearing interest at a variable rate of between 4.0% and 4.5%. The decrease in interest expense is primarily the result of the decrease in the principal balance of convertible notes outstanding as of July 31, 2010 versus July 31, 2009, the reduction in the outstanding borrowings under the secured revolving credit facility which was paid down in March 2010 with no subsequent borrowings, and the reduction in the balance of a term loan held with Silicon Valley Bank that was fully paid off during the first quarter of fiscal 2010.
Investment income. Investment income was $0.2 million for the year ended July 31, 2010, as compared to $2.3 million for the year ended July 31, 2009. The decrease was in line with a reduction in interest rates, and a reduction in the underlying cash balance throughout the year from net cash used in operating activities and net cash used in financing activities, primarily repurchases of certain of our Convertible Notes.
Other income, net. Other income, net was $2.1 million for the year ended July 31, 2010, as compared to $3.5 million for the year ended July 31, 2009. During the year ended July 31, 2010, we collected $2.6 million of a receivable which had been acquired at the time of the merger with Credence and was fully reserved based upon significant uncertainty regarding collectability. Other income, net, also includes foreign exchange currency gains and losses.
Gain on extinguishment of debt, net. At the time of the completion of the merger, Credence had outstanding $122.5 million aggregate principal amount of 3.5% Convertible Senior Subordinated Notes due 2010 (“Notes”). In the year ended July 31, 2009, we repurchased approximately $87.0 million of principal amount of the Notes at a discount to their par value. Of the $87.0 million in Notes repurchases, the repurchases of $47.3 million of Notes in exchange for 3.5% Convertible Senior Subordinated Notes due 2011 (“New Notes”) were considered debt modifications under ASC 470 (EITF 96-19). Accordingly, we deferred a gain of $2.4 million and are amortizing the gain over the remaining life of the New Notes. For the year ended July 31, 2009, we recognized $0.3 million of the gain on this deferral. The discount to the par value of the extinguishment of the remaining notes repurchased resulted in a net gain on extinguishment of debt of approximately $2.1 million in the year ended July 31, 2009. In the year ended July 31, 2010, we repurchased $33.1 million of principal amount of the outstanding New Notes at a discount to their par value, which resulted in a net gain of approximately $0.9 million. We also recognized approximately $2.1 million of previously deferred gains from the debt modifications executed in fiscal 2009.
Provision (benefit) for income taxes. We recorded an income tax provision of $0.3 million for the year ended July 31, 2010 as compared to $0.8 million for the year ended July 31, 2009, primarily due to foreign tax on earnings generated in foreign jurisdictions.
As of July 31, 2010 and July 31, 2009, our liability for unrecognized income tax benefits was $8.6 million and $13.7 million, respectively. As of July 31, 2010, unrecognized tax benefits of $4.8 million, if recognized, would impact the effective income tax rate. The decrease in the unrecognized income tax benefits is attributable to the release of uncertain tax positions in respect to net operating loss and credit carryforwards that are subject to annual limitations as defined in sections 382 and 383 of the Internal Revenue Code.
We expect to maintain a full valuation allowance on United States deferred tax assets until we can sustain an appropriate level of profitability to insure utilization of existing tax assets. Until such time, we do not expect to recognize any significant tax benefits in our results of operations.
Net income (loss). Net income was $18.1 million, or $0.40 per basic share and $0.39 per diluted share, in the year ended July 31, 2010, as compared to net loss of $137.3 million, or $(3.38) per basic and diluted share, in the year ended July 31, 2009. The $155.4 million change from net loss to net income in the year ended July 31,
29
Table of Contents
2010, as compared to the year ended July 31, 2009, was principally due to $54.2 million of merger-related charges that were incurred in fiscal 2009 that did not recur in fiscal 2010, improved levels of sales in the ATE sector, as well as decreased operating expenses associated with our merger integration cost reduction plan.
Liquidity and Capital Resources
The following is a summary of significant items impacting our liquidity and capital resources for the year ended July 31, 2011 and 2010 (in millions):
| Year Ended July 31, 2011 |
Year Ended July 31, 2010 |
|||||||
| (in millions) | ||||||||
| Cash and cash equivalents and marketable securities at beginning of year |
$ | 93.4 | $ | 95.6 | ||||
| Merger related termination fee, net of expenses |
10.1 | — | ||||||
| Pay down of Term Loan with Silicon Valley Bank (“SVB”) |
— | (12.2 | ) | |||||
| Repurchases of convertible notes |
— | (31.6 | ) | |||||
| Cash received from secondary equity offering, net |
— | 47.7 | ||||||
| Pay down of credit revolver, net |
— | (39.4 | ) | |||||
| Repayment at maturity of Notes due May 2011 and 2010, respectively |
(0.9 | ) | (1.5 | ) | ||||
| Capital expenditures |
(6.8 | ) | (3.7 | ) | ||||
| Other sources of cash, primarily cash from operations |
66.8 | 38.5 | ||||||
|
|
|
|
|
|||||
| Cash and cash equivalents and marketable securities at end of year |
$ | 162.6 | $ | 93.4 | ||||
|
|
|
|
|
|||||
Fiscal 2011 Compared to Fiscal 2010
As of July 31, 2011, we had $162.6 million in cash and cash equivalents and marketable securities and working capital of $185.7 million, as compared to $93.4 million of cash and cash equivalents and marketable securities and $111.0 million of net working capital at July 31, 2010. A primary contributor to the increase in cash and cash equivalents and marketable securities was higher operating cash, due to a strong generation of net income and a continued strength in managing working capital from customer payment terms, tight control over vendor payments, and customer collections. Also contributing to the increase year over year was receipt of the Verigy Termination Fee of $15.0 million, offset by $4.9 million of expenses related to this terminated transaction.
Accounts receivable from trade customers, net of allowances, was $42.6 million at July 31, 2011, as compared to $45.6 million at July 31, 2010. The $3.0 million decrease in accounts receivable is primarily due to timely customer collections. The allowance for doubtful accounts was less than $0.1 million, or 0.1% of gross trade accounts receivable at July 31, 2011 and $0.1 million, or 0.2% of gross trade accounts receivable at July 31, 2010.
Capital expenditures totaled $6.8 million for the year ended July 31, 2011, as compared to $3.7 million for the year ended July 31, 2010. Expenditures for the year ended July 31, 2011 and 2010 were composed primarily of testers and tester spare parts. Also included in the capital expenditures for the year ended July 31, 2010 was equipment related to our asset purchase of a board repair vendor.
Net cash provided by operating activities for the year ended July 31, 2011 was $77.1 million as compared to net cash provided by operating activities of $38.7 million for the year ended July 31, 2010. The net cash provided by operating activities for the year ended July 31, 2011 was primarily related to our net income of $60.1 million, adjusted for non-cash items, principally depreciation and amortization and stock-based compensation, of $23.5 million, offset by a net increase in working capital of $6.5 million. The net cash provided by operating activities
30
Table of Contents
for the year ended July 31, 2010 was primarily related to our net income of $18.1 million, adjusted for non-cash items, principally depreciation and amortization and stock-based compensation, of $29.4 million, offset by a net increase in working capital of $8.8 million.
Net cash used in investing activities for the year ended July 31, 2011 was $28.4 million as compared to net cash used in investing activities of $12.2 million for the year ended July 31, 2010. The net cash used in investing activities for the year ended July 31, 2011 was primarily related to $49.4 million in purchases of available-for-sale securities, $4.0 million in purchases of held to maturity securities, and $6.8 million in purchases of property and equipment, offset by $30.7 million of proceeds from sales and maturities of available-for-sale securities and $1.1 million of proceeds from held to maturity securities. The net cash used in investing activities for the year ended July 31, 2010 was primarily related to $42.0 million in purchases of available-for-sale securities, $1.1 million in purchases of held to maturity securities, and $3.7 million in purchases of property and equipment, offset by $34.6 million of proceeds from sales and maturities of available-for-sale securities.
We had $1.0 million in net cash used in financing activities for the year ended July 31, 2011 as compared to net cash used in financing activities of $37.8 million for the year ended July 31, 2010. The net cash used in financing activities for the year ended July 31, 2011 was primarily related to payments made on our convertible senior subordinated notes of $0.9 million, payments of tax withholdings for vested RSUs of $0.8 million, offset by proceeds from the employee stock purchase plan of $0.7 million. The net cash used in financing activities for the year ended July 31, 2010 was primarily related to payments made on our term loan of $12.2 million and payments made on our convertible senior subordinated notes of $33.1 million, as well as net repayments of borrowings from our revolving credit facility of $39.4 million, partially offset by proceeds from our secondary equity offering of $47.7 million.
We believe our cash, cash equivalents and marketable securities balance of $162.6 million as of July 31, 2011 will be sufficient to meet working capital and expenditures needs for at least the next twelve months.
Fiscal 2010 Compared to Fiscal 2009
As of July 31, 2010, we had $93.4 million in cash and cash equivalents and marketable securities and net working capital of $111.0 million, as compared to $95.6 million of cash and cash equivalents and marketable securities and $47.2 million of net working capital at July 31, 2009. The decrease in cash and cash equivalents and marketable securities was due to the pay down of our secured credit revolver of $39.4 million, pay down of the term loan with SVB of $12.2 million, repurchases of convertible notes of $31.6 million, and other items funded by proceeds from our secondary equity offering completed during the quarter ending April 30, 2010 and inflows from improvements in working capital.
Accounts receivable from trade customers, net of allowances, was $45.6 million at July 31, 2010, as compared to $23.6 million at July 31, 2009. The principal reason for the $22 million increase in accounts receivable is our revenues outpaced cash collections for the year ended July 31, 2010. The allowance for doubtful accounts was $0.1 million, or 0.2% of gross trade accounts receivable at July 31, 2010 and $0.5 million, or 2.0% of gross trade accounts receivable at July 31, 2009. The decrease in the allowance of $0.4 million was principally the result of the write off of amounts previously provided for as uncollectible.
Accounts receivable from other sources, principally amounts due from our contract manufacturers, decreased $0.2 million to $1.2 million at July 31, 2010, as compared to $1.4 million at July 31, 2009. The decrease was attributed to the timing of component inventory transferred to our outsource suppliers based on an increase in build plans.
Net inventories decreased by $14.3 million to $21.0 million at July 31, 2010 as compared to $35.3 million primarily due to the sale of production inventory in our normal course of doing business, offset by an increase in consignment inventory deployed to certain customers and prospective customers.
31
Table of Contents
Prepaid expenses and other current assets decreased by $7.6 million to $4.6 million at July 31, 2010 as compared to $12.2 million at July 31, 2009 primarily due to collections of value-added tax (“VAT”) receivables, the liquidation of assets in a deferred compensation plan, utilization of prepaid inventory in line with the increase in sales activities for the year, reduction of our prepaid rent for the comparative periods related to our downsizing activities in our Oregon facility, and return of a security deposit for one of our properties at lease-end.
Future cash payments related to severance restructuring actions are approximately $0.1 million and are expected to be paid out within 12 months.
Capital expenditures totaled $3.7 million for the year ended July 31, 2010, as compared to $8.9 million for the year ended July 31, 2009. Expenditures for the year ended July 31, 2010 were composed of testers and tester spare parts, and equipment related to our asset purchase of a board repair vendor. Expenditures for the year ended July 31, 2009 were composed of tester and tester spare parts.
Net cash provided by operating activities for the year ended July 31, 2010 was $38.7 million as compared to net cash used in operating activities of $58.4 million for the year ended July 31, 2009. The net cash provided by operating activities for the year ended July 31, 2010 was primarily related to our net income of $18.1 million, adjusted for non-cash items, principally depreciation and amortization, of $29.4 million, offset by a net increase in working capital of $8.8 million. The net cash used in operating activities of $58.4 million for the year ended July 31, 2009 was primarily related to our net loss of $137.3 million adjusted for non-cash items, principally depreciation and amortization and impairment losses, of $74.7 million, offset by a net decrease in working capital of $4.2 million.
Net cash used in investing activities for the year ended July 31, 2010 was $12.2 million as compared to net cash provided by investing activities of $136.2 million for the year ended July 31, 2009. The net cash used in investing activities for the year ended July 31, 2010 was primarily related to $43.1 million in purchases of available for sale securities and $3.7 million in purchases of property and equipment, offset by $34.6 million of proceeds from sales and maturities of available for sale securities. The net cash provided by investing activities for the year ended July 31, 2009 was primarily related to $131.7 million of net cash received in connection with our merger with Credence Systems Corporation, as well as $19.7 million in proceeds from the maturities of available for sale securities, offset by $6.3 million of purchases of available for sale securities, and $8.9 million in purchases of property and equipment.
We had $37.8 million in net cash used in financing activities for the year ended July 31, 2010 as compared to net cash used in financing activities of $42.7 million for the year ended July 31, 2009. The net cash used in financing activities for the year ended July 31, 2010 was primarily related to payments made on our term loan of $12.2 million and cash payments made on our convertible senior subordinated notes of $33.1 million, as well as net repayments of borrowings from our revolving credit facility of $99.4 million. These amounts were offset by proceeds received from borrowings from our revolving credit facility of $60.0 million and proceeds from our secondary equity offering of $47.7 million. The net cash used in financing activities for the year ended July 31, 2009 was primarily related to payments made on our term loan of $5.7 million and payments made on our convertible senior subordinated notes of $76.3 million, offset by proceeds from borrowings on revolving credit facility of $39.4 million.
Stock Buyback
On September 15, 2011, we announced that our board of directors authorized a stock repurchase program for up to $25 million. Under this program, our board of directors authorized us to repurchase shares of our common stock from time to time in open market transaction. We will determine the timing and amount of the transaction based on our evaluation of market conditions and other factors. The repurchase program may be suspended or discontinued at any time and has no expiration date.
32
Table of Contents
Loan Agreements with Silicon Valley Bank (“SVB”)
On February 25, 2011, our $40.0 million secured revolving credit facility with SVB expired. We have not renewed and have no plans to renew the agreement for this facility. See Note 5 to the consolidated financial statements included in this Annual Report on Form 10-K for more information.
Convertible Senior Subordinated Notes (“Notes”)
The following table reflects the carrying value of the Convertible Senior Subordinated Notes due 2011 as of July 31, 2011 and July 31, 2010 (in thousands):
| July 31, 2011 |
July 31, 2010 |
|||||||
| Convertible Senior Subordinated Notes due 2011 |
$ | — | $ | 876 | ||||
| Less: Unamortized debt discount |
— | (50 | ) | |||||
|
|
|
|
|
|||||
| Net carrying value—Convertible Senior Subordinated Notes due 2011 |
$ | — | $ | 826 | ||||
|
|
|
|
|
|||||
In May 2010, we repaid the remaining $1.5 million of our 3.5% Convertible Senior Subordinated Notes due May 2010 (the “2010 Notes”) on their maturity date.
In the year ended July 31, 2010, we repurchased $33.1 million of 3.5% Convertible Senior Subordinated Notes due May 2011 (the “2011 Notes” and together with the 2010 Notes, the “Notes”) at a discount to their par value for net cash consideration of $31.6 million. We accounted for the repurchase of the Notes as an extinguishment of debt in accordance with FASB ASC Topic 860, Transfers and Servicing and recorded a net gain on extinguishment of debt of $0.9 million in the twelve months ended July 31, 2010.
At maturity of the 2011 Notes, on May 15, 2011, we repaid the outstanding principal of the 2011 Notes, together with accrued and unpaid interest thereon, and a maturity premium equal to 7.5% of such principal.
As a result, as of July 31, 2011, we have no Notes outstanding.
On May 26, 2009, we settled our offer to exchange (the “Exchange Offer”) any and all of our 2010 Notes for our 2011 Notes and certain cash consideration, all upon the terms and subject to the conditions described in our offering circular, dated April 22, 2009 and the related letter of transmittal. At settlement of the Exchange Offer, in exchange for the 2010 Notes accepted in the Exchange Offer, we issued to the Holders approximately $23.6 million in aggregate principal amount of 2011 Notes and paid to the Holders an aggregate of approximately $6.5 million in cash, which includes accrued and unpaid interest on the 2010 Notes accepted in the Exchange Offer through May 25, 2009.
Covenants
As of July 31, 2011, we no longer have debt obligations subject to covenants. As of May 15, 2011, we repaid the entire outstanding principal amount of the Notes and were not subject to any debt obligations.
Commitments and Contingencies
Our major outstanding contractual obligations are related to our rental properties and other operating leases and inventory purchase commitments, and severance payments.
The aggregate outstanding amount of our contractual obligations was $36.2 million as of July 31, 2011. These obligations and commitments represent maximum payments based on current operating forecasts. Certain of the commitments could be reduced if changes to our operating forecasts occur in the future.
33
Table of Contents
We have approximately $9.6 million of non-cancelable inventory commitments with our outsource suppliers as of July 31, 2011. We expect to consume this inventory through normal operating activity.
The following summarizes our contractual obligations at July 31, 2011, and the effect such obligations are expected to have on our liquidity and cash flows in the future periods:
| Payment Due By Period | ||||||||||||||||||||
| Total | 2012 | 2013 – 2014 | 2015 – 2016 | Thereafter | ||||||||||||||||
| (in thousands) | ||||||||||||||||||||
| Contractual Obligations: |
||||||||||||||||||||
| Operating leases |
$ | 26,558 | $ | 5,984 | $ | 10,226 | $ | 8,204 | $ | 2,144 | ||||||||||
| Inventory commitments |
9,613 | 9,613 | — | — | — | |||||||||||||||
| Severance |
6 | 6 | — | — | — | |||||||||||||||
|
|
|
|
|
|
|
|
|
|
|
|||||||||||
| Total Contractual Obligations |
$ | 36,177 | $ | 15,603 | $ | 10,226 | $ | 8,204 | $ | 2,144 | ||||||||||
|
|
|
|
|
|
|
|
|
|
|
|||||||||||
In addition to the contractual obligations above, as of the date of this filing we have additional inventory commitments of approximately $9.7 million related to our consolidation with Jabil Circuit for our outsource manufacturing activities, which is expected to be completed by the end of calendar year 2011. We also expect to expend approximately $6.0 million on capital expenditures in fiscal 2012.
Off-Balance Sheet Arrangements
As of July 31, 2011, we did not have any off-balance sheet arrangements.
Recent Accounting Pronouncements
See Note 2 to the consolidated financial statements included in this Annual Report on Form 10-K regarding the impact of certain recently issued accounting pronouncements on our consolidated financial statements.
| Item 7A. | Quantitative and Qualitative Disclosures About Market Risk |
Financial instruments that potentially subject us to concentrations of credit-risk consist principally of investments in cash equivalents, short-term investments and trade receivables. We place our investments with high-quality financial institutions, limit the amount of credit exposure to any one institution and have established investment guidelines relative to diversification and maturities designed to maintain safety and liquidity.
Our primary exposure to market risks is fluctuations in foreign currency exchange rates.
Foreign Currency Exchange Risk
Operating in international markets involves exposure to movements in currency exchange rates. Currency exchange rate movements typically also reflect economic growth, inflation, interest rates, government actions and other factors. We transact business in various foreign currencies and, accordingly, we are subject to exposure from adverse movements in foreign currency exchange rates. As currency exchange rates fluctuate, translation of the statements of operations of our international businesses into U.S. dollars may affect year-over-year comparability and could cause us to adjust our financing and operating strategies. To date, the effect of changes in foreign currency exchange rates on revenues and operating expenses has not been material. Substantially all of our revenues are invoiced and collected in U.S. dollars. Our trade receivables result primarily from sales to semiconductor manufacturers located in North America, Asia, and Europe. In fiscal 2011, our revenues derived from sales outside the United States constituted 85% of our total revenues. Accounts receivable in currencies other than U.S. dollars compose 1% of the outstanding accounts receivable trade balance at July 31, 2011. Receivables generally are from major corporations or are supported by letters of credit. We maintain reserves for potential credit losses and such losses have been immaterial. Accounts payable in currencies other than U.S. dollars compose 5.8% of the outstanding accounts payable balance at July 31, 2011.
34
Table of Contents
See Note 2 Summary of Significant Accounting Policies—Derivatives of Notes to Consolidated Financial Statements contained in this report for additional information on the foreign exchange rate risk sensitive instruments entered into by the Company for purposes other than trading. The Company does not enter into foreign exchange rate risk sensitive instruments for trading purposes. Based on a hypothetical 10% adverse movement in foreign currency exchange rates, the potential losses in future earnings, fair value of risk-sensitive financial instruments and cash flows are immaterial, although the actual effects may differ materially from the hypothetical analysis.
Interest Rate Risk
As of the date of filing we have no amounts outstanding under any credit facility or debt obligation. We may from time to time have other outstanding short-term and long-term borrowings with variable interest rates. We do not have outstanding any interest rate risk sensitive instruments.
35
Table of Contents
| Item 8. | Financial Statements and Supplementary Data |
CONSOLIDATED BALANCE SHEETS
(In thousands, except share data)
| July 31, | ||||||||
| 2011 | 2010 | |||||||
| ASSETS | ||||||||
| Current assets: |
||||||||
| Cash and cash equivalents |
$ | 123,198 | $ | 74,978 | ||||
| Marketable securities |
39,417 | 18,458 | ||||||
| Accounts receivable—trade, net of allowances of $40 and $108, respectively |
42,646 | 45,622 | ||||||
| Accounts receivable—other |
408 | 1,174 | ||||||
| Inventories |
21,145 | 21,039 | ||||||
| Prepaid expenses and other current assets |
4,368 | 4,585 | ||||||
|
|
|
|
|
|||||
| Total current assets |
231,182 | 165,856 | ||||||
| Property and equipment, net |
20,827 | 26,277 | ||||||
| Intangible assets, net |
6,317 | 12,277 | ||||||
| Goodwill |
43,030 | 43,030 | ||||||
| Other assets (includes restricted cash of $0 and $256, respectively) |
759 | 771 | ||||||
|
|
|
|
|
|||||
| Total assets |
$ | 302,115 | $ | 248,211 | ||||
|
|
|
|
|
|||||
| LIABILITIES AND STOCKHOLDERS’ EQUITY | ||||||||
| Current liabilities: |
||||||||
| Current portion of long-term debt |
$ | — | $ | 826 | ||||
| Accounts payable |
15,232 | 16,639 | ||||||
| Deferred revenues |
5,589 | 8,317 | ||||||
| Other accrued expenses |
24,677 | 29,090 | ||||||
|
|
|
|
|
|||||
| Total current liabilities |
45,498 | 54,872 | ||||||
| Other long-term liabilities |
15,897 | 16,587 | ||||||
| Commitments and contingent liabilities (Note 10) |
||||||||
| Stockholders’ equity: |
||||||||
| Common stock, $0.05 par value: |
||||||||
| 150,000,000 shares authorized; 49,607,223 and 49,051,312 shares issued and outstanding in 2011 and 2010, respectively |
2,480 | 2,453 | ||||||
| Additional paid-in capital |
756,046 | 752,188 | ||||||
| Accumulated other comprehensive income |
41 | 36 | ||||||
| Accumulated deficit |
(517,847 | ) | (577,925 | ) | ||||
|
|
|
|
|
|||||
| Total stockholders’ equity |
240,720 | 176,752 | ||||||
|
|
|
|
|
|||||
| Total liabilities and stockholders’ equity |
$ | 302,115 | $ | 248,211 | ||||
|
|
|
|
|
|||||
The accompanying notes are an integral part of these consolidated financial statements.
36
Table of Contents
CONSOLIDATED STATEMENTS OF OPERATIONS AND COMPREHENSIVE INCOME (LOSS)
(In thousands, except per share data)
| Year ended July 31, | ||||||||||||
| 2011 | 2010 | 2009 | ||||||||||
| Net product sales |
$ | 207,831 | $ | 174,088 | $ | 79,626 | ||||||
| Net service sales |
41,699 | 44,994 | 57,752 | |||||||||
|
|
|
|
|
|
|
|||||||
| Net sales |
249,530 | 219,082 | 137,378 | |||||||||
| Cost of sales |
95,290 | 96,700 | 87,805 | |||||||||
| Inventory-related provision |
— | — | 19,311 | |||||||||
|
|
|
|
|
|
|
|||||||
| Gross profit |
154,240 | 122,382 | 30,262 | |||||||||
| Engineering and product development expenses |
52,697 | 48,943 | 71,165 | |||||||||
| Selling, general and administrative expenses |
48,968 | 44,956 | 51,447 | |||||||||
| Amortization of purchased intangible assets |
5,961 | 10,655 | 15,967 | |||||||||
| Restructuring |
363 | 2,027 | 21,205 | |||||||||
| Impairment charges |
— | — | 5,799 | |||||||||
| Acquired in-process research and development |
— | — | 6,300 | |||||||||
|
|
|
|
|
|
|
|||||||
| Income (loss) from operations |
46,251 | 15,801 | (141,621 | ) | ||||||||
| Other income (expense): |
||||||||||||
| Interest expense |
(309 | ) | (2,745 | ) | (6,077 | ) | ||||||
| Investment income |
349 | 224 | 2,271 | |||||||||
| Gain on liquidation of subsidiary |
— | — | 2,978 | |||||||||
| Gain on extinguishment of debt, net |
— | 3,080 | 2,387 | |||||||||
| Other income, net |
13,472 | 2,131 | 3,493 | |||||||||
|
|
|
|
|
|
|
|||||||
| Income (loss) before income taxes |
59,763 | 18,491 | (136,569 | ) | ||||||||
| Provision for (benefit from) income taxes |
(315 | ) | 343 | 763 | ||||||||
|
|
|
|
|
|
|
|||||||
| Net income (loss) |
$ | 60,078 | $ | 18,148 | $ | (137,332 | ) | |||||
|
|
|
|
|
|
|
|||||||
| Net income (loss) per share: |
||||||||||||
| Basic |
$ | 1.22 | $ | 0.40 | $ | (3.38 | ) | |||||
| Diluted |
$ | 1.19 | $ | 0.39 | $ | (3.38 | ) | |||||
| Weighted-average common shares used in computing net income (loss) per share: |
||||||||||||
| Basic |
49,398 | 45,198 | 40,646 | |||||||||
| Diluted |
50,415 | 46,036 | 40,646 | |||||||||
| Comprehensive income (loss): |
||||||||||||
| Net income (loss) |
$ | 60,078 | $ | 18,148 | $ | (137,332 | ) | |||||
| Unrealized gain (loss) on marketable securities |
5 | (81 | ) | 243 | ||||||||
| Pension liability gain |
— | — | 739 | |||||||||
|
|
|
|
|
|
|
|||||||
| Comprehensive income (loss) |
$ | 60,083 | $ | 18,067 | $ | (136,350 | ) | |||||
|
|
|
|
|
|
|
|||||||
The accompanying notes are an integral part of these consolidated financial statements.
37
Table of Contents
CONSOLIDATED STATEMENTS OF STOCKHOLDERS’ EQUITY
(In thousands, except share data)
| Common Stock | Additional Paid–In Capital |
Accumulated Other Comprehensive Income (Loss) |
Accumulated Deficit |
Total Stockholders’ Equity |
||||||||||||||||||||
| Shares (#) |
Amount ($) |
|||||||||||||||||||||||
| Balance at July 31, 2008 |
20,994,948 | $ | 1,050 | $ | 575,836 | $ | (865 | ) | $ | (458,741 | ) | $ | 117,280 | |||||||||||
| Issuance of stock for Credence transaction |
21,001,427 | 1,050 | 116,673 | — | — | 117,723 | ||||||||||||||||||
| Fair value of options exchanged during Credence transaction |
— | — | 1,508 | — | — | 1,508 | ||||||||||||||||||
| Vesting of stock based awards |
481,049 | 24 | 5,129 | — | — | 5,153 | ||||||||||||||||||
| Issuance of common shares under employees’ stock purchase plan |
73,089 | 4 | 86 | — | — | 90 | ||||||||||||||||||
| Unrealized gain on marketable securities |
— | — | — | 243 | — | 243 | ||||||||||||||||||
| Change in pension liability |
— | — | — | 739 | — | 739 | ||||||||||||||||||
| Net loss |
— | — | — | — | (137,332 | ) | (137,332 | ) | ||||||||||||||||
|
|
|
|
|
|
|
|
|
|
|
|
|
|||||||||||||
| Balance at July 31, 2009 |
42,550,513 | 2,128 | 699,232 | 117 | (596,073 | ) | 105,404 | |||||||||||||||||
| Equity Offering, net of fees |
5,941,667 | 297 | 47,359 | — | — | 47,656 | ||||||||||||||||||
| Vesting of stock based awards |
485,154 | 24 | 3,630 | — | — | 3,654 | ||||||||||||||||||
| Issuance of shares under employees’ stock purchase plan |
73,978 | 4 | 498 | — | — | 502 | ||||||||||||||||||
| Unrealized loss on marketable securities |
— | — | — | (81 | ) | — | (81 | ) | ||||||||||||||||
| Effect of adoption of ASC 470-20 as it relates to Convertible Senior Subordinated Notes |
— | — | 1,469 | — | — | 1,469 | ||||||||||||||||||
| Net Income |
— | — | — | — | 18,148 | 18,148 | ||||||||||||||||||
|
|
|
|
|
|
|
|
|
|
|
|
|
|||||||||||||
| Balance at July 31, 2010 |
49,051,312 | 2,453 | 752,188 | 36 | (577,925 | ) | 176,752 | |||||||||||||||||
| Vesting of stock based awards |
416,804 | 20 | 2,973 | — | — | 2,993 | ||||||||||||||||||
| Stock option exercises |
37,985 | 2 | 211 | — | — | 213 | ||||||||||||||||||
| Issuance of shares under employees’ stock purchase plan |
101,122 | 5 | 674 | — | — | 679 | ||||||||||||||||||
| Unrealized gain on marketable securities |
— | — | — | 5 | — | 5 | ||||||||||||||||||
| Net Income |
— | — | — | — | 60,078 | 60,078 | ||||||||||||||||||
|
|
|
|
|
|
|
|
|
|
|
|
|
|||||||||||||
| Balance at July 31, 2011 |
49,607,223 | $ | 2,480 | $ | 756,046 | $ | 41 | $ | (517,847 | ) | $ | 240,720 | ||||||||||||
|
|
|
|
|
|
|
|
|
|
|
|
|
|||||||||||||
The accompanying notes are an integral part of these consolidated financial statements.
38
Table of Contents
CONSOLIDATED STATEMENTS OF CASH FLOWS
(In thousands)
| Year ended July 31, | ||||||||||||
| 2011 | 2010 | 2009 | ||||||||||
| Cash Flows from Operating Activities: |
||||||||||||
| Net income (loss) |
$ | 60,078 | $ | 18,148 | $ | (137,332 | ) | |||||
| Add (deduct) non-cash items: |
||||||||||||
| Inventory-related provision |
— | — | 19,311 | |||||||||
| Stock-based compensation |
3,905 | 4,220 | 3,925 | |||||||||
| Depreciation and amortization |
17,655 | 24,736 | 34,259 | |||||||||
| Acquired in-process research and development |
— | — | 6,300 | |||||||||
| Gain on liquidation of subsidiary |
— | — | (2,978 | ) | ||||||||
| Gain on extinguishment of debt, net |
— | (3,080 | ) | (2,387 | ) | |||||||
| Loss on disposal of property and equipment |
54 | 1,775 | 5,099 | |||||||||
| Impairment charges |
— | — | 5,799 | |||||||||
| Other non-cash items |
1,910 | 1,711 | 5,418 | |||||||||
| Changes in operating assets and liabilities, net of effect of merger: |
||||||||||||
| Accounts receivable |
3,618 | (21,743 | ) | 41,210 | ||||||||
| Inventories |
(839 | ) | 15,179 | (8,501 | ) | |||||||
| Prepaid expenses |
490 | 6,378 | 7,577 | |||||||||
| Other assets |
(536 | ) | 574 | 4,932 | ||||||||
| Accounts payable |
(1,407 | ) | (1,912 | ) | (3,453 | ) | ||||||
| Accrued expenses |
(5,092 | ) | (8,185 | ) | (29,344 | ) | ||||||
| Deferred revenues |
(2,728 | ) | 944 | (8,203 | ) | |||||||
|
|
|
|
|
|
|
|||||||
| Net cash provided by (used in) operating activities |
77,108 | 38,745 | (58,368 | ) | ||||||||
| Cash Flows from Investing Activities: |
||||||||||||
| Cash received in connection with merger with Credence Systems Corporation, net of fees paid |
— | — | 131,666 | |||||||||
| Purchases of property and equipment |
(6,769 | ) | (3,653 | ) | (8,944 | ) | ||||||
| Purchases of held-to-maturity securities |
(3,995 | ) | (1,097 | ) | — | |||||||
| Purchases of available-for-sale securities |
(49,418 | ) | (42,006 | ) | (6,274 | ) | ||||||
| Proceeds from maturities of held-to-maturity securities |
1,100 | — | — | |||||||||
| Proceeds from sales and maturities of available-for-sale securities |
30,661 | 34,581 | 19,730 | |||||||||
|
|
|
|
|
|
|
|||||||
| Net cash provided by (used in) investing activities |
(28,421 | ) | (12,175 | ) | 136,178 | |||||||
| Cash Flows from Financing Activities: |
||||||||||||
| Proceeds from borrowings from revolving credit facility |
— | 59,961 | 39,400 | |||||||||
| Proceeds from equity offering, net of commissions and fees |
— | 47,656 | — | |||||||||
| Proceeds from employees’ stock purchase plan |
679 | 502 | 131 | |||||||||
| Payments of tax withholdings for vested RSUs, net of proceeds from stock option exercises |
(832 | ) | (1,290 | ) | (167 | ) | ||||||
| Repayments of borrowings from revolving credit facility |
— | (99,361 | ) | — | ||||||||
| Payments of term loan |
— | (12,200 | ) | (5,700 | ) | |||||||
| Payments of convertible senior subordinated notes |
(876 | ) | (33,109 | ) | (76,318 | ) | ||||||
|
|
|
|
|
|
|
|||||||
| Net cash used in financing activities |
(1,029 | ) | (37,841 | ) | (42,654 | ) | ||||||
| Effect of exchange rate changes on cash and cash equivalents |
562 | (239 | ) | 280 | ||||||||
|
|
|
|
|
|
|
|||||||
| Net increase (decrease) in cash and cash equivalents |
48,220 | (11,510 | ) | 35,436 | ||||||||
| Cash and cash equivalents at beginning of year |
74,978 | 86,488 | 51,052 | |||||||||
|
|
|
|
|
|
|
|||||||
| Cash and cash equivalents at end of year |
$ | 123,198 | $ | 74,978 | $ | 86,488 | ||||||
|
|
|
|
|
|
|
|||||||
| Non-cash investing activities: |
||||||||||||
| Effect of merger: |
||||||||||||
| Fair value of tangible assets acquired |
— | — | $ | (129,019 | ) | |||||||
| Fair value of liabilities assumed |
— | — | 220,815 | |||||||||
| Fair value of stock issued |
— | — | 117,723 | |||||||||
| Fair value of stock options and RSUs exchanged |
— | — | 2,863 | |||||||||
| Cost in excess of fair value (goodwill) |
— | — | (29,287 | ) | ||||||||
| Fair value of acquired identifiable intangible assets |
— | — | (38,900 | ) | ||||||||
| In-process research and development |
— | — | (6,300 | ) | ||||||||
| Less acquisition costs paid |
— | — | (6,229 | ) | ||||||||
|
|
|
|
|
|
|
|||||||
| Net cash received in connection with merger with Credence Systems Corporation |
$ | — | $ | — | $ | 131,666 | ||||||
|
|
|
|
|
|
|
|||||||
The accompanying notes are an integral part of these consolidated financial statements.
39
Table of Contents
NOTES TO CONSOLIDATED FINANCIAL STATEMENTS
1. THE COMPANY
LTX-Credence Corporation (“LTX-Credence” or the “Company”) provides focused, cost-optimized automated test equipment (ATE) solutions. The Company designs, manufactures, markets and services ATE solutions that address the broad, divergent test requirements of the wireless, computing, automotive and digital consumer market segments. Semiconductor designers and manufacturers worldwide use its equipment to test their devices during the manufacturing process. After testing, these devices are then incorporated in a wide range of products, including computers, mobile internet equipment such as wireless access points and interfaces, broadband access products such as cable modems and set top boxes, personal communication products such as mobile phones and personal digital music players, consumer products such as televisions, videogame systems, digital cameras and automobile electronics, and for power management in portable and automotive electronics. The Company also sells hardware and software support and maintenance services for its test systems. The Company is headquartered and has a development facility in Norwood, Massachusetts, development facilities in Milpitas, California and Beaverton, Oregon, and worldwide sales and service facilities to support its customer base.
On September 15, 2010, the Company’s Board of Directors approved a one-for-three reverse stock split of the Company’s common stock, pursuant to previously obtained stockholder authorization. The reverse stock split, which became effective at the close of business on September 30, 2010, reduced the number of shares of the Company’s common stock issued and outstanding from approximately 147.2 million to approximately 49.2 million. All share and per share amounts herein are presented on a post-split basis.
2. SUMMARY OF SIGNIFICANT ACCOUNTING POLICIES
Basis of Presentation
The consolidated financial statements include the accounts of the Company and its wholly owned subsidiaries. All significant inter-company transactions and balances have been eliminated in consolidation.
On August 29, 2008, LTX Corporation (“LTX”) and Credence Systems Corporation (“Credence”) completed a merger (“the Merger”). The Company’s results of operations for the year ended July 31, 2009 include Credence’s operating results from August 29, 2008 through July 31, 2009.
Preparation of Financial Statements and Use of Estimates
The accompanying financial statements have been prepared by the Company, and reflect all adjustments, which, in the opinion of management, are necessary for fair presentation. The preparation of financial statements in conformity with generally accepted accounting principles requires management to make estimates and assumptions that affect the reported amounts of assets and liabilities and disclosures of contingent assets and liabilities as of the date of the financial statements and the reported amounts of income and expenses during the reporting periods. Actual results may differ from those estimates and such differences may be material to the consolidated financial statements. Such estimates relate to fair values ascribed to the assets and liabilities acquired in connection with the Credence merger, revenue recognition, the allowance for doubtful accounts, inventory valuation, depreciation, product warranty costs, stock-based compensation and income taxes, among others.
Foreign Currency Remeasurement
The financial statements of the Company’s foreign subsidiaries are remeasured in accordance with Topic 830, Foreign Currency Matters, to the Financial Accounting Standards Board Codification (FASB ASC). The
40
Table of Contents
LTX-CREDENCE CORPORATION
NOTES TO CONSOLIDATED FINANCIAL STATEMENTS (Continued)
Company’s functional currency is the U.S. dollar. Accordingly, the Company’s foreign subsidiaries remeasure monetary assets and liabilities at month-end exchange rates while long-term non-monetary items are remeasured at historical rates. Income and expense accounts are remeasured at the average rates in effect during the month. Net gains or losses resulting from foreign currency remeasurement and transaction gains or losses are included in the consolidated results of operations as a component of other income, net, and were not significant for the years ended July 31, 2011, 2010, or 2009.
Derivatives
The Company conducts business in a number of foreign countries, with certain transactions denominated in local currencies. The purpose of the Company’s foreign currency management is to minimize the effect of exchange rate fluctuations on certain foreign denominated net monetary assets. The Company does not use derivative financial instruments for trading purposes.
During the twelve months ended July 31, 2011, the Company entered into a derivative in the form of a foreign currency forward contract to minimize the effect of exchange rate fluctuations associated with the remeasurement of net monetary assets denominated in foreign currencies. This transaction did not qualify for hedge accounting under Topic 815, Derivatives and Hedging to the FASB ASC. The change in fair value of this derivative is recorded directly in the Company’s statement of operations, and offsets the change in fair value of the net monetary assets denominated in foreign currencies. The Company recorded $0.2 million of expense in Other income, net for the fiscal year ended July 31, 2011. There was no activity recorded for the same periods in 2010.
The notional amount and market amount of the foreign currency forward contract was $4.6 million and $4.8 million, respectively, at July 31, 2011. The following table summarizes the fair value of derivative instruments as of July 31, 2011 and July 31, 2010:
| Derivatives not designated as hedging instruments: |
Balance Sheet Location | July 31, 2011 | July 31, 2010 | |||||||||
| (in thousands) | ||||||||||||
| Foreign exchange contract |
Other accrued expenses | $ | 187 | $ | — | |||||||
|
|
|
|
|
|||||||||
On September 19, 2011, the Company settled the foreign currency contract that was outstanding as of July 31, 2011, and as of the date of this filing is not a party to any other derivative transactions.
Revenue Recognition
The Company recognizes revenue based on guidance provided in Topic 605, Revenue Recognition, to the FASB ASC (“ASC 605”). The Company recognizes revenue when persuasive evidence of an arrangement exists, delivery has occurred or services have been rendered, the seller’s price is fixed or determinable and collectability is reasonably assured.
Revenue related to equipment sales is recognized when: (a) the Company has a written sales agreement; (b) delivery has occurred or service has been rendered; (c) the price is fixed or determinable; (d) collectability is reasonably assured; (e) the product delivered is standard product with historically demonstrated acceptance; and (f) there is no unique customer acceptance provision or payment tied to acceptance or an undelivered element significant to the functionality of the system. Generally, payment terms are time based after product shipment. When sales to a customer involve multiple elements, revenue is recognized on the delivered element provided that (1) the undelivered element is a proven technology, (2) there is a history of acceptance on the product with
41
Table of Contents
LTX-CREDENCE CORPORATION
NOTES TO CONSOLIDATED FINANCIAL STATEMENTS (Continued)
the customer, (3) the undelivered element is not essential to the customer’s application, (4) the delivered item(s) has value to the customer on a stand-alone basis, and (5) if the arrangement included a general right of return relative to the delivered item(s), delivery or performance of the undelivered item(s) is considered probable and substantially in the control of the Company. The arrangement consideration, or the amount of revenue to be recognized on each separate unit of accounting, is allocated at the inception of the arrangement to all deliverables on the basis of their relative selling price based on the provisions of Accounting Standards Update (“ASU”) 2009-13, Multiple-Deliverable Revenue Arrangements (“ASU 2009-13”).
Revenue related to spare parts is recognized on shipment.
Revenue related to maintenance and service contracts is recognized ratably over the duration of the contracts.
In August 2010, the Company adopted the provisions of ASU 2009-13, which is an update to ASC 605. The update establishes a selling price hierarchy for determining the selling price or, if that’s not available, the estimated selling price of a deliverable under a revenue arrangement and is effective for the Company prospectively for revenue arrangements entered into or materially modified beginning on August 1, 2010. Adoption of the update did not have a material impact on the Company’s financial statements for the twelve months ended July 31, 2011.
Trade Accounts Receivable and Allowance for Doubtful Accounts
Trade accounts receivable are recorded at the invoiced amount and do not bear interest, and typically have a contractual maturity of ninety days or less. A majority of the Company’s trade receivables are derived from sales to large multinational semiconductor manufacturers throughout the world. The volatility of the industries that the Company serves can cause certain of its customers to experience shortages of cash, which can impact their ability to make required payments. An allowance for doubtful accounts is maintained for potential credit losses based upon the Company’s assessment of the expected collectability of all accounts receivable. The allowance for doubtful accounts is reviewed periodically to assess the adequacy of the allowances. In any circumstances in which the Company is aware of a customer’s inability to meet its financial obligations, an allowance is provided, which is based on the age of the receivables, the circumstances surrounding the customer’s financial situation, and historical experience. If circumstances change, and the financial condition of customers is adversely affected resulting in their inability to meet their financial obligations to the Company, additional allowances may be recorded.
Engineering and Product Development Costs
The Company expenses all engineering and product development costs as incurred. Expenses subject to capitalization in accordance with the Topic 985, Software, to the FASB ASC, relating to certain software development costs, were insignificant.
Shipping and Handling Costs
Shipping and handling costs are included in cost of sales in the consolidated statements of operations. Shipping and handling costs were $4.1 million, $3.4 million, and $1.8 million for fiscal years ended July 31, 2011, 2010, and 2009, respectively. These costs, when included in the sales price charged for products, are recognized in net sales.
42
Table of Contents
LTX-CREDENCE CORPORATION
NOTES TO CONSOLIDATED FINANCIAL STATEMENTS (Continued)
Income Taxes
The provision for or benefit from income taxes relates principally to refunds received and operating results in foreign entities in jurisdictions primarily in Asia and Europe. The Company recorded an income tax benefit of $0.3 million for the twelve months ended July 31, 2011, primarily due to the receipt of an income tax refund in the United States. For the twelve months ended July 31, 2010, the Company recorded an income tax provision of $0.3 million, primarily due to foreign tax on earnings in foreign jurisdictions.
As of July 31, 2011 and July 31, 2010, the total unrecognized income tax benefits was $9.1 million and $8.6 million, respectively, of which $5.3 million, if recognized, would impact the Company’s income tax rate. The Company recognizes interest and penalties related to uncertain tax positions as a component of income tax expense. As of July 31, 2011 and July 31, 2010, the Company had accrued approximately $1.3 million and $1.1 million, respectively, for potential payment of accrued interest and penalties.
The Company conducts business globally and, as a result, the Company and its subsidiaries or branches file income tax returns in the U.S. federal jurisdiction and various state and foreign jurisdictions. In the normal course of business the Company is subject to examination by taxing authorities throughout the world, including such major jurisdictions as the United States, Singapore, France and Germany. With few exceptions, the Company is no longer subject to U.S. federal, state and local or non-U.S. income tax examinations for years before 1997.
As a result of the merger with Credence on August 29, 2008, a greater than 50% cumulative ownership change in both entities triggered a significant limitation on net operating loss carryforward utilization. The Company’s ability to use acquired net operating loss and credit carryforwards is subject to annual limitation as defined in sections 382 and 383 of the Internal Revenue Code. The Company currently estimates that the annual limitation on its use of net operating losses generated through August 29, 2008 is approximately $10.1 million which, based on currently enacted federal carryforward periods, limits the amount of net operating losses able to be used to approximately $202.0 million. The Company will continue to assess the realizability of these carryforwards in subsequent periods.
Accounting for Stock-Based Compensation
The Company has various stock-based compensation plans, including the 2010 Stock Plan (“2010 Plan”), 2004 Stock Plan (“2004 Plan”), 2001 Stock Plan (“2001 Plan”), 1999 Stock Plan (“1999 Plan”), and 1993 Stock Plan (“1993 Plan”). In addition, the Company assumed the StepTech, Inc. Stock Option Plan (the “STI 2000 Plan”) as part of its acquisition of StepTech, Inc. (“StepTech”) and the Credence 2005 Stock Incentive Plan (the “Credence 2005 Plan”) with its acquisition of Credence. The Company can only grant awards from the 2010 Plan.
During the fiscal year ended July 31, 2011, the Company granted 784,450 Restricted Stock Units to certain executives, directors and employees, with time-based vesting terms ranging from six months to four years. Of these, 330,000 RSUs were granted to executives. As further described in Note 8, the Company also granted RSU awards for the years ended July 31, 2010 and 2009. There were no stock option grants for the years ended July 31, 2011, 2010 or 2009.
The Company recognizes stock-based compensation expense on its equity awards in accordance with the provisions of Topic 718, Compensation – Stock Compensation, to the FASB ASC (“ASC 718”). Under ASC 718, the Company is required to recognize, as expense, the estimated fair value of all share-based payments to employees. In accordance with this standard, the Company has elected to recognize the compensation cost of all service based awards on a straight-line basis over the vesting period of the award.
43
Table of Contents
LTX-CREDENCE CORPORATION
NOTES TO CONSOLIDATED FINANCIAL STATEMENTS (Continued)
For the years ended July 31, 2011, 2010, and 2009, the Company recorded stock-based compensation expense as follows:
| Year ended July 31, | ||||||||||||
| 2011 | 2010 | 2009 | ||||||||||
| (in thousands) | ||||||||||||
| Cost of sales |
$ | 165 | $ | 115 | $ | 174 | ||||||
| Engineering and product development expenses |
891 | 915 | 716 | |||||||||
| Selling, general and administrative expenses |
2,849 | 3,190 | 3,035 | |||||||||
|
|
|
|
|
|
|
|||||||
| Total stock-based compensation expense |
$ | 3,905 | $ | 4,220 | $ | 3,925 | ||||||
|
|
|
|
|
|
|
|||||||
As of July 31, 2011, there was approximately $6.4 million of unrecognized stock-based compensation expense related to share-based payments to employees that is expected to be recognized over the next 3.9 years.
Product Warranty Costs
The Company’s products are sold with warranty provisions that require it to remedy deficiencies in quality or performance of products over a specified period of time at no cost to its customers. The Company offers a one or two year warranty for all of its products, the terms and conditions of which are based on the product sold and the customer. For all testers sold, the Company accrues a liability for the estimated cost of standard warranty at the time of tester shipment and defers the portion of product revenue attributed to the fair value of non-standard warranty, if any are offered. Costs for non-standard warranty are expensed as incurred. Factors that impact the warranty liability include the number of installed testers, historical and anticipated product failure rates, material usage and service labor costs. The Company periodically assesses the adequacy of its recorded liability and adjusts amounts as necessary.
The following table shows the change in the product warranty liability, as required by Topic 460, Guarantees, to the FASB ASC, for the years ended July 31, 2011 and 2010:
| Product Warranty Activity |
2011 | 2010 | ||||||
| (in thousands) | ||||||||
| Balance at beginning of period |
$ | 4,398 | $ | 3,496 | ||||
| Warranty expenditures for current period |
(8,049 | ) | (6,316 | ) | ||||
| Changes in liability related to pre-existing warranties |
(321 | ) | (946 | ) | ||||
| Provision for warranty costs in the period |
6,253 | 8,164 | ||||||
|
|
|
|
|
|||||
| Balance at end of period |
$ | 2,281 | $ | 4,398 | ||||
|
|
|
|
|
|||||
Net Income (loss) per Share
Basic net income (loss) per common share is computed by dividing net income (loss) available to common stockholders by the weighted average number of common shares outstanding for the period. Diluted net income (loss) per common share reflects the maximum dilution that would have resulted from the assumed exercise and share repurchase related to dilutive stock options, restricted stock units and convertible debt, and is computed by dividing net income (loss) by the weighted average number of common shares and the dilutive effect of all securities outstanding.
44
Table of Contents
LTX-CREDENCE CORPORATION
NOTES TO CONSOLIDATED FINANCIAL STATEMENTS (Continued)
Reconciliation between basic and diluted net income (loss) per share is as follows:
| Fiscal Year Ended July 31, | ||||||||||||
| 2011 | 2010 | 2009 | ||||||||||
| (in thousands, except per share data) | ||||||||||||
| Net income (loss) |
$ | 60,078 | $ | 18,148 | $ | (137,332 | ) | |||||
| Basic EPS |
||||||||||||
| Weighted average shares outstanding—basic |
49,398 | 45,198 | 40,646 | |||||||||
| Basic EPS |
$ | 1.22 | $ | 0.40 | $ | (3.38 | ) | |||||
| Diluted EPS |
||||||||||||
| Weighted average shares outstanding—basic |
49,398 | 45,198 | 40,646 | |||||||||
| Plus: impact of stock options and unvested restricted stock units |
1,017 | 838 | — | |||||||||
|
|
|
|
|
|
|
|||||||
| Weighted average shares outstanding—diluted |
50,415 | 46,036 | 40,646 | |||||||||
|
|
|
|
|
|
|
|||||||
| Diluted EPS |
$ | 1.19 | $ | 0.39 | $ | (3.38 | ) | |||||
For the years ended July 31, 2011, 2010 and 2009, options to purchase approximately 1.5 million, 2.1 million, and 2.7 million shares, respectively, of common stock were not included in the calculation of diluted EPS because the effect of including the options would have been anti-dilutive. These options could be dilutive in the future. In accordance with the contingently issuable shares guidance of Topic 260, Earnings Per Share, to the FASB ASC, the calculation of diluted net income (loss) per share excludes impact of the conversion features of the Company’s Convertible Senior Subordinated Notes due 2010 and 2011 as to include them would have been anti-dilutive.
Cash and Cash Equivalents and Marketable Securities
The Company considers all highly liquid investments that are readily convertible to cash and that have original maturity dates of three months or less to be cash equivalents. Cash and cash equivalents consist primarily of operating cash, money market accounts and reverse repurchase agreements. Marketable securities consist primarily of debt securities that are classified as available-for-sale, in accordance with Topic 320, Investments – Debt and Equity Securities, to the FASB ASC. The Company also holds certain investments in commercial paper that it considers to be held to maturity, based on their maturity dates. Securities available for sale include corporate and governmental obligations with various contractual maturity dates some of which are greater than one year. The Company considers the securities to be liquid and convertible to cash within 30 days. The Company has the ability, if necessary and intent to liquidate any security that the Company holds to fund operations over the next twelve months and as such has classified these securities as short-term. Governmental obligations include U.S. Government, State, Municipal and Federal Agency securities. The Company has an overnight sweep investment solution with its bank for certain accounts to allow the Company to enter into diversified overnight investments via a money market mutual fund which generally provides a higher investment yield than a regular operating account. The Company is investing in the Federated Prime Obligations Fund (POIXX), the average daily balance of the overnight sweep for the year ended July 31, 2011 was $2.0 million and dividends are accrued monthly.
45
Table of Contents
LTX-CREDENCE CORPORATION
NOTES TO CONSOLIDATED FINANCIAL STATEMENTS (Continued)
The market value and maturities of the Company’s marketable securities are as follows:
| Total Amount | ||||
| (in thousands) | ||||
| July 31, 2011 |
||||
| Due in less than one year |
$ | 21,351 | ||
| Due in 1 to 3 years |
18,066 | |||
|
|
|
|||
| Total Marketable securities |
$ | 39,417 | ||
|
|
|
|||
| Total Amount | ||||
| (in thousands) | ||||
| July 31, 2010 |
||||
| Due in less than one year |
$ | 16,002 | ||
| Due in 1 to 3 years |
2,456 | |||
|
|
|
|||
| Total Marketable securities |
$ | 18,458 | ||
|
|
|
|||
The market value and amortized cost of marketable securities are as follows:
| Market Value |
Amortized Cost |
|||||||
| (in thousands) | ||||||||
| July 31, 2011 |
||||||||
| Corporate (a) |
$ | 28,262 | $ | 27,951 | ||||
| Government |
11,155 | 11,099 | ||||||
|
|
|
|
|
|||||
| Total |
$ | 39,417 | $ | 39,050 | ||||
|
|
|
|
|
|||||
| July 31, 2010 |
||||||||
| Corporate (a) |
$ | 8,183 | $ | 8,073 | ||||
| Government |
10,275 | 10,224 | ||||||
|
|
|
|
|
|||||
| Total |
$ | 18,458 | $ | 18,297 | ||||
|
|
|
|
|
|||||
| (a) | Included in the above figures is $3,998 and $1,098 of market value and amortized cost related to the Company’s held to maturity investments as of July 31, 2011 and 2010, respectively. |
Gross unrealized gains were $0.1 million as of July 31, 2011 and 2010. Realized gains, losses and interest income are included in investment income in the Statements of Operations. Unrealized gains and losses are reflected as a separate component of comprehensive income (loss) within Stockholders’ Equity. The Company analyzes its securities portfolio for other than temporary impairment on a quarterly basis or upon occurrence of a significant change in circumstances. There were no other than temporary impairment losses recorded in the twelve months ended July 31, 2011, 2010, or 2009.
46
Table of Contents
LTX-CREDENCE CORPORATION
NOTES TO CONSOLIDATED FINANCIAL STATEMENTS (Continued)
The following table summarizes marketable securities and related unrealized gains and losses as of July 31, 2011 and 2010 (in thousands):
| July 31, 2011 |
Market Value |
Unrealized Gain/(Loss) |
||||||
| Securities < 12 months unrealized losses |
$ | 6,638 | $ | (3 | ) | |||
| Securities > 12 months unrealized losses |
4,994 | (4 | ) | |||||
| Securities < 12 months unrealized gains |
14,713 | 13 | ||||||
| Securities > 12 months unrealized gains |
13,072 | 35 | ||||||
|
|
|
|
|
|||||
| Total |
$ | 39,417 | $ | 41 | ||||
|
|
|
|
|
|||||
| July 31, 2010 |
Market Value |
Unrealized Gain/(Loss) |
||||||
| Securities < 12 months unrealized losses |
$ | 3,314 | $ | (3 | ) | |||
| Securities < 12 months unrealized gains |
12,688 | 19 | ||||||
| Securities > 12 months unrealized gains |
2,456 | 20 | ||||||
|
|
|
|
|
|||||
| Total |
$ | 18,458 | $ | 36 | ||||
|
|
|
|
|
|||||
Interest income and realized gains and losses from sales of marketable securities; included in investment income in the Statement of Operations, are as follows:
| Year Ended July 31, | ||||||||||||
| 2011 | 2010 | 2009 | ||||||||||
| (in thousands) | ||||||||||||
| Interest income on marketable securities |
$ | 895 | $ | 180 | $ | 822 | ||||||
| Realized gain (loss) from sales of available-for-sale securities |
(12 | ) | (22 | ) | 39 | |||||||
|
|
|
|
|
|
|
|||||||
| Total |
$ | 883 | $ | 158 | $ | 861 | ||||||
|
|
|
|
|
|
|
|||||||
Fair Value of Financial Instruments
The Company determines its fair value measurements for assets and liabilities based upon the provisions of Topic 820, Fair Value Measurements and Disclosures, to FASB ASC.
Topic 825 to the FASB ASC, Financial Instruments, requires that disclosure be made of estimates of the fair value of financial instruments. The carrying amounts of certain of the Company’s financial instruments, including cash equivalents, accounts receivable, accounts payable and other accrued liabilities approximate fair value due to their short maturities. Marketable securities classified as available-for-sale are all debt securities and are recorded at fair value based upon quoted market prices.
The fair value of the Company’s debt is estimated based on quoted market prices for similar issues or on current rates offered to the Company for debt of the same remaining maturities.
Concentration of Credit Risk
Revenue from the Company’s top ten customers accounted for 80%, 77%, and 69% of total revenues in fiscal 2011, 2010, and 2009, respectively. Accounts receivable from these customers amounted to approximately $35.3, $36.3 million, and $18.9 million at July 31, 2011, 2010 and 2009, respectively. Sales to customers outside
47
Table of Contents
LTX-CREDENCE CORPORATION
NOTES TO CONSOLIDATED FINANCIAL STATEMENTS (Continued)
the United States were $212.3 million, or 85% of net sales in fiscal 2011, $167.0 million, or 76% of net sales in fiscal 2010, $88.4 million, or 64% of net sales, in fiscal 2009.
Financial instruments, which potentially subject the Company to concentrations of credit risk, are cash equivalents, marketable securities and accounts receivable. All of the Company’s cash equivalents and marketable securities are maintained by major financial institutions. The Company periodically reviews these investments to evaluate and minimize credit risk. Concentration of credit risk with respect to accounts receivable is limited to certain customers to whom the Company makes substantial sales. To reduce risk, the Company routinely assesses the financial strength of its customers. The Company does not require collateral, although the Company does obtain letters of credit on sales to certain foreign customers. Write-offs related to accounts receivable during the period ended July 31, 2011 and July 31, 2010 were immaterial.
Inventories
Inventories are stated at the lower of cost or market, determined on the first-in, first-out (“FIFO”) method, and includes materials, labor and manufacturing overhead. The components of inventories are as follows:
| As of July 31, | ||||||||
| 2011 | 2010 | |||||||
| (in thousands) | ||||||||
| Material and purchased components |
$ | 11,313 | $ | 10,232 | ||||
| Work-in-process |
2,080 | 4,084 | ||||||
| Finished testers, including inventory consigned to customers |
7,752 | 6,723 | ||||||
|
|
|
|
|
|||||
| Total inventories |
$ | 21,145 | $ | 21,039 | ||||
|
|
|
|
|
|||||
The Company establishes inventory reserves when conditions exist that indicate inventory may be in excess of anticipated demand or is obsolete based upon assumptions about future demand for the Company’s products or market conditions. The Company regularly evaluates the ability to realize the value of inventory based on a combination of factors including the following: forecasted sales or usage, estimated product end of life dates, estimated current and future market value and new product introductions. Purchasing and usage alternatives are also explored to mitigate inventory exposure. When recorded, reserves are intended to reduce the carrying value of inventory to its net realizable value.
As of July 31, 2011 and July 31, 2010, inventory is stated net of inventory reserves of $43.0 million and $45.6 million, respectively. If actual demand for products deteriorates or market conditions are less favorable than projected, additional inventory reserves may be required. Such reserves are not reversed until the related inventory is sold or otherwise disposed. For the year ended July 31, 2011, the Company recorded $20.4 million in sales of previously reserved inventory. The Company released reserves of $4.1 million related to these sales for the year ended July 31, 2011. For the year ended July 31, 2010, the Company recorded $1.9 million in sales of previously reserved inventory. The Company released reserves of $0.8 million related to these sales for the year ended July 31, 2010. The significant increase year over year for sales of previously reserved inventory was primarily driven by higher than expected demand for the Sapphire product, which was discontinued as part the Company’s product roadmap decision in fiscal year 2008.
Property and Equipment
Property and equipment acquired is recorded at cost. Property and equipment acquired in connection with the Credence merger was recorded at fair value. The Company provides for depreciation and amortization using
48
Table of Contents
LTX-CREDENCE CORPORATION
NOTES TO CONSOLIDATED FINANCIAL STATEMENTS (Continued)
the straight-line method. Charges are made to operating expenses in amounts that are sufficient to amortize the cost of the assets over their estimated useful lives. Equipment spares used for service and internally manufactured test systems used for testing components and engineering projects are recorded at cost and depreciated over three to seven years. Repair and maintenance costs that do not extend the lives of property and equipment are expensed as incurred. Property and equipment are summarized as follows:
| As of July 31, | Estimated Useful Lives | |||||||||
| 2011 | 2010 | |||||||||
| (in thousands) | (in years) | |||||||||
| Equipment spares |
$ | 65,078 | $ | 64,964 | 5 or 7 | |||||
| Machinery, equipment and internally manufactured systems |
41,476 | 37,442 | 3-7 | |||||||
| Office furniture and equipment |
4,892 | 5,370 | 3-7 | |||||||
| Purchased software |
2,805 | 1,039 | 3 | |||||||
| Land |
2,524 | 2,524 | — | |||||||
| Leasehold improvements |
6,134 | 6,418 | Term of lease or useful life, not to | |||||||
|
|
|
|
|
|||||||
| Property and equipment, gross |
122,909 | 117,757 | ||||||||
| Accumulated depreciation and amortization |
(102,082 | ) | (91,480 | ) | ||||||
|
|
|
|
|
|||||||
| Property and equipment, net |
$ | 20,827 | $ | 26,277 | ||||||
|
|
|
|
|
|||||||
During the year ended July 31, 2010, the Company recorded an adjustment for $1.0 million to reduce the net book value of machinery and equipment to reflect the proper carrying value. The charge was recorded in selling, general, and administrative expense and the effect of the adjustment was immaterial to all periods presented.
Depreciation expense was $11.6 million, $14.0 million, and $18.3 million for the years ended July 31, 2011, 2010, and 2009, respectively.
Impairment of Long-Lived Assets Other Than Goodwill
On an on-going basis, management reviews the value and period of amortization or depreciation of long-lived assets. In accordance with Topic 360, Property, Plant and Equipment, to the FASB ASC, the Company reviews whether impairment losses exist on long-lived assets other than goodwill when indicators of impairment are present. During this review, the Company reevaluates the significant assumptions used in determining the original cost of long-lived assets other than goodwill. Although the assumptions may vary, they generally include revenue growth, operating results, cash flows and other indicators of value. Management then determines whether there has been a permanent impairment of the value of long-lived assets based upon events or circumstances that have occurred since acquisition. The extent of the impairment amount recognized is based upon a determination of the impaired asset’s fair value. During the year ended July 31, 2011 there were no indicators that required the Company to conduct a recoverability test at that date and, therefore, the Company did not recognize an impairment loss during the year ended July 31, 2011.
Goodwill and Other Intangibles
In accordance with Topic 350, Intangibles – Goodwill and Other, to the FASB ASC (“ASC 350”), the Company is required to review goodwill by reporting unit for impairment at least annually or more often if there are indicators of impairment present. The Company has determined its entire business represents one reporting unit. Historically, the Company has performed its annual impairment analysis during the fourth quarter of each
49
Table of Contents
LTX-CREDENCE CORPORATION
NOTES TO CONSOLIDATED FINANCIAL STATEMENTS (Continued)
year. The provisions of ASC 350 require that a two-step impairment test be performed for goodwill. In the first step, the Company compares the fair value of each reporting unit to which goodwill has been allocated to its carrying value. If the fair value of the reporting unit exceeds the carrying value of the net assets assigned to that reporting unit, goodwill is considered not impaired and the Company is not required to perform further testing. If the carrying value of the net assets assigned to the reporting unit exceeds the fair value of the reporting unit, then the Company must perform the second step of the impairment test in order to determine the implied fair value of the reporting unit’s goodwill. If the carrying value of a reporting unit’s goodwill exceeds its implied fair value, then the Company would record an impairment loss equal to the difference. As of July 31, 2011 the fair value of the Company’s reporting unit exceeded the carrying value of the reporting unit’s net assets and therefore no impairment exists as of that date.
Determining the fair value of a reporting unit, if applicable, requires the Company to make judgments and involves the use of significant estimates and assumptions. These estimates and assumptions include revenue growth rates and operating margins used to calculate projected future cash flows, risk-adjusted discount rates, future economic and market conditions and determination of appropriate market comparables. The Company bases its fair value estimates on assumptions it believes to be reasonable but that are unpredictable and inherently uncertain. Actual future results may differ from those estimates.
The Company’s Goodwill consists of the following:
| Goodwill |
July 31, 2011 |
July 31, 2010 |
||||||
| (in thousands) | ||||||||
| Attributed to the acquisition of: |
||||||||
| Credence (August 29, 2008) |
$ | 28,662 | $ | 28,662 | ||||
| Step Tech (June 10, 2003) |
14,368 | 14,368 | ||||||
|
|
|
|
|
|||||
| Total goodwill |
$ | 43,030 | $ | 43,030 | ||||
|
|
|
|
|
|||||
Intangible assets, all of which relate to the Credence merger, consist of the following:
| As of July 31, 2011 | ||||||||||||||||
| Description |
Estimated Useful Life (in years) |
Gross Carrying Amount (in thousands) |
Accumulated Amortization (in thousands) |
Net Amount (in thousands) |
||||||||||||
| Trade names |
1.0 | $ | 300 | $ | 300 | $ | — | |||||||||
| Distributor relationships |
2.0 | 2,800 | 2,800 | — | ||||||||||||
| Key customer relationships |
3.0 | 8,500 | 8,500 | — | ||||||||||||
| Developed technology—ASL |
6.0 | 16,000 | 12,945 | 3,055 | ||||||||||||
| Developed technology—Diamond |
9.0 | 9,400 | 7,495 | 1,905 | ||||||||||||
| Maintenance agreements |
7.0 | 1,900 | 543 | 1,357 | ||||||||||||
|
|
|
|
|
|
|
|||||||||||
| Total intangible assets |
$ | 38,900 | $ | 32,583 | $ | 6,317 | ||||||||||
|
|
|
|
|
|
|
|||||||||||
50
Table of Contents
LTX-CREDENCE CORPORATION
NOTES TO CONSOLIDATED FINANCIAL STATEMENTS (Continued)
| As of July 31, 2010 | ||||||||||||||||
| Description |
Estimated Useful Life (in years) |
Gross Carrying Amount (in thousands) |
Accumulated Amortization (in thousands) |
Net Amount (in thousands) |
||||||||||||
| Trade names |
1.0 | $ | 300 | $ | 300 | $ | — | |||||||||
| Distributor relationships |
2.0 | 2,800 | 2,800 | — | ||||||||||||
| Key customer relationships |
3.0 | 8,500 | 7,502 | 998 | ||||||||||||
| Developed technology—ASL |
6.0 | 16,000 | 9,773 | 6,227 | ||||||||||||
| Developed technology—Diamond |
9.0 | 9,400 | 5,977 | 3,423 | ||||||||||||
| Maintenance agreements |
7.0 | 1,900 | 271 | 1,629 | ||||||||||||
|
|
|
|
|
|
|
|||||||||||
| Total intangible assets |
$ | 38,900 | $ | 26,623 | $ | 12,277 | ||||||||||
|
|
|
|
|
|
|
|||||||||||
Intangible assets are amortized based upon the pattern of estimated economic use, over their estimated useful lives. The weighted average estimated remaining useful life over which these intangible assets will be amortized is 2.9 years.
The Company expects amortization for these intangible assets to be:
| Year ending July 31, |
Amount (in thousands) |
|||
| 2012 |
3,163 | |||
| 2013 |
1,583 | |||
| 2014 |
769 | |||
| 2015 |
396 | |||
| 2016 |
321 | |||
| Thereafter |
85 | |||
|
|
|
|||
| Total |
$ | 6,317 | ||
|
|
|
|||
Recent Accounting Pronouncements
In May 2011, the FASB issued ASU No. 2011-04, Fair Value Measurement. This ASU clarifies the concepts related to highest and best use and valuation premise, blockage factors and other premiums and discounts, the fair value measurement of financial instruments held in a portfolio and of those instruments classified as a component of shareholders’ equity. The guidance includes enhanced disclosure requirements about recurring Level 3 fair value measurements, the use of nonfinancial assets, and the level in the fair value hierarchy of assets and liabilities not recorded at fair value. The provisions of this ASU are effective prospectively for interim and annual periods beginning on or after December 15, 2011. Early application is prohibited. This ASU requires changes in presentation only and the Company is currently assessing if it will have a material impact on its consolidated financial statements.
In June 2011, the FASB issued ASU No. 2011-05, Comprehensive Income. This ASU intends to enhance comparability and transparency of other comprehensive income components. The guidance provides an option to present total comprehensive income, the components of net income and the components of other comprehensive income in a single continuous statement or two separate but consecutive statements. This ASU eliminates the option to present other comprehensive income components as part of the statement of changes in shareholders’ equity. The provisions of this ASU will be applied retrospectively for interim and annual periods beginning after December 15, 2011. Early application is permitted. This ASU requires changes in presentation only and the Company is currently assessing if it will have a material impact on its consolidated financial statements.
51
Table of Contents
LTX-CREDENCE CORPORATION
NOTES TO CONSOLIDATED FINANCIAL STATEMENTS (Continued)
In September 2011, the FASB issued ASU No. 2011-08, Testing Goodwill for Impairment. This revised standard is intended to reduce the cost and complexity of the annual goodwill impairment test by providing entities an option to perform a “qualitative” assessment to determine whether further impairment testing is necessary. The revised standard is effective for annual and interim goodwill impairment tests performed for fiscal years beginning after December 15, 2011. The Company is currently evaluating the impact of adoption of this revised standard.
3. BUSINESS COMBINATION
Merger with Credence Systems Corporation
On August 29, 2008, the Company and Credence completed the Merger contemplated by the Merger Agreement, pursuant to which Credence became a wholly-owned subsidiary of the Company and the Company changed its name to “LTX-Credence Corporation”. Pursuant to the Merger Agreement, each share of Credence common stock outstanding immediately prior to the effective time of the Merger (the “Effective Time”) was converted into the right to receive 0.2043 shares of the Company’s common stock. As a result of this conversion, an aggregate of 21.0 million shares of the Company’s common stock were issued to former stockholders of Credence and, immediately after the Effective Time, the former stockholders of Credence held 50.02% of the outstanding shares of the Company’s common stock and the continuing Company stockholders held 49.98% of the outstanding shares of the Company’s common stock. In addition, at the Effective Time, all outstanding options and other equity-based awards to acquire shares of Credence common stock were converted into options and other equity-based awards to acquire shares of the Company’s common stock, as adjusted to reflect the exchange ratio of the Merger.
In accordance with Topic 805, Business Combinations, to the FASB ASC (“ASC 805”) and based on the terms of the merger, LTX was the accounting acquirer. This conclusion was based on the facts that LTX board members and senior management control and represent a majority of the board of directors and senior management of the combined company, as well as the terms of the merger consideration, pursuant to which the Credence stockholders received a premium over the fair market value of their shares on the merger completion date. There were no preexisting relationships between the two companies.
The aggregate purchase price of approximately $129.3 million included 21.0 million shares of LTX common stock at an estimated fair value of $117.7 million; approximately 1.3 million of fully vested stock options granted to Credence employees in exchange for their vested Credence stock options, with an estimated fair value of approximately $1.5 million; and approximately $10.1 million of direct acquisition costs. There were no potential contingent consideration arrangements payable to the former Credence shareholders in connection with this transaction.
The Company has measured the fair value of the 21.0 million shares of the Company common stock issued as consideration in connection with the merger under ASC 805 (specifically EITF Issue No. 99-12, Determination of the Measurement Date for the Market Price of Acquirer Securities Issued in a Purchase Business Combination). The Company determined the measurement date to be August 29, 2008, the date the transaction was completed, as the number of shares to be issued according to the exchange ratio was fixed without subsequent revision on that date. The Company valued the securities based on the average market price two days before and after the measurement date. The average stock price was determined to be approximately $5.61.
52
Table of Contents
LTX-CREDENCE CORPORATION
NOTES TO CONSOLIDATED FINANCIAL STATEMENTS (Continued)
The following is a summary of the purchase price for Credence:
| (in thousands, except exchange ratio and price per share) |
||||||||
| Number of Credence shares acquired |
102,824 | |||||||
| Multiplied by the exchange ratio |
0.2043 | |||||||
|
|
|
|||||||
| Number of shares of LTX common stock issued to the holders of Credence common stock |
21,007 | |||||||
| Multiplied by the price per share of LTX common stock |
$ | 5.61 | $ | 117,723 | ||||
|
|
|
|||||||
| Fair value of outstanding Credence stock options and restricted stock exchanged for LTX stock options and restricted stock (options calculated using the Company’s option pricing model) |
1,508 | |||||||
| Transaction costs |
6,229 | |||||||
| Other consideration |
3,859 | |||||||
|
|
|
|||||||
| Purchase price |
$ | 129,319 | ||||||
|
|
|
|||||||
The above purchase price has been allocated based on the fair value of net assets acquired as follows:
Allocation of purchase consideration
| (in thousands) | ||||
| Cash and cash equivalents, net of acquisition costs |
$ | 131,666 | ||
| Working capital as of August 29, 2008, net of cash and cash equivalents acquired |
5,840 | |||
| Identifiable intangible assets |
38,900 | |||
| Goodwill |
29,113 | |||
| In-process research and development |
6,300 | |||
| Property and equipment |
28,501 | |||
| Other long-term assets |
20,732 | |||
| Convertible Senior Subordinated Notes due 2010 |
(114,896 | ) | ||
| Other long-term liabilities |
(16,837 | ) | ||
|
|
|
|||
| Purchase price |
$ | 129,319 | ||
|
|
|
|||
Valuation of Intangible Assets and Goodwill
The purchase price for the merger with Credence was allocated to assets acquired and liabilities assumed based on their estimated fair values. The Company then allocated the purchase price in excess of net tangible assets acquired to identifiable intangible assets, including in-process research and development, based upon a detailed valuation that uses information and assumptions provided by management, as further described below. Any excess purchase price over the fair value of the net tangible and intangible assets acquired was allocated to goodwill.
Identifiable Intangible Assets
Credence’s identifiable intangible assets, which were acquired in the merger and are now the property of LTX-Credence, include existing technology, customer and distributor relationships and trade names. Developed technology relates to patents, patent applications and know-how with respect to the technologies embedded in its currently marketed products.
53
Table of Contents
LTX-CREDENCE CORPORATION
NOTES TO CONSOLIDATED FINANCIAL STATEMENTS (Continued)
The Company primarily used the income approach to value the existing technology and other intangibles assets. This approach calculates fair value by estimating future cash flows attributable to each intangible asset and discounting them to present value at a risk-adjusted discount rate.
In estimating the useful life of the acquired intangible assets, the Company considered paragraph 11 of ASC 350, which lists the pertinent factors to be considered when estimating the useful life of an intangible asset. These factors included a review of the expected use by the combined company of the assets acquired, the expected useful life of another asset (or group of assets) related to the acquired assets, legal, regulatory or other contractual provisions that may limit the useful life of an acquired asset or may enable the extension of the useful life of an acquired asset without substantial cost, the effects of obsolescence, demand, competition and other economic factors, and the level of maintenance expenditures required to obtain the expected future cash flows from the asset. The Company is amortizing these intangible assets over their estimated useful lives using a method that is based on estimated future cash flows as the Company believes this approximates the pattern in which the economic benefits of the assets will be derived.
Acquired In-Process Research and Development
As part of the purchase price allocation for Credence, approximately $6.3 million of the purchase price was allocated to acquired in-process research and development projects primarily related to Credence’s ASL and Diamond tester product lines. The amount allocated to acquired in-process research and development represented the estimated value based on risk-adjusted cash flows related to in-process projects that had not yet reached technological feasibility and had no alternative future uses as of the date of the acquisition. The primary basis for determining the technological feasibility of these projects was a detailed review of the development status of each project including factors such as costs incurred/remaining, technological risks achieved/remaining, and incompleteness.
The fair value assigned to acquired in-process research and development was determined by estimating the costs to develop the acquired technology into commercially viable products, estimating the resulting net cash flows from the projects, and discounting the net cash flows to their present value. The revenue projection used to value the acquired in-process research and development was based on estimates of relevant market sizes and growth factors, expected trends in technology, and the nature and expected timing of new product introductions by the Company and its competitors. The resulting net cash flows from such projects were based on the Company’s estimates of cost of sales, operating expenses, and income taxes from such projects. The rates utilized to discount the net cash flows to their present value were based on estimated cost of capital calculations and the implied rate of return from the transaction model plus a risk premium. Due to the nature of the forecasts and the risks associated with the developmental projects, appropriate risk-adjusted discount rates were used for the in-process research and development projects. The discount rates are based on the stage of completion and uncertainties surrounding the successful development of the purchased in-process research and development.
In accordance with ASC 805, the Company recorded a charge upon the consummation of the merger on August 29, 2008, for the full amount of the acquired in-process research and development.
54
Table of Contents
LTX-CREDENCE CORPORATION
NOTES TO CONSOLIDATED FINANCIAL STATEMENTS (Continued)
4. OTHER ACCRUED EXPENSES
Other accrued expenses consisted of the following at July 31, 2011 and July 31, 2010:
| (in thousands) | ||||||||
| 2011 | 2010 | |||||||
| Accrued compensation |
$ | 10,340 | $ | 10,450 | ||||
| Accrued vendor liability |
2,442 | 3,398 | ||||||
| Warranty reserve |
2,281 | 4,398 | ||||||
| Accrued restructuring |
1,350 | 1,490 | ||||||
| Accrued income and local taxes |
1,274 | 1,289 | ||||||
| Accrued professional fees |
964 | 965 | ||||||
| Other accrued expenses |
6,026 | 7,100 | ||||||
|
|
|
|
|
|||||
| Total accrued expenses |
$ | 24,677 | $ | 29,090 | ||||
|
|
|
|
|
|||||
5. LONG TERM DEBT
Loan Agreements with Silicon Valley Bank (“SVB”)
On February 25, 2009, the Company entered into a modification of its Loan Agreement with SVB to provide for a two-year secured revolving line of credit (the “First Loan Modification Agreement”) that expired in February 2011. The First Loan Modification Agreement allowed for cash borrowings, letters of credit and cash management facilities under a secured revolving credit facility of $40.0 million. The Company has not renewed the secured revolving line of credit.
Convertible Senior Subordinated Notes Due 2011 (“Notes”)
The following table reflects the carrying value of the Company’s Convertible Senior Subordinated Notes due May 2011 as of July 31, 2011 and 2010:
| July 31, 2011 |
July 31, 2010 |
|||||||
| Convertible Senior Subordinated Notes due 2011 |
$ | — | $ | 876 | ||||
| Less: Unamortized debt discount |
— | (50 | ) | |||||
|
|
|
|
|
|||||
| Net carrying value—Convertible Senior Subordinated Notes due 2011 |
$ | — | $ | 826 | ||||
|
|
|
|
|
|||||
In May 2010, the Company repaid the remaining $1.5 million of our 3.5% Convertible Senior Subordinated Notes due May 2010 (the “2010 Notes”) on their maturity date.
In the year ended July 31, 2010, the Company repurchased $33.1 million of 3.5% Convertible Senior Subordinated Notes due May 2011 (the “2011 Notes” and together with the 2010 Notes, the “Notes”) at a discount to their par value for net cash consideration of $31.6 million. The Company accounted for the repurchase of the notes as an extinguishment of debt in accordance with FASB ASC Topic 860, Transfers and Servicing and recorded a net gain on extinguishment of debt of $0.9 million in the twelve months ended July 31, 2010.
At maturity of the 2011 Notes, on May 15, 2011, the Company repaid the outstanding principal of the Notes, together with accrued and unpaid interest thereon, and a maturity premium equal to 7.5% of such principal.
As a result, as of July 31, 2011, the Company has no Notes outstanding.
55
Table of Contents
LTX-CREDENCE CORPORATION
NOTES TO CONSOLIDATED FINANCIAL STATEMENTS (Continued)
On May 26, 2009, we settled our offer to exchange (the “Exchange Offer”) any and all of our 2010 Notes for our 2011 Notes and certain cash consideration, all upon the terms and subject to the conditions described in our Offering Circular, dated April 22, 2009 and the related Letter of Transmittal. At settlement of the Exchange Offer, in exchange for the 2010 Notes accepted in the Exchange Offer, we issued to the Holders approximately $23.6 million in aggregate principal amount of New Notes and paid to the Holders an aggregate of approximately $6.5 million in cash, which includes accrued and unpaid interest on the 2010 Notes accepted in the Exchange Offer through May 25, 2009.
Covenants
As of July 31, 2011, the Company no longer has debt obligations subject to covenants. As of May 15, 2011, the Company repaid the entire outstanding principal amount of the Notes and was not subject to any debt obligations.
6. INCOME TAXES
The components of income (loss) before income taxes and the provision (benefit) for income taxes consist of the following (in thousands):
| Fiscal Year Ended July 31, | ||||||||||||
| 2011 | 2010 | 2009 | ||||||||||
| Income (loss) before income taxes |
||||||||||||
| U.S. |
$ | 73,666 | $ | 20,641 | $ | (138,915 | ) | |||||
| Foreign |
(13,903 | ) | (2,150 | ) | 2,346 | |||||||
|
|
|
|
|
|
|
|||||||
| Income (loss) before income taxes |
$ | 59,763 | $ | 18,491 | $ | (136,569 | ) | |||||
|
|
|
|
|
|
|
|||||||
| Provision (benefit) for income taxes: |
||||||||||||
| Current: |
||||||||||||
| Federal |
$ | (405 | ) | $ | (302 | ) | $ | — | ||||
| State |
(17 | ) | — | 124 | ||||||||
| Foreign |
107 | 649 | 637 | |||||||||
|
|
|
|
|
|
|
|||||||
| Total Current |
$ | (315 | ) | $ | 347 | $ | 761 | |||||
|
|
|
|
|
|
|
|||||||
| Deferred |
||||||||||||
| Foreign |
— | (4 | ) | 2 | ||||||||
|
|
|
|
|
|
|
|||||||
| Total Deferred |
(4 | ) | 2 | |||||||||
|
|
|
|
|
|
|
|||||||
| Total provision (benefit) for income taxes |
$ | (315 | ) | $ | 343 | $ | 763 | |||||
|
|
|
|
|
|
|
|||||||
Reconciliation of the U.S. federal statutory rate to the Company’s effective tax rate is as follows:
| Fiscal Year Ended July 31, | ||||||||||||
| 2011 | 2010 | 2009 | ||||||||||
| U.S. Federal statutory rate |
35.00 | % | 35.00 | % | 35.00 | % | ||||||
| Change in valuation allowance/utilization of net operating loss carryforwards |
(34.68 | ) | (32.60 | ) | (34.10 | ) | ||||||
| Tax credits |
(0.67 | ) | (1.60 | ) | — | |||||||
| Change in Uncertain Tax Positions |
0.09 | 0.30 | (0.10 | ) | ||||||||
| Acquisition related |
— | — | (1.50 | ) | ||||||||
| Other |
(0.26 | ) | 0.70 | 0.10 | ||||||||
|
|
|
|
|
|
|
|||||||
| Effective tax rate |
(0.52 | )% | 1.80 | % | (0.60 | )% | ||||||
|
|
|
|
|
|
|
|||||||
56
Table of Contents
LTX-CREDENCE CORPORATION
NOTES TO CONSOLIDATED FINANCIAL STATEMENTS (Continued)
The temporary differences and carryforwards that created the deferred tax assets and liabilities as of July 31, 2011, and 2010 are as follows:
| As of July 31, | ||||||||
| 2011 | 2010 | |||||||
| (in thousands) | ||||||||
| Deferred tax assets: |
||||||||
| Net operating loss carryforwards |
$ | 132,387 | $ | 133,894 | ||||
| Capital loss carryforwards |
759 | 1,029 | ||||||
| Tax credits |
24,660 | 30,987 | ||||||
| Inventory valuation reserves |
23,729 | 27,986 | ||||||
| Deferred revenue |
289 | 2,584 | ||||||
| Fixed assets and spares |
639 | 15,272 | ||||||
| Other |
14,119 | 14,515 | ||||||
|
|
|
|
|
|||||
| Total deferred tax assets |
196,582 | 226,267 | ||||||
| Valuation allowance |
(194,464 | ) | (223,428 | ) | ||||
|
|
|
|
|
|||||
| Net deferred tax assets |
$ | 2,118 | $ | 2,839 | ||||
|
|
|
|
|
|||||
| Deferred tax liabilities: |
||||||||
| Intangibles |
$ | (847 | ) | $ | (2,585 | ) | ||
| Prepaid expenses |
(32 | ) | (237 | ) | ||||
| Other |
(1,239 | ) | (19 | ) | ||||
|
|
|
|
|
|||||
| Total deferred tax liabilities |
(2,118 | ) | (2,841 | ) | ||||
|
|
|
|
|
|||||
| Net deferred tax assets (liabilities) |
$ | — | $ | (2 | ) | |||
|
|
|
|
|
|||||
Cumulative unremitted foreign earnings that are considered to be indefinitely reinvested outside of the U.S. and on which no U.S. taxes have been provided are approximately $1.9 million and $1.4 million as of July 31, 2011 and 2010. Due to net operating loss and credit carryforwards, the residual U.S. tax liability, if such amounts were remitted, would be minimal.
Compliance with ASC 740-10-30 requires the Company to periodically evaluate the necessity of establishing or increasing a valuation allowance for deferred tax assets depending on whether it is more likely than not that a related benefit will be realized in future periods. Because of the cumulative net loss position of the Company and the uncertainty of the time of profitability in future periods, the Company determined that a valuation allowance against its net deferred tax assets is appropriate as the Company determined it would be more likely than not unable to realize its deferred tax assets. The valuation allowance totaled $194.5 million and $223.4 million as of July 31, 2011 and 2010, respectively, a decrease of $28.9 million. The decrease in the Company’s valuation allowance compared to the prior year was primarily due to (i) a decrease in deferred tax assets associated with state net operating loss and credit carryforwards that are subject to annual limitations as defined in sections 382 and 383 of the Internal Revenue Code and (ii) a decrease in deferred tax assets associated with an accounting method change for spares.
As of July 31, 2011, the Company had federal net operating loss carryforwards of $324.0 million, which expire from 2017 to 2030, federal tax credit carryforwards, including Research and Development and foreign tax credits, of $4.7 million which expire from 2018 to 2031, state net operating loss carryforwards of $238.2 million, which expire from 2012 to 2032, and state tax credits and carryforwards of $30.6 million, of which the majority have an indefinite credit carryforward period. The remaining state tax credit carryforwards begin expiring in 2013 to 2027. The Company also has foreign net operating loss carryforwards of approximately $18.4 million in various foreign jurisdictions.
57
Table of Contents
LTX-CREDENCE CORPORATION
NOTES TO CONSOLIDATED FINANCIAL STATEMENTS (Continued)
As of July 31, 2010, the Company had federal net operating loss carryforwards of $327.3 million, which expire from 2017 to 2030, federal tax credit carryforwards, including Research and Development and foreign tax credits, of $3.6 million which expire from 2018 to 2030, state net operating loss carryforwards of $193.8 million, which expire from 2011 to 2030, and state tax credits and carryforwards of $42.1 million, of which the majority have an indefinite credit carryforward period. The remaining state tax credit carryforwards begin expiring in 2011 to 2026. The Company also has foreign net operating loss carryforwards of approximately $1.0 million in France and approximately $0.8 million in Japan. As a result of the merger with Credence Systems Corporation on August 29, 2008, a greater than 50% cumulative ownership change in both entities has triggered a significant limitation in net operating loss carryforward utilization. The Company’s ability to use the operating and acquired net operating loss and credit carryforwards is subject to annual limitations as defined in sections 382 and 383 of the Internal Revenue Code. The Company currently estimates that the annual limitation on its use of net operating losses generated through August 29, 2008 will be approximately $10.1 million, which, based on the currently enacted federal carryforward period, limits the amount of net operating losses able to be used to approximately $202.0 million as of July 31, 2011. The Company will continue to assess the realizability of these carryforwards in subsequent periods.
A summary of the Company’s adjustments to its uncertain tax positions in the fiscal years ended July 31, 2011 and 2010 is as follows (in thousands):
| 2011 | 2010 | |||||||
| Balance at beginning of year |
$ | 8,559 | $ | 13,718 | ||||
| Increase/ (decrease) for uncertain tax positions related to the current year |
712 | 628 | ||||||
| Increase/ (decrease) for uncertain tax positions related to prior years |
— | (5,480 | ) | |||||
| Decreases for settlements with applicable taxing authorities |
— | — | ||||||
| Decreases for lapses of statutes of limitations |
(177 | ) | (307 | ) | ||||
|
|
|
|
|
|||||
| Balance at end of year |
$ | 9,094 | $ | 8,559 | ||||
|
|
|
|
|
|||||
As of July 31, 2011 and 2010, the Company’s unrecognized tax benefits were $9.1 million, and $8.6 million respectively, of which $5.3 million and $4.8 million, if recognized, would impact the effective income tax rate. The Company recognizes interest and penalties related to uncertain tax positions as a component of income tax expense. The Company has accrued a total of $1.3 million and $1.1 million, respectively for the potential payment of interest and penalties at July 31, 2011 and July 31, 2010. The Company does not anticipate the amount of the reserve for uncertain tax positions that will be reduced over the next 12 month period to be material as the Company settles disputed items with the appropriate taxing authorities.
The Company files income tax returns with the U.S. federal government and various state and international jurisdictions, which are subject to potential examination by tax authorities. With few exceptions, the Company’s 1997 and subsequent federal and state tax years remain open by statute, principally relating to net operating loss carryforwards.
Net cash received for income taxes during the year ended July 31, 2011 and July 31, 2010 was approximately $0.6 million and $0.2 million, respectively.
58
Table of Contents
LTX-CREDENCE CORPORATION
NOTES TO CONSOLIDATED FINANCIAL STATEMENTS (Continued)
7. STOCKHOLDERS’ EQUITY
Stock Buyback
On September 15, 2011, the Company announced that its board of directors has authorized a stock repurchase program for up to $25 million. Under this program, the Company is authorized to repurchase shares of its common stock from time to time in open market transaction. The Company will determine the timing and amount of the transaction based on its evaluation of market conditions and other factors. The repurchase program may be suspended or discontinued at any time and has no expiration date.
2010 Plan
On November 5, 2010, the Company’s Board of Directors adopted, subject to shareholder approval, the Company’s 2010 Stock Plan, and subsequently amended it on November 26, 2010 (“2010 Plan”). Under the terms of the 2010 Plan, the Company may issue up to 4,800,000 shares of the Company’s common stock (subject to adjustment in the event of stock splits and other similar events) pursuant to awards granted under the 2010 Plan. In addition, any unissued shares of the Company’s common stock, and any unused shares of the Company’s common stock as a result of termination, surrender, cancellation or forfeiture of outstanding awards under the Credence 2005 Plan, as amended and restated, and the LTX Corporation 2004 Plan, which are referred to together as the Prior Plans, will be available for grant under the 2010 Plan. The 2010 Plan was approved by the Company’s shareholders at the annual meeting on December 7, 2010. All future grants of equity awards will be made out of the 2010 Plan, and no additional grants will be made under the Prior Plans.
Reverse Stock Split
On September 15, 2010, the Company’s Board of Directors approved a one-for-three reverse stock split of the Company’s common stock, pursuant to a previously obtained stockholders authorization. The Company filed Restated Articles of Organization on September 30, 2010 in order to effect the reverse stock split, and on a post-split basis, set the number of authorized shares of its common stock at 150,000,000. The Restated Articles of Organization were approved by the Company’s stockholders at the Special Meeting of Stockholders held on July 8, 2010.
Upon the effective time of the Restated Articles of Organization, each outstanding share of the Company’s common stock was automatically converted into one-third of a share of common stock. No fractional shares were issued in connection with the reverse stock split. Holders of common stock who would otherwise have received a fractional share of common stock pursuant to the reverse stock split received cash in lieu of the fractional share. The reverse stock split became effective for trading purposes at the opening of the Nasdaq Global Market on October 1, 2010. The effect of the reverse stock split has been retroactively applied to all periods presented.
Rights Agreement
The Company had a Rights Agreement, which expired in April 2009, whereby each common stock shareholder has one common share purchase right for each share of common stock held. The rights became exercisable only if a person or group acquired 15% or more of the Company’s common stock or announced a tender offer that would result in ownership of 15% or more of the common stock. Initially, each right entitled a stockholder to buy one share of common stock of the Company at a purchase price of $135.00 per share, subject to significant adjustment depending on the occurrence thereafter of certain events. Before any person or group has acquired 15% or more of the common stock of the Company, the rights were redeemable by the Board of Directors at $0.001 per right.
59
Table of Contents
LTX-CREDENCE CORPORATION
NOTES TO CONSOLIDATED FINANCIAL STATEMENTS (Continued)
Reserved Unissued Shares
At July 31, 2011 and July 31, 2010, the Company had reserved 9,723,074 and 5,362,082 of unissued shares of its common stock for possible issuance under stock-based compensation plans and the Company’s Employee Stock Purchase Plan.
8. EMPLOYEE BENEFIT PLANS
Stock Option Plans
In connection with the Company’s Stock Option Plans, at July 31, 2011, 6,307,075 shares were subject to future grant under the 2010 Plan, No shares were available for future grant under any of the other Company Stock Option Plans. The Company’s general practice has been to issue new shares upon the exercise of options.
For the fiscal years ended July 31, 2011, 2010 and 2009 the Company’s stock option activity is as follows:
| 2011 | 2010 | 2009 | ||||||||||||||||||||||
| Number of Shares |
Weighted Average Exercise Price |
Number of Shares |
Weighted Average Exercise Price |
Number of Shares |
Weighted Average Exercise Price |
|||||||||||||||||||
| Options outstanding, beginning of year |
2,371,252 | $ | 29.79 | 2,723,094 | $ | 30.00 | 2,663,569 | $ | 30.51 | |||||||||||||||
| Credence options converted upon merger |
— | — | — | — | 2,217,582 | 36.81 | ||||||||||||||||||
| Exercised |
(37,985 | ) | 5.62 | (7,047 | ) | 5.56 | — | — | ||||||||||||||||
| Forfeited |
(593,992 | ) | 45.31 | (344,795 | ) | 32.17 | (2,158,057 | ) | 37.62 | |||||||||||||||
|
|
|
|
|
|
|
|||||||||||||||||||
| Options outstanding, end of year |
1,739,275 | $ | 25.04 | 2,371,252 | $ | 29.79 | 2,723,094 | $ | 30.00 | |||||||||||||||
|
|
|
|
|
|
|
|||||||||||||||||||
| Options exercisable |
1,701,971 | $ | 25.45 | 2,279,600 | $ | 30.71 | 2,509,070 | $ | 31.92 | |||||||||||||||
|
|
|
|
|
|
|
|||||||||||||||||||
The intrinsic value of options exercised during the years ended July 31, 2011 2010, and 2009 was $111,814,$25,303, and $0 respectively.
As of July 31, 2011, the status of the Company’s outstanding and exercisable stock options is as follows:
| Options Outstanding |
Options Exercisable | |||||||||||||||||||
| Range of Exercise Price ($) |
Number Outstanding (#) |
Weighted Average Remaining Contractual Life (yrs) |
Weighted Average Exercise Price ($) |
Number Exercisable (#) |
Weighted Average Exercise Price ($) |
|||||||||||||||
| $ 0.00 – 13.88 |
318,639 | 5.83 | $ | 8.10 | 283,029 | $ | 8.40 | |||||||||||||
| 13.90 – 26.81 |
719,662 | 2.71 | 18.48 | 717,968 | 18.49 | |||||||||||||||
| 27.82 – 41.49 |
612,509 | 1.18 | 37.01 | 612,509 | 37.01 | |||||||||||||||
| 41.50 – 54.75 |
52,074 | 2.25 | 46.86 | 52,074 | 46.86 | |||||||||||||||
| 54.76 – 68.58 |
24,136 | 0.67 | 62.85 | 24,136 | 62.85 | |||||||||||||||
| 68.59 – 83.22 |
7,312 | 0.90 | 77.46 | 7,312 | 77.46 | |||||||||||||||
| 83.23 – 108.78 |
4,943 | 0.53 | 95.66 | 4,943 | 95.66 | |||||||||||||||
|
|
|
|
|
|||||||||||||||||
| 1,739,275 | 2.69 | $ | 25.04 | 1,701,971 | $ | 25.45 | ||||||||||||||
|
|
|
|
|
|||||||||||||||||
| Intrinsic value at July 31, 2011 |
$ | 388,057 | $ | 310,370 | ||||||||||||||||
|
|
|
|
|
|||||||||||||||||
60
Table of Contents
LTX-CREDENCE CORPORATION
NOTES TO CONSOLIDATED FINANCIAL STATEMENTS (Continued)
Restricted Stock Units (“RSU’s”)
During the fiscal year ended July 31, 2011, the Company granted 784,450 RSUs to certain executives, directors and employees, with time-based vesting terms ranging from six months to four years. Of these, 330,000 RSUs were granted to executives.
During the year ended July 31, 2010, the Company granted 910,667 RSUs to certain executives and key employees with vesting terms of between three months and four years. Of these, 538,333 RSUs were granted to executives, which included approximately 293,333 that were granted to certain executives in lieu of cash as compensation related to a merger integration bonus tied to key success elements of the merger. The 293,333 RSUs vest over one year and the fair value of these awards was recognized by the Company as a reduction to the bonus accrual which was recorded as of July 31, 2009.
During the fiscal year ended July 31, 2009, the Company granted 928,667 RSUs to certain executives, directors and employees with time-based vesting terms ranging from one to four years. Of these, 515,000 RSUs were granted to executives.
For the fiscal years ended July 31, 2011, 2010, and 2009 the status of the Company’s outstanding RSUs is as follows:
| 2011 | 2010 | 2009 | ||||||||||||||||||||||
| Number of Shares |
Weighted Average Grant-Date Fair Value |
Number of Shares |
Weighted Average Grant-Date Fair Value |
Number of Shares |
Weighted Average Grant-Date Fair Value |
|||||||||||||||||||
| RSUs outstanding, beginning of year |
1,490,232 | $ | 5.24 | 1,344,637 | $ | 5.55 | 770,822 | $ | 12.87 | |||||||||||||||
| Credence RSUs converted upon merger |
— | — | — | — | 341,181 | 5.61 | ||||||||||||||||||
| Granted |
784,450 | 6.80 | 910,667 | 5.28 | 928,667 | 2.28 | ||||||||||||||||||
| Vested |
(585,492 | ) | 6.24 | (729,530 | ) | 5.74 | (684,116 | ) | 9.30 | |||||||||||||||
| Forfeited |
(11,082 | ) | 3.36 | (35,542 | ) | 7.67 | (11,917 | ) | 12.27 | |||||||||||||||
|
|
|
|
|
|
|
|||||||||||||||||||
| RSUs outstanding, end of year |
1,678,108 | $ | 5.64 | 1,490,232 | $ | 5.24 | 1,344,637 | $ | 5.55 | |||||||||||||||
|
|
|
|
|
|
|
|||||||||||||||||||
The fair value of RSUs vested during the years ended July 31, 2011, 2010, and 2009 was $3.6 million, $4.6 million, and $7.4 million, respectively.
Restricted Stock Awards
As part of the merger with Credence, the Company assumed 63,256 shares of restricted stock with a weighted average grant date fair value of $20.34. During the year ended July 31, 2009, 49,610 shares with a weighted average grant date fair value of $20.82 vested, and the remaining 13,646 shares (with a weighted average grant date fair value of $18.54) were cancelled. As of July 31, 2011 there were no restricted stock awards outstanding.
Employee Stock Purchase Plan
In December 2003, the shareholders approved an employee stock purchase plan, which was subsequently amended in September 2005 and July 2009 (“2004 ESPP”). Under the 2004 ESPP, as amended, eligible employees may contribute up to 15% of their annual compensation for the purchase of common stock of the Company, subject to an annual limit of $25,000. The price paid for the common stock is equal to 85% of the
61
Table of Contents
LTX-CREDENCE CORPORATION
NOTES TO CONSOLIDATED FINANCIAL STATEMENTS (Continued)
Company’s common stock on the last business day of a six-month offering period. The 2004 ESPP limited the number of shares that can be issued over the term of the plan to eligible employees to 400,000 shares, and the July 2009 amendment increased the number of shares that may be issued by an additional 400,000 shares. In fiscal years 2011, 2010, and 2009, shares issued under these employee stock purchase plans were, 101,122, 73,978, and 73,089 respectively. As of July 31, 2011, 225,335 shares remain to be issued under the employee stock purchase plan.
Other Compensation Plans
The Company has established a Profit Sharing Bonus Plan, whereby a percentage of pretax profits are distributed quarterly to all eligible non-executive employees. Under the Profit Sharing Bonus Plan, the Company recorded profit sharing expense for all eligible employees of approximately $3.7 million, and $1.8 million for the years ended July 31, 2011, and 2010, respectively. The Company had no profit sharing expense related to the year ended July 31, 2009.
The Company has an Executive Profit Sharing Plan based on certain profitability milestones. Employees included in this plan are excluded from the Profit Sharing Bonus Plan. Under the Executive Profit Sharing Plan, the Company recorded profit sharing expense of approximately $2.5 million and $1.6 million for the years ended July 31, 2011 and 2010. The Company had no executive profit sharing expense in the fiscal year ended July 31, 2009.
The Company has a 401(k) Growth and Investment Program (“401(k) Plan”). Eligible employees may make voluntary contributions to the 401(k) Plan through a salary reduction contract up to the statutory limit or 20% of their annual compensation. The Company matches 50% of employees’ first 6% of voluntary contributions. Company contributions vest at a rate of 20% per year and employees are 100% vested after 5 years of service. The Company funded the match of $1.1 million, $0.9 million, and $1.1 million for the fiscal years ended July 31, 2011, 2010 and 2009, respectively.
The Company also had a one-time integration bonus plan as a special incentive for the executive officers tied to key success elements of the Credence merger. The target bonus under the plan was 100% of base salary for the Chief Executive Officer and Chief Financial Officer and 50% of base salary for other executive officers. The bonus was calculated by reference to assigned revenue targets (40% of bonus), synergy targets (40% of bonus) and individual objectives (20% of bonus). For the year ending July 31, 2009, the Company recorded $4.2 million of expense associated with this plan.
During the year ended July 31, 2009, the Company liquidated a former subsidiary which had a defined benefit pension plan. The plan liability was assumed by that country’s pension regulation board and as a result, the Company has no further obligation under this plan. The Company recorded a non-cash gain of $3.0 million as a result of the liquidation of the subsidiary.
9. INDUSTRY AND GEOGRAPHIC SEGMENT INFORMATION
In accordance with the provisions of Topic 280, Segment Reporting to the FASB ASC (“ASC 280”) the Company operates in one reporting unit, that is, the design, manufacture and sale of automated test equipment for the semiconductor industry that is used to test system-on-a-chip, digital, analog and mixed signal integrated circuits.
62
Table of Contents
LTX-CREDENCE CORPORATION
NOTES TO CONSOLIDATED FINANCIAL STATEMENTS (Continued)
The Company’s top customers in fiscal year 2011 were Texas Instruments, Spirox, and Atmel, which accounted for 23%, 14%, and 13% of its net sales, respectively. In fiscal year 2010, the top customers were Spirox, Atmel, and Texas Instruments which accounted for 24%, 13%, and 12% of the Company’s net sales, respectively. In fiscal year 2009, Texas Instruments accounted for 10% of sales. Sales to the top ten customers were 80%, 77%, and 69%, of net sales in fiscal 2011, 2010, and 2009, respectively. Accounts receivable from these top ten customers was $35.3 million and $36.3 million as of July 31, 2011 and 2010, respectively. The Company’s net sales by geographic area for the twelve months ended July 31, 2011, 2010, and 2009, along with the long-lived assets at July 31, 2011 and July 31, 2010, are summarized as follows:
| Year Ended July 31, | ||||||||||||
| 2011 | 2010 | 2009 | ||||||||||
| (in thousands) | ||||||||||||
| Sales to unaffiliated customers (ship to country): |
||||||||||||
| United States |
$ | 37,160 | $ | 51,711 | $ | 48,971 | ||||||
| Taiwan |
50,914 | 70,038 | 28,655 | |||||||||
| Singapore |
32,416 | 26,308 | 12,314 | |||||||||
| Philippines |
62,218 | 28,735 | 15,324 | |||||||||
| All other countries (none of which is individually greater than 10% of net sales) |
66,822 | 42,290 | 32,114 | |||||||||
|
|
|
|
|
|
|
|||||||
| Total sales to unaffiliated customers |
$ | 249,530 | $ | 219,082 | $ | 137,378 | ||||||
|
|
|
|
|
|
|
|||||||
| As of July 31, | ||||||||
| 2011 | 2010 | |||||||
| (in thousands) | ||||||||
| Long-lived assets |
||||||||
| United States |
$ | 18,820 | $ | 24,443 | ||||
| Singapore |
559 | 793 | ||||||
| Philippines |
371 | 426 | ||||||
| All other countries |
1,077 | 615 | ||||||
|
|
|
|
|
|||||
| Total long-lived assets |
$ | 20,827 | $ | 26,277 | ||||
|
|
|
|
|
|||||
Transfer prices on products sold to foreign subsidiaries are intended to produce profit margins that correspond to the subsidiary’s sales and support efforts.
10. COMMITMENTS AND CONTINGENT LIABILITIES
The Company is subject to various legal proceedings, claims and litigation which arise in the ordinary course of operations. In the opinion of management, the amount of liability, if any, with respect to these actions would not materially affect the Company’s financial position, results of operations or cash flows.
On November 17, 2010, the Company entered into an Agreement and Plan of Merger (the “Merger Agreement”) with Verigy Ltd., a corporation organized under the laws of Singapore (“Verigy”). In March 2011, prior to the closing of our merger with Verigy, the board of directors of Verigy determined that a proposal from Advantest to acquire all of the outstanding ordinary shares of Verigy for $15.00 per share in cash, on the terms and conditions set forth in a definitive implementation agreement proposed by Advantest, constituted a “Superior Offer” within the meaning of the Merger Agreement, the Verigy board of directors withdrew its recommendation in favor of the pending merger transaction between Verigy and the Company and, as a result the Company then
63
Table of Contents
LTX-CREDENCE CORPORATION
NOTES TO CONSOLIDATED FINANCIAL STATEMENTS (Continued)
terminated the Merger Agreement. As a result of the termination of the Merger Agreement, on March 25, 2011 Verigy paid the Company the $15,000,000 Verigy Termination Fee required pursuant to the terms and conditions of the Merger Agreement, which is classified as other income in the Company’s statement of operations.
In the twelve months ended July 31, 2011, the Company has incurred approximately $4.9 million of expenses related to this transaction, of which $3.6 million has been recorded in selling, general and administrative expenses on the Company’s consolidated statement of operations. The remaining $1.3 million was related to a break-up fee and was recorded as Other income (expense).
As previously disclosed by the Company, the Company, its directors, Lobster-1 Merger Corporation, and Lobster-2 Corporation, were named as defendants in the following putative class action complaints:
| • | Carneau v. LTX-Credence Corp., et. al., 110-cv-188153, filed on November 22, 2010 in the Superior Court of the State of California. |
| • | Khan v. LTX-Credence Corp., et.al,, 1-10-cv188773 filed December 1, 2010 in Santa Clara Superior Court. |
| • | Snitily v.Tacelli, et.al., No 1-10-cv-188922 filed on December 6, 2010 in Santa Clara Superior Court. |
| • | Shah v. Tacelli, et. al., No. 10- 4580, filed on November 23, 2010 in the Superior Court of the Commonwealth of Massachusetts. |
| • | Krieger v. LTX-Credence Corp., et. al., No. 10-04713, filed on December 3, 2010 in the Superior Court for the Commonwealth of Massachusetts. |
| • | Keuler v. LTX-Credence Corp., et. al., 1:10-cv-12058, filed on November 30, 2010 in the United States District Court for the District of Massachusetts. |
| • | Brookshire v. LTX-Credence Corp., et. al.,CV 10 5773 filed on December 17, 2010 in the United States District Court for the Northern District of California. |
As of July 31, 2011 all of these actions have been dismissed without costs.
On April 19, 2011, the Company received a demand letter pursuant to Massachusetts General Laws ch. 156D, § 7.42 sent on behalf of Joel Krieger, a purported LTX-Credence shareholder, whose putative class action complaint, Krieger v. LTX-Credence Corp., et. al., No. 10-04713, filed on December 3, 2010 in the Superior Court for the Commonwealth of Massachusetts, was recently dismissed. The letter demands the Company commence legal proceedings against the Company’s directors and senior officers for breaches of their fiduciary duties, gross negligence and mismanagement, waste of corporate assets, and abuse of control, all arising out of the Company’s pursuit of a merger transaction with Verigy. On October 12, 2011 the independent members of the Company’s Board of Directors determined that pursuing the claims asserted in the demand letter was not in the best interest of the Company.
In the ordinary course of business, the Company agrees from time to time to indemnify certain customers against certain third party claims for property damage, bodily injury, personal injury or intellectual property infringement arising from the operation or use of the Company’s products. Also, from time to time in agreements with suppliers, licensors and other business partners, the Company agrees to indemnify these partners against certain liabilities arising out of the sale or use of the Company’s products. The maximum potential amount of future payments the Company could be required to make under these indemnification obligations is theoretically unlimited; however, the Company has general and umbrella insurance policies that enable it to recover a portion of any amounts paid and many of its agreements contain a limit on the maximum amount, as well as limits on the types of damages recoverable. Based on the Company’s experience with such indemnification claims, it believes
64
Table of Contents
LTX-CREDENCE CORPORATION
NOTES TO CONSOLIDATED FINANCIAL STATEMENTS (Continued)
the estimated fair value of these obligations is minimal. Accordingly, the Company has no liabilities recorded for these agreements as of July 31, 2011 or July 31, 2010.
Subject to certain limitations, LTX-Credence indemnifies its current and former officers and directors for certain events or occurrences. Although the maximum potential amount of future payments LTX-Credence could be required to make under these agreements is theoretically unlimited, as there were no known or pending claims, the Company has not accrued a liability for these agreements as of July 31, 2011 or July 31, 2010.
As of July 31, 2011, the Company has approximately $9.6 million of non-cancelable inventory commitments with outsource suppliers. Additionally, as of the date of this filing, the Company has additional inventory purchase commitments of approximately $9.7 million related to the Company’s consolidation of its outsource manufacturing activities with Jabil Circuit. The Company expects to consume this inventory through normal operating activity.
The Company has operating lease commitments for certain facilities and equipment that expire at various dates through 2017. The Company has an option to extend the term for its Norwood, Massachusetts facility lease for two additional five year periods provided that the Company notifies its landlord at least four hundred twenty-five days prior to expiration of the original term. Minimum lease payments under non-cancelable leases at July 31, 2011, are as follows:
| Year ending July 31, |
Facilities | Equipment | Total Operating Leases |
|||||||||
| (in thousands) | ||||||||||||
| 2012 |
$ | 5,864 | $ | 120 | $ | 5,984 | ||||||
| 2013 |
5,190 | 97 | 5,287 | |||||||||
| 2014 |
4,871 | 68 | 4,939 | |||||||||
| 2015 |
4,330 | 3 | 4,333 | |||||||||
| 2016 |
3,868 | 3 | 3,871 | |||||||||
| Thereafter |
2,144 | — | 2,144 | |||||||||
|
|
|
|
|
|
|
|||||||
| Total minimum lease payments |
$ | 26,267 | $ | 291 | $ | 26,558 | ||||||
|
|
|
|
|
|
|
|||||||
Total rent expense for the years ended July 31, 2011, 2010, and 2009 was $4.6 million, $5.5 million, and $6.7 million, respectively.
11. RESTRUCTURING
As a result of the Credence merger in August 2008, the Company assumed previous Credence management approved restructuring plans designed to reduce headcount, consolidate facilities and to align that company’s capacity and infrastructure to anticipated customer demand and transition of its operations for higher utilization of facility space. In connection with these plans, the Company assumed a total liability of approximately $6.0 million. Subsequent to the completion of the merger, the Company incurred approximately $0.9 million of additional expense related to these actions that was recorded in the Company’s statement of operations in fiscal 2009.
During the fiscal year ended July 31, 2009, the Company recorded a charge to operations for a liability of approximately $15.3 million related to severance and other post-employment obligations for legacy LTX employees related to the merger, and two additional plans executed during the year to reduce headcount associated with post-merger cost saving initiatives. Also during the fiscal year ended July 31, 2009, the Company recorded a charge to operations of $5.9 million related to costs associated with vacating several facilities that were no longer being utilized.
65
Table of Contents
LTX-CREDENCE CORPORATION
NOTES TO CONSOLIDATED FINANCIAL STATEMENTS (Continued)
During the fiscal year ended July 31, 2010, the Company recorded a charge of $2.0 million related to additional square footage vacated, changes in sublease assumptions and future rental payments on previously vacated facilities, and employee termination-related costs associated with Europe and downsizing of the Company’s Hillsboro, Oregon facility.
During the fiscal year ended July 31, 2011 the Company recorded a charge of $0.4 million as a result of modifying sublease assumptions and adjusting the liability for changes in common area maintenance charges associated with previously restructured facilities.
The following table sets forth the Company’s restructuring accrual activity for the three years ended July 31, 2011:
| Severance Costs |
Facility Leases |
Asset Impairment |
Total | |||||||||||||
| (in millions) | ||||||||||||||||
| Balance July 31, 2008 |
$ | 0.3 | $ | 0.6 | $ | — | $ | 0.9 | ||||||||
| Provided for under EITF 95-3 in connection with the Credence merger |
13.0 | — | — | 13.0 | ||||||||||||
| Balance acquired from Credence, August 29, 2008 |
6.0 | — | — | 6.0 | ||||||||||||
| Restructuring expense |
15.3 | 4.3 | 1.6 | 21.2 | ||||||||||||
| Elimination of deferred rent and unfavorable lease liability |
— | 2.9 | — | 2.9 | ||||||||||||
| Non-cash utilization |
— | (0.4 | ) | (1.6 | ) | (2.0 | ) | |||||||||
| Cash paid |
(31.8 | ) | (1.8 | ) | — | (33.6 | ) | |||||||||
|
|
|
|
|
|
|
|
|
|||||||||
| Balance July 31, 2009 |
2.8 | 5.6 | — | 8.4 | ||||||||||||
| Restructuring expense |
0.4 | 1.6 | — | 2.0 | ||||||||||||
| Accretion and elimination of unfavorable lease liability |
— | 0.3 | — | 0.3 | ||||||||||||
| Cash paid |
(3.1 | ) | (1.7 | ) | — | (4.8 | ) | |||||||||
|
|
|
|
|
|
|
|
|
|||||||||
| Balance July 31, 2010 |
0.1 | 5.8 | — | 5.9 | ||||||||||||
| Restructuring expense |
— | 0.4 | — | 0. 4 | ||||||||||||
| Accretion and elimination of unfavorable lease liability |
— | 0.1 | — | 0.1 | ||||||||||||
| Cash paid |
— | (1.6 | ) | — | (1.6 | ) | ||||||||||
|
|
|
|
|
|
|
|
|
|||||||||
| Balance July 31, 2011 |
$ | 0.1 | $ | 4.7 | $ | — | $ | 4.8 | ||||||||
|
|
|
|
|
|
|
|
|
|||||||||
As of July 31, 2011, approximately $1.3 million of the liability is included in current liabilities as a component of accrued expenses on the consolidated balance sheet. Approximately $3.5 million is included in other long-term liabilities on the consolidated balance sheet.
12. FAIR VALUE MEASUREMENTS
The Company determines its fair value measurements for assets and liabilities based upon the provisions of Topic 820, Fair Value Measurements and Disclosures, to FASB ASC.
The Company holds short-term money market investments and certain other financial instruments which are carried at fair value. The Company determines fair value based upon quoted prices, when available or through the use of alternative approaches when market quotes are not readily accessible or available.
Valuation techniques for fair value are based upon observable and unobservable inputs. Observable inputs reflect market data obtained from independent sources, while unobservable inputs reflect the Company’s best
66
Table of Contents
LTX-CREDENCE CORPORATION
NOTES TO CONSOLIDATED FINANCIAL STATEMENTS (Continued)
estimate, considering all relevant information. These valuation techniques involve some level of management estimation and judgment. The valuation process to determine fair value also includes making appropriate adjustments to the valuation model outputs to consider risk factors.
The fair value hierarchy of the Company’s inputs used in the determination of fair value for assets and liabilities during the current period consists of three levels. Level 1 inputs are composed of unadjusted, quoted prices in active markets for identical assets or liabilities at the measurement date. Level 2 inputs include quoted prices for similar instruments in active markets; quoted prices for identical or similar instruments in markets that are not active; inputs other than quoted prices that are observable for the asset or liability; and inputs that are derived principally from or corroborated by observable market data by correlation or other means. Level 3 inputs incorporate the Company’s own best estimate of what market participants would use in pricing the asset or liability at the measurement date where consideration is given to the risk inherent in the valuation technique and the risk inherent in the inputs to the model. If inputs used to measure an asset or liability fall within different levels of the hierarchy, the categorization is based on the lowest level input that is significant to the fair value measurement of the asset or liability. The Company’s assessment of the significance of a particular input to the fair value measurement in its entirety requires judgment, and considers factors specific to the asset or liability.
The following table presents financial assets and liabilities measured at fair value and their related valuation inputs as of July 31, 2011 and as of July 31, 2010, respectively.
| Fair Value Measurements at Reporting Date Using (in thousands) |
||||||||||||||||
| July 31, 2011 |
Total Fair Value of Asset or Liability |
Quoted Prices in Active Markets for Identical Assets (Level 1) |
Significant Other Observable Inputs (Level 2) |
Significant Unobservable Inputs (Level 3) |
||||||||||||
| Cash and cash equivalents (1) |
$ | 123,198 | $ | 122,698 | $ | 500 | $ | — | ||||||||
| Marketable securities (2) |
35,419 | 10,031 | 25,388 | — | ||||||||||||
|
|
|
|
|
|
|
|
|
|||||||||
| Total Assets |
$ | 158,617 | $ | 132,729 | $ | 25,888 | $ | — | ||||||||
|
|
|
|
|
|
|
|
|
|||||||||
| Other accrued expenses (Foreign exchange contract (3) |
$ | 187 | $ | — | $ | 187 | $ | — | ||||||||
|
|
|
|
|
|
|
|
|
|||||||||
| Total Liabilities |
$ | 187 | $ | — | $ | 187 | $ | — | ||||||||
|
|
|
|
|
|
|
|
|
|||||||||
| July 31, 2010 |
Total Fair Value of Asset or Liability |
Quoted Prices in Active Markets for Identical Assets (Level 1) |
Significant Other Observable Inputs (Level 2) |
Significant Unobservable Inputs (Level 3) |
||||||||||||
| Cash and cash equivalents (1) |
$ | 74,978 | $ | 74,978 | $ | — | $ | — | ||||||||
| Marketable securities (2) |
17,360 | 3,426 | 13,934 | — | ||||||||||||
| Other assets (Restricted cash) |
256 | 256 | — | — | ||||||||||||
|
|
|
|
|
|
|
|
|
|||||||||
| Total assets |
$ | 92,594 | $ | 78,660 | $ | 13,934 | $ | — | ||||||||
|
|
|
|
|
|
|
|
|
|||||||||
| Convertible notes |
$ | 826 | $ | — | $ | 826 | $ | — | ||||||||
|
|
|
|
|
|
|
|
|
|||||||||
| Total Liabilities |
$ | 826 | $ | — | $ | 826 | $ | — | ||||||||
|
|
|
|
|
|
|
|
|
|||||||||
| (1) | Cash and cash equivalents as of July 31, 2011 and July 31, 2010 includes cash held in operating accounts of approximately $10.9 million and $7.8 million, respectively, that are not subject to fair value measurements. For purposes of this disclosure they are included as having Level 1 inputs. |
| (2) | Marketable securities as of July 31, 2011 and July 31, 2010 exclude approximately $4.0 million and $1.1 million, respectively, of commercial paper which is held to maturity and not subject to fair value measurements. |
67
Table of Contents
LTX-CREDENCE CORPORATION
NOTES TO CONSOLIDATED FINANCIAL STATEMENTS (Continued)
| (3) | Other accrued expenses as of July 31, 2011 includes a derivative not designated as a hedging arrangement related to a foreign exchange contract of approximately $0.2 million. |
The fair value of the Company’s convertible notes was estimated using inputs derived principally from market observable data, including current rates offered to the Company for debt of the same or similar maturities. Within the hierarchy of fair value measurement, these are level 2 inputs.
The carrying value of accounts receivable, prepaid expenses, accounts payable and accrued expenses approximate fair value due to their short-term nature.
There were no assets or liabilities related to non-recurring transactions requiring valuation disclosures as of July 31, 2011 or as of July 31, 2010.
13. QUARTERLY RESULTS OF OPERATIONS (unaudited)
| Year Ended July 31, 2011 | ||||||||||||||||
| First Quarter |
Second Quarter |
Third Quarter |
Fourth Quarter |
|||||||||||||
| (in thousands, except per share data) | ||||||||||||||||
| Net sales |
$ | 75,647 | $ | 52,549 | $ | 58,665 | $ | 62,669 | ||||||||
| Gross profit |
47,246 | 31,423 | 36,461 | 39,110 | ||||||||||||
| Net income |
19,675 | 4,705 | 23,622 | 12,076 | ||||||||||||
| Net income per share: |
||||||||||||||||
| Basic |
$ | 0.40 | $ | 0.10 | $ | 0.48 | $ | 0.24 | ||||||||
| Diluted |
$ | 0.39 | $ | 0.09 | $ | 0.47 | $ | 0.24 | ||||||||
Net income for the year ended July 31, 2011 includes the following activity associated with the following infrequent and non-recurring transactions:
| First Quarter |
Second Quarter |
Third Quarter |
Fourth Quarter |
|||||||||||||
| (in thousands) | ||||||||||||||||
| Merger breakup fees |
$ | — | $ | — | $ | 15,000 | $ | — | ||||||||
| Merger-related expenses |
— | (2,828 | ) | (1,856 | ) | (189 | ) | |||||||||
| Loss on disposition of property and equipment |
— | — | — | 53 | ||||||||||||
| Restructuring |
(116 | ) | — | (247 | ) | — | ||||||||||
|
|
|
|
|
|
|
|
|
|||||||||
| Total non-recurring income (expense) |
$ | (116 | ) | $ | (2,828 | ) | $ | 12,897 | $ | (136 | ) | |||||
|
|
|
|
|
|
|
|
|
|||||||||
| Year Ended July 31, 2010 | ||||||||||||||||
| First Quarter |
Second Quarter |
Third Quarter |
Fourth Quarter |
|||||||||||||
| (in thousands, except per share data) | ||||||||||||||||
| Net sales |
$ | 41,850 | $ | 48,000 | $ | 56,069 | $ | 73,163 | ||||||||
| Gross profit |
20,206 | 25,962 | 32,148 | 44,066 | ||||||||||||
| Net income (loss) |
(3,194 | ) | 813 | 6,829 | 13,700 | |||||||||||
| Net income (loss) per share: |
||||||||||||||||
| Basic |
$ | (0.06 | ) | $ | 0.03 | $ | 0.15 | $ | 0.28 | |||||||
| Diluted |
$ | (0.06 | ) | $ | 0.03 | $ | 0.15 | $ | 0.27 | |||||||
68
Table of Contents
LTX-CREDENCE CORPORATION
NOTES TO CONSOLIDATED FINANCIAL STATEMENTS (Continued)
Net income (loss) for the year ended July 31, 2010 includes the following activity associated with the following infrequent and non-recurring transactions:
| First Quarter |
Second Quarter |
Third Quarter |
Fourth Quarter |
|||||||||||||
| (in thousands) | ||||||||||||||||
| Gain on extinguishment of debt, net |
$ | 625 | $ | 306 | $ | 2,126 | $ | 23 | ||||||||
| Collection of previously written off receivable |
— | 600 | 1,000 | 1,000 | ||||||||||||
| Gain/ (loss) on disposition of property and equipment |
44 | (6 | ) | (13 | ) | (1,378 | ) | |||||||||
| Restructuring |
(423 | ) | (816 | ) | (788 | ) | — | |||||||||
|
|
|
|
|
|
|
|
|
|||||||||
| Total non-recurring income (expense) |
$ | 246 | $ | 84 | $ | 2,325 | $ | (355 | ) | |||||||
|
|
|
|
|
|
|
|
|
|||||||||
14. SUBSEQUENT EVENTS
On September 15, 2011, the Company announced that its board of directors has authorized a stock repurchase program for up to $25 million. Under this program, the Company is authorized to repurchase shares of its common stock from time to time in open market transaction. The Company will determine the timing and amount of the transaction based on its evaluation of market conditions and other factors. The repurchase program may be suspended or discontinued at any time and has no expiration date.
69
Table of Contents
Report of Independent Registered Public Accounting Firm
The Board of Directors and Stockholders of LTX-Credence Corporation
We have audited the accompanying consolidated balance sheets of LTX-Credence Corporation as of July 31, 2011 and 2010 and the related consolidated statements of operations and comprehensive income (loss), stockholders’ equity, and cash flows for the years then ended. In connection with our audits of the financial statements, we have also audited the financial statement schedules listed in the Index at Item 15(c) for the years ended July 31, 2011 and 2010. These financial statements and schedules are the responsibility of the Company’s management. Our responsibility is to express an opinion on these financial statements and schedules based on our audits.
We conducted our audits in accordance with the standards of the Public Company Accounting Oversight Board (United States). Those standards require that we plan and perform the audits to obtain reasonable assurance about whether the financial statements are free of material misstatement. An audit includes examining, on a test basis, evidence supporting the amounts and disclosures in the financial statements, assessing the accounting principles used and significant estimates made by management, as well as evaluating the overall presentation of the financial statements and schedules. We believe that our audits provide a reasonable basis for our opinion.
In our opinion, the consolidated financial statements referred to above present fairly, in all material respects, the financial position of LTX-Credence Corporation at July 31, 2011 and 2010, and the results of its operations and its cash flows for the years then ended in conformity with accounting principles generally accepted in the United States of America.
Also, in our opinion, the financial statement schedules, when considered in relation to the basic consolidated financial statements taken as a whole, presents fairly, in all material respects, the information set forth therein for the years ended July 31, 2011 and 2010.
We also have audited, in accordance with the standards of the Public Company Accounting Oversight Board (United States), LTX-Credence Corporation’s internal control over financial reporting as of July 31, 2011, based on criteria established in Internal Control—Integrated Framework issued by the Committee of Sponsoring Organizations of the Treadway Commission (COSO) and our report dated October 14, 2011 expressed an unqualified opinion thereon.
/s/ BDO USA, LLP
Boston, Massachusetts
October 14, 2011
70
Table of Contents
| Item 9. | Changes in and Disagreements with Accountants on Accounting and Financial Disclosure |
There has been no change of accountants nor any disagreements with accountants on any matter of accounting principles or practices or financial disclosure required to be reported under this Item.
| Item 9A. | Controls and Procedures |
Evaluation of Disclosure Controls and Procedures
The Company’s management, with the participation of the Company’s Chief Executive Officer and Chief Financial Officer, evaluated the effectiveness of the Company’s disclosure controls and procedures as of July 31, 2011. The term “disclosure controls and procedures,” as defined in Rules 13a-15(e) and 15d-15(e) under the Exchange Act, means controls and other procedures of a company that are designed to ensure that information required to be disclosed by a company in the reports that it files or submits under the Exchange Act is recorded, processed, summarized and reported, within the time period specified in the SEC’s rules and forms. Disclosure controls and procedures include, without limitation, controls and procedures designed to ensure that information required to be disclosed by a company in the reports that it files or submits under the Exchange Act is accumulated and communicated to the company’s management, including its principal executive and principal financial officers, as appropriate to allow timely decisions regarding required disclosure. Management recognizes that any controls and procedures, no matter how well designed and operated, can provide only reasonable assurance of achieving their objectives and management necessarily applies its judgment in evaluating the cost-benefit relationship of possible controls and procedures. Based on the evaluation of the Company’s disclosure controls and procedures as of July 31, 2011, the Company’s Chief Executive Officer and Chief Financial Officer concluded that, as of such date, the Company’s disclosure controls and procedures were effective at the reasonable assurance levels.
Management’s report on the Company’s internal control over financial reporting (as defined in Rules 13a-15(f) and 15d-15(f) under the Exchange Act) and the independent registered public accounting firm’s related audit report are included in this Item 9.
Management’s Annual Report on Internal Control Over Financial Reporting
The management of the Company is responsible for establishing and maintaining adequate internal control over financial reporting for the Company. Internal control over financial reporting is defined in Rule 13a-15(f) or 15d-15(f) promulgated under the Securities Exchange Act of 1934 as a process designed by, or under the supervision of, the Company’s principal executive and principal financial officers and effected by the Company’s board of directors, management and other personnel, to provide reasonable assurance regarding the reliability of financial reporting and the preparation of financial statements for external purposes in accordance with generally accepted accounting principles and includes those policies and procedures that:
| • | pertain to the maintenance of records that in reasonable detail accurately and fairly reflect the transactions and dispositions of the assets of the Company; |
| • | provide reasonable assurance that transactions are recorded as necessary to permit preparation of financial statements in accordance with generally accepted accounting principles, and that receipts and expenditures of the Company are being made only in accordance with authorizations of management and directors of the Company; and |
| • | provide reasonable assurance regarding prevention or timely detection of unauthorized acquisition, use or disposition of the Company’s assets that could have a material effect on the financial statements. |
Because of its inherent limitations, internal control over financial reporting may not prevent or detect misstatements. Projections of any evaluation of effectiveness to future periods are subject to the risk that controls may become inadequate because of changes in conditions, or that the degree of compliance with the policies or procedures may deteriorate.
71
Table of Contents
The Company’s management assessed the effectiveness of the Company’s internal control over financial reporting as of July 31, 2011. In making this assessment, the Company’s management used the criteria set forth by the Committee of Sponsoring Organizations of the Treadway Commission (COSO) in Internal Control-Integrated Framework.
Based on our assessment, management concluded that, as of July 31, 2011, the Company’s internal control over financial reporting is effective based on those criteria.
The Company’s independent registered public accounting firm has issued a report on its assessment of the Company’s internal control over financial reporting. This report appears below.
72
Table of Contents
Report of Independent Registered Public Accounting Firm
The Board of Directors and Stockholders of LTX-Credence Corporation
We have audited LTX-Credence Corporations internal control over financial reporting as of July 31, 2011, based on criteria established in Internal Control—Integrated Framework issued by the Committee of Sponsoring Organizations of the Treadway Commission (the COSO criteria). LTX-Credence Corporation’s management is responsible for maintaining effective internal control over financial reporting and for its assessment of the effectiveness of internal control over financial reporting, included in the accompanying Management’s Report on Internal Control Over Financial Reporting. Our responsibility is to express an opinion on the company’s internal control over financial reporting based on our audit.
We conducted our audit in accordance with the standards of the Public Company Accounting Oversight Board (United States). Those standards require that we plan and perform the audit to obtain reasonable assurance about whether effective internal control over financial reporting was maintained in all material respects. Our audit included obtaining an understanding of internal control over financial reporting, assessing the risk that a material weakness exists, and testing and evaluating the design and operating effectiveness of internal control based on the assessed risk. Our audit also included performing such other procedures as we considered necessary in the circumstances. We believe that our audit provides a reasonable basis for our opinion.
A company’s internal control over financial reporting is a process designed to provide reasonable assurance regarding the reliability of financial reporting and the preparation of financial statements for external purposes in accordance with generally accepted accounting principles. A company’s internal control over financial reporting includes those policies and procedures that (1) pertain to the maintenance of records that, in reasonable detail, accurately and fairly reflect the transactions and dispositions of the assets of the company; (2) provide reasonable assurance that transactions are recorded as necessary to permit preparation of financial statements in accordance with generally accepted accounting principles, and that receipts and expenditures of the company are being made only in accordance with authorizations of management and directors of the company; and (3) provide reasonable assurance regarding prevention or timely detection of unauthorized acquisition, use, or disposition of the company’s assets that could have a material effect on the financial statements.
Because of its inherent limitations, internal control over financial reporting may not prevent or detect misstatements. Also, projections of any evaluation of effectiveness to future periods are subject to the risk that controls may become inadequate because of changes in conditions or that the degree of compliance with the policies or procedures may deteriorate.
In our opinion, LTX-Credence Corporation maintained, in all material respects, effective internal control over financial reporting as of July 31, 2011, based on the COSO criteria.
We also have audited, in accordance with the standards of the Public Company Accounting Oversight Board (United States), the consolidated balance sheets of LTX-Credence Corporation as of July 31, 2011 and 2010, and the related consolidated statements of operations and comprehensive income (loss), stockholders’ equity and cash flows for each of the two years in the period ended July 31, 2011 and our report dated October 14, 2011 expressed an unqualified opinion thereon.
/s/ BDO USA, LLP
Boston, Massachusetts
October 14, 2011
73
Table of Contents
Report of Independent Registered Public Accounting Firm
The Board of Directors and Stockholders of LTX-Credence Corporation
We have audited the accompanying consolidated statements of operations and comprehensive loss, stockholders’ equity, and cash flows of LTX-Credence Corporation (the “Company”) for the fiscal year ended July 31, 2009. Our audit also included the financial statement schedule for the year ended July 31, 2009 listed in the index at Item 15(c). These financial statements and schedule are the responsibility of the Company’s management. Our responsibility is to express an opinion on these financial statements and schedule based on our audit.
We conducted our audit in accordance with the standards of the Public Company Accounting Oversight Board (United States). Those standards require that we plan and perform the audit to obtain reasonable assurance about whether the financial statements are free of material misstatement. An audit includes examining, on a test basis, evidence supporting the amounts and disclosures in the financial statements. An audit also includes assessing the accounting principles used and significant estimates made by management, as well as evaluating the overall financial statement presentation. We believe that our audit provide a reasonable basis for our opinion.
In our opinion, the consolidated financial statements referred to above present fairly, in all material respects, the consolidated results of operations of the Company and its cash flows for the year ended July 31, 2009, in conformity with U.S. generally accepted accounting principles. Also, in our opinion, the related financial statement schedule for the year ended July 31, 2009, when considered in relation to the basic financial statements referred to above taken as a whole, presents fairly in all material respects the information set forth therein.
/s/ Ernst & Young LLP
Boston, Massachusetts
October 14, 2009, except for the
effect of the one-for-three reverse
stock split disclosed in Note 1, as to
which the date is October 14, 2010
74
Table of Contents
Changes in Internal Controls
There was no change in the Company’s internal control over financial reporting during the fiscal year ended July 31, 2011 that has materially affected, or is reasonably likely to materially affect, the Company’s internal control over financial reporting.
| Item 9B. | Other Information |
None.
PART III
| Item 10. | Directors, Executive Officers and Corporate Governance |
The information required by this item, including information relating to our directors and executive officers, Section 16(a) beneficial ownership reporting compliance, code of ethics, director nomination procedures and audit committee, is incorporated herein by reference from our definitive proxy statement in connection with our 2011 Annual Meeting of Stockholders (the “2011 Proxy Statement”). The 2011 Proxy Statement will be filed with the SEC not later than 120 days after the close of the fiscal year.
| Item 11. | Executive Compensation |
The information required by this item, including information relating to our executive compensation and compensation committee, is incorporated herein by reference from the 2011 Proxy Statement.
| Item 12. | Security Ownership of Certain Beneficial Owners and Management and Related Stockholder Matters |
The information required by this item, including information relating to our security ownership of certain beneficial owners, is incorporated herein by reference from the 2011 Proxy Statement. In addition, the information under the heading “Securities Authorized for Issuance under Equity Compensation Plans” in Part II, Item 5 of this Form 10-K is incorporated herein by reference.
| Item 13. | Certain Relationships and Related Transactions, and Director Independence |
The information required by this item, including information relating to our related person transactions and director independence, is incorporated herein by reference from the 2011 Proxy Statement.
| Item 14. | Principal Accountant Fees and Services |
The information required by this item, including information relating to our principal accountant fees and services, is incorporated herein by reference from the 2011 Proxy Statement.
75
Table of Contents
PART IV
| Item 15. | Exhibits and Financial Statement Schedules |
The following consolidated financial statements of the Company for the fiscal year ended July 31, 2011, are included in Item 8, herein.
2. Financial Statement Schedules
Consolidated financial statement Schedule II for the Company is included in Item 15(c). All other schedules for which provision is made in the applicable security regulation of the Securities and Exchange Commission are not required under the related instructions or are inapplicable and therefore have been omitted.
(b) Exhibits
The exhibits filed as part of this Annual Report on Form 10-K are set forth on the Exhibit Index immediately preceding such exhibits, and are incorporated herein by reference.
76
Table of Contents
(c) Financial Statement Schedules
SCHEDULE II
LTX-CREDENCE CORPORATION
VALUATION AND QUALIFYING ACCOUNTS
For Years Ended July 31, 2011, 2010 and 2009
(in thousands)
| Description |
Balance at beginning of period |
Charged to expense |
Transfers In, Net (1) |
Deductions (2) | Balance at end of period |
|||||||||||||||
| Reserve for doubtful accounts |
||||||||||||||||||||
| July 31, 2011 |
$ | 108 | $ | 6 | $ | — | $ | (74 | ) | $ | 40 | |||||||||
| July 31, 2010 |
$ | 481 | $ | 303 | $ | — | $ | (676 | ) | $ | 108 | |||||||||
| July 31, 2009 |
$ | 659 | $ | 742 | $ | — | $ | (920 | ) | $ | 481 | |||||||||
| Reserve for excess and obsolete inventory (3) |
||||||||||||||||||||
| July 31, 2011 |
$ | 45,600 | $ | 2,630 | $ | (297 | ) | $ | (4,955 | ) | $ | 42,978 | ||||||||
| July 31, 2010 |
$ | 56,613 | $ | 2,628 | $ | 241 | $ | (13,882 | ) | $ | 45,600 | |||||||||
| July 31, 2009 |
$ | 35,188 | $ | 19,964 | $ | 8,581 | $ | (7,120 | ) | $ | 56,613 | |||||||||
| (1) | Represents transfers from fully reserved vendor liability obligations and internal capital equipment; and transfers to fixed assets. |
| (2) | Represents amounts written off or utilization of reserve or recovery of previously written off amounts. |
| (3) | Amounts charged to expense and recorded in cost of sales are costs relating to product deemed defective or unusable during the normal manufacturing process which total $2.6 million, $2.6 million and $0.6 million for fiscal years 2011, 2010, and 2009, respectively. Also included in the amounts charged to expense for fiscal year 2009 was material inventory provisions related to product transitions and adverse business conditions of $19.3 million. Deductions are also recorded to cost of sales and primarily represent release of reserves related to sales of previously reserved inventory, which totaled ($5.0) million, ($13.9) million and ($7.1) million for the fiscal years 2011, 2010 and 2009, respectively. |
77
Table of Contents
Pursuant to the requirements of Section 13 or 15(d) of the Securities Exchange Act of 1934, the registrant has duly caused this report to be signed on its behalf by the undersigned, thereunto duly authorized.
| LTX-Credence CORPORATION | ||
| By: | /s/ DAVID G. TACELLI | |
| David G. Tacelli | ||
| President and Chief Executive Officer | ||
October 14, 2011
Pursuant to the requirements of the Securities and Exchange Act of 1934, this report has been signed below by the following persons on behalf of the registrant and in the capacities and on the dates indicated.
| /s/ ROGER W. BLETHEN Roger W. Blethen |
Chairman of the Board | October 14, 2011 | ||
| /s/ DAVID G. TACELLI David G. Tacelli |
President and Chief Executive Officer (Principal Executive Officer) | October 14, 2011 | ||
| /s/ MARK J. GALLENBERGER Mark J. Gallenberger |
Vice President, Chief Financial Officer and Treasurer (Principal Financial Officer and Principal Accounting Officer) | October 14, 2011 | ||
| /s/ MARK S. AIN Mark S. Ain |
Director | October 14, 2011 | ||
| /s/ LORI HOLLAND Lori Holland |
Director | October 14, 2011 | ||
| /s/ STEPHEN M. JENNINGS Stephen M. Jennings |
Director | October 14, 2011 | ||
| /s/ ROGER J. MAGGS Roger J. Maggs |
Director | October 14, 2011 | ||
| /s/ BRUCE R. WRIGHT Bruce R. Wright |
Director | October 14, 2011 | ||
| /s/ PING YANG Ping Yang |
Director | October 14, 2011 | ||
78
Table of Contents
| Exhibit No. |
Description | |
| 2.1 | Agreement and Plan of Merger, dated as of June 20, 2008, by and among the Registrant, Zoo Merger Corporation and Credence Systems Corporation (Incorporated by reference to Exhibit 2.1 to the Registrant’s Current Report on Form 8-K filed on June 23, 2008) | |
| 2.2 | Agreement and Plan of Merger by and among the Registrant, Verigy Ltd., Alisier Limited, Lobster-1 Merger Corporation, and Lobster-2 Merger Corporation (Incorporated by reference to Exhibit 2.1 to the Registrant’s Current Report on Form 8-K filed on November 18, 2010) | |
| 3.1 | Restated Articles of Organization, (Incorporated by reference to Exhibit 3.1 to the Registrant’s Current Report on Form 8-K filed on September 30, 2010 | |
| 3.2 | By-laws, as amended (Incorporated by reference to Exhibit 3.2 to the Registrant’s Quarterly Report on Form 10-Q for the fiscal quarter ended October 31, 2007) | |
| 4.2 | Indenture, dated as of May 22, 2009, between LTX-Credence Corporation and The Bank of New York Mellon Trust Company, N.A., as trustee (Incorporated by reference to Exhibit 4.1 to the Registrant’s Current Report on Form 8-K filed on May 26, 2009) | |
| 10.1+ | 1990 Stock Option Plan (Incorporated by reference to Exhibit 10(B) to the Registrant’s Quarterly Report on Form 10-Q for the quarter ended January 31, 1998) | |
| 10.2+ | 1999 Stock Plan (Incorporated by reference to Exhibit 10(CC) to the Registrant’s Quarterly Report on Form 10-Q for the quarter ended October 31, 1999) | |
| 10.3+ | STI 2000 Stock Option Plan (Incorporated by reference to Exhibit 4 to the Registrant’s Registration Statement on Form S-8 (File No. 333-106163)) | |
| 10.4+ | 2001 Stock Plan (Incorporated by reference to Exhibit 10(FF) to the Registrant’s Quarterly Report on Form 10-Q for the quarter ended January 31, 2003) | |
| 10.5+ | 2004 Stock Plan (Incorporated by reference to Exhibit 10.15 to the Registrant’s Quarterly Report on Form 10-Q for the quarter ended October 31, 2004) | |
| 10.6+ | 2004 Employee Stock Purchase Plan (Incorporated by reference to Exhibit 4 to the Registrant’s Registration Statement on Form S-8 (File No. 333-111814)) | |
| 10.7+ | Credence Systems Corporation 2005 Stock Incentive Plan, as amended (Incorporated by reference to Exhibit 10.1 to Credence System Corporation’s Current Report on Form 8-K filed on April 7, 2008) | |
| 10.8+ | 2010 Stock Incentive Plan (Incorporated by reference to Appendix A to the Registrant’s Proxy Statement on Schedule 14A filed on November 8, 2010) | |
| 10.9+ | Form of Restricted Stock Unit Agreement under the 2010 Stock Incentive Plan. | |
| 10.10+ | LTX 401(k) Adoption Agreement, Retirement Plan and Trust Agreement (Incorporated by reference to Exhibit 10(F) to the Registrant’s Annual Report on Form 10-K for the fiscal year ended July 31, 2002) | |
| 10.11+ | Summary of Executive Bonus Plan (Incorporated by reference to Exhibit 10.8 to the Registrant’s Quarterly Report on Form 10-Q for the quarter ended January 31, 2006) | |
| 10.12+ | Form of Change of Control Agreement entered into with certain executive officers (Incorporated by reference to Exhibit 10(Y) to the Registrant’s Quarterly Report on Form 10-Q for the quarter ended January 31, 1998) | |
| 10.13+ | Form of Indemnification Agreement between the Registrant and each of its directors and officers (Incorporated by reference to Exhibit 10.1 to the Registrant’s Current Report on Form 8-K filed on September 23, 2008) | |
79
Table of Contents
| Exhibit No. |
Description | |
| 10.14+ | Retention Agreement, dated July 29, 2008, between the Registrant and Mark J. Gallenberger (Incorporated by reference to Exhibit 10.1 to the Registrant’s Current Report on Form 8-K filed on July 29, 2008) | |
| 10.15 | Loan and Security Agreement dated as of December 7, 2006 between the Registrant and Silicon Valley Bank (Incorporated by reference to Exhibit 10.9 to the Registrant’s Quarterly Report on Form 10-Q for the fiscal quarter ended January 31, 2007) | |
| 10.16 | Tender Support Agreement, dated as of April 22, 2009, between the Company and Tradewinds Global Investors, LLC (Incorporated by reference to Exhibit 10.1 to the Registrant’s Current Report on Form 8-K filed on April 22, 2009) | |
| 10.17 | First Loan Modification Agreement, dated as of February 25, 2009, between the Company and Silicon Valley Bank (Incorporated by reference to the Registrant’s Current Report on Form SC TO-I filed on April 22, 2009. | |
| 10.18 | Second Loan Modification Agreement, dated as of March 27, 2009, between the Company and Silicon Valley Bank (Incorporated by reference to the Registrant’s Current Report on Form SC TO-I filed on April 22, 2009. | |
| 10.19 | Third Loan Modification Agreement, dated as of April 22, 2009, between the Company and Silicon Valley Bank (Incorporated by reference to Exhibit 10.2 to the Registrant’s Current Report on Form 8-K filed on April 22, 2009) | |
| 10.20+ | Amended and Restated LTX-Credence Corporation Employee 2004 Stock Purchase Plan (Incorporated by reference as Exhibit 4.1 to the Registrant’s Current Report on Form 8-K filed on July 30, 2009) | |
| 10.21 | Fourth Loan Modification Agreement, dated as of August 5, 2009 between the Company and Silicon Valley Bank (Incorporated by reference to Exhibit 10.1 to the Registrant’s Current Report of Form 8-K filed on August 5, 2009) | |
| 21.1 | Subsidiaries of Registrant | |
| 23.1 | Consent of BDO USA, LLP | |
| 23.2 | Consent of Ernst & Young, LLP | |
| 25.1 | Statement of Eligibility on Form T-1 under the Trust Indenture Act of 1939, as amended (Incorporated by reference to Exhibit 25.1 to the Registrant’s Current Report on Form T-3 filed on February 13, 2009) | |
| 31.1 | Rule 13a-14(a) Certification of Principal Executive Officer | |
| 31.2 | Rule 13a-14(a) Certification of Principal Financial Officer | |
| 32.1 | Certification of Principal Executive Officer and Principal Financial Officer pursuant to 18 U.S.C. §1350 | |
| + | This exhibit is a compensatory plan or arrangement in which executive officers or directors of the Registrant participate. |
Pursuant to Item 601 of Regulation S-K, certain instruments with respect to long-term debt not exceeding 10% of the total assets of the Company and its subsidiaries on a consolidated basis are not filed herewith. The Company hereby agrees to furnish to the Commission a copy of each such instrument upon request.
80
Table of Contents
Shareholder Return on Common Stock
The graph below compares LTX-Credence Corporation’s cumulative 5-year total shareholder return on common stock with the cumulative total returns of the NASDAQ Composite Index and the RDG Semiconductor Composite Index. The graph tracks the performance of a $100 investment in our common stock and in each index (with the reinvestment of all dividends) from 7/31/2006 to 7/31/2011.
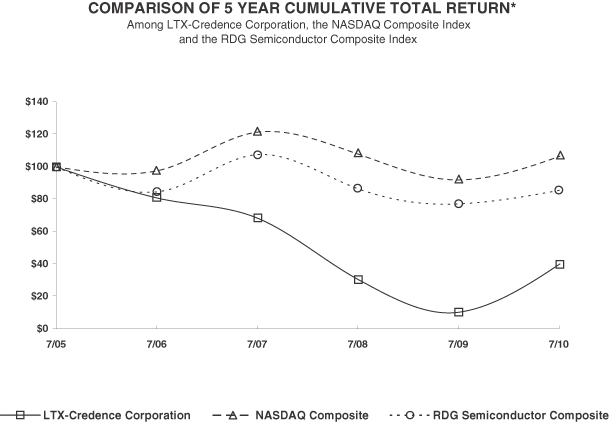
* $100 invested on 7/31/06 in stock or index, including reinvestment of dividends.
Fiscal year ending July 31, 2011
| 7/06 | 7/07 | 7/08 | 7/09 | 7/10 | 7/11 | |||||||||||||||||||
| LTX-Credence Corporation |
$ | 100.00 | $ | 85.16 | $ | 40.45 | $ | 16.70 | $ | 51.95 | $ | 44.47 | ||||||||||||
| NASDAQ Composite |
$ | 100.00 | $ | 124.58 | $ | 114.25 | $ | 98.15 | $ | 112.22 | $ | 137.49 | ||||||||||||
| RDG Semiconductor Composite |
$ | 100.00 | $ | 126.28 | $ | 101.89 | $ | 91.40 | $ | 101.11 | $ | 115.25 | ||||||||||||
The stock price performance included in this graph is not necessarily indicative of future stock price performance.
81