Attached files
| file | filename |
|---|---|
| 8-K - FORM 8-K - Howmet Aerospace Inc. | d243716d8k.htm |
| EX-99.1 - TRANSCRIPT OF ALCOA INC. THIRD QUARTER 2011 EARNINGS CALL - Howmet Aerospace Inc. | d243716dex991.htm |
 3
rd
Quarter 2011 Earnings Conference
October 11, 2011
Exhibit 99.2
[Alcoa logo] |
 Cautionary Statement
2
[Alcoa logo]
rationale
for
the
use
of
the
non-GAAP
financial
measures
can
be
found
in
the
Appendix
to
this
presentation
and
on
our
website
at
www.alcoa.com
under the “Invest”
section. Any reference during the discussion today to EBITDA means adjusted
EBITDA, for which we have provided calculations and reconciliations in the
Appendix and on our website. Forward-Looking Statements
This presentation contains statements that relate to future events and expectations and as such
constitute forward-looking statements. Forward- looking statements include those
containing such words as “anticipates”, “estimates,” “expects,” “forecasts,” “intends,” “outlook,” “plans,” “projects,”
“should,” “targets,” “will,” or other words of similar meaning.
All statements that reflect Alcoa’s expectations, assumptions, or projections about the
future other than statements of historical fact are forward-looking statements, including, without
limitation, forecasts concerning global demand for aluminum, end-market conditions, growth
opportunities for aluminum in automotive, aerospace and other applications or other trend projections,
targeted financial results or operating performance, and statements about Alcoa’s strategies,
outlook, and business and financial prospects. Forward-looking statements are subject
to a number of known and unknown risks, uncertainties, and other factors and are not guarantees of
future performance. Important factors that could cause actual results to differ materially from
those in the forward-looking statements include: (a) material adverse changes in aluminum
industry conditions, including global supply and demand conditions and fluctuations in London Metal
Exchange-based prices for primary aluminum, alumina, and other products, and fluctuations in
indexed-based and spot prices for alumina; (b) global economic and financial market
conditions generally, including the risk of another global economic downturn and uncertainties regarding the
effects of sovereign debt issues or government intervention into the markets to address economic
conditions; (c) unfavorable changes in the markets served by Alcoa, including automotive and
commercial transportation, aerospace, building and construction, distribution, packaging, oil
and gas, defense, and industrial gas turbine; (d) the impact of changes in foreign currency exchange
rates on costs and results, particularly the Australian dollar, Brazilian real, Canadian
dollar, euro, and Norwegian kroner; (e) increases in energy costs, including electricity, natural gas, and
fuel oil, or the unavailability or interruption of energy supplies; (f) increases in the costs of
other raw materials, including caustic soda and carbon products; (g) Alcoa’s inability to
achieve the level of revenue growth, cash generation, cost savings, improvement in profitability and margins, fiscal
discipline, or strengthening of operations (including moving its alumina refining and aluminum
smelting businesses down on the industry cost curve and increasing revenues in its
Flat-Rolled Products and Engineered Products and Solutions segments), anticipated from its productivity
improvement, cash sustainability and other initiatives; (h) Alcoa’s inability to realize expected
benefits from newly constructed, expanded or acquired facilities or from international joint
ventures as planned and by targeted completion dates, including the joint venture in Saudi Arabia; (i)
political, economic, and regulatory risks in the countries in which Alcoa operates or sells products,
including unfavorable changes in laws and governmental policies, civil unrest, or other events
beyond Alcoa’s control; (j) the outcome of contingencies, including legal proceedings,
government investigations, and environmental remediation; (k) the business or financial condition of
key customers, suppliers, and business partners; (l) changes in tax rates or benefits; and (l)
the other risk factors summarized in Alcoa’s Form 10-K for the year ended December 31,
2010, Forms 10-Q for the quarters ended March 31, 2011 and June 30, 2011, and other reports filed
with the Securities and Exchange Commission (SEC). Alcoa disclaims any obligation to
update publicly any forward-looking statements, whether in response to new information,
future events or otherwise, except as required by applicable law. Non-GAAP Financial
Measures Some of the information included in this presentation is derived from
Alcoa’s consolidated financial information but is not presented in Alcoa’s financial
statements prepared in accordance with U.S. generally accepted accounting principles (GAAP). Certain of these data are considered
“non-GAAP financial measures” under SEC rules. These non-GAAP financial
measures supplement our GAAP disclosures and should not be considered an alternative to the
GAAP measure. Reconciliations to the most directly comparable GAAP financial measures and management’s |
 Chuck McLane
Executive Vice President and Chief Financial Officer
[Alcoa logo] |
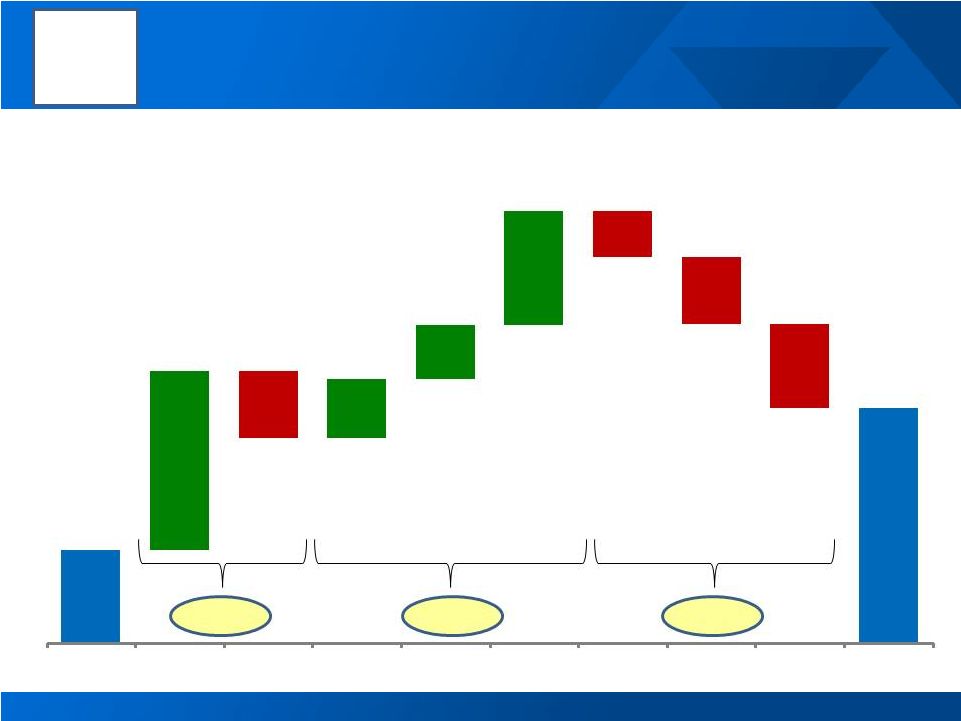
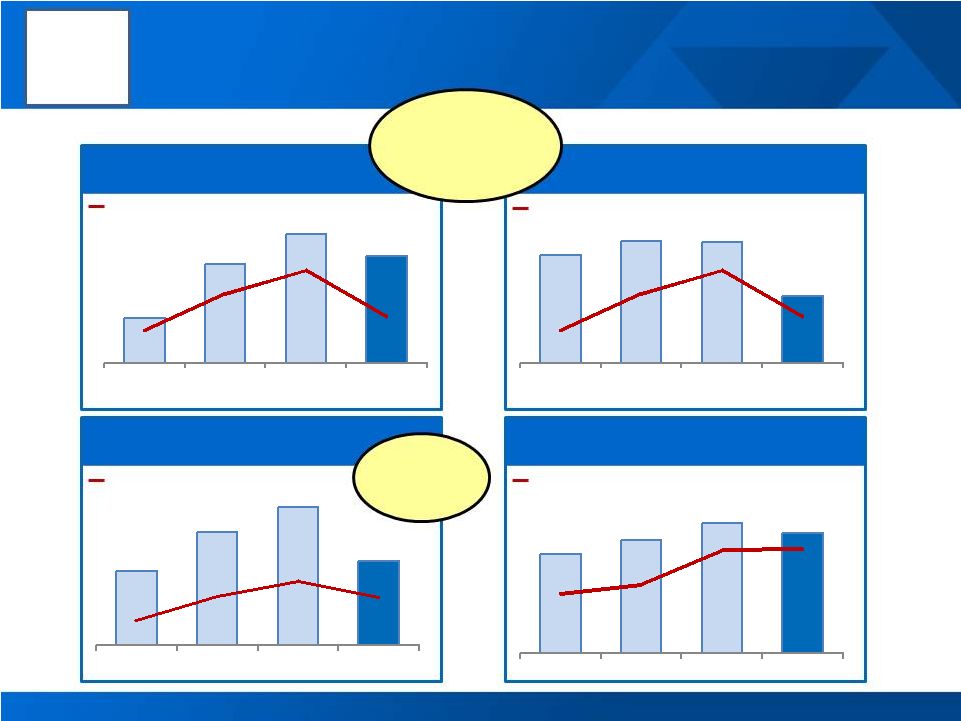 Commodity Price Deflation + European Weakness = Q3 Dip
4
Segment ATOI (US$ Millions)
Alumina
Primary Metals
Flat-Rolled Products
Engineered Products & Solutions
Commodity
Price Deflation
European
market
weakness
Cash LME
Cash LME
Total Shipments
3
rd
Party Revenue
[Alcoa logo]
$53
$81
$99
$60
436
470
491
469
4Q'10
1Q'11
2Q'11
3Q'11
$65
$142
$186
$154
$2,343
$2,500
$2,603
$2,400
4Q'10
1Q'11
2Q'11
3Q'11
$178
$202
$201
$110
$2,343
$2,500
$2,603
$2,400
4Q'10
1Q'11
2Q'11
3Q'11
$113
$130
$149
$138
$1,215
$1,247
$1,370
$1,373
4Q'10
1Q'11
2Q'11
3Q'11 |
 3
rd
Quarter
2011
Financial
Overview
Income
from
Continuing
Operations
of
$172
million,
or
$0.15
per
share
Revenue
down
3%
sequentially
and
up
21%
versus
third
quarter
2010
Adjusted
EBITDA
of
$821
million,
down
21%
sequentially
and
up
36%
versus
third
quarter
2010
13%
Adjusted
EBITDA
Margin,
down
300
basis
points
sequentially
and
up
140
basis
points
versus
third
quarter
2010
Free
Cash
Flow
of
$164
million
Days
Working
Capital
5
days
lower
than
third
quarter
2010
Debt
to
Capital
of
33.7%,
200
basis
points
lower
than
third
quarter
2010
Net
debt
balance
reduced
by
$109
million,
Cash
on
hand
of
$1.3
billion
5
See appendix for reconciliations to GAAP and additional information
[Alcoa logo] |
 Income Statement Summary
$ Millions
3Q’10
2Q’11
3Q’11
Year
Change
Sequential
Change
Sales
$5,287
$6,585
$6,419
$1,132
($166)
Cost of Goods Sold
$4,413
$5,247
$5,290
$877
$43
COGS % Sales
83.5%
79.7%
82.4%
(1.1 % pts.)
2.7 % pts.
Selling, General Administrative, Other
$232
$253
$261
$29
$8
SGA % Sales
4.4%
3.8%
4.1%
(0.3 % pts.)
0.3 % pts.
Restructuring and Other Charges
$2
$34
$9
$7
($25)
Effective Tax Rate
-81.7%
26.3%
19.6%
101.3 % pts.
(6.7 % pts.)
Income from Continuing Operations
$61
$326
$172
$111
($154)
Income Per Diluted Share
$0.06
$0.28
$0.15
$0.09
($0.13)
6
[Alcoa logo] |
 Restructuring and Other Special Items
$ Millions
3Q’10
2Q’11
3Q’11
Income from Continuing Operations
$61
$326
$172
Income Per Diluted Share
$0.06
$0.28
$0.15
Restructuring Related
$1
($16)
($5)
Discrete Tax Items
$38
-
$10
Mark-to-Market Energy Contracts
($29)
$10
$13
Debt Tender Offer
($9)
($32)
-
Sao Luis Power Outage
($23)
-
-
Uninsured Losses
($13)
-
($11)
Special Items
($35)
($38)
$7
Income from Continuing Operations excl Special Items
$96
$364
$165
Income per Diluted Share excluding Special Items
$0.09
$0.32
$0.15
7
See appendix for Adjusted Income reconciliation
[Alcoa logo] |
 $364
$99
$17
$7
$33
$60
$22
$26
$32
$15
$8
$165
2Q11
LME
Currency
Volume
Price /
Mix
Productivity
Energy
Raw
Materials
Cost
Increases
Repair &
Maint
Equity
Earnings
3Q11
3
rd
Quarter 2011 vs. 2
nd
Quarter 2011 Earnings Bridge
8
See appendix for reconciliation
Income from Continuing Operations excluding Restructuring & Other Special Items ($ millions) [Alcoa logo]
-$116m
+$20m
-$103m |
 YTD
2011 vs. YTD 2010 Earnings Bridge 9
See appendix for reconciliation
Income from Continuing Operations excluding Restructuring & Other Special Items ($ millions) 31.8¢
[Alcoa logo]
$336
$645
$241
$210
$196
$411
$167
$240
$304
$846
YTD10
LME
Currency
Volume
Price / Mix
Productivity
Energy
Raw
Materials
Cost
Increases
YTD11
+$404m
+817m
-$711m |
 3Q 10
2Q 11
3Q11
Production (kmt)
4,047
4,144
4,140
3
rd
Party Shipments (kmt)
2,423
2,378
2,256
3
rd
Party Revenue ($ Millions)
717
926
879
ATOI ($ Millions)
70
186
154
Alumina
3rd Quarter Results
4
th
Quarter Outlook
3
rd
Quarter Business Highlights
10
Realized
third-party
alumina
price
down
3%
Days
working
capital
down
7
days
from
Q3
2010
Positive
Currency
impact
of
$16
million
as
the
US$ strengthened
Higher
caustic
and
energy
prices
Productivity
and
volume
offset
higher
costs
20%
of
3
rd
party
shipments
on
spot
or
prior-
month indexed basis
Other
pricing
to
follow
two-month
lag
on
LME
Productivity
improvements
to
continue
Caustic
inflation
to
continue,
offset
by
moderating fuel oil costs
3
rd
Quarter Performance Bridge
See appendix for reconciliations to GAAP and additional information
$ Millions
market
performance
cost increases
[Alcoa logo]
-$14m
-$38m
$39m
-$19m
$186
$154
($35)
$16
$12
$24
$3
($9)
($15)
($14)
($14) |
 3Q 10
2Q 11
3Q 11
Production (kmt)
891
945
964
3
rd
Party Shipments (kmt)
708
724
754
3
rd
Party Revenue ($ Millions)
1,688
2,145
2,124
3
rd
Party Price ($/MT)
2,261
2,830
2,689
ATOI ($ Millions)
78
201
110
Primary Metals
3
rd
Quarter Highlights
3
rd
Quarter Business Highlights
4
th
Quarter Outlook
11
Realized
pricing
down
5%
sequentially
Days
working
capital
down
5
days
from
Q3
2010
Higher structural energy costs in Europe
Productivity
benefits
offset
raw
material
increases
U.S.
restarts
deliver
profitable
results
Positive
Currency
impact
of
$9
million
as
the
US$
strengthened
Pricing
to
follow
15-day
lag
to
LME
Productivity
benefits to continue
Higher
energy
costs
expected
with
seasonal
price increases and Rockdale planned outage
Carbon
price
inflation
expected
to
continue
3
rd
Quarter Performance Bridge
$ Millions
-$83m
$24m
market
performance
-$14m
-$18m
cost increases
[Alcoa logo] |
 12
4
th
Quarter Outlook
3
rd
Quarter Business Highlights
3
rd
Quarter Results
ATOI $ Millions
3Q 10
2Q 11
3Q 11
Flat-Rolled Products,
excl Russia, China & Other
61
86
56
Russia, China & Other
5
13
4
Total ATOI
66
99
60
ATOI down from all-time highs in Q2 driven by
significant market decline in Europe
Total negative impact of $28 million in Europe
due to seasonal summer plant shutdowns and
weakening market conditions
Productivity
improvements
lessen
impact
of
rising costs
Aerospace
and
automotive
demand
remain
strong
Seasonal beverage can packaging decline
European
weakness
expected
to
continue
Productivity
gains
to
mitigate
rising
costs
Progress toward 2013 $2.5 billion incremental
revenue
target,
50
to
60%
during
2011
3
rd
Quarter Performance Bridge
Flat-Rolled Products
See appendix for reconciliations to GAAP and additional information
$ Millions
[Alcoa logo] |
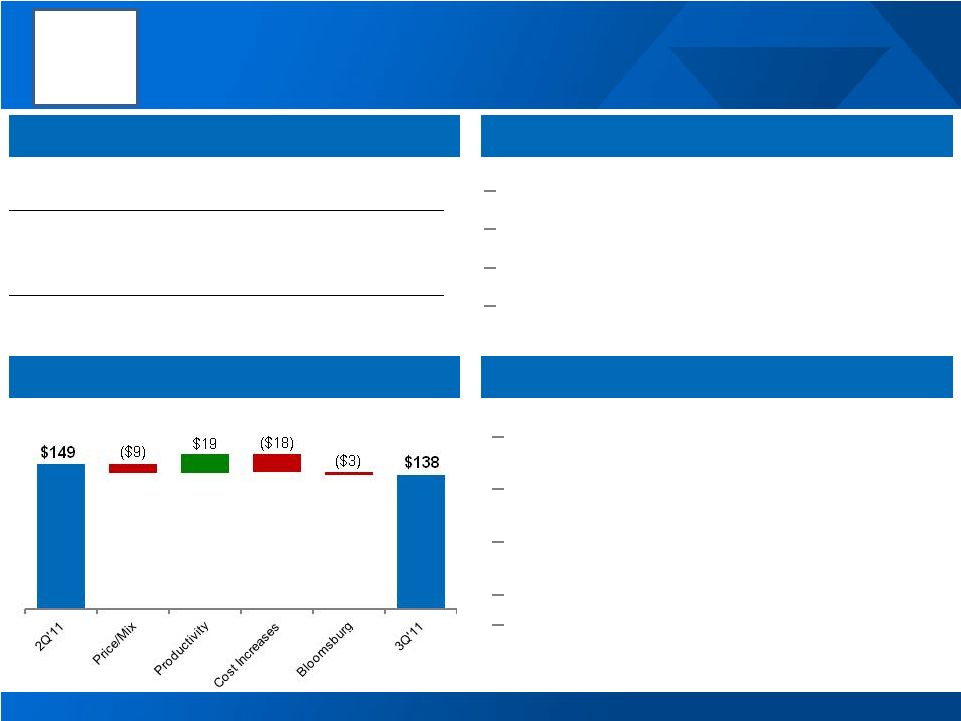 $
Millions 3Q 10
2Q 11
3Q 11
3
rd
Party Revenue
1,173
1,370
1,373
ATOI
114
149
138
Adjusted EBITDA Margin
18%
19%
18%
Engineered Products and Solutions
13
3
rd
Quarter Performance Bridge
$ Millions
3
rd
Quarter Business Highlights
3
rd
Quarter Results
17%
revenue
growth
from
Q3
2010
21%
improvement
in
ATOI
from
Q3
2010
Days
working
capital
down
2
days
from
Q3
2010
$3M
unfavorable
ATOI
impact
due
to
Bloomsburg
flood
4
th
Quarter Outlook
See appendix for reconciliations to GAAP and additional information
Building
&
construction
market
continuing
to
decline
Commercial
transportation
market
weakening
in
Europe
Share
gains
through
innovation
continue
across
all market sectors
Productivity
gains
will
continue
Progress toward 2013 $1.6 billion incremental
revenue
target,
30
to
35%
during
2011
[Alcoa logo] |
 ($
Millions) 3Q’10
2Q’11
3Q’11
Net Income
$109
$377
$225
DD&A
$358
$375
$377
Change in Working Capital
$213
($110)
($94)
Pension Contributions
($26)
($72)
($114)
Taxes / Other Adjustments
($262)
$228
$95
Cash from Operations
$392
$798
$489
Dividends to Shareholders
($31)
($32)
($33)
Change in Debt
($555)
$30
$72
Distributions to Noncontrolling Interest
($41)
($90)
($66)
Contributions from Noncontrolling Interest
$57
$7
$8
Other Financing Activities
($4)
$0
($8)
Cash from Financing Activities
($574)
($85)
($27)
Capital Expenditures
($216)
($272)
($325)
Other Investing Activities
($128)
($78)
($42)
Cash from Investing Activities
($344)
($350)
($367)
14
3Q’11 FCF
$164 million
$1.3 billion
of cash
Debt-to-Cap
in target
range at
33.7%
DWC better
by 5 Days
from 3Q
2010
See appendix for Free Cash Flow reconciliation
3
rd
Quarter 2011 Cash Flow Overview
[Alcoa logo] |
 Sustainable Reductions in Days Working Capital
15
3Q
2009
3Q
2010
3Q
2011
Sustained
historically low
days working
capital
performance
3Q
2009
3Q
2010
3Q
2011
3Q
2009
3Q
2010
3Q
2011
3Q
2009
3Q
2010
3Q
2011
3Q
2009
3Q
2010
3Q
2011
[Alcoa logo] |
 2011 Cash Sustainability Operational Targets and Actual Performance
16
Sustaining Capital
Growth Capital
Ma’aden Invest
$400
Debt-to-Cap
$197
$ Millions
$ Millions
%
2010
Actual
2011
Target
2011
YTD
$165
35.0%
34.9%
2010
Actual
2011
Target
2011
YTD
33.7%
$500
$445
2010
Actual
2011
Target
2011
YTD
$262
$570
2010
Actual
2011
Target
2011
YTD
$539
Free Cash Flow
$ Millions
$0
$1,246
$250
2010
Actual
2011
Target *
2011
YTD
30.0%
•Target is to be free cash flow positive. See appendix for Free Cash
Flow reconciliation We Are Focused on Achieving Our 2011 Goals
[Alcoa logo]
$1,000
$ Millions |
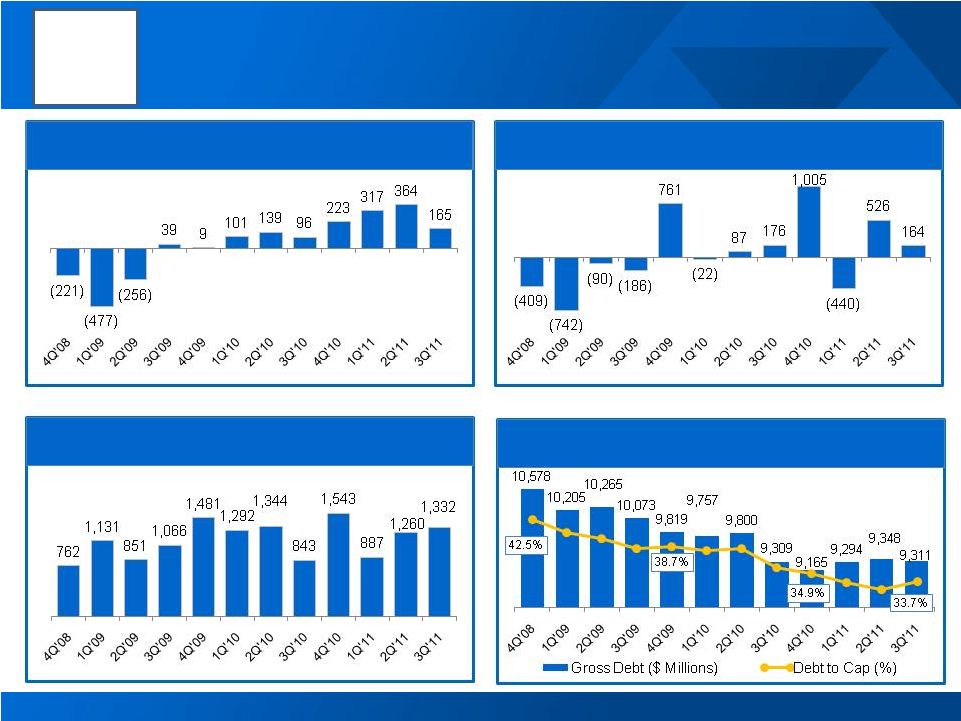 Alcoa Enters Uncertain Times Stronger And More Resilient
17
Improved Performance in our Businesses
Improved Generation of Free Cash Flow
$1b Less Debt and 10% Lower Debt to Cap
Income from Continuing Operations
excluding restructuring and specials
($ Millions)
Free Cash Flow
($ Millions)
Significant Cash on Hand
Cash on Hand
($ Millions)
See appendix for reconciliations to GAAP and additional information
[Alcoa logo] |
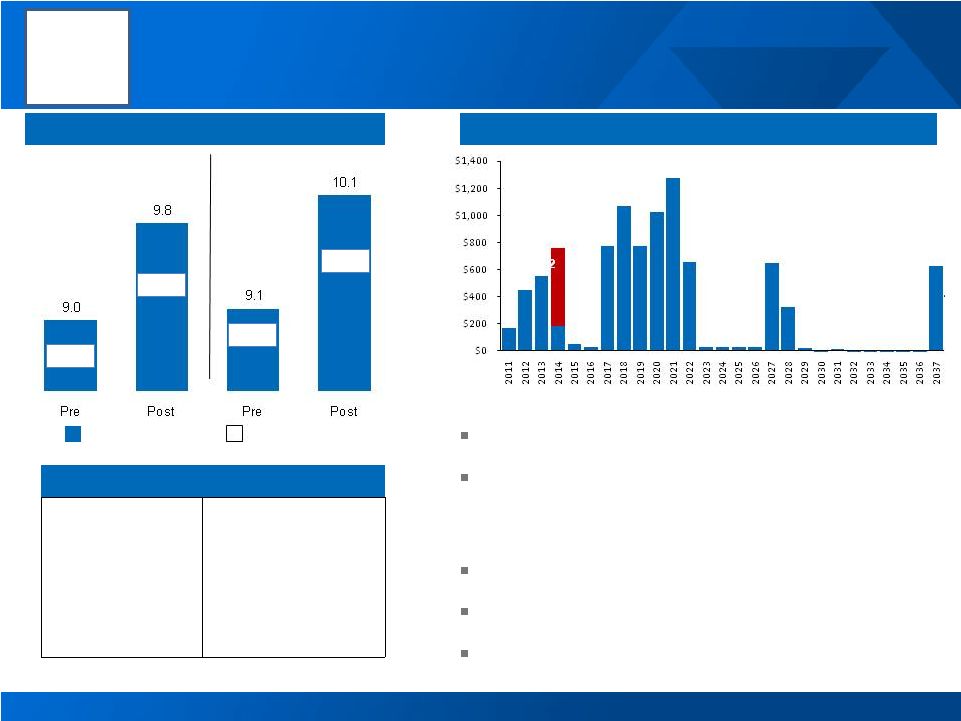 Management Actions Have Led to Improved Liquidity Position
18
Impacts of Refinancing
1
Strong
demand
for
Alcoa
debt
August 2010 and April 2011 issuances
increased
average
debt
maturity
to
10.1
years
Issued
10-year
funds
in
2011
at
5.4%
$1.5B
in
maturities
over
the
next
5
years
1
5-year
credit
facility
completed
successfully
Long-Term
Debt
Maturity
Profile
($millions)
2011 New Issue
2010 New Issue
Close Date
July 25, 2011
Capacity
$3.75B
Tenor
5 years
(July 2016 expiration)
Drawn Amount
$0
Revolving Credit Facility
2
1
Considers convertible debt as equity
2014 Convertible Debt
Weighted life in years
Weighted interest rate
[Alcoa logo]
5.8%
5.5%
5.6%
5.3%
2 |
 [Alcoa logo]
Klaus Kleinfeld
Chairman and Chief Executive Officer |
 3%
4%
6%
6%
5%
5%
17%
7%
12%
17%
Russia
Brazil
Asia w/o China
North America
Europe
China
2010 vs. 2011
2011 Estimated Consumption
10%
21%
16%
*Other
44.3
2010 Actual
2011 Forecast
20
2010 Global Demand
Growth Rate: 13%
2011 Global Demand
Growth Rate 12%
vs. 2010
(2011 ex China:
8%) India
6%
12%
*Other consists of: Middle East, Latin America ex Brazil, and Rest of World
including unallocated global increase 14%
Global Aluminum Demand in 2011 Remains Strong…
0.9
1.0
[Alcoa logo]
2011 Projected Primary Aluminum Consumption (mmt) and Growth Rates (%) by Region |
 Russia
Brazil
Asia w/o China
North America
Europe
China
2H 2011 vs. 1H 2011
2011 Estimated Consumption
*Other
44.3
Decelerating
growth in 2H
Accelerating
growth in 2H
21
India
*Other consists of: Middle East, Latin America ex Brazil, and Rest of World
including unallocated global increase …With
Asia
Compensating
for
Western
Weakness
in
2
nd
Half
0.9
1.0
Net Increase 4%
2H 2011 vs. 1H 2011
Reaffirms 12%
year-on-year
growth 2011 versus 2010
Net Increase = 4%
-13%
-5%
-11%
2%
10%
15%
5%
[Alcoa logo]
19.3
6.8
5.7
5.4
3.4
1.8
4%
2011 Projected Primary Aluminum Consumption (mmt) and 2H vs. 1H 2011 Growth Rates (%)
|
 30
10
60
Regional Physical Markets Remain Tight
LME at 38
days
Non-LME at
15 days
53 days of
consumption
22
Regional Premiums Signal Strong Demand
Inventories 6 days Lower Year-on-Year
Global
Inventories
Drop 3 days vs.
2Q’11
$119 /MT
$200 /MT
$181 /MT
Source: Alcoa estimates, LME, SHFE, IAI, Marubeni, Platt’s Metals Week and
Metal Bulletin [Alcoa logo]
0
20
40
50
70
80
LME
China
Japan Port
Producer
0
1
2
3
4
5
6
7
8
9
10
Midwest
Japan
Europe |
 Western
World
Annualized Production (May 2011)
25,600
Restarted and Expanded Capacity
400
Total Supply
26,000
Western World Consumption
(24,971)
(Deficit) Surplus
1,029
China
Annualized Production (May 2011)
18,000
Restarted and Expanded Capacity
500
Total Supply
18,500
Consumption
(19,300)
(Deficit) Surplus
(800)
2011 Aluminum: China Deficit Counteracts Western Surplus
23
China
Western World
Production
Demand
Surplus
Source: Alcoa estimates, Brook Hunt, CRU, CNIA, IAI
Deficit
Production
Demand
2011E Primary Aluminum Supply / Demand Balance (in kmt)
229 kmt
global surplus
[Alcoa logo] |
 2011 Global Alumina Balance Remains At Equilibrium
24
Source: Alcoa estimates, Brook Hunt, CRU, CNIA, IAI
China
Western World
2011 Annualized Production
34,200
Imports from Western World
1,600
Supply
35,800
Demand
(35,800)
(Deficit) / Surplus
0
2011 Annualized Production
53,800
Exports to China
(1,600)
Supply
52,200
Demand
(52,200)
(Deficit) / Surplus
0
Production
Demand
2011E Alumina Supply / Demand Balance (in kmt)
[Alcoa logo]
Balanced |
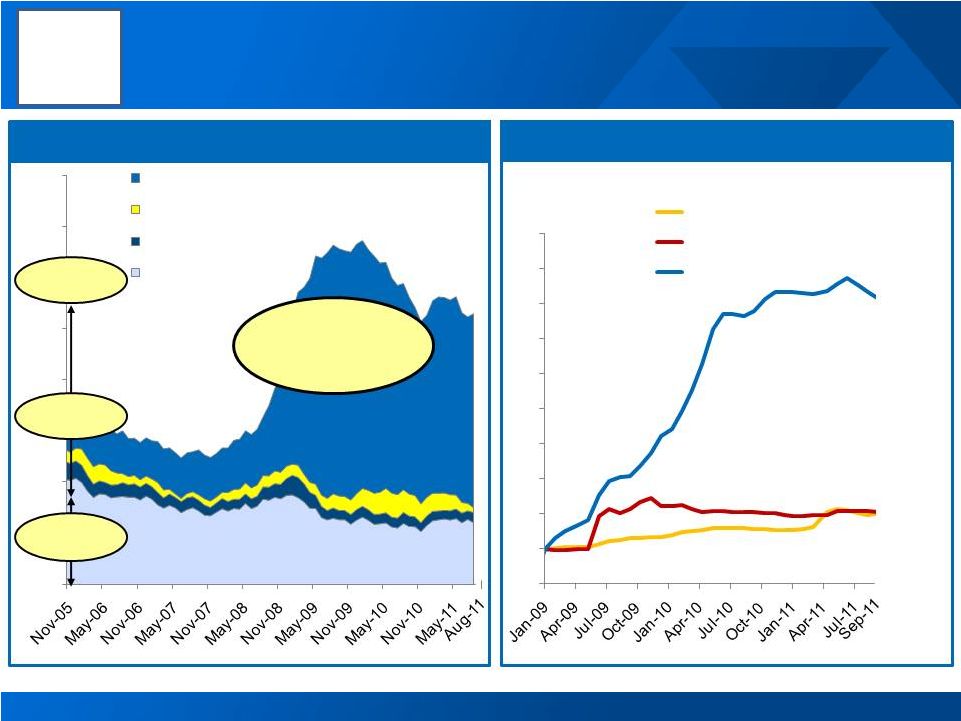
 A
Tale of Two Markets…. 25
2008/2009: Best of times (or close to it)…
…worst of times
-232kMT
-3,383kMT
2008
2009
Global Demand
Destruction
Weakening
Physical Markets
Regional Premiums
Europe
Japan
USA
$57
$32
$90
$81
$116
$76
2011: The world is not the same
Open Interest
LME Aluminum
18.2m
$3,323
16.2m
$1,342
Financial
Bias
Bearish
Defensive
Liquidation
16.6m
$2,513
20.1m
$2,243
Financial
Bias
Bearish
Offensive
Short
Selling
But Physical Markets
Remain Strong
$215
$187
$181
$200
$121
$119
Europe
Japan
USA
+5,268kMT
+4,700kMT
2010
2011
Continued
Demand Growth
Open Interest
LME Aluminum
Regional Premiums
Source: Alcoa estimates, CRU, LME, Platt’s Metals Week and Metal Bulletin
[Alcoa logo]
Jan-08
Apr-08
Jul-08
Oct-08
Jan-09
7/10/08
9/10/08
11/10/08
1/10/09
Jun-11
Jul-11
Aug-11
Sep-11
7/19/11
8/19/11
9/19/11 |
 Leading Market Indicators Have Softened…
26
Sources: International Monetary Fund; Oxford Economics *Confidence figures set at
100 in January 2011 for comparability 1
EC
Commission
EU
Confidence
National
Bureau
of
Statistics
China
Consumer
Confidence
University
of
Michigan
Consumer
Sentiment
[Alcoa logo]
2
3 |
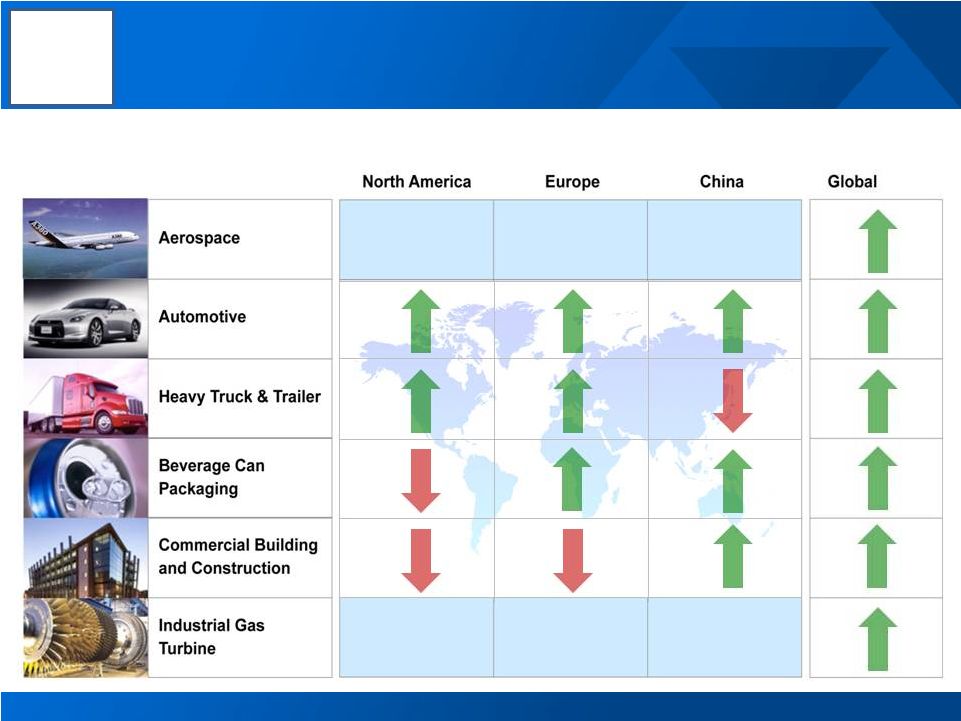 …Still, Growth Continues in 2011…
27
Alcoa End Markets: Current Assessment of 2011 vs. 2010 Conditions
Source: Alcoa analysis
8%-10%
sales growth
1%-2%
sales growth
4%-6%
sales growth
60%-63%
sales growth
26%-29%
sales growth
4%-5%
sales growth
10%-12%
sales growth
10%-12%
sales decline
4%-6%
sales decline
3%-4%
sales decline
10%-16%
sales decline
15%-20%
sales growth
[Alcoa logo]
3%-5%
sales growth
0%-2%
sales growth
2%-3%
sales growth
5%-10% build
rate growth
6%-7%
sales growth
1%-3%
sales growth |
 …with Slowing Growth in 2H
28
Alcoa End Markets: Current Assessment of Market Conditions by Semesters
1H 2011
vs
2H 2010
2H 2011
vs
1H 2011
Key:
Source:
Alcoa
analysis;
**Japanese
earthquake
impact
1H
2011
vs.
2H
2010
[Alcoa logo]
**
10%-12%
1%-3%
5%-10%
4%
0%
28%
23%
0%
-2%-3%
-9%
-3%-4%
14%
-16%
14%
-11%
6%
2%-3%
-4%
-2%-4%
10%-15%
15%-20%
-4%
12%
-4%
4%
10%
-14%
5%
-24%
2%-3%
2%-3%
2%
2% |
 Deteriorating European Conditions Impact Flat-Rolled Segment
29
Alcoa Flat-Rolled Product Orders (12 month rolling average)
Indexed to Q1 2010
Europe
China
FRP Orders: Marked Slowdown in Europe
North
America
1.40
1.50
1.30
1.20
1.10
1.00
0.90
0.80
-20%
Q-o-Q
-1%
Q-o-Q
+2%
Q-o-Q
[Alcoa logo]
Q1
2010
Q2
2010
Q3
2010
Q4
2010
Q1
2011
Q2
2011
Q3
2011 |
 +$411m vs. 2010
-0.4% pts
vs. 2010
2009: Seven Promises
2011: Prepared for Turbulence
Alcoa Today: Stronger and More Resilient
Operational
•
Productivity
•
Overhead Reductions
•
Capital Expenditures
(including Ma’aden)
•
Working Capital
Financial / Strategic
•
Leading Positions
•
Strong Debt
Maturity Profile
-42% vs. 2007
85% #1 or #2
in their businesses
$1.5b due over
next 5 years
-5 days vs. 2010
30
[Alcoa logo] |
 Actively
Managed
Portfolio
Capacity
Optimization
Right-Sized
Workforce
Additional
flexibility
R&D
technology
refocus
Share growth
Procurement
savings
Company-
wide over-
head reduction
Increased
debt capacity
Speedy execution
Focus on cash and bottom line
Capital spend reduction
T U R
N M A N A G
Our Crisis Management Toolbox Is Ready for Rapid Deployment
31
[Alcoa logo]
Alcoa Advantage
creating value for
all businesses
–
Talent
–
Technology
–
Customer Intimacy
–
Purchasing
–
Operating System
Profitable Growth
in every business
Business Programs
that
define:
–
3-year aspirations
–
Priority levers
–
Accountability
Alcoa Advantage
creating value for
all businesses
–
Talent
–
Technology
–
Customer Intimacy
–
Purchasing
–
Operating System
in every business
Business Programs
that
define:
–
3-year aspirations
–
Priority levers
–
Accountability
Disciplined Execution
across all activities |
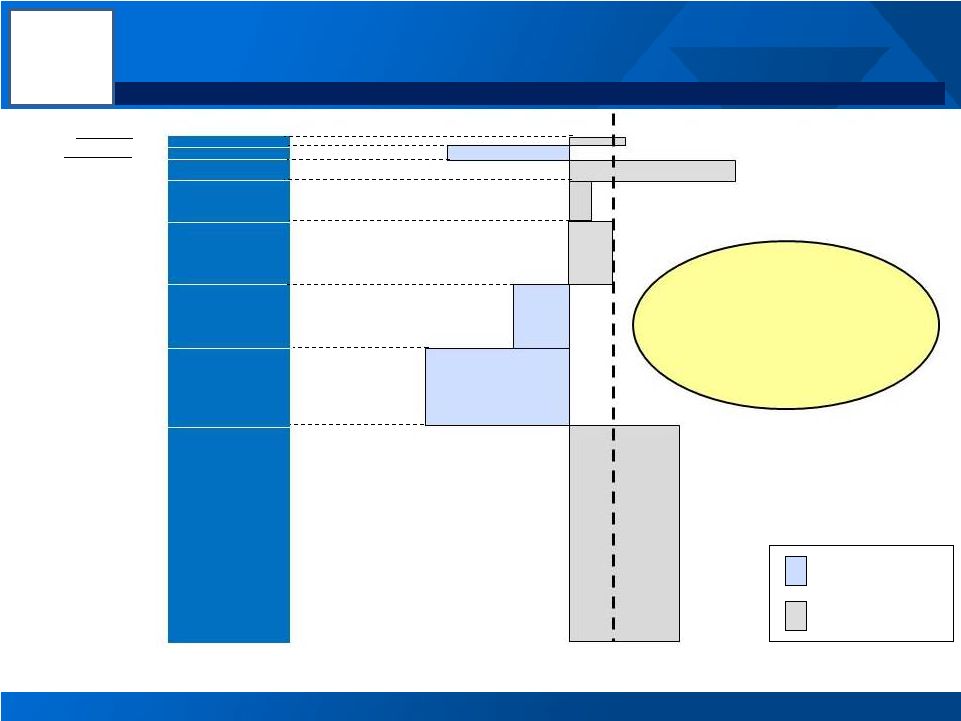
 Alcoa Did Not Compromise Its Future In The Last Downturn…
Alcoa
capital
expenditure
on
growth
projects,
2008
–
2009,
in
US$
32
Asset
Swap
$830m
Investment
$130m
Investment
$80m
Investment
$970m
Investment
Mosjoen
&
Lista,
Norway
–
Smelter
São Luis, Brazil –
Alumina Refinery
Bohai,
China
–
Flat
Rolled
Products
Samara, Russia –
End & Tab Line
Juruti,
Brazil
–
Bauxite
Mine
[Alcoa logo] |
 …And Has Not Lost True North Of Accelerating Value
Environment
Energy consumption rising
–
Increase of 54% by 2025
–
Driven by developing countries
Personal transport rising
–
Increase of 40% by 2030
Greenhouse gas regulation
Light Weight
High
Strength
Durable
Highly
Conductive
Non-Corrosive
Malleable
Recyclable
Relative
Value
Demographics
Urbanization
…Demanding the Right Solutions…
…Targeting Profitable Growth
The World is Changing…
Global population rising
–
2006: 6.6 billion
–
2025: 7.9 billion
–
2050: 9.1 billion
Population in cities
–
2006: > 50%
–
2030: > 60%
33
Alcoa Innovations
[Alcoa logo] |
 Changing Regulations Drive Al Penetration In Automotive
Source: The Aluminum Association, Ducker Research / Alcoa Analysis
Changing Regulations…
…And Drive Substitution
34
US Corporate Average
Fuel Economy (MPG)
Global Auto Body Sheet
Consumption (KMT)
[Alcoa logo]
KMT
…Create Opportunities…
Aluminum Penetration
Opportunities
100%
increase
31%
increase
White House
Proposal
Substitution
potential of
>15MMT
7.5X
increase
27.2
35.5
54.5
2011
2016
2025
0
2,000
4,000
6,000
8,000
10,000
12,000
Currently Aluminum
Aluminum Opportunity
200
800
1,500
2011
2016
2020 |
 Aerospace: Vibrant Growth Projected Over Long & Near Terms
35
2030
Replacement
Growth
2020
Existing fleet
…Driven by Travel Demand + Aging Fleet
Commercial Airline Fleet
(thousand units)
Sources: 1) Boeing 2011 Commercial Market Outlook, 2)
The Airline Monitor and OEM websites Notes: All figures include both
Large Commercial Aircraft & Regional Jets; $ Value of deliveries expressed in then-year dollars
Strong Orders and Deliveries…
Commercial Jet Deliveries
16,000
planes
33,000
new planes
Build rate of
1,675 units
per year
[Alcoa logo]
4% CAGR
Units
$B Value
9% CAGR
16% CAGR
Backlog: ~8
years of
production at
2010 rates
21
16
11
5
9
11
24
2010
1,097
1,190
1,360
1,440
1,550
$63
$71
$90
$100
$114
2010
2011
2012
2013
2014 |
 Aluminum In The Frame For Years To Come
36
A320Neo
B737-MAX
Improving Performance…
~50%
lower
fuel
use
per
seat
than
last
generation
15
to
16%
lower
fuel
use
per
seat
than
current
generation
Demonstrated
market
appeal
--
1,700+
orders
/
commitments
already
captured
…Great for Aluminum & Alcoa
Aluminum
proprietary
alloys
specified
for
both
models
Meets/exceeds
all
performance
requirements
regarding
weight,
strength
and
maintenance
goals
At
far
less
risk
to
schedules,
budgets
and
technical
complexity
Alcoa
continues
to
grow
per-platform
content
Content
on
nearly
every
major
aircraft
Developed
90%
of
aerospace
alloys
in
use
Best-Selling Aircraft
1
MD-80,
737-Classic
2
A320,
B737-NG
[Alcoa logo]
1
2
its |
 37
Potlines
Cathode Sealing Plant
Port
Rolling Mill Construction
Refinery Earth Work
Ma’aden Alcoa Project Progresses On Schedule and Budget
[Alcoa logo] |
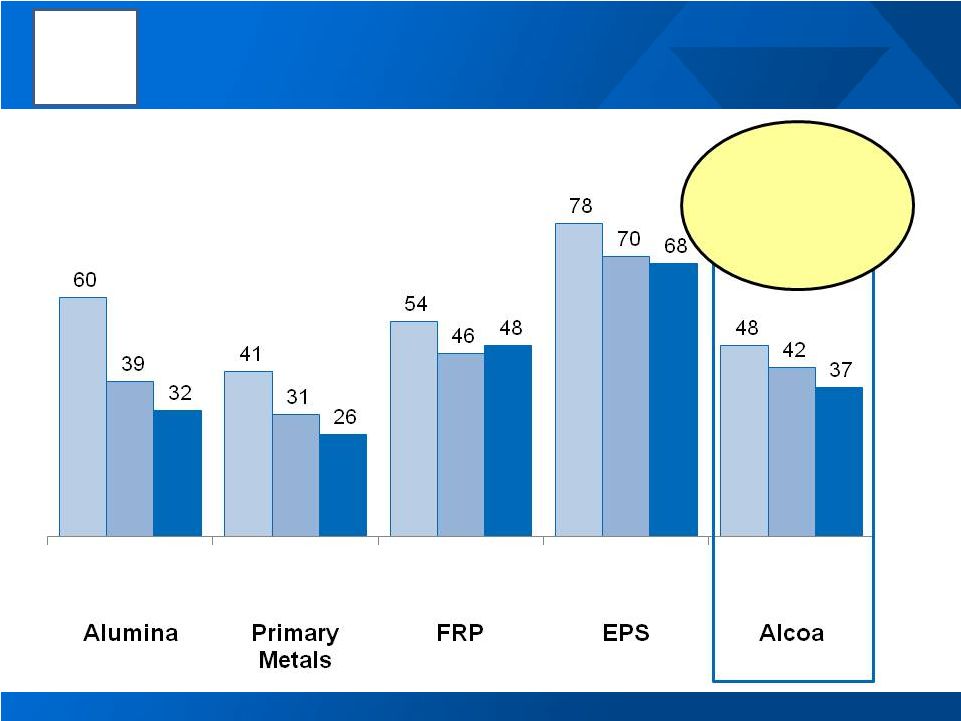
 Segment Dashboard: Price & Market Pressure Impact Results
38
See appendix for Adjusted EBITDA reconciliations
LME
Adjusted EBITDA/MT
LME
Adjusted EBITDA/MT
541
495
479
531
620
536
498
254
224
551
173
193
147
Adjusted EBITDA $Millions
Adjusted EBITDA Margin
436
287
356
495
536
676
783
922
630
762
229
261
245
Adjusted EBITDA $Millions
Adjusted EBITDA Margin
460
321
336
418
398
784
626
392
(159)
320
438
422
283
1,447
1,350
1,433
1,719
1,900
2,570
2,641
2,572
1,664
2,173
2,500
2,603
2,400
2001
2002
2003
2004
2005
2006
2007
2008
2009
2010
2011
Q1
2011
Q2
2011
Q3
10 YR Average ~
$390/MT
Primary Metals: Margin Compression
11%
8%
9%
12%
11%
12%
13%
15%
13%
17%
18%
19%
18%
2001
2002
2003
2004
2005
2006
2007
2008
2009
2010
2011 2011
Q1
Q2
2011
Q3
Eng. Products & Solutions: Continued Strength
62
44
48
68
75
110
104
81
20
47
71
81
75
1,447
1,350
1,433
1,719
1,900
2,570
2,641
2,572
1,664
2,173
2,500
2,603
2,400
2001
2002
2003
2004
2005
2006
2007
2008
2009
2010
2011
Q1
2011
Q2
2011
Q3
10 Yr Average ~ $66/MT
Alumina: Maintaining 2011 Margins
11%
11%
10%
9%
9%
6%
5%
3%
4%
9%
9%
9%
7%
2001
2002
2003
2004
2005
2006
2007
2008
2009
2010
2011
Q1
2011
Q2
2011
Q3
Flat-Rolled Products: European Weakness
[Alcoa logo] |
 Managing Through Uncertainty –
Focused on True North
Opportunity in the Face of Uncertainty
Meeting our Aggressive Targets
EPS: $1.6b in Revenue Growth by 2013 ($b)
GRP: $2.5b in Revenue Growth by 2013 ($b)
See appendix for reconciliations to GAAP and additional information
$1.1 to $1.2
End Markets Slow
In Second Half
Continued Growth
In Aluminum Demand
Prepared for
Uncertain Times…
…but Focused on
Our True North
[Alcoa logo]
$4.6
$4.0
$6.2
2010
2011
YTD
2013
Target
$6.3
$6.0
$8.8
2010
2011
YTD
2013
Target
$1.6 to $1.8
39 |
 40
[Alcoa logo]
[Alcoa logo] |
 Roy Harvey
Director, Investor Relations
390 Park Avenue
New York, NY 10022-4608
Telephone: (212) 836-2674
www.alcoa.com
Additional Information
41
[Alcoa logo]
[Alcoa logo] |
 Annual Sensitivity Summary
42
Currency Annual Net Income Sensitivity
+/-
$100/ = +/
-
$200
Million
LME Aluminum Annual Net Income Sensitivity
Australian $
+/-
$10 million
per 0.01 change in USD / AUD
Brazilian $
+/-
$ 3 million
per 0.01 change in BRL / USD
Euro €
+/-
$ 2 million
per 0.01 change in USD / EUR
Canadian $
+/-
$ 4 million
per 0.01 change in CAD / USD
Norwegian Kroner
+/-
$ 6 million
per 0.10 change in NOK / USD
[Alcoa logo] |
 Revenue Change by Market
3Q’11 Third-Party Revenue
Sequential
Change
Year-Over-Year
Change
43
13%
3%
6%
6%
4%
2%
14%
5%
14%
33%
Aerospace
Automotive
B&C
Comm. Transport
Industrial Products
IGT
Packaging
Distribution/Other
Alumina
Primary Metals
2%
(7%)
(5%)
6%
(6%)
0%
(4%)
(13%)
(5%)
(1%)
20%
26%
9%
44%
1%
11%
21%
14%
23%
26%
[Alcoa logo] |
 Reconciliation of ATOI to Consolidated Net (Loss) Income
Attributable to Alcoa
44
[Alcoa logo]
(in millions)
1Q10
2Q10
3Q10
4Q10
201
0
1Q11
2Q11
3Q11
Total
segment ATOI
$ 306
$ 381
$ 328 $
409
$ 1,424
$
555
$
63
5
$
462
Unallocated amounts (net of tax):
Impact of
LIFO
(14)
(3)
(2)
3
(16)
(24)
(27)
2
Interest expense
(77)
(77)
(91)
(76
)
(321)
(72)
(106
)
(81)
Noncontrolling
interests
(22)
(34)
(48)
(34)
(138
)
(58)
(55
)
(53
)
Corporate expense
(67)
(59)
(71)
(94)
(291)
(67)
(76)
(76)
Restructuring and other charges
(122)
(21)
1
8
(134)
(6)
(22
)
(7
)
Discontinued operations
(7)
(1)
–
–
(8)
(1)
(4)
–
Other
(198)
(50)
(56)
42
(262)
(19)
(23
)
(75
)
Consolidated net
(loss) income
attributable to
Alcoa
$ (201)
$ 136
$
61
$
258
$ 254
$ 308
$ 322
$ 172 |
 Income (loss) from
continuing operations attributable to Alcoa – as adjusted is a non-GAAP financial measure. Management believes that this measure is meaningful to investors because management reviews the operating results of Alcoa
excluding the impacts of restructuring and other charges, discrete tax items, and other special items
(collectively, “special items”). There can be no assurances that additional special items will not occur in future periods. To compensate for this
limitation, management believes that it is appropriate to consider both Income (loss) from continuing
operations attributable to Alcoa determined under GAAP as well as Income (loss) from continuing operations attributable to Alcoa – as
adjusted.
* Discrete tax items include the following:
for the quarter ended September 30, 2011, a net benefit for adjustments made related to the filing of
2010 tax returns in various jurisdictions ($5) and a net benefit for other miscellaneous items ($5);
for the quarter ended December 31, 2010, a benefit for the reversal of the remaining valuation
allowance related to net operating losses of an international subsidiary ($16) (a portion was initially reversed in the quarter ended September 30, 2010) and a net
benefit for other small items ($2);
for the quarter ended September 30, 2010, a benefit for the reversal of a valuation allowance related
to net operating losses of an international subsidiary that are now realizable due to a settlement with a tax authority ($41), a charge for a tax rate change in
Brazil ($11), and a benefit for the recovery of a portion of the unfavorable impact included in the
quarter ended March 31, 2010 related to unbenefitted losses in Russia, China, and Italy ($8);
for the quarter ended June 30, 2010, a benefit for a change in a Canadian provincial tax law
permitting tax returns to be filed in U.S. dollars ($24), a charge based on settlement discussions of several matters with international taxing authorities ($18), and a
benefit for the recovery of a portion of the unfavorable impact included in the quarter ended March
31, 2010 related to unbenefitted losses in Russia, China, and Italy ($10); and, for the
quarter ended March 31, 2010, charges for a change in the tax treatment of federal subsidies received related to prescription drug benefits provided under certain retiree health benefit plans ($79), unbenefitted losses in Russia, China, and Italy
($22), interest due to the IRS related to a previously deferred gain associated with the 2007
formation of the former soft alloy extrusions joint venture ($6), and a change in the anticipated sale structure of the Transportation Products Europe business ($5).
** Other special items include the following:
for the quarter ended September 30, 2011, favorable mark-to-market changes in certain power
derivative contracts ($13) and uninsured losses, including costs related to flood damage to a plant in Pennsylvania caused by Hurricane Irene, ($11);
for the quarter ended June 30, 2011, a net charge comprised of expenses for the early repayment of
Notes set to mature in 2013 due to the premiums paid under the tender offers and call option and gains from the termination of related “in-the-money” interest
rate swaps ($32) and favorable mark-to-market changes in certain power derivative contracts
($10); for the quarter ended March 31, 2011, costs related to acquisitions of the
aerospace fastener business of TransDigm Group Inc. and full ownership of carbothermic smelting technology from ORKLA ASA ($8) and favorable mark-to-market changes in certain
power derivative contracts ($5);
for the quarter ended December 31, 2010, favorable mark-to-market changes in certain power
derivative contracts; for the quarter ended September 30, 2010, unfavorable
mark-to-market changes in certain power derivative contracts ($29), recovery costs associated with the São Luís, Brazil facility due to a power outage and failure of a ship unloader in the first half of 2010
($23), restart costs and lost volumes related to a June 2010 flood at the Avilés smelter in Spain
($13), and a net charge comprised of expenses for the early repayment of Notes set to mature in 2011 through 2013 due to the premiums paid under the tender
offers and call option and gains from the termination of related “in-the-money”
interest rate swaps ($9); for the quarter ended June 30, 2010, favorable mark-to-market
changes in certain power derivative contracts ($22), a charge for costs associated with the potential strike and successful execution of a new agreement with the United Steelworkers ($13), and a
charge related to an unfavorable decision in Alcoa’s lawsuit against Luminant related to the
Rockdale, TX facility ($7); and, for the quarter ended March 31, 2010, charges related to
unfavorable mark-to-market changes in certain power derivative contracts ($31), power outages at the Rockdale, TX and São Luís, Brazil facilities ($17), an additional environmental accrual for the Grass
River remediation in Massena, NY ($11), and the write off of inventory related to the permanent
closures of certain U.S. facilities ($5). Reconciliation of Adjusted
Income 45
[Alcoa logo]
(in millions)
Quarter ended
Nine months ended
March 31,
2010
June 30,
2010
September 30,
2010
December 31,
2010
March 31,
2011
June 30,
2011
September 30,
2011
September 30,
2010
September 30,
2011
Net (loss) income
attributable to Alcoa
$ (201)
$ 136
$ 61
$ 258
$ 308
$ 322
$ 172
$ (4)
$ 802
Loss from discontinued
operations
(7)
(1)
–
–
(1)
(4)
–
(8)
(5)
(Loss) income from
continuing
operations
attributable to Alcoa
(194)
137
61
258
309
326
172
4
807
Restructuring and
other charges
119
20
(1)
(8)
5
16
5
138
26
Discrete tax items*
112
(16)
(38)
(18)
–
–
(10)
58
(10)
Other special items**
64
(2)
74
(9)
3
22
(2)
136
23
Income from
continuing
operations
attributable to Alcoa
–
as adjusted
$ 101
$ 139
$ 96
$ 223
$ 317
$ 364
$ 165
$ 336
$ 846 |
 Reconciliation of Adjusted Income (continued)
46
[Alcoa logo]
(in millions)
Quarter ended
December 31,
2008
March 31,
2009
June 30,
2009
September 30,
2009
December 31,
2009
Net (loss) income
attributable to Alcoa
$ (1,191)
$ (497)
$ (454)
$ 77
$ (277)
(Loss) income
from
discontinued
operations
(262)
(17)
(142)
4
(11)
(Loss) income from
continuing
operations
attributable to Alcoa
(929)
(480)
(312)
73
(266)
Restructuring and
other charges
614
46
56
1
49
Discrete tax items*
65
(28)
–
–
(82)
Other special items**
29
(15)
–
(35)
308
(Loss) income from
continuing
operations
attributable to Alcoa
–
as adjusted
$ (221)
$ (477)
$ (256)
$ 39
$ 9
Income (loss) from continuing operations attributable to Alcoa – as adjusted is a non-GAAP
financial measure. Management believes that this measure is meaningful to investors because management reviews the
operating results of Alcoa excluding the impacts of restructuring and other charges, discrete tax
items, and other special items (collectively, “special items”). There can be no assurances that additional special items will
not occur in future periods. To compensate for this limitation, management believes that it is
appropriate to consider both Income (loss) from continuing operations attributable to Alcoa determined under GAAP as well as
Income (loss) from continuing operations attributable to Alcoa – as adjusted.
* Discrete tax items include the following:
for the quarter ended December 31, 2009, a benefit for the reorganization of an equity investment in
Canada ($71), a charge for the write-off of deferred tax assets related to operations in Italy ($41), a benefit for a tax
rate change in Iceland ($31), and a benefit for the reversal of a valuation allowance on net operating
losses in Norway ($21); for the quarter ended March 31, 2009, a benefit for a change in a
Canadian national tax law permitting tax returns to be filed in U.S. dollars; and,
for the quarter ended December 31, 2008, a charge for non-cash tax on repatriated
earnings. ** Other special items include the following:
for the quarter ended December 31, 2009, charges related to the European Commission’s ruling on
electricity pricing for smelters in Italy ($250), a tax s ettlement related to an equity investment in Brazil ($24), an
estimated loss on excess power at the Intalco smelter ($19), and an environmental accrual for
smelters in Italy ($15); for the quarter ended September 30, 2009, a gain on an
acquisition in Suriname; for the quarter ended March 31, 2009, a gain on the Elkem/SAPA
AB swap ($133) and a loss on the sale of Shining Prospect ($118); and, for the quarter ended
December 31, 2008, charges for environmental reserve ($26), obsolete inventory ($16), and accounts receivable reserve ($11), and a refund of an indemnification payment ($24). |
 Reconciliation of Free Cash Flow
47
(in millions)
Quarter ended
Nine months
ended
March 31,
2011
June 30,
2011
September 30,
2011
September 30,
2011
Cash provided from
operations
$ (236)
$ 798
$ 489
$ 1,051
Capital expenditures
(204)
(272)
(325)
(801)
Free cash flow
$ (440)
$ 526
$ 164
$ 250
Free Cash Flow is a non-GAAP financial measure. Management believes that this measure is
meaningful to investors because management reviews cash flows generated from operations after
taking into consideration capital expenditures due to the fact that these expenditures are
considered necessary to maintain and expand Alcoa’s asset base and are expected to
generate future cash flows from operations. It is important to note that Free Cash Flow does not represent the
residual cash flow available for discretionary expenditures since other non-discretionary
expenditures, such as mandatory debt service requirements, are not deducted from the
measure. [Alcoa logo] |
 December 31,
Reconciliation of Free Cash Flow (continued)
48
[Alcoa logo]
(in millions)
Quarter ended
Year ended
December 31,
2008
March 31,
2009
June 30,
2009
September 30,
2009
December 31,
2009
March 31,
2010
June 30,
2010
September 30,
2010
December 31,
2010
2010
Cash
provided
from
operations
$ 608
$ (271)
$ 328
$ 184
$ 1,124
$ 199
$ 300
$ 392
$ 1,370
$ 2,261
Capital
expenditures
(1,017)
(471)
(418)
(370)
(363
)
(221)
(213)
(216)
(365
)
(1,015)
Free cash
flow
$ (409)
$ (742)
$
(90)
$ (186)
$ 761
$ (22)
$ 87
$ 176
$ 1,005
$ 1,246
Free Cash Flow is a non-GAAP financial measure. Management believes that this measure is
meaningful to investors because management reviews cash flows generated from operations after taking into
consideration capital expenditures due to the fact that these expenditures are considered necessary to
maintain and expand Alcoa’s asset base and are expected to generate future cash flows from operations.
It is important to note that Free Cash Flow does not represent the residual cash flow available for
discretionary expenditures since other non-discretionary expenditures, such as mandatory debt service
requirements, are not deducted from the measure.
|
 Reconciliation of Alcoa Adjusted EBITDA
49
[Alcoa logo]
($ in millions)
2001
2002
2003
2004
2005
2006
2007
2008
2009
2010
3Q10
2Q11
3Q11
Net income (loss)
attributable to
Alcoa
$ 908
$ 420
$ 938
$ 1,310
$ 1,233
$ 2,248
$ 2,564
$ (74)
$ (1,151)
$ 254
$ 61
$ 322
$ 172
Add:
Net income
attributable to
noncontrolling
interests
205
181
212
233
259
436
365
221
61
138
48
55
53
Cumulative effect
of accounting
changes
–
(34)
47
–
2
–
–
–
–
–
–
–
–
Loss (income)
from discontinued
operations
5
101
–
27
50
(22)
250
303
166
8
–
4
–
Provision (benefit)
for income taxes
524
307
367
546
464
853
1,623
342
(574)
148
(49)
136
55
Other (income)
expenses, net
(295)
(175)
(278)
(266)
(478)
(236)
(1,920)
(59)
(161)
5
43
(50)
31
Interest expense
371
350
314
271
339
384
401
407
470
494
139
163
125
Restructuring and
other charges
530
398
(28)
(29)
266
507
268
939
237
207
2
34
9
Provision for
depreciation,
depletion, and
amortization
1,144
1,037
1,110
1,142
1,227
1,252
1,244
1,234
1,311
1,450
358
375
376
Adjusted EBITDA
$ 3,392
$ 2,585
$ 2,682
$ 3,234
$ 3,362
$ 5,422
$ 4,795
$ 3,313
$ 359
$ 2,704
$ 602
$ 1,039
$ 821
Sales
$19,906
$17,691
$18,879
$21,370
$24,149
$28,950
$29,280
$26,901
$18,439
$21,013
$ 5,287
$ 6,585
$ 6,419
Adjusted EBITDA
Margin
17%
15%
14%
15%
14%
19%
16%
12%
2%
13%
11%
16%
13%
Alcoa’s definition of Adjusted EBITDA (Earnings before interest, taxes, depreciation, and
amortization) is net margin plus an add-back for depreciation, depletion, and amortization. Net margin is equivalent to
Sales minus the following items: Cost of goods sold; Selling, general administrative, and other
expenses; Research and development expenses; and Provision for depreciation, depletion, and amortization.
Adjusted EBITDA is a non-GAAP financial measure. Management believes that this measure is
meaningful to investors because Adjusted EBITDA provides additional information with respect to Alcoa’s
operating performance and the Company’s ability to meet its financial obligations. The
Adjusted EBITDA presented may not be comparable to similarly titled measures of other companies. |
 Reconciliation of Alumina Adjusted EBITDA
50
[Alcoa logo]
($ in millions, except
per metric ton
amounts)
2001
2002
2003
2004
2005
2006
2007
2008
2009
2010
3Q10
1Q11
2Q11
3Q11
After-tax operating
income (ATOI)
$ 471
$ 315
$ 415
$ 632
$ 682
$ 1,050
$ 956
$ 727
$ 112
$ 301
$ 70
$ 142
$ 186
$ 154
Add:
Depreciation,
depletion, and
amortization
144
139
147
153
172
192
267
268
292
406
100
103
112
117
Equity (income)
loss
(1)
(1)
–
(1)
–
2
(1)
(7)
(8)
(10)
(1)
(3)
(22)
(2)
Income taxes
184
130
161
240
246
428
340
277
(22)
60
(22)
44
60
42
Other
(17)
(14)
(55)
(46)
(8)
(6)
2
(26)
(92)
(5)
(1)
–
(1)
–
Adjusted EBITDA
$ 781
$ 569
$ 668
$ 978
$ 1,092
$ 1,666
$ 1,564
$ 1,239
$ 282
$ 752
$ 146
$ 286
$ 335
$ 311
Production
(thousand metric
tons) (kmt)
12,527
13,027
13,841
14,343
14,598
15,128
15,084
15,256
14,265
15,922
4,047
4,024
4,144
4,140
Adjusted
EBITDA/Production
($ per metric ton)
$ 62
$ 44
$ 48
$ 68
$ 75
$ 110
$ 104
$ 81
$ 20
$ 47
$ 36
$ 71
$ 81
$ 75
Alcoa’s definition of Adjusted EBITDA (Earnings before interest, taxes,
depreciation, and amortization) is net margin plus an add-back for depreciation, depletion, and amortization. Net margin is equivalent to Sales
minus the following items: Cost of goods sold; Selling, general administrative, and
other expenses; Research and development expenses; and Provision for depreciation, depletion, and amortization. The Other line
in
the
table
above
includes
gains/losses
on
asset
sales
and
other
nonoperating
items.
Adjusted
EBITDA
is
a
non-GAAP
financial
measure.
Management
believes
that
this
measure
is
meaningful
to
investors
because
Adjusted
EBITDA
provides
additional
information
with
respect
to
Alcoa’s
operating
performance
and
the
Company’s
ability
to
meet
its
financial
obligations.
The
Adjusted
EBITDA
presented
may
not
be
comparable
to
similarly titled measures of other companies. |
 Reconciliation of Primary Metals Adjusted EBITDA
51
[Alcoa logo]
($ in millions, except
per metric ton
amounts
)
2001
2002
2003
2004
2005
2006
2007
2008
2009
2010
3Q10
1Q11
2Q11
3Q11
After-tax operating
income (ATOI)
$ 905
$ 650
$ 657
$ 808
$ 822
$ 1,760
$ 1,445
$ 931
$ (612)
$ 488
$ 78
$ 202
$ 201
$ 110
Add:
Depreciation,
depletion, and
amortization
327
300
310
326
368
395
410
503
560
571
142
141
142
137
Equity (income) loss
(52)
(44)
(55)
(58)
12
(82)
(57)
(2)
26
(1)
–
(1)
1
4
Income taxes
434
266
256
314
307
726
542
172
(365)
96
(3)
53
55
21
Other
(8)
(47)
12
20
(96)
(13)
(27)
(32)
(176)
(7)
(7)
1
–
–
Adjusted EBITDA
$ 1,606
$ 1,125
$ 1,180
$ 1,410
$ 1,413
$ 2,786
$ 2,313
$ 1,572
$ (567)
$ 1,147
$ 210
$
396
$ 399
$ 272
Production
(thousand metric
tons) (kmt)
3,488
3,500
3,508
3,376
3,554
3,552
3,693
4,007
3,564
3,586
891
904
945
964
Adjusted
EBITDA/Production
($ per metric ton)
$ 460
$ 321
$ 336
$ 418
$ 398
$ 784
$ 626
$ 392
$ (159)
$ 320
$ 236
$ 438
$ 422
$ 282
Alcoa’s definition of Adjusted EBITDA (Earnings before interest, taxes, depreciation, and
amortization) is net margin plus an add-back for depreciation, depletion, and amortization. Net margin is equivalent to Sales minus the following items: Cost of
goods sold; Selling, general administrative, and other expenses; Research and development expenses; and
Provision for depreciation, depletion, and amortization. The Other line in the table above includes gains/losses on asset sales and other
nonoperating items. Adjusted EBITDA is a non-GAAP financial measure. Management believes that this
measure is meaningful to investors because Adjusted EBITDA provides additional information with respect to Alcoa’s operating performance and
the Company’s ability to meet its financial obligations. The Adjusted EBITDA presented may not be
comparable to similarly titled measures of other companies. |
 Reconciliation of Flat-Rolled Products Adjusted EBITDA
52
[Alcoa logo]
($ in millions,
except
per metric ton
amounts)
2001
2002
2003
2004
2005
2006
2007
2008
2009
2010
3Q10
1Q11
2Q11
3Q11
After-tax
operating income
(ATOI)
$ 253
$ 225
$ 222
$ 254
$
278
$ 233
$ 178
$ (3)
$ (49)
$ 220
$ 66
$ 81
$ 99
$ 60
Add:
Depreciation,
depletion, and
amortization
167
184
190
200
220
223
227
216
227
238
57
58
60
61
Equity loss
2
4
1
1
–
2
–
–
–
–
–
–
–
–
Income taxes
124
90
71
75
121
58
92
35
48
92
26
33
35
26
Other
(5)
(8)
(5)
1
1
20
1
6
(2)
1
–
1
(1)
–
Adjusted EBITDA
$ 541
$ 495
$ 479
$ 531
$ 620
$ 536
$
498
$ 254
$ 224
$ 551
$ 149
$ 173
$ 193
$ 147
Total sales
$ 4,868
$ 4,571
$ 4,768
$ 6,042
$ 7,081
$ 8,610
$ 9,597
$ 9,184
$ 6,182
$ 6,457
$ 1,691
$ 1,961
$ 2,147
$ 2,022
Adjusted EBITDA
Margin
11%
11%
10%
9%
9%
6%
5%
3%
4%
9%
9%
9%
9%
7%
Total shipments
(thousand metric
tons) (kmt)
2,376
2,482
2,361
1,888
1,755
474
470
491
469
Adjusted
EBITDA
/Total
shipments ($ per
metric ton)
$ 226
$ 201
$ 108
$ 119
$ 314
$ 314
$ 368
$ 393
$ 313
-
Alcoa’s definition of Adjusted EBITDA (Earnings before interest, taxes, depreciation, and
amortization) is net margin plus an add-back for depreciation, depletion, and amortization. Net margin is equivalent to
Sales minus the following items: Cost of goods sold; Selling, general administrative, and other
expenses; Research and development expenses; and Provision for depreciation, depletion, and amortization. The
Other line in the table above includes gains/losses on asset sales and other nonoperating items.
Adjusted EBITDA is a non-GAAP financial measure. Management believes that this measure is meaningful to
investors because Adjusted EBITDA provides additional information with respect to Alcoa’s
operating performance and the Company’s ability to meet its financial obligations. The Adjusted EBITDA presented
may not be comparable to similarly titled measures of other companies.
|
 Reconciliation of Engineered Products and Solutions
Adjusted EBITDA
53
[Alcoa logo]
($ in millions)
2001
2002
2003
2004
2005
2006
2007
2008
2009
2010
3Q10
1Q11
2Q11
3Q11
After-tax operating
income (ATOI)
$ 189
$ 63
$ 124
$ 156
$ 271
$ 365
$ 435
$ 533
$ 315
$ 415
$ 114
$ 130
$ 149
$ 138
Add:
Depreciation,
depletion, and
amortization
186
150
166
168
160
152
163
165
177
154
37
38
41
40
Equity loss
(income)
–
–
–
–
–
6
–
–
(2)
(2)
(1)
(1)
–
–
Income taxes
61
39
55
65
116
155
192
222
139
195
63
62
72
67
Other
–
35
11
106
(11)
(2)
(7)
2
1
–
1
–
(1)
–
Adjusted EBITDA
$ 436
$ 287
$ 356
$ 495
$ 536
$ 676
$ 783
$ 922
$ 630
$ 762
$ 214
$ 229
$ 261
$ 245
Total sales
$ 4,141
$ 3,492
$ 3,905
$ 4,283
$ 4,773
$ 5,428
$ 5,834
$ 6,199
$ 4,689
$ 4,584
$ 1,173
$ 1,247
$ 1,370
$ 1,373
Adjusted EBITDA
Margin
11%
8%
9%
12%
11%
12%
13%
15%
13%
17%
18%
18%
19%
18%
Alcoa’s definition of Adjusted EBITDA (Earnings before interest, taxes, depreciation, and
amortization) is net margin plus an add-back for depreciation, depletion, and amortization. Net margin is equivalent to
Sales minus the following items: Cost of goods sold; Selling, general administrative, and other
expenses; Research and development expenses; and Provision for depreciation, depletion, and amortization. The
Other line in the table above includes gains/losses on asset sales and other nonoperating items.
Adjusted EBITDA is a non-GAAP financial measure. Management believes that this measure is meaningful to
investors because Adjusted EBITDA provides additional information with respect to Alcoa’s
operating performance and the Company’s ability to meet its financial obligations. The Adjusted EBITDA presented
may not be comparable to similarly titled measures of other companies.
|
 Reconciliation of Alcoa Net Debt
54
[Alcoa logo]
(in millions)
Quarter ended
December 31,
2008
June 30,
2011
September30,
2011
Short
-
term borrowings
$ 478
$ 65
$ 57
Commercial paper
1,535
–
107
Long
-
term debt due within
one year
56
510
489
Long
-
term debt, less amount
due within one year
8,509
8,773
8,658
Total debt
10,578
9,348
9,311
Less: Cash and cash
equivalents
762
1,260
1,332
Net debt
$ 9,816
$ 8,088
$ 7,979
Net
debt
is
a
non-GAAP
financial
measure.
Management
believes
that
this
measure
is
meaningful
to
investors because management assesses Alcoa’s leverage position after
factoring in available cash that could be used to repay outstanding
debt. |