Attached files
| file | filename |
|---|---|
| 8-K - ARI NETWORK SERVICES 8-K 9-28-2011 - ARI NETWORK SERVICES INC /WI | form8k.htm |
Exhibit 99.1
Introduction to
ARI Network Services, Inc.
ARI Network Services, Inc.
i A.D. u r e O u P

Safe Harbor Statement
Statements in this news release are "forward-looking statements" within the meaning of the Private Securities
Litigation Reform Act. The forward-looking statements can generally be identified by words such as "believes,"
"anticipates," "expects" or words of similar meaning. Forward-looking statements also include statements relating to
the Company's future performance, such as future prospects, revenues, profits and cash flows. The forward-looking
statements are subject to risks and uncertainties, which may cause actual results to be materially different from any
future performance suggested in the forward-looking statements. Such risks and uncertainties include those factors
described in Part 1A of the Company’s annual report on Form 10-K for fiscal year ended July 31, 2010, filed with the
Securities and Exchange Commission. Readers are cautioned not to place undue reliance on these forward-looking
statements. The forward-looking statements are made only as of the date hereof, and the Company undertakes no
obligation to publicly release the result of any revisions to these forward-looking statements. For more information,
please refer to the Company’s filings with the Securities and Exchange Commission.
During this presentation, we will discuss GAAP measure such as Net Income, as well as certain non-GAAP measures
such as EBITDA. We have posted on the Investor Relations tab of our website, www.arinet.com, a reconciliation of
these no-GAAP financial measures to the most comparable financial measures under GAAP.
such as EBITDA. We have posted on the Investor Relations tab of our website, www.arinet.com, a reconciliation of
these no-GAAP financial measures to the most comparable financial measures under GAAP.

ARI OVERVIEW
Roy W. Olivier - President and CEO
Who we are…
ARI is the leader in
creating, marketing,
and supporting
solutions that enhance
revenue and reduce
costs for our
customers.
creating, marketing,
and supporting
solutions that enhance
revenue and reduce
costs for our
customers.

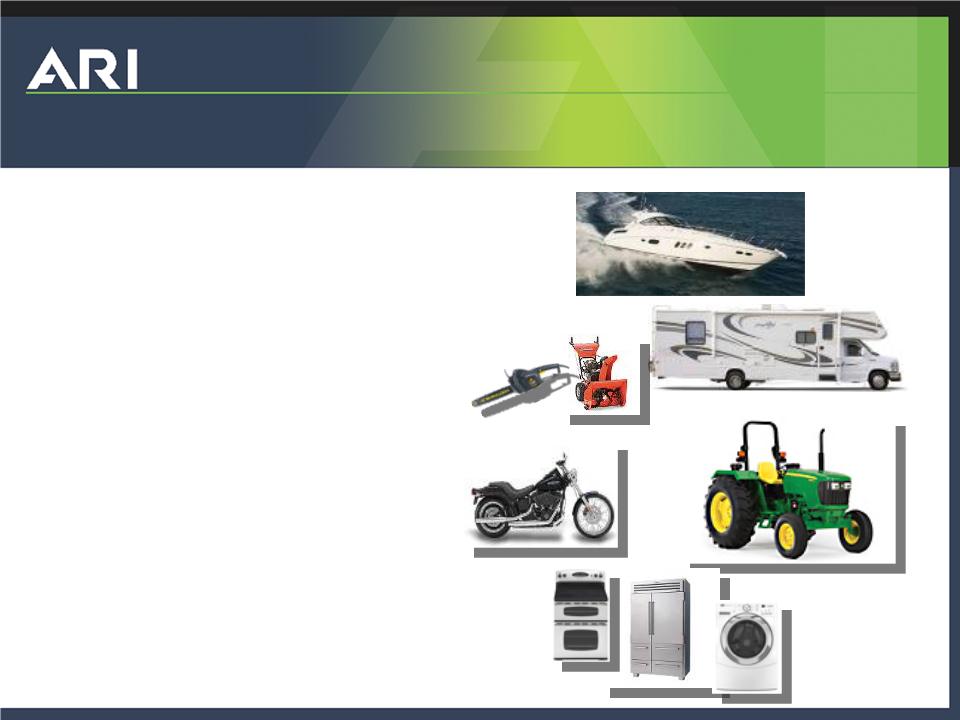
What we do…
• ARI develops multi-industry, multi-brand, SaaS solutions that drive
the sales of whole goods, parts, garments, and accessories in select
vertical markets.
the sales of whole goods, parts, garments, and accessories in select
vertical markets.
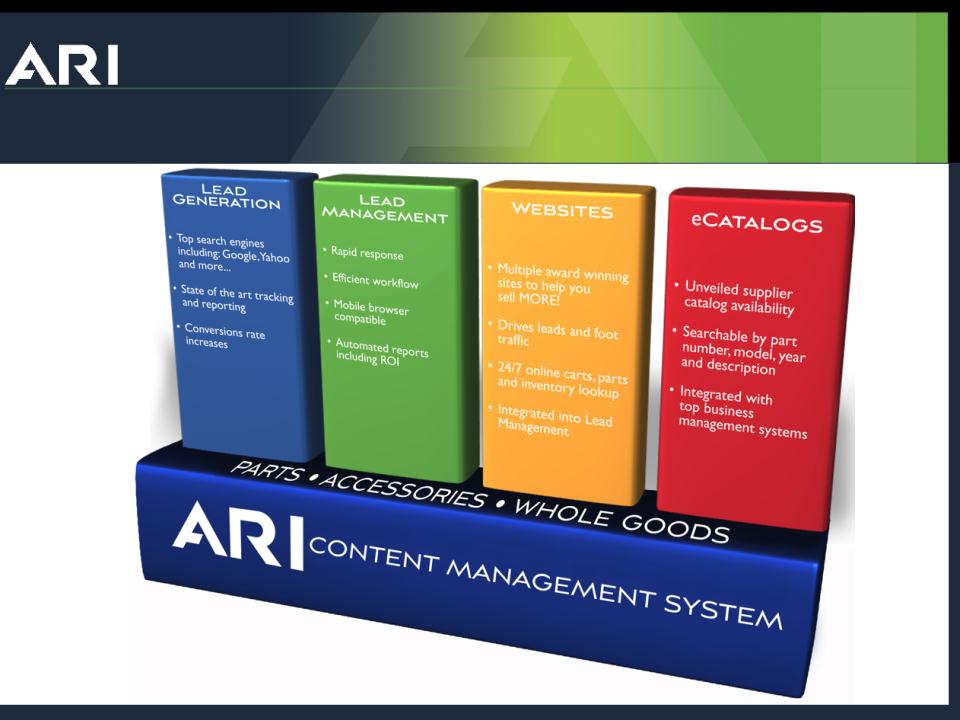
• We provide products and services that connect and enable e-
commerce between consumers, dealers, distributors and OEM's in
the markets we serve.
commerce between consumers, dealers, distributors and OEM's in
the markets we serve.
• Revenue sources include subscription fees for the use of our
services & content, transaction fees for sales generated from our e-
commerce solutions, and analytics from customer data resulting in
over 85% of our revenue being recurring.
services & content, transaction fees for sales generated from our e-
commerce solutions, and analytics from customer data resulting in
over 85% of our revenue being recurring.
How we do it…
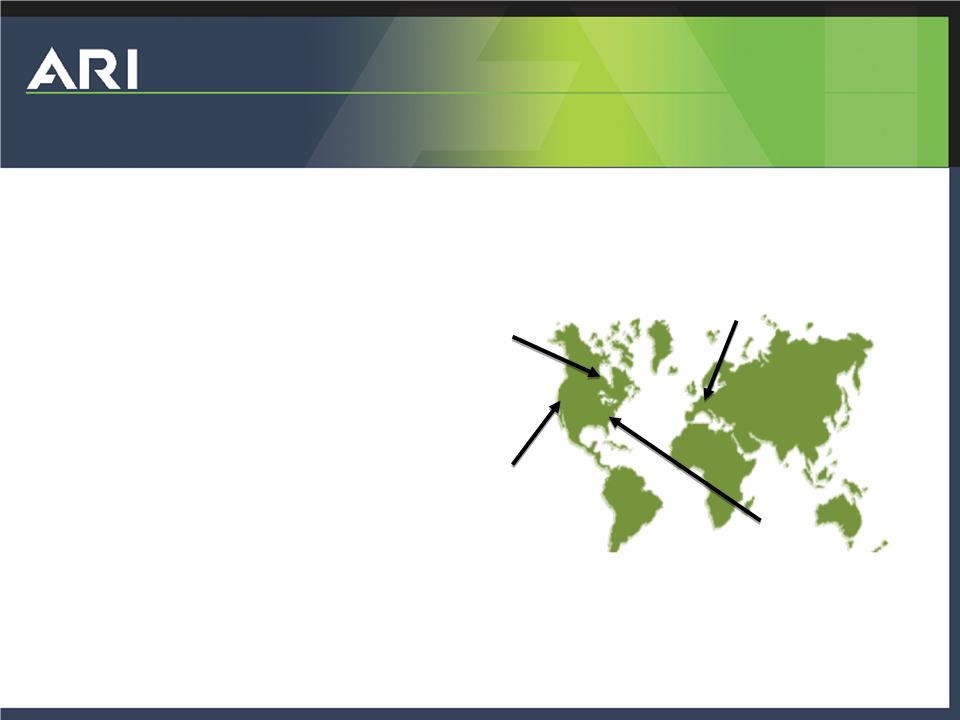
Headquarters
Milwaukee, Wisconsin
Milwaukee, Wisconsin
Intl. Sales/Support
The Netherlands
The Netherlands
Development & Marketing
Services
Cypress, California
Services
Cypress, California
Marine/RV Sales/Support
Virginia Beach, VA
How we go to market…
• 3 sales channels
– OEM sales
– Dealer inside sales
– International sales
• 2 geographic markets
– Americas
– EMEA
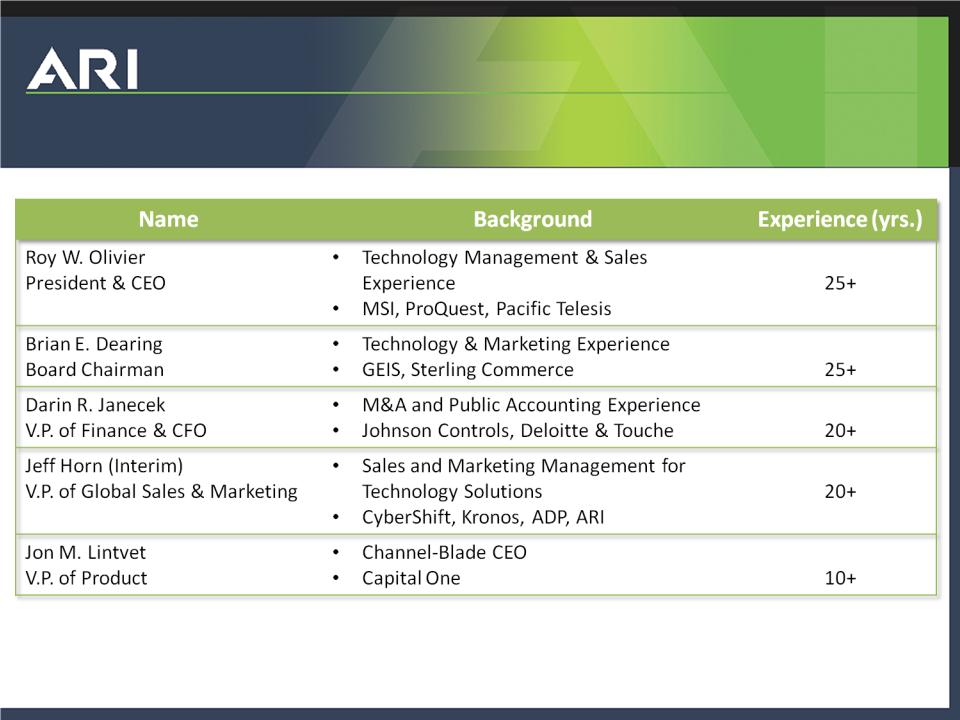
Management Team
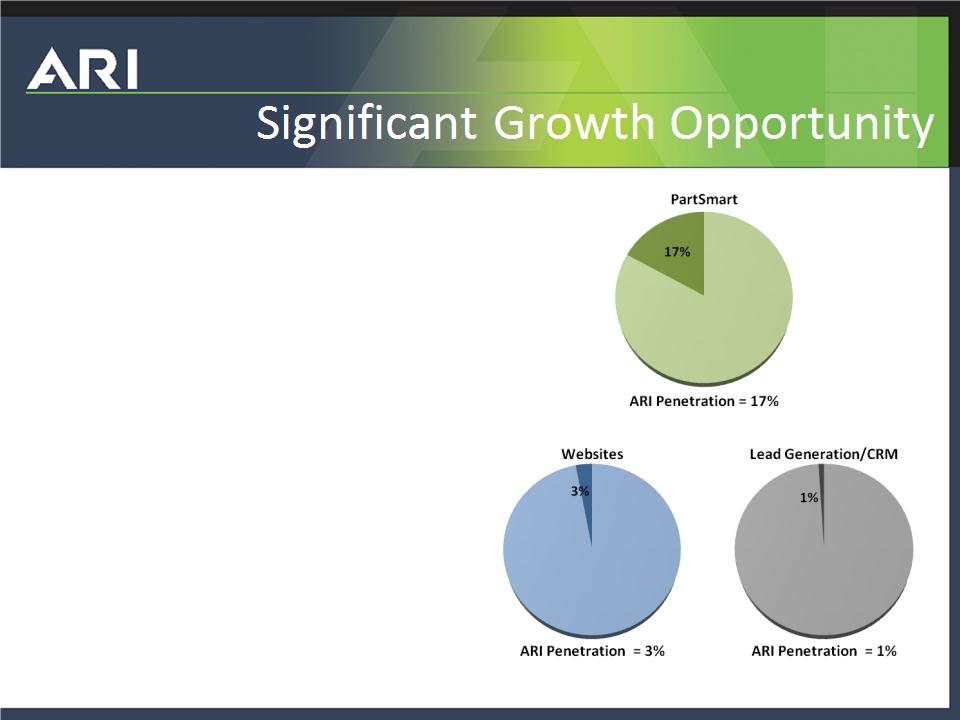
• Significant growth
opportunities in existing
markets
opportunities in existing
markets
• Direct relationships with
over 18,000 OEMs,
dealers, and distributors
over 18,000 OEMs,
dealers, and distributors
• Unmatched knowledge of
the verticals we serve
the verticals we serve
Source: Trade Associations and Internal ARI Data

Growth Strategy
• Organic - Strategic Focus
– Expand market share (new logos)
– Raise average revenue per dealer (upgrades)
– Reduce churn (add value to products)
– Launch new products
• Leverage large install base of 18K Dealers, Dist. & OEM’s
– Position company for new verticals and markets
• Non-organic - Acquisitions
– Acquire competitors
– Acquire into new markets and products that fit our stratigy

Highlights
• Significant untapped growth opportunity in the markets we serve
• Proven business model
– Recurring Revenue Model
– Direct relationship with over 18,000 OEMs, Distributors, and Dealers
– Unmatched knowledge of the verticals we serve
• “Must have” nature of solutions
• Industry Leader with high barriers to entry:
– Largest content library in the verticals we serve
– Leading technology
– Large install base with leading share of top dealers and top OEMs
• Strong, experienced management team
• Proven acquisition experience

TTM & FY11 YTD Q3 RESULTS
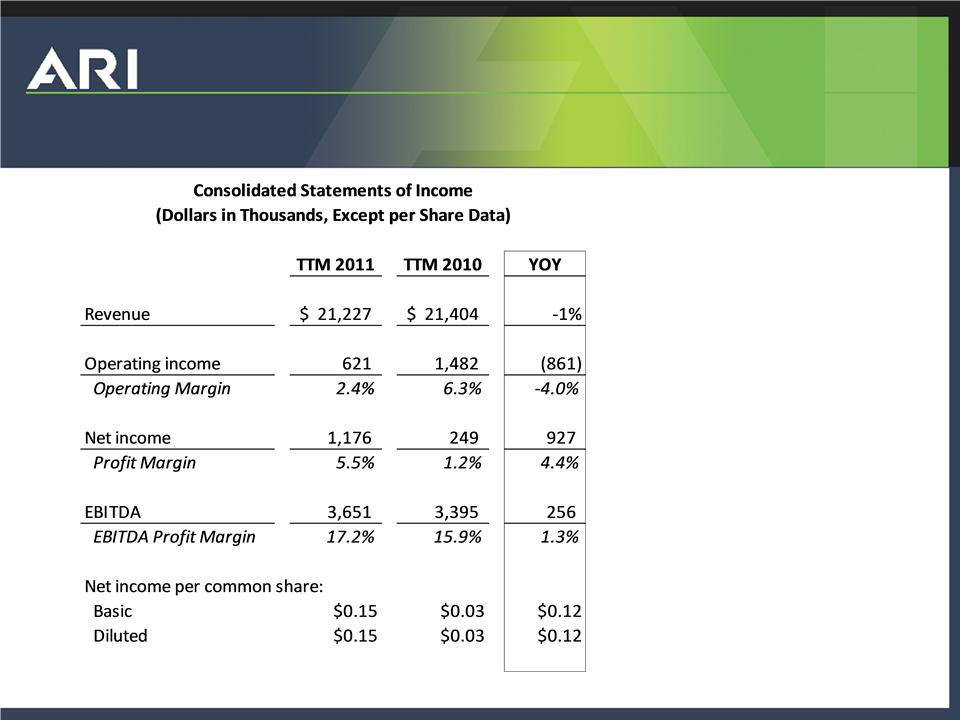
TTM May - April FY11 vs. FY10
2011 Highlights
• Strong operating results
(excluding non-cash revenue)
(excluding non-cash revenue)
• Continued investment in product
development
development
• EBITDA growth
• Customer churn improvement
2011 Challenges
• Loss of non-cash revenues
• Increased interest expense
• Restructuring expense
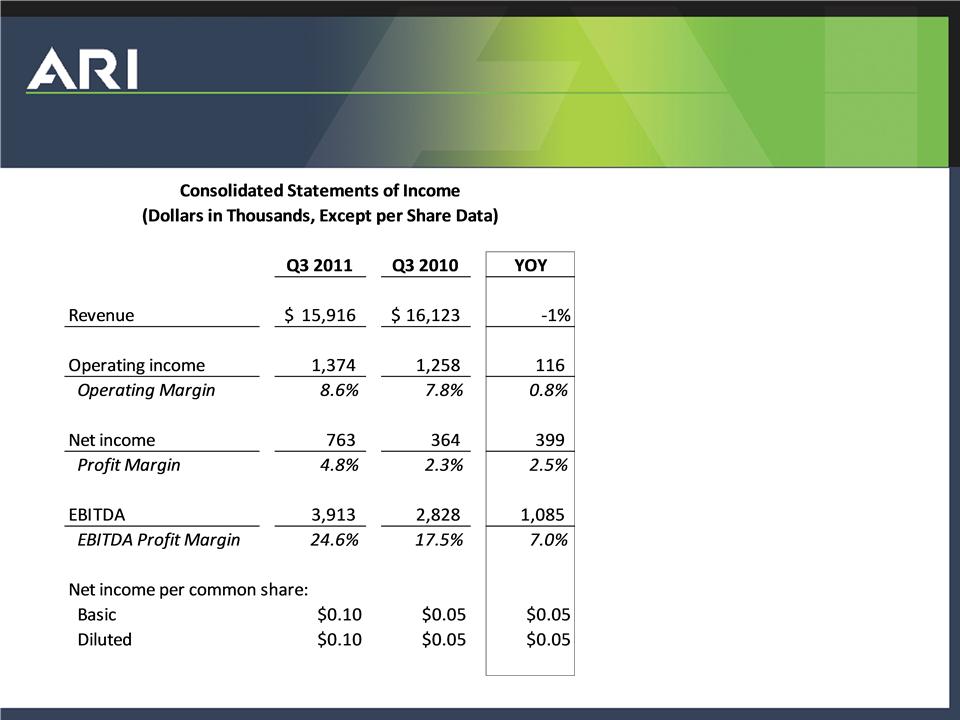
YTD Q3 2011 vs. YTD Q3 2010
Q3’FY11 Highlights
• Strong operating results
(excluding non-cash revenue)
(excluding non-cash revenue)
• Continued investment in product
development
development
• EBITDA growth
• Customer churn improvement
Q3’FY11 Challenges
• Loss of amortized revenues
• Interest expense
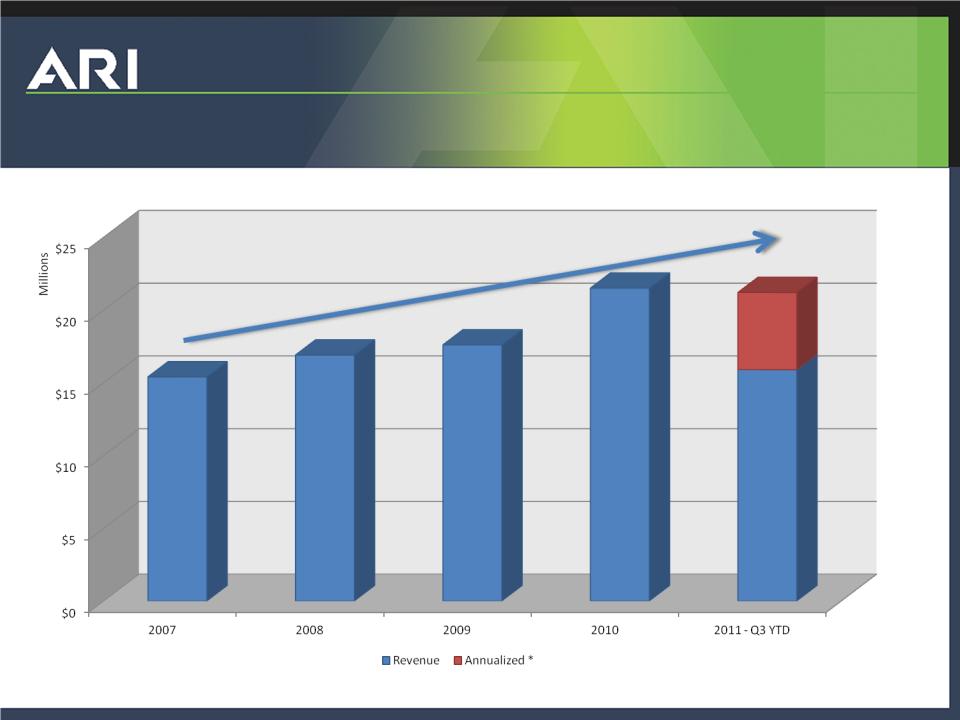
Financial Results: Revenue Growth
CAGR 8.3%
* Does not represent a projection of results, annualized for comparison purposes only.
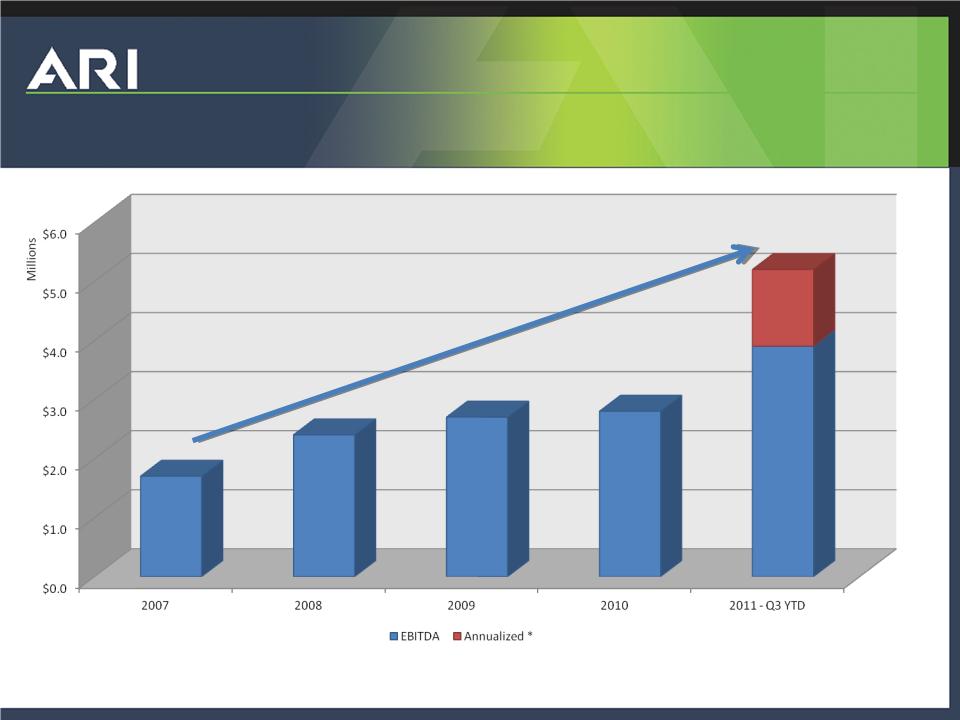
Financial Results: EBITDA
A reconciliation of EBITDA to net income is posted on our website, www.arinet.com, under “Company/Investors”
* Does not represent a projection of results, annualized for comparison purposes only.
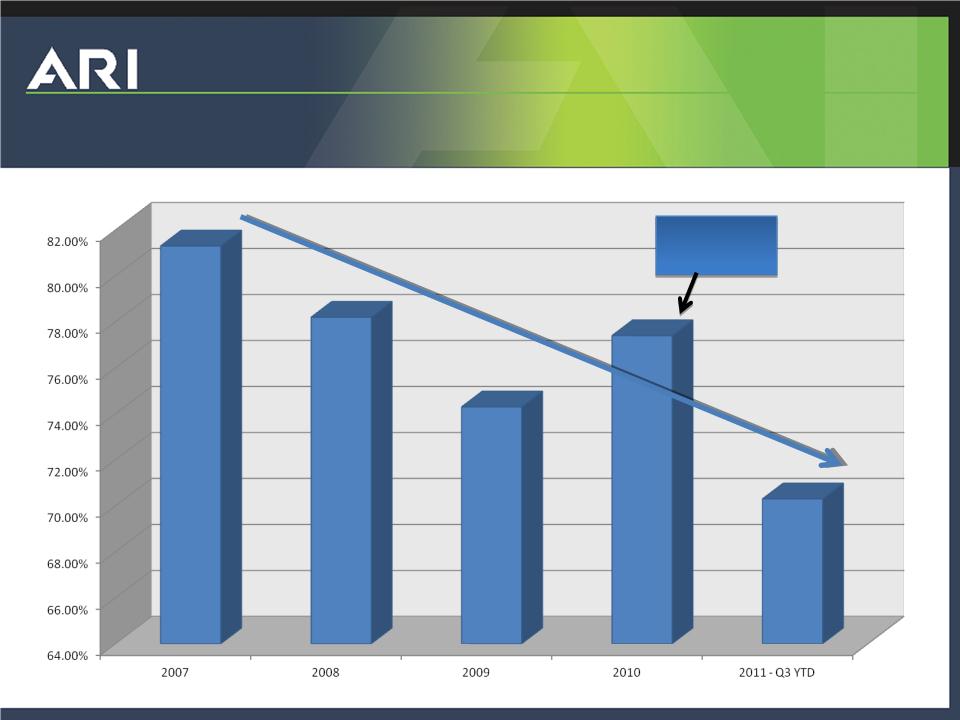
Operating Expenses as % of Revenue
Channel Blade
integration costs
& F&I losses
integration costs
& F&I losses
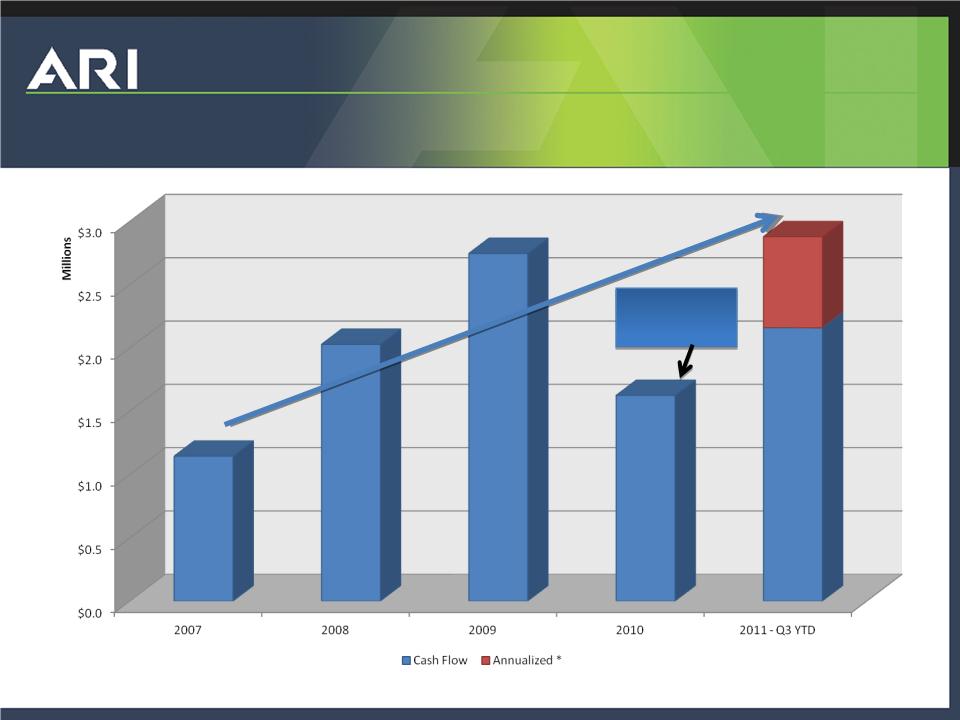
Operating Cash Flow
Channel Blade
integration costs
& F&I losses
integration costs
& F&I losses
* Does not represent a projection of results, annualized for comparison purposes only.
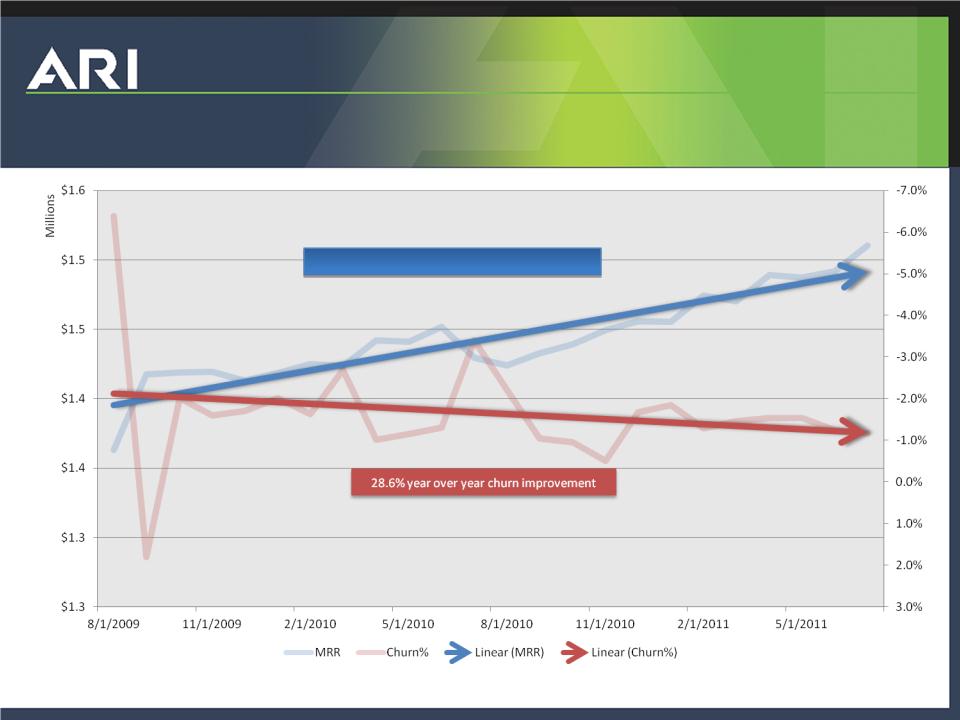
Monthly Recurring Revenue (MRR) & Churn
30.6% year over year MRR improvement
MRR and Churn are non GAAP measures, they are key performance indicators that management uses to gauge the health of the
business.
business.
FY12 Plan Summary
WHO WE ARE
ARI’s broad suite of services, accessible
technology, and ability to deliver tangible
value, equip its customers with every
advantage they need to succeed.
technology, and ability to deliver tangible
value, equip its customers with every
advantage they need to succeed.
MISSION STATEMENT
Be recognized as the leader in creating,
marketing and supporting the best solutions
that enhance revenue or reduce costs for our
customers.
marketing and supporting the best solutions
that enhance revenue or reduce costs for our
customers.
CORE VALUES
People Oriented
Rapid Innovation
Initiative
Delivery and Execution
Embrace the Customer
CRITICAL SUCCESS FACTORS
§ Acquire and retain customers
§ Focused organization that
delivers on commitments and
plans
delivers on commitments and
plans
§ Develop and deploy new
recurring revenue high gross
margin Tech Enabled Svcs
(“TES’s”)
recurring revenue high gross
margin Tech Enabled Svcs
(“TES’s”)
§ Publish the information our
customers need, on time
customers need, on time
§ Develop the systems
infrastructure to support the
company’s growth
infrastructure to support the
company’s growth
§ Acquire, Develop and Retain
High Performing Employees
High Performing Employees
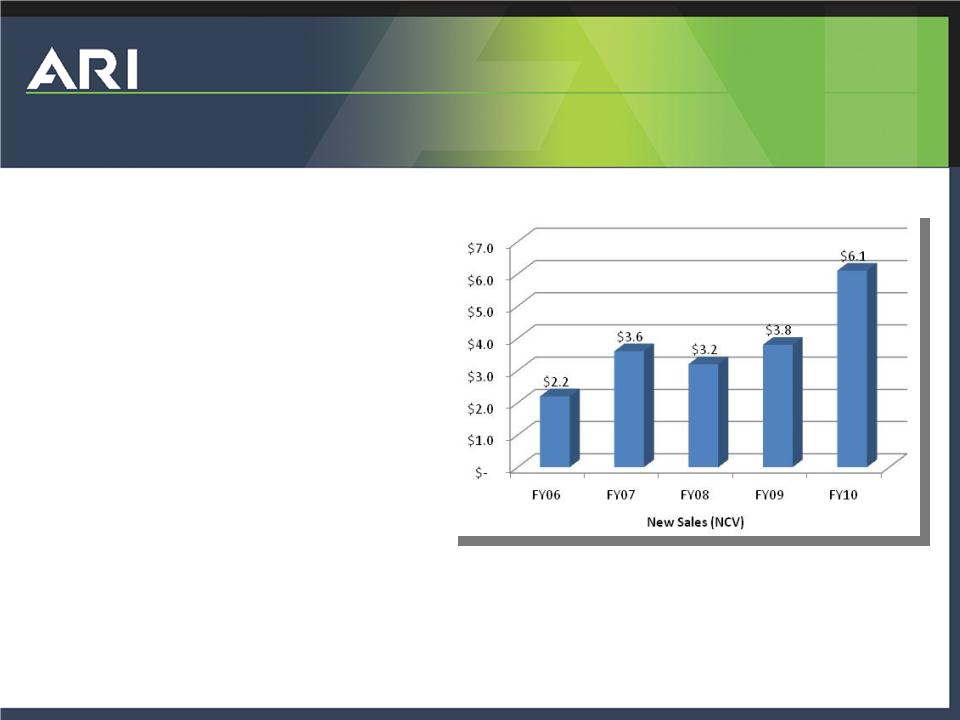
Operating Momentum
Strong New Sales Performance
• 501 New logos (customers) in FY10
• $6.1M in new sales (NCV) in FY10
• 60% increase over FY09
• CAC Ratio is 0.64 (TTM)1
Increased Focus on MRR
• Updating compensation plans
• Updating product pricing
Good progress on controllable churn
• Dedicated team
• Improvements in publishing and software
1 CAC - Customer Acquisition Costs
2 MRR - Monthly Recurring Revenue

Operating Momentum
• Lowered costs
– Staff reductions
– Sold F&I business
• Addressed underperforming products
– Adjusted or are adjusting pricing on all products
– Discontinued two non-core products
– Piloted project to improve one key products gross margin
by almost 2x
by almost 2x
– Sharpened focus on 3 core products (Catalog, Footsteps,
and the Website Platform Products)
and the Website Platform Products)

SUMMARY & CONCLUSION
Roy W. Olivier - President and CEO
Shareholder Value Engine
Performance
Business
Model
Total
Enterprise
Value
1) % Debt
2) # Shares
$$$
Share Price
Communicate to Prospective Shareholders
FY12Plan - I/R program for greater visibility
FY12 Plan
EBITDA
New products
FY12 Plan
SaaS Model
Bessemer metrics
FY12Plan
De-lever

Increasing Shareholder Value
• We run the business to increase shareholder value…
– Grow revenue with fiscal discipline
– Achieve double digit organic sales growth by
• Reducing churn
• Achieving new sales goals
• Increasing average revenue per dealer (ARPD)
• Increasing recurring revenue as a percentage of total revenue
• Launching new products
– Increase ARI visibility
• …but the market sets the price
– Our perspective
• We are undervalued (using industry valuation norms)
• Continued strategic focus and business execution can drive a return to fair value
– We believe that we are doing the right strategic and operational things to
increase shareholder value
increase shareholder value

Outlook
• Expect a slow recovery in several ARI verticals
• Expect revenue growth in FY12
• Expect continued improvement in operating income
& EBITDA
& EBITDA
• Continue to improve cash flow from operations
• Expect to launch a new product to increase ARPD
and drive international growth (BRIC)
and drive international growth (BRIC)
• Expect to reduce churn through increased focus and
product enhancements
product enhancements

Thank You!