Attached files
| file | filename |
|---|---|
| 8-K - 8-K - Essex Rental Corp. | v235759_8k.htm |
Essex Rental Corp Oppenheimer & Co. 6 th Annual Industrials Conference September 27, 2011 1
This document does not constitute an offer to sell or a solicitation of an offer to buy any securities . It is an outline of matters for discussion only . Some of the statements in this presentation and other written and oral statements made from time to time by the Company and its representatives are “forward - looking statements” within the meaning of Section 27 A of the Securities Act of 1933 , as amended, and Section 21 E of the Securities Exchange Act of 1934 , as amended . These statements include statements regarding the intent and belief or current expectations of Essex and its management team and may be identified by the use of words like "anticipate", "believe", "estimate", "expect", "intend", "may", "plan", "will", "should", "seek", the negative of these terms or other comparable terminology . Investors are cautioned that any such forward - looking statements are not guarantees of future performance and involve risks and uncertainties, and that actual results may differ materially from those projected in the forward - looking statements . Important factors that could cause actual results to differ materially from Essex’s expectations include, without limitation, the continued ability of Essex to successfully execute its business plan, the possibility of a change in demand for the products and services that Essex provides, intense competition which may require us to lower prices or offer more favorable terms of sale, our reliance on third party suppliers, our indebtedness which could limit our operational and financial flexibility, global economic factors including interest rates, general economic conditions, geopolitical events and regulatory changes, our dependence on our management team and key personnel, as well as other relevant risks detailed in our Annual Report on Form 10 - K/A and subsequent periodic reports filed with the Securities and Exchange Commission and available on our website, www . essexrentalcorp . com . The factors listed here are not exhaustive . Many of these uncertainties and risks are difficult to predict and beyond management’s control . Forward - looking statements are not guarantees of future performance, results or events . Essex assumes no obligation to update or supplement forward - looking information in this presentation whether to reflect changed assumptions, the occurrence of unanticipated events or changes in future operating results or financial conditions, or otherwise . This presentation contains unaudited non - GAAP financial measures, including Total EBITDA, and EBITDA before Rental Equipment Sales . Management believes that the presentation of these non - GAAP financial measures serves to enhance understanding of Essex’s individual operating and financial performance . These non - GAAP financial measures should be considered in addition to, but not as substitutes for, the most directly comparable U . S . GAAP measures . A reconciliation of Total EBITDA and EBITDA before Rental Equipment Sales to income from operations for the three and six month periods ended June 30 , 2011 can be found in Essex’s Current Report on Form 8 - K filed with the Securities and Exchange Commission (the “SEC”) on August 9 , 2011 . We believe the non - Company information provided herein is reliable, as of the date hereof, but do not warrant its accuracy or completeness . In preparing these materials, we have relied upon and assumed, without independent verification, the accuracy and completeness of all information available from public sources . Except as required by law, the Company, Essex and their respective directors, officers, employees, agents and consultants make no representation or warranty as to the accuracy or completeness of the non - Company information contained in this document, and take no responsibility under any circumstances for any loss or damage suffered as a result of any omission, inadequacy, or inaccuracy in this document . The Company does not guaranty the performance or return of capital from investments . © 2011 Essex Rental Corp . Importance Notice 2
Introduction 1 3
Ron Schad President & Chief Executive Officer President & CEO of Essex Crane since 2000 15 years with Manitowoc Crane Group – General Manager of the Crane Group responsible for over $350 million in sales Graduated from the University of Wisconsin - Madison with a BS in Engineering Marty Kroll Chief Financial Officer & Senior Vice President CFO & Senior Vice President of Essex Crane since May 2001 Former President and Chief Financial Officer of US Holding Company of Outokumpu Copper Group Director of Finance at American Brass Company 8 years with PricewaterhouseCoopers LLP Certified Public Accountant Senior Management 4
Leading provider of lifting equipment solutions to the infrastructure and construction industry Acquisition of Coast Crane Company in November 2010 increased the Company’s geographic footprint, product offerings and lines of business, and diversified its earnings stream Focused on bare rental of construction lifting equipment with over 1 , 000 pieces of equipment and attachments Rental fleet has an Orderly Liquidation Value (“OLV”) in excess of $ 350 million Highly diversified end markets served across a national footprint Over 30 % of common stock is owned by management and members of the Board of Directors Essex Rental Corp. 5
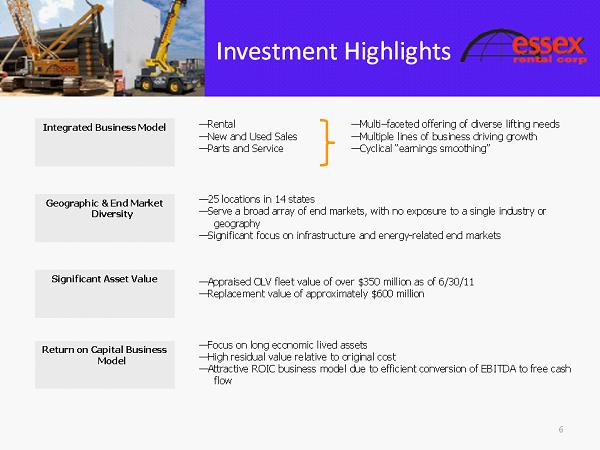
Integrated Business Model — Rental — New and Used Sales — Parts and Service — Multi – faceted offering of diverse lifting needs — Multiple lines of business driving growth — Cyclical “earnings smoothing” Geographic & End Market Diversity — 25 locations in 14 states — Serve a broad array of end markets, with no exposure to a single industry or geography — Significant focus on infrastructure and energy - related end markets Significant Asset Value — Appraised OLV fleet value of over $350 million as of 6/30/11 — Replacement value of approximately $600 million Return on Capital Business Model — Focus on long economic lived assets — High residual value relative to original cost — Attractive ROIC business model due to efficient conversion of EBITDA to free cash flow Investment Highlights 6
▪ Essex acquired Coast’s assets out of bankruptcy on November 12, 2010. ▪ Coast has a s trong presence in Western North America, Hawaii, Guam, Alaska and the South Pacific. ▪ Total consideration was ~$80.0 million cash, plus ~$12 million of existing Coast indebtedness. ▪ Acquisition price reflects a significant discount to the replacement value of Coast’s assets. » Acquisition completed at the low point of the appraised value cycle » Goodwill of only $1.8 million » Nominal value ascribed to distribution and parts and services businesses ▪ Essex issued 3.3 million shares of common stock (at $4.30/share), generating proceeds of $14.2 million. ▪ Coast had a four year average EBITDA of $17 million prior to the acquisition. Transaction Structure : Coast Crane Company: Acquisition Overview 7
Coast Crane Company Summary ▪ Coast’s assets are contiguous and complementary to Essex’s existing crawler crane fleet ▪ Largest fleet in west coast: young, modern fleet with long asset lives of 10 - 30+ years ▪ Low maintenance capital expenditure requirements ▪ Types of cranes: » Towers - Types: Self Erector, City Cranes & T - top Cranes » Rough Terrains - Fleet focus on mid - to - large capacity » Boom Trucks - Heavy lift capacity multi - axel boom trucks ▪ Coast Crane total revenue of $27.8 million for the six months ended June 30, 2011 8
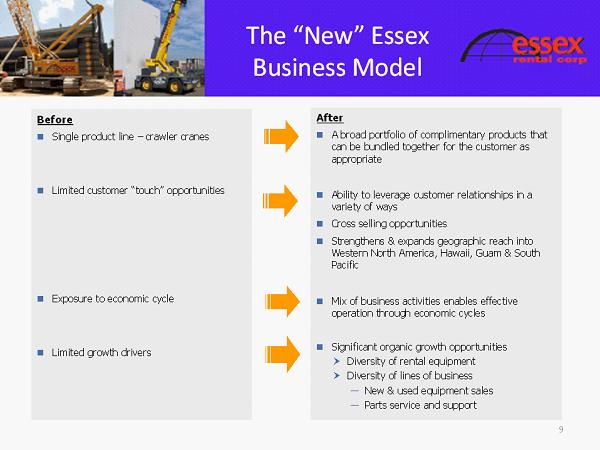
Before Single product line – crawler cranes Limited customer “touch” opportunities Exposure to economic cycle Limited growth drivers After A broad portfolio of complimentary products that can be bundled together for the customer as appropriate Ability to leverage customer relationships in a variety of ways Cross selling opportunities Strengthens & expands geographic reach into Western North America, Hawaii, Guam & South Pacific Mix of business activities enables effective operation through economic cycles Significant organic growth opportunities Diversity of rental equipment Diversity of lines of business ― New & used equipment sales ― Parts service and support The “New” Essex Business Model 9
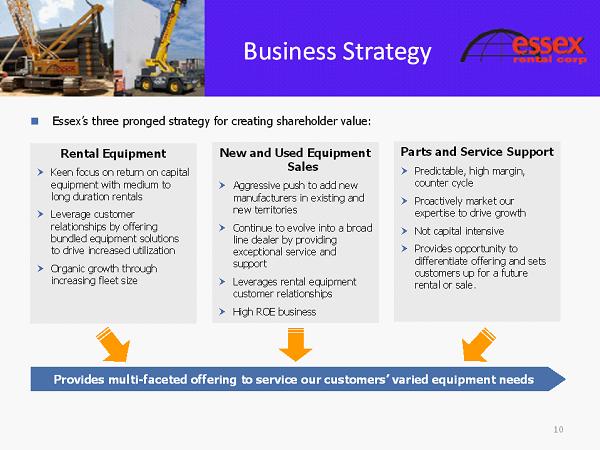
Essex’s three pronged strategy for creating shareholder value: Rental Equipment Keen focus on return on capital equipment with medium to long duration rentals Leverage customer relationships by offering bundled equipment solutions to drive increased utilization Organic growth through increasing fleet size New and Used Equipment Sales Aggressive push to add new manufacturers in existing and new territories Continue to evolve into a broad line dealer by providing exceptional service and support Leverages rental equipment customer relationships High ROE business Parts and Service Support Predictable , high margin, counter cycle Proactively market our expertise to drive growth Not capital intensive Provides opportunity to differentiate offering and sets customers up for a future rental or sale. Provides multi - faceted offering to service our customers’ varied equipment needs Business Strategy 10
Company Overview 2 11
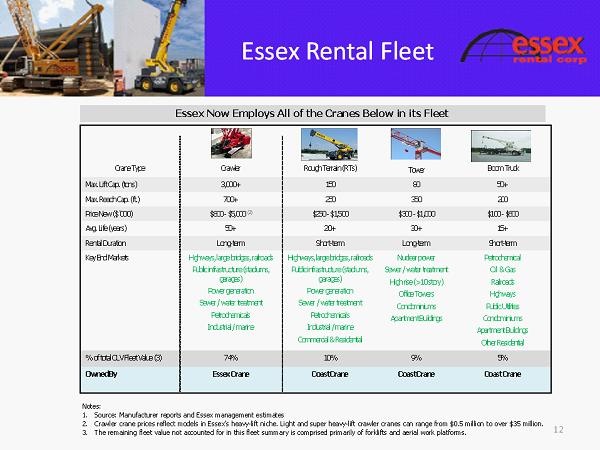
Essex Now Employs All of the Cranes Below in its Fleet Essex Rental Fleet Notes: 1. Source: Manufacturer reports and Essex management estimates 2. Crawler crane prices reflect models in Essex’s heavy - lift niche. Light and super heavy - lift crawler cranes can range from $0.5 m illion to over $35 million. 3. The remaining fleet value not accounted for in this fleet summary is comprised primarily of forklifts and aerial work platfor ms. Crane Type Crawler Rough Terrain (RTs) Tower Boom Truck Max. Lift Cap. (tons) 3,000+ 150 80 50+ Max. Reach Cap. (ft.) 700+ 250 350 200 Price New ($ ‘000) $800 - $5,000 (2) $250 - $1,500 $300 - $1,000 $100 - $600 Avg. Life (years) 50+ 20+ 30+ 15+ Rental Duration Long - term Short - term Long - term Short - term Key End Markets Highways, large bridges, railroads Public infrastructure (stadiums, garages) Power generation Sewer / water treatment Petrochemicals Industrial / marine Highways, large bridges, railroads Public infrastructure (stadiums, garages) Power generation Sewer / water treatment Petrochemicals Industrial / marine Commercial & Residential Nuclear power Sewer / water treatment High rise (>10 story) Office Towers Condominiums Apartment Buildings Petrochemical Oil & Gas Railroads Highways Public Utilities Condominiums Apartment Buildings Other Residential % of total OLV Fleet Value (3) 74% 10% 9% 5% Owned By Essex Crane Coast Crane Coast Crane Coast Crane 12
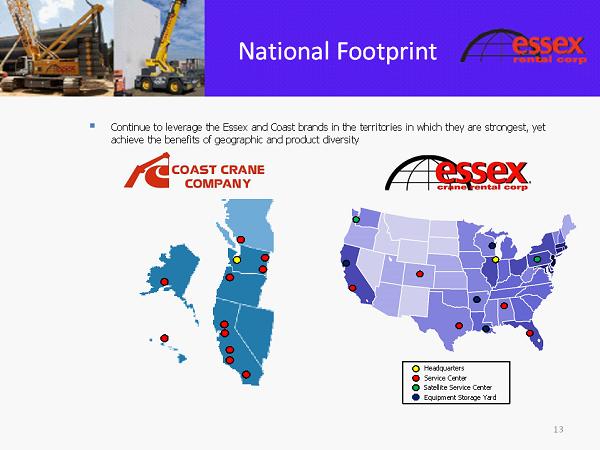
▪ Continue to leverage the Essex and Coast brands in the territories in which they are strongest, yet achieve the benefits of geographic and product diversity Headquarters Service Center Equipment Storage Yard Satellite Service Center National Footprint 13
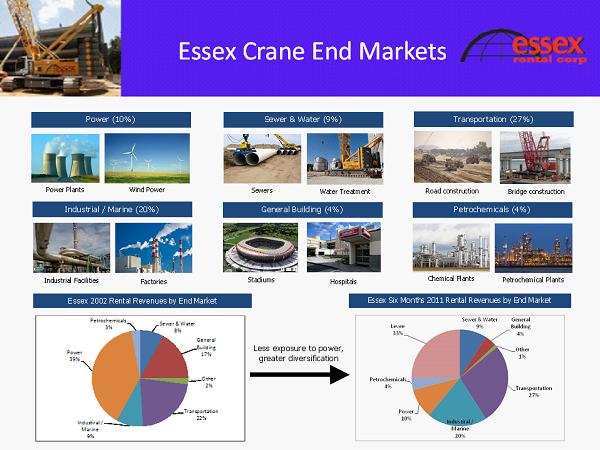
Essex Crane End Markets Essex 2002 Rental Revenues by End Market Less exposure to power, greater diversification Industrial / Marine ( 20%) Industrial Facilities Factories Petrochemicals (4%) Chemical Plants Petrochemical Plants General Building (4%) Hospitals Stadiums Power (10%) Power Plants Wind Power Transportation (27%) Road construction Bridge construction Sewer & Water (9%) Sewers Water Treatment Essex Six Months 2011 Rental Revenues by End Market 14 Sewer & Water 8% General Building 17% Other 2% Transportation 22% Industiral / Marine 9% Power 39% Petrochemicals 3%
New Equipment Sales ▪ Continue to represent Potain Tower Crane line. ▪ Distribution agreements signed with Terex, Manitex, Broderson, Mantis and Tadano in Q1’11: ▪ Each agreement includes distribution to several states, British Columbia, the Yukon, Guam and Republic of the Marshall Islands. ▪ In conjunction with new distribution agreements, Coast Crane ordered new cranes to sell or rent to its customer base from Terex, Tadano, Manitex and Broderson . Used Equipment Sales ▪ Continue to rebalance the Essex crawler crane fleet by selling $20M of smaller, older underutilized cranes ▪ Leverage rent - to - own model relating to boom truck and rough terrain New & Used Equipment Sales 15
▪ Experienced 4 th consecutive quarter of year - over - year improvement in utilization rates of Essex Crane crawler crane rental fleet . ▪ Experienced sequential increases in utilization rates in Q 2 ’ 11 for all categories of rental equipment except crawler cranes . ▪ Expanding fleet with $ 28 million of new equipment purchases over the next 12 months, 90 % of which will be spent on our highly utilized rough terrain cranes . ▪ Public rental companies providing lighter rental equipment are reporting much improved market conditions . Light construction equipment is considered early stage recovery equipment . ▪ Effective August 1 st, we completed the major implementation phase to install a new IT platform at Coast Crane and are now operating on a single Enterprise Resource Planning system across Essex Rental Corp . ▪ Recent quoting activity has shown improvement for quotes to potential customers that have actually been awarded a construction job . Current Market Conditions 16
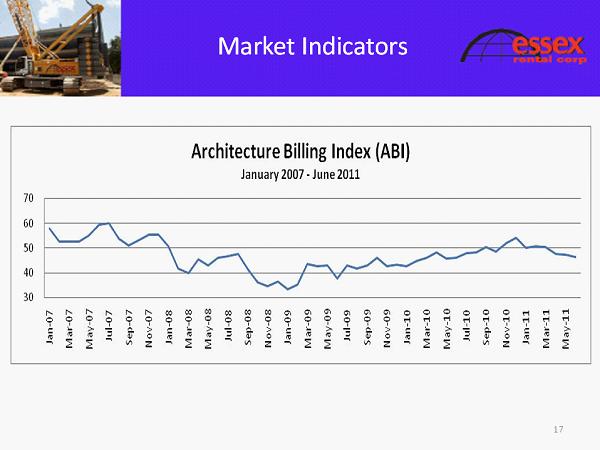
Market Indicators 17
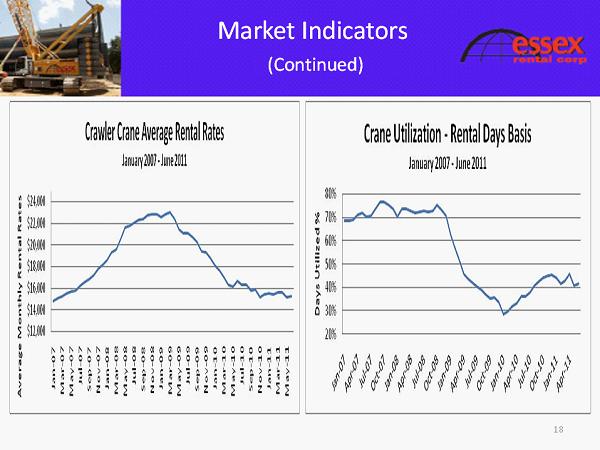
18 Market Indicators (Continued)
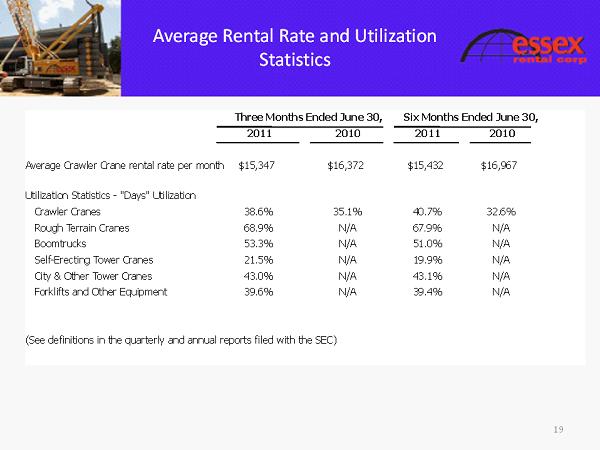
19 Average Rental Rate and Utilization Statistics 2011 2010 2011 2010 Average Crawler Crane rental rate per month $15,347 $16,372 $15,432 $16,967 Utilization Statistics - "Days" Utilization Crawler Cranes 38.6% 35.1% 40.7% 32.6% Rough Terrain Cranes 68.9% N/A 67.9% N/A Boomtrucks 53.3% N/A 51.0% N/A Self - Erecting Tower Cranes 21.5% N/A 19.9% N/A City & Other Tower Cranes 43.0% N/A 43.1% N/A Forklifts and Other Equipment 39.6% N/A 39.4% N/A (See definitions in the quarterly and annual reports filed with the SEC) Six Months Ended June 30, Three Months Ended June 30,
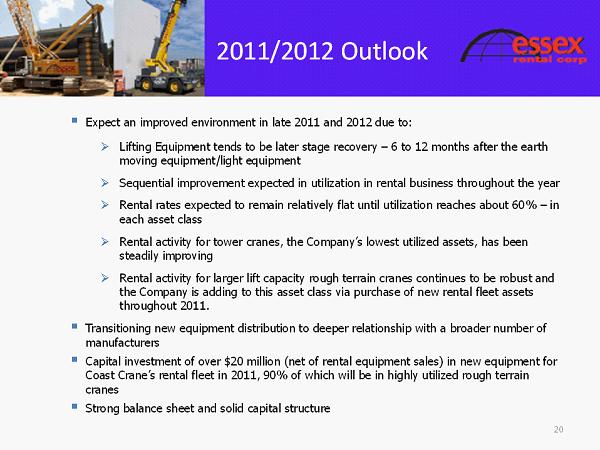
20 ▪ Ex pect an improved environment in late 2011 and 2012 due to: » Lifting Equipment t ends to be later stage recovery – 6 to 12 months after the earth moving equipment /light equipment » S equential improvement expected in utilization in rental business throughout the year » Re ntal rates expected to remain relatively flat until utilization reaches about 60% – in each asset class » Rental activity for tower cranes, the Company’s lowest utilized assets, has been steadily improving » Rental activity for larger lift capacity rough terrain cranes continues to be robust and the Company is adding to this asset class via purchase of new rental fleet assets throughout 2011. ▪ Transitioning new equipment distribution to deeper relationship with a broader number of manufacturers ▪ Capital investment of over $20 million (net of rental equipment sales) in new equipment for Coast Crane’s rental fleet in 2011, 90% of which will be in highly utilized rough terrain cranes ▪ Strong balance sheet and solid capital structure 2011/2012 Outlook
Summary Financial Information and Valuation 3 21
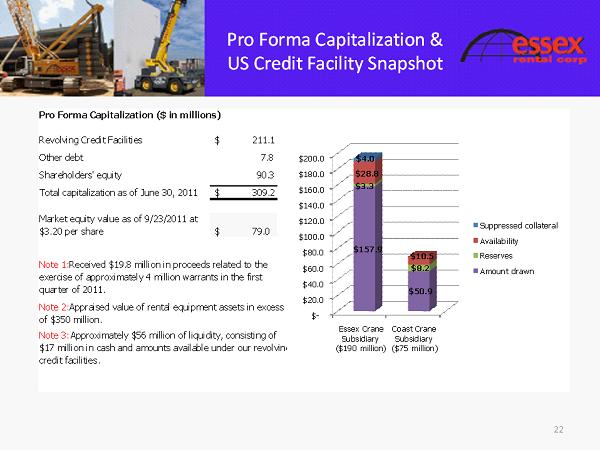
Pro Forma Capitalization & US Credit Facility Snapshot 22 Pro Forma Capitalization ($ in millions) Revolving Credit Facilities 211.1 $ Other debt 7.8 Shareholders' equity 90.3 Total capitalization as of June 30, 2011 309.2 $ Market equity value as of 9/23/2011 at $3.20 per share 7 9.0 $ Note 1: Received $19.8 million in proceeds related to the exercise of approximately 4 million warrants in the first quarter of 2011. Note 2: Appraised value of rental equipment assets in excess of $350 million. Note 3: Approximately $56 million of liquidity, consisting of $17 million in cash and amounts available under our revolving credit facilities. $ - $20.0 $40.0 $60.0 $80.0 $100.0 $120.0 $140.0 $160.0 $180.0 $200.0 Essex Crane Subsidiary ($190 million) Coast Crane Subsidiary ($75 million) $157.9 $50.9 $3.3 $8.2 $28.8 $10.5 $4.0 Suppressed collateral Availability Reserves Amount drawn
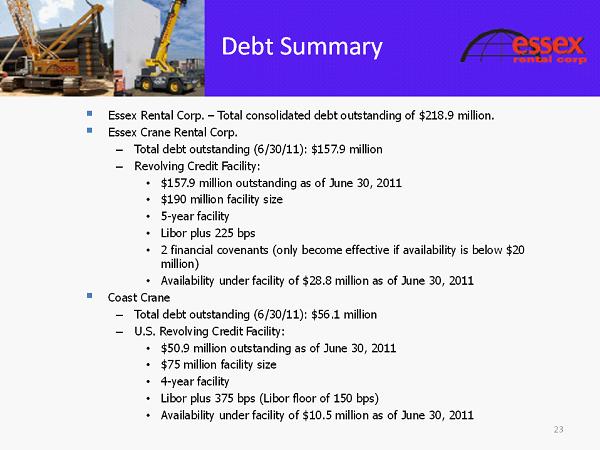
▪ Essex Rental Corp. – Total consolidated debt outstanding of $218.9 million. ▪ Essex Crane Rental Corp. – Total debt outstanding (6/30/11): $157.9 million – Revolving Credit Facility: • $157.9 million outstanding as of June 30, 2011 • $190 million facility size • 5 - year facility • Libor plus 225 bps • 2 financial covenants (only become effective if availability is below $20 million) • Availability under facility of $28.8 million as of June 30, 2011 ▪ Coast Crane – Total debt outstanding (6/30/11): $56.1 million – U.S. Revolving Credit Facility: • $50.9 million outstanding as of June 30, 2011 • $75 million facility size • 4 - year facility • Libor plus 375 bps (Libor floor of 150 bps) • Availability under facility of $10.5 million as of June 30, 2011 Debt Summary 23
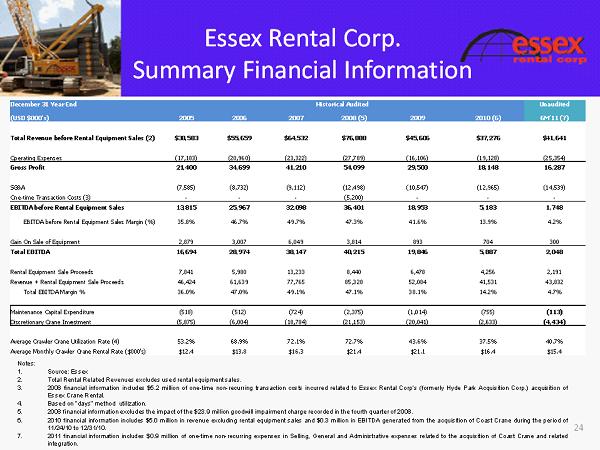
Notes : 1. Source : Essex 2. Total Rental Related Revenues excludes used rental equipment sales . 3. 2008 financial information includes $ 5 . 2 million of one - time non - recurring transaction costs incurred related to Essex Rental Corp’s (formerly Hyde Park Acquisition Corp . ) acquisition of Essex Crane Rental . 4. Based on “days” method utilization . 5. 2008 financial information excludes the impact of the $ 23 . 9 million goodwill impairment charge recorded in the fourth quarter of 2008 . 6. 2010 financial information includes $ 5 . 0 million in revenue excluding rental equipment sales and $ 0 . 3 million in EBITDA generated from the acquisition of Coast Crane during the period of 11 / 24 / 10 to 12 / 31 / 10 . 7. 2011 financial information includes $ 0 . 9 million of one - time non - recurring expenses in Selling, General and Administrative expenses related to the acquisition of Coast Crane and related integration . December 31 Year End Historical Audited Unaudited (USD $000's) 2005 2006 2007 2008 (5) 2009 2010 (6) 6M’11 (7) Total Revenue before Rental Equipment Sales (2 ) $38,583 $55,659 $64,532 $76,888 $45,606 $37,276 $41,641 Operating Expenses (17,183) (20,960) (23,322) (27,789) (16,106) (19,128) (25,354) Gross Profit 21,400 34,699 41,210 54,099 29,500 18,148 16,287 SG&A (7,585) (8,732) (9,112) (12,498) (10,547) (12,965) (14,539) One - time Transaction Costs (3) - - - (5,200) - - - EBITDA before Rental Equipment Sales 13,815 25,967 32,098 36,401 18,953 5,183 1,748 EBITDA before Rental Equipment Sales Margin (%) 35.8% 46.7% 49.7% 47.3% 41.6% 13.9% 4.2% Gain On Sale of Equipment 2,879 3,007 6,049 3,814 893 704 300 Total EBITDA 16,694 28,974 38,147 40,215 19,846 5,887 2,048 Rental Equipment Sale Proceeds 7,841 5,980 13,233 8,440 6,478 4,256 2,191 Revenue + Rental Equipment Sale Proceeds 46,424 61,639 77,765 85,328 52,084 41,531 43,832 Total EBITDA Margin % 36.0% 47.0% 49.1% 47.1% 38.1% 14.2% 4.7% Maintenance Capital Expenditure (518) (512) (724) (2,375) (1,014) (755) (113) Discretionary Crane Investment (5,875) (6,004) (18,784) (21,153) (20,041) (2,633) (4,434) Average Crawler Crane Utilization Rate (4) 53.2% 68.9% 72.1% 72.7% 43.6% 37.5% 40.7% Average Monthly Crawler Crane Rental Rate ($000's) $12.4 $13.8 $16.3 $21.4 $21.1 $16.4 $15.4 Essex Rental Corp. Summary Financial Information 24
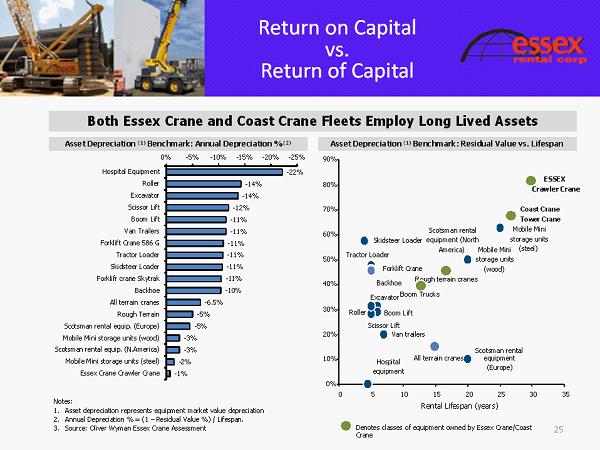
Both Essex Crane and Coast Crane Fleets Employ Long Lived Assets Asset Depreciation (1) Benchmark: Annual Depreciation % (2) - 1% - 2% - 3% - 3% - 5% - 5% - 6.5% - 10% - 11% - 11% - 11% - 11% - 11% - 11% - 12% - 14% - 14% - 22% -25% -20% -15% -10% -5% 0% Essex Crane Crawler Crane Mobile Mini storage units (steel) Scotsman rental equip. (N.America) Mobile Mini storage units (wood) Scotsman rental equip. (Europe) Rough Terrain All terrain cranes Backhoe Forklifr crane Skytrak Skidsteer Loader Tractor Loader Forklift Crane 586 G Van Trailers Boom Lift Scissor Lift Excavator Roller Hospital Equipment Asset Depreciation (1) Benchmark: Residual Value vs. Lifespan Notes: 1. Asset depreciation represents equipment market value depreciation 2. Annual Depreciation % = (1 – Residual Value %) / Lifespan. 3. Source: Oliver Wyman Essex Crane Assessment Return on Capital vs. Return of Capital Rental Lifespan (years) Van trailers Boom Lift Scissor Lift Roller Backhoe Tractor Loader Forklift Crane Excavator Skidsteer Loader Hospital equipment Mobile Mini storage units (steel) Scotsman rental equipment (North America) Mobile Mini storage units (wood) Scotsman rental equipment (Europe) All terrain cranes ESSEX Crawler Crane 0% 10% 20% 30% 40% 50% 60% 70% 80% 90% 0 5 10 15 20 25 30 35 Rough terrain cranes Boom Trucks Coast Crane Tower Crane 25 Denotes classes of equipment owned by Essex Crane/Coast Crane
▪ Market leader with a long industry heritage able to leverage scale ▪ Committed management team ; management and Board of Directors represent ownership in excess of 30 % of common shares outstanding ▪ Long lived assets with OLV of $ 350 million ; stock trades at significant discount to OLV ▪ Strong free cash flow generation potential ▪ Poised to participate in growing infrastructure & energy related markets as economy recovers and as capacity demands updating ▪ Sound capital structure including attractive, flexible and committed debt facilities ▪ Utilization has shown growth and rental rates have bottomed Essex is considered to be an attractive investment opportunity for the following reasons: Investment Summary 26