Attached files
| file | filename |
|---|---|
| 8-K - FORM 8-K - Addus HomeCare Corp | d236019d8k.htm |
 JMP 2011
Healthcare Conference September 2011
EXHIBIT 99.1 |
 2
Mission Statement
It is the primary mission of Addus HealthCare to improve the health and well
being of our consumers through the provision of quality, cost-effective health
care services.
We will accomplish our goals by fostering an environment in which our
employees enthusiastically support and advance our mission.
Reward for accomplishing our mission includes pride in our organization,
contribution to the community and a reasonable profit.
|
 Forward-Looking Statements
3
The following information contains, or may be deemed to contain, forward-looking
statements. By their nature, forward-looking statements involve risks and
uncertainties because they relate to events and depend on circumstances that may
or may not occur in the future. The future results of Addus may vary from
the results expressed in, or implied by, the following forward-looking
statements, possibly to a material degree, and historical results may not be an
indication of future performance. For a discussion of some of the
important factors that could cause Addus' results to differ from those expressed
in, or implied by, the following forward-looking statements, please refer to
Addus’ most recent Annual Report on Form 10-K, and its Quarterly reports on
Form 10-Q each of which is available at www.SEC.gov, particularly the
Sections entitled “Risk Factors”. Addus undertakes no obligation
to update or revise any forward-looking statements, except as may be
required by law. ,
|
 About
Addus Founded in 1979
Comprehensive provider of social and medical
services in the home:
—
Personal Care
—
Home Health
—
Private Duty
—
Adult Day Service
13,000+ employees
26,000+ consumers (many dual eligible)
4
Diversified payor base (200+ payors)
—
Largest payor -
38% of 2010 total revenues
—
Medicare -
12% of 2010 total revenues
2010 revenues of $271.7 million and Adjusted
EBITDA
of $16.3 million
_____________________________________
Note: Adjusted EBITDA is defined as net income plus depreciation and
amortization, net interest expense, income tax expense and stock-based compensation expense. Adjusted
EBITDA is a performance measure used by management that is not calculated under
generally accepted accounting principles in the United States (GAAP). It should not be
considered in isolation or as a substitute for net income, operating income or any
other measure of financial performance calculated in accordance with GAAP. Adjusted EBITDA
margin is computed as the percentage of Adjusted EBITDA to revenue for the applicable
period. 125 Locations Across 19 States
81%
19%
Two Primary Divisions
2010 Revenue Percentage
Home &
Community
Home Health |
 Census and
Revenue Trends 5
Census
Revenues
(millions)
0
5,000
10,000
15,000
20,000
25,000
2007
2008
2009
2010
$0
$50
$100
$150
$200
$250
$300
2007
2008
2009
2010 |
 Our
Clients 6
Addus provides care for the 5% of the population that is the most costly!
Source: Kaiser Family Foundation calculations using data from U.S.
Department of Health and Human Services, Agency for Healthcare Research and
Quality, Medical Expenditure Panel Survey (MEPS), 2007 22.9%
49.5%
65.2%
74.6%
81.2%
97.0%
3.0%
0.0%
10.0%
20.0%
30.0%
40.0%
50.0%
60.0%
70.0%
80.0%
90.0%
100.0%
Top 1%
Top 5%
Top 10%
Top 15%
Top 20%
Top 50%
Bottom 50%
(
$44,482)
(
$4,064)
(
$5,798)
(
$8,716)
(
$15,806)
(
$786)
(<$786)
Percent of Population, Ranked by Health Care Spending
Concentration of Health Care Spending in the U.S. Population, 2007
Facts: Nearly 75% of those who live to 85 will eventually need assistance at
home.
Approximately
50% of US healthcare spending is concentrated in 5% of the population.
97% of
healthcare spending is concentrated on 50% of the population.
|
 Addus
Client Profile and Economics 7
Home & Community
Home Health
Average Length of Service
20 months
2.7 months
Average Reimbursement per Consumer Episode
$17,622
$3,512
Gross Profit per Consumer Episode
Gross Margin
$4,476
25.4%
$1,637
46.6%
Divisional Earnings per Consumer Episode
Division Pre-Corporate Earnings Margin
$1,815
10.3%
$365
10.4%
Note: Data as of December 31, 2010
(1)
Home & Community revenues for the calendar year 2010 of $220.8 million divided by
average weekly census for 2010 of 20,878 divided by 12 months multiplied by 20 months.
(2)
Based on Medicare revenues per episode completed for calendar 2010 of $2,634 and the
average length of service of 2.7 months (3)
For the year ended December 31, 2010.
(4)
For the year ended December 31, 2010. Divisional Earnings is defined as Divisional
operating income . Divisional Earnings margin is computed as the percentage of Divisional Earnings to revenue for the applicable period.
(1)
(2)
(3)
(4) |
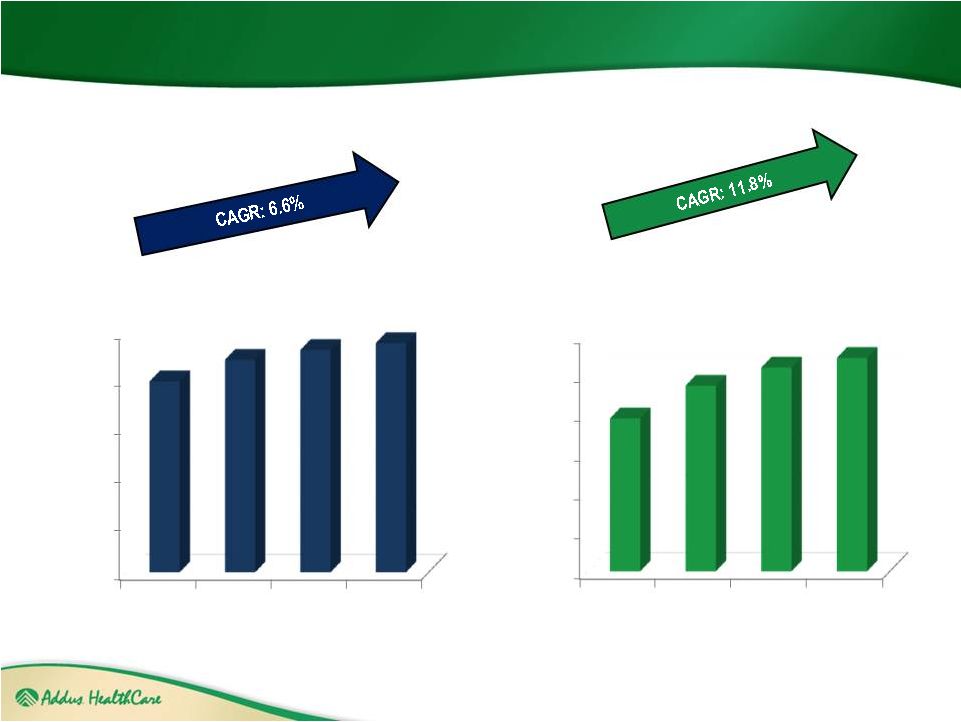
 Macro
Growth Drivers Aging U.S. population projected to more than
double by 2050
—
Age
65
and
over
–
fastest-growing
segment
8
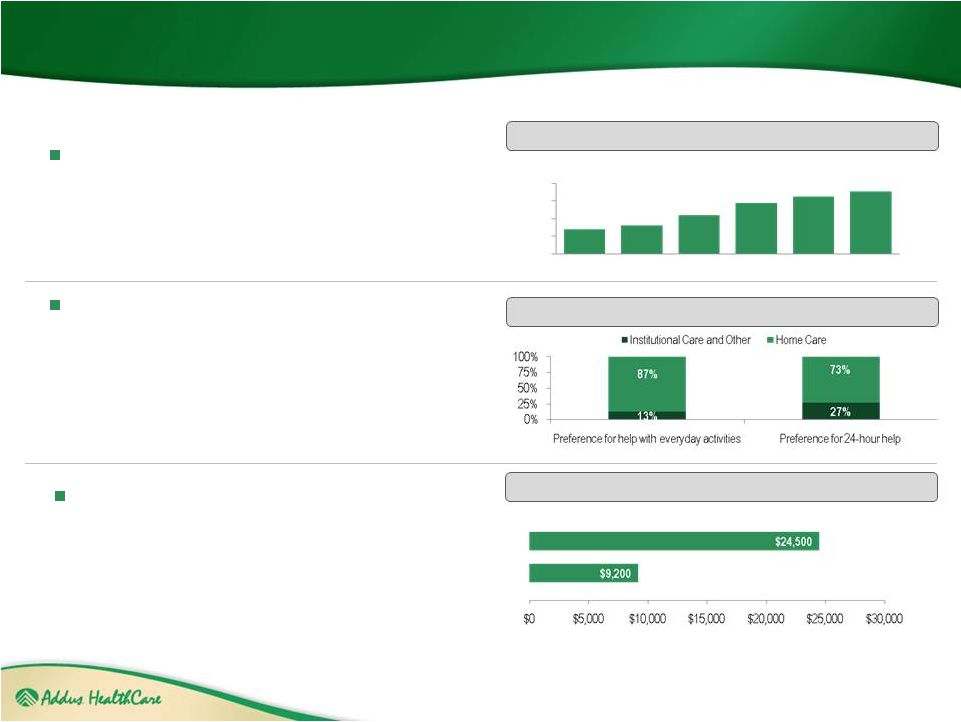
Consumer preference / Public policy
awareness
—
Consumers prefer to receive care at home
—
Increasing awareness of home care as
viable option
Cost effectiveness
—
Home care costs less than hospital or
nursing home care
Nursing Homes
Home Care
(in millions)
35.0
40.2
54.8
72.1
81.2
88.6
0
25
50
75
100
2000
2010
2020
2030
2040
2050
Annual
Medicaid
Spending
per
Beneficiary
(3)
Consumer
Preference
for
People
Age
50
&
Older
with
Disabilities
(2)
U.S.
Population
Age
65
and
Over
(1)
(1)
Source: Grayson Vincent and Victoria Velkoff. The Next Four Decades. The
Older Population in the United States: 2010 to 2050” (May 2010)
http://www.aoa.gov/AoARoot/Aging_Statistics/future_growth/DOCS/p25-1138.pdf (2)
Source: Mary Jo Gibson. AARP Public Policy Institute: “Beyond 50 2003: A
Report to the Nation on Independent Living and Disability,” http://assets.aarp.org/rgcenter/il/beyond_50_il_1.pdf. Note:
Home Care includes care administered in the home by friends, family, or an
agency. Institutional care includes care that is provided in an assisted living or residential setting, nursing home or other.
(3)
Source: Kassner, Reinhard, Fox-Grage, Houser, Accius, Coleman and Milne. AARP
Public Policy Institute: “A Balancing Act: State Long-Term Care Reform,” (July 2008).
(4)
http://assets.aarp.org/rgcenter/il/inb161_ltc.pdf. |
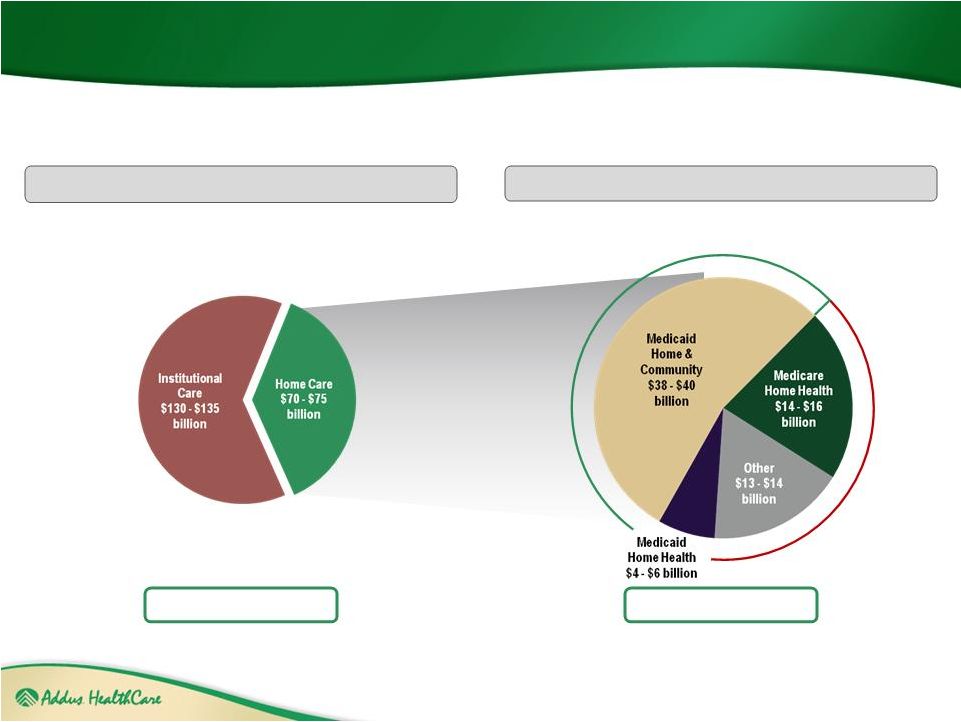 Current
Market Opportunity 9
$200 -
$210 billion
$70 -
$75 billion
Home Care Market
Long-Term Care Market
Social
Funding
Medical
Funding
Source: Company estimates based on: Georgetown University Long-Term Care
Financing Project. “Medicare and Long-Term Care,” (February 2007), http://ltc.georgetown.edu/pdfs/medicare0207.pdf and
Center for Medicare and Medicaid Services. “National Health Expenditure
Projections 2008-2018,” http://www.cms.hhs.gov/NationalHealthExpendData/downloads/proj2008.pdf, and MedPAC. “A Data
Book: Healthcare spending and the Medicare program: June 2010,”
http://www.medpac.gov/chapters/Jun09DataBookSec9.pdf. |
 Increased
Use of Homecare 10
Home and Community-Based Services as % of
Medicaid Long-Term Care Expenditures
(1)
0%
5%
10%
15%
20%
25%
30%
35%
40%
45%
50%
24%
26%
27%
28%
30%
31%
34%
37%
38%
40%
43%
44%
45%
1997
1998
1999
2000
2001
2002
2003
2004
2005
2006
2007
2008
2009
(1)
Source: Thomson Reuters (formerly Medstat). “Medicaid Long Term Care Expenditures
FY 2000,” (August 17, 2010).
http://www.hcbs.org/files/193/9639/2009LTCExpenditures.pdf 3. Note: Medicaid data
represents home & community services, which is comprised of personal care and HCBS
waivers.
|
 Addus
Positioned to Excel Under Healthcare Reform 11
“The Pre-Acute Solution . . . .
to
the
Post-Acute
Problem”
SM |
 The
Healthcare “Dis-continuum” 12
HIGH
COSTS
LOW |
 Addus
Integrated Services – Early Intervention Lowers Cost
13
Homecare Aid identifies
change in condition.
Home Health nurse
conducts home
assessment.
Coordinates with
payor.
Physician is consulted
and Home Health services
ordered.
Home Health field
nurse / therapists
provide medical
services. Coordinate
with Homecare Aid.
Family advised
throughout the
process for additional
support. |
 The Addus
Difference – Integrated Pre-Acute Services
14
Addus
Integrated
Pre-Acute
Services:
•
Continuous
monitoring
of
client
/
member
medical
condition(s)
•
Coordination
of
medical
care
with
healthcare
team
•
Early
identification
of
disease
processes
•
Early
intervention
/
lower
costs
•
Reduced
pain
and
suffering
•
Improved
quality
of
life |
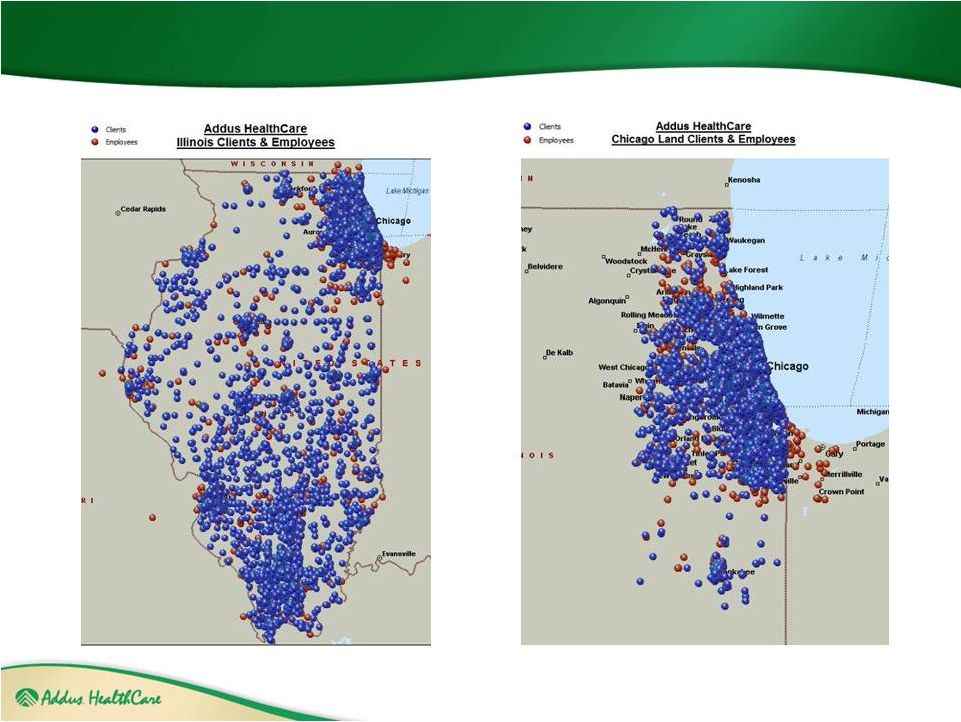 15
The Addus Difference –
Geographic Coverage |
 16
The Addus Difference –
Geographic Coverage |
 17
The Addus Difference –
Geographic Coverage |
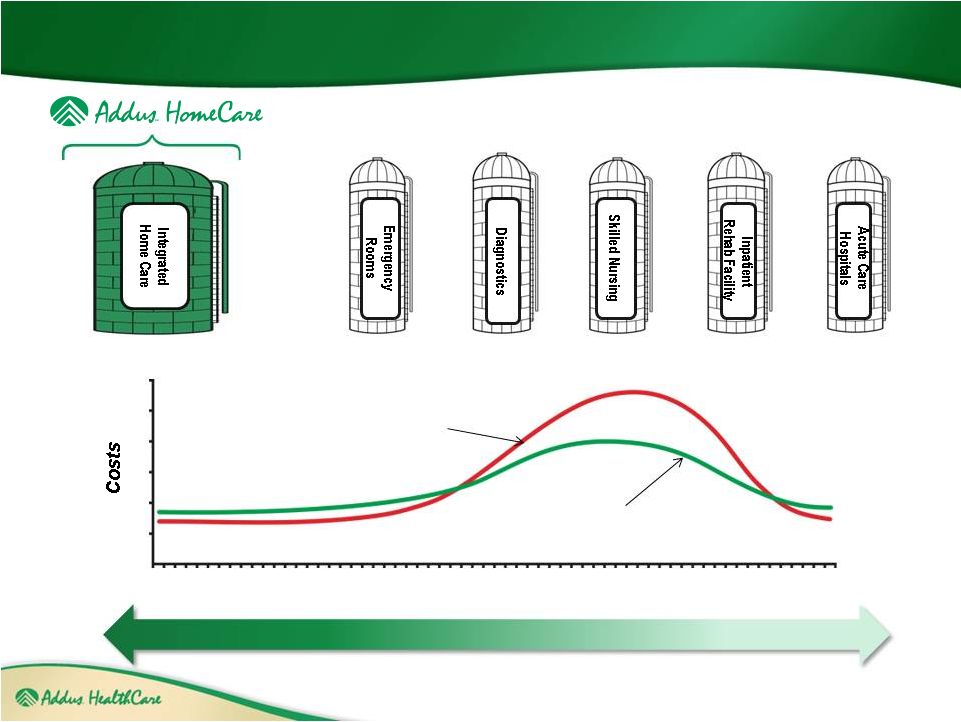 Addus
Integrated Services – Changing the Cost Curve
18
HIGH
COSTS
LOW
Time
Current Cost Curve
Projected Cost Curve |
 19
Homecare Utilization Dramatically Lowers Costs
19
Source: CCP Cost Effectiveness: Comparison of CCP growth with Nursing
Facility Prevalence Reductions HCBS Strategies Inc. February
10, 2010 Conclusion:
Over a 28 year period, which
corresponds to the growth
of the Community Care Program
in Illinois and Addus, the
75 + years old population grew 54%,
while nursing home residents
declined 8.2%.
The annual savings to the State
and Federal Governments is
$1 Billion.
1980
2008
0
100000
200000
300000
400000
500000
600000
700000
800000
900000
Illinois Population > 75 years
68000
70000
72000
74000
76000
78000
80000
Medicaid Nursing Home Residents |
 Second
Quarter 2011 Summary Total net service revenues up 1.6% to $68.3M
Home & Community increased 1.6% to $55.0M
Home Health increased 1.7% to $13.2M
Adjusted EBITDA of $3.7M, compared to $4.3M in Q2 ’2010
Net income of $1.3M, or $0.12 per diluted share, compared to $1.7M, or
$0.16 per diluted share
Cash flows from operations of $29.1M*, compared to $0.8M
Accounts receivable DSO has sequentially improved to 65 days from 84 as
of March 31, 2011
20
* Includes a significant payment received from the state of Illinois at the end of
June 2011 |
   Condensed
Consolidated Statements of Income ($ in millions
Except per share amounts)
21
(1)
(1) Six Month amounts for 2010 and 2011 are Unaudited
2007
2008
2009
2010
6/30/2010
6/30/2011
Net service revenues
194.6
$
236.3
$
259.3
$
271.7
$
131.8
$
135.1
$
Gross profit
55.3
69.1
76.6
79.9
38.6
39.2
Total operating expenses
50.3
58.2
64.8
67.9
32.6
34.5
Net income
0.2
4.0
3.6
6.0
3.0
2.2
Net income (loss)
attributable to common
shareholders
(3.7)
$
(0.3)
$
(1.8)
$
6.0
$
3.0
$
2.2
$
Earnings (loss) per share
(3.62)
$
(0.24)
$
(0.66)
$
0.57
$
0.29
$
0.20
$
For the Year Ended December 31,
For the Six Months Ended |
 Organic
Growth Augmented by Acquisitions Fragmented industry
12,000+ homecare agencies in
U.S.
Numerous acquisition
opportunities
Smaller players struggling;
expect consolidation to
increase
Acquired 12 homecare
agencies since 2007
Average purchase price
multiple of 3.4x trailing actual
EBITDA
Average cash consideration of
62% and earnout / other
contingent payments of 38%
22
Historic Growth Through M & A
$0
$50,000
$100,000
$150,000
$200,000
$250,000
$300,000
2007
2008
2009
2010
Organic Revenue
M&A Revenue |
 Home
& Community Segment 23
($ in millions)
Home & Community
12/31/2007
12/31/2008
12/31/2009
12/31/2010
Average Weekly Census
17,117
19,432
20,182
20,878
Billable Hours (in thousands)
10,421
12,139
12,835
13,132
Reimbursement Rate per Billable Hour
$14.36
$15.57
$16.37
$16.81
(1)
Divisional
EBITDA
is
defined
as
Divisional
operating
income
plus
depreciation
and
amortization.
Divisional
EBITDA
margin
is
computed
as
the
percentage
of
Divisional
EBITDA to revenue for the
applicable
period.
Divisional
EBITDA
is
a
performance
measure
used
by
management
that
is
not
calculated
under
generally
accepted
accounting
principles
in
the
United
States
(GAAP).
It
should
not be
considered
in
isolation
or
as
a
substitute
for
net
income,
operating
income
or
any
other
measure
of
financial
performance
calculated
in
accordance
with
GAAP.
Divisional
EBITDA
margin is
computed as the percentage of Divisional EBITDA to revenue for the applicable
period. (2)
Includes incremental increase in bad debt expense of $1.5 million, recorded in the
fourth quarter of 2009. $149.6
$189.0
$210.1
$220.8
11.1%
11.6%
11.3%
11.5%
0.0%
2.0%
4.0%
6.0%
8.0%
10.0%
12.0%
14.0%
16.0%
18.0%
20.0%
$0.0
$25.0
$50.0
$75.0
$100.0
$125.0
$150.0
$175.0
$200.0
$225.0
CY 2007
CY 2008
CY 2009
CY 2010
(2)
Divisional EBITDA Margin
Revenue
(1) |
 Home
Health Segment 24
($ in millions)
Home Health
12/31/2007
12/31/2008
12/31/2009
12/31/2010
Average Weekly Census
2,565
2,683
2,955
2,976
% of Medicare Revenues
55.1%
58.3%
61.3%
64.1%
Medicare Episodic Amount
$2,563
$2,606
$2,569
$2,634
Divisional EBITDA Margin
(1)
Revenue
$44.9
$47.3
$49.2
$51.0
10.5%
14.3%
15.3%
11.7%
0.0%
2.0%
4.0%
6.0%
8.0%
10.0%
12.0%
14.0%
16.0%
18.0%
20.0%
$0.0
$10.0
$20.0
$30.0
$40.0
$50.0
CY 2007
CY 2008
CY 2009
CY 2010
$44.9
$47.3
$49.2
(1)
Divisional EBITDA is defined as Divisional operating income plus depreciation and
amortization. Divisional EBITDA margin is computed as the percentage of Divisional EBITDA to revenue for
the applicable period. Divisional EBITDA is a performance measure used by management
that is not calculated under generally accepted accounting principles in the United States (GAAP). It
should not be considered in isolation or as a substitute for net income, operating
income or any other measure of financial performance calculated in accordance with GAAP. Divisional EBITDA
margin is computed as the percentage of Divisional EBITDA to revenue for the applicable
period. |
 Divisional EBITDA by Reporting Segment
($ in millions)
25
Year Ended
Six Months Ended
12/31/2007
12/31/2008
12/31/2009
12/31/2010
6/30/2010
6/30/2011
Net Service Revenues
$149.6
$189.0
$210.1
$220.8
$106.8
$109.2
Cost of Service Revenues
(113.8)
(141.8)
(156.6)
(164.6)
(79.7)
(81.9)
General & Administrative
(19.2)
(25.2)
(29.7)
(30.7)
(14.9)
(14.7)
Divisional EBITDA
$16.6
$22.0
$23.8
$25.5
$12.2
$12.6
Home & Community
Home Health
Year Ended
Six Months Ended
12/31/2007
12/31/2008
12/31/2009
12/31/2010
6/30/2010
6/30/2011
Net Service Revenues
$44.9
$47.3
$49.2
$51.0
$24.9
$25.9
Cost of Service Revenues
(25.5)
(25.4)
(26.1)
(27.2)
(13.5)
(14.1)
General & Administrative
(14.7)
(15.2)
(15.6)
(17.8)
(8.4)
(10.0)
Divisional EBITDA
$4.7
$6.7
$7.5
$6.0
$3.0
$1.8
25
Note: Divisional EBITDA is defined as Divisional operating income plus
depreciation and amortization. Divisional EBITDA margin is computed as the percentage of Divisional EBITDA to revenue
for
the
applicable
period.
Divisional
EBITDA
is
a
performance
measure
used
by
management
that
is
not
calculated
under
generally
accepted
accounting
principles
in
the
United
States
(GAAP). It should not be considered in isolation or as a substitute for net
income, operating income or any other measure of financial performance calculated in accordance with GAAP.
6/30/2010 and 6/30/2011 amounts are unaudited. |
     Summary
Balance Sheet 26
($ in millions)
* Includes a significant payment received from the state of Illinois at the end of
June 2011 6/30/2011 amounts are unaudited
Key Balances
12/31/2009
12/31/2010
6/30/2011
Cash
$0.5
$0.8
$ 24.1 *
Accounts receivable, net
70.5
71.0
51.3
Total assets
161.3
166.9
170.1
Debt, including current maturities
49.2
45.2
40.0
Stockholders’ equity
80.6
88.1
90.4
Debt to capital ratio
37.9%
33.9%
30.7% |
 Improving
Days Sales Outstanding 27
# of Days
Accounts Receivable Days Sales Outstanding
40
60
80
100
120
140
160
180
Q1 2010
Q2 2010
Q3 2010
Q4 2010
Q1 2011
Q2 2011
Total Company
-
DSO
Largest Payor in Illinois DSO |
 Key
Management Initiatives – Positioning for Growth
28
Improve Operating Margins and Outcomes
People:
•
New leadership in Finance,
Operations and Sales
•
Agency staff focused on growth
•
Professional Call Center staff
•
Sales team expansion
Process:
•
Focus on Integrated Model
•
Centralized Call Center
•
Centralizing administrative
processes and activities
•
Focus on operating standards
and managing to metrics
Technology:
•
Telephony solution
•
Enhanced VOIP
telephone solutions
linking all offices
•
Enhanced Business
Intelligence solutions
•
Standardize and install
human resource and
payroll solutions
•
Point of Care for Home
Health Division
Process
Technology
People
28 |
 Investment Highlights
29
Large & Growing Market
Broad Range of Services and Payors
Positioned to Excel under Healthcare Reform
Significant
Operational
Scale Across
National Footprint
History of Growth through Acquisition
Multiple
Organic
Growth
Opportunities
Experienced Management Team
Differentiated, Integrated Care Model |
 Adjusted
EBITDA Reconciliation 30
($ in millions)
Year Ended
Sis Months Ended
12/31/2007
12/31/2008
12/31/2009
12/31/2010
6/30/2010
6/30/2011
Net Income
$0.2
$4.0
$3.6
$6.0
$3.0
$2.2
Net Interest Expense
4.8
5.8
6.8
3.0
1.5
1.4
Income Tax Expense
0.1
1.1
1.4
3.0
1.5
1.4
Depreciation & Amortization
6.0
6.1
4.9
4.0
1.9
1.9
Severance Costs Related to
Former Chairman
--
--
1.2
--
--
--
Stock-based Compensation
Expense
0.9
0.2
0.3
0.3
0.1
0.1
Adjusted EBITDA
$12.0
$17.2
$18.2
$16.3
$8.0
$6.7
_____________________________________
(1)
Included as one-time charge associated with the Company’s IPO completed in
November 2009. (2)
Adjusted EBITDA is defined as net income plus depreciation and amortization, net
interest expense, income tax expense and stock-based compensation expense. Adjusted EBITDA is a performance measure used by
management that is not calculated under generally accepted accounting principles in the
United States (GAAP). It should not be considered in isolation or as a substitute for net income, operating income or any other measure of
financial performance calculated in accordance with GAAP.
(3)
6/30/2010 and 6/30/2010 and 6/30/2011 amounts are unaudited.
(3)
(2)
(1) |
 Divisional EBITDA Reconciliation
31
($ in millions)
Year Ended
Six Months Ended
12/31/2007
12/31/2008
12/31/2009
12/31/2010
6/30/2010
6/30/2011
Operating Income
$12.7
$17.6
$20.4
$22.7
$11.0
$11.3
Depreciation &
Amortization
4.4
3.4
2.8
1.2
1.3
Divisional EBITDA
$16.6
$22.0
$23.8
$25.5
$12.2
$12.6
Home & Community
Home Health
Year Ended
Six Months Ended
12/31/2007
12/31/2008
12/31/2009
12/31/2010
6/30/2010
6/30/2011
Operating Income
$3.5
$5.8
$6.8
$5.3
$2.7
$1.5
Depreciation &
Amortization
1.2
0.9
0.7
0.7
0.3
0.3
Divisional EBITDA
$4.7
$6.7
$7.5
$3.0
$1.8
$6.0
(1)
(1)
3.9
(1) Divisional EBITDA is defined as divisional operating
income plus depreciation and amortization. Divisional EBITDA is a performance measure used by management that is not calculated under generally accepted
accounting principles in the United States (GAAP). It should not be considered in
isolation or as a substitute for net income, operating income or any other measure of financial performance calculated in accordance
with GAAP.
|