Attached files
| file | filename |
|---|---|
| 8-K - 8-K - NORTHSTAR REALTY FINANCE CORP. | a11-26944_18k.htm |
Exhibit 99.1
|
|
Investor Presentation September 2011 |
|
|
2 Certain statements in this presentation contain forward-looking statements, within the meaning of the Private Securities Litigation Reform Act of 1995, including statements about future results, projected yields and performance, market and industry trends, investment opportunities, business conditions and other matters. Forward-looking statements concern future circumstances and results and other statements that are not historical facts and are sometimes identified by the words “may,” “will,” “should,” “potential,” “intend,” “expect,” “seek,” “anticipate,” “estimate,” “believe,” “could,” “project,” “predict,” “continue” or other similar words or expressions. The forward-looking statements involve a number of significant risks and uncertainties. Future results may differ materially from historical results and you should not consider annualized data to be a reliable indicator of future results. A number of factors, including those factors set forth under the section entitled “Risk Factors” in the Annual Report on Form 10-K, as amended, of NorthStar Realty Finance Corp. (the “Company”), could cause the Company’s actual results, performance, achievements or industry results to be materially different from any future results, performance and achievements expressed or implied by these forward-looking statements. Additional information concerning factors that could cause actual results to materially differ from those in the forward-looking statements is contained in the Securities and Exchange Commission filings of the Company. The Company does not guarantee that the assumptions underlying such forward-looking statements are free from errors. The Company undertakes no obligation to publicly update any information whether as a result of new information, future events, or otherwise, except as may be required by applicable securities laws. All financial data in this presentation is approximate and as of June 30, 2011 except where noted. This presentation does not constitute an offer to sell or a solicitation of an offer to buy any securities of the Company. Safe Harbor |
|
|
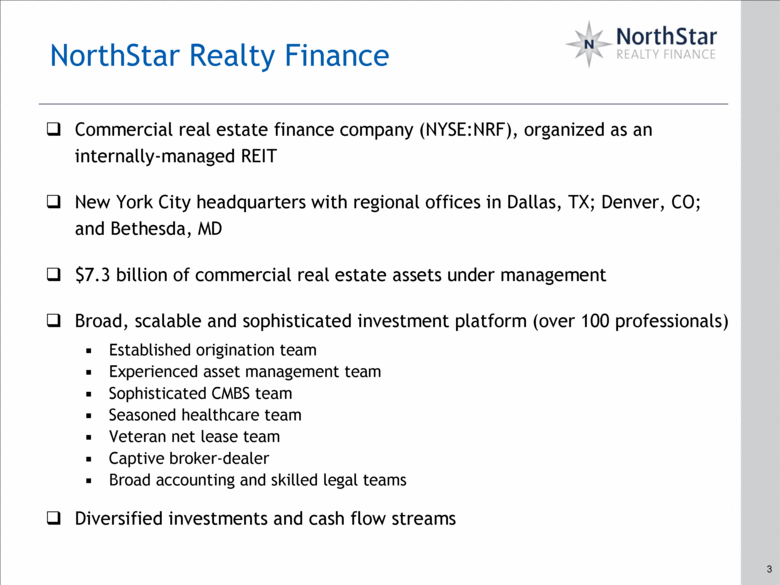
3 Commercial real estate finance company (NYSE:NRF), organized as an internally-managed REIT New York City headquarters with regional offices in Dallas, TX; Denver, CO; and Bethesda, MD $7.3 billion of commercial real estate assets under management Broad, scalable and sophisticated investment platform (over 100 professionals) Established origination team Experienced asset management team Sophisticated CMBS team Seasoned healthcare team Veteran net lease team Captive broker-dealer Broad accounting and skilled legal teams Diversified investments and cash flow streams NorthStar Realty Finance |
|
|
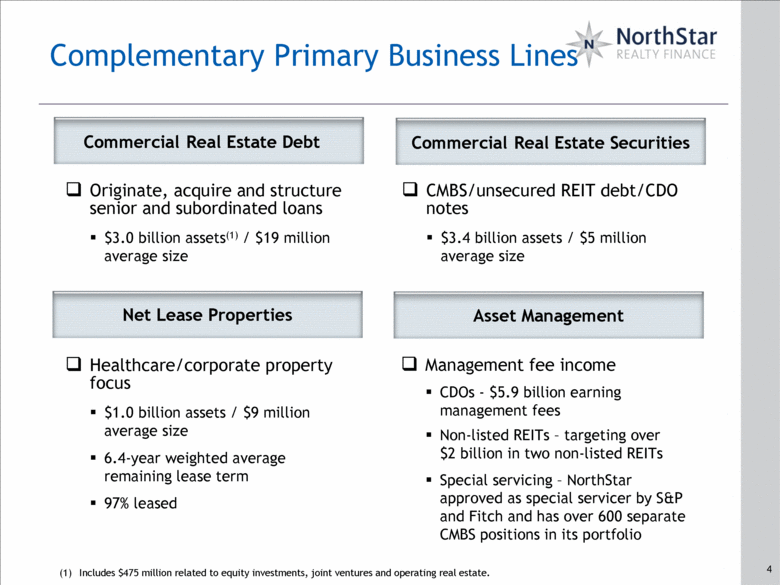
4 4 (1) Includes $475 million related to equity investments, joint ventures and operating real estate. Commercial Real Estate Debt Commercial Real Estate Securities Net Lease Properties Originate, acquire and structure senior and subordinated loans $3.0 billion assets(1) / $19 million average size Asset Management Complementary Primary Business Lines CMBS/unsecured REIT debt/CDO notes $3.4 billion assets / $5 million average size Management fee income CDOs - $5.9 billion earning management fees Non-listed REITs – targeting over $2 billion in two non-listed REITs Special servicing – NorthStar approved as special servicer by S&P and Fitch and has over 600 separate CMBS positions in its portfolio Healthcare/corporate property focus $1.0 billion assets / $9 million average size 6.4-year weighted average remaining lease term 97% leased |
|
|
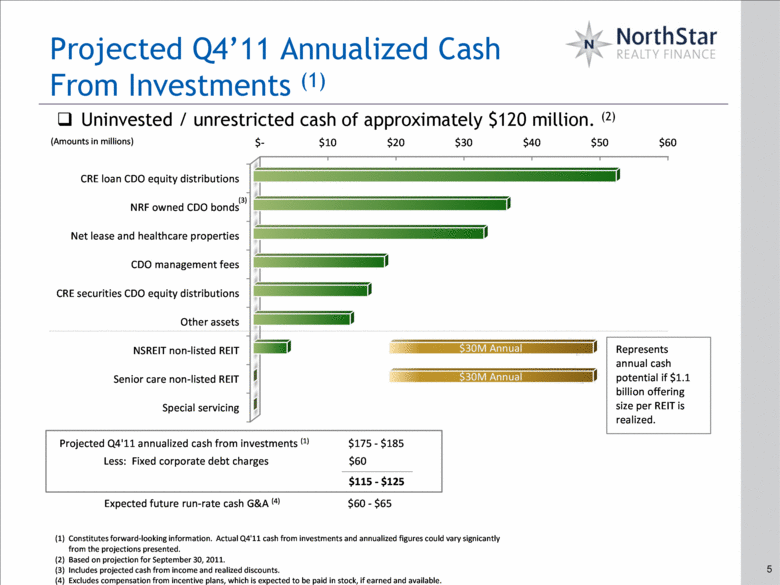
Projected Q4’11 Annualized Cash From Investments (1) Uninvested / unrestricted cash of approximately $120 million. (2) $- $10 $20 $30 $40 $50 $60 Special servicing Senior care non-listed REIT NSREIT non-listed REIT Other assets CRE securities CDO equity distributions CDO management fees Net lease and healthcare properties NRF owned CDO bonds CRE loan CDO equity distributions $30M Annual $30M Annual Projected Q4'11 annualized cash from investments (1) $175 - $185 Less: Fixed corporate debt charges $60 $115 - $125 (1) Constitutes forward - looking information. Actual Q4'11 cash from investments and annualized figures could vary signicantly from the projections presented. (2) Based on projection for September 30, 2011. (3) Includes projected cash from income and realized discounts. (4) Excludes compensation from incentive plans, which is expected to be paid in stock, if earned and available. (Amounts in millions) (3) Represents annual cash potential if $1.1 billion offering size per REIT is realized. Expected future run-rate cash G&A (4) $60 - $65 |
|
|
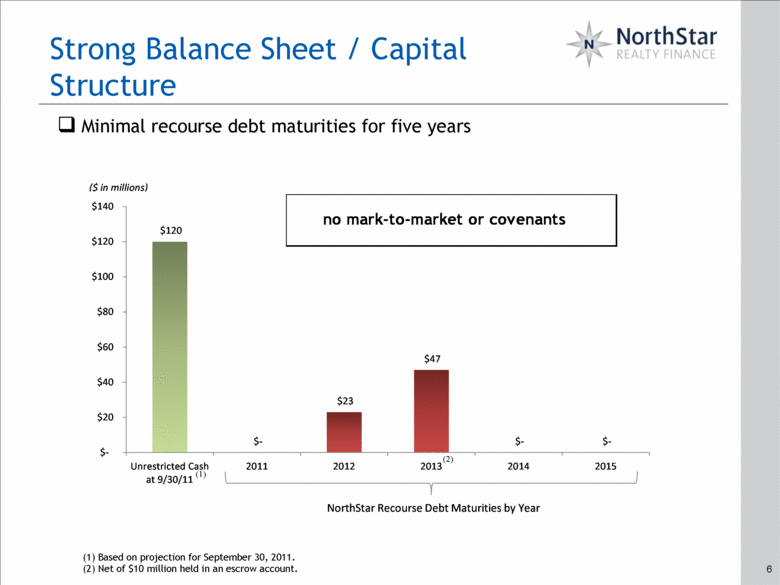
(1) Based on projection for September 30, 2011. (2) Net of $10 million held in an escrow account. 6 Minimal recourse debt maturities for five years (2) Strong Balance Sheet / Capital Structure (1) $120 $ - $23 $47 $ - $ - $- $20 $40 $60 $80 $100 $120 $140 Unrestricted Cash at 9/30/11 2011 2012 2013 2014 2015 NorthStar Recourse Debt Maturities by Year ($ in millions) no mark-to-market or covenants |
|
|
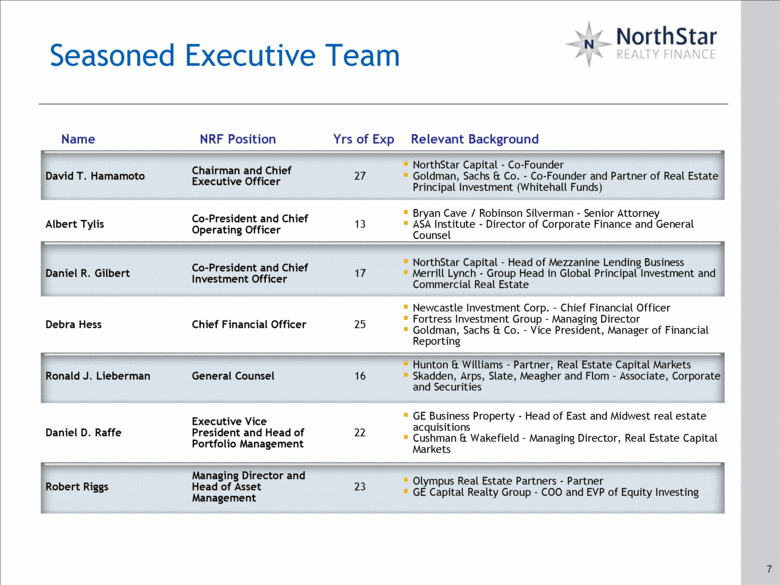
Name NRF Position Yrs of Exp Relevant Background David T. Hamamoto Chairman and Chief Executive Officer 27 NorthStar Capital - Co-Founder Goldman, Sachs & Co. - Co-Founder and Partner of Real Estate Principal Investment (Whitehall Funds) Albert Tylis Co-President and Chief Operating Officer 13 Bryan Cave / Robinson Silverman - Senior Attorney ASA Institute - Director of Corporate Finance and General Counsel Daniel R. Gilbert Co-President and Chief Investment Officer 17 NorthStar Capital – Head of Mezzanine Lending Business Merrill Lynch - Group Head in Global Principal Investment and Commercial Real Estate Debra Hess Chief Financial Officer 25 Newcastle Investment Corp. – Chief Financial Officer Fortress Investment Group – Managing Director Goldman, Sachs & Co. – Vice President, Manager of Financial Reporting Ronald J. Lieberman General Counsel 16 Hunton & Williams – Partner, Real Estate Capital Markets Skadden, Arps, Slate, Meagher and Flom – Associate, Corporate and Securities Daniel D. Raffe Executive Vice President and Head of Portfolio Management 22 GE Business Property - Head of East and Midwest real estate acquisitions Cushman & Wakefield – Managing Director, Real Estate Capital Markets Robert Riggs Managing Director and Head of Asset Management 23 Olympus Real Estate Partners - Partner GE Capital Realty Group – COO and EVP of Equity Investing 7 Seasoned Executive Team |
|
|
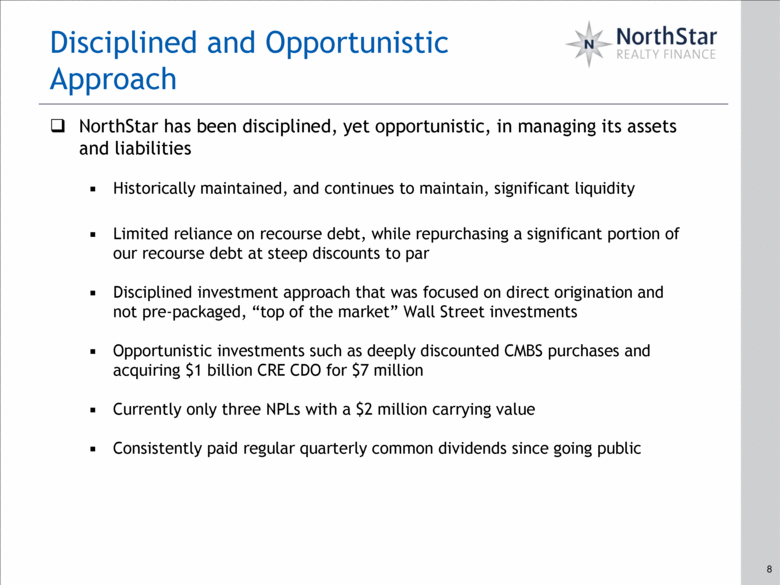
8 NorthStar has been disciplined, yet opportunistic, in managing its assets and liabilities Historically maintained, and continues to maintain, significant liquidity Limited reliance on recourse debt, while repurchasing a significant portion of our recourse debt at steep discounts to par Disciplined investment approach that was focused on direct origination and not pre-packaged, “top of the market” Wall Street investments Opportunistic investments such as deeply discounted CMBS purchases and acquiring $1 billion CRE CDO for $7 million Currently only three NPLs with a $2 million carrying value Consistently paid regular quarterly common dividends since going public Disciplined and Opportunistic Approach |
|
|
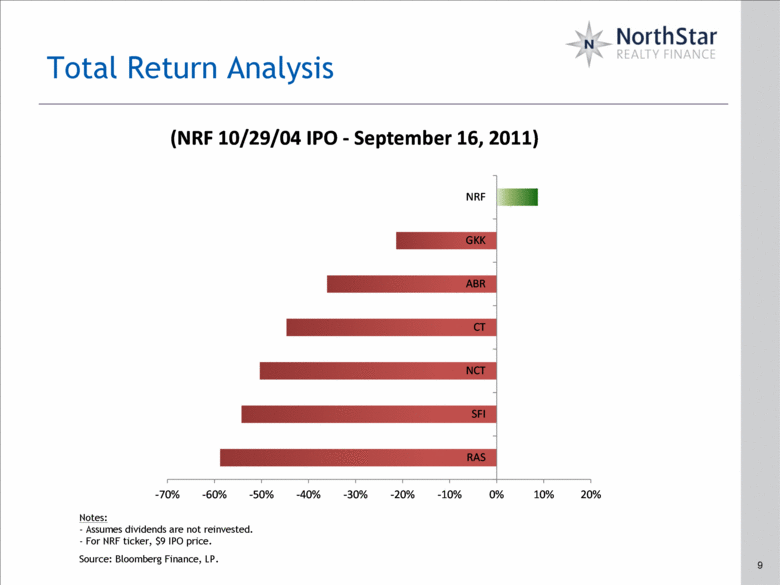
Total Return Analysis 9 Notes: - Assumes dividends are not reinvested. - For NRF ticker, $9 IPO price. Source: Bloomberg Finance, LP. -70% -60% -50% -40% -30% -20% -10% 0% 10% 20% RAS SFI NCT CT ABR GKK NRF (NRF 10/29/04 IPO - September 16, 2011) |
|
|
10 Raised $232 million of new capital during first half of 2011 for investments, while continuing to keep the disciplined approach Re-purchased CDO bonds at significant discounts to par and currently own over $550 million of our CDO bonds Acquisitions of third-party CDO managers, such as $240 million CRE CDO acquired in August 2011 New investments related to restructurings in our $7.3 billion portfolio Voluntarily repaid $100 million convertible preferred investment in our healthcare portfolio Significant progress on credit facilities which, if obtained, would allow us to expand our core debt origination and CMBS businesses Investment and Growth Opportunities |
|
|
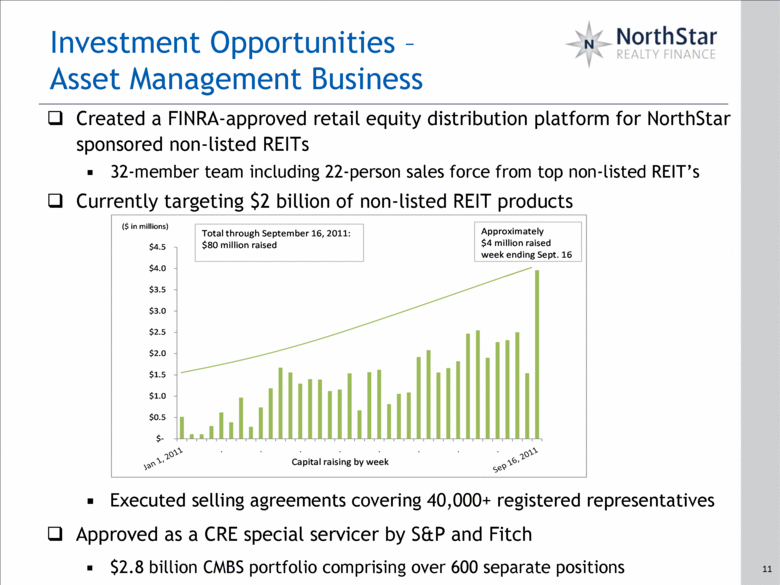
Created a FINRA-approved retail equity distribution platform for NorthStar sponsored non-listed REITs 32-member team including 22-person sales force from top non-listed REIT’s Currently targeting $2 billion of non-listed REIT products 11 Investment Opportunities – Asset Management Business Executed selling agreements covering 40,000+ registered representatives Approved as a CRE special servicer by S&P and Fitch $2.8 billion CMBS portfolio comprising over 600 separate positions $- $0.5 $1.0 $1.5 $2.0 $2.5 $3.0 $3.5 $4.0 $4.5 Approximately $4 million raised week ending Sept. 16 ($ in millions) Capital raising by week Total through September 16, 2011: $80 million raised |
|
|
12 Fully integrated platform with complementary business lines Seasoned executive team Disciplined and opportunistic investment approach Strong balance sheet and liquidity position Low cost, non-recourse and long-term match funded financing Attractive pipeline of investment opportunities Consistently paid cash dividends on common stock since going public NorthStar Highlights |

