Attached files
| file | filename |
|---|---|
| 8-K - FORM 8-K - BENIHANA INC | t71603_8k.htm |
Exhibit 99.1
 |
Investor Presentation
|
 |
Forward-Looking Statements
Statements made in this presentation, other than those concerning historical financial information, may be considered “forward-looking statements,” which are made pursuant to the safe harbor provisions of the Private Securities Litigation Reform Act of 1995 and based upon current expectations, involving a number of assumptions, risks and uncertainties that could cause the actual results to differ materially from such forward-looking statements. In view of such uncertainties, recipients should not place undue reliance on our forward-looking statements. Such statements speak only as of the date of this presentation, and we undertake no obligation to update any forward-looking statements made herein. Factors that could cause actual results to differ materially from management’s expectations include, without limitation: (i) general economic conditions and disruptions in the global credit and equity markets, (ii) competition in the restaurant industry, (iii) ability to achieve expected results, (iv) changes in food and supply costs, (v) increases in minimum wage, (vi) rising insurance costs, (vii) fluctuations in operating results, (viii) challenges to continued growth, (ix) access to sources of capital and the ability to raise capital, (x) issuances of additional equity securities, (xi) ability to construct new restaurants within projected budgets and time periods, (xii) ability to renew existing leases on favorable terms, (xiii) further deterioration in general economic conditions and high unemployment, (xiv) availability of qualified employees, (xv) ability to implement our growth strategies, including the Renewal Program and marketing programs, (xvi) ability to retain key personnel, (xvii) litigation, ability to comply with governmental regulations, (xviii) changes in financial accounting standards, (xix) ability to establish, maintain and apply adequate internal control over financial reporting and (xx) effect of market forces on the price of our stock. This list of factors is not exhaustive, and new factors may emerge or changes to the foregoing factors may occur that would impact our business. In addition to the risks and uncertainties set forth above, recipients should consider the risks and uncertainties discussed in the Company’s filings with the Securities and Exchange Commission, including, without limitation, the risks and uncertainties discussed under the heading “Risk Factors” in such filings.
This presentation also includes non-GAAP financial measures to describe our performance, which we believe are useful in analyzing results and facilitating comparison with prior periods. Additional disclosures relating to non-GAAP measures, including the reconciliation of those measures to corresponding GAAP measures are available in this report and on our website at www.benihana.com under the heading “Investor Relations.”
2
|
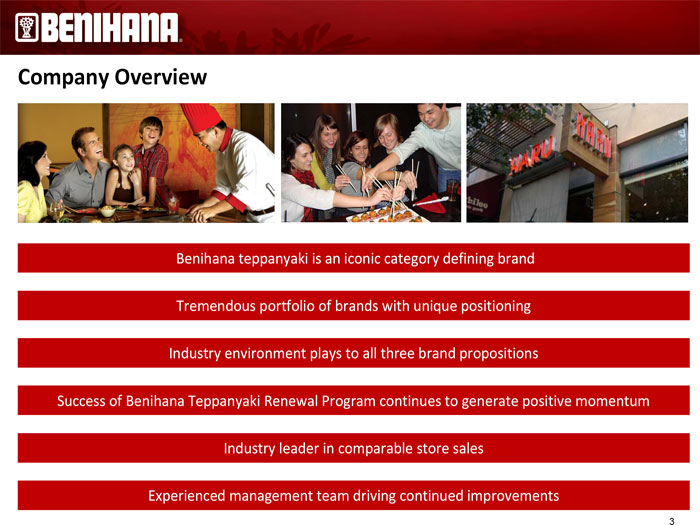 |
Company Overview
Benihana teppanyaki is an iconic category defining brand Tremendous portfolio of brands with unique positioning Industry environment plays to all three brand propositions
Success of Benihana Teppanyaki Renewal Program continues to generate positive momentum
Industry leader in comparable store sales
Experienced management team driving continued improvements
3
|
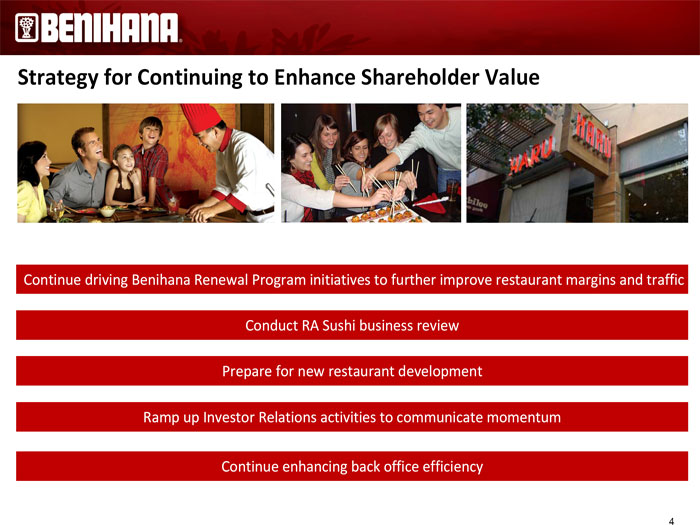 |
Strategy for Continuing to Enhance Shareholder Value
Continue driving Benihana Renewal Program initiatives to further improve restaurant margins and traffic Conduct RA Sushi business review Prepare for new restaurant development Ramp up Investor Relations activities to communicate momentum Continue enhancing back office efficiency
4
|
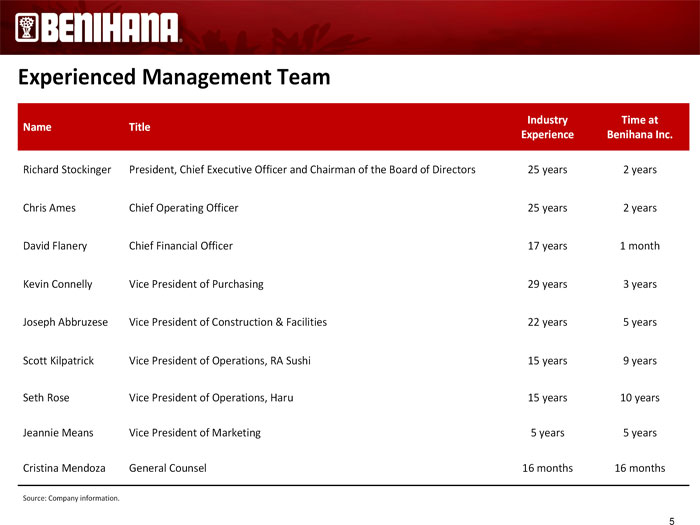 |
Experienced Management Team
Industry Time at Name Title Experience Benihana Inc.
Richard Stockinger President, Chief Executive Officer and Chairman of the Board of Directors 25 years 2 years Chris Ames Chief Operating Officer 25 years 2 years David Flanery Chief Financial Officer 17 years 1 month Kevin Connelly Vice President of Purchasing 29 years 3 years Joseph Abbruzese Vice President of Construction & Facilities 22 years 5 years Scott Kilpatrick Vice President of Operations, RA Sushi 15 years 9 years Seth Rose Vice President of Operations, Haru 15 years 10 years Jeannie Means Vice President of Marketing 5 years 5 years Cristina Mendoza General Counsel 16 months 16 months
Source: Company information.
5
|
 |
Overview of Brands
|
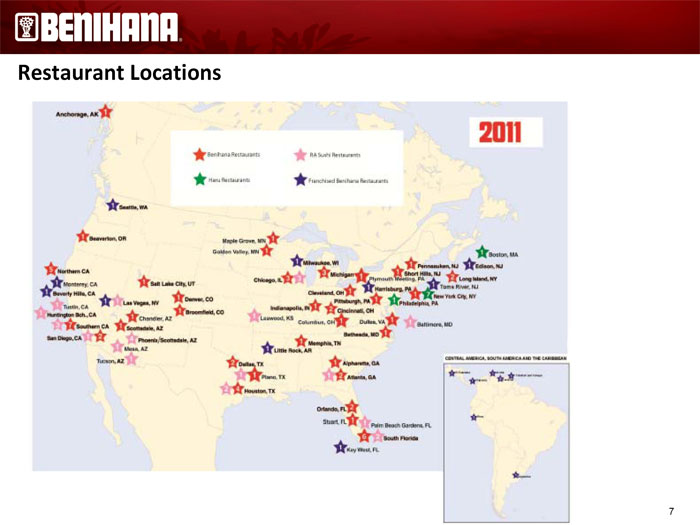 |
Restaurant Locations
7
|
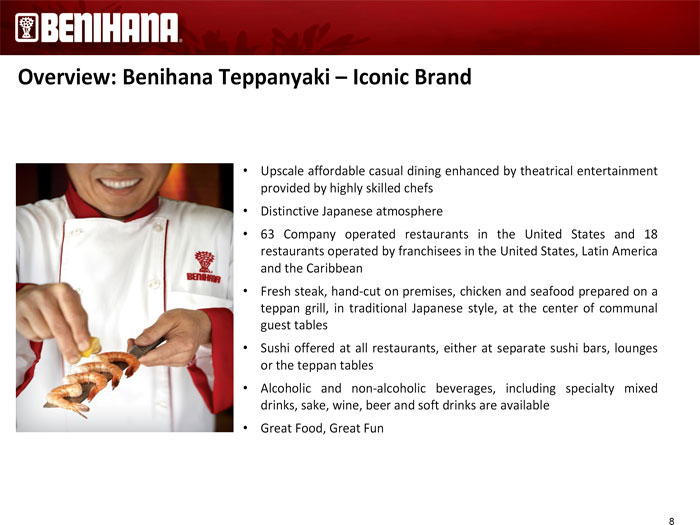 |
Overview: Benihana Teppanyaki – Iconic Brand
• Upscale affordable casual dining enhanced by theatrical entertainment provided by highly skilled chefs
• Distinctive Japanese atmosphere
• 63 Company operated restaurants in the United States and 18 restaurants operated by franchisees in the United States, Latin America and the Caribbean
• Fresh steak, hand-cut on premises, chicken and seafood prepared on a teppan grill, in traditional Japanese style, at the center of communal guest tables
• Sushi offered at all restaurants, either at separate sushi bars, lounges or the teppan tables
• Alcoholic and non-alcoholic beverages, including specialty mixed drinks, sake, wine, beer and soft drinks are available
• Great Food, Great Fun
8
|
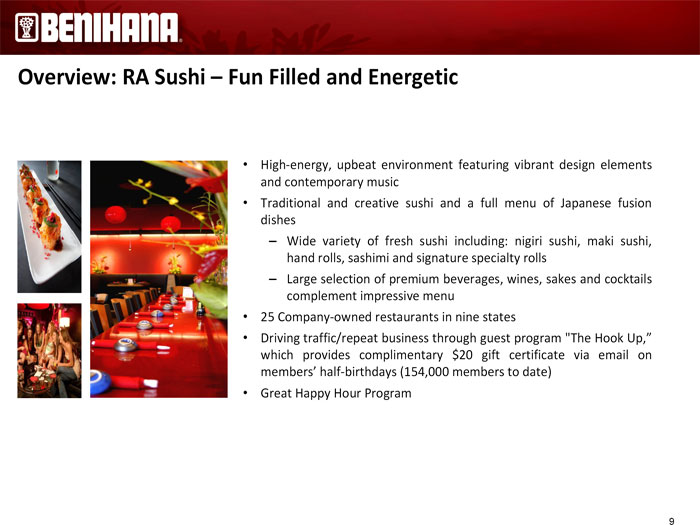 |
Overview: RA Sushi – Fun Filled and Energetic
• High-energy, upbeat environment featuring vibrant design elements and contemporary music
• Traditional and creative sushi and a full menu of Japanese fusion dishes
– Wide variety of fresh sushi including: nigiri sushi, maki sushi, hand rolls, sashimi and signature specialty rolls
– Large selection of premium beverages, wines, sakes and cocktails complement impressive menu
• 25 Company-owned restaurants in nine states
• Driving traffic/repeat business through guest program "The Hook Up,” which provides complimentary $20 gift certificate via email on members’ half-birthdays (154,000 members to date)
• Great Happy Hour Program
9
|
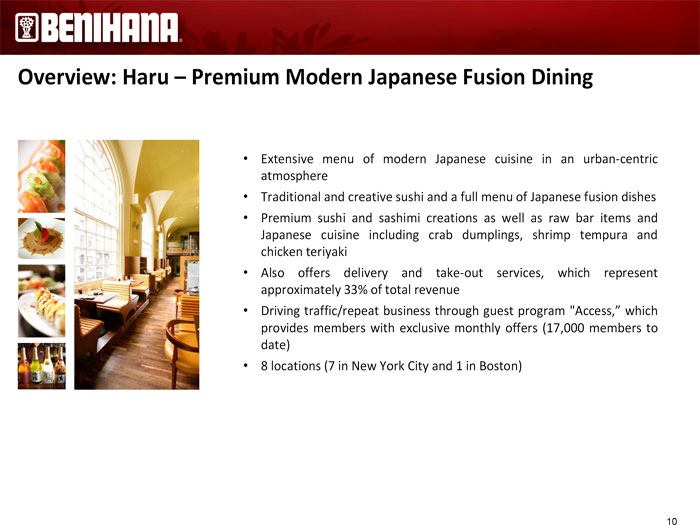 |
Overview: Haru – Premium Modern Japanese Fusion Dining
• Extensive menu of modern Japanese cuisine in an urban-centric atmosphere
• Traditional and creative sushi and a full menu of Japanese fusion dishes
• Premium sushi and sashimi creations as well as raw bar items and Japanese cuisine including crab dumplings, shrimp tempura and chicken teriyaki
• Also offers delivery and take-out services, which represent approximately 33% of total revenue
• Driving traffic/repeat business through guest program "Access,” which provides members with exclusive monthly offers (17,000 members to date)
• 8 locations (7 in New York City and 1 in Boston)
10
|
 |
Renewal Program
|
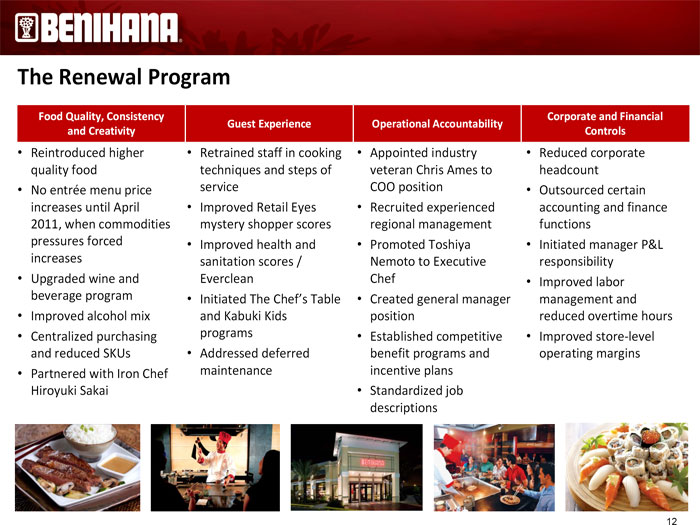 |
The Renewal Program
Food Quality, Consistency Corporate and Financial Guest Experience Operational Accountability and Creativity Controls
• Reintroduced higher • Retrained staff in cooking • Appointed industry • Reduced corporate quality food techniques and steps of veteran Chris Ames to headcount
• No entrée menu price service COO position • Outsourced certain increases until April • Improved Retail Eyes • Recruited experienced accounting and finance 2011, when commodities mystery shopper scores regional management functions pressures forced • Improved health and • Promoted Toshiya • Initiated manager P&L increases sanitation scores / Nemoto to Executive responsibility
• Upgraded wine and Everclean Chef • Improved labor beverage program • Initiated The Chef’s Table • Created general manager management and
• Improved alcohol mix and Kabuki Kids position reduced overtime hours
• Centralized purchasing programs • Established competitive • Improved store-level and reduced SKUs • Addressed deferred benefit programs and operating margins
• Partnered with Iron Chef maintenance incentive plans Hiroyuki Sakai • Standardized job descriptions
12
|
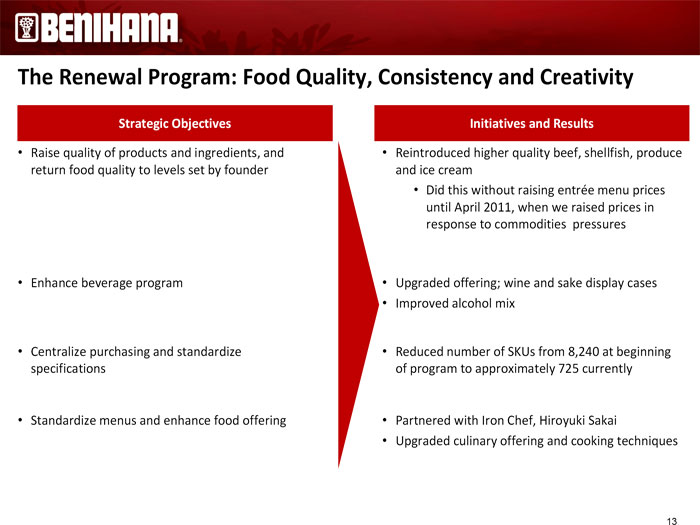 |
The Renewal Program: Food Quality, Consistency and Creativity
Strategic Objectives Initiatives and Results
• Raise quality of products and ingredients, and • Reintroduced higher quality beef, shellfish, produce return food quality to levels set by founder and ice cream
• Did this without raising entrée menu prices until April 2011, when we raised prices in response to commodities pressures
• Enhance beverage program • Upgraded offering; wine and sake display cases
• Improved alcohol mix
• Centralize purchasing and standardize • Reduced number of SKUs from 8,240 at beginning specifications of program to approximately 725 currently
• Standardize menus and enhance food offering • Partnered with Iron Chef, Hiroyuki Sakai
• Upgraded culinary offering and cooking techniques
13
|
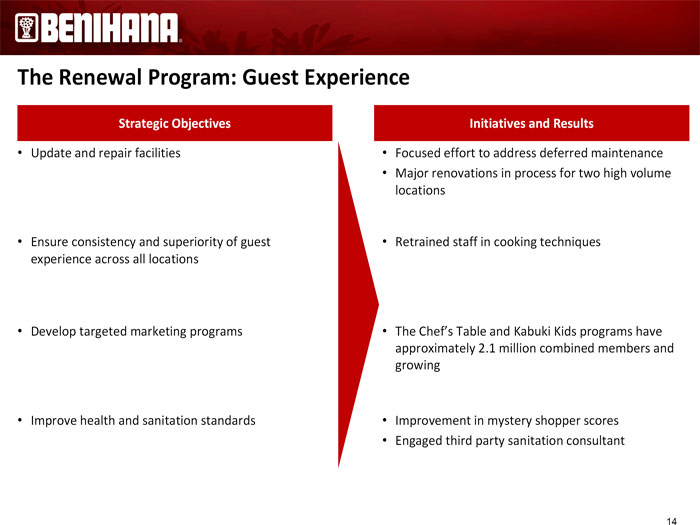 |
The Renewal Program: Guest Experience
Strategic Objectives Initiatives and Results
• Update and repair facilities • Focused effort to address deferred maintenance
• Major renovations in process for two high volume locations
• Ensure consistency and superiority of guest • Retrained staff in cooking techniques experience across all locations
• Develop targeted marketing programs • The Chef’s Table and Kabuki Kids programs have approximately 2.1 million combined members and growing
• Improve health and sanitation standards • Improvement in mystery shopper scores
• Engaged third party sanitation consultant
14
|
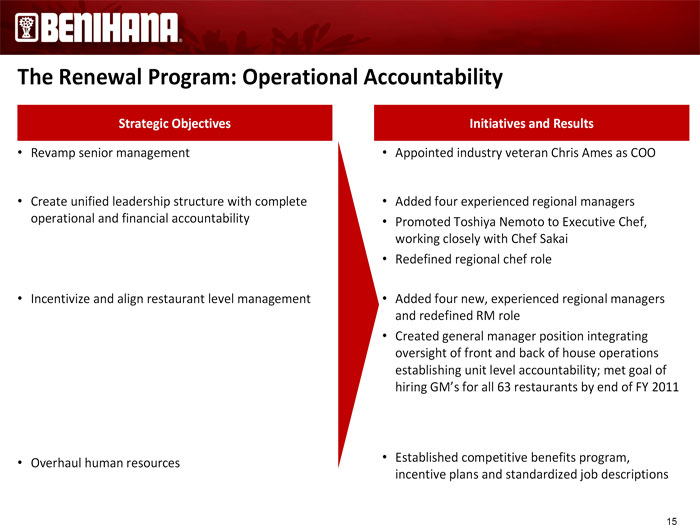 |
The Renewal Program: Operational Accountability
Strategic Objectives Initiatives and Results
• Revamp senior management • Appointed industry veteran Chris Ames as COO
• Create unified leadership structure with complete • Added four experienced regional managers operational and financial accountability • Promoted Toshiya Nemoto to Executive Chef, working closely with Chef Sakai
• Redefined regional chef role
• Incentivize and align restaurant level management • Added four new, experienced regional managers and redefined RM role
• Created general manager position integrating oversight of front and back of house operations establishing unit level accountability; met goal of hiring GM’s for all 63 restaurants by end of FY 2011
• Established competitive benefits program,
• Overhaul human resources incentive plans and standardized job descriptions
15
|
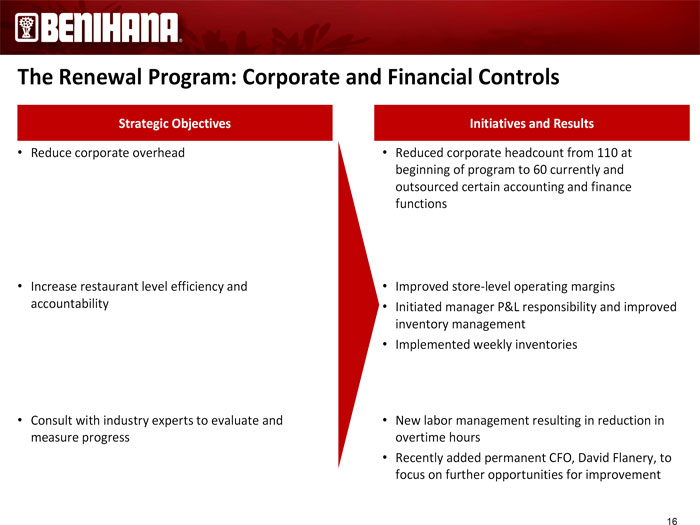 |
The Renewal Program: Corporate and Financial Controls
Strategic Objectives Initiatives and Results
• Reduce corporate overhead • Reduced corporate headcount from 110 at beginning of program to 60 currently and outsourced certain accounting and finance functions
• Increase restaurant level efficiency and • Improved store-level operating margins accountability • Initiated manager P&L responsibility and improved inventory management
• Implemented weekly inventories
• Consult with industry experts to evaluate and • New labor management resulting in reduction in measure progress overtime hours
• Recently added permanent CFO, David Flanery, to focus on further opportunities for improvement
16
|
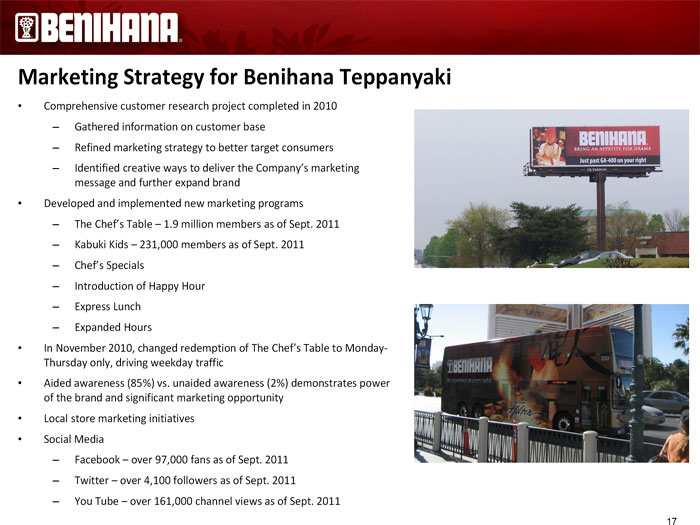 |
Marketing Strategy for Benihana Teppanyaki
• Comprehensive customer research project completed in 2010
– Gathered information on customer base
– Refined marketing strategy to better target consumers
– Identified creative ways to deliver the Company’s marketing message and further expand brand
• Developed and implemented new marketing programs
– The Chef’s Table – 1.9 million members as of Sept. 2011
– Kabuki Kids – 231,000 members as of Sept. 2011
– Chef’s Specials
– Introduction of Happy Hour
– Express Lunch
– Expanded Hours
• In November 2010, changed redemption of The Chef’s Table to Monday-Thursday only, driving weekday traffic
• Aided awareness (85%) vs. unaided awareness (2%) demonstrates power of the brand and significant marketing opportunity
• Local store marketing initiatives
• Social Media
– Facebook – over 97,000 fans as of Sept. 2011
– Twitter – over 4,100 followers as of Sept. 2011
– You Tube – over 161,000 channel views as of Sept. 2011
17
|
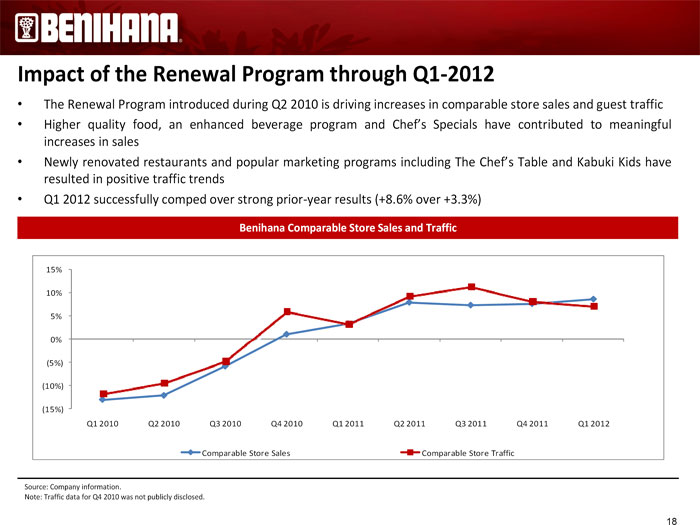 |
Impact of the Renewal Program through Q1-2012
• The Renewal Program introduced during Q2 2010 is driving increases in comparable store sales and guest traffic
• Higher quality food, an enhanced beverage program and Chef’s Specials have contributed to meaningful increases in sales
• Newly renovated restaurants and popular marketing programs including The Chef’s Table and Kabuki Kids have resulted in positive traffic trends
• Q1 2012 successfully comped over strong prior-year results (+8.6% over +3.3%)
Benihana Comparable Store Sales and Traffic
15% 10% 5% 0% (5%) (10%)
(15%)
Q1 2010 Q2 2010 Q3 2010 Q4 2010 Q1 2011 Q2 2011 Q3 2011 Q4 2011 Q1 2012
Comparable Store Sales Comparable Store Traffic
Source: Company information.
Note: Traffic data for Q4 2010 was not publicly disclosed.
18
|
 |
Future Initiatives to Drive Additional Value
• The Company plans to continue developing Renewal Program initiatives to further strengthen performance, including:
– Improve back office efficiency
– Better utilize analytical tools to identify best practices and areas for improvement
– Expand The Chef’s Table and better track redemption and spending patterns
– Signed new beverage agreement with substantial increase in marketing dollars
– Planning pilot test of online reservation system
• In addition to the Renewal Program, the Company is preparing for new restaurant development:
– Market study by a nationally-recognized consultant to optimize site selection
– New restaurant design with reduced construction budget and same number of Teppanyaki tables
• Analyzing potential ways to unlock the value of our real estate portfolio, to provide additional growth funding as may be needed
– Thirteen owned properties appraised at approximately $44 million in 2009
• Potential initiatives related to realizing the value of our brand intangible asset
19
|
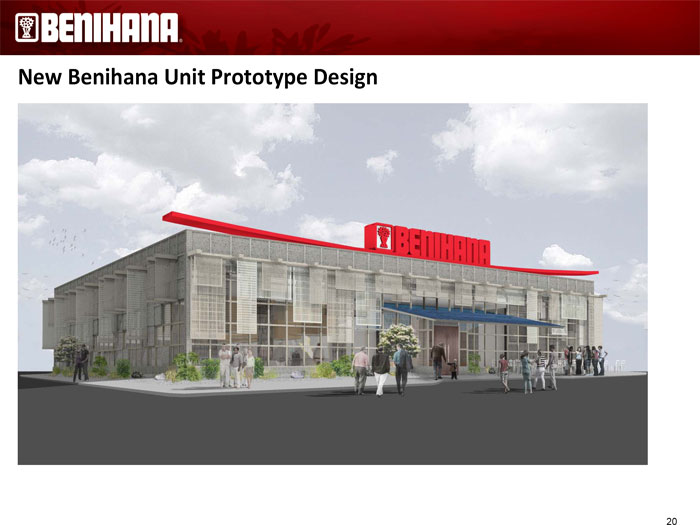 |
New Benihana Unit Prototype Design
20
|
 |
|
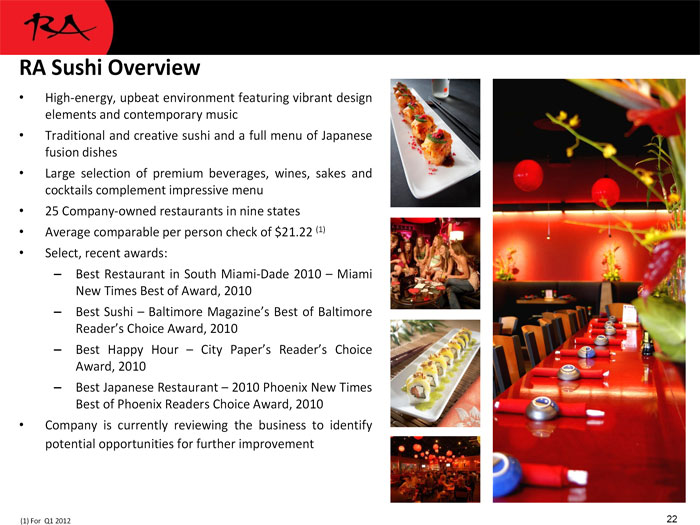 |
RA Sushi Overview
• High-energy, upbeat environment featuring vibrant design elements and contemporary music
• Traditional and creative sushi and a full menu of Japanese fusion dishes
• Large selection of premium beverages, wines, sakes and cocktails complement impressive menu
• 25 Company-owned restaurants in nine states
• Average comparable per person check of $21.22 (1)
• Select, recent awards:
– Best Restaurant in South Miami-Dade 2010 – Miami New Times Best of Award, 2010
– Best Sushi – Baltimore Magazine’s Best of Baltimore Reader’s Choice Award, 2010
– Best Happy Hour – City Paper’s Reader’s Choice Award, 2010
– Best Japanese Restaurant – 2010 Phoenix New Times Best of Phoenix Readers Choice Award, 2010
• Company is currently reviewing the business to identify potential opportunities for further improvement
(1) For Q1 2012 22
|
 |
RA Sushi Customer Demographics
• RA Sushi appeals to a broad demographic, including:
– Diverse age and income spread
– Equal mix of male and female guests
• High-quality food is the primary driver of dining occasions and a vibrant happy hour supplements the brand’s profitable beverage mix
• Broad appeal leads to significant occasion-based dining across day parts while popular happy hour program produces a skew towards evening dining
• Marketing programs:
– "The Hook Up” provides complimentary $20 gift certificate via email on members’ half-birthdays
– Developed national monthly promotions ensuring consistency throughout the brand
– Local store marketing includes unit-specific promotions to drive specific day-parts
– Retained Cramer-Krasselt as media buying/planning partner in April 2011
23
|
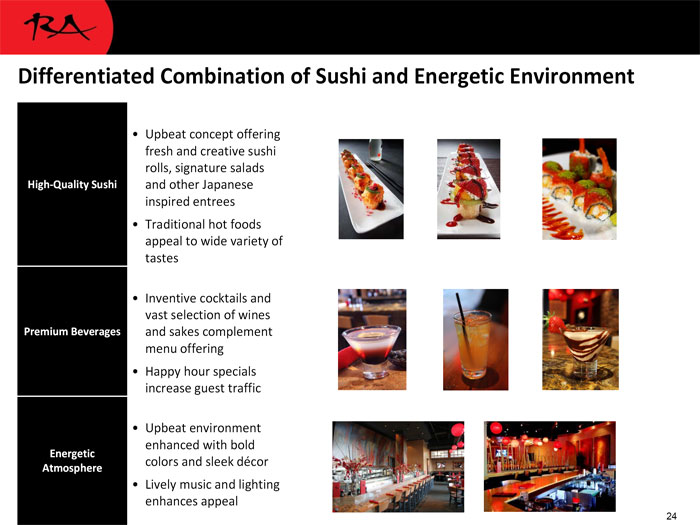 |
Differentiated Combination of Sushi and Energetic Environment
• Upbeat concept offering fresh and creative sushi rolls, signature salads
High-Quality Sushi and other Japanese inspired entrees
• Traditional hot foods appeal to wide variety of tastes
• Inventive cocktails and vast selection of wines Premium Beverages and sakes complement menu offering
• Happy hour specials increase guest traffic
• Upbeat environment enhanced with bold
Energetic colors and sleek décor
Atmosphere
• Lively music and lighting enhances appeal
24
|
 |
|
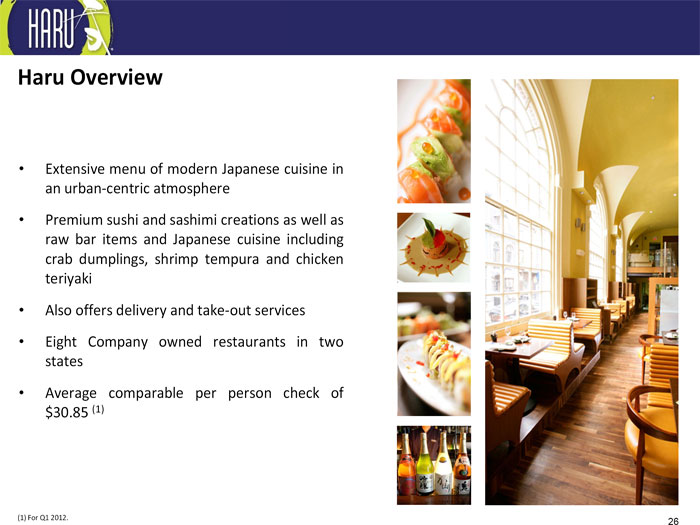 |
Haru Overview
• Extensive menu of modern Japanese cuisine in an urban-centric atmosphere
• Premium sushi and sashimi creations as well as raw bar items and Japanese cuisine including crab dumplings, shrimp tempura and chicken teriyaki
• Also offers delivery and take-out services
• Eight Company owned restaurants in two states
• Average comparable per person check of $30.85 (1)
(1) For Q1 2012. 26
|
 |
Haru Customer Demographics
• Broad guest profile:
– Premium sushi appeals to wide range of guests
– Urban-centric locations attract young adults
– Slightly higher male skew
•Urban locations drive skew toward weekday dining and evening dining occasions •Take-out services approximately 33% of total revenue •Guest program "Access” provides members with exclusive monthly offers •Opportunity to grow off-premise catering business
– Hired dedicated sales manager for the New York City market in March 2010
– Developing catering brochure
27
|
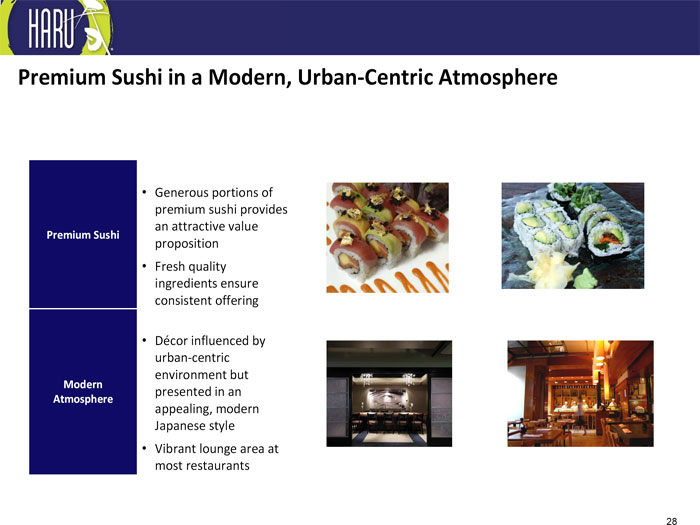 |
Premium Sushi in a Modern, Urban-Centric Atmosphere
• Generous portions of premium sushi provides an attractive value
Premium Sushi proposition
• Fresh quality ingredients ensure consistent offering
• Décor influenced by urban-centric environment but
Modern presented in an
Atmosphere appealing, modern Japanese style
• Vibrant lounge area at most restaurants
28
|
 |
Investment Considerations
|
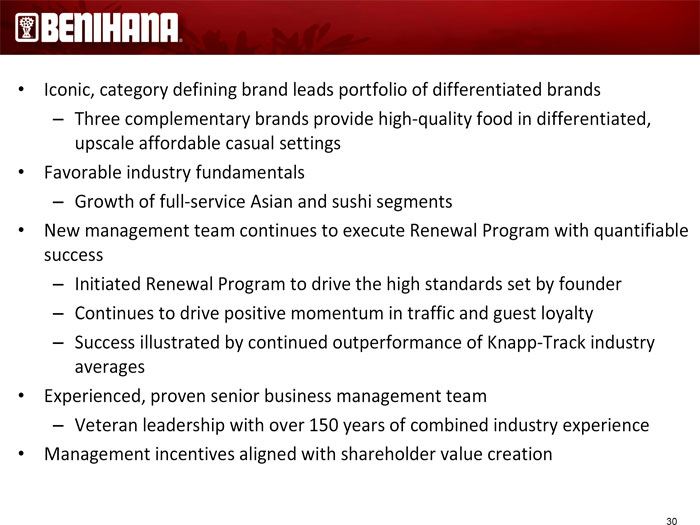 |
• Iconic, category defining brand leads portfolio of differentiated brands
– Three complementary brands provide high-quality food in differentiated, upscale affordable casual settings
• Favorable industry fundamentals
– Growth of full-service Asian and sushi segments
• New management team continues to execute Renewal Program with quantifiable success
– Initiated Renewal Program to drive the high standards set by founder
– Continues to drive positive momentum in traffic and guest loyalty
– Success illustrated by continued outperformance of Knapp-Track industry averages
• Experienced, proven senior business management team
– Veteran leadership with over 150 years of combined industry experience
• Management incentives aligned with shareholder value creation
30
|
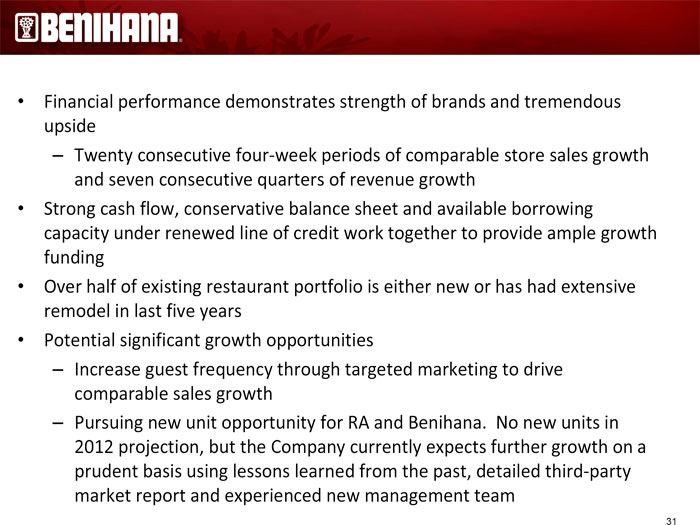 |
• Financial performance demonstrates strength of brands and tremendous upside
– Twenty consecutive four-week periods of comparable store sales growth and seven consecutive quarters of revenue growth
• Strong cash flow, conservative balance sheet and available borrowing capacity under renewed line of credit work together to provide ample growth funding
• Over half of existing restaurant portfolio is either new or has had extensive remodel in last five years
• Potential significant growth opportunities
– Increase guest frequency through targeted marketing to drive comparable sales growth
– Pursuing new unit opportunity for RA and Benihana. No new units in 2012 projection, but the Company currently expects further growth on a prudent basis using lessons learned from the past, detailed third-party market report and experienced new management team
31
|
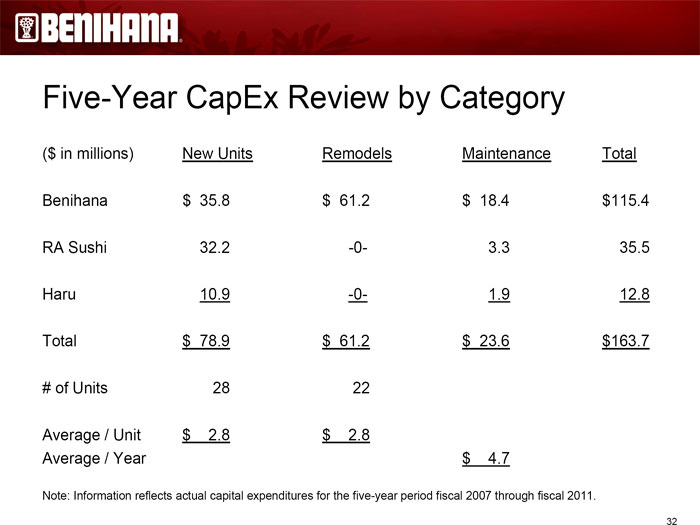 |
Five-Year CapEx Review by Category
($ in millions) New Units Remodels Maintenance Total Benihana $ 35.8 $ 61.2 $ 18.4 $115.4 RA Sushi 32.2 -0- 3.3 35.5 Haru 10.9 -0- 1.9 12.8 Total $ 78.9 $ 61.2 $ 23.6 $163.7 # of Units 28 22
Average / Unit $ 2.8 $ 2.8
Average / Year $ 4.7
Note: Information reflects actual capital expenditures for the five-year period fiscal 2007 through fiscal 2011.
32
|
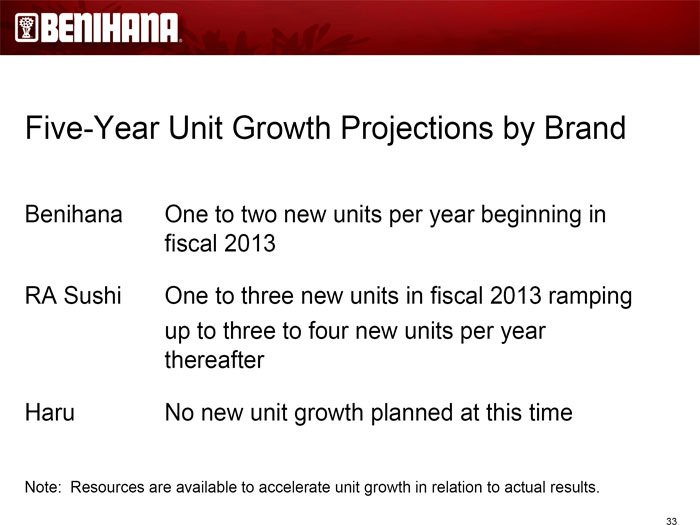 |
Five-Year Unit Growth Projections by Brand
Benihana One to two new units per year beginning in fiscal 2013
RA Sushi One to three new units in fiscal 2013 ramping up to three to four new units per year thereafter
Haru No new unit growth planned at this time
Note: Resources are available to accelerate unit growth in relation to actual results.
33
|
 |
Financial Highlights
|
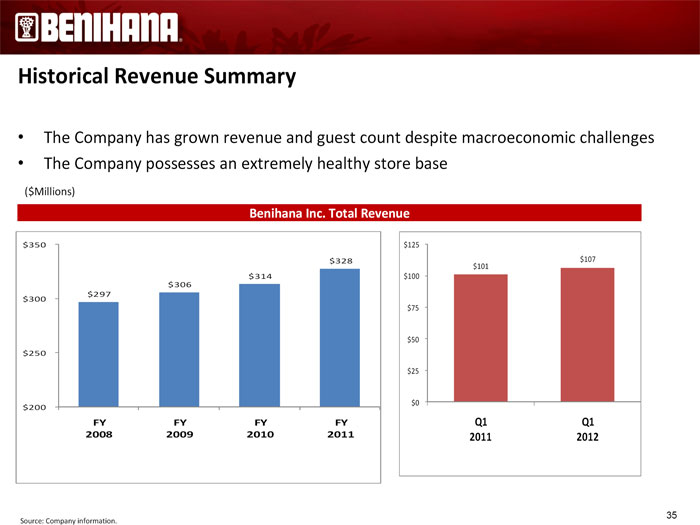 |
Historical Revenue Summary
• The Company has grown revenue and guest count despite macroeconomic challenges
• The Company possesses an extremely healthy store base
($Millions)
Benihana Inc. Total Revenue
$350 $125 $328 $107
$101
$314 $100 $306 $297 $300
$75
$50
$250
$25
$0
$200 Q1 Q1
FY FY FY FY 2011 2012 2008 2009 2010 2011
35
|
 |
Source: Company information.
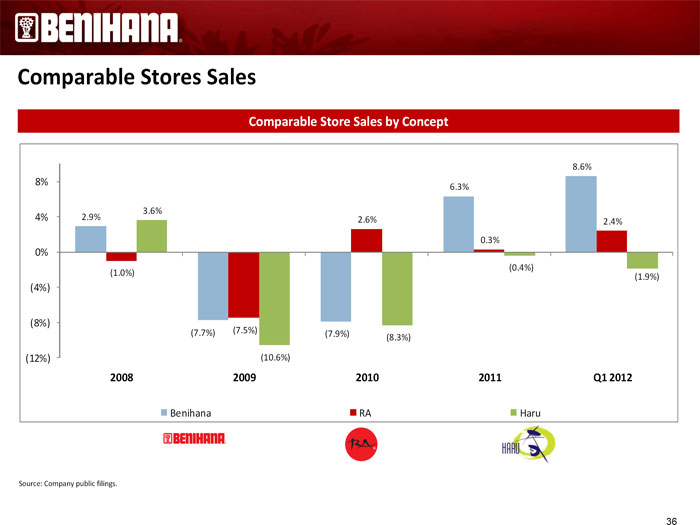
Comparable Stores Sales
Comparable Store Sales by Concept
8.6%
8% 6.3%
3.6%
4% 2.9% 2.6%
2.4%
0.3%
0%
(0.4%)
(1.0%) (1.9%)
(4%)
(8%)
(7.7%) (7.5%) (7.9%)
(8.3%)
(12%) (10.6%)
2008 2009 2010 2011 Q1 2012
Benihana RA Haru
Source: Company public filings.
36
|
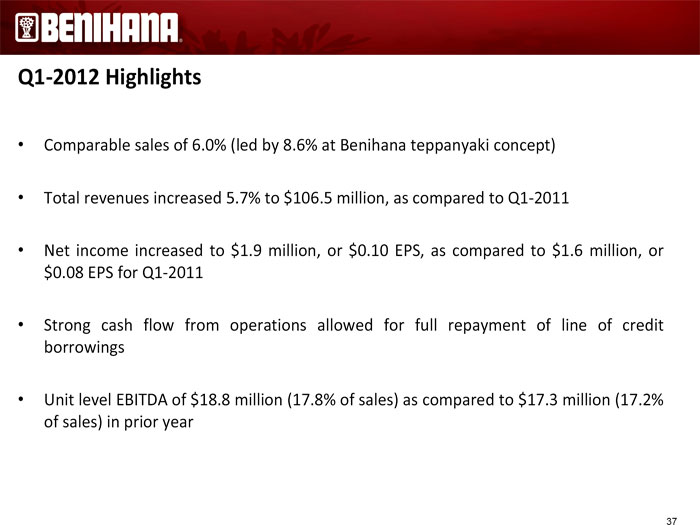 |
Q1-2012 Highlights
• Comparable sales of 6.0% (led by 8.6% at Benihana teppanyaki concept)
• Total revenues increased 5.7% to $106.5 million, as compared to Q1-2011
• Net income increased to $1.9 million, or $0.10 EPS, as compared to $1.6 million, or $0.08 EPS for Q1-2011
• Strong cash flow from operations allowed for full repayment of line of credit borrowings
• Unit level EBITDA of $18.8 million (17.8% of sales) as compared to $17.3 million (17.2% of sales) in prior year
37
|
 |
Supplemental Information
|
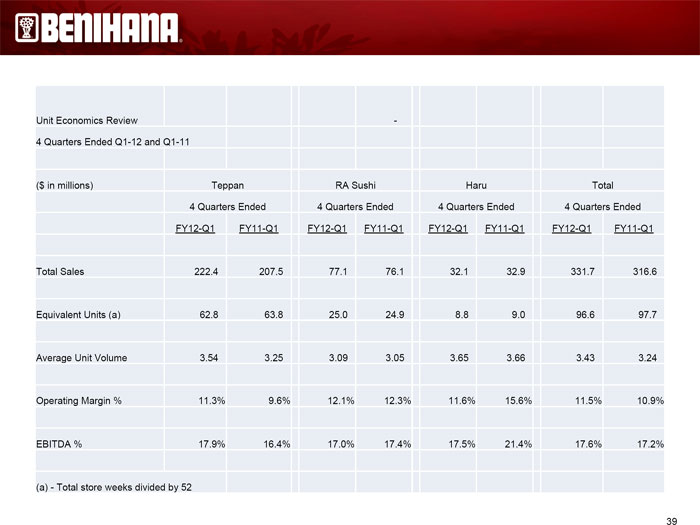 |
Unit Economics Review -
4 Quarters Ended Q1-12 and Q1-11
($ in millions) Teppan RA Sushi Haru Total 4 Quarters Ended 4 Quarters Ended 4 Quarters Ended 4 Quarters Ended FY12-Q1 FY11-Q1 FY12-Q1 FY11-Q1 FY12-Q1 FY11-Q1 FY12-Q1 FY11-Q1
Total Sales 222.4 207.5 77.1 76.1 32.1 32.9 331.7 316.6 Equivalent Units (a) 62.8 63.8 25.0 24.9 8.8 9.0 96.6 97.7 Average Unit Volume 3.54 3.25 3.09 3.05 3.65 3.66 3.43 3.24 Operating Margin % 11.3% 9.6% 12.1% 12.3% 11.6% 15.6% 11.5% 10.9% EBITDA % 17.9% 16.4% 17.0% 17.4% 17.5% 21.4% 17.6% 17.2%
(a) - Total store weeks divided by 52
39
|
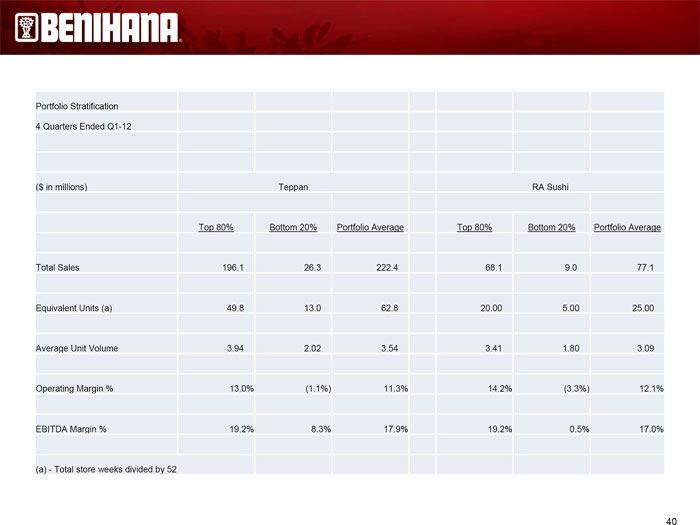 |
Portfolio Stratification
4 Quarters Ended Q1-12
($ in millions) Teppan RA Sushi
Top 80% Bottom 20% Portfolio Average Top 80% Bottom 20% Portfolio Average Total Sales 196.1 26.3 222.4 68.1 9.0 77.1 Equivalent Units (a) 49.8 13.0 62.8 20.00 5.00 25.00 Average Unit Volume 3.94 2.02 3.54 3.41 1.80 3.09 Operating Margin % 13.0% (1.1%) 11.3% 14.2% (3.3%) 12.1% EBITDA Margin % 19.2% 8.3% 17.9% 19.2% 0.5% 17.0% (a) - Total store weeks divided by 52
40
|
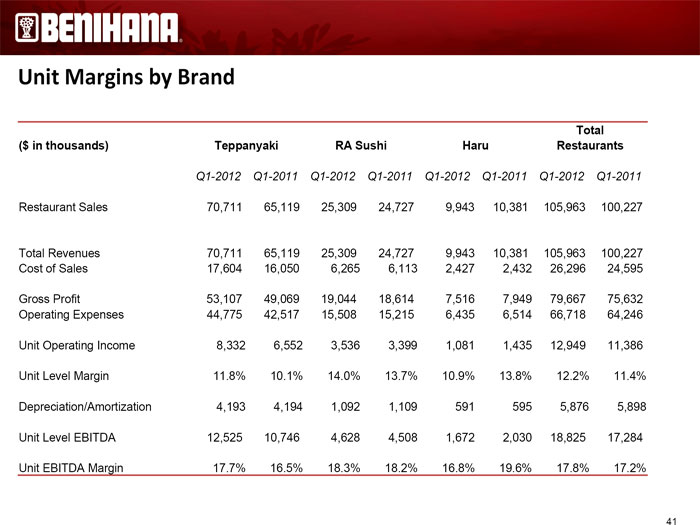 |
Unit Margins by Brand
Total ($ in thousands) Teppanyaki RA Sushi Haru Restaurants
Q1-2012 Q1-2011 Q1-2012 Q1-2011 Q1-2012 Q1-2011 Q1-2012 Q1-2011
Restaurant Sales 70,711 65,119 25,309 24,727 9,943 10,381 105,963 100,227
Total Revenues 70,711 65,119 25,309 24,727 9,943 10,381 105,963 100,227 Cost of Sales 17,604 16,050 6,265 6,113 2,427 2,432 26,296 24,595
Gross Profit 53,107 49,069 19,044 18,614 7,516 7,949 79,667 75,632 Operating Expenses 44,775 42,517 15,508 15,215 6,435 6,514 66,718 64,246
Unit Operating Income 8,332 6,552 3,536 3,399 1,081 1,435 12,949 11,386 Unit Level Margin 11.8% 10.1% 14.0% 13.7% 10.9% 13.8% 12.2% 11.4% Depreciation/Amortization 4,193 4,194 1,092 1,109 591 595 5,876 5,898 Unit Level EBITDA 12,525 10,746 4,628 4,508 1,672 2,030 18,825 17,284 Unit EBITDA Margin 17.7% 16.5% 18.3% 18.2% 16.8% 19.6% 17.8% 17.2%
41
|
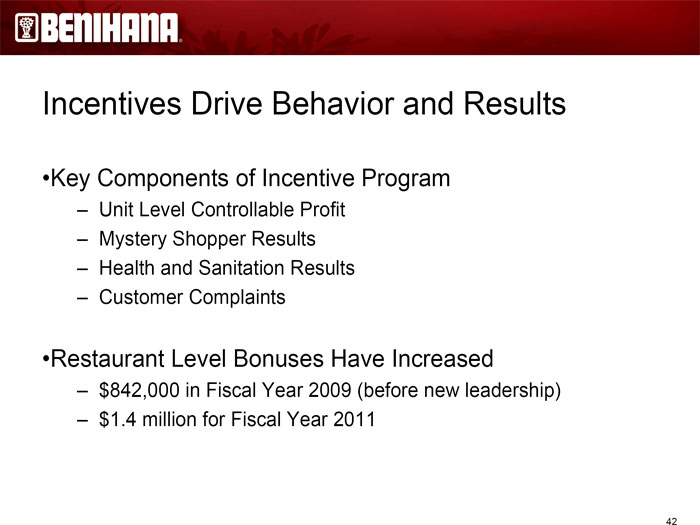 |
Incentives Drive Behavior and Results
•Key Components of Incentive Program
– Unit Level Controllable Profit
– Mystery Shopper Results
– Health and Sanitation Results
– Customer Complaints
•Restaurant Level Bonuses Have Increased
– $842,000 in Fiscal Year 2009 (before new leadership) – $1.4 million for Fiscal Year 2011
42
|
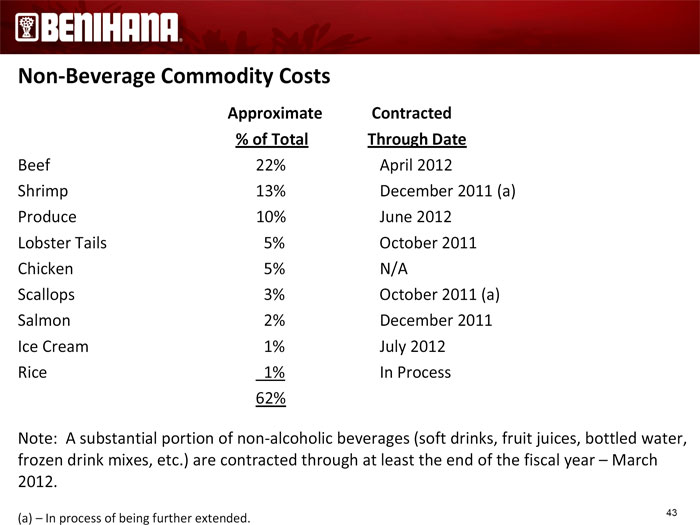 |
Non-Beverage Commodity Costs
Approximate Contracted % of Total Through Date
Beef 22% April 2012
Shrimp 13% December 2011 (a) Produce 10% June 2012 Lobster Tails 5% October 2011 Chicken 5% N/A
Scallops 3% October 2011 (a) Salmon 2% December 2011 Ice Cream 1% July 2012 Rice 1% In Process 62%
Note: A substantial portion of non-alcoholic beverages (soft drinks, fruit juices, bottled water, frozen drink mixes, etc.) are contracted through at least the end of the fiscal year – March 2012.
(a) – In process of being further extended.
43
|
 |
General & Administrative Expenses
•Increased $1.8 million to $11.2 million in Q1 2012 vs. Q1 2011
•Substantial portion of increase was due to stock-based compensation
•Certain non-recurring expenses were $1.1 million in Q1 2012 as compared to $1.3 million in Q1 2011
44
|
 |
Restricted Stock Awards (RSAs)
• Four members of senior management received RSAs in connection with their employment agreements – CEO, COO, CFO and General Counsel
• Total of 775,000 RSAs were granted between December 2010 and August 2011 with a total deferred compensation value of approximately $6.2 million at grant date
• Vesting for 75% of the initial grant value is tied to the later of passage of time or achievement of targeted share prices, providing alignment between management incentives and shareholder interests
• Accounting expense is based on deferred compensation determined as of grant date and reversed to income for RSAs that terminate unvested
• Change in control provisions exist that allow for accelerated vesting in certain circumstances
45
|
 |
Restricted Stock Awards – Vesting and Expense Recognition
Pre- Q2-Q4 Fiscal Fiscal % of ($000’s) Q2-12 FY ’12 2013 2014 Total Total
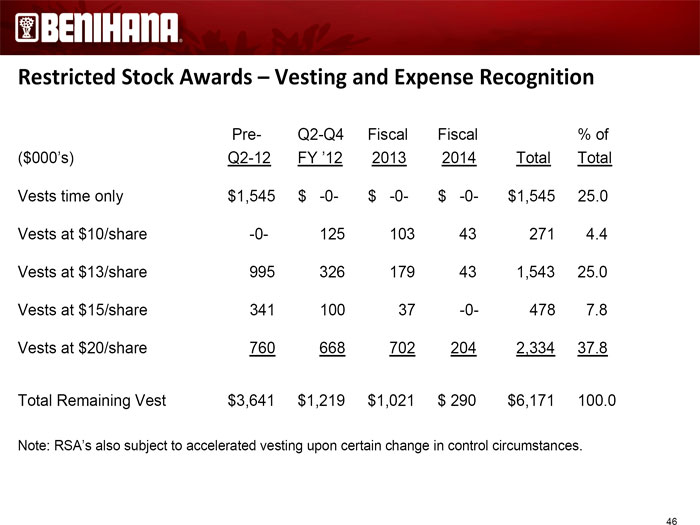
Vests time only $1,545 $ -0- $ -0- $ -0- $1,545 25.0 Vests at $10/share -0- 125 103 43 271 4.4 Vests at $13/share 995 326 179 43 1,543 25.0 Vests at $15/share 341 100 37 -0- 478 7.8 Vests at $20/share 760 668 702 204 2,334 37.8
Total Remaining Vest $3,641 $1,219 $1,021 $ 290 $6,171 100.0
Note: RSA’s also subject to accelerated vesting upon certain change in control circumstances.
46
|
 |
Non-Recurring Expenses: Q1-FY12 vs. Q1-FY11
($ in millions) Q1-FY12 Q1-FY11
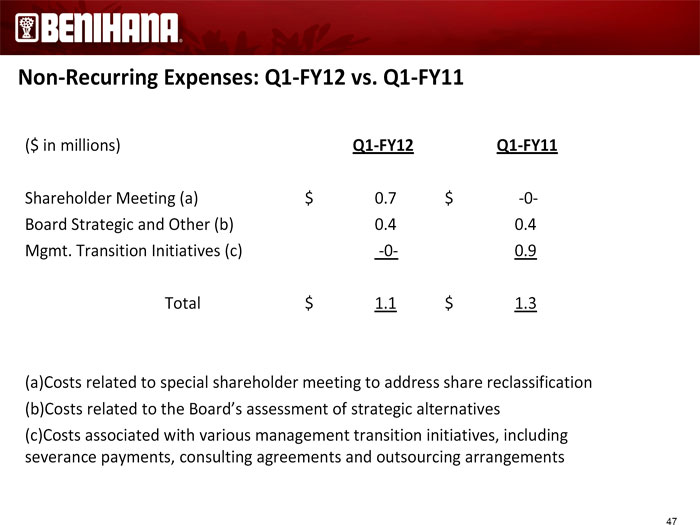
Shareholder Meeting (a) $ 0.7 $ -0-Board Strategic and Other (b) 0.4 0.4 Mgmt. Transition Initiatives (c) -0- 0.9
Total $ 1.1 $ 1.3
(a)Costs related to special shareholder meeting to address share reclassification (b)Costs related to the Board’s assessment of strategic alternatives (c)Costs associated with various management transition initiatives, including severance payments, consulting agreements and outsourcing arrangements
47
|
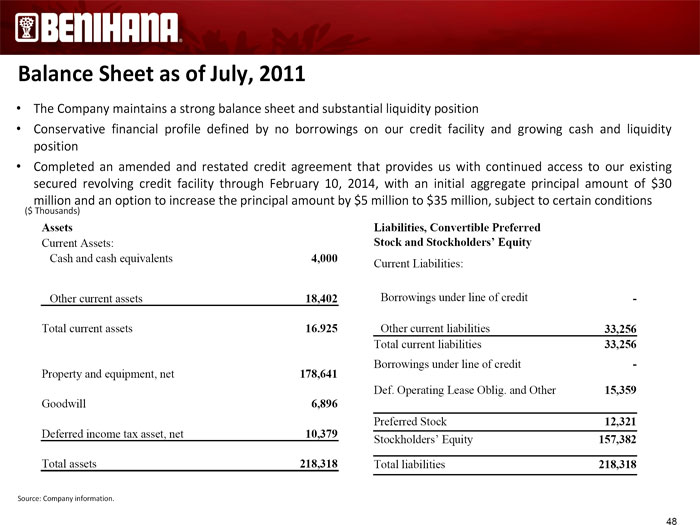 |
Balance Sheet as of July, 2011
• The Company maintains a strong balance sheet and substantial liquidity position
• Conservative financial profile defined by no borrowings on our credit facility and growing cash and liquidity position
• Completed an amended and restated credit agreement that provides us with continued access to our existing secured revolving credit facility through February 10, 2014, with an initial aggregate principal amount of $30 million and an option to increase the principal amount by $5 million to $35 million, subject to certain conditions
($ Thousands)
Assets Liabilities, Convertible Preferred Current Assets: Stock and Stockholders’ Equity
Cash and cash equivalents 4,000 Current Liabilities:
Other current assets 18,402 Borrowings under line of credit -
Total current assets 16.925 Other current liabilities 33,256 Total current liabilities 33,256 Borrowings under line of credit -Property and equipment, net 178,641 Def. Operating Lease Oblig. and Other 15,359 Goodwill 6,896 Preferred Stock 12,321 Deferred income tax asset, net 10,379 Stockholders’ Equity 157,382 Total assets 218,318 Total liabilities 218,318
Source: Company information.
48
|
 |
Reconciliation of Non-GAAP Measures
In this presentation, we refer to unit level and consolidated EBITDA, both of which are non-GAAP measures. Management considers unit level and consolidated EBITDA to be a meaningful indicator of operating performance from operations before depreciation, amortization, net interest and income taxes. Unit level and consolidated EBITDA provides us with an understanding of one aspect of earnings before the impact of investing and financing transactions and income taxes. Consolidated EBITDA is also a measure utilized in the financial covenants required under our line of credit arrangement and in certain management incentive compensation programs to define targets. While unit level and consolidated EBITDA should not be construed as substitutes for net income or a better indicator of liquidity than cash flows from operating activities, which are determined in accordance with accounting principles generally accepted in the United States (“GAAP”), they are included herein to provide additional information with respect to the ability of the company to meet its future debt service, capital expenditure and working capital requirements. Consolidated EBITDA is not necessarily a measure of the company’s ability to fund its cash needs and it excludes components that are significant in understanding and assessing our results of operations and cash flows. In addition, unit level and consolidated EBITDA are not terms defined by GAAP and as a result our measures of EBITDA might not be comparable to similarly titled measures used by other companies.
49
|
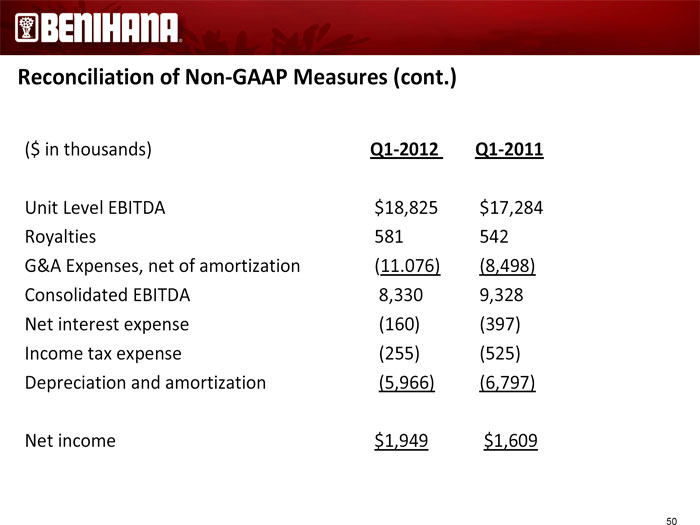 |
Reconciliation of Non-GAAP Measures (cont.)
($ in thousands) Q1-2012 Q1-2011
Unit Level EBITDA $18,825 $17,284 Royalties 581 542 G&A Expenses, net of amortization (11.076) (8,498) Consolidated EBITDA 8,330 9,328 Net interest expense (160) (397) Income tax expense (255) (525) Depreciation and amortization (5,966) (6,797)
Net income $1,949 $1,609
50
|