Attached files
| file | filename |
|---|---|
| 8-K - TAIWAN FUND INC | v235409_8-k.htm |
|
THE TAIWAN FUND, INC. (THE ‘FUND’)
MONTHLY INSIGHT
|
 |
AT AUGUST 31, 2011
|
IN BRIEF
|
||||
|
Net asset value per share
|
US$20.2 | |||
|
Market price
|
US$18.1 | |||
|
Premium/(discount)
|
(10.50%) | |||
|
Fund size
|
US$375.2m | |||
Source: State Street Bank and Trust Company.
|
At July 31, 2011
|
US$ return
|
|||||||
|
Fund*
|
TAIEX Index†
|
|||||||
|
%
|
%
|
|||||||
|
One month
|
(8.6 | ) | (10.2 | ) | ||||
|
Three months
|
(5.9 | ) | (11.6 | ) | ||||
|
One year
|
24.2 | 16.7 | ||||||
|
Three years % pa
|
9.7 | 10.0 | ||||||
Past performance is not a guide to future returns.
Returns are annualized, except for periods of less than one year.
*Source: State Street Bank and Trust Company.
NAV performance.
†Source: TWSE. The index shown is the TAIEX Total Return Index.
PORTFOLIO MANAGER

Shifeng Ke
MANAGER’S COMMENTARY
In August, worries about S&P’s downgrading of the US long-term credit rating and the faltering economies in Europe rocked global stockmarkets. The Taiwanese index, which is dominated by electronic exporters, was hit hard falling by 10.2%. Falling 8.6% during the month, the Fund outperformed. The top performer was PC Home Online (8044 TT), Taiwan’s leading e-commerce provider, as broker coverage of the stock increased.
The technology sector’s weighting in the Taiwanese market declined from 55.5% (the peak in 2010) to 48% (the lowest level since February 2005). This sector faces further uncertainty after a slew of bad news. Google proposed to acquire Motorola for its mobile patents against Apple. Meanwhile, HP intends to spin off its PC division, which is very close to the Taiwanese manufacturing supply chain. At the same time, ProMOS (5387 TT) and Powerchip (5346 TT), the two Taiwanese DRAM (dynamic random-access memory) producers, are running out of cash, and Taiwanese panel-makers suffered a total loss of US$2 billion in the first half of 2011. Hon Hai (2317 TT), the largest provider of electronic manufacturing services, with more than 800,000 employees in China, plans to install 1 million robots to reduce the pressure from wage inflation. And while the tech sector is still undergoing consolidation, it is hard to tell who the winners will be. So we think that the best strategy is to keep clear of the sector for the time being.
The finance sector has been resilient thanks to the Taiwanese government’s policies of easing restrictions on developing the Chinese market. Taiwanese banks are now allowed to invest in more than one Chinese bank. Offshore bank units can lend to Chinese enterprises and individuals. The next step is negotiation with the Chinese government on the opening of further Chinese financial markets, which should increase Taiwanese banks’ flexibility in China.
The weighting of the retail sector has reached a record level, but is still just 1.7% of the Taiwanese market. It benefits from strong domestic consumer confidence, which reached a record high of 86.9 in August. The July statistics showed that wholesale sales in Taiwan grew by 4.6%. PC Home’s sales increased 16%, showing strong domestic-consumption momentum. Taiwanese retailers are also aggressively investing in China. To take two examples from the portfolio, Gourmet Master (2723 TT) aims to open 100 new cafe shops nationwide this year, and President Chain Store (2912 TT) plans to have 100 convenience stores in Shanghai. The finance and wholesale & retail sectors account for 19.6% and 19.8% of the portfolio, respectively.
Even though the prospects for exporters are still under a cloud, the portfolio, which is mainly focused on beneficiaries of domestic consumption and government policy, should suffer little impact from the global fluctuations.
MONTHLY INSIGHT
INVESTMENT STRATEGY
The Fund is 89.8% invested with holdings in 51 companies.
We took advantage of the sharp market correction to add stocks we have been watching for a while. We initiated a holding in HTC (2498 TT), the second-largest manufacturer of smart-phones, which boasts a strong culture of innovation and a well-known brand name. We bought it after the share price collapsed on concern over Apple’s filing of patent lawsuit against the company. We re-invested in Wistron NeWeb (6285 TT), a provider of total communication solutions (encompassing networking, handsets, satellite-radio and antennae); the shares had slumped following disappointing second quarter results, but we are confident about the company’s prospects for the second half of the year – and the stock’s undemanding valuation.
We also increased existing holdings in Advantech, Goldsun Development & Construction, KGI Securities, Excelsior Medical, Taiflex Scientific, MPI, Ruentex Development, Aurora, Nan Ya Plastics, Shin Kong Financial Holding and Mercuries & Associates to reduce the Fund’s cash position, which we had raised to counter the risk of sovereign-debt default in Europe.
Shifeng Ke, Martin Currie Inc*
*Martin Currie Ltd and Heartland Capital Management Ltd (‘HCML’) have established MC China Ltd (‘MCCL’), as a joint venture company, to provide investment consultancy services to the range of China investment products managed by Marin Currie and its affiliates. HCML has seconded Shifeng Ke to Martin Currie Inc. and its affiliates, on a full time basis. Effective July 29, 2011, Chris Ruffle ceased performing client portfolio management functions for Martin Currie. Shifeng Ke is the lead manager of the Fund.
Martin Currie Inc. took over management of the Fund on May 9, 2010.
|
FUND DETAILS
|
||||
|
August 31, 2011
|
|
|
Market cap
|
US$336.03m
|
|
Shares outstanding
|
18,575,214
|
|
Exchange listed
|
NYSE
|
|
Listing date
|
1986
|
|
Investment manager
|
Martin Currie Inc
|
|
Source: State Street Bank and Trust Company.
|
|
PERFORMANCE
|
(US$ RETURNS)
|
|||||||
|
(US$ returns)
|
NAV %
|
Market price %
|
||||||
|
One month
|
(8.6 | ) | (7.2 | ) | ||||
|
Three months
|
(5.9 | ) | (7.4 | ) | ||||
|
Three years % pa
|
9.7 | 9.1 | ||||||
|
Past performance is not a guide to future returns. Returns are annualized, except for periods of less than one year.
|
||||||||
|
|
||||||||
|
Source: State Street Bank and Trust Company.
|
||||||||
|
SECTOR ALLOCATION
|
||||||||
|
Fund %*
|
Benchmark %†
|
|||||||
|
Wholesale and retail
|
19.8 | 5.9 | ||||||
|
Finance
|
19.6 | 14.1 | ||||||
|
Electronics
|
17.4 | 48.4 | ||||||
|
Construction
|
6.8 | 1.8 | ||||||
|
Plastics
|
6.5 | 8.9 | ||||||
|
Healthcare
|
4.5 | — | ||||||
|
Foods
|
3.2 | 1.8 | ||||||
|
Steel and iron
|
2.9 | 3.2 | ||||||
|
Textiles
|
2.5 | 1.9 | ||||||
|
Electric and machinery
|
2.2 | 1.4 | ||||||
|
Transportation
|
2.0 | 2.2 | ||||||
|
Cement
|
1.0 | 1.5 | ||||||
|
Chemicals
|
0.9 | 2.2 | ||||||
|
Others
|
0.5 | 2.0 | ||||||
|
Rubber
|
— | 1.6 | ||||||
|
Automobile
|
— | 1.3 | ||||||
|
Electrical appliance and cable
|
— | 0.5 | ||||||
|
Glass and ceramics
|
— | 0.5 | ||||||
|
Tourism
|
— | 0.5 | ||||||
|
Paper and pulp
|
— | 0.3 | ||||||
|
Other assets and liabilities, net
|
10.2 | — | ||||||
|
*Source: State Street Bank and Trust Company.
|
||||||||
|
†Source: TWSE.
|
||||||||
|
15 LARGEST HOLDINGS*
|
|||||
|
% of net
|
|||||
|
45.0% of holdings
|
Sector
|
assets
|
|||
|
President Chain Store
|
Wholesale and retail
|
4.8 | |||
|
Chinatrust Financial Holding
|
Finance
|
3.5 | |||
|
Far Eastern Department Stores
|
Wholesale and retail
|
3.5 | |||
|
Mercuries & Associates
|
Wholesale and retail
|
3.1 | |||
|
Nan Ya Plastics
|
Plastics
|
3.0 | |||
|
Fubon Financial Holding
|
Finance
|
2.9 | |||
|
Tung Ho Steel Enterprise
|
Steel and iron
|
2.9 | |||
|
SinoPac Financial Holdings
|
Finance
|
2.9 | |||
|
KGI Securities
|
Finance
|
2.8 | |||
|
Uni-President Enterprises
|
Foods
|
2.8 | |||
|
Clevo
|
Wholesale and retail
|
2.7 | |||
|
Wah Lee Industrial
|
Electronics
|
2.7 | |||
|
Yuanta Financial Holding
|
Finance
|
2.7 | |||
|
Shin Kong Financial Holding
|
Finance
|
2.4 | |||
|
WT Microelectronics
|
Electronics
|
2.3 | |||
|
*Source: State Street Bank and Trust Company.
|
|||||
|
PERFORMANCE
|
(US$ returns at August 31, 2011)
|
|||||||||||||||||||||||||||||||
|
One month
|
Three months
|
Calendar year
|
One year
|
Three years
|
Five years
|
Ten years
|
Since launch
|
|||||||||||||||||||||||||
|
%
|
%
|
to date
|
%
|
% pa
|
% pa
|
% pa
|
% pa
|
|||||||||||||||||||||||||
|
%
|
||||||||||||||||||||||||||||||||
|
The Taiwan Fund, Inc.*
|
(8.6 | ) | (5.9 | ) | (3.1 | ) | 24.2 | 9.7 | 7.3 | 8.8 | 9.5 | |||||||||||||||||||||
|
TAIEX Index†
|
(11.0 | ) | (14.9 | ) | (13.3 | ) | 12.2 | 6.1 | 5.9 | 7.4 | 9.0 | |||||||||||||||||||||
|
TAIEX Total Return Index†
|
(10.2 | ) | (11.6 | ) | (9.9 | ) | 16.7 | 10.0 | 10.0 |
na
|
na
|
|||||||||||||||||||||
|
MSCI Taiwan Index†
|
(9.0 | ) | (11.9 | ) | (10.4 | ) | 16.4 | 7.0 | 6.6 | 8.0 |
na
|
|||||||||||||||||||||
|
Past performance is not a guide to future returns. Returns are annualized, except for periods of less than one year.
|
|
*Source: State Street Bank and Trust Company. Launch date December 23, 1986. Returns for the Fund are historical total returns that reflect changes in net asset value per share during each period and assume that dividends and capital gains, if any, were reinvested.
|
|
†Source: MSCI for the MSCI Taiwan Index and TWSE for the TAIEX Total Return Index and the TAIEX Index. For a full description of each index please see the index descriptions section.
|
|
Returns for the TAIEX Index are not total returns and reflect only changes in the share price but do not assume that cash dividends, if any, were reinvested, and thus are not strictly comparable to the Fund returns.
|
|
The TAIEX Total Return Index commenced January 1, 2003.
|
MONTHLY INSIGHT
PORTFOLIO IN FULL
|
Company
|
% of
|
||||||||||||||
|
Sector
|
(BGB ticker)
|
Price
|
Holding
|
Value US$
|
net assets
|
||||||||||
|
WHOLESALE AND RETAIL
|
19.8
|
||||||||||||||
|
President Chain Store
|
2912
|
TT
|
NT$185.0
|
2,840,000
|
$18,111,308
|
4.8
|
|||||||||
|
Far Eastern Department Stores
|
2903
|
TT
|
NT$53.9
|
6,953,070
|
$12,918,888
|
3.5
|
|||||||||
|
Mercuries & Associates
|
2905
|
TT
|
NT$32.0
|
10,576,169
|
$11,648,205
|
3.1
|
|||||||||
|
Clevo
|
2362
|
TT
|
NT$47.0
|
6,288,000
|
$10,187,559
|
2.7
|
|||||||||
|
Test-Rite International
|
2908
|
TT
|
NT$23.0
|
10,622,000
|
$8,421,586
|
2.3
|
|||||||||
|
PC Home Online
|
8044
|
TT
|
NT$215.0
|
1,071,588
|
$7,941,930
|
2.1
|
|||||||||
|
Taiwan Tea
|
2913
|
TT
|
NT$17.7
|
8,231,000
|
$5,007,917
|
1.3
|
|||||||||
|
FINANCE
|
19.6
|
||||||||||||||
|
Chinatrust Financial Holding
|
2891
|
TT
|
NT$23.7
|
16,067,000
|
$13,126,317
|
3.5
|
|||||||||
|
Fubon Financial Holding
|
2881
|
TT
|
NT$41.3
|
7,716,706
|
$10,986,055
|
2.9
|
|||||||||
|
SinoPac Financial Holdings
|
2890
|
TT
|
NT$11.1
|
28,093,205
|
$10,749,395
|
2.9
|
|||||||||
|
KGI Securities
|
6008
|
TT
|
NT$13.0
|
23,159,658
|
$10,378,516
|
2.8
|
|||||||||
|
Yuanta Financial Holding
|
2885
|
TT
|
NT$17.0
|
17,184,900
|
$10,070,608
|
2.7
|
|||||||||
|
Shin Kong Financial Holding
|
2888
|
TT
|
NT$10.3
|
25,830,000
|
$9,126,579
|
2.4
|
|||||||||
|
China Life Insurance
|
2823
|
TT
|
NT$37.0
|
4,743,182
|
$6,049,664
|
1.6
|
|||||||||
|
Union Bank of Taiwan
|
2838
|
TT
|
NT$11.3
|
7,507,000
|
$2,911,245
|
0.8
|
|||||||||
|
ELECTRONICS
|
17.4
|
||||||||||||||
|
Wah Lee Industrial
|
3010
|
TT
|
NT$44.5
|
6,644,000
|
$10,180,313
|
2.7
|
|||||||||
|
WT Microelectronics
|
3036
|
TT
|
NT$48.9
|
5,156,936
|
$8,683,925
|
2.3
|
|||||||||
|
HTC
|
2498
|
TT
|
NT$756.0
|
296,000
|
$7,713,887
|
2.1
|
|||||||||
|
Aurora
|
2373
|
TT
|
NT$53.5
|
4,060,000
|
$7,487,547
|
2.0
|
|||||||||
|
Advantech
|
2395
|
TT
|
NT$83.5
|
2,426,100
|
$6,983,207
|
1.9
|
|||||||||
|
Wistron NeWeb
|
6285
|
TT
|
NT$74.1
|
2,287,000
|
$5,841,766
|
1.6
|
|||||||||
|
Taiflex Scientific
|
8039
|
TT
|
NT$46.5
|
3,452,820
|
$5,534,605
|
1.5
|
|||||||||
|
CHIPBOND Technology
|
6147
|
TT
|
NT$26.5
|
5,411,000
|
$4,942,915
|
1.3
|
|||||||||
|
MPI
|
6223
|
TT
|
NT$82.8
|
1,448,000
|
$4,132,936
|
1.1
|
|||||||||
|
Tatung
|
2371
|
TT
|
NT$12.5
|
4,770,897
|
$2,055,748
|
0.5
|
|||||||||
|
Powercom
|
3043
|
TT
|
NT$26.5
|
1,830,000
|
$1,668,540
|
0.4
|
|||||||||
|
CONSTRUCTION
|
6.8
|
||||||||||||||
|
Ruentex Development
|
9945
|
TT
|
NT$33.2
|
6,351,000
|
$7,268,419
|
1.9
|
|||||||||
|
Goldsun Development & Construction
|
2504
|
TT
|
NT$13.5
|
11,314,980
|
$5,246,091
|
1.4
|
|||||||||
|
Hung Poo Real Estate Development
|
2536
|
TT
|
NT$26.8
|
4,929,873
|
$4,554,391
|
1.2
|
|||||||||
|
Taiwan Land Development
|
2841
|
TT
|
NT$14.0
|
8,177,799
|
$3,946,610
|
1.1
|
|||||||||
|
King’s Town Construction
|
2524
|
TT
|
NT$23.2
|
4,261,680
|
$3,408,227
|
0.9
|
|||||||||
|
Continental Holdings
|
3703
|
TT
|
NT$11.4
|
3,061,000
|
$1,202,896
|
0.3
|
|||||||||
|
PLASTICS
|
6.5
|
||||||||||||||
|
Nan Ya Plastics
|
1303
|
TT
|
NT$69.1
|
4,783,000
|
$11,393,002
|
3.0
|
|||||||||
|
China Petrochemical Development
|
1314
|
TT
|
NT$42.7
|
4,809,200
|
$7,078,814
|
1.9
|
|||||||||
|
Yem Chio
|
4306
|
TT
|
NT$29.4
|
5,701,316
|
$5,778,062
|
1.6
|
|||||||||
|
HEALTHCARE
|
4.5
|
||||||||||||||
|
Excelsior Medical
|
4104
|
TT
|
NT$69.9
|
3,081,729
|
$7,425,597
|
2.0
|
|||||||||
|
St.Shine Optical
|
1565
|
TT
|
NT$391.5
|
392,000
|
$5,290,267
|
1.4
|
|||||||||
|
Pacific Hospital Supply
|
4126
|
TT
|
NT$103.5
|
1,223,142
|
$4,363,922
|
1.1
|
|
Company
|
% of
|
||||||||||||||
|
Sector
|
(BGB ticker)
|
Price
|
Holding
|
Value US$
|
net assets
|
||||||||||
|
FOODS
|
3.2
|
||||||||||||||
|
Uni-President Enterprises
|
1216
|
TT
|
NT$42.8
|
6,996,000
|
$10,309,692
|
2.8
|
|||||||||
|
Gourmet Master
|
2723
|
TT
|
NT$206.0
|
214,200
|
$1,521,060
|
0.4
|
|||||||||
|
STEEL AND IRON
|
2.9
|
||||||||||||||
|
Tung Ho Steel Enterprise
|
2006
|
TT
|
NT$31.0
|
10,099,000
|
$10,791,947
|
2.9
|
|||||||||
|
TEXTILES
|
2.5
|
||||||||||||||
|
Makalot Industrial
|
1477
|
TT
|
NT$68.4
|
1,828,000
|
$4,310,147
|
1.2
|
|||||||||
|
Far Eastern New Century
|
1402
|
TT
|
NT$38.0
|
3,214,836
|
$4,211,164
|
1.1
|
|||||||||
|
Li Peng Enterprise
|
1447
|
TT
|
NT$12.1
|
1,760,400
|
$734,271
|
0.2
|
|||||||||
|
ELECTRIC AND MACHINERY
|
2.2
|
||||||||||||||
|
Yungtay Engineering
|
1507
|
TT
|
NT$51.7
|
3,274,000
|
$5,834,840
|
1.5
|
|||||||||
|
Good Friend International Holdings
|
2398
|
TT
|
NT$17.6
|
4,145,000
|
$2,507,618
|
0.7
|
|||||||||
|
TRANSPORTATION
|
2.0
|
||||||||||||||
|
Farglory F T Z Investment Holding
|
5607
|
TT
|
NT$20.6
|
7,485,000
|
$5,315,190
|
1.4
|
|||||||||
|
Taiwan High Speed Rail
|
2633
|
TT
|
NT$5.1
|
12,597,600
|
$2,201,687
|
0.6
|
|||||||||
|
CEMENT
|
1.0
|
||||||||||||||
|
Wei Mon Industry
|
8925
|
TT
|
NT$17.8
|
6,433,854
|
$3,947,762
|
1.0
|
|||||||||
|
CHEMICALS
|
0.9
|
||||||||||||||
|
China Steel Chemical
|
1723
|
TT
|
NT$145.0
|
654,000
|
$3,268,929
|
0.9
|
|||||||||
|
OTHERS
|
0.5
|
||||||||||||||
|
Globe Union Industrial
|
9934
|
TT
|
NT$19.7
|
2,885,000
|
$1,954,196
|
0.5
|
|||||||||
|
OTHER ASSETS AND LIABILITIES, NET
|
$38,445,634
|
10.2
|
MONTHLY INSIGHT
THE TAIWAN FUND, INC. PREMIUM/DISCOUNT
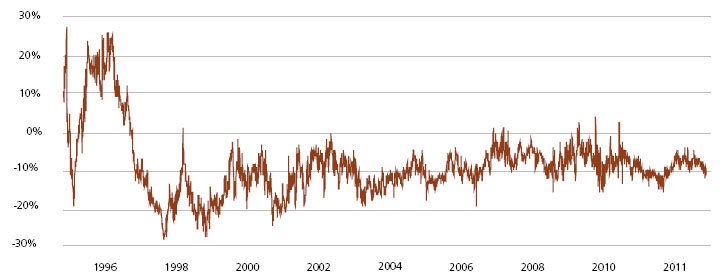
Source: State Street Bank and Trust Company as of August 31, 2011.
INDEX DESCRIPTIONS
TAIEX Index
The TWSE, or TAIEX Index is a capitalization-weighted index of all listed common shares traded on the Taiwan Stock Exchange. The index was based in 1966 and does not include re-invested dividends.
TAIEX Total Return Index
The TAIEX Total Return Index is a capitalization-weighted index of all listed common shares traded on the Taiwan Stock Exchange, based in 1966, which includes re-invested dividends.
MSCI Taiwan Index
The MSCI Total Return Taiwan Index is a free-float adjusted market capitalization index. The index represents Taiwanese companies that are available to investors worldwide. The Index has a base date of December 31, 1987. As of July 31, 2011, it contained 125 constituents.
OBJECTIVE
The Fund was launched on December 23, 1986 to allow US and other investors to access and participate in the growth of the economy and the stock market in Taiwan, the Republic of China. The Fund’s investment objective is to seek long-term capital appreciation primarily through investments in equity securities listed in Taiwan. The Fund is a diversified, closed-end management investment company listed on the New York Stock Exchange (NYSE) under the symbol ‘TWN’.
Taiwan, with its global market leadership in high technology goods and its significant investments throughout mainland China and Southeast Asian economies, is now an integral economic player in the Asia Pacific Region as well as around the world. Investing in Taiwan not only allows investors to capitalize on Taiwan’s dynamic economy, but also allows investors to reap the growth and investment potential of the mainland China and other emerging economies of the region.
CONTACTS
The Taiwan Fund, Inc.
c/o State Street Bank and Trust Company
2 Avenue de Lafayette
PO Box 5049
Boston, MA 02111
Tel: (1) 877-864-5056
www.thetaiwanfund.com
IMPORTANT INFORMATION
This document is issued and approved by Martin Currie Inc (MC Inc), as investment adviser of The Taiwan Fund, Inc. (the ‘Fund’). MC Inc is authorised and regulated by the Financial Services Authority (FSA) and incorporated under limited liability in New York, USA. Registered in Scotland (No BR2575), registered address Saltire Court, 20 Castle Terrace, Edinburgh, EH1 2ES. Information herein is believed to be reliable but has not been verified by MC Inc. MC Inc makes no representation or warranty and does not accept any responsibility in relation to such information or for opinion or conclusion which the reader may draw from this newsletter.
Martin Currie Ltd and Heartland Capital Management Ltd (‘HCML’) have established MC China Ltd (‘MCCL’), as a joint venture company, to provide investment consultancy services to the range of China investment products managed by Martin Currie and its affiliates. HCML has seconded Shifeng Ke to Martin Currie Inc. and its affiliates, on a full time basis. Effective July 29, 2011, Chris Ruffle ceased performing client portfolio management functions for Martin Currie.
Heartland Capital Investment Consulting (Shanghai) Ltd (‘HCIC’) is a wholly owned subsidiary of MC China Ltd. Research is undertaken by HCIC for MC China Ltd and provided to MC Inc (the investment manager of The Taiwan Fund, Inc.) and Martin Currie Investment Management Ltd., an affiliate of the investment manager. HCIC may change its opinions and views without prior notice. Any information provided within does not constitute investment advice nor is it an invitation to invest in this company.
The Fund is classified as a diversified investment company under the US Investment Company Act of 1940 as amended. It meets the criteria of a closed ended US mutual fund and its shares are listed on the New York Stock Exchange. MC Inc has been appointed investment adviser to the Fund.
Investors are advised that they will not generally benefit from the rules and regulations of the United Kingdom Financial Services and Markets Act 2000 and the FSA for the protection of investors, nor benefit from the United Kingdom Financial Services Compensation Scheme, nor have access to the Financial Services Ombudsman in the event of a dispute. Investors will also have no rights of cancellation under the FSA’s Conduct of Business Sourcebook of the United Kingdom.
This newsletter does not constitute an offer of shares. MC Inc, its ultimate and intermediate holding companies, subsidiaries, affiliates, clients, directors or staff may, at any time, have a position in the market referred to herein, and may buy or sell securities, currencies, or any other financial instruments in such markets. The information or opinion expressed in this newsletter should not be construed to be a recommendation to buy or sell the securities, commodities, currencies or financial instruments referred to herein.
The information provided in this report should not be considered a recommendation to purchase or sell any particular security. There is no assurance that any securities discussed herein will remain in an account’s portfolio at the time you receive this report or that securities sold have not been repurchased.
It should not be assumed that any of the securities transactions or holdings discussed here were or will prove to be profitable, or that the investment recommendations or decisions we make in the future will be profitable or will equal the investment performance of the securities discussed herein.
Investing in the Fund involves certain considerations in addition to the risks normally associated with making investments in securities. The value of the shares issued by the Fund, and the income from them, may go down as well as up and there can be no assurance that upon sale, or otherwise, investors will receive back the amount originally invested. There can be no assurance that you will receive comparable performance returns, or that investments will reflect the performance of the stock examples contained in this document. Movements in foreign exchange rates may have a separate effect, unfavorable as well as favorable, on the gain or loss otherwise experienced on an investment. Past performance is not a guide to future returns. Accordingly, the Fund is only suitable for investment by investors who are able and willing to withstand the total loss of their investment. In particular, prospective investors should consider the following risks:
 |
It should be noted that investment in the Fund is only suitable for sophisticated investors who are aware of the risk of investing in Taiwan and should be regarded as long term. Funds which invest in one country carry a higher degree of risk than those with portfolios diversified across a number of markets.
|
|
|
Investment in the securities of smaller and unquoted companies can involve greater risk than is customarily associated with investment in larger, more established, companies. In particular, smaller companies often have limited product lines, markets or financial resources and their management may be dependent on a smaller number of key individuals. In addition, the market for stock in smaller companies is often less liquid than that for stock in larger companies, bringing with it potential difficulties in acquiring, valuing and disposing of such stock. Proper information for determining their value, or the risks to which they are exposed, may not be available.
|
|
|
Investments within emerging markets such as Taiwan can be of higher risk. Many emerging markets, and the companies quoted on their stock exchanges, are exposed to the risks of political, social and religious instability, expropriation of assets or nationalization, rapid rates of inflation, high interest rates, currency depreciation and fluctuations and changes in taxation which may affect the Fund’s income and the value of its investments.
|
|
|
The marketability of quoted shares may be limited due to foreign investment restrictions, wide dealing spreads, exchange controls, foreign ownership restrictions, the restricted opening of stock exchanges and a narrow range of investors. Trading volume may be lower than on more developed stockmarkets, and equities are less liquid. Volatility of prices can also be greater than in more developed stockmarkets. The infrastructure for clearing, settlement and registration on the primary and secondary markets may be undeveloped. Under certain circumstances, there may be delays in settling transactions in some of the markets.
|


Martin Currie Inc registered in Scotland (no BR2575)
Registered office: Saltire Court, 20 Castle Terrace, Edinburgh EH1 2ES
Tel: 44 (0) 131 229 5252 Fax: 44 (0) 131 228 5959 www.martincurrie.com
North American office: 1350 Avenue of the Americas, Suite 3010, New York, NY
10019, USA Tel: (1) 212 258 1900 Fax: (1) 212 258 1919
Authorised and regulated by the Financial Services Authority and incorporated with
limited liability in New York, USA. Registered with the SEC as an investment adviser.
Please note: calls to the above numbers may be recorded.