Attached files
| file | filename |
|---|---|
| 8-K - FORM 8-K - PUBLIC SERVICE ELECTRIC & GAS CO | d234763d8k.htm |
 Bank of
America-Merrill Lynch 2011 Power & Gas Leaders Conference
September 21, 2011
EXHIBIT 99
PSEG
Public
Service
Enterprise
Group |
 2
Forward-Looking Statement
Readers are cautioned that statements contained in this presentation about our and our
subsidiaries' future performance, including future revenues, earnings, strategies,
prospects, consequences and all other statements that are not purely historical, are
forward-looking statements for purposes of the safe harbor provisions under The Private
Securities Litigation Reform Act of 1995. When used herein, the words
“will”, “anticipate”, “intend”, “estimate”, “believe”, “expect”, “plan”, “should”, “hypothetical”, “potential”,
“forecast”, “project”, variations of such words and similar
expressions are intended to identify forward-looking statements. Although we believe that our expectations are based on
reasonable assumptions, they are subject to risks and uncertainties and we can give no
assurance they will be achieved. The results or developments projected or predicted in
these statements may differ materially from what may actually occur. Factors
which could cause results or events to differ from current expectations include, but are not limited to:
• adverse changes in energy industry law, policies and regulation, including
market structures and a potential shift away from competitive markets toward subsidized market mechanisms,
transmission planning and cost allocation rules, including rules regarding how
transmission is planned and who is permitted to build transmission in the future, and reliability standards,
• any inability of our transmission and distribution businesses to obtain
adequate and timely rate relief and regulatory approvals from federal and state regulators,
• changes in federal and state environmental regulations that could increase our
costs or limit operations of our generating units,
• changes in nuclear regulation and/or general developments in the nuclear power
industry, including various impacts from any accidents or incidents experienced at our facilities or by others in
the industry that could limit operations of our nuclear generating units,
• actions or activities at one of our nuclear units located on a multi-unit
site that might adversely affect our ability to continue to operate that unit or other units located at the same site,
• any inability to balance our energy obligations, available supply and trading
risks,
• any deterioration in our credit quality, or the credit quality of our
counterparties,
• availability of capital and credit at commercially reasonable terms and
conditions and our ability to meet cash needs, • any inability to realize anticipated tax benefits or retain tax credits,
• changes in the cost of, or interruption in the supply of, fuel and other
commodities necessary to the operation of our generating units,
• delays in receipt of necessary permits and approvals for our construction and
development activities,
• delays or unforeseen cost escalations in our construction and development
activities,
• adverse changes in the demand for or price of the capacity and energy that we
sell into wholesale electricity markets,
• increase in competition in energy markets in which we compete,
• challenges associated with recruitment and/or retention of a qualified
workforce,
• adverse performance of our decommissioning and defined benefit plan trust fund
investments and changes in discount rates and funding requirements, and
• changes in technology and customer usage patterns.
For further information, please refer to our Annual Report on Form 10-K, including
Item 1A. Risk Factors, and subsequent reports on Form 10-Q and Form 8-K filed with the
Securities and Exchange Commission. These documents address in further detail our
business, industry issues and other factors that could cause actual results to differ
materially from those indicated in this presentation. In addition, any
forward-looking statements included herein represent our estimates only as of today and should not be relied
upon as representing our estimates as of any subsequent date. While we may elect
to update forward-looking statements from time to time, we specifically disclaim any obligation
to do so, even if our internal estimates change, unless otherwise required by
applicable securities laws. |
 3
GAAP Disclaimer
PSEG presents Operating Earnings in addition to its Net Income reported in
accordance with accounting principles generally accepted in the United States
(GAAP). Operating Earnings is a non-GAAP financial measure that differs from
Net Income because it excludes gains or losses associated with Nuclear
Decommissioning Trust (NDT), Mark-to-Market (MTM) accounting, and other
material one-time items. PSEG presents Operating Earnings because
management believes that it is appropriate for investors to consider results
excluding these items in addition to the results reported in accordance with
GAAP. PSEG believes that the non-GAAP financial measure of Operating
Earnings provides a consistent and comparable measure of performance of its
businesses to help shareholders understand performance trends.
This
information is not
intended to be viewed as an alternative to GAAP information.
The last two slides in this presentation include a list of items
excluded from
Income from Continuing Operations to reconcile to Operating Earnings, with a
reference to that slide included on each of the slides where the
non-GAAP
information appears. |
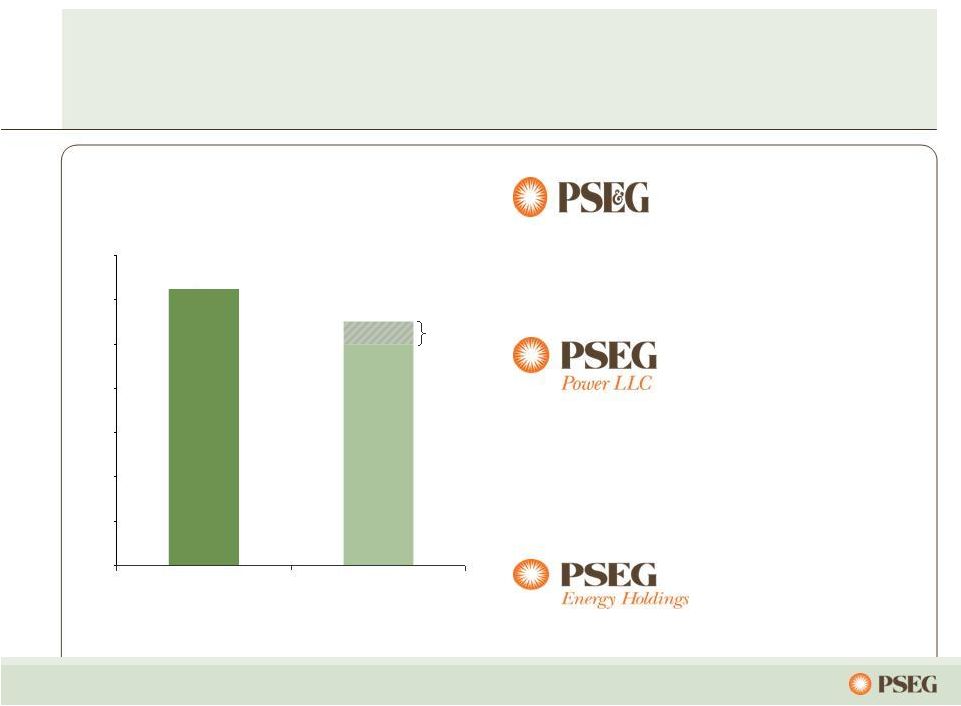
 6
PSEG Advantage: Asset mix, strong
operations…
Reliability One Award
winner for Mid-Atlantic
Region –
9
th
year in a row
Regulatory agreements
and cost control provide
opportunity for improved
returns
Investment program
focused on growth and
providing customers with
clean, reliable energy
PSEG Power
PSE&G
…with balance sheet to support growth.
Asset mix
Strong platform open to
improvement in the market
Well-run, low-cost
generating fleet combined
with fuel flexibility
supports margins
Hedging strategy mitigates
near-term risk
Major environmental
compliance capital
program completed
Actively working to defend
competitive power markets
Reducing risk
Building a platform for
renewables and investing
through PPA-supported
projects
International lease
investments terminated
Resources carefully
monitoring remaining
traditional leases and
other investments
PSEG Energy Holdings |
 11
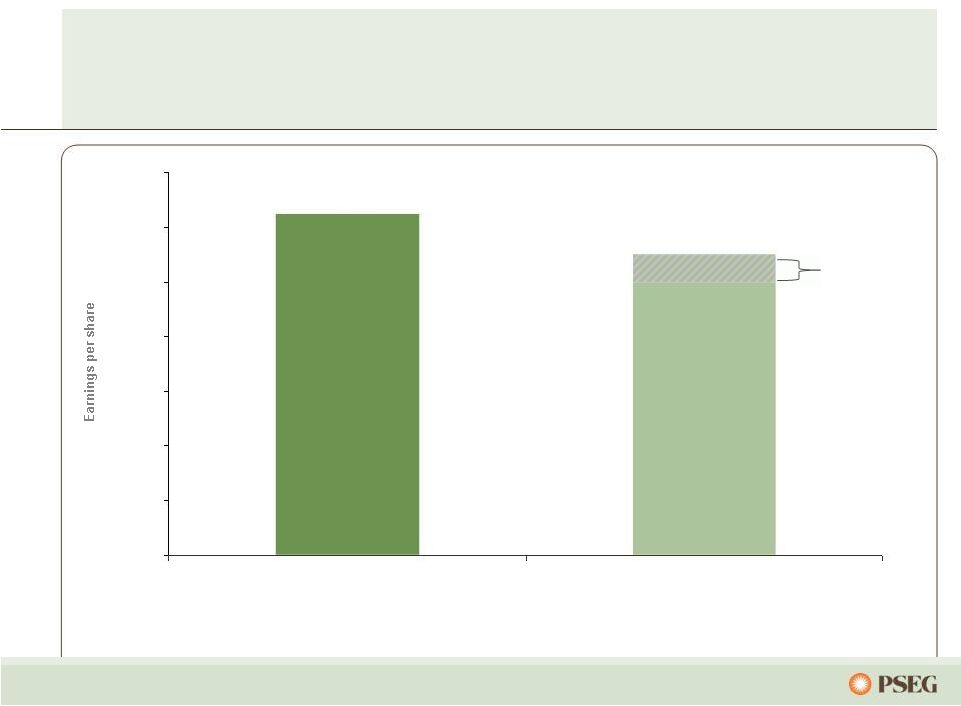
PSEG’s 2011 earnings guidance reflects
continued improvement at PSE&G…
–
Network transmission service revenue increase
= ~ $0.05 per share
–
Full year of E&G Rate Relief = ~ $0.05 per share
–
Each 1% change in Load = ~ $0.02 per share
–
Each 1% change in O&M = ~ $0.01 per share
–
2010 Utility ROE 9.9%; Each 10 bp = $0.01 per share
Revenue/Margin
–
Decline in average Hedge Price/Volume = ~ ($0.25-$0.30)
per share
–
Decline in Capacity revenues = ~ ($0.15-$0.20) per share
–
Improvement in WPT/BGSS = ~ $0.03-$0.05 per share
Other Expense
–
Higher O&M = ~ ($0.03) per share
–
Increase in Depreciation rate = ~ ($0.05) per share
–
Absence of LILO/SILO termination gains = ~ ($0.06) per share
–
Loss of Income from Asset Sales = ~ ($0.04) per share
Guidance
$2.75
$2.50
2011 Drivers
…offset by a decline in margins at Power and Holdings.
Earnings Per Share
* See page 64 for Items excluded from Income from Continuing Operations to reconcile
to Operating Earnings. E Estimate. $3.12
$0.00
$0.50
$1.00
$1.50
$2.00
$2.50
$3.00
$3.50
2010 Operating Earnings*
2011E Earnings Guidance* |
 Outlook for 2011 Operating Earnings
Maintained
* See page 64 for Items excluded from Income from Continuing Operations to
reconcile to Operating Earnings. $2.75E
$2.50E
$3.12
$0.00
$0.50
$1.00
$1.50
$2.00
$2.50
$3.00
$3.50
2010 Operating Earnings*
2011E Earnings Guidance*
EPS contribution from PSE&G expected to represent 35 to 40% of 2011
forecast earnings versus 27% contribution to 2010 earnings.
12 |
 41
Investment program supporting NJ’s energy
and economic goals has led to 45 MW of solar…
…
with 30 MW in
development. ($ Millions)
Approval
Date
Total
Amount
Spending
Thru
6/2011
Remaining
Spending
Thru 2013
Solar Loan I & II
April 2008/
November 2009
$248
$93
$151
Carbon Abatement
December 2008
46
30
16
NJ Capital Infrastructure Stimulus I
April 2009
694
701
-
Solar 4 All *
July 2009
465
278
187
Energy Efficiency Economic Stimulus
July 2009
166
118
48
Demand Response
July 2009
65
10
35
Energy Efficiency Economic Stimulus
Extension
July 2011
95
-
95
NJ Capital Infrastructure Stimulus II
July 2011
273
-
273
Total
$2,052
$1,230
$805
* Filing amount based on installation of 80MW, total forecasted spend is lower due
to a lower cost per watt to install. |
 43
Energy Holdings is pursuing renewable
energy alternatives with emphasis on solar
•
Solar is a good strategic fit for PSEG
–
Predictable and attractive returns through long-term Power Purchase
Agreements with creditworthy counterparties
–
Improves geographic, technology, regulatory and market risk profile
–
Strong relationships established across the value chain
–
Favorable tax attributes, long-term earnings, short construction cycles and
proven technology
•
Solar In-Service
–
Installed 29 MW at three locations; ~$117 million investment to date
–
Projects completed ahead of schedule and under budget; operating
performance better than plan |
 51
PSEG received a perfect score of 100 on the Corporate Equality Index and
Best Places to Work 2010 Survey
conducted by the Human Rights Campaign.
The Edison Award. Presented annually by EEI
and recognizes U.S. and international electric
utilities for their innovation and role in advancing
the industry.
Our focus on customers, community and
employees…
PSE&G named America’s Most Reliable
Utility 4 of past 6 years
Mid-Atlantic
Region
winner
for
the
9
th
straight
year
Carbon Performance Leadership Index (CPLI)
2010. Named Maplecroft Climate
Innovation Index (CII) utility sector Leader.
Second year in World Index, fourth year
in the North American Index.
PSEG is one of only two U.S. electric companies in the World Index.
…
has been widely recognized. |
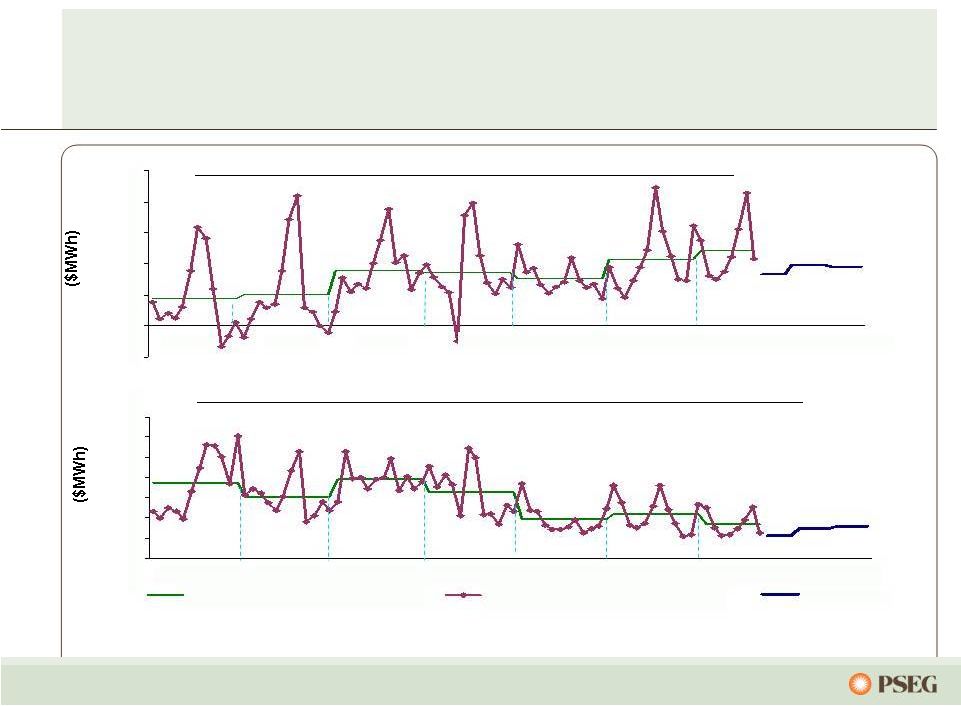 Note: Forward prices
as of September 2011. Forward
spark
spreads
have
increased
significantly
from earlier this year…
…
while the increase in forward dark spreads has been more moderate.
-$10
$0
$10
$20
$30
$40
$50
2005
2006
2007
2008
2009
2010
2011
2012
2013
$0
$10
$20
$30
$40
$50
$60
$70
2005
2006
2007
2008
2009
2010
2011
2012
2013
Annual Average
Historical Monthly
Forecast
PJM Western Hub Spark Spread (On-Peak –
Henry Hub x 7.5 Heat Rate)
PJM Western Hub Dark Spread (RTC –
Central Appalachian Coal x 10 Heat Rate)
56 |
 57
PSEG 2011 Operating Earnings Guidance
-
by Subsidiary
$ millions (except EPS)
2011E
2010A
PSEG Power
$ 765 –
$ 855
$ 1,091
PSE&G
$ 495 –
$ 520
$ 430
PSEG Energy Holdings
$ 0 –
$ 5
$ 49
Enterprise
$ 5 –
$ 15
$ 14
Operating Earnings*
$ 1,265 –
$ 1,395
$ 1,584
Earnings per Share
$ 2.50 –
$ 2.75
$ 3.12
* See Page 64 for Items excluded from Income from Continuing Operations to
reconcile to Operating Earnings. |
  63
Items Excluded from Income from Continuing
Operations to Reconcile to Operating Earnings
Please see Page 3 for an explanation of PSEG’s use of Operating Earnings as a
non-GAAP financial measure and how it differs from Net Income. Pro-forma Adjustments, net
of tax 2011
2010
2011
2010
Earnings Impact ($ Millions)
Gain (Loss) on Nuclear Decommissioning Trust (NDT)
Fund Related Activity (PSEG Power)
15
$
10
$
42
$
20
$
Gain (Loss) on Mark-to-Market (MTM) (PSEG Power)
4
(37)
8
12
Market Transition Charge Refund (PSE&G)
-
(72)
-
(72)
Total Pro-forma adjustments
19
$
(99)
$
50
$
(40)
$
Fully Diluted Average Shares Outstanding (in Millions)
507
507
507
507
Per Share Impact (Diluted)
Gain (Loss) on NDT Fund Related Activity (PSEG Power)
0.03
$
0.02
$
0.08
$
0.04
$
Gain (Loss) on MTM (PSEG Power)
0.01
(0.07)
0.02
0.02
Market Transition Charge Refund (PSE&G)
-
(0.14)
-
(0.14)
Total Pro-forma adjustments
0.04
$
(0.19)
$
0.10
$
(0.08)
$
For the Three Months Ended
For the Six Months Ended
June 30,
June 30,
PUBLIC SERVICE ENTERPRISE GROUP INCORPORATED
Reconciling Items Excluded from Continuing Operations to Compute Operating Earnings
(Unaudited) |
 64
Please
see
Page
3
for
an
explanation
of
PSEG’s
use
of
Operating
Earnings
as
a
non-GAAP
financial
measure
and
how
it
differs
from
Net
Income.
Items Excluded from Income from Continuing
Operations to Reconcile to Operating Earnings
Pro-forma Adjustments, net of tax
2010
2009
2008
Earnings
Impact
($
Millions)
Gain (Loss) on Nuclear Decommissioning Trust (NDT)
Fund Related Activity (PSEG Power)
46
$
9
$
(71)
$
Gain (Loss) on Mark-to-Market (MTM) (PSEG Power)
(1)
(11)
14
Market Transition Charge Refund (PSE&G)
(72)
-
-
Net Reversal of Lease Transaction Reserves (Energy Holdings)
-
29
-
Lease Transaction Reserves (Energy Holdings)
-
-
(490)
Asset Impairments
-
-
(13)
Premium on Bond Redemption
-
-
(1)
Total Pro-forma adjustments
(27)
$
27
$
(561)
$
Fully Diluted Average Shares Outstanding (in Millions)
507
507
508
Per
Share
Impact
(Diluted)
Gain (Loss) on Nuclear Decommissioning Trust (NDT)
Fund Related Activity (PSEG Power)
0.09
$
0.02
$
(0.14)
$
Gain (Loss) on Mark-to-Market (MTM) (PSEG Power)
-
(0.02)
0.03
Market Transition Charge Refund (PSE&G)
(0.14)
-
-
Net Reversal of Lease Transaction Reserves (Energy Holdings)
-
0.05
-
Lease Transaction Reserves (Energy Holdings)
-
-
(0.96)
Asset Impairments
-
-
(0.03)
Premium on Bond Redemption
-
-
-
Total Pro-forma adjustments
(0.05)
$
0.05
$
(1.10)
$
December 31,
PUBLIC SERVICE ENTERPRISE GROUP INCORPORATED
Reconciling
Items
Excluded
from
Continuing
Operations
to
Compute
Operating
Earnings
(Unaudited)
For the Twelve Months Ended |