Attached files
| file | filename |
|---|---|
| 8-K - FORM 8-K - CINCINNATI FINANCIAL CORP | v235297_8k.htm |
Cincinnati Financial Corporation Steven J. Johnston, FCAS, MAAA, CFA President and Chief Executive Officer INVESTOhio Equity Conference This presentation contains forward-looking statements that involve risks and uncertainties. Please refer to our various filings with the U.S. Securities and Exchange Commission for factors that could cause results to materially differ from those discussed. The forward-looking information in this presentation has been publicly disclosed, most recently on July 27, 2011, and should be considered to be effective only as of that date. Its inclusion in this document is not intended to be an update or reaffirmation of the forward-looking information as of any later date. Reconciliations of non-GAAP measures are in our most recent quarterly earnings news release, which is available on the Investors page of our website www.cinfin.com Copyright © 2011 Cincinnati Financial Corporation. All rights reserved. Do not reproduce or post online, in whole or in part, without written permission.

Cincinnati Financial Profile 25th largest U.S. property casualty writer based on 2010 written premium Rated A+ by A.M. Best Increased shareholder dividend for 50 consecutive years A record matched by only 9 other publicly traded companies $3.1 billion annual premiums through select agencies in 39 states Rank # 1 or # 2 in approximately 75% of agencies appointed more than five years Life 5% Commercial Lines 70% Personal Lines 23% Excess & Surplus 2% 1. Combined ratio below 100% 3. Investment contribution 2. Premium growth vs. industry Value Creation Focus Three performance drivers Value Creation

Increase Value for Shareholders Measured by Value Creation Ratio (VCR) -25% -20% -15% -10% -5% 0% 5% 10% 15% 20% 25% 30% 2006 2007 2008 2009 2010 VCR - Investment Income & Other VCR - P&C Underwriting VCR - Bond Portfolio Gains VCR - Equity Portfolio Gains Total CINF Shareholder Return (TSR) Target for the period 2010-2014: Annual VCR averaging 12% to 15% 2011 Combined Ratio Reflects Improving Profitability Trends 97.2% 95.2% 65% 70% 75% 80% 85% 90% 95% 100% 105% YTD 6-30-10 YTD 6-30-11

Cash Dividend Payout Ratio 0% 10% 20% 30% 40% 50% 60% 70% 80% 90% 100% 110% 120% 2000 2001 2002 2003 2004 2005 2006 2007 2008 2009 2010 Dividend Payout Ratio – Net Income Dividend Payout Ratio – Operating Income Strong capital and cash flow support current dividend payout level Investment Portfolio Invest for income and capital appreciation Taxable Fixed Maturities $5.790 Tax-Exempt Fixed Maturities $2.927 Common Equities $2.864 Preferred Equities $0.107 $11.7 billion fair value at June 30, 2011 • Investment income grew 3% in 2010, 1% for first-half 2011 (pre-tax) • Portfolio composition helps mitigate anticipated effects of inflation, rising rates • Diversified equity portfolio had 11% compound annual return in 2010 • Diversified bond portfolio has laddered maturity structure, A2/A average rating
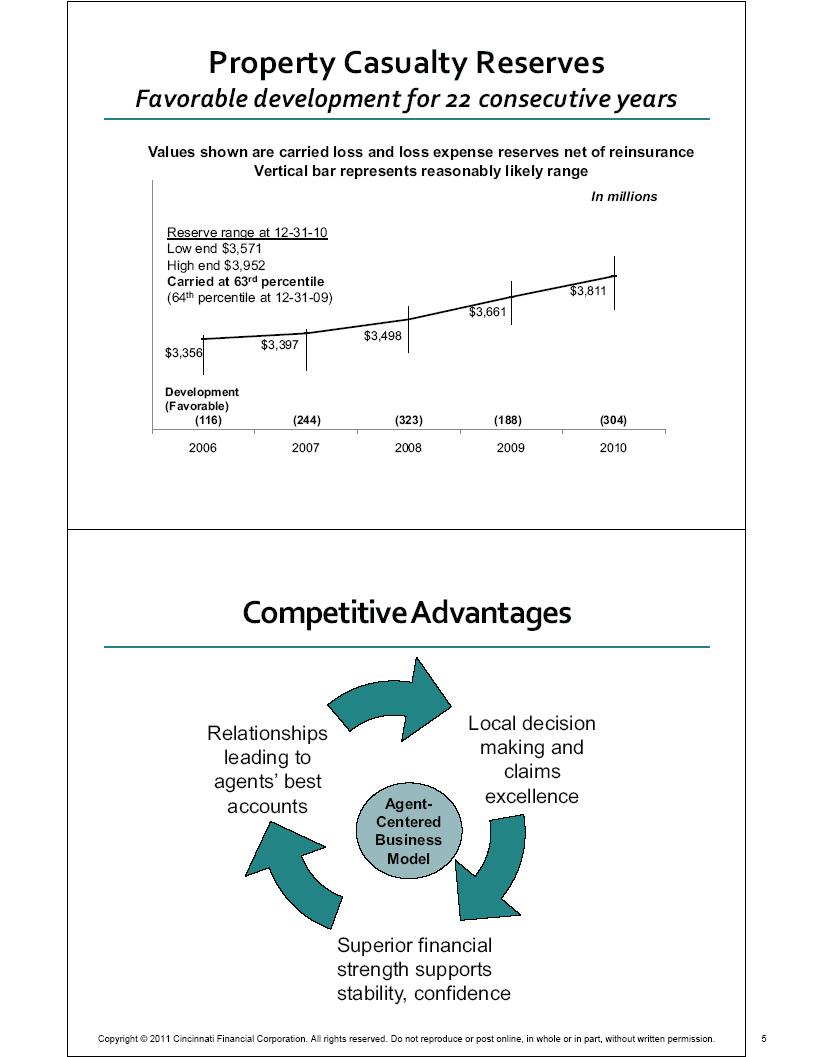
Property Casualty Reserves Favorable development for 22 consecutive years $3,356 $3,397 $3,498 $3,661 $3,811 2006 2007 2008 2009 2010 Reserve range at 12-31-10 Low end $3,571 High end $3,952 Carried at 63rd percentile (64th percentile at 12-31-09) Values shown are carried loss and loss expense reserves net of reinsurance Vertical bar represents reasonably likely range Development (Favorable) (116) (244) (323) (188) (304) In millions Competitive Advantages Relationships leading to agents’ best accounts Local decision making and claims excellence Superior financial strength supports stability, confidence Agent- Centered Business Model
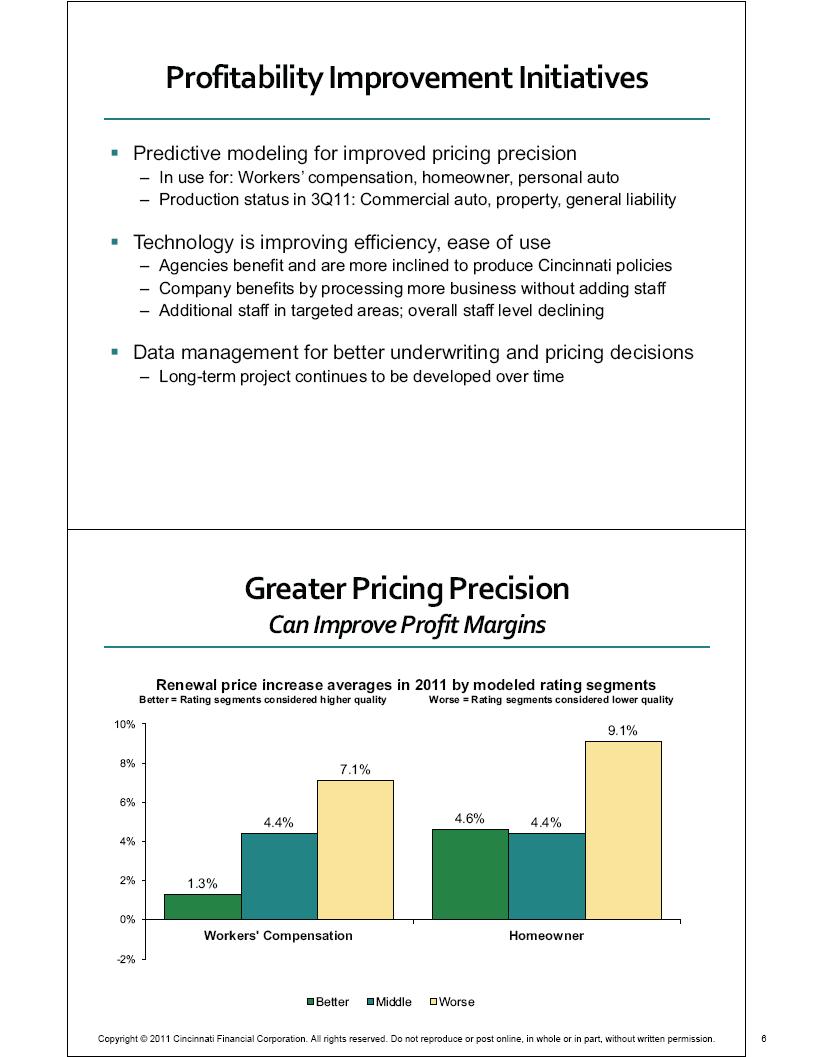
Profitability Improvement Initiatives Predictive modeling for improved pricing precision – In use for: Workers’ compensation, homeowner, personal auto – Production status in 3Q11: Commercial auto, property, general liability Technology is improving efficiency, ease of use – Agencies benefit and are more inclined to produce Cincinnati policies – Company benefits by processing more business without adding staff – Additional staff in targeted areas; overall staff level declining Data management for better underwriting and pricing decisions – Long-term project continues to be developed over time Renewal price increase averages in 2011 by modeled rating segments Better = Rating segments considered higher quality Worse = Rating segments considered lower quality 1.3% 4.6% 4.4% 4.4% 7.1% 9.1% -2% 0% 2% 4% 6% 8% 10% Workers' Compensation Homeowner Better Middle Worse Greater Pricing Precision Can Improve Profit Margins

Premium Growth Initiatives New agency appointments – 2011 target: 120 appointments; 2010 actual: 93 appointments – Benefits realized over time as relationships mature and our share increases Targeted marketing – Enhancing our small business strategy, including greater ease of use – Target Markets programs provide focused support to agencies Past geographic & product line expansion benefits current growth – New states since 2008: Texas, Colorado, Wyoming, Connecticut, Oregon – Personal lines expansion into seven states during 2008-2009 – Started marketing surplus lines products beginning early 2008 Steadily Increase Share of Agency Business 0.8% 2.8% 6.2% 6.3% 19.9% 2010 2009 2004-2007 1999-2003 Pre-1999 Market share per reporting agency location by year appointed Based on 2010 Standard Agency Written Premiums (Excluding excess and surplus lines)

Select Group of Agencies in 39 States P&C Market Share: 1% and higher Less than 1% Entered in 2008 and 2009 New states in 2010 Inactive states Headquarters (no branches) 1,281 agency relationships with 1,593 locations Commercial Top Five = 45% Ohio, Illinois, Pennsylvania, Indiana, North Carolina Personal Top Five = 66% Ohio, Georgia, Indiana, Illinois, Alabama (as of June 30, 2011) Market Share Top Three Ohio at 4.7% Indiana at 2.6% Illinois at 1.3% Based on 2010 data excluding A&H Current Valuation Is Attractive 0.0 0.2 0.4 0.6 0.8 1.0 1.2 1.4 1.6 Ratio of closing price on 9-12-11 to latest reported tangible book value Market Chubb Travelers Harleysville Median Cincinnati State Auto Selective Hanover Hartford
Why Invest in Cincinnati Financial Potential for stock price appreciation based on current valuation and long-term potential growth of earnings and book value Clear strategy for profitable growth, proven record of execution History of increasing dividend, attractive current yield Solid capital position, high quality balance sheet