Attached files
| file | filename |
|---|---|
| EX-23.1 - CONSENT OF INDEPENDENT REGISTERED PUBLIC ACCOUNTING FIRM - Renewable Energy Group, Inc. | d200494dex231.htm |
Table of Contents
As filed with the Securities and Exchange Commission on September 19, 2011
Registration No. 333-175627
UNITED STATES
SECURITIES AND EXCHANGE COMMISSION
Washington, D.C. 20549
Amendment No. 3
to
Form S-1
REGISTRATION STATEMENT
Under
THE SECURITIES ACT OF 1933
RENEWABLE ENERGY GROUP, INC.
(Exact name of registrant as specified in its charter)
| Delaware | 2860 | 26-4785427 | ||
| (State or other jurisdiction of incorporation or organization) |
(Primary Standard Industrial Classification Code Number) |
(I.R.S. Employer Identification No.) |
416 South Bell Avenue
Ames, Iowa 50010
(515) 239-8000
(Address, including zip code, and telephone number, including area code, of registrant’s principal executive offices)
Jeffrey Stroburg
Chief Executive Officer
416 South Bell Avenue
Ames, Iowa 50010
(515) 239-8000
(Name, address, including zip code, and telephone number, including area code, of agent for service)
Copies to:
| Blair W. White, Esq. Heidi E. Mayon, Esq. Pillsbury Winthrop Shaw Pittman LLP 50 Fremont Street San Francisco, California 94105 (415) 983-1000 |
Michael J. Zeidel, Esq. Skadden, Arps, Slate, Meagher & Flom LLP Four Times Square New York, New York 10036 |
Approximate date of commencement of proposed sale to the public: As soon as practicable after this Registration Statement becomes effective.
If any of the securities being registered on this Form are to be offered on a delayed or continuous basis pursuant to Rule 415 under the Securities Act of 1933, check the following box. ¨
If this Form is filed to register additional securities for an offering pursuant to Rule 462(b) under the Securities Act, please check the following box and list the Securities Act registration statement number of the earlier effective registration statement for the same offering. ¨
If this Form is a post-effective amendment filed pursuant to Rule 462(c) under the Securities Act, check the following box and list the Securities Act registration statement number of the earlier effective registration statement for the same offering. ¨
If this Form is a post-effective amendment filed pursuant to Rule 462(d) under the Securities Act, check the following box and list the Securities Act registration statement number of the earlier effective registration statement for the same offering. ¨
Indicate by check mark whether the registrant is a large accelerated filer, an accelerated filer, a non-accelerated filer, or a smaller reporting company. See the definitions of “large accelerated filer,” “accelerated filer” and “smaller reporting company” in Rule 12b-2 of the Exchange Act. (Check one):
| Large accelerated filer | ¨ | Accelerated filer | ¨ | |||||
| Non-accelerated filer | x | (Do not check if a smaller reporting company) | Smaller reporting company | ¨ | ||||
The Registrant hereby amends this Registration Statement on such date or dates as may be necessary to delay its effective date until the Registrant shall file a further amendment which specifically states that this Registration Statement shall thereafter become effective in accordance with Section 8(a) of the Securities Act of 1933 or until the Registration Statement shall become effective on such date as the Commission, acting pursuant to said Section 8(a), may determine.
Table of Contents
The information contained in this prospectus is not complete and may be changed. We and the selling stockholders may not sell these securities until the registration statement filed with the Securities and Exchange Commission is effective. This prospectus is not an offer to sell these securities and we are not soliciting offers to buy these securities in any jurisdiction where the offer or sale is not permitted.
| PRELIMINARY PROSPECTUS | Subject to Completion | , 2011 |
Shares

Common Stock
This is the initial public offering of our Common Stock. No public market currently exists for our Common Stock. We are offering shares of our Common Stock and the selling stockholders identified in this prospectus are selling shares of our Common Stock offered by this prospectus. We will not receive any of the proceeds from the Common Stock sold by the selling stockholders. We expect the public offering price to be between $ and $ per share.
Following this offering, we will have two classes of authorized common stock, Common Stock and Class A Common Stock. The rights of the Common Stock and Class A Common Stock are identical, including rights with respect to voting and dividends. However, the Class A Common Stock will not be listed for trading on any stock exchange. Shares of Class A Common Stock will automatically convert into shares of Common Stock upon expiration of the underwriter lock-up agreements described herein.
We have applied to list our Common Stock on the Nasdaq Global Market, under the symbol “REGI.”
Investing in our Common Stock involves a high degree of risk. Before buying any shares, you should carefully read the discussion of material risks of investing in our Common Stock in “Risk factors” beginning on page 9 of this prospectus.
Neither the Securities and Exchange Commission nor any state securities commission has approved or disapproved of these securities or determined if this prospectus is truthful or complete. Any representation to the contrary is a criminal offense.
| Per Share | Total | |||
| Public offering price | $ | $ | ||
| Underwriting discounts and commissions | $ | $ | ||
| Proceeds, before expenses, to Renewable Energy Group, Inc. | $ | $ | ||
| Proceeds, before expenses, to the selling stockholders | $ | $ |
The underwriters may also purchase up to an additional shares of our Common Stock from us at the public offering price, less underwriting discounts and commissions, to cover over-allotments, if any, within 30 days from the date of this prospectus. If the underwriters exercise this option in full, the total underwriting discounts and commissions will be $ . Our total proceeds, after underwriting discounts and commissions but before expenses, will be $ based on a public offering price of $ , the midpoint of the price range set forth above.
The underwriters are offering the Common Stock as set forth under “Underwriting.” Delivery of the shares will be made on or about , 2011.
| UBS Investment Bank | Piper Jaffray |
| Stifel Nicolaus Weisel | Canaccord Genuity |
Table of Contents
You should rely only on the information contained in this prospectus and any free writing prospectus we may specifically authorize to be delivered or made available to you. We, the selling stockholders and the underwriters have not authorized anyone to provide you with additional or different information. The information contained in this prospectus or any free writing prospectus is accurate only as of its date, regardless of its time of delivery or of any sale of shares of our Common Stock. Our business, financial condition, results of operations and prospects may have changed since that date.
| 1 | ||||
| 5 | ||||
| 7 | ||||
| 9 | ||||
| 30 | ||||
| 31 | ||||
| 32 | ||||
| 33 | ||||
| 36 | ||||
| 38 | ||||
| Management’s discussion and analysis of financial condition and results of operations |
40 | |||
| 77 | ||||
| 88 |
| 102 | ||||
| 110 | ||||
| 115 | ||||
| 121 | ||||
| 124 | ||||
| 133 | ||||
| Material United States federal income and estate tax considerations to non-United States holders |
136 | |||
| 140 | ||||
| 148 | ||||
| 148 | ||||
| 148 | ||||
| F-1 |
This prospectus is an offer to sell only the shares offered hereby but only under circumstances and in jurisdictions where it is lawful to do so.
i
Table of Contents
Conventions That Apply to this Prospectus
Prior to February 26, 2010, the “Company,” “we,” “us,” “our” and similar references refer to the business, results of operations and cash flows of REG Biofuels, Inc., formerly Renewable Energy Group, Inc., which is considered the accounting predecessor to Renewable Energy Group, Inc., formerly REG Newco, Inc. On or after February 26, 2010, such references refer to the business, results of operations and cash flows of Renewable Energy Group, Inc. and its consolidated subsidiaries.
In this prospectus:
“ASTM” refers to the American Society for Testing and Materials International, an organization that develops and delivers international voluntary consensus standards, including United States standards for fuel.
“ASTM D6751” refers to the ASTM specification for pure biodiesel, or B100, in the United States.
“ASTM D7467” refers to the ASTM specification for biodiesel blends in the United States from 6% to 20% biodiesel.
“ASTM D975” refers to the ASTM specification for diesel fuel in the United States, which includes up to 5% biodiesel.
“B2, B5, B6, B10, B11, B99.9 and B100” each refer to blends of biodiesel with petroleum-based diesel. The number represents the biodiesel percentage of the blend. For instance, a blend of 5% biodiesel and 95% petroleum-based diesel would be represented as B5.
“blender’s tax credit” refers to the federal excise tax credit of $1.00 per gallon of biodiesel that is available to the person who blends biodiesel with petroleum-based diesel.
“BQ-9000” refers to a cooperative and voluntary program for the accreditation of biodiesel producers and marketers. The program combines the ASTM standard for B100, ASTM D6751, and a quality systems program that includes storage, sampling, testing, blending, shipping, distribution and fuel management practices.
“CBOT” refers to the Chicago Board of Trade.
“Distillate fuel”, as defined by the Energy Information Association, involves two products: low-sulfur distillate, which is used as a transportation fuel (diesel) for on-highway vehicles, and high-sulfur distillate, which is used for space heating (heating oil) in the residential and commercial sectors and as a fuel for other stationary (nontransportation) applications in the commercial, industrial, and electricity generation sectors.
“mmgy” refers to million gallons per year.
“nameplate production capacity” refers to the production capacity of a particular facility based on the expected annual throughput in gallons based upon producing at 100% of design capacity for approximately 330 days per year using a particular feedstock.
“NBB” refers to the National Biodiesel Board which is a national trade association representing the biodiesel industry, of which we are one of its largest members.
“Obligated Parties” refers to petroleum refiners and petroleum fuel importers in the 48 contiguous states and Hawaii that have annual renewable fuel volume obligations to use biofuels under RFS2.
“OPIS” refers to the Oil Price Information Service.
ii
Table of Contents
“REG-9000” refers to the brand that we use to market our biodiesel.
“RFS” refers to the renewable fuel standard created under the Energy Policy Act of 2005, which established the first renewable fuel volume requirement in the United States.
“RFS2” refers to the expanded renewable fuel standard that became effective July 1, 2010 requiring for the first time that a specific portion of the diesel fuel consumed in the United States annually be renewable.
“RIN” refers to a renewable identification number, which is generated in connection with the production or importation of renewable fuel and is assigned to a gallon of renewable fuel. RINs are primarily used by Obligated Parties to demonstrate compliance with the use of the specific volumes of renewable fuels mandated by RFS2. For a more detailed discussion of RINs, see the section entitled “Industry overview—Government Programs Favoring Biodiesel Production and Use—Renewable Identification Numbers.”
“RVO” refers to a renewable volume obligation, the annual renewable fuel volume requirement for an Obligated Party under RFS2.
“Tolling arrangements” refer to agreements under which a biodiesel facility produces biodiesel for a third party using such third party’s feedstock.
“ULSD” refers to ultra low sulfur diesel, which is diesel fuel containing 15 parts per million or less of sulfur, which is the current United States standard for on-road diesel fuel.
III
Table of Contents
This summary highlights information contained elsewhere in this prospectus and does not contain all of the information you should consider before investing in our Common Stock. You should read this entire prospectus carefully, including our consolidated financial statements and the related notes and the information set forth under the headings “Risk factors” and “Management’s discussion and analysis of financial condition and results of operations,” in each case included elsewhere in this prospectus.
OUR BUSINESS
We are the largest producer of biodiesel in the United States based on gallons produced. We have played a leading role in developing the United States biodiesel industry since our inception in 1996. We market and distribute our biodiesel throughout the country to all segments of the petroleum-based distillate fuel supply chain. In 2010, we sold nearly 68 million gallons of biodiesel, representing approximately 22% of United States biodiesel production. Our strategy is to optimize and grow our core biodiesel business, to diversify into renewable chemicals and additional advanced biofuels, and to expand internationally.
We believe we have completed more acquisitions in the biodiesel industry than any of our competitors since 2006. We operate six biodiesel plants, with an aggregate nameplate production capacity of 212 million gallons per year, or mmgy, consisting of five wholly-owned facilities and one leased facility. We have acquired four of our six facilities since February 2010. Our scale allows us to quickly transfer best practices at one of our facilities to the others to maximize production volumes and cost efficiencies. We believe our fully integrated approach, which includes acquiring feedstock, managing biorefinery facility construction and upgrades, operating biorefineries and marketing renewable products, strongly positions us to capitalize on growing demand for biodiesel, renewable chemicals and other advanced biofuels.
We are a low-cost biodiesel producer. We primarily produce our biodiesel from a wide variety of lower cost feedstocks, including inedible animal fat, used cooking oil and inedible corn oil. We believe our ability to process these feedstocks provides us with a cost advantage over many biodiesel producers, particularly those that rely on higher cost virgin vegetable oils, such as soybean oil. In addition, we believe our size, reputation, large and diverse feedstock supplier base and processing capabilities give us a competitive advantage over other biodiesel producers.
Biodiesel addresses a large existing market. According to the United States Energy Information Administration, or EIA, the market for distillate fuel, which includes biodiesel, in 2009 in the United States was 52.7 billion gallons, the latest year for which data is available.
On July 1, 2010, the expanded renewable fuel standard, or RFS2, became effective, requiring for the first time that a portion of the diesel fuel consumed in the United States be renewable. RFS2 requires that Obligated Parties use 800 million gallons of biomass-based diesel in 2011, one billion gallons in 2012 and at least one billion gallons each year thereafter through 2022. Recently, the United States Environmental Protection Agency, or EPA, proposed a requirement that 1.28 billion gallons of biomass-based diesel be used in 2013. According to the National Biodiesel Board, or NBB, biodiesel is currently the only commercially significant RFS2-compliant biomass-based diesel fuel produced in the United States. As a result, demand for biodiesel has increased significantly. In the first four months of 2011, according to the EIA, 173 million gallons of biodiesel were produced in the United States, compared to 309 million gallons in all of 2010.
1
Table of Contents
OUR COMPETITIVE STRENGTHS
| Ø | Largest United States Biodiesel Producer. We believe the scale of our operations allows us to enjoy several advantages over many of our competitors. First, we offer lower cost feedstock producers consistent access to the renewable fuel industry on a scale that we believe our competitors generally cannot match. Second, our size allows us to provide our customers with larger volumes of biodiesel than our smaller competitors. Third, our larger size also generally allows us to reduce our overhead costs per gallon compared to our smaller competitors. Fourth, we are able to transfer best practices among our six operating facilities to maximize production volumes and reduce operating costs, in a manner that our competitors who do not operate multiple facilities cannot. |
| Ø | Multi-Feedstock Expertise. We utilize our proprietary technology and knowhow to efficiently convert a wide variety of lower cost feedstocks into high quality biodiesel. We believe our ability to process lower cost feedstocks at scale enables us to be a low cost producer and provides a distinct advantage against many of our competitors. Several of our competitors’ facilities are only able to process higher cost virgin vegetable oil feedstocks. Our competitors that are able to process lower cost feedstocks generally operate at a smaller scale, making it more difficult for them to reliably procure and efficiently process lower cost feedstocks. |
| Ø | Effective Acquisitions. We believe we have completed more acquisitions in the biodiesel industry than any of our competitors since 2006, acquiring six biodiesel plants and two additional biodiesel businesses since our inception. We have developed an ability to target and acquire strategic assets and quickly add value to them through upgrades and integration onto our biorefinery platform. We believe our in-house expertise will allow us to continue to acquire and effectively integrate new production facilities as we grow and complete additional acquisitions in the biodiesel industry. |
| Ø | Strategic relationships with other industry participants. We have established strategic relationships with other industry participants, particularly Bunge North America, Inc., or Bunge, ED&F Man Holdings Limited and its subsidiaries, or ED&F Man, and West Central Cooperative, or West Central, with whom we trade feedstock and biodiesel, and each of whom is also a principal stockholder. These relationships enable us to more effectively address market opportunities and provide us with an advantage over our competitors that have not been able to establish such strategic relationships. |
| Ø | Sales and Marketing Leadership. We are a leading marketer of biodiesel in the United States, marketing both biodiesel we produce as well as biodiesel produced by others. The scale of our operations, combined with our logistics capabilities, allows us to satisfy local and national customer needs in a manner that we believe most other biodiesel producers and marketers cannot match. In addition, the customer support provided by our large sales and technical teams provides us with further competitive advantages. |
| Ø | Premium Product Quality. Our REG-9000® biodiesel exceeds the ASTM D6751 biodiesel quality specification. In addition, all of our operating facilities are either certified as BQ-9000 producers or follow BQ-9000 protocols and are in the process of obtaining certification. Some larger customers require specifications stricter than ASTM D6751. The ability of our REG-9000® biodiesel to meet stricter specifications than the industry standards and our BQ-9000 accreditation enables us to sell to a broader customer base than our competitors who cannot meet these customer requirements. |
| Ø | Experienced Management Team with Significant Risk Management Expertise. Our management team has extensive experience in the biodiesel and related oleochemical and agricultural industries, with an average of 19 years of relevant experience. Our management team has enabled our company to evolve from a single biodiesel production facility in 1996 into a nationally recognized fully integrated biodiesel company. Our team also has extensive experience in managing risk related to commodity pricing, which is an essential component of effective biorefinery management. |
2
Table of Contents
OUR STRATEGY
Our strategy is to optimize and grow our core biodiesel business, to diversify our biorefinery assets to produce renewable chemicals, additional advanced biofuels and next generation feedstocks, and to expand internationally.
| Ø | Optimize and expand our fully integrated biodiesel offering. We intend to enhance the capabilities and increase the production capacity of our existing plants by investing in high-value processing upgrades to further improve yields and optimize the range of usable lower cost feedstocks at our production facilities. We also plan to continue to consolidate the biodiesel industry and expand our existing biorefinery platform by continuing to strategically acquire biodiesel plants. |
| Ø | Diversify into the production of renewable chemicals, additional advanced biofuels and related products. Our track record of successfully commercializing new biorefinery technologies positions us well to diversify into the production of renewable chemicals and additional advanced biofuels, such as renewable diesel and jet fuel. We also plan to vertically integrate by producing next generation feedstocks, such as algae oil. |
| Ø | Grow our business internationally. We intend to expand into select international markets, which may include Europe, South America and Asia, where we believe we can leverage our existing fully integrated biorefinery platform or leverage our existing strategic relationships with industry participants operating in such markets. In addition, we plan to acquire or invest in biodiesel, renewable chemicals or other advanced biofuel production and distribution assets targeting large end-user or large feedstock generating markets. |
| Ø | Expand our intellectual property base. We intend to build upon our existing intellectual property portfolio and develop and acquire additional intellectual property to support our business and to expand into renewable chemicals, additional advanced biofuels, next generation feedstocks and related renewable products. |
RISKS ASSOCIATED WITH OUR BUSINESS
Our business is subject to numerous risks. Before you invest in our Common Stock, you should carefully consider all the information in this prospectus, including matters set forth under the heading “Risk factors” beginning on page 9 of this prospectus. These risks include, among others, that:
| Ø | a loss or reduction of governmental requirements for the use of biofuels could have a material adverse affect on our revenues and operating margins; |
| Ø | our gross margins are dependent on the spread between feedstock costs and biodiesel prices; |
| Ø | the costs of raw materials that we use as feedstocks are volatile and our results of operations could fluctuate substantially as a result; |
| Ø | we have limited working capital and a recent history of unprofitable operations, and these working capital constraints may limit our growth and may cause us to curtail our operations or forgo sales; |
| Ø | we and certain subsidiaries have substantial indebtedness, which subjects us to potential defaults, and could adversely affect our ability to raise additional capital to fund our operations and could limit our ability to react to changes in the economy or the biodiesel industry; |
| Ø | a loss or reductions of tax incentives for biodiesel production or consumption could have a material adverse affect on our revenues and operating margins; |
| Ø | despite our current debt levels, we and our subsidiaries may incur substantially more debt. This could exacerbate the risks associated with our substantial indebtedness; |
3
Table of Contents
| Ø | our success depends on our ability to manage our growing and changing operations; |
| Ø | risk management transactions could significantly increase our operating costs and working capital requirements if we incorrectly estimate our feedstock demands and biodiesel sales as compared to market conditions; |
| Ø | one customer accounted for a meaningful percentage of revenues and a loss of this customer could have an adverse impact on our total revenues; and |
| Ø | insiders have substantial control over us and will continue to be able to exercise influence over corporate matters following this offering. |
CORPORATE INFORMATION
Our predecessor, REG Biofuels, Inc., formerly named Renewable Energy Group, Inc., was formed under the laws of the State of Delaware in August 2006 upon acquiring the assets and operations of the biodiesel division of West Central and two of West Central’s affiliated companies, InterWest, L.C. and REG, LLC. We were incorporated in Delaware in April 2009.
Our principal executive offices are located at 416 South Bell Avenue, Ames, Iowa 50010. Our telephone number at that location is (515) 239-8000. Our website address is www.REGI.com. Information on our website is not part of this prospectus and should not be relied upon in determining whether to make an investment decision.
Renewable Energy Group, REG, the REG logo, and REG-9000® referenced in this prospectus are our trademarks or service marks or registered trademarks or service marks. All other trademarks, trade names and service marks appearing in this prospectus are the property of their respective owners.
4
Table of Contents
| Common Stock offered by us |
shares (or shares if the underwriters exercise their over-allotment option in full) |
| Common Stock offered by the selling stockholders |
shares |
| Common Stock to be outstanding after this offering |
shares (or shares if the underwriters exercise their over-allotment option in full) |
| Class A Common Stock to be outstanding after this offering |
shares |
| Total Common Stock and Class A Common Stock to be outstanding after this offering |
shares (or shares if the underwriters exercise their over-allotment option in full) |
| Over-allotment option |
The underwriters have an option to purchase a maximum of additional shares of Common Stock from us to cover over-allotments. The underwriters could exercise this option at any time within 30 days from the date of the prospectus. |
| Use of proceeds |
We intend to use approximately $12.0 million of the net proceeds received by us from this offering to exercise the option we hold to acquire our facility in Seneca, Illinois, which we currently lease, with the remaining proceeds to be used for working capital, capital expenditures related to improvements of production processes and logistics, investments in new biofuel businesses, production technologies or other assets, and in opportunities to extend our biorefinery platform to the production of renewable chemicals and feedstocks. If the underwriters exercise their over-allotment option, the first $15.0 million of net proceeds, or such lesser amount if the net proceeds are less than $15.0 million, will be used for certain payments to the former holders of the Series A preferred stock. We intend to use any net proceeds from the exercise of the over-allotment option in excess of $15.0 million as described in the first sentence above. See “Use of proceeds” on page 31. We will not receive any of the proceeds from the sale of Common Stock by the selling stockholders. |
5
Table of Contents
| Risk factors |
See “Risk factors” beginning on page 9 of this prospectus for a discussion of factors you should carefully consider before deciding to invest in our Common Stock. |
| Proposed Nasdaq Global Market symbol |
“REGI” |
The total number of shares of our Common Stock and Class A Common Stock outstanding after this offering is based on no shares of our Common Stock and shares of our Class A Common Stock outstanding (after giving pro forma effect to the reclassification of our existing common stock into an equivalent number of shares of Class A Common Stock), as of June 30, 2011 and:
| Ø | Includes shares of Class A Common Stock that will be issued as part of the conversion of our outstanding Series A preferred stock and exchange of existing warrants to purchase shares of our common stock; |
| Ø | Excludes up to shares of Common Stock issuable upon the conversion of the Series B preferred stock issuable upon conversion of our outstanding Series A preferred stock; |
| Ø | Excludes shares of Class A Common Stock issuable upon the exercise of warrants to purchase Class A Common Stock that will remain outstanding following this offering; |
| Ø | Excludes shares of Class A Common Stock issuable upon the exercise of outstanding restricted stock units, or RSUs; |
| Ø | Excludes shares of Class A Common Stock issuable upon the exercise of outstanding options, at a weighted average exercise price of $ per share; and |
| Ø | Excludes shares of Class A Common Stock reserved for future issuance under our 2009 Stock Incentive Plan. |
Unless otherwise indicated, all information in this prospectus assumes:
| Ø | The reclassification of our existing common stock into an equivalent number of shares of our Class A Common Stock and the authorization of our Common Stock; |
| Ø | That our third amended and restated certificate of incorporation, which we will file in connection with the completion of this offering, is in effect; |
| Ø | Except for the financial statements and notes thereto, the conversion, effective immediately prior to the completion of this offering, of all outstanding shares of our Series A preferred stock for an aggregate of shares of Class A Common Stock and 3,000,000 shares of Series B preferred stock, which number includes up to 400,000 shares of Series B preferred stock, issuable upon expiration of the underwriters’ over-allotment option, to be reduced proportionately if the net proceeds from that exercise are greater than $5.0 million and less than $15.0 million, as described under “Use of proceeds”; and |
| Ø | No exercise by the underwriters of their over-allotment option to purchase up to additional shares of Common Stock from us. |
All references in this prospectus to common stock include our existing common stock, our Common Stock and our Class A Common Stock. As set forth in the section entitled “Description of capital stock,” all shares of Class A Common Stock outstanding following this offering will automatically convert into shares of Common Stock upon expiration of the underwriters lock-up described in the section entitled “Underwriting.”
6
Table of Contents
Summary consolidated financial data
The summary consolidated statements of operations data for each of the three years in the period ended December 31, 2010 have been derived from our audited consolidated financial statements that are included elsewhere in this prospectus. The summary consolidated balance sheet data as of June 30, 2011 and the summary consolidated statements of operations data for each of the six months ended June 30, 2011 and 2010 have been derived from our unaudited condensed consolidated financial statements that are included elsewhere in this prospectus. You should read this information together with the consolidated financial statements and related notes, unaudited pro forma as adjusted financial information and other information under “Management’s discussion and analysis of financial condition and results of operations” included elsewhere in this prospectus. Operating results for the six months ended June 30, 2011 are not necessarily indicative of the results that may be expected for the year ended December 31, 2011.
| Year ended December 31, | Six months ended June 30, |
|||||||||||||||||||
| Consolidated Statement of Operations Data: | 2010(1) | 2009 | 2008(2) | 2011 | 2010 | |||||||||||||||
| (in thousands, except share and per share amounts) | ||||||||||||||||||||
| Revenues: |
||||||||||||||||||||
| Biodiesel sales |
$ | 207,902 | $ | 109,027 | $ | 69,509 | $ | 284,421 | $ | 79,144 | ||||||||||
| Biodiesel government incentives |
7,240 | 19,465 | 6,564 | 16,266 | 3,674 | |||||||||||||||
|
|
|
|
|
|
|
|
|
|
|
|||||||||||
| Total biodiesel |
215,142 | 128,492 | 76,073 | 300,687 | 82,818 | |||||||||||||||
| Services |
1,313 | 3,009 | 9,379 | 60 | 1,008 | |||||||||||||||
|
|
|
|
|
|
|
|
|
|
|
|||||||||||
| Total revenues |
216,455 | 131,501 | 85,452 | 300,747 | 83,826 | |||||||||||||||
|
|
|
|
|
|
|
|
|
|
|
|||||||||||
| Costs of goods sold: |
||||||||||||||||||||
| Biodiesel |
194,016 | 127,373 | 78,736 | 262,084 | 75,949 | |||||||||||||||
| Services |
807 | 1,177 | 4,470 | 42 | 533 | |||||||||||||||
|
|
|
|
|
|
|
|
|
|
|
|||||||||||
| Total costs of goods sold |
194,823 | 128,550 | 83,206 | 262,126 | 76,482 | |||||||||||||||
|
|
|
|
|
|
|
|
|
|
|
|||||||||||
| Gross profit |
21,632 | 2,951 | 2,246 | 38,621 | 7,344 | |||||||||||||||
| Total operating expenses |
29,681 | 24,144 | 24,208 | 14,090 | 10,958 | |||||||||||||||
|
|
|
|
|
|
|
|
|
|
|
|||||||||||
| Income (loss) from operations |
(8,049 | ) | (21,193 | ) | (21,962 | ) | 24,531 | (3,614 | ) | |||||||||||
|
|
|
|
|
|
|
|
|
|
|
|||||||||||
| Total other income (expense), net |
(16,102 | ) | (1,364 | ) | (2,318 | ) | (21,596 | ) | 2,956 | |||||||||||
|
|
|
|
|
|
|
|
|
|
|
|||||||||||
| Income (loss) before income tax benefit (expense) and loss from equity investments |
(24,151 | ) | (22,557 | ) | (24,280 | ) | 2,935 | (658 | ) | |||||||||||
| Income tax benefit (expense) |
3,252 | (45,212 | ) | 9,414 | — | 3,728 | ||||||||||||||
| Loss from equity investments |
(689 | ) | (1,089 | ) | (1,013 | ) | (148 | ) | (381 | ) | ||||||||||
|
|
|
|
|
|
|
|
|
|
|
|||||||||||
| Net income (loss) |
(21,588 | ) | (68,858 | ) | (15,879 | ) | 2,787 | 2,689 | ||||||||||||
| Less: Net loss attributable to noncontrolling interests |
— | 7,953 | 2,788 | — | — | |||||||||||||||
|
|
|
|
|
|
|
|
|
|
|
|||||||||||
| Net income (loss) attributable to the company |
(21,588 | ) | (60,905 | ) | (13,091 | ) | 2,787 | 2,689 | ||||||||||||
| Effects of recapitalization |
8,521 | — | — | — | 8,521 | |||||||||||||||
| Less: accretion of preferred stock to redemption value |
(27,239 | ) | (44,181 | ) | (26,692 | ) | (12,076 | ) | (16,246 | ) | ||||||||||
| Less: undistributed dividends allocated to preferred stockholders |
(10,027 | ) | (14,036 | ) | (11,145 | ) | (6,246 | ) | (4,073 | ) | ||||||||||
|
|
|
|
|
|
|
|
|
|
|
|||||||||||
| Net loss attributable to the company’s common stockholders |
$ | (50,333 | ) | $ | (119,122 | ) | $ | (50,928 | ) | $ | (15,535 | ) | $ | (9,109 | ) | |||||
|
|
|
|
|
|
|
|
|
|
|
|||||||||||
| Net loss per share attributable to common stockholders: |
||||||||||||||||||||
| Basic |
$ | (1.71 | ) | $ | (6.14 | ) | $ | (3.07 | ) | $ | (0.47 | ) | $ | (0.34 | ) | |||||
|
|
|
|
|
|
|
|
|
|
|
|||||||||||
| Diluted (3) |
$ | (1.71 | ) | $ | (6.14 | ) | $ | (3.07 | ) | $ | (0.47 | ) | $ | (0.34 | ) | |||||
|
|
|
|
|
|
|
|
|
|
|
|||||||||||
7
Table of Contents
| Year ended December 31, | Six months ended June 30, |
|||||||||||||||||||
| Consolidated Statement of Operations Data: | 2010(1) | 2009 | 2008(2) | 2011 | 2010 | |||||||||||||||
| (in thousands, except share and per share amounts) |
||||||||||||||||||||
| Weighted-average shares used to compute net loss per share attributable to common stockholders: |
||||||||||||||||||||
| Basic |
29,427,120 | 19,407,227 | 16,593,555 | 31,171,531 | 26,686,936 | |||||||||||||||
|
|
|
|
|
|
|
|
|
|
|
|||||||||||
| Diluted(3) |
29,427,120 | 19,407,227 | 16,593,555 | 31,171,531 | 26,686,936 | |||||||||||||||
|
|
|
|
|
|
|
|
|
|
|
|||||||||||
| Pro forma net loss per share attributable to common stockholders(4): |
||||||||||||||||||||
| Basic |
$ | $ | ||||||||||||||||||
|
|
|
|
|
|||||||||||||||||
| Diluted |
$ | $ | ||||||||||||||||||
|
|
|
|
|
|||||||||||||||||
| Pro forma weighted-average shares used to compute net loss per share attributable to common stockholders(4): |
||||||||||||||||||||
| Basic |
||||||||||||||||||||
|
|
|
|
|
|||||||||||||||||
| Diluted |
||||||||||||||||||||
|
|
|
|
|
|||||||||||||||||
| (1) | Reflects the deconsolidation of Blackhawk Biofuels, LLC, or Blackhawk, as of January 1, 2010, the acquisition of Blackhawk as of February 26, 2010, the acquisition of Central Iowa Energy, LLC, or CIE, as of March 8, 2010, the consolidation of Seneca Landlord, LLC, or Landlord, as of April 8, 2010, the acquisition of Tellurian Biodiesel, Inc., or Tellurian, and American BDF, LLC, or ABDF, as of July 16, 2010, and the acquisition of Clovis Biodiesel, LLC, as of September 21, 2010. |
| (2) | Reflects the consolidation of Blackhawk as of May 9, 2008 and the acquisition of U.S. Biodiesel Group, Inc., or USBG, as of June 26, 2008. |
| (3) | Certain potentially dilutive securities were excluded from the calculation of diluted net loss per share attributable to common stockholders during the periods presented as the effect was anti-dilutive. |
| (4) | The pro forma per share amounts give effect to (i) the filing of our second amended and restated certificate of incorporation, (ii) the automatic conversion of all outstanding shares of Series A preferred stock and the reclassification of our existing common stock into an aggregate of shares of Class A Common Stock and 3,000,000 shares of Series B preferred stock in the recapitalization transactions that will occur in connection with this offering, (iii) the issuance of 500,000 shares of Class A Common Stock to USRG Holdco IX, LLC immediately prior to the completion of this offering in connection with the termination of the Glycerin Option Agreement dated as of April 8, 2010, between us and USRG Holdco IX, LLC and (iv) the issuance of shares of Class A Common Stock in exchange for existing warrants to purchase shares of Class A Common Stock, as if such actions had occurred on the first day of the applicable period. |
| As of June 30, 2011 | ||||||||
| Consolidated Balance Sheet Data: | Actual | Pro Forma(1) | Pro Forma as Adjusted(2) | |||||
| (in thousands) | ||||||||
| Cash and cash equivalents |
$ | 9,125 | ||||||
| Working capital (deficit)(3) |
19,459 | |||||||
| Total debt(4) |
$ | 99,917 | ||||||
| Total assets |
403,949 | |||||||
| Total liabilities |
241,582 | |||||||
| Total stockholders’ equity |
27,855 | |||||||
| (1) | The pro forma column in the consolidated balance sheet data table above reflects the conversion of all outstanding shares of our Series A preferred stock into shares of Class A Common Stock and 3,000,000 shares of Series B preferred stock in recapitalization transactions that will occur in connection with this offering. |
| (2) | The pro forma as adjusted column in the consolidated balance sheet data table above reflects (i) the conversion of all outstanding shares of our Series A preferred stock into shares of Class A Common Stock and 3,000,000 shares of Series B preferred stock in the recapitalization transactions that will occur in connection with this offering, (ii) the issuance of shares of Class A Common Stock to USRG Holdco IX, LLC immediately prior to the completion of this offering in connection with the termination of the Glycerin Option Agreement dated as of April 8, 2010, between us and USRG Holdco IX, LLC, (iii) the issuance of shares of Class A Common Stock in exchange for existing warrants to purchase shares of Class A Common Stock and (iv) the issuance and sale by us of shares of our Common Stock in this offering at an assumed initial public offering price of $ per share, the midpoint of the price range set forth on the cover page of this prospectus, after deducting the estimated underwriting discounts and commissions and estimated offering expenses payable by us. |
| (3) | Includes $22.8 million term loan held by our wholly-owned subsidiary, REG Danville, LLC, or REG Danville, which matures on November 3, 2011. Working capital is defined as current assets less current liabilities. |
| (4) | In August 2011, our wholly-owned subsidiary, REG Albert Lea, LLC, or REG Albert Lea, entered into a $10.0 million note for working capital, which we have guaranteed. |
8
Table of Contents
Investing in our Common Stock involves a high degree of risk. You should consider carefully the risks and uncertainties described below, together with all of the other information in this prospectus, including our consolidated financial statements and related notes included elsewhere in this prospectus, before making an investment decision. If any of the following risks are realized, our business, financial condition, results of operations and prospects could be materially and adversely affected. In that event, the trading price of our Common Stock could decline and you could lose part or all of your investment.
RISKS ASSOCIATED WITH OUR BUSINESS
Loss or reductions of governmental requirements for the use of biofuels could have a material adverse affect on our revenues and operating margins.
The biodiesel industry relies substantially on federal requirements and state policies for use of biofuels. Since biodiesel has been more expensive to produce than petroleum-based diesel fuel over the past few years, the biodiesel industry depends on governmental programs that support a market for biodiesel that might not otherwise exist.
The most important of these government programs in the United States is RFS2, which requires that a certain volume of biomass-based diesel fuel, which includes biodiesel, be consumed. RFS2 became effective on July 1, 2010 and applies through 2022. We believe that the increase in demand for our biodiesel in 2011 is directly attributable to the implementation of RFS2. In addition, we believe that biodiesel prices in 2011 have benefited significantly from RFS2.
There can be no assurance that Congress or the EPA will not repeal, curtail or otherwise change the RFS2 program in a manner adverse to us. The petroleum industry has opposed the retroactive application of certain provisions of the rule and fundamental fairness in the implementation of policy involved in RFS2 and can be expected to continue to press for changes that eliminate or reduce its impact. Any repeal or reduction in the RFS2 requirements or reinterpretation of RFS2 resulting in our biodiesel failing to qualify as a required fuel would materially decrease the demand for and price of our product, which would materially and adversely harm our revenues and cash flows.
If Congress decides to repeal or curtail RFS2, or if the EPA is not able or willing to enforce RFS2 requirements, the demand for our product based on this program and any increases in demand that we expect due to RFS2 would be significantly reduced or eliminated and our revenues and operating margins would be materially harmed. In addition, although we believe that state requirements for the use of biofuels increase demand for our biodiesel within such states, they generally may not increase overall demand in excess of RFS2 requirements. Rather, existing demand for our biofuel from petroleum refiners and petroleum fuel importers in the 48 contiguous states or Hawaii, which are defined as “Obligated Parties” in the RFS2 regulations, in connection with federal requirements, may shift to states that have use requirements or tax incentive programs.
Our gross margins are dependent on the spread between biodiesel prices and feedstock costs.
Our gross margins depend on the spread between biodiesel prices and feedstock costs. Historically, the spread between biodiesel prices and feedstock costs has varied significantly. Although actual yields vary depending on the feedstock quality, the average monthly spread between the price per gallon of 100% pure biodiesel, or B100, as reported by The Jacobsen Publishing Company, or The Jacobsen, and the
9
Table of Contents
Risk factors
price for the amount of choice white grease, a common inedible animal fat used by us to make biodiesel, was $1.83 in 2008, $1.25 in 2009, $1.06 in 2010, and $1.08 in the first six months of 2011, assuming 8.0 pounds of choice white grease yields one gallon of biodiesel. The average monthly spread for the amount of crude soybean oil required to produce one gallon of biodiesel, based on the nearby futures contract as reported on the Chicago Board of Trade, or CBOT, was $0.61 per gallon in 2008, $0.39 in 2009, and $0.25 per gallon in 2010, and $0.62 in the first six months of 2011, assuming 7.5 pounds of soybean oil yields one gallon of biodiesel. For 2010, approximately 91% of our total feedstock usage was inedible animal fat, used cooking oil or inedible corn oil and 9% was soybean oil, compared to approximately 78% for inedible animal fat, used cooking or inedible corn oil and 22% for soybean oil in 2009.
Biodiesel has traditionally been marketed primarily as an additive or alternative to petroleum-based diesel fuel and as a result biodiesel prices have been influenced by the price of petroleum-based diesel fuel, adjusted for government tax incentives supporting renewable fuels, rather than biodiesel production costs. A lack of correlation between production costs and biodiesel prices means that we may be unable to pass increased production costs on to our customers in the form of higher prices. Any decrease in the spread between biodiesel prices and feedstock costs, whether as a result of an increase in feedstock prices or a reduction in biodiesel prices, including, but not limited to, a reduction in the value of Renewable Identification Numbers, or RINs, would adversely affect our gross margins, cash flow and results of operations. For a detailed description of RINs, see “Industry overview—Government Programs Favoring Biodiesel Production and Use—Renewable Identification Numbers.”
The costs of raw materials that we use as feedstocks are volatile and our results of operations could fluctuate substantially as a result.
The cost of feedstocks is a significant uncertainty for our business. The success of our operations is dependent on the price of feedstocks and certain other raw materials that we use to produce biodiesel. A decrease in the availability or an increase in the price of feedstocks may have a material adverse effect on our financial condition and operating results. At elevated price levels, these feedstocks may be uneconomical to use, as we may be unable to pass feedstock cost increases on to our customers.
The price and availability of feedstocks and other raw materials may be influenced by general economic, market and regulatory factors. These factors include weather conditions, farming decisions, government policies and subsidies with respect to agriculture and international trade, and global supply and demand. The significance and relative impact of these factors on the price of feedstocks is difficult to predict, especially without knowing what types of feedstock materials will be optimal for use in the future, particularly at new facilities that we construct or acquire.
Since 2009, we have principally used inedible animal fats, used cooking oil and inedible corn oil as our feedstocks for the production of biodiesel. Our decision to shift to these feedstocks resulted from the reduction in profit caused by a significant increase in soybean oil prices, which rose from $0.1435 per pound in February 2001 to $0.7040 per pound in March 2008, and soybean oil having generally remained at high levels since that time. While less volatile than soybean oil, prices for these alternative feedstocks can also vary significantly based on market conditions. Since January 1, 2008, the cost per pound of choice white grease, an inedible animal fat commonly used by us in the production of biodiesel, has traded in a range of $0.0950 to $0.5250 based on the closing nearby futures prices on the CBOT. Historically, the price of animal fat has been affected by the amount of slaughter kills in the United States, as well as demand from other markets. If biodiesel production continues to increase in response to RFS2, we expect that more biodiesel producers will seek to use these lower cost feedstocks, potentially increasing our costs of production. In addition, because the market for animal fat is less developed than
10
Table of Contents
Risk factors
markets for vegetable oils such as soybean oil, we generally are unable to enter into forward contracts at fixed prices. Further, the markets for used cooking oil and inedible corn oil are in their nascent stages. The market for used cooking oil as a feedstock for biodiesel is still developing and supply is limited. While the commercial supply of inedible corn oil is growing as some ethanol producers are installing corn oil extraction technology in their ethanol plants, it is not generally available in quantities sufficient to cover all our operations. At present, there are a limited number of ethanol plants with the equipment necessary to extract inedible corn oil that can be used in biodiesel production. If more ethanol plants do not acquire and utilize corn oil extraction equipment or if ethanol plants are idled, we may not be able to obtain additional amounts of inedible corn oil for use in our production of biodiesel and may be forced to utilize higher cost feedstocks to meet increased demand, which may not be economical.
We have limited working capital and a recent history of unprofitable operations; these working capital constraints may limit our growth and may cause us to curtail our operations or forgo sales.
We have a limited amount of working capital to support our operations. We became cash flow positive during fourth quarter of 2010 and were cash flow positive in the first and second quarters of 2011, but we will need to raise additional working capital to be able to take advantage of the anticipated increased demand for biodiesel resulting from RFS2. Rising commodity prices further increase our demand for working capital, as both our feedstock production costs and costs for biodiesel we acquire from third parties and resell have increased in price, requiring more working capital to manage the same volume of sales. If additional working capital is not available, we may find it necessary to curtail operations and forgo sales, harming our revenues and profitability.
We and certain subsidiaries have substantial indebtedness, which subjects us to potential defaults, could adversely affect our ability to raise additional capital to fund our operations and limit our ability to react to changes in the economy or the biodiesel industry.
Several of our subsidiaries have a significant amount of indebtedness, some of which we have guaranteed. At June 30, 2011, our total long-term debt was $89.3 million, which includes $24.6 million of indebtedness of REG Danville that matures in November 2011. This includes consolidated long-term debt owed by our Variable Interest Entities, or VIEs, including Landlord and 416 South Bell, LLC, or Bell, LLC. At June 30, 2011, the amount borrowed by our subsidiaries under our lines of credit was $10.6 million, all of which we guaranteed. In addition, in August 2011, REG Albert Lea borrowed and we guaranteed $10.0 million that will be used for working capital at our Albert Lea facility. This REG Albert Lea debt matures in December 2011.
All of the agreements for our indebtedness contain financial covenants the breach of which would result in an event of default by us or our subsidiary obligor. At March 31, 2011, REG Danville was not in compliance with its financial covenants requiring it to meet a minimum fixed charge coverage ratio and a maximum funded debt-to-EBITDA ratio and it was necessary for us to obtain a waiver from the lender to avoid a default. At June 30, 2011, our Danville subsidiary was in compliance with its financial covenants. For a discussion of the financial covenants related to our debt agreements, see “Management discussion and analysis of financial condition and results of operations—Liquidity.”
Our level of indebtedness relative to our size could restrict our operations and make it more difficult for us to satisfy our debt obligations or obtain additional borrowings for working capital to fund operations. In connection with the Seneca facility transaction, one of our subsidiaries leases the Seneca facility from Landlord, an entity owned by certain of our large stockholders. In addition, our subsidiaries are required annually to pay a certain portion of our excess cash flow at our Danville and Newton facilities to their respective lenders, which reduces the cash flow that we receive from these facilities.
11
Table of Contents
Risk factors
Our significant amount of indebtedness could:
| Ø | require us to dedicate a substantial portion of our cash flow from operations to payments of principal, interest on, and other fees related to such indebtedness, thereby reducing the availability of our cash flow to fund working capital and capital expenditures, and for other general corporate purposes; |
| Ø | increase our vulnerability to general adverse economic and biodiesel industry conditions; |
| Ø | limit our flexibility in planning for, or reacting to, changes in our business and the biodiesel industry, which may place us at a competitive disadvantage compared to our competitors that have less debt; and |
| Ø | limit among other things, our ability to borrow additional funds. |
Loss or reductions of tax incentives for biodiesel production or consumption would have a material adverse affect on our revenues and operating margins.
The biodiesel industry is also substantially aided by federal and state tax incentives. Prior to RFS2, the biodiesel industry relied principally on these tax incentives to bring the price of biodiesel more in line with the price of petroleum-based diesel fuel to the end user. The most significant tax incentive program is the federal blenders’ tax credit. The blenders’ tax credit provides a $1.00 refundable tax credit per gallon of pure biodiesel, or B100, to the first blender of biodiesel with petroleum-based diesel fuel. Congress allowed the blenders’ tax credit to expire as of December 31, 2009 and then re-enacted the credit in December 2010, retroactively for all of 2010 and prospectively for 2011. The blenders’ tax credit is set to expire again on December 31, 2011. Certain ethanol tax credits have recently been proposed to be curtailed or eliminated as part of United States federal deficit reduction efforts. Unlike RFS2, the blenders’ tax credit has a direct effect on federal government spending and could be changed or eliminated as a result of changes in the federal budget policy. The absence of and uncertainty around the blenders’ tax credit during most of 2010 materially curtailed demand for biodiesel and our ability to cost effectively produce and sell biodiesel, resulting in our idling production at several of our facilities during that period. Although the blenders’ tax credit was reinstated for all of 2010, we were not able to recapture all of the tax credit we would have been able to receive because we had chosen not to blend a significant portion of our production in 2010 after the credit lapsed. It is uncertain what action, if any, Congress may take with respect to extending the blenders’ tax credit beyond 2011 or when such action might be effective. If Congress eliminates or reduces the blenders’ tax credit before its expiration on December 31, 2011, or does not extend the credit beyond 2011, demand for our biodiesel and the price we are able to charge for our product may be significantly reduced, harming revenues and profitability.
In addition, several states have enacted tax incentives for the use of biodiesel. Like the federal blenders’ tax credit, these tax incentive programs could be changed as a result of state budget considerations or otherwise. Reduction or elimination of such incentives could materially and adversely harm our revenues and profitability.
Despite our current debt levels, we and our subsidiaries may incur substantially more debt. This could exacerbate the risks associated with our substantial indebtedness.
We and our subsidiaries may incur substantial additional debt in the future, including secured debt. We and certain of our subsidiaries are not currently prohibited under the terms of our debt from incurring additional debt, pledging assets, recapitalizing our debt or taking a number of other actions that could diminish our ability to make payments thereunder. If new indebtedness is added to our current debt levels, the related risks that we and our subsidiaries now face could intensify.
12
Table of Contents
Risk factors
Our success depends on our ability to manage our growing and changing operations.
Since our formation, our business has grown significantly in size and complexity. This growth has placed, and is expected to continue to place, significant demands on our management, systems, internal controls and financial and physical resources. In addition, we expect that we will need to further develop our financial and managerial controls and reporting systems to accommodate future growth. This will require us to incur expenses related to hiring additional qualified personnel, retaining professionals to assist in developing the appropriate control systems and expanding our information technology infrastructure. Our inability to manage growth effectively could have a material adverse effect on our results of operations, financial position and cash flows.
Risk management transactions could significantly increase our operating costs and working capital requirements if we incorrectly estimate our feedstock demands and biodiesel sales as compared to market conditions.
In an attempt to partially offset the effects of volatility of feedstock costs and biodiesel fuel prices, we may enter into contracts that establish market positions in feedstocks, such as inedible animal fats and soybean oil, and related commodities, such as heating oil and ultra-low sulfur diesel, or ULSD. The financial impact of such market positions will depend on commodity prices at the time that we are required to perform our obligations under these contracts. Risk management arrangements will also expose us to the risk of financial loss in situations where the counterparty defaults on its contract or, in the case of exchange-traded or over-the-counter futures or options contracts, where there is a change in the expected differential between the underlying price in the contract and the actual prices paid or received by us. Risk management activities can themselves result in losses when a position is purchased in a declining market or a position is sold in a rising market. Changes in the value of these futures instruments are recognized in current income and may result in margin calls. We may also vary the amount of risk management strategies we undertake, or we may choose not to engage in risk management transactions at all. Further, our ability to reduce the risk of falling biodiesel prices and rising feedstock costs will be limited as currently there is no established futures market for biodiesel or the vast majority of our feedstocks, nor are fixed-price long-term contracts generally available. As a result, our results of operations and financial position may be adversely affected by increases in the price of feedstocks or decreases in the price of biodiesel that are not managed effectively.
One customer accounted for a meaningful percentage of revenues and a loss of this customer could have an adverse impact on our total revenues.
One customer, Pilot Travel Centers LLC, or Pilot, accounted for 24% and 29% of our total revenues in 2009 and 2010, respectively. During the first six months of 2011, Pilot accounted for 25% of our total revenues. Our agreements with Pilot have typically had a one-year term and our current agreement with Pilot expires December 31, 2011. In the event we lose Pilot as a customer or Pilot significantly reduces the volume of biodiesel it buys from us, it could be difficult to replace the lost revenues in the short term and potentially over an extended period, and our profitability and cash flow could be materially harmed.
Our business is primarily dependent upon one product. As a consequence, we may not be able to adapt to changing market conditions or endure any decline in the biodiesel industry.
Our business is currently focused almost entirely on the production and sale of biodiesel, with glycerin and fatty acid sales and the operations of our Services segment representing only a small portion of revenues. Our reliance on biodiesel means that we may not be able to adapt to changing market conditions or to withstand any significant decline in the biodiesel industry. For example, in 2009 and the beginning of 2010, we were required to periodically idle our plants due to insufficient demand which
13
Table of Contents
Risk factors
materially affected our revenues. If we are required to idle our plants in the future or are unable to adapt to changing market conditions, our revenues and results of operations may be materially harmed.
Technological advances and changes in production methods in the biodiesel industry could render our plants obsolete and adversely affect our ability to compete.
It is expected that technological advances in biodiesel production methods will continue to occur and new technologies for biodiesel production may develop. Advances in the process of converting oils and fats into biodiesel could allow our competitors to produce biodiesel faster and more efficiently and at a substantially lower cost. If we are unable to adapt or incorporate technological advances into our operations, our production facilities could become less competitive or obsolete. Further, it may be necessary for us to make significant expenditures to acquire any new technology and retrofit our plants in order to incorporate new technologies and remain competitive. There is no assurance that third-party licenses for any new proprietary technologies would be available to us on commercially reasonable terms or that any new technologies could be incorporated into our plants. If we are unable to obtain, implement or finance new technologies, our production facilities could be less efficient than our competitors and our results of operations could be substantially harmed.
If we are unable to respond to changes in ASTM or customer standards, our ability to sell biodiesel may be harmed.
We currently produce biodiesel to conform to or exceed standards established by ASTM. ASTM standards for biodiesel and biodiesel blends may be modified in response to new observations from the industries involved with diesel fuel. New tests or more stringent standards may require us to make additional capital investments in, or modify, plant operations to meet these standards. In addition, some biodiesel customers have developed their own biodiesel standards which are stricter than the ASTM standards. If we are unable to meet new ASTM standards or our biodiesel customers’ standards cost effectively or at all, our production technology may become obsolete, and our ability to sell biodiesel may be harmed, negatively impacting our revenues and profitability.
Increases in our transportation costs or disruptions in our transportation services could have a material adverse effect on our business.
Our business depends on transportation services to deliver our products to our customers and to deliver raw materials to us. The costs of these transportation services are affected by the volatility in fuel prices, such as those caused by recent geopolitical and economic events. We have not been in the past, and may not be in the future, able to pass along part or all of any fuel price increases to customers. If we continue to be unable to increase our prices as a result of increased fuel costs charged to us by transportation providers, our gross margins may be materially adversely affected.
If any transportation providers fail to deliver raw materials to us in a timely manner, we may be unable to manufacture products on a timely basis. Shipments of products and raw materials may be delayed due to weather conditions, strikes or other events. Any failure of a third-party transportation provider to deliver raw materials or products in a timely manner could harm our reputation, negatively affect our customer relationships and have a material adverse effect on our business, financial condition and results of operations.
We are dependent upon our key management personnel and the loss of any of these persons could adversely affect our results of operations.
We are highly dependent upon key members of our management team for the execution of our business plan. We believe that our future success is highly dependent on the contributions of these key employees.
14
Table of Contents
Risk factors
There can be no assurance that any individual will continue in his or her capacity for any particular period of time. The loss of any of these key employees could delay or prevent the achievement of our business objectives and have a material adverse effect upon our results of operations and financial position.
We have partially constructed plants and planned plant upgrades that require capital that we may not be able to raise.
We have three partially constructed plants, one near New Orleans, Louisiana, one in Emporia, Kansas and one in Clovis, New Mexico, that we expect will require additional investments of approximately $130 to $140 million in the aggregate, excluding working capital requirements, before they would be able to commence production. We also have various upgrades planned for our operating facilities. In order to complete construction of these facilities or upgrade our facilities as planned, we will require additional capital. While we intend to finance certain upgrades to our existing facilities in part with a portion of the proceeds of this offering and from our cash flow from operations, we will need to raise significant capital in addition to the proceeds of this offering to complete construction of the three facilities. We continue to be in discussions with lenders in an effort to obtain financing for our facilities, however, it is uncertain when or if financing will be available. It is also likely that the terms of any project financing would include customary financial and other covenants restricting our project subsidiaries, including restrictions on the ability to make distributions, to guarantee indebtedness and to incur liens on the plants of such subsidiaries. If we are unable to obtain such capital on satisfactory terms, or if such capital is otherwise unavailable, or if we encounter cost overruns on these projects such that we have insufficient capital, we may have to postpone completion of these projects indefinitely, which may adversely affect our ability to implement our strategy and our future revenues and cash flow.
We may not successfully identify and complete acquisitions and other strategic relationships on favorable terms or achieve anticipated synergies relating to any such transactions, and integration of acquisitions may disrupt our business and management.
We regularly review domestic and international acquisitions of biodiesel production facilities and have acquired most of our facilities from third parties. However, we may be unable to identify suitable acquisition candidates in the future. Even if we identify appropriate acquisition candidates, we may be unable to complete such acquisitions on favorable terms, if at all. In addition, we may not realize the anticipated benefits of any or all of our past or future transactions and each transaction has numerous risks. These risks include:
| Ø | difficulty in integrating the operations and personnel of the acquired company; |
| Ø | difficulty in effectively integrating the acquired technologies, products or services with our current technologies, products or services; |
| Ø | disruption of our ongoing business and distraction of our management and employees from other opportunities and challenges; |
| Ø | inability to achieve the financial and strategic goals for the acquired and combined businesses; |
| Ø | incurring acquisition-related costs or amortization costs for acquired intangible assets that could impact our operating results; |
| Ø | potential failure of the due diligence processes to identify significant problems, liabilities or other shortcomings or challenges of an acquired company or technology, including but not limited to, issues with the acquired company’s intellectual property, product quality, environmental liabilities, data back-up and security, revenue recognition or other accounting practices, employee, customer or partner issues or legal and financial contingencies; |
15
Table of Contents
Risk factors
| Ø | exposure to litigation or other claims in connection with, or inheritance of claims or litigation risk as a result of, an acquisition, including but not limited to, claims from terminated employees, customers, former stockholders or other third parties; and |
| Ø | incurring significant exit charges if products or services acquired in business combinations are unsuccessful. |
In addition, one of our strategic goals is to expand our biodiesel production capabilities into international markets. In the event we expand our operations into international markets through acquisitions or otherwise, we may be exposed to additional risks, including unexpected changes in foreign laws and regulations, political and economic instability, challenges in managing foreign operations, increased costs to adapt our systems and practices to those used in foreign countries, export duties, currency restrictions, tariffs and other trade barriers, and the burdens of complying with a wide variety of foreign laws, each of which could have a material adverse effect on our business, financial condition, results of operations and liquidity.
Our business is subject to seasonal fluctuations, which are likely to cause our revenues and operating results to fluctuate.
Our operating results are influenced by seasonal fluctuations in the price of biodiesel. Our sales tend to decrease during the winter season due to perceptions that biodiesel will not perform adequately in colder weather. Colder seasonal temperatures can cause the higher cloud point biodiesel we make from inedible animal fats to become cloudy and eventually gel at a higher temperature than petroleum-based diesel or lower cloud point biodiesel made from soybean, canola or inedible corn oil. Such gelling can lead to plugged fuel filters and other fuel handling and performance problems for customers and suppliers. Reduced demand in the winter for our higher cloud point biodiesel may result in excess supply of such higher cloud point biodiesel and lower prices for such higher cloud point biodiesel. In addition, most of our production facilities are located in colder Midwestern states and our costs of shipping biodiesel to warmer climates generally increase in cold weather months. As a result of these seasonal fluctuations, comparisons of operating measures between consecutive quarters may not be as meaningful as comparisons between longer reporting periods.
Failure to comply with governmental regulations, including EPA requirements relating to RFS2, could result in the imposition of penalties, fines, or restrictions on our operations and remedial liabilities.
The biodiesel industry is subject to extensive federal, state and local laws and regulations related to the general population’s health and safety and compliance and permitting obligations, including those related to the use, storage, handling, discharge, emission and disposal of municipal solid waste and other waste, pollutants or hazardous substances, discharges, air and other emissions, as well as land use and development. Existing laws also impose obligations to clean up contaminated properties or to pay for the cost of such remediation, often upon parties that did not actually cause the contamination. Compliance with these laws, regulations and obligations could require substantial capital expenditures. Failure to comply could result in the imposition of penalties, fines or restrictions on operations and remedial liabilities. These costs and liabilities could adversely affect our operations.
Changes in environmental laws and regulations occur frequently, and any changes that result in more stringent or costly waste handling, storage, transport, disposal or cleanup requirements could require us to make significant expenditures to attain and maintain compliance and may otherwise have a material adverse effect on our business in general and on our results of operations, competitive position or financial condition. We are unable to predict the effect of additional environmental laws and regulations
16
Table of Contents
Risk factors
which may be adopted in the future, including whether any such laws or regulations would significantly increase our cost of doing business or affect our operations in any area.
Under certain environmental laws and regulations, we could be held strictly liable for the removal or remediation of previously released materials or property contamination regardless of whether we were responsible for the release or contamination, or if current or prior operations were conducted consistent with accepted standards of practice. Such liabilities can be significant and, if imposed, could have a material adverse effect on our financial condition or results of operations.
In addition to the regulations mentioned above, we are subject to various laws and regulations related to RFS2, most significantly regulations related to the generation and dissemination of RINs. These regulations are highly complex and evolving, requiring us to periodically update our compliance systems. Any violation of these regulations by us, inadvertently or otherwise, could result in significant fines and harm our customers’ confidence in the RINs we issue, either of which could have a material adverse effect on our business. For a detailed description of RINs, see “Industry overview—Government Programs Favoring Biodiesel Production and Use—Renewable Identification Numbers.”
We are a holding company and there are limitations on our ability to receive dividends and distributions from our subsidiaries.
All of our principal assets, including our biodiesel production facilities, are owned by subsidiaries and these subsidiaries are subject to loan covenants that generally restrict them from paying dividends, making distributions or making loans to us or to any other subsidiary. These limitations will restrict our ability to repay indebtedness, finance capital projects or pay dividends to stockholders from our subsidiaries cash flows from operations.
Our business may suffer if we are unable to attract or retain talented personnel.
Our success depends on the abilities, expertise, judgment, discretion, integrity, and good faith of our management and employees to manage the business and respond to economic, market and other conditions. We have a relatively small management team and employee base, and the inability to attract suitably qualified replacements or additional staff could adversely affect our business. No assurance can be given that our management team or employee base will continue their employment, or that replacement personnel with comparable skills could be found. If we are unable to attract and retain key personnel and additional employees, our business may be adversely affected.
If we fail to maintain effective internal control over financial reporting, we might not be able to report our financial results accurately or prevent fraud; in that case, our stockholders could lose confidence in our financial reporting, which would harm our business and could negatively impact the value of our stock.
Effective internal controls are necessary for us to provide reliable financial reports and prevent fraud. The process of maintaining our internal controls may be expensive and time consuming and may require significant attention from management. Although we have concluded as of December 31, 2010 that our internal control over financial reporting provides reasonable assurance regarding the reliability of financial reporting and the preparation of financial statements for external purposes in accordance with generally accepted accounting principles, because of its inherent limitations, internal control over financial reporting may not prevent or detect fraud or misstatements. Failure to implement required new or improved controls, or difficulties encountered in their implementation, could harm our results of operations or cause us to fail to meet our reporting obligations. If we or our independent registered public accounting firm discover a material weakness, the disclosure of that fact could harm the value of our stock and our business.
17
Table of Contents
Risk factors
A natural disaster, leak, fire or explosion at any of our production plants would increase our costs and liabilities.
Because biodiesel and some of its inputs and outputs are combustible and flammable, a leak, fire or explosion may occur at a plant which could result in damage to the plant and nearby properties, injury to employees and others, and interruption of operations. In addition, our Houston facility, due to its coastal location, is vulnerable to hurricanes, which may cause plant damage, injury to employees and others and interruption of operations and all of our plants could incur damage from other natural disasters. A majority of our facilities are also located in the Midwest, which is subject to tornado activity. If any of the foregoing events occur, we may incur significant additional costs including, among other things, loss of profits due to unplanned temporary or permanent shutdowns of our facilities, clean-up costs, liability for damages or injuries, legal expenses, and reconstruction expenses, which would seriously harm our results of operations and financial condition.
Our insurance may not protect us against our business and operating risks.
We maintain insurance for some, but not all, of the potential risks and liabilities associated with our business. For some risks, we may not obtain insurance if we believe the cost of available insurance is excessive relative to the risks presented. As a result of market conditions, premiums and deductibles for certain insurance policies can increase substantially and, in some instances, certain insurance policies may become unavailable or available only for reduced amounts of coverage. As a result, we may not be able to renew our existing insurance policies or procure other desirable insurance on commercially reasonable terms, if at all. Although we intend to maintain insurance at levels we believe are appropriate for our business and consistent with industry practice, we will not be fully insured against all risks. In addition, pollution, environmental risks and the risk of natural disasters generally are not fully insurable. Losses and liabilities from uninsured and underinsured events and delay in the payment of insurance proceeds could have a material adverse effect on our financial condition and results of operations.
Confidentiality agreements with employees and others may not adequately prevent disclosures of confidential information, trade secrets and other proprietary information.
We rely in part on trade secret protection to protect our confidential and proprietary information and processes. However, trade secrets are difficult to protect. We have taken measures to protect our trade secrets and proprietary information, but these measures may not be effective. For example, we require new employees and consultants to execute confidentiality agreements upon the commencement of their employment or consulting arrangement with us. These agreements generally require that all confidential information developed by the individual or made known to the individual by us during the course of the individual’s relationship with us be kept confidential and not disclosed to third parties. These agreements also generally provide that knowhow and inventions conceived by the individual in the course of rendering services to us are our exclusive property. Nevertheless, these agreements may be breached, or may not be enforceable, and our proprietary information may be disclosed. Further, despite the existence of these agreements, third parties may independently develop substantially equivalent proprietary information and techniques. Accordingly, it may be difficult for us to protect our trade secrets. Costly and time-consuming litigation could be necessary to enforce and determine the scope of our proprietary rights, and failure to obtain or maintain trade secret protection could adversely affect our competitive business position.
Moreover, we cannot assure you that our technology does not infringe upon any valid claims of patents that other parties own. In the future, if we were found to be infringing on a patent owned by a third party, we might have to seek a license from such third party to use the patented technology. We cannot
18
Table of Contents
Risk factors
assure you that, if required, we would be able to obtain such a license on terms acceptable to us, if at all. If a third party brought a legal action against us or our licensors, we could incur substantial costs in defending ourselves, and we cannot assure you that such an action would be resolved in our favor. If such a dispute were to be resolved against us, we could be subject to significant damages.
We depend on our ability to maintain relationships with industry participants, including our current stockholders and other strategic partners.
Our ability to maintain commercial arrangements with biodiesel customers, feedstock suppliers, and transportation and logistics services providers may depend on maintaining close working relationships with industry participants including some of our current and principal stockholders, such as Bunge, ED&F Man and West Central. As we continue to develop our business, we expect to use the business relationships of management and our stockholders in order to form strategic relationships such as contractual arrangements, joint ventures, financings or minority investments. There can be no assurance that we will be able to maintain or establish additional necessary strategic relationships, in which case the opportunity to grow our business may be negatively affected.
Some arrangements that we have with our principal stockholders may not be the result of arm’s-length negotiations.
We have entered into various agreements with West Central, Bunge, ED&F Man and USRG, four of our principal stockholders, and their affiliates, relating to corporate and commercial services that are material to the conduct of our business, and we may enter into additional agreements with these parties and their affiliates. Although we believe that these agreements, as a whole, are no less favorable to us than could be obtained through arm’s-length dealing, these agreements include specific terms and conditions that may be different from terms contained in similar agreements negotiated with unaffiliated third parties. In addition, because these parties are also our principal stockholders and because we have significant contractual or strategic relationships with these parties, it may be difficult or impossible for us to enforce claims that we may have against one or more of them. For a more complete discussion of our arrangements with our principal stockholders, see the discussion under the heading “Certain relationships and related party transactions.”
Insiders have substantial control over us and will continue to be able to exercise influence over corporate matters following this offering.
As of June 30, 2011, our five largest stockholders beneficially owned, in the aggregate, % of our outstanding capital stock, including shares subject to outstanding warrants, and we expect that upon completion of this offering and the related recapitalization transactions described herein the same stockholders will continue to beneficially own approximately % of our outstanding common stock, assuming conversion of the outstanding Series B preferred Stock. As a result, these stockholders, were they to act together, would be able to exercise control over all matters requiring stockholder approval, including the election of directors and approval of significant corporate transactions, such as a merger or other sale of our company or its assets. In addition, subject to certain exceptions, two of our largest stockholders, USRG Holdco V, LLC, which together with its affiliates we refer to as USRG, and NGP Energy Technology Partners, L.P., will hold rights to each designate a member of our board of directors for a period of three years from and after the closing of this offering. This concentration of ownership and contractual power over the appointment of directors could limit other stockholders’ ability to influence corporate matters and may have the effect of delaying or preventing a third party from acquiring control over us.
19
Table of Contents
Risk factors
We operate in a highly competitive industry and competition in our industry would increase if new participants enter the biodiesel business.
We operate in a very competitive environment. The biodiesel industry is primarily comprised of smaller entities that engage exclusively in biodiesel production and large integrated agribusiness companies that produce biodiesel along with their soybean crush businesses. We face competition for capital, labor, feedstocks and other resources from these companies. In the United States, we compete with soybean processors and refiners, including Archer-Daniels-Midland Company, LLC, Cargill, Inc. and Louis Dreyfus Commodities. These and other competitors that are divisions of larger enterprises may have greater financial resources than we do. We also have many smaller competitors. If our competitors consolidate or otherwise grow and we are unable to similarly increase our scale, our business and prospects may be significantly and adversely affected.
In addition, petroleum companies and diesel retailers have not been engaged in biodiesel production to a large extent. These companies form the primary distribution networks for marketing biodiesel through blended petroleum-based diesel. If these companies seek to engage in direct or indirect biodiesel production, there will be less of a need to purchase biodiesel from independent biodiesel producers like us. Such a shift in the market would materially harm our operations, cash flows and financial position.
In the event we enter into new construction contracts, we may be exposed to a variety of risks that could affect our ability to realize profit.
While our construction services management business has had only limited external operations over the last two years, we intend to continue to pursue opportunities to provide these services. Substantially all of our revenues from our new facility construction services business have been derived from fixed unit price contracts. Fixed unit price contracts require us to perform the contract for a fixed unit price irrespective of our actual costs. As a result, we realize a profit on these contracts only if we and our subcontractors successfully estimate our costs and then successfully control actual costs and avoid cost overruns. Further, we have historically subcontracted substantially all of our construction work to Todd & Sargent, Inc. and TSW, LLC on a time and materials, rather than fixed, basis. As a result, we have less control over the largest component of our plant construction costs and the risk of cost overruns generally falls on us rather than our subcontractors. If we or our subcontractors do not execute a contract within cost estimates, then cost overruns may cause us to incur losses or cause the contract not to be as profitable as we initially expected. This, in turn, could negatively affect our cash flow, earnings and financial position.
If we or our subcontractors perform extra or change order work that is not approved by the customer in advance we may have a dispute with the customer over whether the work performed is beyond the scope of the work included in the original project plans and specifications or, if the customer agrees that the work performed qualifies as extra work, the price that the customer is willing to pay for the extra work. These disputes may result in us not receiving payment for all or a significant portion of work that we or our subcontractors have performed. Even where the customer agrees to pay for the extra work, we may be required to fund the cost of that work for a lengthy period of time until the change order is approved and paid by the customer. To the extent actual recoveries with respect to change orders or amounts subject to contract disputes or claims are less than the estimates used in our financial statements, the amount of any shortfall will reduce our revenues and profits, and this could have a material adverse effect on our working capital and results of operations.
20
Table of Contents
Risk factors
We intend to pursue strategic initiatives to diversify our business that will require significant funding and management attention and these initiatives may not be successful.
We are seeking opportunities to diversify our product lines, both as a commercialization partner for companies engaged in the development of new advanced biofuels and by using our biorefinery platform to produce renewable chemicals from bio-mass feedstocks. There is no assurance that new technologies capable of economically producing advanced biofuels will be developed, that the developers of these technologies will select us as their commercialization partner or that the terms of any such collaborative arrangement will be favorable to us. Further, the renewable chemicals market is underdeveloped. Any chemicals that we produce from renewable sources may not prove to be as effective as chemicals produced from petroleum or other sources and, regardless of their effectiveness, renewable chemicals may not be accepted in the chemical marketplace. These strategic initiatives will require significant funding and management attention, and if we are not successful in implementing them, our financial condition and results of operations may be harmed.
We may be obligated to redeem the Series B preferred stock issuable in connection with the recapitalization beginning in 2015.
On June 30, 2015, each holder of the then-outstanding shares of Series B preferred stock may require that up to all of such holder’s shares of Series B preferred stock be redeemed by us out of funds lawfully available at a price per share equal to $25 per share plus any accumulated and unpaid dividends. Assuming no exercise of the underwriters over-allotment option, as of the date of this prospectus, the amount of this potential obligation would be $75 million. In order to satisfy any redemption request, we may need to use limited cash resources on hand, be required to borrow money, issue equity securities or sell assets to meet this obligation, which could impair our working capital, reduce the funds necessary to operate and grow our business, involve significant dilution to holders of our Common Stock or require the disposition of our key assets. If we are subject to a redemption request, it could have a material adverse effect on our financial condition, results of operations and cash flows, and cause the price of our Common Stock to decline.
RISKS RELATED TO THE BIODIESEL INDUSTRY
The market price of biodiesel is influenced by the price of petroleum-based distillate fuels, such as ultra-low sulfur diesel, and decreases in the price of petroleum-based distillate fuels or RIN values would very likely decrease the price we can charge for our biodiesel, which could harm our revenues and profitability.
Historically, biodiesel prices have been strongly correlated to petroleum-based diesel prices and in particular ULSD regardless of the cost of producing biodiesel itself. We market our biofuel as an alternative to petroleum-based fuels. Therefore, if the price of petroleum-based diesel falls, the price of biodiesel could decline, and we may be unable to produce products that are a commercially viable alternative to petroleum-based fuels. Petroleum prices are volatile due to global factors, such as the impact of wars, political uprisings, OPEC production quotas, worldwide economic conditions, changes in refining capacity and natural disasters. Additionally, demand for liquid transportation fuels, including biodiesel, is impacted by economic conditions. Just as a small reduction in the real or anticipated supply of crude oil can have a significant upward impact on the price of petroleum-based fuels, a perceived reduction of such threats can result in a significant reduction in petroleum-based fuel prices. A reduction in petroleum-based fuel prices may have a material adverse affect on our revenues and profits if such price decrease reduces the price we are able to charge for our biodiesel.
21
Table of Contents
Risk factors
Under RFS2 and its increasing required volume obligations, the price of biodiesel has been more sensitive to changes in feedstock costs. Increased RIN values have, in part, offset this sensitivity in price resulting from higher feedstock costs. A reduction in RIN values may have a material adverse affect on our revenues and profits if such price decrease reduces the price we are able to charge for our biodiesel.
The development of alternative fuels and energy sources may reduce the demand for biodiesel, resulting in a reduction in our revenues and profitability.
The development of alternative fuels, including a variety of energy alternatives to biodiesel has attracted significant attention and investment. The construction of several renewable diesel plants by competitors has been announced. Under RFS2, renewable diesel made from biomass meets the definition of biomass-based diesel and thus is eligible, along with biodiesel, to satisfy the RFS2 biomass-based diesel requirement described in “Industry overview—Government Programs Favoring Biodiesel Production and Use.” Furthermore, under RFS2, renewable diesel may receive up to 1.7 RINs per gallon, whereas biodiesel currently receives 1.5 RINs. For a detailed description of RINs and RIN values, see “Industry overview—Government Programs Favoring Biodiesel Production and Use—Renewable Identification Numbers.” As the value of RINs increases, this 0.2 RIN advantage may make renewable diesel more cost-effective, both as a petroleum-based diesel substitute and for meeting RFS2 requirements. If renewable diesel proves to be more cost-effective than biodiesel, our revenues and results of operations would be adversely impacted.
The biodiesel industry will also face increased competition resulting from the advancement of technology by automotive, industrial and power generation manufacturers which are developing more efficient engines, hybrid engines and alternative clean power systems. Improved engines and alternative clean power systems offer a technological solution to address increasing worldwide energy costs, the long-term availability of petroleum reserves and environmental concerns. If and when these clean power systems are able to offer significant efficiency and environmental benefits and become widely available, the biodiesel industry may not be able to compete effectively with these technologies and government requirements for the use of biodiesel may not continue.
The development of alternative fuels and renewable chemicals also puts pressure on feedstock supply and availability to the biodiesel industry. If these emerging technologies compete with biodiesel for feedstocks, are more profitable or have greater governmental support than biodiesel does, then the biodiesel industry may have difficulty in procuring the feedstocks necessary to be successful.
The European Commission has imposed anti-dumping and countervailing duties on biodiesel blends imported into Europe, which have effectively eliminated our ability to sell those biodiesel blends in Europe.
In March 2009, as a response to the federal blenders’ tax credit, the European Commission imposed anti-dumping and anti-subsidy tariffs on biodiesel produced in the United States. These tariffs have effectively eliminated European demand for 20% biodiesel blends, or B20, or higher imported from the United States. The European Commission has extended these tariffs through 2014. In May 2011, the European Commission imposed similar anti-dumping and countervailing duties on biodiesel blends below B20. These duties significantly increase the price at which we and other United States biodiesel producers will be able to sell such biodiesel blends in European markets, making it difficult or impossible to compete in the European biodiesel market. These anti-dumping and countervailing duties therefore decrease the demand for biodiesel produced in the United States and increase the supply of biodiesel available in the United States market. Such market dynamics may negatively impact our revenues and profitability.
22
Table of Contents
Risk factors
If automobile manufacturers and other industry groups express reservations regarding the use of biodiesel, our ability to sell biodiesel will be negatively impacted.
Because it is a relatively new product, research on biodiesel use in automobiles is ongoing. Some industry groups have recommended that blends of no more than 5% biodiesel be used for automobile fuel due to concerns about fuel quality, engine performance problems and possible detrimental effects of biodiesel on rubber components and other engine parts. Although some manufacturers have encouraged use of biodiesel fuel in their vehicles, cautionary pronouncements by other manufacturers or industry groups may impact our ability to market our biodiesel.
There is currently excess production capacity and low utilization in the biodiesel industry and if non-operational and underutilized facilities commence or increase operations, our results of operations may be negatively affected.
Many biodiesel plants in the United States do not currently operate, and of those that do, many do not operate at full capacity. According to statements made by the CEO of the NBB, as of April 2010 2.2 billion gallons per year of biodiesel production capacity in the United States were registered under the RFS2 program. Further, plants under construction and expansion in the United States as of December 2010, if completed, could add an additional several hundred million gallons of annual biodiesel production capacity. The annual production capacity of existing plants and plants under construction far exceeds both historic consumption of biodiesel in the United States and required consumption under RFS2. If this excess production capacity was utilized for biodiesel production, it would increase competition for our feedstocks, increase the volume of biodiesel on the market and may reduce biodiesel gross margins, harming our revenues and profitability.
Perception about “food vs. fuel” could impact public policy which could impair our ability to operate at a profit and substantially harm our revenues and operating margins.
Some people believe that biodiesel may increase the cost of food, as some feedstocks such as soybean oil used to make biodiesel can also be used for food products. This debate is often referred to as “food vs. fuel.” This is a concern to the biodiesel industry because biodiesel demand is heavily influenced by government policy and if public opinion were to erode, it is possible that these policies would lose political support. These views could also negatively impact public perception of biodiesel. Such claims have led some, including members of Congress, to urge the modification of current government policies which affect the production and sale of biofuels in the United States.
Concerns regarding the environmental impact of biodiesel production could affect public policy which could impair our ability to operate at a profit and substantially harm our revenues and operating margins.
Because biodiesel is a new product, the environmental impacts associated with biodiesel production and use have not yet been fully analyzed. Under the 2007 Energy Independence and Security Act, the EPA is required to produce a study every three years of the environmental impacts associated with current and future biofuel production and use, including effects on air and water quality, soil quality and conservation, water availability, energy recovery from secondary materials, ecosystem health and biodiversity, invasive species and international impacts. A draft of the first such triennial report was released in January 2011, with the final report expected to be released in 2012. Should the 2012 study, future EPA triennial studies, or other analyses find that biodiesel production and use has resulted in, or could in the future result in, adverse environmental impacts, such findings could also negatively impact public perception of biodiesel and acceptance of biodiesel as an alternative fuel, which also could result in the loss of political support.
23
Table of Contents
Risk factors
To the extent that state or federal laws are modified or public perception turns against biodiesel, use requirements such as RFS2 and tax incentives such as the federal blenders’ tax credit may not continue, which could materially harm our ability to operate profitably.
Problems with product performance, in cold weather or otherwise, could cause consumers to lose confidence in the reliability of biodiesel which, in turn, would have an adverse impact on our ability to successfully market and sell biodiesel.
Concerns about the performance of biodiesel could result in a decrease in customers and revenues and an unexpected increase in expenses. Biodiesel typically has a higher cloud point than petroleum-based diesel. The cloud point is the temperature below which a fuel exhibits a noticeable cloudiness and is the conventional indicator of a fuel’s potential for cold weather problems. The lower the cloud point, the better the fuel should perform in cold weather. According to an article published by Iowa State University Extension, the cloud point of biodiesel is typically between 30 °F and 60 °F, while the cloud point of the most common form of petroleum-based diesel fuel is typically less than 20 °F. It is our experience that when biodiesel is mixed with petroleum-based diesel to make a two percent biodiesel blend, the cloud point of the blended fuel can be 2 °F to 6 °F higher than petroleum-based diesel and the cloud point of a twenty percent biodiesel blend can be 15 °F to 35 °F higher than petroleum-based diesel, depending on the individual cloud points of the biodiesel and petroleum-based diesel. Cold temperatures can therefore cause biodiesel blended fuel to become cloudy and eventually to gel when pure petroleum-based diesel would not, and this can lead to plugged fuel filters and other fuel handling and performance problems for customers and suppliers. The consequences of these higher cloud points may cause demand for biodiesel in northern and eastern United States markets to diminish during the colder months, which are the primary markets in which we currently operate.
The tendency of biodiesel to gel in colder weather may also result in long-term storage problems. In cold climates, fuel may need to be stored in a heated building or heated storage tanks, which result in higher storage costs. This and other performance problems, including the possibility of particulate formation above the cloud point of a blend of biodiesel and petroleum-based diesel, may also result in increased expenses as we try to remedy these performance problems. Remedying these performance problems may result in decreased yields, lower process throughput or both, as well as substantial capital costs. Any reduction in the demand for our biodiesel product, or the production capacity of our facilities will reduce our revenues and have an adverse effect on our cash flows and results of operations.
Growth in the sale and distribution of biodiesel is dependent on the expansion of related infrastructure which may not occur on a timely basis, if at all, and our operations could be adversely affected by infrastructure limitations or disruptions.
Growth in the biodiesel industry depends on substantial development of infrastructure for the distribution of biodiesel. Substantial investment required for these infrastructure changes and expansions may not be made on a timely basis or at all. The scope and timing of any infrastructure expansion are generally beyond our control. Also, we compete with other biofuel companies for access to some of the key infrastructure components such as pipeline and terminal capacity. As a result, increased production of biodiesel or other biofuels will increase the demand and competition for necessary infrastructure. Any delay or failure in expanding distribution infrastructure could hurt the demand for or prices of biodiesel, impede delivery of our biodiesel, and impose additional costs, each of which would have a material adverse effect on our results of operations and financial condition. Our business will be dependent on the continuing availability of infrastructure for the distribution of increasing volumes of biodiesel and any infrastructure disruptions could materially harm our business.
24
Table of Contents
Risk factors
We may face competition from imported biodiesel, which may reduce demand for biodiesel produced by us and cause our revenues to decline.
Biodiesel produced in Canada, South America, Eastern Asia, the Pacific Rim, or other regions may be imported into the United States market to compete with United States produced biodiesel. These regions may benefit from biodiesel production incentives or other financial incentives in their home countries that offset some of their biodiesel production costs and enable them to profitably sell biodiesel in the United States at lower prices than United States-based biodiesel producers. Under RFS2, imported biodiesel may be eligible and, therefore, may compete to meet the volumetric requirements. This could make it more challenging for us to market or sell biodiesel in the United States, which would have a material adverse effect on our revenues.
Nitrogen oxide emissions from biodiesel may harm its appeal as a renewable fuel and increase costs.
In some instances biodiesel may increase emissions of nitrogen oxide as compared to petroleum-based diesel fuel, which could harm air quality. Nitrogen oxide is a contributor to ozone and smog. These emissions may decrease the appeal of biodiesel to environmental groups and agencies who have been historic supporters of the biodiesel industry, potentially harming our ability to market our biodiesel.
In addition, several states have acted to regulate potential nitrogen oxide emissions from biodiesel. Texas currently requires that biodiesel blends contain an additive to eliminate this perceived nitrogen oxide increase. California is in the process of formulating biodiesel regulations that may also require such an additive. In states where such an additive is required to sell biodiesel, the additional cost of the additive may make biodiesel less profitable or make biodiesel less cost competitive against petroleum-based diesel or renewable diesel, which would negatively impact our ability to sell our products in such states and therefore have an adverse effect on our revenues and profitability.
Several biofuels companies throughout the United States have filed for bankruptcy over the last several years due to industry and economic conditions.
Unfavorable worldwide economic conditions, lack of credit and volatile biofuel prices and feedstock costs have likely contributed to the necessity of bankruptcy filings by biofuel producers. Our business has been, and in the future may be, negatively impacted by the industry conditions that influenced the bankruptcy proceedings of other biofuel producers, or we may encounter new competition from buyers of distressed biodiesel properties who enter the industry at a lower cost than original plant investors.
RISKS RELATED TO THIS OFFERING AND OUR COMMON STOCK
There is no prior public market for our common stock and an active trading market or any specific price for our common stock may not be established or maintained.
Currently, there is no public trading market for our common stock. We intend to apply to list our Common Stock on the Nasdaq Global Market under the symbol “REGI.” The initial public offering price per share will be determined by agreement among us and the representatives of the underwriters and may not be indicative of the market price of our Common Stock after our initial public offering. An active trading market for our Common Stock may not develop and even if it does develop, may not continue upon the completion of this offering and the market price of our Common Stock may decline below the initial public offering price.
25
Table of Contents
Risk factors
The market price for our Common Stock may be volatile.
The market price for our Common Stock is likely to be highly volatile and subject to wide fluctuations in response to factors including the following:
| Ø | actual or anticipated fluctuations in our financial condition and operating results; |
| Ø | changes in the performance or market valuations of other companies engaged in our industry; |
| Ø | issuance of new or updated research reports by securities or industry analysts; |
| Ø | changes in financial estimates by us or of securities or industry analysts; |
| Ø | investors’ general perception of us and the industry in which we operate; |
| Ø | changes in the political climate in the industry in which we operate, existing laws, regulations and policies applicable to our business and products, including RFS2, and the continuation or adoption or failure to continue or adopt renewable energy requirements and incentives, including the blenders’ tax credit; |
| Ø | other regulatory developments in our industry affecting us, our customers or our competitors; |
| Ø | announcements of technological innovations by us or our competitors; |
| Ø | announcement or expectation of additional financing efforts, including sales or expected sales of additional common stock; |
| Ø | additions or departures of key management or other personnel; |
| Ø | litigation; |
| Ø | general market conditions in our industry; and |
| Ø | general economic and market conditions, including continued dislocations and downward pressure in the capital markets. |
In addition, stock markets generally and from time to time experience significant price and volume fluctuations that are not related to the operating performance of particular companies. These market fluctuations may have a material adverse effect on the market price of our Common Stock.
As noted below, a significant portion of our total outstanding shares of common stock is restricted from immediate resale but may be sold into the market in the near future. This could cause the market price of our Common Stock to drop significantly, even if our business is doing well.
Purchasers in this offering will experience immediate and substantial dilution in the book value of their investment.
The initial public offering price of our Common Stock will be substantially higher than the net tangible book value per share of our Common Stock immediately after this offering. Therefore, if you purchase shares of our Common Stock in this offering, you will incur an immediate dilution of $ in net tangible book value per share from the price you paid, based on an assumed initial public offering price of $ per share, the midpoint of the initial public offering price range set forth on the cover page of this prospectus. In addition, new investors who purchase shares in this offering will contribute approximately % of the total amount of equity capital raised by us through the date of this offering, but will only own approximately % of the outstanding share capital and approximately % of the voting rights. The exercise of outstanding options and warrants will result in further dilution. For a further description of the dilution that you will experience immediately after this offering, see the section entitled, “Dilution.”
26
Table of Contents
Risk factors
Future sales of shares by existing stockholders could cause our stock price to decline.
If our existing stockholders sell, or indicate an intention to sell, substantial amounts of our Common Stock in the public market after the underwriter lock-up and other liquidity and legal restrictions on resale discussed in this prospectus lapse, the trading price of our Common Stock could decline. Based on shares outstanding as of June 30, 2011, after giving pro forma effect to the completion of this offering and the related recapitalization transactions, we will have outstanding a total of shares of common stock, assuming no exercise of the underwriters’ over-allotment option. Of these shares, only the shares of Common Stock sold in this offering by us will be listed and eligible for trading on the Nasdaq Global Market after the offering. All of our existing stockholders will own Class A Common Stock or Series B preferred stock, which will not be eligible for trading on the Nasdaq Global Market. The Class A Common Stock will be converted into our Common Stock upon the expiration of the underwriters’ lock-up period described below and the Series B preferred stock will be convertible into Common Stock after the expiration of the underwriters’ lock-up period at the election of the holders or at our election upon the occurrence of certain events. There is currently no public market for our Class A Common Stock, although it is possible that there will be off-market transactions in our Class A Common Stock following the closing of this offering. Of the shares of our Class A Common Stock that, on a pro forma basis for this offering and the related recapitalization transactions, would have been outstanding as of June 30, 2011, shares held by our directors and officers, and certain of our stockholders, are subject to lock-up agreements with the underwriters that restrict their ability to sell or transfer their shares. The lock-up agreements pertaining to this offering will expire 180 days from the date of this prospectus, or the initial lock-up period. Notwithstanding the initial lock-up period, if (i) during the period beginning on the date that is 15 calendar days plus three business days before the last day of the 180-day period, and ending on the last day of the initial lock-up period, we issue an earnings release or material news or a material event relating to us occurs; or (ii) prior to the expiration of the initial lock-up period, we announce that we will release earnings results during the 16-day period beginning on the last day of the initial lock-up period, then the restrictions imposed by these lock-up agreements will continue to apply until the expiration of the date that is 15 calendar days plus three business days after the date on which the issuance of the earnings release or the material news or material event occurs. Our underwriters, however, may, in their sole discretion, permit our officers, directors and other current stockholders who are subject to the contractual lock-up to sell shares prior to the expiration of the lock-up agreements. After the lock-up agreements expire and all shares of Class A Common Stock are converted to Common Stock, based on shares outstanding as of June 30, 2011 giving pro forma effect to the completion of this offering and the related recapitalization transactions, up to an additional shares of Common Stock will be eligible for sale in the public market, of which are held by directors, executive officers and other affiliates and will be subject to volume limitations under Rule 144 under the Securities Act of 1933, or the Securities Act, and various vesting agreements. Following this offering and the related recapitalization transactions, we will have warrants outstanding that will be exercisable for approximately shares of our Class A Common Stock. In addition, following this offering and the related recapitalization transactions, shares of Class A Common Stock will be issuable upon the exercise of outstanding options. Also, there will be shares of Class A Common Stock initially issuable upon conversion of the Series B preferred stock issued in the recapitalization, assuming the underwriters’ over-allotment option has not been exercised. All of these shares of Class A Common Stock will become eligible for sale in the public market after the lock-up agreements expire and all shares of Class A Common Stock are converted to Common Stock, to the extent permitted by the provisions of various vesting and other agreements, and Rules 144 and 701 under the Securities Act. If these additional shares are sold, or if it is perceived that they will be sold, in the public market, the trading price of our Common Stock could decline.
27
Table of Contents
Risk factors
We may issue additional Common Stock as consideration for future investments or acquisitions.
We have issued in the past, and may issue in the future, our securities in connection with investments and acquisitions. The amount of our Common Stock or securities convertible into or exchangeable for our Common Stock issued in connection with an investment or acquisition could constitute a material portion of our then outstanding common stock.
We will incur increased costs as a result of operating as a publicly traded company and our management will be required to devote substantial time to compliance initiatives.
Although we have been operating as a reporting company, we have not been responsible for the full corporate governance and financial reporting practices and policies required of a public company pursuant to the Sarbanes-Oxley Act of 2002, as well as the rules implemented by the Nasdaq Global Market. Following the completion of this offering, we will be a publicly traded company and we will incur significant legal, accounting, investor relations and other expenses that we do not currently incur. We will need to dedicate a substantial amount of time to these compliance initiatives. We will need to hire additional accounting, financial and other staff with appropriate experience and financial knowledge to ensure compliance. Furthermore, if we identify issues complying with these requirements, we would likely incur additional costs relating to such issues, and the existence of such issues could adversely affect us, our reputation, investor perceptions of us and the market price of our Common Stock.
We have never paid dividends on our capital stock and we do not anticipate paying any cash dividends in the foreseeable future.
We have paid no cash dividends on any of our classes of capital stock to date, have contractual restrictions against paying cash dividends and currently intend to retain our future earnings to fund the development and growth of our business. As a result, stockholders must look solely to appreciation of our Common Stock to realize a gain on their investment. This appreciation may not occur. Investors seeking cash dividends should not invest in our Common Stock.
Delaware law and our amended and restated certificate of incorporation and bylaws will contain anti-takeover provisions that could delay or discourage takeover attempts that stockholders may consider favorable.
Provisions in our amended and restated certificate of incorporation and bylaws that we intend to adopt before the closing of this offering may have the effect of delaying or preventing a change of control or changes in our management. These provisions include the following:
| Ø | the right of the board of directors to elect a director to fill a vacancy created by the expansion of the board of directors; |
| Ø | the requirement for advance notice for nominations for election to the board of directors or for proposing matters that can be acted upon at a stockholders’ meeting; |
| Ø | the ability of the board of directors to alter our bylaws without obtaining stockholder approval; |
| Ø | the ability of the board of directors to issue, without stockholder approval, up to 10,000,000 shares of preferred stock with rights set by the board of directors, which rights could be senior to those of common stock; |
| Ø | a classified board; |
| Ø | the required approval of holders of at least two-thirds of the shares entitled to vote at an election of directors to adopt, amend or repeal our bylaws or amend or repeal the provisions of our amended and |
28
Table of Contents
Risk factors
| restated certificate of incorporation regarding the classified board, the election and removal of directors and the ability of stockholders to take action by written consent; and |
| Ø | the elimination of the right of stockholders to call a special meeting of stockholders and to take action by written consent. |
In addition, because we are incorporated in Delaware, we are governed by the provisions of Section 203 of the Delaware General Corporation Law, or DGCL. These provisions may prohibit or restrict large stockholders, in particular those owning 15% or more of our outstanding voting stock, from merging or combining with us. These provisions in our amended and restated certificate of incorporation and bylaws and under Delaware law could discourage potential takeover attempts and could reduce the price that investors might be willing to pay for shares of our common stock in the future and result in our market price being lower than it would without these provisions.
We have broad discretion in the use of the net proceeds from this offering and may not use them effectively.
We intend to use the net proceeds from this offering to exercise the option we hold to acquire the Seneca facility for approximately $12.0 million. The remaining net proceeds will be used for working capital, capital expenditures related to improvements of production processes and logistics, and investments. In addition, the first $15.0 million of the net proceeds from the exercise of the over-allotment option, if any, will be used for certain payments to the former holders of the Series A preferred stock. For a further description of our intended use of the net proceeds to us from this offering, see the “Use of proceeds” section of this prospectus.
Because of the number and variability of factors that will determine our use of the net proceeds from this offering, our ultimate use of these proceeds may vary substantially from their currently intended use. Our management will have considerable discretion over the use of the net proceeds to us from this offering. Stockholders may not agree with such uses and the net proceeds may be used in a manner that does not increase our operating results or market value.
Our failure to apply these funds effectively could have a material adverse effect on our business, delay the development of our products and cause the price of our common stock to decline.
If securities or industry analysts issue an adverse or misleading opinion regarding our stock or do not publish research or reports about our business, our stock price and trading volume could decline.
The trading market for our Common Stock will rely in part on the research and reports that equity research analysts publish about us and our business. It may be difficult for companies such as ours to attract independent equity research analysts to cover our Common Stock. We do not control these analysts or the content and opinions included in their reports. The price of our Common Stock could decline if one or more equity research analysts downgrade our Common Stock or if those analysts issue other unfavorable commentary or cease publishing reports about us or our business. If one or more equity research analysts ceases coverage of our company, we could lose visibility in the market, which in turn could cause our stock price to decline. Further, securities analysts may elect not to provide research coverage of our Common Stock after the completion of this offering, and such lack of research coverage may adversely affect the market price of our Common Stock.
29
Table of Contents
Information regarding forward-looking statements
This prospectus includes forward-looking statements. All statements other than statements of historical facts contained in this prospectus, including statements regarding our future results of operations and financial position, strategy and plans, and our expectations for future operations, are forward-looking statements. The words “believe,” “may,” “estimate,” “continue,” “anticipate,” “design,” “intend,” “expect” and similar expressions are intended to identify forward-looking statements. We have based these forward-looking statements largely on our current expectations and projections about future events and trends that we believe may affect our financial condition, results of operations, strategy, short-term and long-term business operations and objectives, and financial needs. These forward-looking statements are subject to a number of risks, uncertainties and assumptions, including those described in “Risk factors.” In light of these risks, uncertainties and assumptions, the forward-looking events and circumstances discussed in this prospectus may not occur, and actual results could differ materially and adversely from those anticipated or implied in the forward-looking statements. Forward-looking statements include, but are not limited to, statements about:
| Ø | the effect of governmental programs on our business; |
| Ø | government policymaking and mandates relating to renewable fuels; |
| Ø | the future price and volatility of feedstocks; |
| Ø | the future price and volatility of petroleum and products derived from petroleum; |
| Ø | expected future financial performance; |
| Ø | our liquidity and working capital requirements; |
| Ø | availability of federal and state governmental tax credits and incentives; |
| Ø | anticipated trends and challenges in our business and competition in the markets in which we operate; |
| Ø | our ability to estimate our feedstock demands and biodiesel sales; |
| Ø | our dependence on sales to a limited number of customers and distributors; |
| Ø | technological obsolescence; |
| Ø | our expectations regarding future expenses; |
| Ø | our ability to successfully implement our acquisition strategy; |
| Ø | government regulatory and industry certification, approval and acceptance of our product; |
| Ø | our ability to protect our proprietary technology and trade secrets; |
| Ø | market acceptance of biodiesel; and |
| Ø | our expectations regarding the use of proceeds from this offering. |
Although we believe that the expectations reflected in the forward-looking statements are reasonable, we cannot guarantee future results, level of activity, performance or achievements. In addition, neither we nor any other person assumes responsibility for the accuracy and completeness of any of these forward-looking statements. We disclaim any duty to update any of these forward-looking statements after the date of this prospectus to confirm these statements to actual results or revised expectations.
You may rely only on the information contained in this prospectus. Neither we nor any of the underwriters have authorized anyone to provide information different from that contained in this prospectus. Neither the delivery of this prospectus, nor sale of Common Stock, means that information contained in this prospectus is correct after the date of this prospectus. This prospectus is not an offer to sell or solicitation of an offer to buy shares of Common Stock in any circumstances under which the offer or solicitation is unlawful.
30
Table of Contents
We expect that the net proceeds we will receive from the sale of the shares of Common Stock offered by us will be approximately $ million (or approximately $ million if the underwriters exercise their over-allotment option in full), based on an assumed initial public offering price of $ per share (the midpoint of the range reflected on the cover page of this prospectus), after deducting the estimated underwriting discounts and commissions and estimated offering expenses payable by us. A $1.00 increase (decrease) in the assumed initial public offering price of $ per share would increase (decrease) the net proceeds to us from this offering by approximately $ million, assuming the number of shares offered by us, as set forth on the cover page of this prospectus, remains the same. A 100,000 share increase (decrease) in the number of shares of Common Stock offered by us in this offering would increase (decrease) the net proceeds to us by approximately $ million. If the underwriters’ over-allotment option to purchase additional shares from us is exercised in full, we estimate that we will receive additional net proceeds of $ million. We will not receive any of the proceeds from the sale of Common Stock by the selling stockholders, although we will bear the costs, other than the underwriting discounts and commissions, associated with the sale of these shares. The selling stockholders include entities affiliated with or controlled by certain of our directors.
We intend to use approximately $12.0 million of the net proceeds we receive from this offering to exercise the option we hold to acquire the Seneca facility, which we currently lease. The Seneca facility is beneficially owned by three of our stockholders: Bunge, USRG, and West Central. The option purchase price was determined through negotiation between the current beneficial owners and us in a transaction whereby we acquired the facility from a third party in 2010 and immediately sold the facility to its current owners in a sale/leaseback transaction. We also have certain other arrangements and agreements in place with these parties. See “Certain relationships and related party transactions” beginning on page 115 of this prospectus.
The remainder of the net proceeds is expected to be used for working capital, capital expenditures related to improvements of production processes and logistics, and investments, including potential acquisitions, joint ventures and other collaborative arrangements, in new biofuel businesses, production technologies or other assets and in opportunities to extend our biorefinery platform to the production of renewable chemicals and feedstocks. We have no agreements with respect to any material investments at this time.
If the underwriters’ over-allotment option is exercised, we are obligated to use the first $15.0 million of net proceeds, or such lesser amount if the net proceeds are less than $15.0 million, to make a one-time special payment to the former holders of our Series A preferred stock. To the extent that the underwriters’ over-allotment option is not exercised, or the net proceeds from the exercise of the over-allotment option are less than $15.0 million, upon expiration of the 30-day option period, we are obligated to issue up to 400,000 additional shares of Series B preferred stock to the former holders of Series A preferred stock, such that the maximum number of shares of Series B preferred stock that we may issue is 3,000,000. The number of shares of Series B preferred stock to be issued to such former holders of Series A preferred stock will be reduced proportionately for any exercise of the over-allotment option resulting in net proceeds in excess of $5.0 million and less than $15.0 million. If the net proceeds from the exercise of the over-allotment option exceed $15.0 million, we intend to use such excess net proceeds as described in the preceding paragraphs.
As of the date of this prospectus, however, except as set forth above, we cannot predict with certainty all of the particular uses for the proceeds of this offering or the amounts that we will actually spend on the uses set forth above. Our management will have significant flexibility in applying the net proceeds of this offering. Pending use of the net proceeds as described above, we intend to invest the net proceeds of this offering in short-term, interest-bearing, investment-grade securities.
31
Table of Contents
Upon the completion of the offering, holders of the Series B preferred stock are entitled to receive, on each share, out of assets legally available, cumulative dividends semi-annually at an annual rate of 4.50% of the stated value, which is $25 per share. For so long as at least 300,000 shares of Series B preferred stock remain outstanding, without the approval of the holders of at least 75% of the then-outstanding shares of Series B preferred stock, we may not declare, pay or set apart funds for the payment of any dividend or other distribution with respect to any junior stock or parity stock, including the Common Stock, and we will not, subject to certain exceptions, redeem, purchase or otherwise acquire for consideration junior stock or parity stock, including the Common Stock.
We have never declared or paid any cash dividends on the Common Stock. We expect to retain all of our earnings to finance the expansion and development of our business and we do not currently intend to pay any cash dividends on the Common Stock in the foreseeable future. Any future determinations to declare dividends will be at the discretion of our Board of Directors, subject to the restrictions imposed by our Series B preferred stock, and will depend on our financial condition, results of operations, capital requirements, general business requirements, contractual restrictions and other factors our Board of Directors deems relevant. Certain of our subsidiaries have entered into credit agreements that limit their ability to pay dividends. See “Management’s discussion and analysis of financial condition and results of operations—Liquidity and Capital Resources” beginning on page 68 for a discussion of these limitations. Future agreements that we may enter into, including with respect to any future debt we may incur, may also further limit or restrict our ability to pay dividends.
32
Table of Contents
The following table describes our cash and cash equivalents, short-term debt and capitalization as of June 30, 2011:
| Ø | on an actual basis; |
| Ø | on a pro forma basis, giving effect to (i) the filing of our second amended and restated certificate of incorporation, (ii) the reclassification of our existing common stock into an aggregate of shares of Class A Common Stock and the automatic conversion of all outstanding shares of Series A preferred stock into shares of Class A Common Stock and 3,000,000 shares of Series B preferred stock in the recapitalization transactions in connection with this offering, (iii) the issuance of shares of Class A common stock to USRG Holdco IX, LLC immediately prior to the completion of this offering in connection with the termination of the Glycerin Option Agreement dated as of April 8, 2010, between us and USRG Holdco IX, LLC and (iv) the issuance of shares of Class A Common Stock in exchange for existing warrants to purchase shares of Class A Common Stock immediately prior to the completion of this offering; and |
| Ø | on a pro forma as adjusted basis, giving effect to the issuance and sale by us and the sale by the selling stockholders of shares of Common Stock in this offering at an assumed initial public offering price of $ per share, the midpoint of the price range set forth on the cover page of this prospectus, after deducting the estimated underwriting discounts and commissions and estimated offering expenses payable by us. |
33
Table of Contents
| As of June 30, 2011 | ||||||||||||
| Actual | Pro forma | Pro forma as adjusted |
||||||||||
| (In thousands, except share and per share data) | ||||||||||||
| Cash and cash equivalents |
$ | 9,125 | $ | $ | ||||||||
|
|
|
|
|
|
|
|||||||
| Revolving credit facility |
$ | 10,550 | $ | 10,550 | $ | 10,550 | ||||||
| Other long term debt |
89,367 | 89,367 | 89,367 | |||||||||
|
|
|
|
|
|
|
|||||||
| Total debt(1) |
99,917 | 99,917 | 99,917 | |||||||||
|
|
|
|
|
|
|
|||||||
| Series A Preferred Stock, $0.0001 par value, 14,000,000 shares authorized, 13,455,522 shares issued and outstanding, actual; 14,000,000 shares authorized, no shares issued and outstanding, pro forma and pro forma as adjusted |
134,512 | — | — | |||||||||
| Series B Preferred Stock, $0.0001 par value, no shares authorized, no shares issued and outstanding, actual; 3,000,000 shares authorized, 3,000,000 shares issued and outstanding, pro forma and pro forma, as adjusted |
— | |||||||||||
| Stockholders’ equity: |
||||||||||||
| Existing common stock, $0.0001 par value; 140,000,000 shares authorized, 33,129,553 shares issued and outstanding, actual; no shares authorized, issued or outstanding pro forma and pro forma as adjusted. |
3 | — | — | |||||||||
| Common Stock, $0.0001 par value; no shares authorized, no shares issued and outstanding, actual; 300,000,000 shares authorized, no shares issued and outstanding, pro forma; 300,000,000 shares authorized, shares issued and outstanding, pro forma as adjusted |
— | |||||||||||
| Class A Common Stock, $0.0001 par value; no shares authorized, no shares issued and outstanding, actual; 140,000,000 shares authorized, shares issued or outstanding, pro forma; 140,000,000 shares authorized, shares issued and outstanding, pro forma as adjusted |
— | |||||||||||
| Additional paid-in capital |
73,708 | |||||||||||
| Warrants - additional paid-in-capital |
3,698 | |||||||||||
| Accumulated deficit |
(49,554 | ) | ||||||||||
|
|
|
|
|
|
|
|||||||
| Total stockholders’ equity |
27,855 | |||||||||||
|
|
|
|
|
|
|
|||||||
| Total capitalization |
$ | 262,284 | $ | $ | ||||||||
|
|
|
|
|
|
|
|||||||
| (1) | In August 2011, REG Albert Lea entered into a $10.0 million note for working capital, which we have guaranteed. |
34
Table of Contents
Capitalization
A $1.00 increase (decrease) in the assumed initial public offering price of $ per share, the midpoint of the price range set forth on the cover page of this prospectus, would increase (decrease) total stockholders’ equity and total capitalization by $ million, assuming that the number of shares offered by us, as set forth on the cover page of this prospectus, remains the same and after deducting estimated underwriting discounts and commissions and estimated offering expenses. A one million share increase (decrease) in the number of shares of Common Stock sold by us in this offering would increase (decrease) total stockholders’ equity and total capitalization by approximately $ million, assuming an initial public offering price of $ per share, the midpoint of the price range set forth on the cover page of this prospectus, and after deducting estimated underwriting discounts and commissions and estimated offering expenses.
The pro forma information set forth in the above table is based on no shares of our Common Stock and shares of our Class A Common Stock outstanding (after giving pro forma effect to the reclassification of our existing common stock into an equivalent number of shares of Class A Common Stock) as of June 30, 2011; and
| Ø | Excludes up to shares of Common Stock issuable upon conversion of the Series B preferred stock issuable pursuant to the recapitalization; |
| Ø | Excludes shares of Class A Common Stock issuable upon the exercise of warrants to purchase Class A Common Stock that will remain outstanding following this offering; |
| Ø | Excludes shares of Class A Common Stock issuable upon the exercise of outstanding restricted stock units; |
| Ø | Excludes shares of Class A Common Stock issuable upon the exercise of outstanding options, at a weighted average exercise price of $ per share; |
| Ø | Excludes shares of Class A Common Stock reserved for future issuance under our 2009 Stock Incentive Plan; and |
| Ø | Assumes no exercise of the underwriters’ over-allotment option; if the over-allotment option is exercised, up to 400,000 fewer shares of Series B preferred stock may be issued; the maximum number of shares of Series B preferred stock that will be outstanding immediately after the expiration of the 30-day option period will be 3,000,000 shares and the minimum number will be 2,600,000 shares. |
35
Table of Contents
Our net tangible book value as of June 30, 2011 was approximately $ million, or $ per share of common stock. Net tangible book value per share represents the amount of our total tangible assets less total liabilities, divided by the number of shares of common stock outstanding as of June 30, 2011. Dilution in net tangible book value per share to new investors represents the difference between the amount per share paid by purchasers of shares of Common Stock in this offering and the net tangible book value per share of common stock immediately after completion of this offering.
After giving effect to the sale of the shares of Common Stock by us in this offering at an assumed public offering price of $ per share, the midpoint of the range on the cover page of this prospectus, and after deducting underwriting discounts and commissions and estimated offering expenses payable by us, our net tangible book value as of June 30, 2011 would have been approximately $ million, or $ per share of common stock. This represents an immediate increase in net tangible book value of $ per share of common stock to existing stockholders and an immediate dilution in net tangible book value of $ per share to new investors purchasing shares of Common Stock in this offering.
The following table illustrates this per share dilution:
| Assumed public offering price per share of Common Stock |
$ | $ | ||
| Net tangible book value per common share as of June 30, 2011 |
||||
| Increase in net tangible book value per share attributable to existing stockholders |
||||
|
|
||||
| Net tangible book value per share as adjusted after this offering |
||||
|
| ||||
| Dilution per share to new investors |
$ | |||
|
|
A $1.00 increase (decrease) in the assumed public offering price per share would increase (decrease) our net tangible book value as of June 30, 2011 by approximately $ million, or $ per share, resulting in additional dilution of $ per share to the new investors purchasing shares of Common Stock in this offering.
Separately, a one million share increase (decrease) in the number of shares of Common Stock sold would increase (decrease) our net tangible book value as of June 30, 2011 by approximately $ million, or $ per share, resulting in a decrease (increase) in dilution of $ per share to the new investors purchasing shares of Common Stock in this offering.
If the underwriters’ over-allotment option to purchase additional shares from us is exercised in full, the pro forma as adjusted net tangible book value per share after this offering would be $ per share, the increase in pro forma as adjusted net tangible book value per share to existing stockholders would be $ per share and the dilution to new investors purchasing shares in this offering would be $ per share.
As of June 30, 2011, assuming the exercise and payment of all outstanding options and warrants, excluding warrants that are terminated in connection with the recapitalization, and after giving effect to this offering, net tangible book value would have been approximately $ million, representing dilution of $ per share to new investors.
36
Table of Contents
Dilution
As of June 30, 2011, assuming a $1.00 increase in the assumed public offering price per share, our net tangible book value would have increased by $ million, representing additional dilution of $ per share to new investors. As of June 30, 2011, assuming a 10% increase in the number of shares of Common Stock sold and an assumed public offering price of $ per share, our net tangible book value would have increased by approximately $ million, representing a decrease in dilution of $ per share to new investors.
| Shares Purchased | Total Consideration | |||||||||||||||||
| Number | Percent | Amount | Percent | Average Price Per Share |
||||||||||||||
| Existing stockholders |
% | $ | % | $ | ||||||||||||||
| New investors |
||||||||||||||||||
|
|
|
|
|
|
|
|
||||||||||||
| Total |
100.0 | % | $ | 100.0 | % | |||||||||||||
|
|
|
|
|
|
|
|
||||||||||||
If the underwriters’ over-allotment option is exercised in full, the number of shares of common stock held by existing stockholders will be reduced to % of the total number of shares of common stock to be outstanding after this offering; and the number of shares of Common Stock held by the new investors will be increased to shares or % of the total number of shares of common stock outstanding after this offering.
A 10% increase in the number of shares sold of Common Stock would decrease the number of shares of common stock held by existing stockholders as a percentage of the total number of shares of common stock outstanding after this offering by %; the number of shares of Common Stock held by new investors would increase by shares, or % of the total number of shares of common stock outstanding after this offering.
Sales by the selling stockholders in this offering will reduce the number of shares held by existing stockholders to or approximately % of the total shares of our common stock outstanding after this offering, or shares and approximately % of the total shares of our common stock outstanding after this offering if the over-allotment option is exercised in full. The number of shares to be purchased by new investors will be increased to or approximately % of the total shares of our common stock outstanding after this offering, or shares and approximately of the total shares of common stock outstanding after this offering, if the over-allotment option is exercised in full.
37
Table of Contents
Selected consolidated financial data
The following table sets forth selected historical consolidated financial data that should be read in conjunction with “Management’s discussion and analysis of financial condition and results of operations” and our consolidated financial statements and notes thereto. The selected historical consolidated financial data in this section is not intended to replace our historical consolidated financial statements and the related notes thereto. Our historical results are not necessarily indicative of future results, and our operating results for the six months ended June 30, 2011 are not necessarily indicative of the results that may be expected for the year ended December 31, 2011.
The selected consolidated balance sheet data as of December 31, 2010 and 2009, and the selected consolidated statements of operations data for each year ended December 31, 2010, 2009 and 2008, have been derived from our audited consolidated financial statements which are included in this prospectus. The selected consolidated balance sheet data as of December 31, 2008, 2007 and 2006, and the selected consolidated statements of operations data for the years ended December 31, 2007 and 2006 have been derived from our audited consolidated financial statements not included in this prospectus.
The consolidated statements of operations data for the six month periods ended June 30, 2011 and 2010 and the balance sheet data as of June 30, 2011 have been derived from our unaudited condensed consolidated financial statements that are included elsewhere in this prospectus and have been prepared on the same basis as our audited consolidated financial statements and include all adjustments (consisting of normal recurring adjustments) that we considered necessary for a fair presentation of the results for or as of the periods presented. The balance sheet data as of June 30, 2010 has been derived from our unaudited condensed consolidated financial statements, which are not included in this prospectus.
| Year ended December 31, | Six months ended June 30, |
|||||||||||||||||||||||||||
| Consolidated statement of operations data: | 2010(1) | 2009 | 2008(2) | 2007 | 2006 | 2011 | 2010 | |||||||||||||||||||||
| (In thousands, except share and per share amounts) | ||||||||||||||||||||||||||||
| Revenues: |
||||||||||||||||||||||||||||
| Biodiesel sales |
$ | 207,902 | $ | 109,027 | $ | 69,509 | $ | 130,562 | $ | 93,649 | $ | 284,421 | $ | 79,144 | ||||||||||||||
| Biodiesel government incentives |
7,240 | 19,465 | 6,564 | 9,970 | 8,915 | 16,266 | 3,674 | |||||||||||||||||||||
|
|
|
|
|
|
|
|
|
|
|
|
|
|
|
|||||||||||||||
| Total biodiesel |
215,142 | 128,492 | 76,073 | 140,532 | 102,564 | 300,687 | 82,818 | |||||||||||||||||||||
| Services |
1,313 | 3,009 | 9,379 | 94,018 | 75,465 | 60 | 1,008 | |||||||||||||||||||||
|
|
|
|
|
|
|
|
|
|
|
|
|
|
|
|||||||||||||||
| Total revenues |
216,455 | 131,501 | 85,452 | 234,550 | 178,029 | 300,747 | 83,826 | |||||||||||||||||||||
|
|
|
|
|
|
|
|
|
|
|
|
|
|
|
|||||||||||||||
| Costs of goods sold: |
||||||||||||||||||||||||||||
| Biodiesel |
194,016 | 127,373 | 78,736 | 141,748 | 92,423 | 262,084 | 75,949 | |||||||||||||||||||||
| Services |
807 | 1,177 | 4,470 | 71,258 | 70,751 | 42 | 533 | |||||||||||||||||||||
|
|
|
|
|
|
|
|
|
|
|
|
|
|
|
|||||||||||||||
| Total costs of goods sold |
194,823 | 128,550 | 83,206 | 213,006 | 163,174 | 262,126 | 76,482 | |||||||||||||||||||||
|
|
|
|
|
|
|
|
|
|
|
|
|
|
|
|||||||||||||||
| Gross profit |
21,632 | 2,951 | 2,246 | 21,544 | 14,855 | 38,621 | 7,344 | |||||||||||||||||||||
| Total operating expenses |
29,681 | 24,144 | 24,208 | 29,453 | 11,688 | 14,090 | 10,958 | |||||||||||||||||||||
|
|
|
|
|
|
|
|
|
|
|
|
|
|
|
|||||||||||||||
| Income (loss) from operations |
(8,049 | ) | (21,193 | ) | (21,962 | ) | (7,909 | ) | 3,167 | 24,531 | (3,614 | ) | ||||||||||||||||
| Total other income (expense), net |
(16,102 | ) | (1,364 | ) | (2,318 | ) | 36,623 | (377 | ) | (21,596 | ) | 2,956 | ||||||||||||||||
|
|
|
|
|
|
|
|
|
|
|
|
|
|
|
|||||||||||||||
| Income (loss) before income tax benefit (expense) and income (loss) from equity investments |
(24,151 | ) | (22,557 | ) | (24,280 | ) | 28,714 | 2,790 | 2,935 | (658 | ) | |||||||||||||||||
| Income tax benefit (expense) |
3,252 | (45,212 | ) | 9,414 | 3,198 | 745 | — | 3,728 | ||||||||||||||||||||
| Income (loss) from equity investments |
(689 | ) | (1,089 | ) | (1,013 | ) | 113 | 493 | (148 | ) | (381 | ) | ||||||||||||||||
|
|
|
|
|
|
|
|
|
|
|
|
|
|
|
|||||||||||||||
| Net income (loss) |
(21,588 | ) | (68,858 | ) | (15,879 | ) | 32,025 | 4,028 | 2,787 | 2,689 | ||||||||||||||||||
| Less: Net (income) loss attributable to noncontrolling interests |
— | 7,953 | 2,788 | (141 | ) | — | — | — | ||||||||||||||||||||
|
|
|
|
|
|
|
|
|
|
|
|
|
|
|
|||||||||||||||
| Net income (loss) attributable to the company |
(21,588 | ) | (60,905 | ) | (13,091 | ) | 31,884 | 4,028 | 2,787 | 2,689 | ||||||||||||||||||
| Effects of recapitalization |
8,521 | — | — | — | — | — | 8,521 | |||||||||||||||||||||
38
Table of Contents
Selected consolidated financial data
| Year ended December 31, | Six months ended June 30, |
|||||||||||||||||||||||||||
| Consolidated statement of operations data: |
2010(1) | 2009 | 2008(2) | 2007 | 2006 | 2011 | 2010 | |||||||||||||||||||||
| (in thousands, except share and per share amounts) | ||||||||||||||||||||||||||||
| Less: accretion of preferred stock to redemption value |
(27,239 | ) | (44,181 | ) | (26,692 | ) | (4,434 | ) | — | $ | (12,076 | ) | $ | (16,246 | ) | |||||||||||||
| Less: undistributed dividends allocated to preferred stockholders |
(10,027 | ) | (14,036 | ) | (11,145 | ) | (7,112 | ) | (1,095 | ) | (6,246 | ) | (4,073 | ) | ||||||||||||||
|
|
|
|
|
|
|
|
|
|
|
|
|
|
|
|||||||||||||||
| Net income (loss) attributable to the company’s common stockholders |
$ | (50,333 | ) | $ | (119,122 | ) | $ | (50,928 | ) | 20,338 | 2,933 | $(15,535 | ) | $ | (9,109 | ) | ||||||||||||
|
|
|
|
|
|
|
|
|
|
|
|
|
|
|
|||||||||||||||
| Net income (loss) per share attributable to common stockholders: |
||||||||||||||||||||||||||||
| Basic |
$ | (1.71 | ) | $ | (6.14 | ) | $ | (3.07 | ) | $ | 1.01 | $ | 0.26 | $ | (0.47 | ) | $ | (0.34 | ) | |||||||||
|
|
|
|
|
|
|
|
|
|
|
|
|
|
|
|||||||||||||||
| Diluted(3) |
$ | (1.71 | ) | $ | (6.14 | ) | $ | (3.07 | ) | $ | (0.16 | ) | $ | 0.26 | $ | (0.47 | ) | $ | (0.34 | ) | ||||||||
|
|
|
|
|
|
|
|
|
|
|
|
|
|
|
|||||||||||||||
| Weighted-average shares used to compute net income (loss) per share attributable to common stockholders: |
||||||||||||||||||||||||||||
| Basic |
29,427,120 | 19,407,227 | 16,593,555 | 12,996,493 | 9,958,359 | 33,171,531 | 26,686,936 | |||||||||||||||||||||
|
|
|
|
|
|
|
|
|
|
|
|
|
|
|
|||||||||||||||
| Diluted(3) |
29,427,120 | 19,407,227 | 16,593,555 | 20,236,723 | 9,958,359 | 33,171,531 | 26,686,936 | |||||||||||||||||||||
|
|
|
|
|
|
|
|
|
|
|
|
|
|
|
|||||||||||||||
| Pro forma net loss per share attributable to common stockholders(4): |
||||||||||||||||||||||||||||
| Basic |
$ | $ | ||||||||||||||||||||||||||
|
|
|
|
|
|||||||||||||||||||||||||
| Diluted |
$ | $ | ||||||||||||||||||||||||||
|
|
|
|
|
|||||||||||||||||||||||||
| Pro forma weighted-average shares used to compute net loss per share attributable to common stockholders(4): |
||||||||||||||||||||||||||||
| Basic |
||||||||||||||||||||||||||||
|
|
|
|
|
|||||||||||||||||||||||||
| Diluted |
||||||||||||||||||||||||||||
|
|
|
|
|
|||||||||||||||||||||||||
| As of December 31, | As of June 30, | |||||||||||||||||||||||||||
| Consolidated Balance Sheet Data: | 2010(1) | 2009 | 2008(2) | 2007 | 2006 | 2011 |
2010 |
|||||||||||||||||||||
| (In thousands) | ||||||||||||||||||||||||||||
| Cash and cash equivalents |
4,259 | 5,855 | 15,311 | 18,965 | 53,698 | 9,125 | 5,285 | |||||||||||||||||||||
| Working capital (deficit) |
(3,581 | )(5) | 10,786 | 25,984 | 36,157 | 69,930 | 19,459 | 4,633 | ||||||||||||||||||||
| Total assets |
369,643 | 200,558 | 251,984 | 169,706 | 143,606 | 403,949 | 348,351 | |||||||||||||||||||||
| Total liabilities |
212,091 | 78,567 | 65,359 | 32,283 | 68,767 | 241,582 | 181,112 | |||||||||||||||||||||
| Total long-term obligations |
61,024 | 25,749 | 25,161 | 2,843 | 3,020 | 64,107 | 84,997 | |||||||||||||||||||||
| Redeemable preferred stock |
122,436 | 149,122 | 104,607 | 43,707 | 20,934 | 134,512 | 111,443 | |||||||||||||||||||||
| Total stockholders’ equity (deficit) |
35,116 | (27,131 | ) | 82,018 | 93,716 | 53,905 | 27,855 | 55,796 | ||||||||||||||||||||
| (1) | Reflects the deconsolidation of Blackhawk as of January 1, 2010, the acquisition of Blackhawk as of February 26, 2010, the acquisition of CIE as of March 8, 2010, the consolidation of Landlord as of April 8, 2010, the acquisition of Tellurian and ABDF as of July 16, 2010 and the acquisition of Clovis Biodiesel, LLC as of September 21, 2010. |
| (2) | Reflects the consolidation of Blackhawk as of May 9, 2008 and the acquisition of USBG as of June 26, 2008. |
| (3) | Certain potentially dilutive securities were excluded from the calculation of diluted net income (loss) per share attributable to common stockholders during the periods presented as the effect was anti-dilutive, except for 2007, which reflects the inclusion of preferred shares but excludes warrants and options as the effect was anti-dilutive. |
| (4) | The pro forma per share amounts give effect to (i) the filing of our second amended and restated certificate of incorporation, (ii) the automatic conversion of all outstanding shares of Series A preferred stock and the reclassification of our existing common stock into an aggregate of shares of Class A Common Stock and 3,000,000 shares of Series B preferred stock in the recapitalization transactions in connection with this offering, (iii) the issuance of 500,000 shares of Class A Common Stock to USRG immediately prior to the completion of this offering in connection with the termination of the Glycerin Option Agreement dated as of April 8, 2010, between us and USRG and (iv) the issuance of shares of Class A Common Stock in exchange for existing warrants to purchase shares of Class A Common Stock, as if such actions had occurred on the first day of the applicable period. |
| (5) | Includes $23.2 million Danville term loan held by our wholly-owned subsidiary, REG Danville, which matures on November 3, 2011. Working capital is defined as current assets less current liabilities. |
39
Table of Contents
Management’s discussion and analysis of financial condition and results of operations
The following discussion and analysis of our financial condition and results of operations should be read in conjunction with our consolidated financial statements and related notes included elsewhere in this prospectus. This discussion contains forward-looking statements that involve risks and uncertainties. Our actual results could differ materially from those discussed below. Factors that could cause or contribute to such differences include, but are not limited to, those identified below and those discussed in the section entitled “Risk factors” included elsewhere in this prospectus.
OVERVIEW
We are the largest producer of biodiesel in the United States based on gallons produced. We have been a leader of the biodiesel industry since 1996. We have transitioned from being primarily an operator of a third party-owned network of facilities to now owning five operating biodiesel production facilities and leasing a sixth biodiesel facility. We own biodiesel production facilities with nameplate capacities consisting of: a 12 mmgy facility in Ralston, Iowa, a 35 mmgy facility near Houston, Texas, or the Houston facility, a 45 mmgy facility in Danville, Illinois and a 30 mmgy facility in Newton, Iowa. As part of our acquisition strategy, in April 2010, we signed a seven year lease for a 60 mmgy facility in Seneca, Illinois, and on July 12, 2011, we completed our acquisition of SoyMor Biodiesel, LLC’s, or SoyMor, 30 mmgy biodiesel production facility in Albert Lea, Minnesota, bringing our total nameplate production capacity to 212 mmgy. During 2010, we sold 68 million gallons of biodiesel, including five million gallons we purchased from third parties and resold, and including eight million gallons we manufactured for others. The 68 million gallons we sold in 2010 represented approximately 22% of the total biodiesel produced in the United States in 2010.
As noted above, on July 12, 2011, we acquired SoyMor’s production facility, now named REG Albert Lea, LLC. We built and operated this facility under a management and operation services agreement, or MOSA, until SoyMor idled the facility in February 2008. In August 2011, we recommenced operations of the facility using soybean oil feedstock. We intend to upgrade the facility to process a wide variety of lower cost feedstocks as project financing becomes available and market conditions warrant.
The recent implementation of the Renewable Fuel Standard, or RFS2, has led to a significant year-over-year increase in demand for biodiesel and a substantial increase in the sales price per gallon. Over the last three years, prior to the implementation of RFS2, challenging biodiesel industry conditions have had a significant effect on our results of operations. The United States biodiesel industry experienced a downturn beginning in 2008 as a result of a variety of factors, including the imposition of extensive anti-dumping tariffs and countervailing duties on exports of United States biodiesel to the European Union, or EU, the worldwide economic crisis, falling petroleum-based diesel fuel prices, an uncertain regulatory environment and high soybean oil prices. As a result of these factors, the average price for B100 Upper Midwest Biodiesel as reported by The Jacobsen fell from $4.47 per gallon in 2008 to $3.07 per gallon in 2009.
In response to these industry dynamics, we reduced expenses in our biodiesel business by shifting production to lower cost feedstocks such as inedible animal fat, used cooking oil and inedible corn oil. In addition, we periodically idled our plants when there was insufficient demand. Beginning in 2008, the services segment of our business became significantly less active as construction of new biodiesel production facilities largely stopped and the third party-owned facilities managed by us also saw decreased volume from poor industry conditions. However, in anticipation of increased demand for
40
Table of Contents
Management’s discussion and analysis of financial condition and results of operations
biodiesel as a result of RFS2, we elected to use our available resources and our market position to acquire two plants with lower cost feedstock processing capabilities which we managed prior to such acquisitions. We also leased and obtained an option to buy the Seneca facility, a third lower cost feedstock facility, and focused on developing sufficient and reliable supplies of lower cost feedstocks.
During the second half of 2010, we and the biodiesel industry began to benefit from RFS2, which became effective July 1, 2010 and requires Obligated Parties to use specified amounts of biomass-based diesel, as discussed further below. In addition, the $1.00 per gallon federal blenders’ tax credit, which had expired as of December 31, 2009, was reinstated in December 2010 retroactively for all of 2010 and prospectively for 2011. As a result of these regulatory changes, as well as improving general economic conditions and relatively high petroleum prices, the price of and demand for biodiesel have increased significantly. In the first six months of 2010, prior to the effectiveness of RFS2 and the reinstatement of the blenders’ tax credit, our average price for B100 was $3.14 per gallon. In the first six months of 2011, our average price per gallon of B100 was $4.88, or 55% higher than the average price during the first six months of 2010, and we sold approximately 58 million gallons of biodiesel, including approximately four million gallons we purchased from third parties and resold, compared to approximately 68 million gallons sold in all of 2010.
We have completed eight acquisitions since the beginning of 2010, which include the acquisition of five biodiesel plants, and we intend to continue to seek opportunities to acquire biodiesel production facilities located in the United States and in international markets. We own three partially completed biodiesel production facilities. In 2007, we began construction of two 60 mmgy nameplate production capacity facilities, one near New Orleans, Louisiana and the other in Emporia, Kansas. In February 2008, we halted construction of these facilities as a result of conditions in the biodiesel industry and our inability to obtain financing necessary to complete construction of the facilities. Construction of the New Orleans facility is approximately 45% complete and construction of the Emporia facility is approximately 20% complete. Further, during the third quarter of 2010, we acquired a 15 mmgy nameplate biodiesel production capacity facility in Clovis, New Mexico, which is approximately 50% complete. We plan to complete construction of these facilities as financing becomes available, subject to market conditions. We expect that the aggregate cost to complete construction and commence operations of these three facilities is in the range of approximately $130 to $140 million, excluding working capital.
We derive revenues from two reportable business segments: Biodiesel and Services
Biodiesel Segment
Our Biodiesel segment, as reported herein, includes:
| Ø | the operations of the following biodiesel production facilities: |
| Ø | a 12 mmgy nameplate biodiesel production facility located in Ralston, Iowa; |
| Ø | a 35 mmgy nameplate biodiesel production facility located near Houston, Texas, since its acquisition in June 2008; |
| Ø | a 45 mmgy nameplate biodiesel production facility located in Danville, Illinois, since its acquisition in February 2010; |
| Ø | a 30 mmgy nameplate biodiesel production facility located in Newton, Iowa, since its acquisition in March 2010; |
| Ø | a leased 60 mmgy nameplate biodiesel production facility located in Seneca, Illinois, which began production in August 2010, since commencement of the lease in April 2010; |
41
Table of Contents
Management’s discussion and analysis of financial condition and results of operations
| Ø | a 30 mmgy nameplate biodiesel production facility located in Albert Lea, Minnesota, since its acquisition in July 2011; |
| Ø | purchases and resale of biodiesel and raw material feedstocks produced by third parties; |
| Ø | our sales of biodiesel produced under toll manufacturing arrangements with third party facilities using our feedstocks; and |
| Ø | our production of biodiesel under toll manufacturing arrangements with third parties using their feedstocks at our facilities. |
We derive a small portion of our revenues from the sale of glycerin, free fatty acids and other co-products of the biodiesel production process. In 2009 and 2010, our revenues from the sale of co-products were less than five percent of our total Biodiesel segment revenues.
As discussed under the heading “Industry overview—Government Programs Favoring Biodiesel Production and Use—Renewable Identification Numbers,” when we produce a gallon of biodiesel, we generate 1.5 Renewable Identification Numbers, or RINs, per gallon. When we sell a gallon of biodiesel we generally attach the 1.5 RINs, but may attach anywhere between zero and 2.5 RINs. As a result, a portion of our selling price for a gallon of biodiesel is generally attributable to the value of the attached RINs. The value of RINs has become increasingly significant to the price of biodiesel, contributing approximately $0.7904, or 25%, of the average OPIS Chicago spot price of a gallon of biodiesel in July 2010 and $2.03, or 38%, of the average OPIS Chicago spot price of a gallon of biodiesel in July 2011.
Services Segment
Our Services segment includes:
| Ø | biodiesel facility management and operational services, whereby we provide day-to-day management and operational services to biodiesel production facilities as well as other clean-tech companies; and |
| Ø | construction management services, whereby we act as the construction manager and general contractor for the construction of biodiesel production facilities. |
Historically, we provided facility operations management services to owners of biodiesel production facilities. Pursuant to a MOSA with a facility owner, we provided a broad range of management and operations services, typically for a monthly fee based on gallons of biodiesel produced or marketed and a contingent payment based on the facility’s net income. We do not recognize revenues from the sale of biodiesel produced at managed facilities, which is sold for the account of the third party owner. In 2009, we provided notice of termination of our five remaining third party MOSAs because we determined the terms were not favorable to us. During 2010, we ceased providing services to three of these facilities, acquired one and continue to provide limited services to the other facility. We do not anticipate the termination of our MOSAs will have a significant impact on our financial statements.
In addition, historically we have provided construction management services to the biodiesel industry, including assistance with pre-construction planning, such as site selection and permitting, facility and process design and engineering, engagement of subcontractors to perform construction activity and supply biodiesel processing equipment and project management services. Because we do not have internal construction capabilities and do not manufacture biodiesel processing equipment, we rely on our prime subcontractors, Todd & Sargent, Inc. and its joint venture with the Weitz Company, TSW, LLC, to fulfill the bulk of our obligations to our customers. Payments to these prime subcontractors historically represented most of the costs of goods sold for our Services segment.
42
Table of Contents
Management’s discussion and analysis of financial condition and results of operations
Demand for our construction management and facility management and operational services depends on capital spending by potential customers and existing customers, which is directly affected by trends in the biodiesel industry. Due to the current economic climate, overcapacity in the biodiesel industry and reduced demand for biodiesel, we have not received any orders or provided services to outside parties for new facility construction services since 2009. We have, however, utilized our construction management expertise internally to upgrade two of our facilities during the last three years. We anticipate revenues derived from construction management services will be minimal in future periods.
Factors Influencing Our Results of Operations
Our results of operations are primarily affected by industry-wide factors affecting the profitability of biodiesel production. The principal factors affecting our segments are the market prices for biodiesel and the feedstocks used to produce biodiesel, as well as governmental programs designed to create incentives for the production and use of biodiesel.
Governmental programs favoring biodiesel production and use
Biodiesel has been more expensive to produce than petroleum-based diesel fuel and as a result the industry depends on federal and, to a lesser extent, state usage requirements and tax incentives.
On July 1, 2010, RFS2 was implemented, stipulating volume requirements for the amount of biomass-based diesel that must be utilized in the United States each year. Under RFS2, Obligated Parties, including petroleum refiners and fuel importers, must show compliance with these standards. Currently, biodiesel meets two categories of an Obligated Party’s annual renewable fuel volume requirement, or RVO, biomass-based diesel and advanced biofuel. According to the NBB, biodiesel is currently the only commercially significant RFS2-compliant biomass-based diesel fuel produced in the United States. Consistent with the RFS2 program, the EPA announced it would require the domestic use of 800 million gallons of biodiesel in 2011 and one billion gallons in 2012. The EPA recently proposed a requirement for domestic use of biodiesel by Obligated Parties of 1.28 billion gallons in 2013. Our sales volumes have increased during 2011 as a result of RFS2-generated demand.
The federal blenders’ tax credit provides a $1.00 refundable tax credit per gallon of 100% pure biodiesel, or B100, to the first blender of biodiesel with petroleum-based diesel fuel. The blenders’ tax credit expired on December 31, 2009, but was reinstated on December 17, 2010, retroactively for 2010 and prospectively for 2011. As a result of the uncertainty about the reinstatement of the blenders’ tax credit for most of 2010, we elected to sell mostly unblended biodiesel. Accordingly, we were not entitled to claim the blenders’ tax credit for these gallons on a retroactive basis. The absence of the blenders’ tax credit during most of 2010 also affected our ability to cost effectively sell biodiesel and as a consequence, we idled several of our plants for various periods of time. Most of our facilities operated at less than 50% utilization in 2010 due to decreased demand for biodiesel.
Biodiesel and feedstock price fluctuations
Our operating results generally reflect the relationship between the price of biodiesel and the price of feedstocks used to produce biodiesel.
Biodiesel is a low carbon, renewable alternative to petroleum-based diesel fuel and is primarily sold to the end user after it has been blended with petroleum-based diesel fuel. Biodiesel prices have historically been correlated to petroleum-based diesel fuel prices. Accordingly, biodiesel prices have generally been
43
Table of Contents
Management’s discussion and analysis of financial condition and results of operations
impacted by the same factors that affect petroleum prices, such as worldwide economic conditions, wars and other political events, OPEC production quotas, changes in refining capacity and natural disasters. Recently enacted government requirements and incentive programs, such as RFS2 and the blenders’ tax credit, have reduced this correlation, although it remains a significant factor in the market price of our product.
During late 2010 and in 2011, we have seen regulatory and legislative factors influencing the price of biodiesel, in addition to petroleum prices. RIN pricing, a value component that was introduced as a result of RFS2, has had a significant impact on our biodiesel pricing. During the first six months of 2011, RIN value represented almost a third of the price of each gallon of biodiesel that we sold.
During 2010, feedstock expense accounted for 76% of our costs of goods sold, while methanol and chemical catalysts expense accounted for 5% and 3% of our costs of goods sold, respectively. Methanol, a reactant in the production process, represents our second largest cost, the price of which is correlated to the cost of natural gas.
Feedstocks for biodiesel production, such as inedible animal fat, used cooking oil, inedible corn oil and soybean oil are commodities and market prices for them will be affected by a wide range of factors unrelated to the supply and demand for biodiesel and petroleum-based diesel fuels. The following table outlines some of the factors influencing supply for each feedstock:
| Feedstock | Factors Influencing Supply | |
| Inedible Animal Fat |
Export demand | |
| Number of slaughter kills in the United States | ||
| Demand for inedible animal fat from other markets | ||
| Used Cooking Oil |
Export demand | |
| Population | ||
| Number of restaurants in the vicinity of collection facilities and terminals which is dependent on population density | ||
| Eating habits, which can be impacted by the economy | ||
| Inedible Corn Oil |
Implementation of inedible corn oil separation systems into existing and new ethanol facilities | |
| Extraction system yield | ||
| Soybean Oil |
Export demand | |
| Weather conditions | ||
| Farmer planting decisions | ||
| Government policies and subsidies | ||
| Crop disease | ||
During 2010, 91% of our feedstocks were comprised of inedible animal fats, used cooking oil and inedible corn oil while in 2007 we used 100% refined vegetable oil. We have increased the use of these feedstocks because they are lower cost than refined vegetable oils.
Historically, most biodiesel in the United States has been made from soybean oil. Soybean oil prices have fluctuated greatly, but have generally remained at historically high levels since early 2007 due to higher overall commodity prices. Over the period January 2006 to June 2011, soybean oil prices (based on daily closing nearby futures prices on the CBOT for crude soybean oil) have ranged from $0.21 per pound, or $1.58 per gallon, in January 2006 to $0.70 per pound, or $5.28 per gallon of biodiesel, in March 2008, assuming 7.5 pounds of soybean oil yields one gallon of biodiesel. The average closing price for soybean
44
Table of Contents
Management’s discussion and analysis of financial condition and results of operations
oil during 2010 was $0.42 per pound, or $3.16 per gallon of biodiesel, in 2010, compared to $0.25 per pound, or $1.88 per gallon of biodiesel, in 2006, $0.36 per pound, or $2.72 per gallon of biodiesel, in 2007 and $0.51 per pound, or $3.85 per gallon of biodiesel, in 2008, assuming 7.5 pounds of soybean oil yields one gallon of biodiesel.
Over the period from January 2008 to July 2011, the price of choice white grease, an inedible animal fat (based on daily closing nearby futures prices as reported by The Jacobsen for Missouri River delivery of choice white grease), have ranged from $0.0950 per pound, or $0.76 per gallon of biodiesel, in December 2008 to $0.5250 per pound, or $4.20 per gallon of biodiesel, in June 2011, assuming 8.0 pounds of choice white grease yields one gallon of biodiesel. The average closing price for choice white grease during 2010 was $0.29 per pound, or $2.34 per gallon of biodiesel, compared to $0.33 per pound, or $2.64 per gallon of biodiesel, in 2008, assuming 8.0 pounds of choice white grease yields one gallon of biodiesel.
The graph below illustrates the spread between the cost of producing one gallon of biodiesel made from soybean oil to the cost of producing one gallon of biodiesel made from a lower cost feedstock. The results were derived using assumed conversion factors for the yield of each feedstock and subtracting the cost of producing one gallon of biodiesel made from each respective lower cost feedstock from the cost of producing one gallon of biodiesel made from soybean oil.
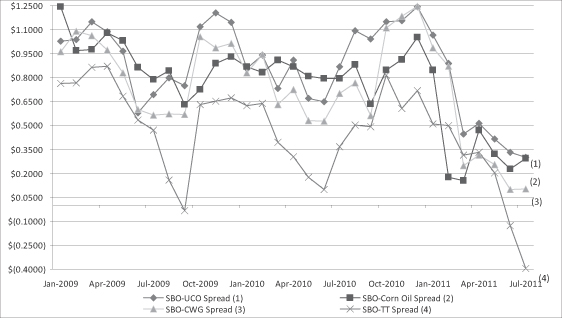
| * | Soybean oil (crude) prices are based on the monthly average of the daily closing sale price of the nearby soybean oil contract as reported by CBOT (Based on 7.5 pounds per gallon). |
| (1) | Used cooking oil prices are based on the monthly average of the daily low sales price of Missouri River yellow grease as reported by The Jacobsen (Based on 8.5 pounds per gallon). |
| (2) | Inedible corn oil prices are based on the monthly average of the daily market values delivered to Illinois as reported by The Jacobsen (Based on 8.2 pounds per gallon). |
| (3) | Choice white grease prices are based on the monthly average of the daily low prices of Missouri River choice white grease as reported by The Jacobsen (Based on 8.0 pounds per gallon). |
| (4) | Edible/tech tallow prices are based on the monthly average of the daily low sales prices of Missouri River edible/tech tallow as reported by The Jacobsen (Based on 7.6 pounds per gallon). |
45
Table of Contents
Management’s discussion and analysis of financial condition and results of operations
Our results of operations generally will benefit when the spread between biodiesel prices and feedstock prices widens and will be harmed when this spread narrows. The following graph shows feedstock cost data of choice white grease and soybean oil on a per gallon basis compared to the sale price data for biodiesel, and the spread between the two, from January 2008 to July 2011.
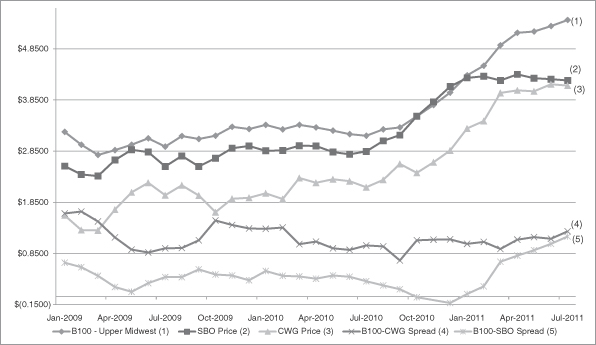
| (1) | Biodiesel prices are based on the monthly average of the midpoint of the high and low prices of B100 (Upper Midwest) as reported by The Jacobsen. |
| (2) | Soybean oil (crude) prices are based on the monthly average of the daily closing sale price of the nearby soybean oil contract as reported by CBOT (Based on 7.5 pounds per gallon). |
| (3) | Choice white grease prices are based on the monthly average of the daily low price of Missouri River choice white grease as reported by The Jacobsen (Based on 8.0 pounds per gallon). |
| (4) | Spread between biodiesel price and choice white grease price. |
| (5) | Spread between biodiesel price and soybean oil (crude) price. |
COMPONENTS OF REVENUES AND EXPENSES
We derive revenues in our Biodiesel segment from the following sources:
| Ø | sales of biodiesel produced at our wholly-owned facilities, including transportation, storage and insurance costs to the extent paid for by our customers; |
| Ø | fees from toll manufacturing arrangements; |
| Ø | revenues from our sale of biodiesel produced by third parties through toll manufacturing arrangements with us; |
| Ø | resale of finished biodiesel and raw material feedstocks acquired from others; |
| Ø | sales of glycerin, other co-products of the biodiesel production process and RINs; and |
46
Table of Contents
Management’s discussion and analysis of financial condition and results of operations
| Ø | incentive payments from federal and state governments, including the federal biodiesel blenders’ tax credit, which we receive directly when we sell our biodiesel blended with petroleum-based diesel, primarily as B99.9, a less than one percent petroleum-based diesel mix with biodiesel, rather than in pure form, or B100. |
We derive revenues in our Services segment from the following sources:
| Ø | fees received from operations management services that we provide for biodiesel production facilities, typically based on production rates and profitability of the managed facility; and |
| Ø | amounts received for services performed by us in our role as general contractor and construction manager for biodiesel production facilities. |
Cost of goods sold for our Biodiesel segment includes:
| Ø | with respect to our wholly-owned production facilities, expenses incurred for feedstocks, catalysts and other chemicals used in the production process, leases, utilities, depreciation, salaries and other indirect expenses related to the production process, and, when required by our customers, transportation, storage and insurance; |
| Ø | with respect to biodiesel acquired from third parties produced under toll manufacturing arrangements, expenses incurred for feedstocks, transportation, catalysts and other chemicals used in the production process and toll processing fees paid to the facility producing the biodiesel; |
| Ø | with respect to finished goods acquired from third parties, the purchase price of biodiesel on the spot market or under contract, and related expenses for transportation, storage, insurance, labor and other indirect expenses; and |
| Ø | changes during the applicable accounting period in the market value of derivative and hedging instruments, such as exchange traded contracts, related to feedstocks and commodity fuel products. |
Cost of goods sold for our Services segment includes:
| Ø | our facility management and operations activities, primarily salary expenses for the services of management employees for each facility and others who provide procurement, marketing and various administrative functions; and |
| Ø | our construction management services activities, primarily our payments to subcontractors constructing the production facility and providing the biodiesel processing equipment, and, to a much lesser extent, salaries and related expenses for our employees involved in the construction process. |
Selling, general and administrative expense consists of expenses generally involving corporate overhead functions and operations at our Ames, Iowa headquarters.
Other income (expense), net is primarily comprised of the changes in fair value of the embedded derivative related to the Series A preferred stock conversion feature, changes in fair value of interest rate swap, interest expense, interest income, the impairment of investments we made in biodiesel plants owned by third parties and the changes in valuation of the Seneca Holdco, LLC liability associated with the put and call options on the equity interest in Landlord.
ACCOUNTING FOR INVESTMENTS
We use the equity method of accounting to account for the operating results of entities over which we have significant influence. Significant influence may be reflected by factors such as our ownership percentage, our significant operational influence due to our management of biodiesel operations at a
47
Table of Contents
Management’s discussion and analysis of financial condition and results of operations
third party owned facility and participation by one of our employees on the facility’s board of directors. Prior to our acquisition and as of June 30, 2011, we accounted for our approximately 9% ownership interest in SoyMor under the equity method due to our ownership interest, MOSA and board seat. In the past we used this method to account for our interests in other entities where we had a significant management roll under a MOSA and had board participation. One of our wholly-owned subsidiaries acquired substantially all of the assets of SoyMor in July 2011; therefore, in future periods we will no longer account for our interest under the equity method, instead we will consolidate our interest in SoyMor like all of our other wholly-owned subsidiaries in our consolidated financial statements. Until January 1, 2011, we used the equity method of accounting to account for the operating results of Bell, LLC which owns our headquarters building. We own 50% of Bell, LLC and one of our employees is a member of the facility’s board of managers. Under the equity method, we recognized our proportionate share of the net income (loss) of each entity in the line item “Loss from equity investments.”
We use the cost method of accounting to account for our minority investment in three previously managed plants, East Fork Biodiesel, LLC, or EFB, Western Iowa Energy, LLC, or WIE, since May, 2010, and Western Dubuque Biodiesel, LLC, or WDB, since August 2010. Because we do not have the ability to influence the operating and financial decisions of EFB, WIE, or WDB, and do not maintain a position on the board of directors, the investment is accounted for using the cost method. Under the cost method, the initial investment is recorded at cost and assessed for impairment. There was $0.4 million impairment recorded during 2010, relating to the wind up and liquidation of EFB, which fully impaired the remaining investment. We have not recorded any impairment of our investments in WIE or WDB.
For additional information with regards to prior accounting treatment for now acquired investments including Blackhawk and CIE, please see “Note 5—Blackhawk,” “Note 6—Acquisitions and Equity Transactions” and “Note 7—Variable Interest Entities” to our audited consolidated financial statements.
In June 2009, the Financial Accounting Standards Board, or FASB, amended its guidance on accounting for variable interest entities, or VIEs. As of January 1, 2010, we evaluated each investment and determined we do not hold a controlling interest in any of our investments in third party owned plants that would empower us to direct the activities that most significantly impact economic performance. As a result, we are not the primary beneficiary and do not consolidate these VIE’s. See “Note 7—Variable Interest Entities” to our audited consolidated financial statements for more information.
On April 8, 2010, we determined that Landlord was a VIE and it was consolidated into our financial statements as we are the primary beneficiary. See “Note 6—Acquisitions and Equity Transactions” to our audited consolidated financial statements for a description of the transaction. We have a put/call option with Seneca Holdco, LLC to purchase Landlord and currently lease the plant for production of biodiesel, both of which represent a variable interest in Landlord that is significant to the VIE. Although we do not have an ownership interest in Seneca Holdco, LLC, it was determined that we are the primary beneficiary due to the related party nature of the entities involved, our ability to direct the activities that most significantly impact Landlord’s economic performance and the design of Landlord that ultimately gives us the majority of the benefit from the use of Landlord’s assets.
During 2007, we invested, through a wholly-owned subsidiary, in Bell, LLC, a VIE joint venture, whereby we own 50% of the outstanding units. Bell, LLC owns and leases to us its corporate office building located in Ames, Iowa, which we use as our corporate headquarters. We currently have the right to exercise a call option with the other joint venture member, Dayton Park, LLC, to purchase Bell, LLC; therefore, we have determined we are the primary beneficiary of Bell, LLC and have consolidated Bell, LLC into our financial statements in accordance with ASC Topic 810, Consolidation (ASC Topic 810). See “Note 7—Variable Interest Entities” to our audited consolidated financial statements for a description of the consolidation.
48
Table of Contents
Management’s discussion and analysis of financial condition and results of operations
RISK MANAGEMENT
The profitability of the biodiesel production business largely depends on the spread between prices for feedstocks and for biodiesel fuel. We actively monitor changes in prices of these commodities and attempt to manage a portion of the risks of these price fluctuations. However, the extent to which we engage in risk management activities varies substantially from time to time, and from feedstock to feedstock, depending on market conditions and other factors. Adverse price movements for these commodities directly affect our operating results. As a result of our recent acquisitions, our exposure to these risks has increased. In making risk management decisions, we receive input from others with risk management expertise and utilize research conducted by outside firms to provide additional market information.
We manage feedstock supply risks related to biodiesel production in a number of ways, including, where available, through long-term supply contracts. For example, most of the feedstock requirements for our Ralston facility were supplied under a three-year agreement with West Central that expired on July 8, 2010. However, we continue to purchase under, and expect to renegotiate terms similar to, the expired agreement. The purchase price for soybean oil under this agreement is indexed to prevailing Chicago Board of Trade, or CBOT, soybean oil market prices with a negotiated market basis. We utilize futures contracts and options to hedge, or lock in, the cost of portions of our future soybean oil requirements generally for varying periods up to one year.
Inedible animal fat is the primary feedstock that we used to produce biodiesel in 2010. We have increased our use of inedible animal fat as a result of the tolling arrangements, as explained in “Critical Accounting Policies—Revenue recognition,” with plants with animal fat processing capabilities and our acquisitions of the Danville and Newton facilities. We utilize several varieties of inedible animal fat, such as beef tallow, choice white grease derived from pork and poultry fat. We manage inedible animal fat supply risks related to biodiesel production through supply contracts with inedible animal fat suppliers/producers. There is no established futures market for inedible animal fat. The purchase price for inedible animal fat is generally set on a negotiated flat price basis or spread to a prevailing market price reported by the United States Department of Agriculture price sheet. Our limited efforts to hedge against changing inedible animal fat prices have involved entering into futures contracts or options on other commodity products, such as soybean oil or heating oil. However, these products do not always experience the same price movements as animal fats, making risk management for these feedstocks challenging.
Our ability to mitigate our risk of falling biodiesel prices is limited. We have entered into forward contracts to supply biodiesel. However, pricing under these forward sales contracts generally has been indexed to prevailing market prices, as fixed price contracts for long periods on acceptable terms have generally not been available. There is no established market for biodiesel futures in the United States. Our efforts to hedge against falling biodiesel prices, which have been relatively limited to date, generally involve entering into futures contracts and options on other commodity products, such as diesel fuel and heating oil. However, these products do not always experience the same price movements as biodiesel.
Changes in the value of these futures or options instruments are recognized in current income or loss.
See “Critical Accounting Policies.”
CRITICAL ACCOUNTING POLICIES
Our discussion and analysis of our financial condition and results of operations is based upon our financial statements, which have been prepared in accordance with accounting principles generally accepted in the United States. The preparation of these financial statements requires us to make estimates
49
Table of Contents
Management’s discussion and analysis of financial condition and results of operations
and judgments that affect the reported amount of assets, liabilities, equities, revenues and expenses and related disclosure of contingent assets and liabilities. We evaluate our estimates on an ongoing basis. We base our estimates on historical experience and on various other assumptions that we believe to be reasonable under the circumstances, the results of which form the basis for judgments we make about the carrying values of assets and liabilities that are not readily apparent from other sources. Because these estimates can vary depending on the situation, actual results may differ from the estimates.
We believe the following critical accounting policies affect our more significant judgments used in the preparation of our consolidated financial statements:
Revenue recognition.
We recognize revenues from the following sources:
| Ø | the sale of biodiesel, including RINs, biodiesel co-products and raw material feedstocks purchased by us or produced by us at owned manufacturing facilities, leased manufacturing facilities and manufacturing facilities with which we have tolling arrangements; |
| Ø | fees received under toll manufacturing agreements with third parties; |
| Ø | fees received from federal and state incentive programs for renewable fuels; |
| Ø | fees from construction, operations and project management; and |
| Ø | fees received for the marketing and sales of biodiesel produced by third parties. |
Biodiesel sales and raw material feedstock revenues are recognized when there is persuasive evidence of an arrangement, delivery has occurred, the price has been fixed or is determinable and collectability can be reasonably assured.
We refer to agreements under which a biodiesel facility produces biodiesel for a third party using such third party’s feedstock as tolling arrangements. Generally, the party producing the biodiesel receives a per gallon fee. Fees received under toll manufacturing agreements with third parties are generally established as an agreed upon amount per gallon of biodiesel produced. The fees are recognized where there is persuasive evidence of an arrangement, delivery has occurred, the price has been fixed or is determinable and collectability can be reasonably assured.
Revenues associated with the governmental incentive programs are recognized when the amount to be received is determinable, collectability is reasonably assured and the sale of product giving rise to the incentive has been recognized. Our revenue from governmental incentive programs is comprised of amounts received from the blender’s tax credit. For a discussion of the blender’s tax credit, see the section entitled “Risk factors—Loss or reductions of tax incentives for biodiesel production or consumption would have a material adverse effect on our revenues and operating margins” and “—Factors Influencing Our Results of Operations—Governmental programs favoring biodiesel production and use.” We file a claim with the Internal Revenue Service for a refund of excise taxes in connection with the blender’s tax credit each week for gallons we have blended to B99.9 and sold during the prior week. During 2011, we have collected these claims in approximately 20 days on average from the time we file and we currently have no filed claims older than one month. Other than routine audits of these claims, we have had no denials or challenges of our claims and no issues with collectability.
Historically, we have provided consulting and construction services under turnkey contracts. These jobs require design and engineering effort for a specific customer purchasing a unique facility. We record
50
Table of Contents
Management’s discussion and analysis of financial condition and results of operations
revenues on these fixed-price contracts on the percentage of completion basis using the ratio of costs incurred to estimated total costs at completion as the measurement basis for progress toward completion and revenue recognition. The total contract price includes the original contract plus any executed change orders only when the amounts have been received or awarded.
Contract costs include all direct labor and benefits, materials unique to or installed in the project and subcontract costs. Contract accounting requires significant judgment relative to assessing risks, estimating contract costs and making related assumptions for schedule and technical issues. We routinely review estimates related to contracts and reflect revisions to profitability in earnings on a current basis. If a current estimate of total contract cost indicates an ultimate loss on a contract, we would recognize the projected loss in full when it is first determined. We recognize additional contract revenue related to claims when the claim is probable and legally enforceable.
Changes relating to executed change orders, job performance, construction efficiency, weather conditions and other factors affecting estimated profitability may result in revisions to costs and revenues and are recognized in the period in which the revisions are determined.
Billings in excess of costs and estimated earnings on uncompleted contracts represents amounts billed to customers prior to providing related construction services.
Fees for managing ongoing operations of third party plants, marketing biodiesel produced by third party plants and from other services are recognized as services are provided. We also have performance-based incentive agreements that are included as management service revenues. These performance incentives are recognized as revenues when the amount to be received is determinable and collectability is reasonably assured.
In the past, we have acted as a sales agent for certain third parties under our MOSAs, thus we recognized that biodiesel revenue on a net basis in accordance with ASC Topic 605-45, “Revenue Recognition.” We included the fees earned under the MOSAs in revenue. Our third party MOSAs all either expired or were terminated during 2010.
Impairment of Long-Lived Assets and Certain Identifiable Intangibles. We review long-lived assets, including property, plant and equipment and definite-lived intangible assets, for impairment in accordance with ASC Topic 360-10, “Property, Plant, and Equipment.” Asset impairment charges are recorded for long-lived assets and intangible assets subject to amortization when events and circumstances indicate that such assets may be impaired and the undiscounted net cash flows estimated to be generated by those assets are less than their carrying amounts. If estimated future undiscounted cash flows are not sufficient to recover the carrying value of the assets, an impairment charge is recorded for the amount by which the carrying amount of the assets exceeds its fair value. Fair value is determined by management estimates using discounted cash flow calculations. The estimate of cash flows arising from the future use of the asset that are used in the impairment analysis requires judgment regarding what we would expect to recover from the future use of the asset.
Significant assumptions used by management in the gross cash flow analysis include the projected demand for biodiesel based on annual renewable fuel volume obligations under RFS2, our capacity to meet that demand, the market price of biodiesel and the cost of feedstock used in the manufacturing process. For facilities under construction, management’s estimates also include the capital expenditures necessary to complete construction of the plant. Our facilities under construction are expected to have substantially similar operating capabilities and results as our current operating facilities. Such operating capabilities would include similar feedstock capabilities, similar access to low cost feedstocks, proximity
51
Table of Contents
Management’s discussion and analysis of financial condition and results of operations
to shipping from our vendors and to our customers, and our ability to transfer best practices among our various operating facilities to maximize production volumes and reduce operating costs.
We estimated the future cash flows from the facilities under construction utilizing the following significant assumptions:
Costs to complete: The remaining costs to complete the plant construction were developed by management, using historical and plant-specific knowledge, and external estimates. Management’s estimate of costs included those required to finish the general structure of each facility, as well as furnish it with the appropriate equipment necessary to produce biodiesel. There has not been an accumulation of costs significantly in excess of the amount originally expected for the acquisition or construction of a long-lived asset (asset group). There can be no assurance actual costs to complete or upgrade these facilities will be consistent with these estimates.
Gallons sold: We estimated the aggregate gallons to be produced and sold based upon nameplate capacity of the plants under construction coupled with historical operating rates for our existing plants.
Gross margin per gallon: We have estimated rising sales prices and costs after 2011. This annual increase is a consequence of anticipated increased demand for biodiesel, market trends expected for the energy industry and normal inflationary pressures. Biodiesel sales prices were estimated using the expected prices for biodiesel, RINs and co-products. When building the estimate for future prices, we weighed historical evidence, CBOT and NYMEX future prices, and industry forecasts. To develop the estimated feedstock prices, we utilized soybean oil as a base coupled with a spread to soybean oil for all other feedstocks based on historical experience and expected future price changes.
Plant operation costs: We estimated plant operational costs to increase with production, until a steady cost level is reached once the plants are operating in a stabilized manner. Plant operating costs are estimated based upon costs at currently operating plants and take into account the size of the plants under construction and production volumes.
Financing of facilities under construction: In 2008, we halted construction on our New Orleans, Louisiana, and Emporia, Kansas facilities as a result of conditions in the biodiesel industry and the credit markets. The Company continues to pursue financing and intends to finish the facilities, when industry conditions improve and financing becomes available. Since construction halted at these facilities in 2008 we have continued to monitor the construction sites and perform routine maintenance on the partially constructed assets. We continue to be in discussions with lenders in an effort to obtain financing for facilities under construction and capital improvement projects. The city incentive package for the Emporia construction project was renewed for an additional three years starting July 1, 2010. In addition, we have been in discussions with potential investors and commercial partners that have expressed interest in these facilities. We have also invested in third-party engineering studies to revise and enhance construction completion plans.
Period of time used in recovery analysis: To estimate the period of time utilized in the recovery analysis, we followed the guidance included in ASC 360-10-35-31, which states in part that estimates of future cash flows used to test the recoverability of a long-lived asset (asset group) shall be made for the remaining useful life of the asset (asset group) to the entity. For purposes of this Subtopic, the primary asset is the principal long-lived tangible asset being depreciated or intangible asset being amortized that is the most significant component asset from which the asset group derives its cash-flow-generating capacity. We considered the plant assets and their operational functionality and determined that the inner equipment of the plants, (e.g. tanks, separators, filters, heaters, etc.), is the most significant component of the asset group. We have determined that the
52
Table of Contents
Management’s discussion and analysis of financial condition and results of operations
useful life of this equipment has a range of 10-30 years depending on its use, with the majority of the equipment having a 20 year life. Therefore, we have selected a 20 year period from the original date the assets are placed into service as the time period over which the cash flows would be projected.
Our analysis determined that the gross cash flows of each plant exceeded its carrying value by a significant margin and therefore no charge for impairment was needed.
During 2010, certain of our soybean oil supply agreements were cancelled. The original agreements were recorded as intangible assets in the amount of $7.0 million. As a result of the cancellations, the full amount was charged off as an impairment during the year ended December 31, 2010.
We also recorded an impairment on deferred financing cost related to Gulf Opportunity Zone, or GOZone, bonds available as part of Congress’ tax incentive program to help the Gulf Coast recover from Hurricane Katrina. We determined that it was not probable that the GOZone bonds allocation would be extended past the December 14, 2010 deadline or that the bonds would be issued prior to the deadline, and accordingly, we returned our allocation prior to the deadline. The amount of the impairment for the year ended December 31, 2010 was $0.3 million.
Total asset impairment charges of $7.5 million were recorded for the year ended December 31, 2010.
Goodwill asset valuation. While goodwill is not amortized, it is subject to periodic reviews for impairment. As required by ASC Topic 350, “Intangibles—Goodwill and Other,” we review the carrying value of goodwill for impairment annually on July 31 or when we believe impairment indicators exist. Goodwill is allocated and reviewed for impairment by reporting units. The Company’s reporting units consist of its two operating segments, the biodiesel operating segment and services operating segments. The analysis is based on a comparison of the carrying value of the reporting unit to its fair value, determined utilizing a discounted cash flow methodology. Additionally, we review the carrying value of goodwill whenever events or changes in business circumstances indicate that the carrying value of the assets may not be recoverable. Changes in estimates of future cash flows caused by items such as unforeseen events or sustained unfavorable changes in market conditions could negatively affect the fair value of the reporting unit’s goodwill asset and result in an impairment charge. The annual impairment test as of July 31, 2010 determined that the fair value at each of the reporting units exceeded its carrying value by significant margins. There has been no impairment of goodwill recorded in 2010, 2009, or 2008.
Income taxes. We recognize deferred taxes by the asset and liability method. Under this method, deferred income taxes are recognized for differences between the financial statement and tax bases of assets and liabilities at enacted statutory tax rates in effect for the years in which differences are expected to reverse. The effect on deferred taxes of a change in tax rates is recognized in income in the period that includes the enactment date. In addition, valuation allowances are established if necessary to reduce deferred tax assets to amounts expected to be realized.
On December 31, 2009, we determined that it is unlikely that our deferred tax assets will be fully realized in the future based on available evidence; therefore, a full valuation allowance was established against the assets. On a quarterly basis, any deferred tax assets are reviewed to determine the probability of realizing the assets. At December 31, 2010, we had net deferred income tax assets of approximately $39.2 million with a valuation allowance of $37.7 million, which resulted in a net deferred tax asset of $1.5 million and is offset by an accrued liability for uncertain tax benefits. We believe there is a
53
Table of Contents
Management’s discussion and analysis of financial condition and results of operations
reasonable basis in the tax law for all of the positions we take on the various federal and state tax returns we file. However, in recognition of the fact that various taxing authorities may not agree with our position on certain issues, we expect to establish and maintain tax reserves. As of December 31, 2010, we had a net deferred tax asset of $1.5 million relating to uncertain tax benefits.
Prior to the merger of our wholly-owned subsidiary with and into Blackhawk, or the Blackhawk Merger, Blackhawk was treated as a partnership for federal and state income tax purposes and generally did not incur income taxes. Instead, its earnings and losses were included in the income tax returns of its members. Therefore, no provision or liability for federal or state income taxes was included in our consolidated financial statements aside from our pro-rata share included on our Schedule K-1 determined based on our ownership interest for the year ending December 31, 2009 and the period ending February 26, 2010 prior to acquisition.
Consolidations. Prior to January 1, 2010, we consolidated Blackhawk according to the then existing requirements of ASC Topic 810, “Consolidations”, as it was determined that we were the primary beneficiary. We determined that we were the primary beneficiary as we held significant variable interests through which we received the majority of Blackhawk’s expected losses or the majority of its expected residual returns. Variable interests in Blackhawk held by us are the subordinated convertible note, membership units, guaranty of indebtedness of up to $1,500, warrants, MOSA, and the design-build agreement.
As a result of the consolidation, all accounts of Blackhawk have been included with our financial statements as of May 9, 2008, the date of the transaction. As required by ASC Topic 810 the assets, including cash of $2.2 million, and liabilities consolidated by us were recorded at their relative fair values.
On May 9, 2008, REG through its subsidiary entered into a MOSA with Blackhawk. The agreement provides for the overall management of Blackhawk’s facility by REG, including the procurement of feedstocks as necessary for the operation of the plant, performance of administrative, sales and marketing functions, and other services as needed. The term of the agreement is five years from the end of the first month in which biodiesel was produced for sale and will continue thereafter unless one of the parties gives 24-months notice to terminate the agreement. The MOSA is still in affect with Blackhawk, now known as REG Danville, LLC, and upon notice, will expire on April 30, 2014.
Beginning in March 2009, Blackhawk, now REG Danville, LLC, entered into a series of monthly toll processing agreements with REG under which Blackhawk has agreed to process biodiesel for the account of REG using feedstocks provided by REG. These agreements have continued on substantially similar terms since that time. REG has been obligated to request Blackhawk to produce a minimum amount of biodiesel under these agreements, which minimum is determined on a monthly basis. Blackhawk receives a set fee per gallon up to 2.5 million gallons produced and a reduced fee per gallon thereafter, which is also determined on a monthly basis. The agreements also waive the biodiesel production fee of $0.0425 per gallon payable to REG under the terms of the MOSA.
On January 1, 2010, we deconsolidated Blackhawk as a result of adopting ASU No. 2009-17, as it was determined that we were no longer the primary beneficiary. Although the financial arrangements mentioned above resulted in us holding substantial variable interests in Blackhawk, Blackhawk did not give us the power through the MOSA or the tolling arrangements to direct the activities that most significantly impact Blackhawk’s economic performance. Specifically, we entered into a tolling arrangement with Blackhawk on a month to month basis which required Blackhawk’s Board to approve the monthly volume and toll fee paid to Blackhawk. While we proposed this amount, the Blackhawk Board ultimately determined whether the volume and toll fee was acceptable to Blackhawk each month,
54
Table of Contents
Management’s discussion and analysis of financial condition and results of operations
which was the primary driver of Blackhawk’s economic performance. In addition, while the MOSA requires that we provide certain services for Blackhawk, the terms of the MOSA as well as Blackhawk’s limited liability company agreement explicitly specify ultimate power to direct the activities and business affairs of Blackhawk are held by its independent board. We have concluded the activities that are most significant to Blackhawk’s economic performance including: budgeting, feedstock procurement, marketing and securing and allocating capital, are performed by Blackhawk’s independent board and therefore indicate our role in the MOSA is that of a service provider. Specifically, although we may make recommendations on the pricing of feedstock and finished product, these recommendations are presented to the independent board or its delegate for approval. We do not act as the independent board’s delegate. Furthermore, although we provide input in determining the capital and operating budget for the production facility, ultimate authority to approve the operating budget rests with Blackhawk’s Board which also must approve all capital expenditures before costs are incurred.
As a result of the above agreements and upon adoption of ASU No. 2009-17, we determined we were not the primary beneficiary of Blackhawk. Consequently, subsequent to adopting this accounting pronouncement, we deconsolidated Blackhawk. Upon deconsolidation, an equity investment in Blackhawk of $4.0 million and a subordinated convertible note receivable of $24.3 million were recognized at fair value using the option available under ASC Topic 825, Financial Instruments, and the previously consolidated amounts were removed from the consolidated balance sheet. The difference between the amounts recognized at fair value and the removal of the previously consolidated amounts was recorded to retained earnings (accumulated deficit).
As of June 30, 2010, we determined the acquisition price of Blackhawk and CIE. For the Blackhawk Merger and the acquisition of substantially all of the assets and liabilities of CIE pursuant to the CIE asset purchase agreement, the allocation of the recorded amounts of consideration transferred and the recognized amounts of the assets acquired and liabilities assumed are based on the final appraisals and evaluation and estimations of fair value as of the acquisition date. We determined the goodwill recorded was $44.2 million and $24.6 million for REG Danville and REG Newton, LLC, or REG Newton, respectively.
On April 8, 2010, we determined that Landlord was a VIE and consolidated it into our financial statements as we are the primary beneficiary (ASC Topic 810, “Consolidations”). We have a put/call option with Seneca Holdco, LLC to purchase Landlord and we currently lease the plant for production of biodiesel, both of which represent a variable interest in Landlord that are significant to the VIE. Although we do not have an ownership interest in Seneca Holdco, LLC, we determined that we are the primary beneficiary because the equity owners are our stockholders; our ability to direct the activities that most significantly impact Landlord’s economic performance; and the design of the leasing arrangement that ultimately gives us the majority of the benefit from the use of Landlord’s assets. We have elected the fair value option available under ASC Topic 825, “Financial Instruments” on the $4.0 million investment made by Seneca Holdco, LLC and the associated put and call options. Changes in the fair value after the date of the transaction are recorded in earnings. Those assets are owned by and those liabilities are obligations of Landlord, which we have consolidated as the primary beneficiary.
During 2007, we invested, through a wholly-owned subsidiary, in Bell, LLC, a VIE joint venture, whereby we own 50% of the outstanding units. Commencing January 1, 2011, we have the right to execute a call option with the joint venture member, Dayton Park, LLC, to purchase Bell, LLC; therefore, we determined we were the primary beneficiary of Bell, LLC and consolidated Bell, LLC into our financial statements in accordance with ASC Topic 810. See “Note 5—Variable Interest Entities” to our condensed consolidated financial statements for a description of the consolidation.
55
Table of Contents
Management’s discussion and analysis of financial condition and results of operations
Valuation of Preferred Stock Embedded Derivatives. The terms of our Series A preferred stock provide for voluntary and, under certain circumstances, automatic conversion of the Series A preferred stock to common stock based on a prescribed formula. In addition, shares of Series A preferred stock are subject to redemption at the election of the holder beginning February 26, 2014. The redemption price is equal to the greater of (i) an amount equal to $13.75 per share of Series A preferred stock plus any and all accrued dividends, not exceeding $16.50 per share, and (ii) the fair market value of the Series A preferred stock. Under ASC Topic 815-40, we are required to bifurcate and account for as a separate liability certain derivatives embedded in our contractual obligations. An “embedded derivative” is a provision within a contract, or other instrument, that affects some or all of the cash flows or the value of that contract, similar to a derivative instrument. Essentially, the embedded terms contain all of the attributes of a free-standing derivative, such as an underlying market value, a notional amount or payment provision, and can be settled “net,” but the contract, in its entirety, does not meet the ASC Topic 815-40 definition of a derivative. For a description of the redemption and liquidation rights associated with Series A preferred stock, see “Note 4—Redeemable Preferred Stock” to our audited consolidated financial statements.
We have determined that the conversion feature of Series A preferred stock is an embedded derivative because the redemption feature allows the holder to redeem Series A preferred stock for cash at a price which can vary based on the fair market value of the Series A preferred stock, which effectively provides the holders of the Series A preferred stock with a mechanism to “net settle” the conversion option. Consequently, the embedded conversion option must be bifurcated and accounted for separately because the economic characteristics of this conversion option are not considered to be clearly and closely related to the economic characteristics of the Series A preferred stock, which is considered more akin to a debt instrument than equity.
Upon issuance of Series A preferred stock, we recorded a liability representing the estimated fair value of the right of preferred holders to receive the fair market value of the common stock issuable upon conversion of the Series A preferred stock on the redemption date. This liability is adjusted each quarter based on changes in the estimated fair value of such right, and a corresponding income or expense is recorded as Other Income in our statements of operations.
We use the option pricing method to value the embedded derivative. We use the Black-Scholes options pricing model to estimate the fair value of the conversion option embedded in the Series A preferred stock. The Black-Scholes options pricing model requires the development and use of highly subjective assumptions. These assumptions include the anticipated impact of this offering and the application of the proceeds therefrom, the expected volatility of the value of our equity, the expected conversion date, an appropriate risk-free interest rate, and the estimated fair value of our equity. The expected volatility of our equity is estimated based on the volatility of the value of the equity of publicly traded companies in a similar industry and general stage of development as us. The expected term of the conversion option is based on the period remaining until the contractually stipulated redemption date of February 26, 2014. The risk-free interest rate is based on the yield on United States Treasury STRIPs with a remaining term equal to the expected term of the conversion option. The development of the estimated fair value of our equity is discussed below in the “Valuation of the Company’s Equity.”
The significant assumptions utilized in our valuation of the embedded derivative are as follows:
| June 30, 2011 |
December 31, 2010 |
February 26, 2010 |
December 31, 2009 |
December 31, 2008 |
June 30, 2008 |
|||||||||||||||||||
| Expected volatility |
40.00 | % | 40.00 | % | 40.00 | % | 50.00 | % | 55.00 | % | 55.00 | % | ||||||||||||
| Risk-free rate |
4.10 | % | 4.10 | % | 4.40 | % | 4.11 | % | 4.39 | % | 4.58 | % | ||||||||||||
56
Table of Contents
Management’s discussion and analysis of financial condition and results of operations
The estimated fair values of the conversion feature embedded in the Series A preferred stock is recorded as a derivative liability. The derivative liability is adjusted to reflect fair value at each period end, with any increase or decrease in the fair value being recorded in results of operations as change in fair value of Series A preferred stock embedded derivative. The impact of the change in the value of the embedded derivative is not included in the determination of taxable income. For a discussion of the conversion of our Series A preferred stock, see the section entitled “Certain relationships and related party transactions—Recapitalization” in this prospectus.
Valuation of Seneca Holdco, LLC Liability. In connection with the agreements under which we lease the Seneca facility (See “Note 6—Acquisitions and Equity Transactions” to our audited consolidated financial statements), we have the option to purchase, or Call Option, and Seneca Holdco, LLC has the option to require us to purchase, or Put Option, the membership interest of Landlord whose assets consist primarily of a biodiesel plant located in Seneca, Illinois. Both the Put Option and the Call Option have a term of seven years and are exercisable by either party at a price based on a pre-defined formula. We have valued the amounts financed by Seneca Holdco, LLC, the Put Option and the Call Option using an option pricing model. The fair values of the Put Option and the Call Option were estimated using an option pricing model, and represent the probability weighted present value of the gain that is realized upon exercise of each option. The option pricing model requires the development and use of highly subjective assumptions. These assumptions include (i) the value of our equity, (ii) expectations regarding future changes in the value of our equity, (iii) expectations about the probability of either option being exercised, including the our ability to list our securities on an exchange or complete a public offering and (iv) an appropriate risk-free rate. We considered current public equity markets, relevant regulatory issues, biodiesel industry conditions and our position within the industry when estimating the probability that we will raise additional capital. Differences in the estimated probability and timing of this event may significantly impact the fair value assigned to the Seneca Holdco, LLC liability as we determined it is not likely that the Put Option will become exercisable in the absence of this event.
The significant assumptions utilized in our valuation of the Seneca Holdco, LLC liability are as follows:
| June 30, 2011 |
December 31, 2010 |
April 9, 2010 |
||||||||||
| Expected volatility |
50.00 | % | 50.00 | % | 50.00 | % | ||||||
| Risk-free rate |
2.05 | % | 2.45 | % | 3.36 | % | ||||||
| Probability of IPO |
75.00 | % | 70.00 | % | 60.00 | % | ||||||
Preferred Stock Accretion. Beginning October 1, 2007, the date that we determined that there was a more than remote likelihood that our then outstanding preferred stock would become redeemable, we commenced accretion of the carrying value of the preferred stock over the period until the earliest redemption date, which was August 1, 2011, to the preferred stock’s redemption value, plus accrued but unpaid dividends using the effective interest method. This determination was based upon the current state of the public equity markets which restricted our ability to execute a qualified public offering, our historical operating results and the volatility in the biodiesel and renewable fuels industries which have resulted in lower projected profitability. Prior to October 1, 2007, we had determined that it was not probable that the preferred stock would become redeemable; therefore, the carrying value was not adjusted in accordance with ASC Topic 480-10-S99, “Classification and Measurement of Redeemable Securities.”
On February 26, 2010, after issuance of the Series A preferred stock, we determined that there was a more than remote likelihood that the Series A preferred stock would become redeemable and we commenced accretion of the carrying value of the Series A preferred stock over the period until the
57
Table of Contents
Management’s discussion and analysis of financial condition and results of operations
earliest redemption date (February 26, 2014) to the Series A preferred stock’s redemption value, plus dividends, using the effective interest method. This determination was based upon the state of the public equity markets at the time which restricted our ability to execute a qualified public offering, our historical operating results and the volatility in the biodiesel and renewable fuels industries.
Accretion of $27.2 million and $44.2 million for 2010 and 2009, respectively, has been recognized as a reduction to income available to common stockholders in accordance with paragraph 15 of ASC Topic 480-10-S99.
Valuation of the Company’s Equity. We considered three generally accepted valuation approaches to estimate the fair value of our aggregate equity: the income approach, the market approach and the cost approach. Ultimately, the estimated fair value of our aggregate equity is developed using the Income Approach—Discounted Cash Flow, or DCF, method. The value derived using this approach is supported by a variation of the Market Approach, specifically comparisons of the implied multiples derived using the DCF method to the multiples of various metrics calculated for guideline public companies.
Material underlying assumptions in the DCF analysis include the gallons produced and managed, gross margin per gallon, expected long-term growth rates and an appropriate discount rate. Gallons produced and managed as well as the gross margin per gallon were determined based on historical and forward-looking market data.
The discount rate used in the DCF analysis is based on macroeconomic, industry and company-specific factors and reflects the perceived degree of risk associated with realizing the projected cash flows. The selected discount rate represents the weighted average rate of return that a market participant investor would require on an investment in our debt and equity. The percent of total capital assumed to be comprised of debt and equity when developing the weighted average cost of capital was based on a review of the capital structures of our publicly traded industry peers. The cost of debt was estimated utilizing the adjusted average 20-Year B-rated corporate bond rate during the previous 12 months representing a reasonable market participant rate based on our publicly traded industry peers. Our cost of equity was estimated utilizing the capital asset pricing model, which develops an estimated market rate of return based on the appropriate risk-free rate adjusted for the risk of the industry relative to the market as a whole, an equity risk premium and a company specific risk premium. The risk premiums included in the discount rate were based on historical and forward looking market data.
Discount rates utilized in our DCF model are as follows:
| June 30, 2011 |
December 31, 2010 |
February 26, 2010 |
December 31, 2009 |
December 31, 2008 |
June 30, 2008 |
|||||||||||||||||||
| Discount rate |
19.50 | % | 16.00 | % | 15.00 | % | 13.00 | % | 15.00 | % | 13.50 | % | ||||||||||||
Valuations derived from this model are subject to ongoing internal and external verification and review. Selection of inputs involves management’s judgment and may impact net income. This analysis is done on a regular basis and takes into account factors that have changed from the time of the last common stock issuance. Other factors affecting our assessment of price include recent purchases or sales of common stock, if available.
58
Table of Contents
Management’s discussion and analysis of financial condition and results of operations
RESULTS OF OPERATIONS
Three and six months ended June 30, 2011 and June 30, 2010
Set forth below is a summary of certain unaudited financial information (in thousands) for the periods indicated:
| Three Months Ended June 30, |
Six Months Ended June 30, |
|||||||||||||||
| 2011 | 2010 | 2011 | 2010 | |||||||||||||
| Revenues |
||||||||||||||||
| Biodiesel |
$ | 184,347 | $ | 46,169 | $ | 284,421 | $ | 79,144 | ||||||||
| Biodiesel government incentives |
11,926 | 22 | 16,266 | 3,674 | ||||||||||||
|
|
|
|
|
|
|
|
|
|||||||||
| Total biodiesel |
196,273 | 46,191 | 300,687 | 82,818 | ||||||||||||
| Services |
39 | 146 | 60 | 1,008 | ||||||||||||
|
|
|
|
|
|
|
|
|
|||||||||
| Total |
196,312 | 46,337 | 300,747 | 83,826 | ||||||||||||
| Costs of goods sold |
||||||||||||||||
| Biodiesel |
165,895 | 41,125 | 262,084 | 75,949 | ||||||||||||
| Services |
24 | 118 | 42 | 533 | ||||||||||||
|
|
|
|
|
|
|
|
|
|||||||||
| Total |
165,919 | 41,243 | 262,126 | 76,482 | ||||||||||||
|
|
|
|
|
|
|
|
|
|||||||||
| Gross profit |
30,393 | 5,094 | 38,621 | 7,344 | ||||||||||||
| Selling, general and administrative expenses |
7,812 | 5,731 | 14,090 | 10,817 | ||||||||||||
| Impairment of assets |
— | — | — | 141 | ||||||||||||
|
|
|
|
|
|
|
|
|
|||||||||
| Income (loss) from operations |
22,581 | (637 | ) | 24,531 | (3,614 | ) | ||||||||||
| Other income (expense), net |
(23,446 | ) | 3,011 | (21,596 | ) | 2,956 | ||||||||||
| Income tax benefit (expense) |
— | (2,600 | ) | — | 3,728 | |||||||||||
| Loss from equity investments |
(83 | ) | (166 | ) | (148 | ) | (381 | ) | ||||||||
|
|
|
|
|
|
|
|
|
|||||||||
| Net income attributable to REG |
(948 | ) | (392 | ) | 2,787 | 2,689 | ||||||||||
| Effects of recapitalization |
— | — | — | 8,521 | ||||||||||||
| Accretion of preferred stock to redemption value |
(6,180 | ) | (5,178 | ) | (12,076 | ) | (16,246 | ) | ||||||||
| Undistributed dividends allocated to preferred stockholders |
(3,185 | ) | (2,926 | ) | (6,246 | ) | (4,073 | ) | ||||||||
|
|
|
|
|
|
|
|
|
|||||||||
| Net income (loss) attributable to the Company’s common stockholders |
$ | (10,313 | ) | $ | (8,496 | ) | $ | (15,535 | ) | $ | (9,109 | ) | ||||
|
|
|
|
|
|
|
|
|
|||||||||
Revenues. Our total revenues increased $150.0 million, or 324%, and $216.9 million, or 259%, to $196.3 million and $300.7 million for the three and six months ended June 30, 2011, respectively, from $46.3 million and $83.8 million for the three and six months ended June 30, 2010, respectively. This increase was due to an increase in biodiesel revenues as follows:
Biodiesel. Biodiesel revenues including government incentives increased $150.1 million, or 325%, and $217.9 million, or 263%, to $196.3 million and $300.7 million during the three and six months ended June 30, 2011, respectively, from $46.2 million and $82.8 million for the three and six months ended June 30, 2010, respectively. This increase in biodiesel revenues was due to an increase in both gallons sold and selling price. Due to higher RIN and energy prices in the first half of 2011, our average B100 sales price per gallon increased $1.96, or 61%, and $1.74, or 55%, to $5.19 and $4.88 during the three and six months ended June 30, 2011, respectively, compared to $3.23 and $3.14 during the three and six months ended June 30, 2010, respectively. The increase in sale price
59
Table of Contents
Management’s discussion and analysis of financial condition and results of operations
from the first half of 2010 to the first half of 2011 contributed to a $40 million revenue increase when applied to the number of gallons sold during the first six months of 2010. Gallons sold, excluding tolled gallons, increased 22.7 million, or 177%, and 32.6 million, or 142%, to 35.5 million and 55.6 million during the three and six months ended June 30, 2011, respectively, compared to 12.8 million and 23.0 million during the three and six months ended June 30, 2010, respectively. The increase in gallons for the six months ended June 30, 2011 accounted for a revenue increase of $159.1 million using pricing for the first six months of 2011. We tolled 2.5 million gallons and 5.4 million gallons at our Houston facility for the six months ended June 30, 2011 and 2010, respectively, which are included in the total gallons sold reported above. This increase in gallons sold reflects significantly stronger market demand primarily as a result of RFS2. In response to this demand our Newton, Danville and Seneca facilities produced biodiesel through the entire first half of 2011.
Services. Services revenues decreased $0.1 million, or 73%, and $0.9 million, or 94%, to $0 million and $0.1 million for the three and six months ended June 30, 2011, respectively, from $0.1 million and $1.0 million for the three and six months ended June 30, 2010, respectively. This decrease was due to our decision to cancel our remaining MOSAs during 2010.
Costs of goods sold. Our cost of goods sold increased $124.7 million, or 302%, and $185.6 million, or 243%, to $165.9 million and $262.1 million for the three and six months ended June 30, 2011, respectively, from $41.2 million and $76.5 million for the three and six months ended June 30, 2010, respectively. This increase was primarily due to costs associated with the increase in gallons sold in the 2011 period and as follows:
Biodiesel. Biodiesel cost of goods sold increased $124.8 million, or 303%, and $186.1 million, or 245%, to $165.9 million and $262.1 million for the three and six months ended June 30, 2011, respectively, compared to $41.1 million and $75.9 million for the three and six months ended June 30, 2010, respectively. The increase in biodiesel cost of goods sold is primarily the result of the additional gallons sold in the 2011 period as discussed above and an increase in average feedstock prices. Average inedible animal fat costs for the three and six months ended June 30, 2011 were $0.48 and $0.45 per pound, respectively, compared to $0.29 and $0.28 per pound for the three and six months ended June 30, 2010, respectively. Soybean oil costs for the three and six months ended June 30, 2011 were $0.58 and $0.57 per pound, respectively, and were $0.35 and $0.36 per pound for the three and six months ended June 30, 2010, respectively. We had gains of $1.7 million and losses of $2.1 million from hedging activity in the three and six months ended June 30, 2011, respectively, compared to gains of $0.7 million and $0.5 million from hedging arrangements in the three and six months ended June 30, 2010, respectively.
Services. Costs of services decreased $0.1 million and $0.5 million to $0 million for the three and six months ended June 30, 2011, respectively, from $0.1 million and $0.5 million for the three and six months ended June 30, 2010, respectively. Costs incurred to perform services under the MOSAs decreased due to our decision to cancel the MOSAs during 2010.
Selling, general and administrative expenses. Our selling, general and administrative, or SG&A, expenses were $7.8 million and $14.1 million for the three and six months ended June 30, 2011, respectively, compared to $5.7 million and $10.8 million for the three and six months ended June 30, 2010. SG&A expenses increased $2.1 million, or 37%, and $3.3 million, or 31%, for the three and six months ended June 30, 2011, respectively. The increase was primarily related to the additional non-cash stock compensation expense of $1.0 million and $2.0 million for the three and six months ended June 30, 2011, respectively, compared to less than $0.1 million for each of the three and six months ended June 30, 2010. Additionally, depreciation expense increased $0.2 million, the provision for bad
60
Table of Contents
Management’s discussion and analysis of financial condition and results of operations
debt expense increased $0.6 million and insurance expense increased approximately $0.2 million, or an aggregate of $1.0 million, in the first six months of 2011 when compared to the same period for 2010.
Other income (expense), net. Other expense was $23.4 million and $21.6 million for the three and six months ended June 30, 2011 and other income was $3.0 million for each of the three and six months ended June 30, 2010. Other income is primarily comprised of the changes in fair value of the Series A preferred stock conversion feature embedded derivative, changes in fair value of Seneca Holdco, LLC liability, interest expense, interest income and the other non-operating items. The change in fair value of the Series A preferred stock conversion feature embedded derivative resulted in $19.6 million and $17.1 million of expense for the three and six months ended June 30, 2011, respectively, and $5.0 million for the three and six months ended June 30, 2010, respectively. The change in fair value of the Seneca Holdco, LLC liability was $2.3 million and $1.5 million of expense for the three and six months ended June 30, 2011, respectively, and was $0.4 million of expense for each of the three and six months ended June 30, 2010. Interest expense increased $0.4 million and $1.7 million for the three and six months ended June 30, 2011, respectively, from $1.4 million and $1.7 million for the three and six months ended June 30, 2010, respectively. This increase was primarily attributable to the debt related to the consolidation of Landlord during 2010.
Income tax benefit (expense). There was no income tax benefit or expense for the first half of 2011, compared to an income tax expense of $2.6 million and income tax benefit of $3.7 million for the three and six months ended June 30, 2010. Any income tax expense for the three or six months ending June 30, 2011 was offset entirely by the income recognized by the release of the associated valuation allowance. Deferred tax liabilities were recorded as a result of the Blackhawk Merger and CIE Asset Acquisition. As the deferred tax liabilities were recorded, the resulting decrease in net deferred tax assets required a lower valuation allowance. The income tax expense for the three months ended June 30, 2010 results from the finalization of the Blackhawk and CIE purchase accounting. The release of the associated valuation allowance resulted in an income tax benefit for the six months ended June 30, 2010. At June 30, 2011, we had net deferred income tax assets of approximately $31.2 million with a valuation allowance of $29.7 million, which resulted in a net deferred tax asset of $1.5 million and was offset by an accrued liability for uncertain tax benefits.
Loss from equity investments. Loss from equity investments was $0.1 million and $0.4 million for the first half of 2011 and 2010, respectively, due to lower levels of overall production at equity method investees that were generating gross losses during the first half of 2010 and the change of investments from equity method to cost method during the last half of 2010.
Effects of Biofuels Merger Recapitalization. In February 2010, we acquired REG Biofuels, Inc., our accounting predecessor, which transaction we refer to as the Biofuels Merger. Due to the Biofuels Merger, we recorded the effects from recapitalization of $8.5 million. To account for the exchange of one series of preferred shares for the newly issued series of preferred shares, we compared the fair value of the preferred shares issued to the carrying amount of the preferred and common shares that were redeemed. The excess of the carrying amount of preferred and common shares that were redeemed over the fair value of the preferred shares that were issued was recorded as an increase to additional paid-in capital and was added to net earnings available to common shareholders.
Preferred stock accretion. Preferred stock accretion was $6.2 million and $12.1 million for the three and six months ended June 30, 2011, respectively, compared to $5.2 and $16.2 million for the three and six months ended June 30, 2010, respectively. During the first quarter of 2010, we accreted two months of the previously issued Seneca Holdco, LLC preferred stock (redemption date of August 1, 2011) and
61
Table of Contents
Management’s discussion and analysis of financial condition and results of operations
one month of newly issued Series A preferred stock (redemption date February 26, 2014). Monthly accretion expense decreased after the Biofuels Merger in 2010 as a result of the new redemption amount and redemption date of our Series A preferred stock.
Undistributed dividends. Undistributed dividends were $3.2 million and $6.2 million for the three and six months ended June 30, 2011, respectively, compared to $2.9 million and $4.1 million for the three and six months ended June 30, 2010, respectively. During the first quarter of 2010, we accrued dividends on the previously issued Seneca Holdco, LLC preferred stock prior to the Biofuels Merger on February 26, 2010. All prior undistributed dividends were cancelled as part of the merger agreement.
Fiscal year ended December 31, 2010 and fiscal year ended December 31, 2009
Set forth below is a summary of certain financial information (in thousands) for the periods indicated:
| Twelve Months Ended December 31, |
||||||||
| 2010 | 2009 | |||||||
| Revenues |
||||||||
| Biodiesel |
$ | 207,902 | $ | 109,027 | ||||
| Biodiesel government incentives |
7,240 | 19,465 | ||||||
|
|
|
|
|
|||||
| Total biodiesel |
215,142 | 128,492 | ||||||
| Services |
1,313 | 3,009 | ||||||
|
|
|
|
|
|||||
| Total |
216,455 | 131,501 | ||||||
|
|
|
|
|
|||||
| Cost of goods sold |
||||||||
| Biodiesel |
194,016 | 127,373 | ||||||
| Services |
807 | 1,177 | ||||||
|
|
|
|
|
|||||
| Total |
194,823 | 128,550 | ||||||
|
|
|
|
|
|||||
| Gross profit |
21,632 | 2,951 | ||||||
| Selling, general and administrative expenses |
22,187 | 25,565 | ||||||
| Gain on sale of assets—related party |
— | (2,254 | ) | |||||
| Impairment of assets |
7,494 | 833 | ||||||
|
|
|
|
|
|||||
| Loss from operations |
(8,049 | ) | (21,193 | ) | ||||
| Other income (expense) |
(16,102 | ) | (1,364 | ) | ||||
| Income tax benefit (expense) |
3,252 | (45,212 | ) | |||||
| Loss from equity investments |
(689 | ) | (1,089 | ) | ||||
|
|
|
|
|
|||||
| Net loss |
(21,588 | ) | (68,858 | ) | ||||
| Net loss attributable to non-controlling interests |
— | 7,953 | ||||||
|
|
|
|
|
|||||
| Net loss attributable to REG |
(21,588 | ) | (60,905 | ) | ||||
| Effects of recapitalization |
8,521 | — | ||||||
| Accretion of preferred stock to redemption value |
(27,239 | ) | (44,181 | ) | ||||
|
|
|
|
|
|||||
| Net loss attributable to the company’s common stockholders |
$ | (40,306 | ) | $ | (105,086 | ) | ||
|
|
|
|
|
|||||
During 2009, Blackhawk was consolidated in our financial results. During first quarter 2010, Blackhawk was excluded from our financial results until the date of the Blackhawk Merger, February 26, 2010. After February 26, 2010, Blackhawk was included in our financial results. See “Note 5—Blackhawk” and “Note 7—Variable Interest Entities” in our audited consolidated financial statements for additional information relating to the Blackhawk consolidation.
62
Table of Contents
Management’s discussion and analysis of financial condition and results of operations
Revenues. Our total revenues increased $85.0 million, or 65%, to $216.5 million in 2010, from $131.5 million in 2009. This increase was due to an increase in biodiesel revenues, offset by a small decrease in services revenues, as follows:
Biodiesel. Biodiesel revenues including government incentives increased $86.6 million, or 67%, to $215.1 million during the year ended December 31, 2010, from $128.5 million for the year ended December 31, 2009. This increase in biodiesel revenues was due to an increase in both average selling price and gallons sold. As a result of higher energy prices during 2010, the average sales price per gallon increased $0.57, or 22%, to $3.16, compared to $2.59 during 2009. The increase in sale price from 2009 to 2010 contributed to a $25.4 million revenue increase when applied to the number of 2009 gallons sold. Total gallons sold increased 34% to 59.5 million gallons during 2010 from 44.5 million gallons during 2009. The increase in gallons sold was primarily the result of additional demand. At 2010 pricing, the additional gallons sold in 2010 represented $47.4 million in additional revenues. We produced and sold 54.1 million gallons at our owned or leased facilities during 2010; compared to 41.5 million gallons at our owned or tolling facilities during 2009, which represents an increase of 12.6 million gallons, or 30.4%. We also purchased 5.4 million gallons of third party product in 2010 and 3.0 million gallons in 2009. During 2010 under a tolling arrangement, our Houston facility shipped 8.2 million gallons compared to 14.0 million gallons during 2009. For a description of “tolling arrangements,” see “—Critical Accounting Policies—Revenue Recognition.” As a result of these shipments, we earned toll fee revenues $3.8 million during 2010, and $5.6 million during 2009. We had biodiesel government incentives revenue of $3.6 million during fourth quarter 2010 due to the reenactment of the blenders’ tax credit on December 17, 2010. We expect to continue to increase production based on anticipated additional demand for our product as a result of the implementation of RFS2.
Services. Services revenues decreased $1.7 million, or 57%, to $1.3 million for the year ended December 31, 2010, from $3.0 million for the year ended December 31, 2009. Our revenues generated from management services decreased during 2010 due to decreased production at the third party plants driven by the expiration of the blenders’ tax credit and due to the termination of the MOSA arrangements.
Cost of goods sold. Our cost of goods sold increased $66.2 million, or 51%, to $194.8 million for the year ended December 31, 2010, from $128.6 million for the year ended December 31, 2009. This increase was primarily due to costs associated with the increase in gallons sold in the 2010 period as follows:
Biodiesel. Biodiesel cost of goods sold increased $66.6 million, or 52%, to $194.0 million for the year ended December 31, 2010, compared to $127.4 million for the year ended December 31, 2009. The increase in cost of goods sold is primarily the result of additional gallons sold in the 2010 period as outlined above and an increase in feedstock prices. Average animal fat costs for 2010 and 2009 were $0.30 and $0.24 per pound, respectively. Average soybean oil costs for 2010 and 2009 were $0.38 and $0.33 per pound, respectively. We had losses of $1.2 million from hedging activity during 2010, compared to a loss of $1.1 million from hedging activities in 2009. Hedge gains and losses are generally offset by other corresponding changes in gross margin through changes in either biodiesel sales price and/or feedstock price.
Services. Cost of services decreased $0.4 million, or 33%, to $0.8 million for the year ended December 31, 2010, from $1.2 million for the year ended December 31, 2009. We had limited construction activity during 2010 and minimal associated costs. Costs incurred to perform services under the MOSAs decreased due to reduced employee costs stemming from the termination of our MOSAs during 2010.
63
Table of Contents
Management’s discussion and analysis of financial condition and results of operations
Selling, general and administrative expenses. Our SG&A expenses were $22.2 million for the year ended December 31, 2010, compared to $25.6 million for the year ended December 31, 2009. The decrease was primarily due to our 2009 expenses including the consolidation of Blackhawk SG&A expenses, which although still included in expenses during 2010, have been greatly reduced due to the completion of the Blackhawk Merger and start up of the facility. SG&A was further reduced by other cost cutting measures undertaken by management during 2010, which reduced wages by $1.4 million and reduced information technology expenses by $0.6 million during 2010.
Gain on sale of assets—related party. In July 2009, we sold our Stockton, California terminal facility to Westway Feed Products, Inc., or Westway, for $3.0 million in cash. We recognized a gain on the sale of this asset of $2.3 million. We had no similar sales in 2010.
Impairment of Long Lived and Intangible Assets. During 2010, the raw material supply agreements for the New Orleans and Emporia facilities were cancelled. The original agreements were recorded as an intangible asset in the amount of $7.0 million. As a result of the cancellations the full amount was charged off during the three months ended December 31, 2010. We also impaired deferred financing costs related to the New Orleans project because we determined that it was unlikely that the previously contemplated Gulf Opportunity Zone bond financing, available as part of Congress’ tax incentive program to help the Gulf Coast recover from Hurricane Katrina, would be completed prior to the deadline. The amount of the impairment for 2010 was $0.3 million.
Other income (expense), net. Other expense was $16.1 million for the year ended December 31, 2010 and $1.4 million during the year ended December 31, 2009. Other income and expense is primarily comprised of the changes in fair value of the Series A preferred stock conversion feature embedded derivative, changes in fair value of the Seneca Holdco, LLC liability, interest expense, interest income, and the other non-operating items. The change in fair value of the Series A preferred stock conversion feature embedded derivative resulted in $8.2 million expense for year ended December 31, 2010, compared $2.3 million expense for the year ended December 31, 2009. The change in the fair value of the Seneca Holdco, LLC liability for the year ending December 31, 2010, was an expense of $4.2 million. Interest expense increased $2.5 million to $4.9 million for the year ended December 31, 2010, from $2.4 million for the year ended December 31, 2009. This increase was primarily attributable to the Seneca Transaction during the second quarter of 2010, the $49.4 million of debt assumed in connection with the Blackhawk Merger and the CIE Asset Acquisition during the first quarter of 2010. Other income and expense during 2009 included $1.4 million of miscellaneous income from the release of an escrow related to our Stockton terminal facility that occurred in the first half of 2009 and grant income of $1.0 million. In addition, during 2010 we fully wrote off our investment in East Fork Biodiesel, LLC for an additional expense of $0.4 million.
Income tax benefit (expense). We recorded income tax expense for the year ended December 31, 2009 due to the full valuation allowance against the income tax expense. Income tax benefit was $3.3 million for the year ending December 31, 2010, compared to income tax expense of $45.2 million for the year ended December 31, 2009. Deferred tax liabilities were recorded as a result of the Blackhawk Merger and CIE Asset Purchase. As the deferred tax liabilities were recorded, the resulting decrease in net deferred tax assets required a lower valuation allowance. The release of the associated valuation allowance resulted in an income tax benefit. The income tax expense for the year ended December 31, 2009 was the result of our recording a full valuation allowance for our deferred tax assets.
Loss from equity investments. Loss from equity investments was $0.7 million for the year ended December 31, 2010 and $1.1 million for the year ended December 31, 2009.
64
Table of Contents
Management’s discussion and analysis of financial condition and results of operations
Non-controlling interest. Net benefit from the removal of non-controlling interests was $8.0 million for the year ended December 31, 2009, resulting from the consolidation of Blackhawk in 2009. In 2010, there was no income or loss from non-controlling interest due to our acquisition of Blackhawk.
Effects of Biofuels Merger Recapitalization. We recorded the effects from recapitalization of $8.5 million resulting from the Biofuels Merger in 2010. To account for the exchange of the then-existing series of preferred shares for the newly issued series of preferred shares, we compared the fair value of the preferred shares issued to the carrying amount of the preferred and common shares that were redeemed. The excess of the carrying amount of preferred and common shares that were redeemed over the fair value of the preferred shares that were issued was recorded as an increase to additional paid-in capital and was added to net earnings available to common shareholders.
Preferred stock accretion. Preferred stock accretion was $27.2 million for the year ended December 31, 2010, compared to $44.2 million for the year ended December 31, 2009. The accretion amount increases as the redemption date becomes closer due to the use of the effective interest rate method. Accretion during 2009 was higher based on the previous redemption date of August 1, 2011. During 2010, we accreted two months of the previously issued REG Biofuels, Inc. preferred stock (redemption date of August 1, 2011) and ten months of newly issued Series A preferred stock (redemption date February 26, 2014). Monthly accretion expense decreased after issuance of our new Series A preferred stock as a result of the new redemption amount and redemption date.
Fiscal year ended December 31, 2009 and fiscal year ended December 31, 2008
Set forth below is a summary of certain financial information (in thousands) for the periods indicated:
| Twelve Months Ended December 31, |
||||||||
| 2009 | 2008 | |||||||
| Revenues |
||||||||
| Biodiesel |
$ | 109,027 | $ | 69,509 | ||||
| Biodiesel government incentives |
19,465 | 6,564 | ||||||
|
|
|
|
|
|||||
| Total biodiesel |
128,492 | 76,073 | ||||||
| Services |
3,009 | 9,379 | ||||||
|
|
|
|
|
|||||
| Total |
131,501 | 85,452 | ||||||
|
|
|
|
|
|||||
| Cost of goods sold |
||||||||
| Biodiesel |
127,373 | 78,736 | ||||||
| Services |
1,177 | 4,470 | ||||||
|
|
|
|
|
|||||
| Total |
128,550 | 83,206 | ||||||
|
|
|
|
|
|||||
| Gross profit |
2,951 | 2,246 | ||||||
| Selling, general and administrative expenses |
25,565 | 24,048 | ||||||
| Gain on sale of assets—related party |
(2,254 | ) | — | |||||
| Impairment of assets |
833 | 160 | ||||||
|
|
|
|
|
|||||
| Loss from operations |
(21,193 | ) | (21,962 | ) | ||||
| Other income (expense) |
(1,364 | ) | (2,318 | ) | ||||
| Income tax benefit (expense) |
(45,212 | ) | 9,414 | |||||
| Loss from equity investments |
(1,089 | ) | (1,013 | ) | ||||
|
|
|
|
|
|||||
| Net loss |
(68,858 | ) | (15,879 | ) | ||||
| Net loss attributable to non-controlling interests |
7,953 | 2,788 | ||||||
|
|
|
|
|
|||||
| Net loss attributable to REG |
(60,905 | ) | (13,091 | ) | ||||
| Less—accretion of preferred stock to redemption value |
(44,181 | ) | (26,692 | ) | ||||
|
|
|
|
|
|||||
| Net loss attributable to the Company’s common stockholders |
$ | (105,086 | ) | (39,783 | ) | |||
|
|
|
|
|
|||||
65
Table of Contents
Management’s discussion and analysis of financial condition and results of operations
During 2008 and 2009, Blackhawk was consolidated in our financial results.
Revenues. Our total revenues increased $46.0 million, or 54%, to $131.5 million for the year ended December 31, 2009 from $85.5 million for the year ended December 31, 2008. This increase was due to an increase in revenues from the Biodiesel segment and a decrease in revenues from the Services segment, as follows:
Biodiesel. Biodiesel revenues including government incentives increased $52.4 million, or 69%, to $128.5 million for the year ended December 31, 2009 from $76.1 million for the year ended December 31, 2008. This increase in biodiesel revenue was primarily due to an increase in gallons sold. Gallons sold increased 253% from 12.6 million gallons during 2008 to 44.5 million gallons during 2009, excluding gallons tolled at our Houston facility. At 2009 pricing levels, the increase in gallons from 2008 to 2009 accounted for a revenue increase of $82.6 million. The increase in gallons sold is primarily the result of finished biodiesel produced by CIE and Blackhawk for us under tolling arrangements of 23.7 million gallons during 2009. For a description of “tolling arrangements”, see “Critical Accounting Policies—Revenue Recognition.” Our acquisition of the Houston facility in June 2008 resulted in 6.0 million gallons of production for our account during 2009, compared to zero gallons during 2008. The overall increase in gallons sold was partially offset by a reduction in our average B100 sales price from $4.46 in 2008 to $2.59 in 2009, reflecting lower market pricing. The decrease in sale price from 2008 to 2009 contributed to a $23.6 million revenue decrease when applied to 2008 gallons sold. Under the Houston facility’s tolling arrangement we produced 14.0 million gallons, during 2009, at our Houston facility compared to 8.8 million gallons during the same period of 2008. As a result of this production, revenues include an average toll fee of $0.40 per gallon.
Services. Services revenues decreased $6.4 million, or 68%, to $3.0 million for the year ended December 31, 2009 from $9.4 million for the year ended December 31, 2008 almost entirely as a result of lower construction management services revenues due to decreased construction activity. The consolidation of Blackhawk as of May 9, 2008 resulted in the elimination for financial reporting purposes of all construction revenue related to the Blackhawk construction project, which, prior to the elimination represented substantially all of our construction revenues in 2009. In the first nine months of 2008, REG recognized $2.5 million of revenue from construction services including completion activities related to one other facility. Revenues generated from management services we provided to third party owned facilities were $1.6 million for the year ended December 31, 2009, compared to $3.7 million for the year ended December 31, 2008. This decrease was due to decreased production at the third party plants driven by the narrowing of the spread between feedstock and biodiesel prices.
Cost of goods sold. Our cost of goods sold increased $45.4 million, or 55%, to $128.6 million for the year ended December 31, 2009 from $83.2 million for the year ended December 31, 2008. This increase is due to an increase in cost of goods sold in the Biodiesel segment, partially offset by lower cost of services, as follows:
Biodiesel. Biodiesel costs of goods sold increased $48.7 million, or 62%, to $127.4 million for the year ended December 31, 2009 from $78.7 million for the year ended December 31, 2008. The increase in cost of goods sold is primarily the result of additional gallons sold in the 2009 periods as outlined above. Cost of goods during 2009 includes $59.4 million of cost of goods for 23.7 million gallons produced through tolling arrangements with others. Increases in gallons were offset mostly by average feedstock price reductions. Average feedstock cost for the year ended December 31, 2008 was $0.48 per pound, reflecting high soybean oil prices as we did not process a significant amount of animal fat in 2008. Average feedstock cost for the year ended December 31, 2009 was $0.33 per pound for soybean oil, which represents an approximate 31% cost reduction for soybean oil
66
Table of Contents
Management’s discussion and analysis of financial condition and results of operations
compared to 2008. The remaining feedstock cost reduction was due to use of inedible animal fat under the tolling arrangements during 2009, which is generally a lower cost feedstock. Average inedible animal fat cost during 2009 was $0.24 per pound. Risk management gains and losses, which offset costs of goods sold, were approximately $1.1 million of losses for 2009, compared to $0.4 million of gains for 2008. Hedge gains and losses are generally offset by other corresponding changes in gross margin through changes in either biodiesel sales price and/or feedstock price.
Services. Cost of services decreased $3.3 million, or 73%, to $1.2 million for the year ended December 31, 2009 from $4.5 million for the year ended December 31, 2008. The decrease in cost of services revenue was attributable to decreased construction activity in 2009. Costs incurred to perform services under the MOSAs were consistent for both periods as we provided services to the same number of third party facilities in each period.
Selling, general and administrative expenses. Our SG&A expense increased $1.6 million, or 7%, to $25.6 million for the year ended December 31, 2009 from $24.0 million for the year ended December 31, 2008. The increase was attributable to a $4.3 million increase in professional expenses for the year ending December 31, 2009 compared to year ending December 31, 2008. This increase is almost entirely related to the consolidation transactions during 2009. Costs also increased due to the inclusion of $2.8 million in expenses relating to Blackhawk in 2009 compared to $1.3 million during 2008. Also, during the first quarter of 2009, we collected a doubtful receivable account which was accounted for as a $1.5 million decrease to SG&A expenses.
Gain on sale of assets—related party. In July 2009, we sold the Stockton terminal facility to Westway for $3.0 million in cash. We recognized a gain on the sale of this asset of $2.3 million. We had no similar sale in 2008.
Impairment of Long Lived and Intangible Assets. Impairment of long lived assets increased $0.6 million, to $0.8 million for the year ended December 31, 2009 from $0.2 million for the year ended December 31, 2008. The $0.8 million impairment in 2009 related to a write off of construction inventory. The $0.2 million impairment in 2008 related to a partial write off of abandoned capital assets.
Other income (expense), net. Other income and expense was $1.4 million of expense for the year ended December 31, 2009 and $2.3 million of expense for the year ended December 31, 2008. Other expense is primarily comprised of the changes in fair value of the preferred stock conversion feature embedded derivative, interest expense, interest income, and the other non-operating items. The change in fair value of the preferred stock conversion feature embedded derivative resulted in expense of $2.3 million for the year ending December 31, 2009, compared to income of $2.1 million for the year ending December 31, 2008. The expense was recorded as a result of a net increase in the fair market value of our common stock. The change in fair value of interest rate swap recognized a gain of $0.4 million for the year ended December 31, 2009 and a loss of $1.4 million for the year ended December 31, 2008 as a result of the consolidation of Blackhawk into our financial statements. Interest expense increased $0.5 million, to $2.4 million for the year ended December 31, 2009 from $1.9 million for the year ended December 31, 2008. This increase was primarily attributable to new debt of $1.8 million for 2009 and interest paid to TSW, LLC during 2009 and the consolidation of Blackhawk into our financial statements, which accounted for $0.2 million in interest expense for 2008. We incurred impairment of investments of $0.2 million for the year ended December 31, 2009 versus $1.4 million for the year ended December 31, 2008 related to a write down of our investment in East Fork Biodiesel, LLC. Other income during 2009 included $1.4 million of miscellaneous income relating to release of an escrow related to REG’s Stockton terminal facility that occurred in the first quarter and $1.0 million of grant income.
67
Table of Contents
Management’s discussion and analysis of financial condition and results of operations
Income tax (expense) benefit. Income tax expense was $45.2 million for the year ended December 31, 2009 compared to an income tax benefit of $9.4 million for the year ended December 31, 2008. The expense was a result of our conclusion as of December 31, 2009 that we were required to establish a valuation allowance for the entire amount of the net deferred tax assets since evidence was not available to prove that it was more likely than not that we would be able to realize these assets.
Loss from equity investments. Loss from equity investments was $1.1 million for the year ended December 31, 2009 compared to a loss of $1.0 million for the year ended December 31, 2008. The loss from equity investments was primarily attributable to losses sustained by partially owned facilities.
Non-controlling interest. Non-controlling interest was $8.0 million for the year ended December 31, 2009 compared to a loss of $2.8 million for the year ended December 31, 2008. The increase in non-controlling interest was primarily attributable to the losses sustained by Blackhawk which were consolidated.
Preferred stock accretion. Preferred stock accretion was $44.2 million for the year ended December 31, 2009, compared to $26.7 million for the year ended December 31, 2008. Accretion of preferred stock to redemption value increased during 2009 due to the full year impact of issuances of preferred stock during 2008, as well as the impact of using the effective interest rate method. As the redemption date becomes closer, the accretion amount increases.
LIQUIDITY AND CAPITAL RESOURCES
Sources of liquidity. Since inception, a significant portion of our operations have been financed through the sale of our capital stock. From August 1, 2006 through June 30, 2011, we received cash proceeds of $132.2 million from private sales of preferred stock and common stock. Based on available funds, current plans and business conditions, we believe that our available cash, amounts available under our credit agreement and amounts expected to be generated from future operations will be sufficient to meet our cash requirements for at least the next twelve months. At June 30, 2011 and December 31, 2010, we had cash and cash equivalents of $9.1 million and $4.3 million, respectively. At June 30, 2011, we had total assets of $403.9 million, compared to total assets of $369.6 million at December 31, 2010. At June 30, 2011, we had debt of $99.9 million, compared to debt of $96.1 million at December 31, 2010. In addition, in August 2011, REG Albert Lea borrowed and we guaranteed $10.0 million of debt that will be used for working capital at our Albert Lea facility. This REG Albert Lea debt matures in December 2011.
Our borrowings (in millions) are as follows:
| June 30, 2011 |
December 31, 2010 |
|||||||
| Revolving lines of credit |
$ | 10.6 | $ | 9.5 | ||||
| REG Danville term loan |
22.8 | 23.6 | ||||||
| REG Newton term loan |
23.3 | 23.6 | ||||||
| Other |
2.3 | 3.1 | ||||||
|
|
|
|
|
|||||
| Total notes payable |
$ | 59.0 | $ | 59.8 | ||||
|
|
|
|
|
|||||
| Seneca Landlord term loan |
$ | 36.3 | $ | 36.3 | ||||
| Bell, LLC promissory note |
4.6 | — | ||||||
|
|
|
|
|
|||||
| Total notes payable—variable interest entities |
$ | 40.9 | $ | 36.3 | ||||
|
|
|
|
|
|||||
68
Table of Contents
Management’s discussion and analysis of financial condition and results of operations
On February 26, 2010, in connection with the Blackhawk Merger, one of our subsidiaries, REG Danville, assumed a $24.6 million term loan and a $5.0 million revolving credit line with Fifth Third Bank. As of June 30, 2011, there was $22.8 million of principal outstanding under the term loan. On November 30, 2010, the revolving credit line expired. The Illinois Finance Authority guarantees 61% of the term loan and the loan is secured by our Danville facility. The term loan bears interest at a fluctuating rate per annum equal to LIBOR plus the applicable margin of 4%. Until June 30, 2010, REG Danville was required to make only monthly payments of accrued interest. Beginning on July 1, 2010, REG Danville was required to make monthly principal payments equal to $135,083 plus accrued interest. In addition to these monthly payments, as a result of the amendment to the loan agreement dated February 26, 2010, REG Danville is required to make annual principal payments equal to 50% of REG Danville’s Excess Cash Flow (as defined in the loan agreement), or the 50% Excess Payment, with respect to each fiscal year until $2.5 million has been paid from the Excess Cash Flow. Thereafter, REG Danville is required to make annual payments equal to 25% of its Excess Cash Flow. Excess Cash Flow is equal to EBITDA less certain cash payments made during the period including principal payments, lease payments, interest payments, tax payments, approved distributions and capital expenditures. REG Danville did not have Excess Cash Flow during 2010 and no amounts have been accrued or paid. REG Danville is subject to various loan covenants that restrict its ability to take certain actions, including prohibiting it from paying any dividend to us until the 50% Excess Payment is made and certain financial ratios are met. We are currently in negotiations to renew the term loan, which matures on November 3, 2011.
On March 8, 2010, in connection with the CIE Asset Acquisition, one of our subsidiaries, REG Newton, refinanced a $23.6 million term loan, or the AgStar Loan, and obtained a $2.4 million line of credit, or the AgStar Line, with AgStar Financial Service, PCA, or AgStar. As of June 30, 2011, there was $23.3 million of principal outstanding under the AgStar Loan and $0.6 million of principal outstanding under the AgStar Line. These amounts are secured by our Newton facility. We have guaranteed the obligations under the AgStar Line and have a limited guarantee related to the obligations under the AgStar Loan, which provides that we will not be liable for more than the unpaid interest, if any, on the AgStar Loan that has accrued during an 18-month period beginning on March 8, 2010. The AgStar Loan bears interest at 3% plus the greater of (i) LIBOR or (ii) two percent. Beginning on October 1, 2011, monthly principal payments of approximately $120,000 and accrued interest are due based on a 12-year amortization period. Under the AgStar Loan, REG Newton is required to maintain a debt service reserve account, or the Debt Reserve, equal to 12-monthly payments of principal and interest on the AgStar Loan. Beginning on January 1, 2011 and at each fiscal year end thereafter, until such time as the balance in the Debt Reserve contains the required 12-months of payments, REG Newton must deposit an amount equal to REG Newton’s Excess Cash Flow, which is defined in the AgStar Loan agreement as EBITDA, less the sum of required debt payments, interest expense, any increase in working capital from the prior year until working capital exceeds $6.0 million, up to $0.5 million in maintenance capital expenditure, allowed distributions and payments to fund the Debt Reserve. In the event any amounts are past due, AgStar may withdraw such amounts from the Debt Reserve. REG Newton was not required to make a Debt Reserve deposit for 2010. REG Newton is subject to various standard loan covenants that restrict its ability to take certain actions, including prohibiting REG Newton from making any cash distributions to us in excess of 35% of REG Newton’s net income for the prior year. On November 15, 2010, REG Newton amended the loan agreement to revise certain financial covenants. In exchange for these revisions, REG Newton agreed to begin reduced principal payments of approximately $60,000 per month within two months after the enactment of the reinstated blenders’ tax credit. REG Newton began such principal payments on March 1, 2011. The AgStar Loan matures on March 8, 2013 and the AgStar Line expires on March 5, 2012, which was extended for one year on March 7, 2011. The AgStar Line is secured by REG Newton’s accounts receivable and inventory.
69
Table of Contents
Management’s discussion and analysis of financial condition and results of operations
During July 2009, we and certain subsidiaries entered into an agreement with Bunge to provide services related to the procurement of raw materials and the purchase and resale of biodiesel produced. The agreement provides for Bunge to purchase up to $10.0 million in feedstock for, and biodiesel from, us. Feedstock is paid for daily as it is processed. Biodiesel is purchased and paid for by Bunge the following day. In June 2009, we entered into an extended payment terms agreement with West Central to provide up to $3.0 million in outstanding payables for up to 45 days. Both of these agreements provide additional working capital resources to us. As of June 30, 2011, we had $8.0 million outstanding under these agreements.
We and certain of our subsidiaries entered into a Revolving Credit Agreement, or the WestLB Revolver, dated as of April 8, 2010, with WestLB, AG. We guarantee the WestLB Revolver. The initial available credit amount under the WestLB Revolver is $10 million with additional lender increases up to a maximum commitment of $18 million. Advances under the WestLB Revolver are limited to the amount of certain of our qualifying assets that secure amounts borrowed. The WestLB Revolver requires that we maintain compliance with certain financial covenants. The term of the WestLB Revolver is two years. The interest rate varies depending on the loan type designation and is either 2.0% over the higher of 50 basis points above the Federal Funds Effective Rate or the WestLB prime rate for Base Rate loans or 3.0% over adjusted LIBOR for Eurodollar loans. The WestLB Revolver is secured by assets and ownership interests of our subsidiaries. As of June 30, 2011, we had $10.0 million outstanding under the WestLB Revolver and we and our subsidiaries were in compliance with all of the financial covenants associated therewith.
In connection with our agreement to lease the Seneca facility, Landlord, or the entity that owns the Seneca facility, received from Seneca Holdco, LLC, which is owned by three of our investors, an investment of $4.0 million at closing to fund certain repairs to the Seneca facility. Landlord leases the Seneca facility to our subsidiary, REG Seneca, with rent being set at an amount to cover debt service and other expenses. REG Seneca pays Landlord, who pays the fee to Seneca Holdco, LLC, a $600,000 annual fee, payable quarterly, which is guaranteed by us. See “Note 5—Variable Interest Entities” to our condensed consolidated financial statements for additional information.
On April 8, 2010, Landlord entered into a note payable agreement with West LB. The note requires that interest be accrued at different rates based on whether it is a Base Rate Loan or Eurodollar loan. Interest is at either 2.0% over the higher of 50 basis points above the Federal Funds Effective Rate or the WestLB prime rate for Base Rate loans or 3.0% over adjusted LIBOR for Eurodollar loans. The loan was a Eurodollar loan as of June 30, 2011. The effective rate at June 30, 2011 was 3.19%. Interest is paid monthly. Principal payments have been deferred until February 2012. At that time, Landlord will be required to make monthly principal payments of $201,389, with the remaining unpaid principal due at maturity on April 8, 2017. The note payable is secured by the Seneca facility. The balance of the note as of June 30, 2011 was $36.3 million.
The Company has 50% ownership in Bell, LLC, a VIE joint venture that owns and leases to the Company its corporate office building located in Ames, Iowa. Commencing January 1, 2011, the Company has the right to execute a call option with the joint venture member, Dayton Park, LLC, to purchase Bell, LLC; therefore, the Company determined it was the primary beneficiary of Bell, LLC and consolidated Bell, LLC into the Company’s financial statements. The Company is the primary beneficiary due to its ownership interest and as a result of having an exercisable call option that allows us to direct the activities that most significantly impact Bell, LLC’s economic performance and gives the Company the majority of the benefit from the use of Bell, LLC’s assets. Through consolidation of Bell, LLC on January 1, 2011, the Company recorded an outstanding promissory note balance of $4.8 million. Bell,
70
Table of Contents
Management’s discussion and analysis of financial condition and results of operations
LLC makes monthly principal payments of approximately $15,000 plus interest. The note bears interest at a rate of 5.125% per annum and the note matures February 15, 2013. The note is secured by a mortgage interest in the office building and has an outstanding balance of $4.6 million at June 30, 2011.
As of June 30, 2011, we were in compliance with all restrictive financial covenants associated with the borrowings as of June 30, 2011.
In addition, in August 2011, REG Albert Lea borrowed and we guaranteed $10.0 million that will be used for working capital at our Albert Lea facility. This REG Albert Lea debt matures in December 2011. For a discussion of the terms of this debt, see the section entitled “Certain relationships and related party transactions — USRG.”
Cash flow. The following table presents information regarding our cash flows and cash and cash equivalents for the years ended December 31, 2010, 2009 and 2008 and the six months ended June 30, 2011 and 2010:
| Year Ended December 31, | Six Months Ended June 30, |
|||||||||||||||||||
| 2010 | 2009 | 2008 | 2011 | 2010 | ||||||||||||||||
| (in thousands) | ||||||||||||||||||||
| Net cash flows from operating activities |
$ | (14,593 | ) | $ | (8,209 | ) | $ | (3,636 | ) | $ | 6,926 | $ | (2,105 | ) | ||||||
| Net cash flows from investing activities |
(4,562 | ) | 371 | (26,173 | ) | (787 | ) | (1,394 | ) | |||||||||||
| Net cash flows from financing activities |
17,559 | (1,618 | ) | 26,155 | (1,273 | ) | 2,929 | |||||||||||||
| Net change in cash and cash equivalents |
(1,596 | ) | (9,456 | ) | (3,654 | ) | 4,866 | (570 | ) | |||||||||||
| Cash and cash equivalents, end of period |
$ | 4,259 | $ | 5,855 | $ | 15,311 | $ | 9,125 | $ | 5,285 | ||||||||||
Operating activities. Net cash provided in operating activities was $6.9 million and net cash used in operating activities was $2.1 million for the six months ended June 30, 2011 and 2010, respectively. The increase in cash provided from operating activities is largely related to improved operating margins realized from an increase in market demand, gallons sold and plant utilization. For the six months ended June 30, 2011, net income was $2.8 million, which includes depreciation and amortization expense of $4.0 million, stock compensation expense of $2.0 million, a increase in the non-cash change in the preferred stock embedded derivative liability of $17.1 million and a increase in the non-cash change in the Seneca Holdco liability of $1.2 million. We also used $20.9 million to fund net working capital requirements, consisting of a $12.0 million increase in inventory due to increase sales volume, $7.9 million increase in accounts receivable, a $6.7 million increase in prepaid expenses and a decrease in deferred revenues of $7.7 million, which was partially offset by a $12.0 million increase in accounts payable. The net result was a cash source from operations of $6.9 million.
The net use of cash from operating activities for the six months ended June 30, 2010 of $2.1 million reflects $2.7 million in net income from operations, primarily offset by a deferred tax benefit of $3.7 million, depreciation and amortization expense of $2.3 million and $5.0 million change in the fair value of preferred stock conversion feature embedded derivative. It also included a net working capital increase of $0.3 million which included an accounts receivable decrease of $8.2 million and an increase in accrued expenses of $3.5 million, which were partially offset by an accounts payable decrease of $5.3 million and deferred revenue decrease of $5.5 million.
Net cash used in operating activities was $14.6 million and $8.2 million for the year ended December 31, 2010 and 2009, respectively. For 2010, net loss was $21.6 million which includes non-cash charges for impairment of intangible assets of $7.3 million, depreciation and amortization expense of $5.9 million, non-cash change in the preferred stock embedded derivative liability of $8.2 million and non-cash change
71
Table of Contents
Management’s discussion and analysis of financial condition and results of operations
in the Seneca Holdco, LLC liability of $3.7 million. These charges were offset by non-cash benefits including a $3.3 million increase for changes in the deferred tax benefit. We also used $17.8 million to fund net working capital requirements, including an accounts receivable increase of $4.9 million, an increase in inventories of $15.9 million and a decrease in accounts payable of $3.9 million which were partially offset by an increase in deferred revenues of $3.4 million. This resulted in a net cash use from operations of $14.6 million for 2010. The net use of cash from operating activities during 2009, of $8.2 million resulted primarily from a $68.9 million net loss from operations, a $2.3 million gain on the sale of property, and changes in allowance for doubtful accounts of $1.4 million. Those were primarily offset by a charge to deferred taxes of $45.2 million. In addition, they were partially offset by net working capital decrease of $5.9 million, non-cash depreciation and amortization of $5.8 million and stock-based compensation expenses totaling $2.5 million. Working capital decreases were primarily a result of an increase in deferred revenues of $5.5 million, a decrease in prepaid expenses of $2.9 million and a decrease in accounts payable of $3.4 million, which was offset by an accounts receivable increase of $3.7 million. Cash used in operating activities in 2008 was $3.6 million, as a net loss of $15.9 million and $8.3 million in non-cash deferred tax benefits were partially offset by positive working capital changes of $13.6 million.
Investing activities. Net cash used for investing activities for the six months ended June 30, 2011 was $0.8 million, consisting of net cash used to pay for facility construction of $1.2 million and cash provided from the release of restricted cash in the amount of $0.4 million. Net cash used in investing activities for the six months ended June 30, 2010 was $1.4 million, consisting of cash paid for Seneca construction of $2.1 million partially offset by a certificate of deposit provided from the acquisition of CIE that relates to the Iowa Department of Economic Development loan and is restricted.
Net cash used for investing activities for the year ended December 31, 2010 was $4.6 million, consisting mostly of cash used to pay for Seneca construction of $4.0 million. Net cash provided from investing activities for the year ended December 31, 2009 was $0.4 million, as $7.4 million in facility construction costs for Danville were partially offset by receipt of $4.7 million from a construction escrow fund related to construction of the Danville facility. We also received $3.0 million for the sale of our Stockton terminal facility to Westway. Net cash used in investing activities for the year ended December 31, 2008 was $26.2 million. In 2008, we invested $67.2 million in construction of facilities, which includes $15.9 million from a construction escrow fund related to the Danville facility and $16.9 million related to the acquisition of USBG.
Financing activities. Net cash used from financing activities for the six months ended June 30, 2011 was $1.3 million, which includes $1.0 million in borrowings on our WestLB Revolver. This was offset by $2.0 million in principal payments in connection with the notes payable. Net cash provided from financing activities for the six months ended June 30, 2010 was $2.9 million, which includes $4.0 million cash proceeds received from the Seneca investors. This was partially offset by principal payments in connection with the note payable and amounts paid for debt issuance.
Net cash provided from financing activities for the year ended December 31, 2010 was $17.6 million, which represents $8.0 million cash investment from ARES Corporation, $4.0 million cash proceeds received from the Seneca investors and $9.4 million in borrowings on our line of credit. This was partially offset by principal payments in connection with the note payable and cash paid for debt issuance. Net cash used in financing activities for the year ended December 31, 2009 was $1.6 million, which consisted of the payoff of the WestLB borrowings of $1.8 million, pay down of notes payable of $0.8 million and changes in the balance of the REG Danville line of credit for a net result of $0.9 million. Net cash provided by financing activities was $26.2 million in 2008. In 2008, cash provided by financing
72
Table of Contents
Management’s discussion and analysis of financial condition and results of operations
activities related primarily to the issuance of the Blackhawk notes payable. In February 2008, we through two of our subsidiaries obtained the first line of credit from WestLB. Borrowings ranged from $1.3 million to $4.2 million during the one year loan period.
Capital expenditures. We plan to make significant capital expenditures when project financing becomes available to complete construction of three facilities, our New Orleans facility, our Emporia facility and our Clovis facility, with expected aggregate nameplate production capacity of 135 mmgy. We estimate completion of the New Orleans, Emporia and the Clovis facilities will require an estimated $130 to $140 million, excluding working capital. We also plan to undertake various facility upgrades when funding becomes available to further expand processing capabilities at our existing facilities, most significantly our Houston facility and our newly acquired Albert Lea facility.
We continue to be in discussions with lenders in an effort to enter into equity and debt financing arrangements to meet our projected financial needs for facilities under construction and capital improvement projects for our operating facilities. Since these discussions are ongoing, we are uncertain when or if financing will be available. The financing may consist of common or preferred stock, debt, project financing or a combination of these financing techniques. Additional debt would likely increase our leverage and interest costs and would likely be secured by certain of our assets. Additional equity or equity-linked financings would likely have a dilutive effect on our existing and future stockholders. It is likely that the terms of any project financing would include customary financial and other covenants on our project subsidiaries, including restrictions on the ability to make distributions, to guarantee indebtedness, and to incur liens on the plants of such subsidiaries.
Contractual Obligations
The following table describes our commitments to settle contractual obligations in cash as of December 31, 2010:
| Payments Due by Period | ||||||||||||||||||||
| Total | Less Than 1 Year |
Years 1-3 | Years 4-5 | More Than 5 Years |
||||||||||||||||
| (in thousands) | ||||||||||||||||||||
| Long Term Debt(1) |
$ | 99,774 | $ | 30,097 | $ | 36,660 | $ | 7,974 | $ | 25,043 | ||||||||||
| Operating Lease Obligation(2) |
89,214 | 7,268 | 23,799 | 15,005 | 43,142 | |||||||||||||||
| Purchase Obligation(3) |
18,087 | 10,039 | 8,048 | — | — | |||||||||||||||
| Other Long-Term Liabilities(4) |
2,201 | 160 | 301 | 80 | 160 | |||||||||||||||
|
|
|
|
|
|
|
|
|
|
|
|||||||||||
| $ | 209,276 | $ | 47,564 | $ | 68,808 | $ | 23,059 | $ | 68,345 | |||||||||||
|
|
|
|
|
|
|
|
|
|
|
|||||||||||
| (1) | See footnotes to the financial statements for additional detail. Includes fixed interest associated with these obligations. |
| (2) | Operating lease obligations consist of terminals, rail cars, vehicles, ground leases and the Ames office lease. |
| (3) | Purchase obligations for our production facilities and partially completed facilities. |
| (4) | Includes incentive compliance and other facility obligations. Also, represents $1.5 million of liability for unrecognized tax benefits as the timing and amounts of cash payments are uncertain the amounts have not been classified by period. |
On August 4, 2011, REG Albert Lea, LLC, one of our wholly-owned subsidiaries entered into a $10.0 million loan agreement to obtain short-term working capital in order to purchase feedstocks and chemicals for our biodiesel production facility. The note is due in full on December 15, 2011.
73
Table of Contents
Management’s discussion and analysis of financial condition and results of operations
OFF-BALANCE SHEET ARRANGEMENTS
We have no off-balance sheet arrangements.
RECENT ACCOUNTING PRONOUNCEMENTS
In June 2009, the FASB issued Accounting Standards Update, or ASU, No. 2009-17, Improvements to Financial Reporting by Enterprises Involved with Variable Interest Entities, which amends ASC Topic 810, “Consolidations”. This Statement requires a qualitative analysis to determine the primary beneficiary of a VIE. The analysis identifies the primary beneficiary as the enterprise that has both the power to direct the activities of a VIE that most significantly impact the VIE’s economic performance and the obligation to absorb losses or the right to receive benefits that could be significant to the VIE. The Statement also requires additional disclosures about an enterprise’s involvement in a VIE. The effective date was the beginning of fiscal year 2010. We adopted this statement effective January 1, 2010, which resulted in the deconsolidation of Blackhawk and additional disclosure requirements. See “Note 7—Variable Interest Entities” to our audited consolidated financial statements for additional information.
In January 2010, the FASB issued ASU No. 2010-06, “Fair Value Measurements and Disclosures,” which amends ASC Topic 820, adding new requirements for disclosures for Level 1 and 2 assets, separate disclosures of purchases, sales issuances, and settlements related to Level 3 measurements and clarification of existing fair value disclosures. ASU 2010-06 became effective for interim and annual periods beginning after December 15, 2009, except for the requirement to provide Level 3 activity of purchases, sales, issuances, and settlements on a gross basis, which is effective for fiscal years beginning after December 15, 2010. The adoption of this guidance did not have a material effect on our financial statements and we do not anticipate the remaining disclosures will have a material effect on our financial statements.
QUANTITATIVE AND QUALITATIVE DISCLOSURES ABOUT MARKET RISK
The primary objectives of our investment activity are to preserve principal, provide liquidity and maximize income without significantly increasing risk. Some of the securities we invest in are subject to market risk. This means that a change in prevailing interest rates may cause the principal amount of the investment to fluctuate. To minimize this risk, we maintain a portfolio of cash equivalents in short-term investments in money market funds.
Commodity Price Risk
Over the period from January 2007 through June 2011, average diesel prices based on Platts reported pricing for Group 3 (Midwest) have ranged from a high of approximately $4.10 per gallon reported in July 2008 to a low of approximately $1.03 per gallon in March 2009, with prices averaging $2.34 per gallon during this period. Over the period from January 2006 through June 2011, soybean oil prices (based on closing sales prices on the CBOT nearby futures, for crude soybean oil) have ranged from a high of $0.7040 per pound in March 2008 to a low of $0.2108 per pound in January 2006, with closing sales prices averaging $0.3987 per pound during this period. Over the period from January 2008 through June 2011, animal fat prices (based on prices from The Jacobsen Missouri River, for choice white grease) have ranged from a high of $0.5250 per pound in June 2011 to a low of $0.0950 per pound in December 2008, with sales prices averaging $0.3120 per pound during this period.
Higher feedstock prices or lower biodiesel prices result in lower profit margins and, therefore, represent unfavorable market conditions. Traditionally, we have not been able to pass along increased feedstock
74
Table of Contents
Management’s discussion and analysis of financial condition and results of operations
prices to our biodiesel customers. The availability and price of feedstocks are subject to wide fluctuations due to unpredictable factors such as weather conditions during the growing season, kill ratios, carry-over from the previous crop year and current crop year yield, governmental policies with respect to agriculture, and supply and demand.
We have prepared a sensitivity analysis to estimate our exposure to market risk with respect to our sales contracts, lower cost feedstock requirements, soybean oil requirements and the related exchange-traded contracts for 2010. Market risk is estimated as the potential loss in fair value, resulting from a hypothetical 10% adverse change in the fair value of our soybean oil and requirements and biodiesel sales. The results of this analysis, which may differ from actual results, are as follows:
| 2010 Volume (in millions) |
Units | Hypothetical Adverse Change in Price |
Change in Annual Gross Profit (in millions) |
Percentage Change in Gross Profit |
||||||||||||||||
| Biodiesel |
67.9 | gallons | 10 | % | $ | 19.2 | 87.2 | % | ||||||||||||
| Lower Cost Feedstocks |
398.3 | pounds | 10 | % | $ | 11.8 | 53.5 | % | ||||||||||||
| Soybean Oil |
40.5 | pounds | 10 | % | $ | 1.6 | 7.1 | % | ||||||||||||
Interest Rate Risk
We are subject to interest rate risk in connection with our $2.0 million loan from the proceeds of Variable Rate Demand Industrial Development Revenue Bonds, or IFA Bonds, issued by the Iowa Finance Authority to finance our Ralston facility. The IFA Bonds bear interest at a variable rate determined by the remarketing agent from time to time as the rate necessary to produce a bid for the purchase of all of the Bonds at a price equal to the principal amount thereof plus any accrued interest at the time of determination, but not in excess of 10% per annum. The interest rate on the bonds was 0.54% for the last week of December 2010. A hypothetical increase in interest rate of 10% would not have a material effect on our annual interest expense.
We are subject to interest rate risk relating to REG Danville’s $24.6 million term debt financing with Fifth Third Bank. The term loan bears interest at a fluctuating rate based on a range of rates above 30-day LIBOR and will mature on November 3, 2011. Interest will accrue on the outstanding balance of the term loan at 30-day LIBOR plus 400 basis points. Interest accrued on the outstanding balance of the loan at December 31, 2010 at 4.26%.
Blackhawk entered into an interest rate swap agreement in connection with the aforementioned term loan in May 2008. The agreement was assumed by REG Danville in the Blackhawk merger. The swap agreement effectively fixes the interest rate at 3.67% on a notional amount of approximately $20.7 million of REG Danville’s term loan through November 2011. The fair value of the interest rate swap agreement was $0.6 million and $1.0 million at December 31, 2010 and 2009, respectively, and is recorded in the other noncurrent liabilities. The interest rate swap agreement is not designated as a cash flow or fair value hedge. Gains and losses based on the fair value change in the interest rate swap agreement are recognized in the statement of operations as a change in the fair value of interest rate swap agreement. A hypothetical increase in interest rate of 10% would not have a material effect on our annual interest.
REG Newton is subject to interest rate risk relating to its $23.6 million term debt financing and its $2.4 million revolving line of credit both from AgStar. Interest will accrue on the outstanding balance of the term loan at 30-day LIBOR or 2.00%, whichever is higher, plus 300 basis points (effective rate at
75
Table of Contents
Management’s discussion and analysis of financial condition and results of operations
December 31, 2010 of 5.00%). The revolving line of credit accrues interest at 30-day LIBOR or 2.00%, whichever is higher, plus 300 basis points (effective rate at December 31, 2010 of 5.00%). A hypothetical increase in interest rate of 10% would not have a material effect on our annual interest expense.
REG Seneca is subject to interest rate risk relating to its lease payments for the Seneca facility. The lease provides that REG Seneca will pay rent in the amount of the interest payments due to WestLB from Landlord. The note requires that interest be accrued at different rates based on whether it is a Base Rate Loan or Eurodollar loan. Each Base Rate Loan accrues interest at a rate per annum equal to 2% plus the higher of (i) the Federal Funds Effective Rate plus 0.5% and (ii) the rate of interest in effect for such day as publicly announced from time to time by WestLB as its “prime rate”. Each Eurodollar Loan accrues interest at a rate per annum equal to 3.0% plus the greater of (a) one and one half percent (1.5%) per annum, and (b) the rate per annum obtained by dividing (x) LIBOR for such Interest Period and Eurodollar Loan, by (y) a percentage equal to (i) 100% minus (ii) the Eurodollar Reserve Percentage for such Interest Period. The loan was a Eurodollar Loan through December 31, 2010 (effective rate at December 31, 2010 of 3.26%). Interest is paid monthly. A hypothetical increase in interest rate of 10% would not have a material effect on our annual interest expense.
REG Marketing and Logistics Group, LLC and REG Services Group, LLC, together the WestLB Loan Parties, are subject to interest rate risk relating to their $10.0 million revolving line of credit from WestLB. The note requires that interest be accrued at different rates based on whether it is a Base Rate Loan or Eurodollar loan. Each Base Rate Loan shall accrue interest at a rate per annum equal to 2% plus the higher of (i) the Federal Funds Effective Rate plus 0.5% and (ii) the rate of interest in effect for such day as publicly announced from time to time by WestLB as its “prime rate”. Each Eurodollar Loan shall accrue interest at a rate per annum equal to 3.0% plus the greater of (a) one and one half percent (1.5%) per annum, and (b) the rate per annum obtained by dividing (x) LIBOR for such Interest Period and Eurodollar Loan, by (y) a percentage equal to (i) 100% minus (ii) the Eurodollar Reserve Percentage for such Interest Period. The loan was a Eurodollar Loan through December 31, 2010 (effective rate at December 31, 2010 of 3.26%). Interest is paid monthly. A hypothetical increase in interest rate of 10% would not have a material effect on our annual interest expense.
Inflation
To date, inflation has not significantly affected our operating results, though costs for petroleum-based diesel fuel, feedstocks, construction, labor, taxes, repairs, maintenance and insurance are all subject to inflationary pressures. Inflationary pressure in the future could affect our ability to sell the biodiesel we produce, maintain our production facilities adequately, build new biodiesel production facilities and expand our existing facilities as well as the demand for our facility construction management and operations management services.
76
Table of Contents
Biodiesel is an advanced biofuel made from renewable oils or fats, ranging from soybean oil to inedible waste oils and inedible animal fats. Biodiesel is a drop-in replacement for petroleum-based diesel fuel. Biodiesel is an environmentally friendly diesel fuel with physical and chemical properties similar to petroleum-based diesel fuel. Biodiesel can be blended with petroleum-based diesel or other petroleum-based distillate fuels like heating oil in any ratio and can also be used in its pure form. Biodiesel is simple to use, biodegradable and nontoxic.
According to the NBB, biodiesel is currently the only commercially significant RFS2-compliant biomass-based diesel fuel produced in the United States. Annual biodiesel production in the United States has increased from approximately 14 million gallons in 2003 to approximately 309 million gallons in 2010, according to data compiled by the EIA and is expected to increase significantly to meet the RFS2 biomass-based diesel requirement, which calls for 800 million gallons in 2011, increasing to a proposed 1.28 billion gallons in 2013.
Biodiesel has become a widely accepted global biofuel. In the United States, ASTM created ASTM D6751 as the official quality specification for pure biodiesel, or B100. Biodiesel has been registered with the EPA as a fuel and a fuel additive since 1998. The EU biodiesel industry began approximately 10 years prior to the United States biodiesel industry and has been a model for many of the programs adopted in the United States. EN 14214 is the quality standard used in the EU and serves as the international biodiesel standard.
KEY ADVANTAGES OF BIODIESEL
Biodiesel extends existing diesel fuel supplies and promotes United States energy independence
Biodiesel production in the United States enhances energy security through use of readily available domestic feedstocks. The growth in the supply of conventional petroleum-based diesel fuel is being outpaced by growing demand for diesel fuel. Global demand for petroleum, and diesel fuel in particular, is increasing, largely driven by increased demand from developing nations such as China and India. Distillate fuel is a general classification for one of the petroleum fractions produced in conventional petroleum distillation operations. It includes diesel fuels used in on-road and off-road diesel engines and fuel oils used primarily for space heating and electric power generation. World petroleum prices have risen and continue to fluctuate in response to supply insecurity, political unrest and the threat of attacks on oil infrastructure in major oil producing regions, particularly those located in the Middle East. By adding biodiesel to petroleum-based diesel fuel, refiners and distributors are able to increase the volume of diesel fuel available to meet consumer demand. The 309 million gallons of biodiesel produced in the United States in 2010 represents the equivalent of 7.4 million barrels of petroleum. Increased production and use of biodiesel in the United States displaces foreign oil imports and improves our energy independence.
Biodiesel is a drop-in fuel, compatible with existing diesel engines and the existing diesel fuel distribution infrastructure
Unlike ethanol, biodiesel is a drop-in replacement fuel. According to the NBB, biodiesel blends can generally be used in conventional diesel engines with no modifications to the engine. Industry associations, such as the American Trucking Association, the largest national association for the trucking industry, have adopted policies supporting the voluntary use of high quality biodiesel in low percentage blends.
77
Table of Contents
Industry overview
According to NBB, more than 20 engine manufacturers, including Cummins, Inc., Ford Motor Company, General Motors Corporation, Deere & Company, Mack Trucks, Inc., Mercedes-Benz USA, LLC, Volkswagen of America, Inc. and Volvo Truck Corporation, have approved biodiesel blends for use in their engines ranging from 5% biodiesel blends, or B5, to 20% biodiesel blends, or B20. Additionally, blends of B20 or higher are now accepted by several engine manufacturers. For blends higher than B20, minor engine modifications are sometimes necessary. Biodiesel and biodiesel blends can generally be transported using the same trucks, railcars and barges used to transport petroleum-based diesel and can be dispensed through the same terminals and retail pumps as petroleum-based diesel. Ethanol can currently only be used in blends up to 10% in a conventional gasoline engine, while diesel engines can use any blend of biodiesel, up to 100% pure biodiesel, or B100.
ASTM amended the definition of standard diesel fuel, ASTM D975, in October 2008 to include up to 5% biodiesel. ASTM also established a new specification, ASTM D7467, for blends of biodiesel between B6 and B20.
Biodiesel can be produced from a wide variety of feedstocks and promotes American agriculture
Biodiesel can be produced from a wide variety of feedstocks. Higher cost feedstock options include virgin vegetable oils, such as soybean, canola and palm oil. Lower cost feedstock options include inedible animal fats such as beef tallow, poultry fat, choice white grease derived from pork, and inedible corn oil, a co-product of corn ethanol production, and used cooking oils and greases from the restaurant and food processing industries. In 2007, according to the Asia-Pacific Economic Cooperation, 90% of the biodiesel produced in the United States was produced from soybean oil. Over the last three years, due to the high cost of soybean oil, several biodiesel companies, including us, began using lower cost feedstocks. By 2010, the volume of biodiesel produced in the United States from soybean oil decreased to approximately 50%, according to the South Dakota Soybean Association. The soybean oil and inedible animal fats that comprise the biodiesel industry’s feedstocks are co-products and by-products of meat and soybean meal production. As a result, biodiesel has become an important component of protein production and the larger agribusiness sector in general.
Biodiesel is environmentally friendly, safe to use and reduces emissions of greenhouse gases
Biodiesel is non-toxic and biodegradable. Under the Clean Air Act, the EPA established a health effects testing program to assess the health impacts of various materials and products. The biodiesel tests conducted pursuant to the EPA’s health effects testing program demonstrated that, compared to petroleum-based diesel fuel, the use of a fuel comprised of a blend of petroleum-based diesel and biodiesel, or biodiesel blend, reduces substantially all regulated emissions and that the higher the percentage of biodiesel in the blend, the greater the reduction. These reduced emissions included unburned hydrocarbons, a contributing factor in the localized formation of smog and ozone; carbon monoxide, a poisonous gas; and particulate matter, a human health hazard. Pure biodiesel and blends of biodiesel with petroleum-based diesel are safer to store, handle and use than conventional petroleum-based diesel fuel.
Biodiesel benefits from numerous government programs
Based on many of the benefits of biodiesel described above, the United States federal and state governments have sought to encourage biodiesel production and use in the United States through numerous programs that either provide economic incentives for biodiesel or require the use of biodiesel. For a more complete discussion of the various programs, see the discussion below under the heading “Government Programs Favoring Biodiesel Production and Use.”
78
Table of Contents
Industry overview
Biodiesel provides necessary lubricity to ultra-low sulfur diesel fuel
A significant benefit of biodiesel is its lubricity. Diesel fuel engines depend, in part, on the diesel fuel to lubricate internal moving parts, which reduces equipment wear and premature breakdown. EPA regulations now require reduced sulfur of 15 parts per million for on-road diesel fuel, known as ULSD. We anticipate that the EPA will implement a similar requirement for off-road, railroad and marine diesel over the next few years to reduce harmful emissions and improve air quality. ULSD does not contain sufficient lubricity and thus requires a lubricity additive. Blending biodiesel with ULSD, even at very low blend rates such as B2, adds the required lubricity, eliminating the need for lubricity additives. Higher blends of biodiesel add even more lubricity and may reduce maintenance and extend engine life as a result.
BIODIESEL FEEDSTOCKS, PRODUCTION AND DISTRIBUTION PROCESS
Biodiesel Feedstocks
Biodiesel can be made from a wide variety of feedstocks, including lower cost and lower carbon feedstocks such as inedible animal fats, used cooking oil and inedible corn oil, or higher cost virgin vegetable oil feedstocks such as soybean oil, palm oil and canola oil.
According to United States Census Bureau data, 9.4 billion pounds, or approximately 1.2 billion gallons, of lower cost biodiesel feedstocks are generated in the United States annually. This estimate does not include inedible corn oil, which is a relatively new lower cost feedstock. EPA estimates that approximately 680 million gallons of inedible corn oil will be produced annually by 2022.
Biodiesel Production Process
Methods for the production of methyl esters like biodiesel have been well known for over 100 years. A wide variety of different techniques and technologies have been developed for the production of biodiesel, all of which result in the conversion of triglycerides, or feedstock, into biodiesel and co-products, in a chemical reaction using alcohol. As discussed above, biodiesel can be made from a variety of feedstocks. The production method chosen for a biodiesel production facility, or biodiesel plant, will depend on the feedstocks used. Higher cost virgin vegetable oil feedstocks contain few impurities and are comparatively easy to process. Lower cost and unrefined virgin vegetable oil feedstocks generally contain impurities that must be pretreated as part of the production process.
The schematic below shows a generalized biodiesel production process, starting with either a refined virgin vegetable oil or a lower cost or unrefined virgin vegetable oil feedstock. The pretreatment may involve removing water or other impurities, stripping free fatty acids, or FFAs, which then become a byproduct, or acid esterification to convert FFAs to methyl esters or glycerolysis, which attaches glycerin to FFAs so the FFAs do not produce soap in the transesterification reaction. Typically, the refined virgin vegetable oil or treated lower cost or unrefined virgin vegetable oil feedstock is mixed with an alcohol, usually methanol, and a catalyst, usually sodium methylate or potassium hydroxide, to create a transesterification reaction. This chemical reaction causes the glycerin attached to the feedstock to detach and be replaced with the alcohol creating methyl esters, or biodiesel, and crude glycerin. The biodiesel and crude glycerin are then separated from each other and purified.
79
Table of Contents
Industry overview
General Biodiesel Production
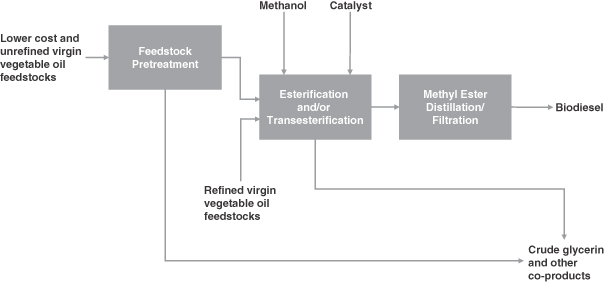
As a general rule, 100 pounds of feedstock combined with 10 pounds of methanol will yield approximately 100 pounds of biodiesel and 10 pounds of crude glycerin. The actual yield will be influenced by the level of impurities in the feedstock and processing capabilities of the producer and typically ranges from approximately 7.5 pounds for refined soybean oil to approximately 9.0 pounds for lower cost feedstocks with a high level of impurities to produce one gallon of biodiesel.
Crude glycerin is the principal co-product of biodiesel production. Depending on the production method chosen, other co-products such as free fatty acids and distillation bottoms may also be generated. Crude glycerin is used in the animal feed market and industrial use markets as feedstock for highly refined glycerin. Highly refined or purified glycerin is used in pharmaceuticals, soaps, cosmetics and food and beverages.
Biodiesel Distribution Process
Unlike ethanol, biodiesel is a drop-in fuel that can enter at any point along the petroleum-based fuel supply chain. Biodiesel can be shipped by rail car, barge or truck directly to a petroleum refinery, terminal, distributor, retailer or end user where it will typically be blended with petroleum-based diesel and continue down the supply chain. If sent to a refinery or terminal, the biodiesel can be blended with petroleum-based diesel up to a B5 biodiesel blend and shipped in certain pipelines. This flexibility of biodiesel provides great optionality for the biodiesel producer, fuel distribution supply chain and end user.
Biodiesel Industry Quality Assurance
In response to early product quality inconsistencies, the United States biodiesel industry created the BQ-9000 program. The BQ-9000 program is run by the National Biodiesel Accreditation Committee, a cooperative and voluntary program for the accreditation of producers and marketers. The program is a quality systems program that includes storage, sampling, testing, blending, shipping, distribution and fuel management practices. Since the creation and adoption of the BQ-9000 program, the quality of biodiesel in the marketplace has improved greatly.
80
Table of Contents
Industry overview
End Users of Biodiesel and Biodiesel Blends
Biodiesel and biodiesel blends are currently used in nearly all of the end markets where petroleum-based distillate fuels are used. Today, most biodiesel in the United States is consumed as a biodiesel and petroleum-based diesel blend in the on-road diesel fuel market, with blends of B2 up to B11 being the most common. Biodiesel is also used in the off-road diesel fuel market, residential/commercial heating oil and power generation markets. Biodiesel is also used in higher blends, generally from B20 to pure biodiesel. Military, government and mining represent large customers that use these higher blends of biodiesel. The following distillate fuel segments are best-positioned for use of biodiesel blends:
Distillate Fuel Segments Best-Positioned for Adoption of Biodiesel

|
· Trucks, buses and automobiles |

|
· Farming and ranching | |||

|
· Construction facilities and equipment and other off-road use |

|
· Facilities and equipment used for producing, processing or assembling goods | |||

|
· Railroads for any use, including related facilities |

|
· Utilities using fuel for electric power generation | |||

|
· Commercial and private boats, including ocean-going vessels |

|
· Living quarters for private households and institutional living quarters; service-providing facilities and equipment for non-manufacturing businesses | |||

|
· Other energy-consuming sectors not included elsewhere, including the military |

|
· Federal, state and local governments; and private and public organizations | |||
81
Table of Contents
Industry overview
UNITED STATES BIODIESEL MARKET OVERVIEW
History
The United States biodiesel industry traces its roots to the mid-1990s when the soybean industry began the technical and regulatory work to make biodiesel a commercially viable, legally-approved fuel in the United States. The biodiesel industry in the United States was a small niche industry prior to the passage of the American Jobs Creation Act of 2004, which created the $1.00 per gallon tax credit for biodiesel effective January 1, 2005. This credit is referred to as the blenders’ tax credit because the $1.00 refundable tax credit is earned by the person who blends biodiesel with petroleum-based diesel to create a biodiesel blend. Following the passage of the blenders’ tax credit, the United States biodiesel industry experienced explosive growth. By September 2007, according to the NBB, over one hundred biodiesel plants had been built and biodiesel production increased 48 fold from 14 million gallons in 2003 to 678 million gallons in 2008. In 2009 and 2010, the United States biodiesel industry experienced difficulties due to a combination of negative market forces, including EU anti-dumping duties, the collapse of United States financial markets, the drop in the price of petroleum and the lapse of the $1.00 per gallon blenders’ tax credit in January 2010. These forces caused virtually all new biodiesel plant development to stop and production in the United States to decrease to 309 million gallons in 2010, 54% lower than total production in 2008. The graph below shows biodiesel production and expected production over the period from 2003 to 2013.
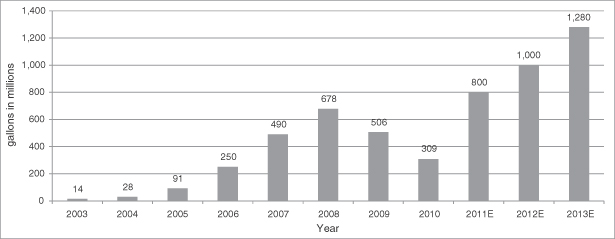
(Source: EIA)
By the end of 2010, the United States biodiesel industry had stabilized and was poised for growth. RFS2 became effective July 1, 2010 after 18 months of delay and in December 2010, a lawsuit challenging RFS2’s retroactive requirements was dismissed. The blenders’ tax credit was reinstated on December 17, 2010 and applied retroactively for 2010 and prospectively for 2011. Biodiesel production in the United States has increased significantly in 2011. According to the EPA, biomass-based diesel production volumes in the United States in the first six months of 2011 were approximately 37, 43, 70, 74, 82, 85 and 95 million gallons respectively, for a total of over 487 million gallons. Of this total, biodiesel accounted for approximately 468 million gallons or 96% of total United States biomass-based diesel production.
Production Capacity Rationalization
In response to the downturn of 2009 and 2010, the biodiesel industry began a process of capacity rationalization. Over one hundred biodiesel plants were built in the United States between the beginning of
82
Table of Contents
Industry overview
2004 and the end of 2008. The initial self-reported annual nameplate production capacity of these plants was reported to be 2.69 billion gallons per year by the NBB in June of 2009. The vast majority of this nameplate production capacity was built to use higher cost virgin vegetable oil, usually soybean oil, as its only feedstock. We believe many of the biodiesel plants were constructed in haste and were either poorly built, built with deficient technology, built in an area with poor logistics, or a combination of each. These factors, plus the contraction of the biodiesel industry in 2009 and 2010, caused many of these biodiesel plants to fail. The stabilization that occurred in the biodiesel industry in 2010 was partially a result of a rationalization of production capacity in the biodiesel industry. We believe that as RFS2 increases demand for biodiesel in 2011 and beyond, the increased demand will be met first by increased capacity utilization of larger biodiesel producers that continued to produce through the 2009 to 2010 downturn. Many of the biodiesel plants that shut down production during 2009 and 2010 may experience difficulty in restarting production due to insufficient working capital, poor logistics that make them less competitive and a limited ability to run lower cost feedstocks without significant capital improvements.
Seasonality
Biodiesel producers have historically experienced seasonal fluctuations in demand for biodiesel. Biodiesel demand has tended to be lower during the winter in Northern and Midwestern states due to concerns about biodiesel’s ability to operate optimally in cold weather, as compared to the most commonly used petroleum-based diesel fuel. This seasonal fluctuation was strongest for biodiesel made from inedible animal fats and used cooking oil. Biodiesel made from those feedstocks has a higher cloud point, the point at which a fuel begins to gel, than biodiesel produced from soybean, canola, or inedible corn oil, which may cause cold weather performance issues. This historical seasonality appears to be decreasing. Biodiesel blends are used in cold Midwestern states like Minnesota, Iowa and Illinois throughout the year. We expect RFS2 may further reduce seasonality as Obligated Parties learn and begin to install infrastructure to properly handle biodiesel during all seasons in order to meet their requirements.
GOVERNMENT PROGRAMS FAVORING BIODIESEL PRODUCTION AND USE
The biodiesel industry benefits from numerous federal and state government programs, the most important of which is RFS2.
Renewable Fuel Standard
On July 1, 2010, RFS2’s biomass-based diesel requirement became effective, requiring for the first time that a certain percentage of the diesel fuel consumed in the United States be made from renewable sources. The biomass-based diesel requirement can be satisfied by two primary fuels, biodiesel and renewable diesel. Renewable diesel is not currently available in the United States in significant commercial quantities and thus, biodiesel is expected to satisfy the vast majority of the RFS2 biomass-based diesel requirement for the foreseeable future. RFS2 requires 800 million gallons of biomass-based diesel in 2011, one billion gallons in 2012 and at least one billion gallons each year thereafter, with such higher amounts subject to EPA discretion. In June 2011, the EPA proposed a 1.28 billion gallon biomass-based diesel requirement for 2013. We expect that the EPA will increase the requirement each year thereafter based on its evaluation of the availability of biodiesel and renewable diesel. As such, we expect RFS2 to create a consistent and stable demand for biodiesel.
The biomass-based diesel requirement is one of four separate renewable fuel requirements under RFS2. The RFS2 requirements are based on two primary categories and two subcategories. The two primary
83
Table of Contents
Industry overview
categories are conventional renewable fuel, which is intended to be satisfied by corn ethanol, and advanced biofuel, which is defined as a biofuel that reduces lifecycle greenhouse gas emissions by at least 50% compared to the petroleum-based fuel the biofuel is replacing. The advanced biofuel category has two subcategories, cellulosic biofuel, which is intended to be satisfied by newly developed cellulosic biofuels, such as ethanol made from woody biomass, and biomass-based diesel, which is intended to be satisfied by biodiesel and renewable diesel. RFS2’s total advanced biofuel requirement is larger than the combined cellulosic fuel and biomass-based diesel requirements, thus requiring the use of additional volumes of advanced biofuels.
The RFS2 requirement for additional volumes of advanced biofuels can be satisfied by any advanced biofuel, including biodiesel, renewable diesel, or sugarcane-based ethanol. The additional advanced biofuel requirement is approximately 150 million gallons in 2011 and 500 million gallons in 2012. We expect it will increase each year thereafter through 2022, subject to the EPA’s evaluation of the availability of advanced biofuels. RFS2’s initial compliance schedule required an additional advanced biofuel volume of approximately one billion by 2018. As biodiesel is currently the only advanced biofuel produced in the United States in significant commercial quantities, we expect the RFS2 advanced biofuel requirement to increase demand for biodiesel.
The advanced biofuel RVO is expressed in terms of ethanol equivalent volumes, or EEV, which is based on the fuel’s renewable energy content compared to ethanol. Biodiesel has an EEV of 1.5 compared to 1.0 for sugarcane-based ethanol. Accordingly, it requires less biodiesel than sugarcane-based ethanol to meet the required volumes as each gallon of biodiesel counts as 1.5 gallons for purposes of fulfilling the advanced biofuel RVO, providing an incentive for Obligated Parties to purchase biodiesel to meet their advanced biofuel RVO.
The RFS2 volume requirements apply to petroleum refiners and petroleum fuel importers in the 48 contiguous states or Hawaii, who are defined as “Obligated Parties” in the RFS2 regulations, and requires these Obligated Parties to incorporate into their petroleum-based fuel a certain percentage of renewable fuel or purchase credits in the form of RINs from those who do. An Obligated Party’s RVO is based on the volume of petroleum-based fuel they produce or import. The largest United States petroleum companies, such as ExxonMobil, Valero, ConocoPhillips, British Petroleum, Chevron and Shell, represent the majority of the total RVOs, with the remainder made up of smaller refiners and importers.
Renewable Identification Numbers
The EPA created the renewable identification number, or RIN, system to track renewable fuel production and compliance with the renewable fuel standard. EPA registered producers of renewable fuel may generate RINs for each gallon of renewable fuel they produce. In the case of biodiesel, 1.5 biomass-based diesel RINs may be generated for each gallon of biodiesel produced. Most renewable fuel, including biodiesel, is then sold with its associated RINs attached. Under the RFS2 regulations, the RINs may also be separated from the gallons of renewable fuel and once separated they may be sold as a separate commodity. RINs are ultimately used by Obligated Parties to demonstrate compliance with the RFS2. Obligated Parties must obtain and retire the required number of RINs to satisfy their RVO during a particular compliance period. An Obligated Party can obtain RINs by buying renewable fuels with RINs attached, buying RINs that have been separated, or producing renewable fuels themselves. All RIN activity under RFS2 must be entered into the EPA’s moderated transaction system, which tracks RIN generation, transfer and retirement. RINs are retired when used for compliance with the RFS2 requirements.
84
Table of Contents
Industry overview
In July 2010 when RFS2 became effective, biomass-based diesel RINs began trading at approximately $0.55 per RIN. By the end of the year, the 2010 biomass-based diesel RIN value had increased to $0.74.
The chart below shows how biomass-based diesel RINs have traded over time. The value of RINs has become increasingly significant to the price of biodiesel, contributing approximately $0.7904, or 25% of the average OPIS Chicago spot price of a gallon of biodiesel in July 2010 and $2.03, or 38% of the average OPIS Chicago spot price of a gallon of biodiesel in July 2011.
Biomass-Based Diesel RIN Values Have Been Significant Since RFS2 Began in July 2010
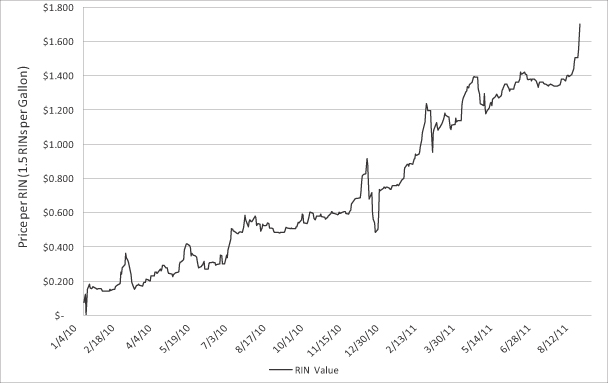
(Source: OPIS)
Blenders’ Tax Credit
The blenders’ tax credit provides a $1.00 per gallon excise tax credit to the first person who blends the biodiesel with at least 0.1% petroleum-based diesel fuel. The blenders’ tax credit can then be credited against such blender’s federal excise tax liability or the blender can obtain a cash refund from the United States Treasury for the value of the credit. The blenders’ tax credit became effective January 1, 2005 and then lapsed January 1, 2010 before being reinstated retroactively December 17, 2010. The blenders’ tax credit is currently authorized through the end of 2011.
85
Table of Contents
Industry overview
State Programs
Several states have enacted legislation providing incentives for the use of biodiesel, requiring the use of biodiesel, or both. For example, Illinois offers an exemption from the generally applicable 6.25% sales tax for biodiesel blends that incentivizes blending at 11% biodiesel, or B11, however such taxes will not apply after December 31, 2013 unless such exemption is extended. Illinois’ program has made that state the largest biodiesel market in the country. Currently, Iowa offers a $0.03 per gallon income tax credit to petroleum marketers of B2 blends. In May 2011, Iowa signed into law a bill that encourages Iowa’s petroleum marketers to blend biodiesel into on-road and off-road diesel in a multi-year incentive program beginning in 2012. In 2012, retailers earn $0.02 per gallon for B2 blends or $0.045 per gallon for B5 blends. For 2013 through 2017, retailers earn $0.045 per gallon of B5. The new law also creates a biodiesel production incentive of $0.03 per gallon in 2012, $0.025 per gallon in 2013, and $0.02 per gallon in 2014, for each gallon produced in an Iowa facility up to the first 25 million gallons per production plant. South Carolina has a retailer cash incentive of $0.25 per gallon of B100 or $0.025 per gallon of B10. In Texas, biodiesel blends are exempt from state excise tax, which results in a $0.20 per gallon incentive for B100.
According to the U.S. Department of Energy, more than 40 states currently have implemented various programs that encourage the use of biodiesel through blending requirements as well as various tax incentives. Minnesota requires a B5 blend, which is scheduled to increase to B10 in 2012. Oregon has implemented a B5 biodiesel blend requirement. New Mexico, Pennsylvania, Massachusetts and Washington have all adopted legislation requiring biodiesel blends. Several northeast states, including Connecticut and Massachusetts, and the City of New York have adopted legislation requiring biodiesel blends for heating oil.
In addition, several states have adopted or are considering adopting a low carbon fuel standard, or LCFS, requiring a reduction in the amount of lifecycle carbon intensity in their transportation fuels. Biodiesel has lower carbon emissions than petroleum-based diesel and is thus expected to benefit from increased demand in states like California that have adopted a LCFS. California’s LCFS calls for a reduction in greenhouse gas emissions from transportation fuels of 10% by 2020.
Although we believe that state requirements for the use of biofuels increase demand for our biodiesel within such states, they generally may not increase overall demand in excess of RFS2 requirements. Rather, existing demand for our biofuel from Obligated Parties in connection with federal requirements may shift to states that have use requirements or tax incentive programs.
Canadian and European Union Biodiesel Markets
CANADA
Biodiesel demand in Canada is expected to grow significantly in 2011 and 2012 due to Canada’s renewable fuel policies. Those policies require a 2% renewable blend into Canadian petroleum-based diesel and heating oil beginning July 1, 2011 and a 5% renewable blend into Canadian gasoline beginning December 15, 2010. Given an estimated diesel market of 6.8 billion gallons of diesel fuel in 2009, based on data published by the Canadian Association of Petroleum Production, and a 2% blend rate, we estimate total Canadian market demand for biodiesel of approximately 135 mmgy. Additionally, several Canadian provinces maintain provincial blend requirements, including a 2% biodiesel blend requirement into diesel fuel in Manitoba as of November 2009, a 4% renewable fuel content in British Columbia that increases to a 5% renewable fuel content requirement in January 2012, and a 2% renewable fuel content requirement in Alberta as of April 2011. According to the Canadian Renewable Fuels Association, there is 54 mmgy of operating production capacity in Canada. Therefore, we expect United States biodiesel exports to Canada to increase significantly to satisfy higher demand levels pursuant to the recently enacted national blend requirements.
86
Table of Contents
Industry overview
EUROPEAN UNION
The EU represents the largest diesel market in the world, having consumed approximately 84.4 billion gallons of diesel fuel and 3.2 billion gallons of biodiesel in 2009, the latest year for which figures are available, according to the EIA. Demand in the EU is largely driven by public policy, the most significant of which is the Renewable Energy Directive 2009/28, which set a 5.75% target for renewable energy use in transport fuels by 2010 and a 10% target for renewable energy use in transport fuels by 2020, both targets to be met by EU member countries. The blend percentages are calculated on the basis of energy content of the fuel and apply to petrol and diesel fuel for transport purposes placed on the markets of member countries. Member countries are encouraged to take on national “indicative” targets in conformity with the overall target.
The EU biodiesel industry began approximately ten years prior to the United States biodiesel industry and has been a model for many of the programs adopted in the United States. In 2007 and 2008, approximately 50% of United States biodiesel production was exported to EU markets. In March 2009, EU trade authorities imposed extensive anti-dumping and countervailing duties on imports of United States biodiesel, which were extended for five years in July 2009. Since then, United States exports to the EU have been significantly curtailed and we do not expect the EU to be a significant source of demand for United States biodiesel producers until such anti-dumping and countervailing duties are rescinded or expire.
87
Table of Contents
We are the largest producer of biodiesel in the United States based on gallons produced. We have played a leading role in developing the United States biodiesel industry since our inception in 1996. We market and distribute our biodiesel throughout the country to all segments of the petroleum-based fuel supply chain. In 2010, we sold nearly 68 million gallons of biodiesel, representing approximately 22% of United States biodiesel production.
We operate a network of six biodiesel plants, with an aggregate nameplate production capacity of 212 mmgy consisting of five wholly-owned facilities and one leased facility. We have acquired four of our six facilities since February 2010. Our scale allows us to quickly transfer best practices from one of our facilities to the others to maximize production volumes and reduce operating costs. We believe our fully integrated approach, which includes acquiring feedstock, managing biorefinery facility construction and upgrades, operating biorefineries and marketing renewable products, strongly positions us to capitalize on growing demand for biodiesel, renewable chemicals and other advanced biofuels. Our experience has enabled us to develop extensive expertise in biorefinery operations, from facility construction management and feedstock procurement to biodiesel production, marketing, logistics and risk management.
We are a low-cost biodiesel producer. We primarily produce our biodiesel from a wide variety of lower cost feedstocks, including inedible animal fat, used cooking oil and inedible corn oil. We also produce a smaller portion of our biodiesel from higher cost virgin vegetable oils. We believe our ability to process a wide variety of feedstocks provides us with a cost advantage over many biodiesel producers, particularly those that rely on higher cost virgin vegetable oils, such as soybean oil. In addition, we believe our size, reputation, large and diverse feedstock supplier base and processing capabilities give us a competitive advantage over other biodiesel producers.
During 2008, we took advantage of the downturn in the biodiesel industry and began acquiring biodiesel businesses and biodiesel production capacity. In 2010, we became the largest biodiesel producer in the United States by selectively acquiring three strategically located biodiesel plants in Danville, Illinois and Newton, Iowa and our leased Seneca, Illinois plant. This initial phase of our acquisition strategy focused on plants with strong access to lower cost feedstocks, lower cost feedstock production capabilities and access to key biodiesel markets. As part of our consolidation effort, we also acquired three additional biodiesel companies in 2010 that provided increased access to lower cost feedstocks, west coast biodiesel markets, our partially constructed Clovis, New Mexico facility and an $8 million strategic investment from ARES Corporation, the prior owner of the Clovis facility. On July 12, 2011, we completed the acquisition of the former SoyMor biodiesel facility in Albert Lea, Minnesota.
Biodiesel benefits from many government programs. The most important of these programs is RFS2, which we expect will create significant, stable and growing demand for our biodiesel. According to the NBB, Biodiesel is the only commercially significant advanced biofuel currently produced in the United States. On July 1, 2010, RFS2 became effective, requiring for the first time that a portion of the diesel fuel consumed in the United States be renewable. In response, according to the EIA, 173 million gallons of biodiesel were produced in the United States in the first four months of 2011, compared with 309 million gallons in all of 2010.
88
Table of Contents
Our business
FULLY INTEGRATED PLATFORM
We participate in each aspect of biodiesel production, from acquiring feedstock, managing construction and operating biodiesel production facilities to marketing, selling and distributing biodiesel and its co-products. We believe this integrated approach allows us to lower costs, improve biodiesel quality and distribute large quantities of biodiesel more efficiently than our competitors.
| Ø | Design, Build and Upgrade. We have developed expertise in designing, managing the construction of and upgrading biodiesel plants. We have managed the design and construction of ten commercial-scale biodiesel plants on our own behalf and for third parties. Our design, build and upgrade experience has enabled us to constantly improve and test new production technologies lowering operating costs, improving yields, and expanding our ability to use lower cost feedstocks. This expertise has also allowed us to quickly and cost effectively upgrade and integrate the biodiesel plants we have acquired. We believe we will be able to leverage this experience into the design and construction of renewable chemical and other advanced biofuel production facilities as we expand into these areas. |
| Ø | Operate and Manage. We manage the operation of our six biodiesel production facilities and have managed production facilities for others. In total, we have operated ten different biodiesel plants over the last five years. This operational experience allows us to continually improve our production process efficiency and quality and to deploy best practices throughout our network, increasing production volumes and improving economics. A key element in successfully managing a biodiesel plant is the procurement of feedstock. We believe our strong knowledge and history in feedstock markets allows us to procure feedstock more efficiently and reliably than our competitors. We believe our operational expertise also enables us to effectively acquire new facilities and quickly have them up and running, manage facilities for others, and will enable us to manage the renewable chemical and other advanced biofuel facilities we intend to own and operate in the future. |
| Ø | Marketing. We market both the biodiesel we produce as well as biodiesel produced by others throughout the United States. We believe we are able to capture business from the largest customers, namely large United States petroleum refiners and national truck stop chains, whose demand cannot be met by smaller producers or marketers that do not have our scale or national reach. |
We believe our biorefinery platform and experience running a fully integrated biorefining company is highly attractive to technology companies working on developing renewable chemicals and advanced biofuels. We are able to offer to co-locate these companies’ equipment and production processes at our existing facilities, as well as to offer, design-build, operations and management capabilities to accelerate the commercialization of these companies’ products.
OUR MARKETS
Biodiesel addresses a large existing market. Biodiesel is a low carbon, advanced biofuel, and drop-in replacement for petroleum-based distillate fuel. In 2007, the petroleum-based distillate fuels market was a 522 billion gallon per year global market, according to the EIA. Biodiesel is compatible with the existing fuel infrastructure. The largest segment of the distillate fuel market is diesel fuel for on-road and off-road use and also includes fuel oils used for heating and power generation. In 2009, the United States market for distillate fuel was 52.7 billion gallons, according to the EIA. In 2010, 309 million gallons of biodiesel were produced in the United States according to the EIA, achieving less than one percent penetration of the United States distillate fuel market.
89
Table of Contents
Our business
United States Distillate Fuel Market 2009
(in billions)
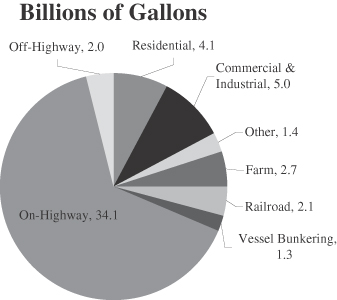
Source: EIA
In addition to addressing the large distillate fuel market, our biodiesel addresses the renewable fuels market. As discussed in the section entitled, “Industry overview—Government Programs Favoring Biodiesel Production and Use—Renewable Fuel Standard” on page 83, biodiesel satisfies the RFS2 biomass-based diesel and advanced biofuel requirements and is the only fuel produced in the United States in commercially significant volumes that can satisfy those requirements.
RFS2 requires the use of 800 million gallons of biomass-based diesel in 2011, one billion gallons in 2012 and at least one billion gallons each year thereafter through 2022. In June 2011, the EPA proposed a 1.28 billion gallon biomass-based diesel requirement for 2013. We expect the EPA will increase the requirement each year thereafter based on its evaluation of the availability of biodiesel and renewable diesel. As such, we expect RFS2 to create a consistent, stable and growing demand for our biodiesel.
RFS2’s requirement for additional volumes of advanced biofuels can be satisfied by any advanced biofuel, including biodiesel, renewable diesel, or sugarcane-based ethanol. This additional advanced biofuel requirement is approximately 150 million gallons in 2011 and 500 million gallons in 2012. We expect it will increase each year thereafter through 2022, subject to the EPA’s evaluation of the availability of advanced biofuels. RFS2’s initial advanced biofuel schedule required an additional volume of approximately one billion gallons of advanced biofuel by 2018.
The advanced biofuel RVO is expressed in terms of ethanol equivalent volumes, or EEV, which is based on the fuel’s renewable energy content compared to ethanol. Biodiesel has an EEV of 1.5 compared to 1.0 for sugarcane-based ethanol. Accordingly, it requires less biodiesel to meet the required volumes than it would if such volumes were satisfied by the use of sugarcane-based ethanol, providing an incentive for Obligated Parties to purchase biodiesel to meet their advanced biofuel RVO and creating additional demand for our biodiesel.
90
Table of Contents
Our business
In addition, as discussed in the section entitled “Industry overview—Government Programs Favoring Biodiesel Production and Use—State Programs,” biodiesel must be used in several states to meet state biodiesel requirements and may be used in other states to meet LCFS or other state renewable fuel requirements.
Our products are able to address the large chemicals market. Today, our methyl esters, glycerin and fatty acids, among other products we produce, are sold into the chemicals market. For example, in the specialty chemical market, methyl esters are used as a solvent and glycerin is used in a variety of industrial and chemical products. We anticipate that our chemical sales, which were less than 5% of our total sales in 2010, will increase as we execute on our growth plan and increase the number of products we produce for the chemical markets.
We expect the renewable chemicals that we intend to make will be produced from feedstocks that are subject to lower cost volatility than the materials used to produce the petroleum-based chemicals they replace, thus allowing us to offer potential customers a replacement product with lower price volitility. Using our products also offers our customers the additional benefit of being able to market their products as environmentally friendly.
OUR COMPETITIVE STRENGTHS
| Ø | Largest United States Biodiesel Producer. We believe the scale of our operations allows us to enjoy several advantages over many of our competitors. First, we offer lower cost feedstock producers consistent access to the renewable fuel industry on a scale that we believe our competitors generally cannot match. Second, our size allows us to provide our customers with larger volumes of biodiesel than our smaller competitors. Third, our larger size also generally allows us to reduce our overhead costs per gallon compared to our smaller competitors. Fourth, we are able to transfer best practices among our six operating facilities to maximize production volumes and reduce operating costs in a manner that our competitors who do not operate multiple facilities cannot. |
| Ø | Multi-Feedstock Expertise. We utilize our proprietary technology and knowhow to efficiently convert a wide variety of lower cost feedstocks into high quality biodiesel. We believe our ability to process lower cost feedstocks at scale enables us to be a low cost producer and provides a distinct advantage against many of our competitors. Several of our competitors’ facilities are only able to process higher cost virgin vegetable oil feedstocks. Our competitors that are able to process lower cost feedstocks generally operate at a smaller scale, making it more difficult for them to reliably procure and efficiently process lower cost feedstocks. |
| Ø | Effective Acquisitions. We believe we have completed more acquisitions in the biodiesel industry than any of our competitors since 2006, acquiring six biodiesel plants and two additional biodiesel businesses since our inception. We have developed an ability to target and acquire strategic assets and quickly add value to them through upgrades and integration onto our biorefinery platform. We believe our in-house expertise will allow us to continue to acquire and effectively integrate new production facilities as we grow and complete additional acquisitions in the biodiesel industry. |
| Ø | Strategic relationships with other industry participants. We have established strategic relationships with other industry participants, particularly Bunge, ED&F Man and West Central, with whom we trade feedstock and biodiesel, and each of whom is also a principal stockholder. These relationships enable us to more effectively address market opportunities and provide us with an advantage over our competitors that have not been able to establish such strategic relationships. |
91
Table of Contents
Our business
| Ø | Sales and Marketing Leadership. We are a leading marketer of biodiesel in the United States, marketing both biodiesel we produce as well as biodiesel produced by others. The scale of our operations, combined with our logistics capabilities, allows us to satisfy local and national customer needs in a manner that we believe most other biodiesel producers and marketers cannot match. In addition, the customer support provided by our large sales and technical teams provides us with further competitive advantages. |
| Ø | Premium Product Quality. Our REG-9000® biodiesel exceeds the ASTM D6751 biodiesel quality specification. In addition, all of our operating facilities are either certified as BQ-9000 Producers or follow BQ-9000 protocols and are in the process of obtaining certification. Some larger customers require specifications stricter than ASTM D6751. The ability of our REG-9000® biodiesel to meet stricter specifications than the industry standards and our BQ-9000 accreditation enables us to sell to a broader customer base than our competitors who cannot meet these customer requirements. |
| Ø | Experienced Management Team with Significant Risk Management Expertise. Our management team has extensive experience in the biodiesel and related oleochemical and agricultural industries, with an average of 19 years of relevant experience. Our management team has enabled our company to evolve from a single biodiesel production facility in 1996 into a nationally recognized fully integrated biodiesel company. Our team also has extensive experience in managing risk related to commodity pricing, which is an essential component of effective biorefinery management. |
OUR STRATEGY
Our strategy is to optimize and grow our existing core biodiesel business in the United States and expand internationally while diversifying to produce renewable chemicals and additional advanced biofuels. We plan to maintain and improve upon our position as the largest producer of biodiesel in the United States, by continuously improving our biodiesel production facilities and continuing our acquisition efforts. We believe our integrated biorefinery platform strongly positions us as a development and commercialization partner for companies developing new feedstocks, renewable chemicals, other advanced biofuels and biodiesel production techniques. Key elements of our strategy include the following:
Optimize and expand our fully-integrated biodiesel offering.
| Ø | Enhance the capabilities and increase the production capacity of our existing plants by investing in high-value processing upgrades to improve yields and optimize the range of usable lower cost feedstocks at each of our production facilities. |
| Ø | Expand our existing biorefinery platform by continuing to strategically acquire biodiesel plants and by completing our facilities under construction. |
| Ø | Grow our REG-9000® sales by expanding our logistics and biodiesel blending infrastructure to reduce distribution costs and improve our blending capabilities to further enhance our geographic reach. |
| Ø | Further grow our REG-9000® sales by having biodiesel manufactured for us through tolling arrangements and by reselling biodiesel produced by others. |
Diversify into the production of renewable chemicals, additional advanced biofuels and related products.
| Ø | Our track record of successfully commercializing new biorefinery technologies positions us well to diversify into the production of renewable chemicals, additional advanced biofuels, such as renewable diesel and jet fuel, and related products, like bio-based lubricants and greases. |
92
Table of Contents
Our business
| Ø | Vertically integrate by producing next generation feedstocks, such as algae oil. |
| Ø | One example of these efforts is our relationship with Glycos Biotechnologies, Inc., or GlycosBio. We have collaborated with GlycosBio on emerging renewable chemical market development opportunities since 2007 with a focus on using crude glycerin, a co-product of our biodiesel production, as a feedstock for microorganisms that produce high-value specialty chemicals. GlycosBio focuses on the development of microorganisms for use in the manufacturing of renewable chemicals. |
Grow our business internationally.
| Ø | Expand into select international markets, which may include Europe, South America, and Asia, where we believe we can leverage our existing fully integrated biorefinery platform or leverage our existing strategic relationships with industry participants operating in such markets. |
| Ø | Acquire or invest in biodiesel, renewable chemicals or other advanced biofuel production and distribution assets in select international markets targeting large end-user or large feedstock generating markets. |
Expand our intellectual property base.
| Ø | Build upon our existing intellectual property portfolio and develop and acquire additional intellectual property to support our business and to expand into the production of renewable chemicals, additional advanced biofuels, next generation feedstocks, such as algae oil, and related renewable products. |
93
Table of Contents
Our business
OUR FEEDSTOCKS AND OTHER INPUTS
Our multi-feedstock platform allows us to arbitrage across feedstocks more successfully than many of our competitors. Lower cost feedstocks allow us to produce biodiesel at a cost of approximately $0.37 to $0.67 less per gallon than our competitors who use higher cost virgin vegetable oils.
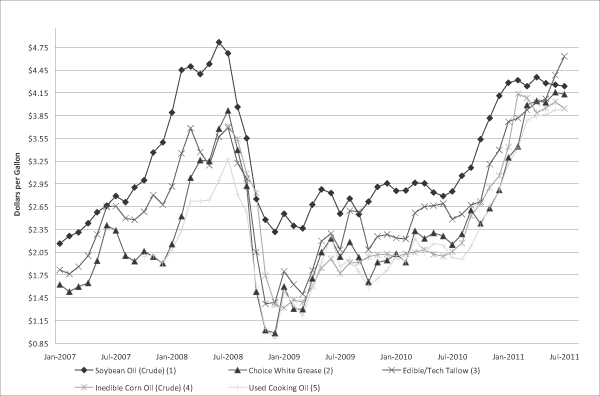
| (1) | Crude soybean oil prices are reported as the monthly average derived from daily closing prices as reported by CBOT (Based on 7.5 pounds per gallon). |
| (2) | Choice white grease prices are based on the monthly average of the daily low prices of Missouri River choice white grease as reported by The Jacobsen (Based on 8.0 pounds per gallon). |
| (3) | Edible/tech tallow prices are based on the monthly average of the daily low sales price of Missouri River edible/tech tallow as reported by The Jacobsen (Based on 7.6 pounds per gallon). |
| (4) | Inedible corn oil prices are reported as the monthly average of the daily market values delivered to Illinois (Based on 8.2 pounds per gallon). |
| (5) | Used cooking oil prices are based on the monthly average of the daily low sales price of Missouri River Yellow Grease as reported by The Jacobsen (Based on 8.5 pounds per gallon). |
94
Table of Contents
Our business
For 2010, approximately 91% of our total feedstock usage was lower cost inedible animal fat, used cooking oil or inedible corn oil feedstock and 9% was higher cost soybean oil. Our ability to use a wide range of feedstocks gives us the flexibility to quickly respond to changes in feedstock pricing to maintain our feedstock cost advantage. We have the ability to rapidly change our processing techniques to accommodate different feedstocks and feedstock mixes. Our plants generally run on a mix of feedstocks. As different feedstocks are delivered to the plant, they are combined or segregated into our feedstock storage tanks. Feedstock tanks are then tested and the plant is tuned to optimize the processing of that specific feedstock mix.
We procure our feedstocks from numerous vendors in small to medium quantities. There is no established futures market for lower cost feedstocks. We generally purchase inedible animal fats on a freight delivered basis and purchase in one to four week forward positions. Used cooking oil and inedible corn oil can be purchased in nearby forward positions of three to twelve months, and are sometimes indexed to the New York Mercantile Exchange, or NYMEX, heating oil index. We maintain both long term contractual arrangements and long term trading relationships with key feedstock suppliers, which provides us with an advantage. Some of these relationships are with our investors including West Central, Bunge and ED&F Man. These arrangements and relationships give us an advantage over our competition in procuring reliable volumes of lower cost feedstock at competitive prices. Higher cost virgin vegetable oil feedstocks like soybean oil can be purchased on a spot or forward contract basis from a number of suppliers.
We work with developers of next generation feedstocks, such as algae, camelina and jatropha oil, to assist them in bringing these new feedstocks to market. We have converted each of these feedstocks, as well as other second generation feedstocks, into high quality biodiesel in our laboratory. We believe we are well positioned to incorporate these new feedstocks into our production process as they become commercially available.
We obtain methanol, chemical catalysts such as sodium methylate and hydrochloric acid, under fixed-price contracts and formula-indexed contracts based upon competitive bidding. These procurement contracts typically last from three months to one year. The price of methanol is indexed to the monthly reported published price of methanol plus or minus a negotiated basis.
OUR PRODUCTION NETWORK
We are the largest biodiesel producer in the United States. We currently own five and lease one operating biodiesel production facilities with an aggregate nameplate production capacity of 212 mmgy. In addition to these six plants, we began construction of two 60 mmgy nameplate production capacity facilities in 2007, one near New Orleans, Louisiana and the other in Emporia, Kansas. In February 2008, we halted construction of these facilities as a result of conditions in the biodiesel industry and the lack of financing. In September 2010, we acquired a partially constructed 15 mmgy biodiesel production facility in Clovis, New Mexico. We plan to complete these three facilities as financing becomes available, subject to market conditions.
Our plants are able to use lower cost feedstock, which gives us a cost advantage over our competitors who can only run higher cost virgin vegetable oils. We intend to upgrade the Albert Lea facility to process a wide variety of lower cost feedstocks when project financing becomes available and market conditions warrant. In addition, our plants have the ability to quickly change the feedstock they are using. This allows us to respond to changes in feedstock pricing to maintain our feedstock cost advantage. We have the ability to rapidly change our processing techniques to accommodate different feedstocks and feedstock mixes.
95
Table of Contents
Our business
REG BIODIESEL PLANT NETWORK
| Property | Nameplate Production Capacity1 |
Production Capacity for Current Feedstock Mix |
REG Operations Commenced |
Feedstock Capability | ||||||||
| Completed |
||||||||||||
| Ralston, Iowa |
12 | 12 | 2003 | Refined Oils and Fats | ||||||||
| Albert Lea, Minnesota2 |
30 | 30 | 20062 | Refined Oils and Fats3 | ||||||||
| Newton, Iowa |
30 | 24 | 2007 | Crude, High FFA and Refined Oils and Fats | ||||||||
| Seabrook, Texas |
35 | 33 | 2008 | Refined Oils and Fats3 | ||||||||
| Danville, Illinois |
45 | 37 | 2009 | Crude, High FFA and Refined Oils and Fats | ||||||||
| Seneca, Illinois4 |
60 | 33 | 5 | 2010 | Crude, High FFA and Refined Oils and Fats | |||||||
| Partially Constructed |
% Complete | |||||||||||
| St. Rose, Louisiana |
60 | n/a | ~45% | Crude, High FFA and Refined Oils and Fats | ||||||||
| Emporia, Kansas |
60 | n/a | ~20% | Crude, High FFA and Refined Oils and Fats | ||||||||
| Clovis, New Mexico |
15 | n/a | ~50% | Crude, High FFA and Refined Oils and Fats | ||||||||
| 1 | The nameplate capacity listed above is based on soy, except for Seneca, which is based on lower cost feedstocks. |
| 2 | SoyMor began operations of the biodiesel facility located in Albert Lea, Minnesota in 2006 under our management. In February 2008, SoyMor stopped production and idled the facility. In July 2011, one of our subsidiaries acquired the biodiesel facility and has recommenced operations of the facility. |
| 3 | We plan on upgrading this facility to produce biodiesel using crude and high FFA oils and fats when project financing becomes available. |
| 4 | Facility is currently leased. |
| 5 | Our Seneca facility includes three production lines, each with a 20 mmgy production capacity. One of these three production lines is not currently operating. |
In addition to the production facilities listed above, REG maintains a testing laboratory in its corporate headquarters in Ames, Iowa. The testing laboratory allows us to test various feedstocks for their conversion into biodiesel, as well as various manufacturing processes available in the production of biodiesel. Through a subsidiary we are a 50% owner of 416 South Bell, LLC, which owns and leases to us our corporate headquarters located at 416 South Bell Avenue, Ames, Iowa 50010, comprised of 60,480 square feet of office and laboratory space, under a lease that expires in December 2017 and is renewable at our option for an additional ten years.
96
Table of Contents
Our business
DISTRIBUTION
We have established a national distribution system to supply biodiesel throughout the United States. Each of our facilities is equipped with an on-site rail loading system, a truck loading system, or both, and a logistics and supply chain management staff. We also manage some customers’ biodiesel storage tanks and replenishment process. We lease more than 250 railcars for transportation and lease biodiesel storage tanks in 12 terminals as of July 2011. Typically, the terminals where we lease our biodiesel storage tanks are petroleum fuel terminals so that fuel distributors and other biodiesel customers can create a biodiesel blend at the terminal before further distribution. Terminal leases typically have one to three-year terms and are generally renewable subject to certain terms and conditions. In the future, we plan to increase the number of terminal leases we hold in strategic locations, including on the coasts of the United States and other deep water access points, to create a distribution system that enhances our ability to market biodiesel throughout the United States, Canada and abroad. We have sold biodiesel in 43 states and Canada. The map below represents our distribution network throughout the 48 contiguous states. The darkly shaded states represent the states in which we have sold our biodiesel.
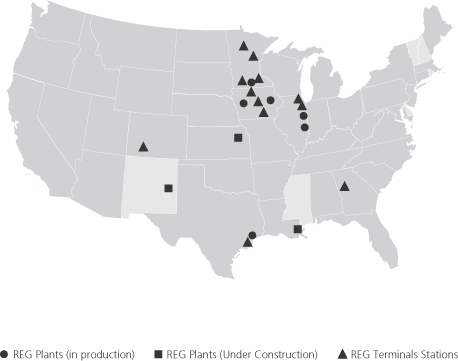
RISK MANAGEMENT
The prices for feedstocks and biodiesel can be volatile and are not always closely correlated. Lower cost feedstocks are particularly difficult to risk manage given that such feedstocks are not traded in any public futures market. To manage feedstock and biodiesel price risks, we utilize forward contracting, hedging and other risk management strategies, including the use of futures, options and over-the-counter products.
We believe we are better at managing risk than our competitors that use lower cost feedstocks due to our scale, experience, feedstock supply relationships and the number of feedstocks we use, which allow us to more effectively risk manage lower cost feedstocks.
97
Table of Contents
Our business
In establishing our risk management strategies, we draw from our own in-house risk management expertise and we consult with industry experts, such as Bunge and ED&F Man, two of the largest international commodity trading firms and each of which is also a principal stockholder. Bunge provides risk management services to us pursuant to a master services agreement. We utilize research conducted by outside firms to provide additional market information and risk management strategies. We believe combining these sources of knowledge, experience and expertise gives us a more sophisticated and global view of the fluctuating commodity markets for raw materials and energies, which we then can incorporate into our risk management strategies.
COMPETITION
While we are the largest producer of biodiesel in the United States, we still face competition in the biodiesel market from other biodiesel producers, marketers and distributors. Our principal methods of competition are product quality, supply reliability and price. We also face competition in the biomass-based diesel RIN compliance market from producers of renewable diesel, in the advanced biofuel RIN compliance market from producers of other advanced biofuels and in the distillate fuel market from producers and suppliers of petroleum-based diesel fuel. In the United States and Canadian biodiesel markets, we compete with large, multi-product companies that have greater resources than we do. Archer Daniels Midland Company, Cargill, Incorporated, Louis Dreyfus Commodities Group and Ag Processing Inc. are major international agribusiness corporations and biodiesel producers with the financial, sourcing and marketing resources to be formidable competitors in the biodiesel industry. These agribusiness competitors tend to make biodiesel from higher cost virgin vegetable oils such as soybean or canola oil, which they produce as part of their integrated agribusinesses.
We also face competition from independent biodiesel producers. Unlike us, most of these competitors own only one biodiesel plant and thus, do not enjoy the benefits of scale that we do. Many of our competitors own biodiesel plants that can process only higher cost virgin vegetable oils. Furthermore, in our marketing and distribution, we face competition from biodiesel traders such as Mansfield, Astra, Gavilon, Tenaska and ED&F Man. These trading companies have far greater financial resources than we do and are able to take significant biodiesel positions in the marketplace. These competitors are often customers of ours as well.
In the RFS2 biomass-based diesel and the Canadian renewable fuel requirement markets, we are in competition with producers of renewable diesel. Renewable diesel, like biodiesel, is a petroleum-based diesel substitute made from renewable feedstocks. Renewable diesel can also satisfy the RFS2 biomass-based diesel requirement if the renewable diesel meets the greenhouse gas reduction requirements and may satisfy Canadian renewable fuel requirements. Some of the future producers of renewable diesel, like the renewable diesel joint venture between Valero Energy Corp. and Darling International, may have greater financial resources than we do. In the RFS2 advanced biofuel market, we also compete with other producers and importers of advanced biofuels such as Brazilian sugarcane ethanol producers.
The biodiesel industry is also in competition with the petroleum-based diesel fuel industry. The size of the biodiesel industry is small compared to the size of the petroleum-based diesel fuel industry and large petroleum companies have greater resources than we do. Without government incentives and requirements, biodiesel may be more expensive than petroleum-based diesel, making it difficult to compete with petroleum-based diesel on price.
98
Table of Contents
Our business
OUR HISTORY
We have been growing our business since 1996 by partnering with key industry participants and evolving our business model to take advantage of opportunities presented by the emergence of the United States biodiesel industry. In 1996, West Central, our former parent company, completed construction of a 1.3 mmgy biodiesel plant. Using the experience gained from operating this first plant, West Central began work in 2001 on our Ralston facility, a 12 mmgy biodiesel plant, which was the largest biodiesel plant in the United States at the time of its completion in 2002.
We partnered with Crown Iron Works and Todd & Sargent, Inc. to leverage the experience we gained building our 12 mmgy Ralston facility into a biodiesel plant design and build business that built more commercial scale biodiesel plants in the United States than anyone else. We used the expertise we gained from operating our Ralston facility to build a biodiesel plant services business that managed and operated seven biodiesel plants for third parties. Our collaborative services business enabled us to become a leading marketer of biodiesel in the United States since 2005 and gave us substantial early operating experience.
In 2006, we spun-off from West Central and raised approximately $100 million from financial and strategic investors. In 2007, we began construction on two 60 mmgy facilities for our own account, our partially completed New Orleans and Emporia facilities. In February of 2008, in response to collapsing debt markets, we halted construction on these facilities. In June of 2008, we acquired our Houston facility from the USBG, increasing our wholly-owned nameplate production capacity to 47 mmgy.
In 2008 and 2009, in response to higher soybean oil prices we transformed our operations to allow us to produce biodiesel primarily from lower cost feedstocks. During these difficult times in the biodiesel industry, we became the largest producer of biodiesel in the United States as a result of acquisitions that began to consolidate the biodiesel industry, including the acquisition of three facilities we previously managed. Through our consolidation efforts, we have completed a total of nine acquisitions, including five biodiesel plants, with eight of the nine acquisitions closing since early 2010. Our current six operating biodiesel plants have a nameplate production capacity of 212 mmgy.
We believe the experience we have gained over the last 15 years combined with our track record of building business relationships and aligning our business with market trends will enable us to continue to lead the United States biodiesel industry, diversify into renewable chemicals, additional advanced biofuels and next generation feedstocks through strategic relationships with innovative companies, and expand internationally.
Employees
As of June 30, 2011, we employed 204 full-time employees, including 151 in operations, procurement, logistics and technical, 15 in sales and marketing and 38 in administration. None of our employees are represented by a labor organization or under any collective bargaining agreements. We consider our relationship with our employees to be good.
Environmental Matters
Our biofuel facilities, like other fuel and chemical production facilities, are subject to various federal, state and local environmental laws and regulations, including those relating to the discharge of materials into the air, water and ground; the generation, storage, handling, use, transportation and disposal of hazardous materials; ecological and natural resources; and the health and safety of our employees, contractors and the public. These laws and regulations require us to obtain and comply with numerous environmental permits to construct and operate each network facility. They can require expensive
99
Table of Contents
Our business
pollution control equipment or operational changes to limit actual or potential impacts to human health and the environment. A violation of these laws, regulations or permit conditions could result in substantial fines, natural resource damage, criminal sanctions, permit revocations and/or facility shutdowns. However, we do not currently have any such proceedings either pending or threatened against our facilities. Furthermore, we do not anticipate a material adverse effect on our business or financial condition as a result of our efforts to comply with these requirements as presently in effect.
We also do not expect to incur material capital expenditures for environmental controls in this or the succeeding fiscal year. However, new laws, new interpretations of existing laws, increased governmental enforcement of environmental laws or other developments could require us to make additional significant expenditures. Continued government and public emphasis on environmental issues can be expected to result in increased future investments for environmental controls at our ongoing operations. Future environmental laws and regulations and related interpretations applicable to our operations, more vigorous enforcement policies and discovery of currently unknown conditions may require substantial capital and other expenditures.
Our air emissions are subject to the federal Clean Air Act and similar state and local laws and associated regulations. For example, the EPA has promulgated National Emissions Standards for Hazardous Air Pollutants, or NESHAPs, under the federal Clean Air Act that apply to facilities that we own or manage if the emissions of hazardous air pollutants exceed certain thresholds. If a facility we operate is authorized to emit hazardous air pollutants above the threshold level, then we are required to comply with the NESHAP related to our manufacturing process, boilers and process heaters. New or expanded facilities would be required to comply with such standards upon startup if they exceed the hazardous air pollutant threshold. In addition to costs for achieving and maintaining compliance with these laws, more stringent standards also may limit our operating flexibility. Other federal and state emission limitations, such as New Source Performance Standards, may also apply to facilities we own or manage. Because other domestic biodiesel manufacturers will have similar restrictions, however, we believe that compliance with more stringent air emission control or other environmental laws and regulations is not likely to materially affect our competitive position.
We do transport and dispose of small quantities of hazardous materials from our on-site research and testing laboratories. The facilities in our network have been and may in the future be located on or adjacent to industrial property. There is a risk of liability for the investigation and cleanup of environmental contamination at each of the properties that we own or operate and at off-site locations where we arranged for the disposal of hazardous substances. If these substances have been or are disposed of or released at sites that undergo investigation or remediation by regulatory agencies or private parties, we may be responsible under the Comprehensive Environmental Response Compensation and Liability Act or other environmental laws for all or part of the costs of investigation or remediation and for damage to natural resources. We also may be subject to related claims by private parties alleging property damage and personal injury due to exposure to hazardous or other materials at or from these properties. Some of these matters may require us to expend significant amounts for investigation and/or cleanup or other costs. We are not aware of any material environmental liabilities relating to contamination at or from our facilities or at off-site locations where we have transported or arranged for the disposal of hazardous substances.
The hazards and risks associated with producing and transporting our products, such as fires, natural disasters, explosions, abnormal pressures, blowouts and pipeline ruptures also may result in personal injury claims or damage to property and third parties. As protection against operating hazards, we maintain insurance coverage against some, but not all, potential losses. Our coverage includes physical
100
Table of Contents
Our business
damage to assets, employer’s liability, comprehensive general liability, automobile liability and workers’ compensation. We believe that our insurance is adequate and customary for our industry, but losses could occur for uninsurable or uninsured risks or in amounts in excess of existing insurance coverage. We do not currently have pending material claims for damages or liability to third parties relating to the hazards or risks of our business.
Intellectual Property
We rely primarily on trade secret laws and contractual restrictions to protect our technology. As of June 30, 2011, we had one issued patent, which expires in December 2018, and two patent applications pending in the United States.
Customers
As of June 30, 2011, we had 212 customers, only one of which, Pilot Travel Centers LLC, or Pilot, accounted for 10% or more of our total revenues. Sales to Pilot during December 31, 2010 and the first six months of 2011 were $62.6 million and $75.0 million, respectively, representing approximately 29% and 25% of biodiesel revenues, respectively, and 29% and 25%, respectively, of our total revenues.
Legal Proceedings
We are currently not a party to any material legal proceedings. We may from time to time become involved in litigation relating to claims arising from our ordinary course of business. Any claims we become subject to, even if not meritorious, could result in the expenditure of significant financial and managerial resources.
101
Table of Contents
DIRECTORS AND EXECUTIVE OFFICERS
The following table lists the names, ages and positions of our named executive officers and directors. The ages of the individuals are provided as of August 31, 2011.
| Name | Age | Position | ||||
| Jeffrey Stroburg |
61 | Chairman and Chief Executive Officer | ||||
| Daniel J. Oh |
46 | President and Chief Operating Officer | ||||
| Chad Stone |
41 | Chief Financial Officer | ||||
| Paul Chatterton |
40 | Director | ||||
| Scott P. Chesnut |
61 | Director | ||||
| Delbert Christensen |
62 | Director | ||||
| Eric Hakmiller |
48 | Director | ||||
| Randolph L. Howard |
60 | Director | ||||
| Don Huyser |
52 | Director | ||||
| Michael A. Jackson |
56 | Director | ||||
| Jonathan Koch |
42 | Director | ||||
| Ronald L. Mapes |
70 | Director | ||||
| Christopher D. Sorrells |
43 | Director | ||||
Jeffrey Stroburg has served as our Chief Executive Officer and director since June 2006. Mr. Stroburg concurrently serves as Chief Executive Officer of West Central, a position he has held since October 1999. He has also held the position of President of West Central since July 2003. Prior to joining West Central, Mr. Stroburg was Vice President and Chief Operating Officer of the Eastern Ag Region of Land O’ Lakes, an agricultural cooperative, from 1998 to 1999. From 1997 to 1998, Mr. Stroburg was President and Chief Executive Officer of Countrymark Cooperative, a refiner and distributor of diesel, gasoline and other petroleum products. From 1987 to 1997, Mr. Stroburg was President and Chief Executive Officer of Hamilton Farm Bureau Cooperative and held positions within the Missouri Farmers Association. From 1997 to 1998, Mr. Stroburg also served as a director for A.C. Toepfer International, a Hamburg, Germany trading company for agricultural products, and as a director for CF Industries, a fertilizer manufacturing company. Mr. Stroburg currently serves on the board of directors for the National Council of Farmer Cooperatives, the Associated Benefits Corporation, the Biosciences Alliance of Iowa, the Cooperative Business International, and the Iowa State University’s Center for Crops Utilization Research Industry/Stakeholder Advisory Board. Mr. Stroburg holds a B.S. from Iowa State University. Mr. Stroburg was nominated as a director by West Central.
The Board believes that Mr. Stroburg’s experience, knowledge, skills and expertise as Chief Executive Officer and his knowledge of our operations and effectiveness of our business strategies provides a valuable perspective to our Board and adds significant value. Additionally, Mr. Stroburg’s current experience as the Chief Executive Officer of West Central and prior experience as Chief Executive Officer of Countrymark Cooperative, as well as a number of executive positions with other agriculture and refining companies, are integral to the Board’s assessment of business opportunities and strategic options for our company. Additionally, Mr. Stroburg’s service and experience as a director for other boards, including active involvement in strategy, strengthen the governance and functioning of our Board.
Daniel J. Oh has served as our Chief Operating Officer since June 2007, and President since April 2009. Mr. Oh served as our Chief Financial Officer and Executive Vice President from June 2006 to June 2007 and as Secretary from August 2006 until March 2009. From May 2004 to May 2006, Mr. Oh served at
102
Table of Contents
Management
Agri Business Group, Inc., or ABG, an agribusiness management consulting firm, including as Associate Director, Director and Vice President. Prior to joining ABG, Mr. Oh served in several different positions, including Senior Financial Analyst, Financial Team Member and Manager, in the Corporate Finance and Investment Banking area of the Corporate Strategy and Business Development Group at Eli Lilly and Company, a global pharmaceutical company, from August 2001 to May 2004. From 2000 to August 2001, Mr. Oh served as a consultant with McKinsey & Company, a leading consulting firm, where he focused on the pharmaceutical industry. From 1987 to 1998, Mr. Oh served as an officer in the United States Army, earning the rank of Major. Mr. Oh holds an M.B.A. from the University of Chicago with concentrations in finance, accounting and strategic management as well as a B.S. with a concentration in economics from the United States Military Academy. Mr. Oh serves as a director for the Ames Chamber of Commerce.
Chad Stone has served as our Chief Financial Officer since August 2009. Prior to joining us, he was a Director at Protiviti Inc., a global business consulting and internal audit firm, from October 2007 to May 2009. From August 1997 to September 2007, Mr. Stone served as Director with PricewaterhouseCoopers and was a manager at Arthur Andersen from July 1992 to August 1997. He holds an M.B.A. in Finance from the University of Chicago, Graduate School of Business and a B.B.A in Accounting from the University of Iowa. He is also a Certified Public Accountant.
Paul Chatterton has served as a member of our Board of Directors since June 2009. In January 2011, he became the Commercial Director of Industrials Division at ED&F Man, a sugar, molasses, palm oil, coffee, cocoa and biofuels trading company. Mr. Chatterton has served as Managing Director of ED&F Man Biofuels Ltd since 2006 and a board member of the Molasses & Palm Oil Trading, Feed Products, Third Party Storage and Biofuels Division with ED&F Man. From January 2001 to June 2006, Mr. Chatterton was the General Manager of Westway Terminals Europe, an international bulk liquid storage provider. From 1992 to 1997, Mr. Chatterton worked in different trading and commercial roles for Cargill, Incorporated and then ED&F Man. Mr. Chatterton holds a M.A. from Oxford University. He was nominated as a director by ED&F Man Holdings BV.
The Board believes that Mr. Chatterton’s experience, knowledge, skills and expertise acquired as Managing Director of ED&F Man Biofuels, including experience and understanding of the international trading markets, distribution and operations, as well as biofuels and other commodities, add significant value to our Board.
Scott P. Chesnut has served as a member of our Board of Directors since June 2006. From July 2003 to June 2010, Mr. Chesnut was the Chairman of the Board of West Central. From 1998 until July 2003, he was the Vice Chairman of West Central. He has been the President of Circle C Farm Corporation, a producer of soybeans, corn and beef, since 1993. Mr. Chesnut holds a B.S. in agricultural business from Iowa State University and an A.A. in agricultural engineering from Ellsworth College. Mr. Chesnut was nominated as a director by West Central.
The Board believes that Mr. Chesnut’s experience, knowledge, skills and expertise as a multiple year Chairman of West Central, as well as his commodity and market knowledge as the President of Circle C Farm Corporation, add significant value to our Board.
Delbert Christensen has served as a member of our Board of Directors since August 2006. Mr. Christensen has been a director of West Central since 1993. Mr. Christensen has been the Chairman of the Board of West Central since June 2010. Since January 2004, he has served as the President of CHMD Pork, a hog producer. He was Chairman of the Board of Directors of the Iowa Soybean Association from October 2009 to October 2010 and has been on the Board of Directors of the Iowa
103
Table of Contents
Management
Soybean Association since 2003 and is still serving in that capacity. Mr. Christensen serves on the Soybean Promotion and Research Board including on the Audit and Evaluation and New Uses Committees for the United Soybean Board. Mr. Christensen holds a B.S. in Agricultural Business from Iowa State University. Mr. Christensen was nominated as a director by West Central.
The Board believes that Mr. Christensen’s experience, knowledge, skills and expertise acquired as a director of West Central, President of a hog production operation, previous substantial board experience and commodity and market knowledge as an independent farmer, add significant value to our Board.
Eric Hakmiller has served as a member of our Board of Directors since December 2009. Mr. Hakmiller has served as General Manager and Vice President of the Biofuels Division of Bunge Limited, an agribusiness and food company, since December 2007 and was Chief Administrative Officer from November 2006. Prior to that, Mr. Hakmiller was the Director of Bunge Deutschland and Austria from September 2005 to November 2006 and General Manager and Vice President of Specialty Products Group at Bunge from March 2002 to September 2005. Mr. Hakmiller was selected as a director by Bunge.
The Board believes that Mr. Hakmiller’s experience, knowledge, skills and expertise acquired as the Vice President of Bunge’s Biofuels Division, including experience with operations, risk management and international operations, add significant value to our Board.
Randolph L. Howard has served as a member of our Board of Directors since February 2007. From July 2004 to until his retirement in September 2005, Mr. Howard served as the Senior Vice President for the Global Gas Division of Unocal Corporation, an oil company. Prior to that role, Mr. Howard served as Regional Vice President of Unocal’s International Energy Operations—North ASEAN and President with Unocal Thailand from May 1999 to June 2004. Mr. Howard served in various managerial roles at Unocal over 17 years. Mr. Howard participated in the advanced executive program at Northwestern University and holds a B.S. in chemical engineering from University of California Berkeley. Mr. Howard was nominated as a director by West Central.
The Board believes that Mr. Howard’s experience, knowledge, skills and expertise acquired as an executive officer at Unocal Corporation, including experience and understanding of the oil and petroleum markets and operations, as well as his experience in strategy formation and doing business in international markets, add significant value to our Board.
Don Huyser has served as a member of our Board of Directors since March 2010. Prior to joining our Board and prior to our acquisition of Central Iowa Energy, Mr. Huyser served as a director of CIE since June 2005. He was Treasurer of CIE from April 2008 to March 2010. Since 1986, Mr. Huyser has owned and operated Huyser Ag, Inc., a business primarily involved in row crop farming. He also serves as Vice President of Killduff Feed & Grain, a position which he has had since January 2005. Mr. Huyser was nominated as a director pursuant to the terms by which we acquired CIE.
The Board believes that Mr. Huyser’s experience, knowledge, skills and expertise acquired as a CIE Board member, including experience as its Treasurer, as well as his commodity and market knowledge as the owner of Huyser Ag, add significant value to our Board.
Michael A. Jackson has served as a member of our Board of Directors since August 2006. Mr. Jackson served as the Chief Executive Officer and President of Adayana, Inc., a human capital development and agribusiness management consulting firm, from April 2008 to May 2011 and served as Chief Operating Officer of Adayana, Inc. from February 2006 to April 2008. Mr. Jackson was Chief Executive Officer and President of Agri Business Group, Inc., an agribusiness consulting and training company, which he
104
Table of Contents
Management
founded in 1979, until its merger with Adayana, Inc. in October 2005. Mr. Jackson is a member of the board of directors of Terra Nitrogen Company, L.P., a nitrogen fertilizer company. Mr. Jackson holds a B.S. in agricultural economics from Purdue University. Mr. Jackson was nominated as a director by West Central.
The Board believes that Mr. Jackson’s experience, knowledge, skills and expertise acquired as the Chief Executive Officer of Adayana, Inc. and Agri Business Group, Inc., including experience and understanding of business strategy formation and execution from both a board and management perspective, add significant value to the Board. Additionally, Mr. Jackson’s service and experience as the head of our audit committee and as an independent director for another company, including active involvement in strategy discussions and other matters, strengthen the functioning of our Board.
Jonathan Koch has served as a member of our Board of Directors since June 2008. Mr. Koch has served as a Managing Director of US Renewables Group, an investment firm focused on the renewable energy industry, since July 2004. Prior to joining US Renewables Group, Mr. Koch was Chief Operating Officer for Visible Path, an application service provider. He was the founder and Chief Executive Officer of Sundial, a provider of utility services online. Prior to founding Sundial, Mr. Koch was a Business Development Manager at General Electric Power Systems. Mr. Koch spent more than five years with Booz, Allen & Hamilton. Mr. Koch also serves as a Director for Westerly Wind, a wind development company, General Compression, an energy storage company, Fulcrum BioEnergy, a cellulosic ethanol company, and Niagara Generation, LLC, a power generation facility. Mr. Koch holds a joint M.B.A. and M.S. in Resource Policy from the University of Michigan and a B.A. from Tufts University. Mr. Koch was nominated as a director by USBG.
The Board believes that Mr. Koch’s experience, knowledge, skills and expertise acquired as the CEO and COO of his prior organizations, including experience and understanding of the strategy and operation of a start-up company and board experience with renewable energy companies add significant value to the Board. Additionally, Mr. Koch’s experience as a consultant on large mergers and acquisitions in the energy sector also adds significant value to our Board.
Ronald L. Mapes has served as a member of our Board of Directors since March 2010. Prior to joining our Board and prior to our acquisition of Blackhawk Biofuels in February 2010, Mr. Mapes served as Chair of Blackhawk’s board of managers beginning in March 2006. Mr. Mapes serves as Vice Chairman of the Jo Daviess County Board and also is Chairman of the Economic Development Committee and Executive Committees. As member of the Jo Daviess County Farm Bureau and Illinois Beef Association, Mr. Mapes previously served on the Illinois Soybean Promotion Board, United Soybean Board, and United States Meat Federation Board and Executive Committee. Mr. Mapes is a trustee for Stockton Township, and serves on the Mt. Carroll Mutual Insurance Company board. Mr. Mapes attended the University of Wisconsin. Mr. Mapes was nominated as a director pursuant to the terms by which we acquired Blackhawk Biofuels.
Board believes that Mr. Mapes’ experience, knowledge, skills and expertise acquired as the Chairman of the Blackhawk Biofuels Board, previous substantial board experience and commodity and market knowledge as a family grain and cattle operations owner, add significant value to our Board.
Christopher Sorrells has served as a member of our Board of Directors since November 2008. Mr. Sorrells has worked at NGP Energy Technology Partners, L.P., a private equity firm investing in technology and services companies focused on the energy and power industries, since its formation in September 2005 and currently serves as a Managing Director. From September 2003 to September 2005, Mr. Sorrells worked at Clarity Partners, a private equity firm. Mr. Sorrells served as a principal with
105
Table of Contents
Management
Banc of America Securities from June 1998 to November 2002 and as an associate with Salomon Smith Barney from August 1996 to June 1998. Mr. Sorrells is a member of the board of directors of Living Earth, an organic manufacturing and recycling company, groSolar, a commercial installer of solar energy systems, and Lehigh Technologies, a manufacturer of industrial polymers, and he is a board observer at Community Energy, a utility scale solar developer. Mr. Sorrells holds an M.B.A. from the College of William and Mary, a Masters of Accounting degree from the University of Southern California, and a B.A. from Washington and Lee University. Mr. Sorrells was nominated as a director by NGP Energy Technology Partners, L.P.
The Board believes that Mr. Sorrells’ experience, knowledge, skills and expertise acquired as a Managing Director of NGP Energy Technology Partners, L.P., including experience and understanding of the operation and governance of public companies and knowledge of debt and equity markets, add significant value to the Board. Mr. Sorrells’ knowledge of energy, power, and renewable energy industries, including solar energy, organic waste streams and chemical products, acquired as a director of Living Earth, groSolar and Lehigh Technologies adds further value to the Board, particularly when it comes to assessing historical trends and strategic options for our company.
KEY EMPLOYEES
The following table summarizes other key officers and employees. The ages of individuals are provided as of August 31, 2011:
| Name | Age | Position | ||||
| Brad Albin |
49 | Vice President, Manufacturing | ||||
| Chad Baker |
36 | Controller | ||||
| Eric Bowen |
39 | Executive Director, Corporate Business Development & Legal Affairs | ||||
| David Elsenbast |
50 | Vice President, Supply Chain Management | ||||
| Gary Haer |
58 | Vice President, Sales and Marketing | ||||
| Natalie Lischer |
34 | Secretary and Treasurer | ||||
| Keith Olson |
47 | Executive Director, Corporate Finance & Investment Banking | ||||
Brad Albin has served as our Vice President, Manufacturing since February 2008. Mr. Albin also served as Vice President of Construction Services from April 2007 through February 2008. From September 2006 through April 2007, Mr. Albin served as Director, Construction. Prior to joining us, Mr. Albin served as General Manager for West Central, one of our predecessors from October 2005 through September 2006. From November 2002 to January 2006, Mr. Albin served as Executive Director of Operations for Material Sciences Corporation, where he directed multi-plant operations for automotive and global appliance industries. From 1996 to 2002, Mr. Albin was the Vice President of Operations for Griffin Industries. Mr. Albin has over 22 years of experience in executive operations positions in multi-feedstock biodiesel, chemical, food and automotive supplier companies, such as The Monsanto Company, The NutraSweet Company and Griffin Industries. Mr. Albin was a charter member of the National Biodiesel Accreditation Committee. Mr. Albin is currently the Vice President of the Iowa Renewable Fuels Association and will be the President in 2012. Mr. Albin holds a B.S. in chemistry from Eastern Illinois University.
Chad Baker has served as our Controller since October 2010. From December 2008 to October 2010, Mr. Baker served as our Accounting Manager – Commodities & Risk. Prior to joining us, Mr. Baker served as the Internal Audit and Compliance Manager for Hawkeye Energy Holdings, LLC, an ethanol company, from September 2006 to December 2008. From September 2003 to September 2006, Mr. Baker served as Senior Financial Analyst for Pioneer Hi-Bred International, Inc. Prior to that,
106
Table of Contents
Management
Mr. Baker was an accounting manager for Ernst & Young, LLP from September 1997 to September 2003. Mr. Baker has over 13 years experience in financial auditing and accounting. He holds a B.A. in accounting from Northwestern College and is a licensed certified public accountant.
Eric Bowen has served as our Executive Director, Corporate Business Development & Legal Affairs since July 2010. Prior to joining us, Mr. Bowen co-founded Tellurian Biodiesel, Inc. in September 2006 and served as its President and Chief Executive Officer until we acquired Tellurian in July 2010. In October 2005, Mr. Bowen co-founded San Francisco Biodiesel, Tellurian’s predecessor, and served as its managing director until the formation of Tellurian. Prior to Tellurian, Mr. Bowen led Sigma Capital’s biodiesel project finance group. From 1999 until October 2004, Mr. Bowen practiced corporate and securities law at the Venture Law Group. Mr. Bowen is a founding member of the California Biodiesel Alliance and has served as its chairman since 2007. He is also the former chairman of the San Francisco Biodiesel Taskforce and is a member of the California Air Resource Board’s Low Carbon Fuel Standard Advisory Panel. Mr. Bowen has over 14 years experience in business and law, with the last six years focused on the biodiesel industry. Mr. Bowen holds a J.D. from the University of California, Berkeley and a B.A. from the University of Oregon Honors College.
David Elsenbast has served as our Vice President, Supply Chain Management since April 2009. From August 2006 to April 2009, Mr. Elsenbast served as our Vice President, Procurement. Prior to joining us, Mr. Elsenbast served in the same role for West Central, since April 2006. Mr. Elsenbast has also served on the Board of the American Fats and Oils Association since October 2009. From 1990 to March 2006, Mr. Elsenbast served in various roles for Milk Specialties Company, an animal nutrition company, including Vice President of Business Development, Vice President of Operations and Purchasing and General Manager. Mr. Elsenbast has over 27 years in agricultural business development, supply chain management, operations, and purchasing. Mr. Elsenbast holds a B.S. in agricultural business from Iowa State University.
Gary Haer has served as our Vice President, Sales and Marketing since we commenced operations in August 2006. From October 1998 to August 2006, Mr. Haer served as the National Sales and Marketing Manager for biodiesel for West Central and was responsible for developing the marketing and distribution infrastructure for biodiesel sales in the United States. Mr. Haer has over 15 years of experience in the biodiesel industry. Mr. Haer is currently Chairman of the NBB’s Governing Board and has been elected to various officer positions during his tenure from 1998 to 2011. Mr. Haer holds a M.B.A. from Baker University and a B.S. in accounting from Northwest Missouri State University.
Natalie Lischer has served as our Secretary since April 2009 and Treasurer since May 2009. From January 2007 to May 2009, Ms. Lischer served in various finance roles with us, including Senior Manager of Corporate Finance and Investment Banking. Prior to joining us, Ms. Lischer served as a Senior Consultant for Deloitte Consulting, LLP from July 2005 to January 2007. Ms. Lischer has over 10 years of experience in finance and accounting. She holds a M.B.A from Washington University, a Master of Accountancy from Truman State University and a B.S. in accounting from Truman State University. Ms. Lischer is also a licensed certified public accountant.
Keith Olson has served as our Executive Director, Corporate Finance and Investment Banking since January 2009. Prior to joining us, Mr. Olson operated his own financial advisory firm, Olson Advisory, LLC, representing middle market clients involved in merger transactions since January 2008. From January 2005 to December 2007, Mr. Olson was a Managing Director with Stout Risius Ross Advisors, LLC, an investment banking firm specializing in mergers and acquisitions advice and private capital raising services. Prior to that, Mr. Olson was an investment banker with ABN AMRO Incorporated, The
107
Table of Contents
Management
Chicago Corporation and First Chicago Corporation and was a consultant with Andersen Consulting. Mr. Olson has over 20 years of experience in finance and investment banking. He holds a M.B.A. from the University of Chicago Booth School of Business and a B.S. in operations research and industrial engineering from Cornell University.
BOARD COMPOSITION
Our Board of Directors is currently composed of eleven members, all of whom are independent, except for Mr. Stroburg. Our bylaws provide that the authorized number of board seats, which is currently eleven, shall be not less than one and not more than fourteen, with the exact number to be fixed from time to time by a resolution of the majority of our Board of Directors. Each officer serves at the discretion of the Board of Directors and holds office until his successor is duly elected and qualified or until his or her earlier resignation or removal. There are no family relationships among any of our directors or executive officers. In addition, USRG and NGP Technology Partners, L.P., who following the offering will beneficially own % and % of our outstanding fully diluted capital stock, respectively, will each hold the rights to appoint a director to our Board of Directors for a period from and after the closing of this offering pursuant to an investment agreement to be executed immediately prior to the closing of this offering. For a discussion of the investment agreement, see the section entitled “Certain relationships and related party transactions—Investment Agreement.”
BOARD COMMITTEES
Audit Committee. The audit committee provides assistance to the Board of Directors in fulfilling its legal and fiduciary obligations in matters involving our accounting, auditing, financial reporting, internal control and legal compliance functions by approving the services performed by our independent registered public accounting firm and reviewing their reports regarding our accounting practices and systems of internal accounting controls. The audit committee also oversees the audit efforts of our independent registered public accounting firm and takes those actions as it deems necessary to satisfy itself that the independent registered public accounting firm is independent of management. Our audit committee is comprised of Michael Jackson (Chairman), Scott Chesnut and Eric Hakmiller, each of whom is a non-employee member of our Board of Directors. We believe that each member of our audit committee meets the requirements for independence and financial literacy under the applicable requirements of the United States Securities and Exchange Commission, or SEC rules and regulations. Mr. Jackson is our audit committee financial expert as currently defined under SEC rules.
Compensation Committee. The compensation committee determines our general compensation policies and the compensation provided to our directors and officers. The compensation committee also reviews and determines bonuses for our officers and other employees. In addition, the compensation committee reviews and determines equity-based compensation for our directors, officers, employees and consultants and administers our stock incentive plan. Our compensation committee also oversees our corporate compensation programs. Our compensation committee is currently comprised of Chris Sorrells (Chairman), Scott Chesnut, Mike Jackson and Jonathan Koch. We believe that the composition of our compensation committee meets the criteria for independence under, and the functioning of our compensation committee complies with the applicable requirements of, the Sarbanes-Oxley Act of 2002 and SEC rules and regulations.
Nominating and Governance Committee. The nominating and governance committee is responsible for making recommendations to the Board of Directors regarding candidates for directorships and the size and composition of the board. In addition, the nominating and governance committee is responsible for overseeing our corporate governance guidelines and reporting and making recommendations to the Board of Directors concerning corporate governance matters. The members of the nominating and
108
Table of Contents
Management
governance committee are Delbert Christensen (Chairman), Paul Chatterton, Randy Howard and Chris Sorrells. We believe that the composition of our nominating and governance committee meets the criteria for independence under, and the functioning of our nominating and governance committee currently complies with the applicable requirements of, the Sarbanes-Oxley Act of 2002, and SEC rules and regulations.
COMPENSATION COMMITTEE INTERLOCKS AND INSIDER PARTICIPATION
Chris Sorrells (Chairman), Scott Chesnut, Mike Jackson, and Jonathan Koch served as members of our Compensation Committee during 2010. All are outside, independent directors, and none of our named executive officers served as a director or as a member of a compensation committee of any business entity employing any of our directors during 2010.
DIRECTOR COMPENSATION
Our directors did not receive any cash compensation for the fiscal year ended December 31, 2010. Messrs. Jackson, Howard, Chesnut, and Christensen received grants of 33,083, 33,458, 10,458 and 10,458 RSUs, respectively, in August, 2010 in respect of previously deferred cash director fees. The RSUs become exercisable three years after the date of grant and are convertible on a one-for-one basis into our Class A Common Stock.
The following table provides information regarding director compensation during fiscal year 2010.
| Name | Stock Awards ($)(1) |
Total ($) |
||||||
| Paul Chatterton |
— | — | ||||||
| Scott P. Chesnut |
$ | 49,571 | $ | 49,571 | ||||
| Delbert Christensen |
49,571 | 49,571 | ||||||
| Eric Hakmiller |
— | — | ||||||
| Randolph L. Howard |
158,591 | 158,591 | ||||||
| Don Huyser |
— | — | ||||||
| Michael A. Jackson |
156,813 | 156,813 | ||||||
| Jonathan Koch |
— | — | ||||||
| Ronald L. Mapes |
— | — | ||||||
| Christopher D. Sorrells |
— | — | ||||||
| Jeff Stroburg |
2,966,738 | 2,966,738 | ||||||
| (1) | Represents the grant date fair value of restricted stock units granted under our 2009 Stock Incentive Plan in August, 2010, as computed in accordance with FASB ASC Topic 718. For a summary of the assumptions used in the valuation of awards made in 2010, please see note 16 to our audited consolidated financial statements included in this prospectus. |
109
Table of Contents
COMPENSATION DISCUSSION AND ANALYSIS
COMPENSATION PHILOSOPHY AND OBJECTIVES
Our compensation philosophy is to align executive compensation with the interests of our stockholders and therefore to financial objectives that the Board of Directors believes are primary determinants of long-term stockholder value.
Our compensation system is based largely on the compensation system of our predecessors, which was a privately-held company. We are in the process of developing more formal compensation policies and procedures in order to attract and retain talented executives and other key employees. To assist us, we have retained Grant Thornton as our compensation consultant. We expect to adopt compensation plans that set compensation at levels that are comparable to those at other companies of similar size and stage of development operating in the biofuel industry, as well as companies in the region with whom we compete for talent, while taking into account our relative performance and strategic goals.
ROLE OF THE COMPENSATION COMMITTEE AND MANAGEMENT
The compensation committee of our board has the overall responsibility for advising the independent members of our Board of Directors regarding the compensation of our named executive officers. Members of the compensation committee are appointed by our board. The compensation committee makes its compensation recommendations based on the judgment of its members based on their tenure and experience and after receiving input from our Chief Executive Officer. The independent members of our Board of Directors, taking into account the recommendations of the compensation committee, have the ultimate responsibility of formulating, evaluating and determining the compensation of our named executive officers, including the compensation of our Chief Executive Officer.
ELEMENTS OF COMPENSATION
Base Salary
We pay our named executive officers a base salary based on the experience, skills, knowledge and responsibilities required of each officer, other than our Chief Executive Officer who, based on our arrangement with West Central, does not receive a base salary from us. We believe base salaries are an important element in our overall compensation program because base salaries provide a fixed element of compensation that reflects job responsibilities and value to the Company.
Our Chief Executive Officer, Mr. Stroburg, concurrently serves as our Chief Executive Officer and as the Chief Executive Officer of West Central. Prior to February 2009, pursuant to an oral agreement, we reimbursed West Central for a pro-rated portion of Mr. Stroburg’s base salary based on an estimate of the relative amount of time he devoted to REG’s activities. In February 2009 it was orally agreed that Mr. Stroburg would not earn a salary for his services provided to REG in light of difficult market and industry conditions. While conditions have improved, there have been no additional discussions with West Central about our resuming payment of a portion of Mr. Stroburg’s salary. As such, we did not pay Mr. Stroburg a base salary in 2010.
In 2010, we did not make any adjustments to the base salaries of either our President or Chief Financial Officer due to uncertain market conditions as a result of the expiration of the blenders’ credit and other factors that were prevalent throughout most of the year.
110
Table of Contents
Executive compensation
Long-Term Cash Incentive Plans
We do not currently have an annual cash incentive or long-term cash incentive plan and did not have such plans in either 2008, 2009, or 2010. In connection with our efforts to formalize our compensation practices, we are considering adopting such a plan. However, no determinations have been made to date.
Long-Term Equity Compensation
We currently provide our named executive officers with long-term equity compensation through our 2009 Stock Incentive Plan, pursuant to which we have granted employees and consultants restricted stock unit awards. We believe that providing our named executive officers with an equity interest in the Company brings their interests in line with those of our stockholders and that including a vesting component to those equity interests encourages named executive officers to remain with us for the long term.
In August 2010, all outstanding options of our predecessor held by our employees, including our named executive officers, were cancelled and each employee was issued restricted stock units under the 2009 Stock Incentive Plan. Mr. Stroburg and Mr. Oh each received an additional grant of 18,000 and 18,635 restricted stock units, respectively. These additional amounts were intended to restore an equal amount of value to both Mr. Stroburg and Mr. Oh in light of the reduced compensation each had taken in 2009 and 2010 due to difficult market conditions.
Other Supplemental Benefits
Our named executive officers are eligible for the following benefits on a similar basis as other eligible employees:
| Ø | health, dental and vision insurance; |
| Ø | vacation, personal holidays and sick days; |
| Ø | life insurance and supplemental life insurance; |
| Ø | short-term and long-term disability; and |
| Ø | a 401(k) plan with matching contributions. |
111
Table of Contents
Executive compensation
SUMMARY COMPENSATION TABLE
The following table summarizes certain compensation paid to our Chief Executive Officer, President and Chief Operating Officer and Chief Financial Officer during the years ended December 31, 2010, 2009, and 2008.
| Name and Positions(s) | Year | Salary ($) |
Bonus ($) |
Stock Awards ($)(1) |
All Other Compensation ($)(2) |
Total ($) | ||||||||||||||||||
| Jeffrey Stroburg |
2010 | — | — | $ | 2,966,738 | — | $ | 2,966,738 | ||||||||||||||||
| Chief Executive Officer |
2009 | $ | 72,187 | (3) | — | — | — | $ | 72,187 | |||||||||||||||
| 2008 | $ | 370,310 | (4) | — | — | — | $ | 370,310 | ||||||||||||||||
| Daniel J. Oh |
2010 | $ | 260,926 | — | $ | 2,249,393 | $ | 4,845 | $ | 2,515,164 | ||||||||||||||
| President and Chief Operating Officer |
2009 | $ | 255,532 | — | — | $ | 3,790 | $ | 259,322 | |||||||||||||||
| 2008 | $ | 291,377 | — | — | $ | 3,733 | $ | 295,110 | ||||||||||||||||
| Chad Stone(5) |
2010 | $ | 186,252 | — | $ | 592,500 | $ | 5,735 | $ | 784,487 | ||||||||||||||
| Chief Financial Officer |
2009 | $ | 64,967 | $ | 10,000 | — | $ | 2,249 | $ | 77,216 | ||||||||||||||
| 2008 | — | — | — | — | — | |||||||||||||||||||
| (1) | Represents the grant date fair value of restricted stock unit awards granted to each named executive officer, computed in accordance with FASB ASC Topic 718. For a summary of the assumptions used in the valuation of awards made in 2010, please see note 16 to our audited consolidated financial statements included in this prospectus. These awards will vest on August 18, 2013. The restricted stock units were granted with respect to stock options that were cancelled on August 18, 2010. Mr. Stroburg and Mr. Oh each received an additional grant of 18,000 and 18,635 restricted stock units, respectively, to restore an equivalent amount of value to each in light of the reduced compensation each had taken in 2009 and 2010 due to difficult market conditions. The named executive officers no longer hold any stock options and no stock options were granted to the named executive officers in 2008, 2009 or 2010. |
| (2) | Represents 401(k) match payments under REG’s 401(k) plan. |
| (3) | Represents amounts paid to West Central for services provided by Mr. Stroburg in January 2009 and February 2009. REG did not reimburse West Central for any amounts paid to Mr. Stroburg by West Central after February 2009 in light of the agreement that Mr. Stroburg would not earn a salary for his services provided to REG in light of difficult market and industry conditions. |
| (4) | Represents amounts paid to West Central for services provided by Mr. Stroburg as REG’s Chief Executive Officer. See “Certain relationships and related party transactions” for more information about these payments. |
| (5) | Mr. Stone joined REG in August 2009. |
GRANTS OF PLAN BASED AWARDS TABLE
The following table provides information regarding plan-based awards granted during fiscal year 2010 to the Named Executive Officers.
| Name | Grant Date |
All Other Stock Awards: Number of Shares of Stock or Units (#)(1) |
Grant Date Fair Stock and Option |
|||||||||
| Jeffrey Stroburg(3) |
08/18/2010 | 625,894 | $ | 2,966,738 | ||||||||
| Chief Executive Officer |
||||||||||||
| Daniel J. Oh(4) |
08/18/2010 | 474,556 | $ | 2,249,393 | ||||||||
| President and Chief Operating Officer |
||||||||||||
| Chad Stone(5) |
08/18/2010 | 125,000 | $ | 592,500 | ||||||||
| Chief Financial Officer |
||||||||||||
| (1) | Represents restricted stock units granted under our 2009 Stock Incentive Plan in August 2010. |
| (2) | Represents the grant date fair value of the restricted stock units received by the named executive officers, computed in accordance with FASB ASC Topic 718. For a summary of the assumptions used in the valuation of awards made in 2010, please see note 16 to our audited consolidated financial statements included in this prospectus. |
(footnotes continued on following page)
112
Table of Contents
Executive compensation
| (3) | Mr. Stroburg was granted 607,894 restricted stock units in exchange for cancellation of his options in the predecessor company. Mr. Stroburg was also granted an additional 18,000 restricted stock units. |
| (4) | Mr. Oh was granted 455,921 restricted stock units in exchange for the cancellation of his options in the predecessor company. Mr. Oh was also granted an additional 18,635 restricted stock units. |
| (5) | Mr. Stone was granted 125,000 restricted stock units in exchange for the cancellation of his options in the predecessor company. |
OUTSTANDING EQUITY AWARDS AT FISCAL YEAR-END TABLE
The following table provides information about the number of outstanding equity awards held by our Named Executive Officers at fiscal year-end 2010.
| Stock Awards | ||||||||||||
| Name | Grant Date |
Number of Not Vested (#)(1) |
Market Value of Shares ($) |
|||||||||
| Jeffrey Stroburg |
08/18/2010 | 625,894 | $ | 2,966,738 | ||||||||
| Chief Executive Officer |
||||||||||||
| Daniel J. Oh |
08/18/2010 | 474,556 | $ | 2,249,393 | ||||||||
| President and Chief Operating Officer |
||||||||||||
| Chad Stone |
08/18/2010 | 125,000 | $ | 592,500 | ||||||||
| Chief Financial Officer |
||||||||||||
| (1) | Represents restricted stock units granted under our 2009 Stock Incentive Plan in August, 2010 which vest on August 18, 2013. |
SEVERANCE AND CHANGE IN CONTROL PAYMENTS
Acceleration of Equity
Restricted stock units held by each of Messrs. Stroburg, Oh and Stone will vest in full (i) upon involuntary termination by the Company without cause, (ii) upon a change in control of the Company, (iii) on the first date that they sell Company common stock on a national securities exchange, and (iv) three months following the creation of a regular trading market for the Company’s common stock where trading volume exceeds one percent of the outstanding shares of the Company. If a change in control were to occur as of December 31, 2010, the named executive officers would be entitled to receive the value of the restricted stock units that would become vested. The named executive officers would be entitled to the following amounts: Mr. Stroburg – $2,966,738; Mr. Oh – $2,249,393; and Mr. Stone – $592,500.
Employment Agreements
We have entered into an employment agreement with Mr. Oh, currently REG’s President and Chief Operating Officer, with a three year term commencing August 1, 2006, which renews automatically on a quarterly basis until terminated by either party. As of July 31, 2011, neither party has provided notice to terminate this agreement. If we terminate Mr. Oh’s employment without cause or Mr. Oh terminates his employment for good reason, then within thirty days of the date of his termination, we will pay Mr. Oh a lump sum payment in an amount equal to the sum of his annual base salary accrued but not yet paid through the date of termination, one-half of his annual base salary then in effect, any bonus earned
113
Table of Contents
Executive compensation
during the prior calendar year but not yet paid and payment with respect to accrued but unused vacation, as well as additional relocation expenses and outplacement support services. Mr. Oh would be required to execute a release in order to receive the severance payments under his employment agreement. If Mr. Oh was terminated on December 31, 2010 he would be entitled to severance payments of $246,901.
114
Table of Contents
Certain relationships and related party transactions
Each of West Central, Bunge, and ED&F Man are significant beneficial owners of our Series A preferred stock and common stock, and, as a result of the conversion of our Series A preferred stock, immediately prior to the closing of this offering, will be significant beneficial owners of our Class A Common Stock. See “Principal stockholders and selling stockholders,” for a detailed listing of each owner’s holdings.
WEST CENTRAL COOPERATIVE
We have several contractual relationships and transactions with West Central, including contracts for services, supply of soybean oil feedstock, a ground lease for our Ralston facility and an extended payment terms arrangement.
In 2006, we entered into a contract for services with West Central, to provide certain corporate and administrative services such as human resources, information technology, and accounting. We pay West Central its proportionate share of the costs associated with the provision of services, plus a 15% margin. The agreement had an initial one-year term and is now cancellable upon six months notice by either party. The expenses related to this agreement totaled $134,000, $288,000 and $1,269,000 for the years ended December 31, 2010, 2009 and 2008, respectively.
Under our ground lease with West Central, West Central leases to us the real property on which our Ralston facility is located for an annual rental fee of one dollar. The ground lease has a 20-year term ending July 31, 2026 and we may elect to extend the term for six additional five-year terms. Under an Asset Use Agreement between us and West Central, West Central provides us with the use of certain assets, such as office space, maintenance equipment and utilities, for which we pay a proportionate share of the costs. This agreement has the same term as the ground lease. The expenses related to this agreement totaled $40,000 each year for the years ended December 31, 2010, 2009 and 2008, respectively.
We purchase once-refined soybean oil from West Central to supply our Ralston facility. These purchases are made under an feedstock supply agreement that expired in July 2010. The agreement provided that West Central would supply and we would purchase all of our soybean oil requirements for the Ralston facility at a price based on the nearby futures contract price for crude system oil quoted on the CBOT plus a provision fee. Since the agreement expired, we and West Central have continued to operate on substantially the same terms, although there can be no assurance that we will continue to do so. We have paid West Central $14,739,000, $21,893,000 and $38,848,000 for soybean oil for the years ended December 31, 2010, 2009 and 2008, respectively. We also had biodiesel and co-product sales to West Central which totaled $20,000, $11,000 and $30,000 for the years ended December 31, 2010, 2009 and 2008, respectively.
In June 2009, we entered into an extended payment terms agreement with West Central. The agreement sets forth the terms of payment that apply for soybean oil that West Central sells to us for use at our Ralston facility, as well as any other feedstock that West Central may agree to sell to us. Pursuant to the agreement, payment for feedstocks delivered to us by West Central is required to be made within 45 days after delivery by West Central of an invoice for the feedstocks. Interest accrues on amounts due for feedstocks supplied by West Central beginning on the fifth day after West Central delivered an invoice for the feedstock until paid. At no time during the term of the agreement is the amount payable to West
115
Table of Contents
Certain relationships and related party transactions
Central permitted to exceed $3.0 million. Under the agreement, we have granted West Central a security interest in certain current and after acquired personal property associated with the Ralston facility. The agreement will expire in February 2012. We recorded interest expense of $123,000, $0 and $0 for the years ended December 31, 2010, 2009 and 2008, respectively, related to this extended payment terms agreement with West Central and had a balance due to West Central of $2,539,000 at December 31, 2010.
In August 2006, we hired Mr. Stroburg as our Chief Executive Officer. At such time, pursuant to an oral agreement, we paid a salary to Mr. Stroburg consistent with the amount that he received in his capacity with West Central. Because Mr. Stroburg concurrently serves as our Chief Executive Officer and as the Chief Executive Officer of West Central, in 2008 West Central determined and paid Mr. Stroburg’s $389,800 annual salary and we reimbursed West Central for a pro-rated portion based on an estimate of the relative amount of time he devoted to our activities. In 2008, we paid 95% of Mr. Stroburg’s salary plus benefits. In February 2009, it was orally agreed that Mr. Stroburg would not earn a salary for his services provided to us in light of difficult market and industry conditions. As a result, we did not reimburse West Central for any amounts paid to Mr. Stroburg by West Central after February 2009.
BUNGE NORTH AMERICA
Effective May 8, 2009, we entered into a Master Services Agreement with Bunge, which we refer to as the Bunge MSA. The Bunge MSA created a structure whereby Bunge may purchase supplies of inedible animal fat, soybean oil, inedible corn oil and other products as feedstock for resale to us or its affiliates for biodiesel production at one or more of the biodiesel production facilities owned or operated by us. Additionally, the Bunge MSA provided a structure under which Bunge may also purchase biodiesel produced by us or its affiliates at one of more of our facilities for resale to our customers. Neither the amount of feedstock contracted to be sold by Bunge to us, nor the amount of biodiesel purchased by Bunge from us for resale to our customers, may exceed $10 million at any point in time. If Bunge provides any of these services pursuant to the Bunge MSA to us or one of our facilities, Bunge will be the sole provider of such services with limited exception. The Bunge MSA has applied to our Danville and Newton facilities since 2009.
Pursuant to the Bunge MSA, Bunge was entitled for its services to an initial, one-time fee of $150,000. We are also obligated to pay Bunge a monthly fee of $40,000, resulting in aggregate payments by us of $480,000, $461,000 and $0 in 2010, 2009 and 2008, respectively. In addition, an incentive fee must be paid to Bunge for each facility for which Bunge provides services equal to 1.5% of the production gross margin of each of our applicable facilities up to a total of $1.5 million, resulting in aggregate incentive fee expensed by us of $513,000, $156,000 and $0 for the years ended December 31, 2010, 2009 and 2008, respectively. Further, Bunge is entitled to a variable rate fee on the aggregate outstanding amount (defined below) for all of our facilities for which Bunge is providing services under the Bunge MSA at a rate per annum equal to the greater of (determined daily) (a) 7 1/2% per annum over and above the LIBOR rate or (b) 10% per annum. The aggregate outstanding amount is defined as (a) all amounts paid by Bunge to purchase feedstock for resale to us or one of our affiliates and for which Bunge has not received payment from us or such affiliate, and (b) all amounts paid by Bunge to us or one of our affiliates for the purchase of biodiesel until the earlier of (i) the due date for payment for such biodiesel from the third party purchaser, or (ii) the date that Bunge has received payment for such biodiesel from the third party purchaser. Finally, we must pay interest on any amounts that are past due equal to the greater of (a) 10-1/2% per annum over and above the LIBOR rate or (b) 13% per annum.
116
Table of Contents
Certain relationships and related party transactions
The initial term of the Bunge MSA is three years and it will automatically renew for successive three-year terms unless either party gives prior written notice to the other party of its election not to renew no later than 180 days prior to the expiration of the initial term or the then current renewal term. Bunge may terminate the Bunge MSA any time, with or without cause, upon at least either 15 or 45 days’ prior written notice depending on certain production milestones. Bunge also has a right to terminate the Bunge MSA if certain events of default occur, including the failure by us to perform our obligations under another material agreement between REG and Bunge.
Pursuant to the Bunge MSA, our subsidiary, REG Danville and Bunge entered into an agreement pursuant to which Bunge may purchase biodiesel for resale to third parties that is produced by the Danville facility, thereby accelerating payment to us and for which we pay Bunge a fee. On October 22, 2009, we, REG Newton, one of our subsidiaries, and Bunge entered into a new agreement with substantially the same terms. Aggregate proceeds from the sale of biodiesel from us under these agreements, which REG ultimately sells to unrelated third parties and accounts for as external sales, were $37,502,000, $18,178,000 and $0 for the years ended 2010, 2009 and 2008, respectively. This agreements with Bunge will continue until the Bunge MSA expires or we nominate a different facility for the services.
Pursuant to the Bunge MSA, on July 6, 2009, we, REG Danville and Bunge entered into an agreement pursuant to which Bunge may purchase supplies of inedible corn oil, inedible animal fat or other products as feedstocks for resale to us for use in biodiesel production at the Danville facility. On October 22, 2009, we, REG Newton and Bunge entered into a new agreement with substantially the same terms. Under the agreements, Bunge purchases feedstock identified by us and then sells it to us at the time the feedstock enters the Danville or the Newton facility for processing. Pursuant to this agreement, REG Danville and REG Newton have granted Bunge certain storage rights at the facility. There are no minimum commitments for supply under this agreement. This agreement with Bunge will continue until the Bunge MSA expires, or we nominate a different facility for the services. Purchases from Bunge under these agreements were $96,659,000, $31,183,000 and $0 for the years ended December 31, 2010, 2009 and 2008, respectively.
We incurred $211,000, $26,000 and $0 in interest expense for the years ended December 31, 2010, 2009 and 2008, respectively, related to the above described biodiesel purchase arrangements with Bunge.
ED&F MAN HOLDINGS LIMITED
We also entered into a tolling agreement with ED&F Man for biodiesel to be produced out of our Houston, Texas biodiesel production facility. Our revenues from ED&F Man on biodiesel produced under this tolling agreement and from other biodiesel sales were $4,241,000, $12,659,000 and $10,023,000 for the years ended December 31, 2010, 2009 and 2008, respectively. We had accounts receivable due from ED&F Man of $1,066,000 as of December 31, 2010.
SENECA TRANSACTION
On April 8, 2010, our wholly-owned subsidiary REG Seneca agreed to lease and operate a 60 mmgy biodiesel production facility located in Seneca, Illinois, or the Seneca facility, which had previously been acquired from certain Chapter 11 debtors in consideration for the assumption of certain indebtedness. The lease has a term of seven years on a net lease basis covering the debt service on $36.25 million of mortgage indebtedness against the Seneca facility, as well as taxes, utilities, maintenance and other operating expenses. The Seneca facility is leased from an entity, or Landlord, owned by three of our significant stockholders: Bunge, USRG and West Central.
117
Table of Contents
Certain relationships and related party transactions
In connection with our lease and operation of the Seneca facility:
(i) Landlord funded $4.0 million in cash to pay for repairs and improvements to the Seneca facility and certain transaction costs,
(ii) we guaranteed investor fee payments to Bunge, USRG and West Central, collectively, of $150,000 per quarter,
(iii) we acquired a “call” right to purchase the membership units of Landlord for an amount equal to the “put/call” price (as defined below), and
(iv) Bunge, USRG and West Central acquired a “put” right to require us to purchase the membership units of Landlord provided that we have excess net working capital of at least 1.5 times the “put/call” price (as defined below).
The “put/call” price is equal to the greater of (i) a 35% internal rate of return on the investment, or (ii) three times the investment. The investment includes $4.0 million plus any portion of the quarterly investor fee payments of $150,000 that are deferred. The quarterly payments of $150,000 are also credited to the “put/call” price.
We are obligated to issue an aggregate of 150,000 shares of our common stock to Bunge, USRG and West Central upon exercise of the put or call rights. The term of the put and call extends to April 8, 2017 or, if earlier, the termination of our lease of the Seneca facility. If the lease is terminated due to our breach, we are required to issue to Bunge, USRG and West Central a three-year note in the principal amount of $4.0 million subject to certain adjustments, and bearing interest at the rate of 15% per annum.
To provide for working capital expenses relating to the Seneca facility, certain of our subsidiaries responsible for the operation of the Seneca facility, and us as guarantor, entered into a revolving credit agreement with WestLB, which had an initial available credit line of $10 million with additional lender increases up to a maximum commitment of $18 million. As of June 30, 2011, $10 million was outstanding under this credit line. We issued 500,000 shares of our common stock to WestLB in connection with entering into the revolving credit agreement.
In connection with the transactions described above, REG Seneca entered into an accounts agreement relating to the deposit of Seneca facility cash flow, which includes provisions for payments for operating expenses, debt service and excess cash flow at the Seneca facility to the parties in an agreed order of priority. We expect to use approximately $12.0 million of the proceeds of this offering to acquire the Seneca facility from Bunge, USRG and West Central. See “Use of Proceeds.”
USRG
We have entered into a termination agreement relating to a glycerin option agreement with USRG pursuant to which, immediately prior to the completion of this offering, we will issue 500,000 shares of Class A Common Stock to USRG. Upon the issuance of these shares, the glycerin option agreement will be terminated.
On August 4, 2011, REG Albert Lea, LLC, one of our wholly-owned subsidiaries, or REG Albert Lea, entered into a Loan Agreement, or the USRG Loan Agreement, with USRG under which USRG agreed to loan REG Albert Lea $10.0 million for the purpose of purchasing feedstocks and chemicals for REG Albert Lea facility. The USRG Loan Agreement is evidenced by a note. Amounts borrowed under the
118
Table of Contents
Certain relationships and related party transactions
USRG Loan Agreement bear interest at a rate of 12% per annum. REG Albert Lea is obligated to pay interest on the amounts borrowed monthly beginning on August 15, 2011. The amounts borrowed under the USRG Loan Agreement are repayable in full on December 15, 2011 with certain prepayments due weekly beginning November 15, 2011. Any payments prior to the maturity date that are not made within 10 days of the due date we will incur a late charge equal to 5% of the amount of such payment. In the event the loan is not repaid in full by December 15, 2011, REG Albert Lea will be required to pay $1.0 million initially and $500,000 on every fifth day thereafter until such amounts outstanding have been paid. The interest rate of the loan will increase in the event the loan is not repaid on the maturity date to the lesser of (i) the maximum rate permitted by New York law or (ii) the rate per annum, calculated each day during which such rate shall apply, which shall on the first day be equal to 8% in excess of 12%, the rate of interest under the note, and then on each subsequent day be equal to 5% in excess of the rate of interest as computed on the prior day. Amounts outstanding under the USRG Loan Agreement may become immediately due and payable upon the occurrence of specified events, including: failure to pay any obligations under the USRG Loan Agreement or any of the other Loan Documents (as defined in the USRG Loan Agreement) that have become due; breach of any representation or warranty, or certain covenants; insolvency of REG Albert Lea or us; and a change of ownership of REG Albert Lea. In consideration for the loan, we paid a $500,000 lender fee.
The loan is secured by all of REG Albert Lea’s real and personal property. We have guaranteed the obligation of REG Albert Lea and have pledged all of our equity interests in REG Albert Lea to USRG as security for performance under the terms of the USRG Loan Agreement.
REGISTRATION RIGHTS
See “Description of capital stock—Registration Rights” on page 129 for a description of the registration rights applicable to certain of our affiliates.
RECAPITALIZATION
In connection with the offering, all outstanding shares of Series A preferred stock will be converted into shares of Class A Common Stock and shares of Series B preferred stock. In the event the underwriters exercise their over-allotment option, the first $15.0 million in net proceeds will be paid to the former holders of our Series A preferred stock. To the extent that the underwriters’ over-allotment option is not exercised, or the net proceeds of the over-allotment option are less than $15.0 million, upon expiration of the 30-day option period, we are obligated to issue up to 400,000 additional shares of Series B preferred stock to the former holders of Series A preferred stock. The number of shares of Series B preferred stock issued to such former holders of Series A preferred stock will be reduced proportionately for any exercise of the over-allotment option resulting in net proceeds in excess of $5.0 million and less than $15.0 million.
INVESTMENT AGREEMENT
In connection with the offering, we entered into an Investment Agreement with NGP Energy Technology Partners, L.P., USRG, Natural Gas Partners VIII, L.P., ED&F Man, Bunge and West Central, under which each of USRG and NGP Energy Technology Partners, L.P. is entitled to designate a member of our Board of Directors to serve from and after the initial public offering. The right to designate directors will terminate at the earlier of (i) the third anniversary of the closing of this offering or (ii) a change of control. In addition, each of USRG and NGP will lose its respective right to designate a director at such
119
Table of Contents
Certain relationships and related party transactions
time as it fails to beneficially own 50% of the shares of our common stock and Series B preferred stock issued to it in connection with the recapitalization. The Investment Agreement further provides that, as to any matter submitted to a vote of stockholders, the parties thereto will vote their shares of Series B preferred stock in a manner proportionate to the votes cast by all holders of Common Stock (without taking into account abstentions).
WARRANT EXCHANGE AGREEMENT
We intend to enter into warrant exchange agreements with certain holders of our outstanding warrants that will be effective immediately prior to the completion of this offering pursuant to which warrants to purchase shares of our common stock will be cancelled in exchange for an aggregate of shares of our Class A Common Stock.
PROCEDURES FOR APPROVAL OF RELATED PARTY TRANSACTIONS
The Company does not have a written policy regarding approval of related party transactions, however, the Company and the holders of a majority of our outstanding shares of common stock and Series A preferred stock are parties to a Stockholder Agreement, under which the Company agreed that it will not enter into or engage in any transaction with any person who beneficially owns ten percent or more of the equity securities of the Company (or an affiliate of such beneficial owner), unless such contract or transaction shall have been authorized, approved or ratified by a majority of the directors not nominated by such 10 percent beneficial owner.
Each of the related party transactions described above were submitted to our Board of Directors and were approved by a disinterested majority of our Board of Directors after full disclosure of the interest of the related party in the transaction, if any, at the time of approval. We believe the terms of these agreements were negotiated at arms’ length and are comparable to terms that could have been obtained from unaffiliated third parties.
Our Board of Directors intends to approve a Related Person Transactions Policy, which will be effective upon consummation of this offering. The Related Person Transactions Policy will require approval by the audit committee of our Board of Directors of transactions with us involving more than $120,000 in which any director, officer, 5% stockholder or certain related persons or entities has a direct or indirect material interest.
120
Table of Contents
Principal stockholders and selling stockholders
The following table sets forth information as of July 31, 2011 about (i) the number of shares of Class A Common Stock beneficially owned and the percentage of Class A Common Stock beneficially owned before this offering and (ii) the percentage of common stock, including both Common Stock and Class A Common Stock, beneficially owned after the completion of this offering assuming the conversion of all Class A Common Stock into Common Stock by:
| Ø | each person or group of persons known to us to be the beneficial owner of more than 5% of our common stock; |
| Ø | each of our named executive officers; |
| Ø | each of our directors; |
| Ø | all of our directors and executive officers as a group; and |
| Ø | each selling stockholder. |
Unless otherwise noted below, the address of each beneficial owner listed in the table is: c/o Renewable Energy Group, Inc., 416 S Bell Avenue, P.O. Box 888, Ames, IA 50010-0888.
We have determined beneficial ownership in accordance with the rules of the Securities and Exchange Commission. Except as indicated by the footnotes below, we believe, based on the information furnished to us, that the persons and entities named in the table below have sole voting and investment power with respect to all shares of common stock that they beneficially own, subject to applicable community property laws.
Applicable percentage beneficial ownership before the offering is based on shares of Class A Common Stock outstanding on July 31, 2011, which gives effect to the conversion of all outstanding shares of our Series A preferred stock and the issuance of shares of Class A Common Stock, the transfer of shares of Class A Common Stock among certain of our stockholders pursuant to a letter agreement immediately following the closing of this offering as well as the issuance of 500,000 shares of Class A Common Stock pursuant to the termination of a glycerin option agreement with USRG. In computing the number of shares of common stock beneficially owned by a person and the percentage beneficial ownership of that person, we deemed outstanding shares of common stock subject to options, restricted stock units and warrants held by that person that are currently exercisable or exercisable within 60 days of June 30, 2011. We have also treated the outstanding shares of our Class A Common Stock and Common Stock as a single class, although the existing holders of our capital stock or outstanding warants will hold only Class A Common Stock following this offering, which will not be convertible into Common Stock until the expiration of the underwriters’ lock-up period described in “Underwriting—No Sales of Similar Secruities” herein. We did not deem these shares outstanding, however, for the purpose of computing the percentage ownership of any other person. For purposes of the table below, we have assumed that shares of Common Stock will be outstanding upon completion of this offering.
121
Table of Contents
Principal stockholders and selling stockholders
| Number of Shares |
Shares Offered |
Percentage of Common Stock Beneficially Owned | ||||||
| Name | Before Offering | After Offering | ||||||
| 5% Stockholders: |
||||||||
| ARES Holding Corporation(1) |
||||||||
| Entities Affiliated with Bunge North America, Inc.(2) |
||||||||
| E D& F Man Holdings B.V.(3) |
||||||||
| Entities affiliated with NGP Energy Technology Partners(4) |
||||||||
| USRG Holdco V, LLC(5) |
||||||||
| West Central Cooperative(6) |
||||||||
| Named Executive Officers and Directors: |
||||||||
| Paul Chatterton |
||||||||
| Scott P. Chesnut |
||||||||
| Delbert Christensen |
||||||||
| Eric Hakmiller |
||||||||
| Randolph L. Howard |
||||||||
| Don Huyser |
||||||||
| Michael A. Jackson |
||||||||
| Jonathan Koch |
||||||||
| Ronald L. Mapes |
||||||||
| Daniel J. Oh |
||||||||
| Christopher D. Sorrells |
||||||||
| Chad Stone |
||||||||
| Jeff Stroburg |
||||||||
| All executive officers and directors as a group (13 persons) |
||||||||
| (1) | The principal business address of ARES Holding Corporation is: 1440 Chapin Avenue, Suite 390, Burlingame, California, 94010. |
| (2) | The principal business address of Bunge is: 11720 Borman Drive St. Louis, Missouri 63146-1000. Bunge is a wholly-owned subsidiary of Bunge Limited, a publicly traded company. The principal business address of Biofuels Company of America, LLC is 1661 International Drive, Suite 400 Memphis, Tennessee 38120. Bunge is a minority owner of Biofuels Company of America, LLC. Includes shares of our common stock subject to currently exercisable warrants held by Bunge and includes shares of our common stock held by Biofuels Company of America, LLC. |
| (3) | The principal business address of ED&F Man is: De Ruyterkade 6 (6th Floor), 1013 AA Amsterdam, the Netherlands. ED&F Man Holdings BV is a wholly-owned subsidiary of ED&F Man Holdings Limited. Includes shares of our common stock subject to currently exercisable warrants held by ED&F Man Holdings BV. |
| (4) | The principal business address of Natural Gas Partners VIII, L.P. (“NGP”) is 125 E. John Carpenter Freeway, Suite 600 Irving, Texas 75062. G.F.W. Energy VIII, L.P. (“GFW LP”) is the general partner of NGP. GFW VIII, L.L.C. (“GFW LLC”) is the general partner of GFW LP. Each of GFW LP and GFW LLC disclaims beneficial ownership of the reported securities except to the extent of its pecuniary interest therein. The principal business address of NGP Energy Technology Partners, L.P. (“NGP Energy Tech”) is 1700 K Street NW, Suite 750, Washington, D.C. 20006. NGP ETP, L.L.C. (“NGP GP”) is the general partner of NGP Energy Tech. Energy Technology Partners, L.L.C. (“ETP”) is the manager of NGP GP. Philip J. Deutch (“Mr. Deutch”) is the manager of ETP. Each of NGP GP, ETP and Mr. Deutch (the “NGP ETP Reporting Persons”) disclaim beneficial ownership of the reported securities except to the extent of his, her or its pecuniary interest therein. Includes shares of our common stock subject to currently exercisable warrants held by Natural Gas Partners VIII LP. Includes shares of our common stock subject to currently exercisable warrants held by NGP Energy Tech. |
(footnotes continued on following page)
122
Table of Contents
Principal stockholders and selling stockholders
| (5) | The principal business address of USRG Holdco V, LLC is: 2425 Olympic Blvd., Suite 4050 West, Santa Monica, California 90404. USRG Power & Biofuels Fund II, LP (“Fund II”) and USRG Power & Biofuels Fund II-A, LP (“Fund II-A”) are members of USRG Holdco V, LLC. USRG Power & Biofuels Fund II GP, LLC (“Fund II GP”) is the general partner of Fund II and Fund II-A. USRG Management Company, LLC (“Management Company”) is a manager of USRG Holdco V, LLC and the management company for Fund II and Fund II-A. Fund II, Fund II-A, Fund II GP and Management Company may be deemed to beneficially own the securities of the issuer owned by USRG Holdco V, LLC. Each of Fund II, Fund II-A, Fund II GP and Management Company expressly disclaims beneficial ownership over these securities, except to the extent of any pecuniary interest therein. Includes giving effect to the recapitalization transactions, (i) shares of our Class A common stock held by USRG Holdco V, LLC and (ii) shares of our Class A common stock held by Ohana Holdings, LLC, JYCO, LLC and Supreme Oil Company, Inc., which have agreed, pursuant to a voting agreement, to vote their shares as directed by USRG Holdco V, LLC. Includes shares of our Class A common stock subject to currently exercisable warrants, held by Ohana Holdings, LLC, JYCO, LLC and Supreme Oil Company, Inc., which have agreed, pursuant to a voting agreement, to vote their shares as directed by USRG Holdco V, LLC. |
| (6) | The principal business address of West Central is: 406 First Street, Ralston, Iowa 51459. Includes shares of our common stock subject to currently exercisable warrants held by West Central. Also, includes shares of Class A common stock held by Sargeco, Inc., which has agreed, pursuant to a voting agreement, to vote its shares with those held by West Central. |
123
Table of Contents
GENERAL
Upon the completion of this offering, our third amended and restated certificate of incorporation will provide for two classes of common stock, Common Stock and Class A Common Stock, and one series of preferred stock, Series B preferred stock. In addition, our certificate of incorporation will authorize shares of undesignated preferred stock, the rights, preferences and privileges of which may be designated from time to time by our board of directors.
Upon completion of of this offering, our authorized capital stock will consist of 450,000,000 shares, all with a par value of $.0001 per share, which will include:
| Ø | 300,000,000 shares of Common Stock (the class of common stock being offered hereby), par value $.0001 per share, |
| Ø | 140,000,000 shares of Class A Common Stock, par value $.0001 per share, |
| Ø | 10,000,000 shares of preferred stock, par value $.0001 per share, including 3,000,000 shares of Series B preferred stock, par value $.0001 per share. |
Of the authorized shares of Common Stock, shares are being offered hereby, or shares if the underwriters exercise their over-allotment option in full. The material terms and provisions of our certificate of incorporation affecting the rights of the Common Stock and the Class A Common Stock are described below. The Class A Common Stock will not be listed for trading on any stock exchange and will not be fungible with our Common Stock prior to conversion. The following description of our capital stock is qualified in its entirety by reference to our Third Amended and Restated Certificate of Incorporation and amended and Amended and Restated Bylaws filed with this prospectus.
As of , 2011, there were shares of Class A Common Stock held by stockholders of record and no shares of Common Stock outstanding, giving effect to the conversion of all outstanding shares of common stock and preferred stock into shares of Class A Common Stock and Series B preferred stock immediately prior to the completion of this offering, as well as the issuance of an additional 400,000 shares of Series B preferred stock upon expiration of the underwriters’ over-allotment option, assuming such option is not exercised.
COMMON STOCK
The rights of the Common Stock and Class A Common Stock are identical, except that shares of Class A Common Stock will automatically convert into shares of our Common Stock upon expiration of the underwriters’ lock-up agreement and, with respect to the shares of Common Stock being sold by the selling stockholders, upon the closing of this offering. We have agreed not to convert or exchange any shares of Class A Common Stock into shares of Common Stock during the lock-up period described under “Underwriting—No Sales of Similar Securities” herein, without the consent of UBS Securities LLC and Piper Jaffray & Co. Each holder of our Common Stock and Class A Common Stock, voting together as one class, will be entitled to one vote for each share of common stock held on all matters submitted to a vote of stockholders. Common and Class A stockholders will not be entitled to cumulative voting in the election of directors by our certificate of incorporation. This means that the holders of a majority of the shares voted will be able to elect all of the directors then standing for election. Subject to preferences that may apply to shares of preferred stock outstanding at the time, including the Series B preferred stock
124
Table of Contents
Description of capital stock
described below, the holders of outstanding shares of our Common Stock and Class A Common Stock will be entitled to receive dividends out of assets legally available at the times and in the amounts that our Board of Directors may determine from time to time. In connection with a merger or consolidation of the company with or into any other entity, shares of Common Stock and Class A Common Stock will be treated equally and ratably on a pre-share basis. Upon our liquidation, dissolution or winding-up, the holders of our Common Stock and Class A Common Stock will be entitled to share ratably in all assets remaining after payment of all liabilities and the liquidation preferences of our Series B preferred stock and any other series of capital stock ranking senior to the common stock upon liquidation. In addition, in certain circumstances the holders of our Series B preferred stock will share ratably in the proceeds of liquidation with the holders of our common stock on an as-converted basis as described in “—Series B Preferred Stock—General—Liquidation Preference” below. Holders of Common Stock and Class A Common Stock have no preemptive or conversion rights or other subscription rights. There will be no redemption or sinking fund provisions applicable to either Common Stock or Class A Common Stock. All outstanding shares of Class A Common Stock are fully paid and nonassessable, and the shares of Common Stock to be issued in this offering, when they are paid for, will be fully paid and nonassessable.
SERIES B PREFERRED STOCK
General
The Series B preferred stock is a single series of preferred stock consisting of 3,000,000 shares. There are no sinking fund provisions applicable to our Series B preferred stock. Holders of the Series B preferred stock have no preemptive rights.
Ranking
As described more fully below, the Series B preferred stock ranks senior with respect to liquidation preference and dividend rights to any “Junior Stock,” which means the Common Stock, Class A Common Stock, and any other class or series of stock that we may issue that has terms that provide that such class or series ranks junior to the Series B preferred stock.
Liquidation preference
In the event of any voluntary or involuntary liquidation, dissolution, or winding up of our affairs, a holder of Series B preferred stock will be entitled to be paid, before any distribution or payment may be made to any holders of Junior Stock, an amount per share of Series B preferred stock, which we refer to as the Liquidation Preference, equal to the sum of the stated value of a share of Series B preferred stock of $25.00, which we refer to as the Stated Value, plus the amount of any accumulated and unpaid dividends, whether or not declared, to, but excluding, the date of payment.
If the Liquidation Preference has been paid in full to all holders of the Series B preferred stock and the corresponding amounts payable with respect to any other stock of ours ranking equally with the Series B preferred stock as to such distribution have been paid in full, the holders of our Junior Stock will be entitled to receive all remaining assets of ours (or proceeds thereof) according to their respective rights and preferences; provided that if the amount of such assets or proceeds to be distributed with respect to a number of shares of Common Stock into which one share of Series B preferred stock would then be convertible exceeds the Liquidation Preference, then holders of our Series B preferred stock will be entitled to receive, for each share of Series B preferred stock, an additional amount so that a holder of one share of Series B preferred stock receives the same amount as will be received by the holders of a number of shares of Common Stock into which one share of Series B preferred stock would then be convertible.
125
Table of Contents
Description of capital stock
Dividends
Holders of the Series B preferred stock are entitled to receive, when, as and if declared by our board of directors, out of funds legally available for payment, cumulative dividends on each outstanding share of Series B preferred stock at the annual rate of 4.50% of the Stated Value. The dividend rate is initially equivalent to $1.125 per share annually. Dividends are payable semi-annually in arrears on June 30 and December 30 of each year, beginning on the June 30 or December 30 occurring immediately after the original issuance date of the Series B preferred stock. We may, at our option, defer a regularly scheduled dividend payment and instead pay accumulated and unpaid dividends on the following dividend payment date. We may only defer two such dividend payments and may not defer consecutive dividend payments.
If the product of the dividends declared in respect of one share of Common Stock during any semi-annual dividend period and the number of shares of Common Stock into which one share of Series B preferred stock would then be convertible, which we refer to as the as-converted dividend amount, exceeds the amount of the dividends payable for such period computed at the 4.50% annual rate, then the amount of dividends payable on one share of Series B preferred stock for that period will instead be the as-converted dividend amount. Unless all accumulated and unpaid dividends on the Series B preferred stock are paid in full, we may not pay any dividends or distributions on the Common Stock or any other Junior Stock, and we may not, subject to certain exceptions, repurchase any shares of common stock or any other Junior Stock.
We will pay any dividend in cash, by delivering shares of Common Stock, or through any combination of cash and shares of Common Stock. If we elect to make any such payment by delivering shares of Common Stock, those shares will be valued at the average of the daily volume weighted average price of the Common Stock on each of the ten consecutive trading days ending on the trading day immediately preceding the record date for that dividend. If we elect to make any such payment by delivering shares prior to the expiration of the underwriters’ lock-up period described under “Underwriting,” which we refer to as the lock-up expiration date, we will deliver shares of Class A Common Stock instead of Common Stock.
Redemption and repurchase
Except as set forth below, we may not redeem the Series B preferred stock prior to the date, which we refer to as the Initial Optional Redemption Date, that is 18 months following the lock-up expiration date. On or after the Initial Optional Redemption Date, the Series B preferred stock may be redeemed at our option, in whole or in part, for cash at a price per share equal to the Stated Value, plus any accumulated and unpaid dividends, which we refer to as the Redemption Price. If a change of control transaction occurs any time before the Initial Optional Redemption Date, then we may elect to redeem all, but not part, of the outstanding shares of Series B preferred stock for cash at the Redemption Price plus a “make-whole” payment for each share of Series B preferred stock equal to $2.25 less the amount of any dividends paid on such share since the original issuance date of the Series B preferred stock.
If, after the closing of this offering but before March 31, 2015, we conduct an equity offering or offerings for cash that results in aggregate net proceeds in excess of $20.0 million, then, subject to our having legally available funds, we will offer to purchase or redeem the maximum number of shares of Series B preferred stock at a price equal to the Stated Value plus the amount of any accumulated and unpaid dividends to, but excluding, the purchase date that may be purchased or redeemed using 25% of those net proceeds. Before the Initial Optional Redemption Date, we will use those net proceeds to offer to purchase, in a tender offer, Series B preferred stock, and after the Initial Optional Redemption Date, we will use those net proceeds to redeem Series B preferred stock.
126
Table of Contents
Description of capital stock
On June 30, 2015, each holder of Series B preferred stock will have the right to require us to redeem its shares at the Redemption Price, subject to our having legally available funds. If at any time dividends on any shares of Series B preferred stock are unpaid as of a specific dividend payment date and the non-payment continues for a period of 30 days, then the holders of not less than 25% of the then-outstanding Series B preferred stock may require us, subject to our having legally available funds, to redeem all outstanding shares of Series B preferred stock at the Redemption Price.
Conversion
At any time following the lock-up expiration date, the holder of any shares of Series B preferred stock will have the right to convert such shares, together with accumulated and unpaid dividends (whether or not declared) into shares of Common Stock at the conversion rate in effect at such time. The initial conversion rate for each $25 of Liquidation Preference will be equal to $25 divided by a price that is 125% of the public offering price set forth on the cover page of this prospectus. This represents an initial conversion price equal to $ per share of the Common Stock, based on an initial public offering price of $ per share, the midpoint of the price range set forth on the cover page of this prospectus.
If, at any time following the lock-up expiration date, the closing sale price of the Common Stock exceeds 150% of the public offering price set forth on the cover page of this prospectus for at least 20 trading days in any 30 consecutive trading day period and the average daily trading volume of the Common Stock for at least 20 trading days in such period exceeds 200,000 shares or $2.5 million, then we may, at our option, cause up to 50% of the then-outstanding shares of Series B preferred stock (and corresponding accumulated and unpaid dividends) to be converted into shares of Common Stock at the then-applicable conversion rate. If, at any time following the lock-up expiration date, the closing sale price of the Common Stock exceeds 160% of the public offering price set forth on the cover page of this prospectus for at least 20 trading days in any 30 consecutive trading day period and the average daily trading volume of the Common Stock for at least 20 trading days in such period exceeds 200,000 shares or $2.5 million, then we may, at our option, cause up to all of the then-outstanding shares of Series B preferred stock (and corresponding accumulated and unpaid dividends) to be converted into shares of Common Stock at the then-applicable conversion rate.
The conversion rate is subject to adjustment from time to time if any of the following events occur: the issuance of Common Stock as a dividend, a distribution of Common Stock, certain subdivisions and combinations of Common Stock, the issuance to holders of Common Stock of certain rights or warrants to purchase Common Stock, certain dividends or distributions of capital stock, evidences of indebtedness, other assets or cash to holders of Common Stock, or, under certain circumstances, a payment we make in respect of a tender offer or exchange offer for Common Stock.
We may adopt a rights agreement following consummation of this offering, pursuant to which certain rights would be issued with respect to shares of Common Stock. In certain circumstances, the holders of the Series B preferred stock would receive, upon conversion of the Series B preferred stock, in addition to the Common Stock, the rights under any such rights agreement (if adopted) or any other rights plan then in effect.
Voting rights
Holders of Series B preferred stock are entitled to vote their shares of Series B preferred stock on an as-converted basis on any matters presented to holders of Common Stock for their consideration. Except
127
Table of Contents
Description of capital stock
as required by law, holders of Series B preferred stock will vote on an as-converted basis together with the holders of Common Stock and with the holders of any other class or series of our capital stock entitled to vote with the Common Stock, as a single class.
So long as at least 300,000 shares of Series B preferred stock remain outstanding, subject to certain exceptions, the vote or consent of the holders of at least 75% of the shares of the Series B preferred stock at the time outstanding, voting as a separate class, shall be necessary to declare or pay any dividend or make any distribution on or with respect to, or repurchase any shares of, our capital stock.
The vote or consent of the holders of at least 75% of the shares of the Series B preferred stock at the time outstanding, voting as a separate class, shall be necessary to amend, alter or repeal the terms of the Series B preferred stock so as to adversely affect the powers, preferences or rights of the Series B preferred stock.
Consolidations and mergers
We may not consolidate with or merge into any other person or sell, convey, transfer or lease all or substantially all of our property and assets to any other person, except as may be provided in a definitive agreement relating to such a transaction that has been approved by our stockholders, including the holders of the then-outstanding shares of Series B preferred stock, or unless:
| · | the Series B preferred stock remains outstanding or, if we are not the surviving or resulting entity, is converted into or exchanged for preference securities of the surviving or resulting entity or its ultimate parent and the issuer of those preference securities is an entity organized under the laws of the United States, any state thereof or the District of Columbia, and a corporation for United States federal income tax purposes; and |
| · | the shares of Series B preferred stock remaining outstanding or preference securities, as the case may be, have rights, preferences, privileges and voting powers, taken as a whole, that are not materially less favorable to their holders than the rights, preferences, privileges and voting powers of the Series B preferred stock, taken as a whole, immediately prior to consummation of the consolidation, merger or sale transaction. |
PREFERRED STOCK
Our Board of Directors is authorized, subject to any limitations prescribed by law and the rights of our Series B preferred stock, without further vote or action by the stockholders, to issue from time to time any of the remaining authorized shares of preferred stock in one or more series without stockholder approval. Each such series of preferred stock shall have such number of shares, designations, preferences, voting powers, qualifications, and special or relative rights or privileges as shall be determined by the board of directors, which may include, among others, dividend rights, voting rights, liquidation preferences, conversion rights and preemptive rights.
WARRANTS
As of , 2011, there were warrants outstanding exercisable for an aggregate of shares of common stock, at a weighted average exercise price of $ per share, which will convert into warrants to purchase shares of Class A Common Stock immediately prior to the completion of this offering. Following the expiration of the underwriters’ lock-up period, the warrants will be exercisable for an equal number of shares of Common Stock.
128
Table of Contents
Description of capital stock
We entered into warrant exchange agreements with certain holders of our outstanding warrants that will be effective immediately prior to the completion of this offering pursuant to which warrants to purchase shares of our common stock will be cancelled in exchange for shares of our Class A Common Stock. As a result, upon completion of this offering, we will have warrants outstanding exercisable for an aggregate of shares of common stock.
CONTINGENT SHARE ISSUANCES
We have certain obligations to issue additional shares of our common stock. At the time the Seneca put or call is exercised, we will issue 150,000 shares of Class A Common Stock to Seneca Holdco, LLC. Pursuant to the asset purchase agreement entered into in connection with the Tellurian and ABDF asset acquisition, we are obligated, subject to certain conditions, to issue up to an additional 731,250 shares of common stock over the next five years. In addition, to the extent that the underwriters’ over-allotment option is not exercised, or the net proceeds of the over-allotment option are greater than $5.0 million but less than $15.0 million, upon expiration of the 30-day option period, we are obligated to issue up to 400,000 additional shares of Series B preferred stock to the former holders of Series A preferred stock, such that the maximum number of shares of Series B preferred stock that we may issue is 3,000,000. The number of shares of Series B preferred stock issued to such former holders of Series A preferred stock will be reduced proportionately for any exercise of the over-allotment option resulting in net proceeds in excess of $5.0 million and less than $15.0 million.
REGISTRATION RIGHTS
Stockholder Registration Rights
We are party to a stockholders agreement which provides that certain holders of our Series A preferred stock and certain holders of our Class A Common Stock, including certain holders of 5% of our capital stock and entities affiliated with certain of our directors, have certain registration rights, as set forth below. The registration of shares of our common stock pursuant to the exercise of registration rights described below would enable the holders to trade these shares without restriction under the Securities Act when the applicable registration statement is declared effective. We will pay the registration expenses, other than underwriting discounts, selling commissions and stock transfer taxes, of the shares registered pursuant to the demand, piggyback and Form S-3 registrations described below.
Generally, in an underwritten offering, the managing underwriter, if any, has the right, subject to specified conditions, to limit the number of shares such holders may include. The demand, piggyback and Form S-3 registration rights described below will terminate with respect to any holder at such time as both the shares held or entitled to be held upon conversion, may be immediately sold under Rule 144 during any 90-day period and such holder holds less than 3% of the issued and outstanding shares of our Class A Common stock.
Demand Registration Rights
The holders of an aggregate of shares of our Class A Common Stock will be entitled to certain demand registration rights. At the earlier of the date this registration statement is withdrawn or July 1, 2012, the holders of at least 75% of these shares may, on not more than two occasions, request that we register all or a portion of their shares. Such request for registration must cover that number of shares with an anticipated aggregate offering price, net of underwriting discounts, selling commissions and
129
Table of Contents
Description of capital stock
stock transfer taxes, exceeding $10 million. We will not be required to effect a demand registration during the period beginning 60 days prior to the filing and 180 days following the effectiveness of a registration statement relating to a public offering of our securities. In addition, the holders of these shares will have executed lock-up agreements with the underwriters in this offering, which will prevent these holders from demanding registration of their shares until after the expiration of the lock-up period.
Piggyback Registration Rights
In the event that we propose to register any of our securities under the Securities Act, either for our own account or for the account of other security holders, the holders of an aggregate of shares of our Class A Common Stock will be entitled to certain “piggyback” registration rights allowing the holder to include their shares in such registration, subject to certain marketing and other limitations. As a result, whenever we propose to file a registration statement under the Securities Act, other than with respect to a demand registration or certain registrations on Forms S-4 or S-8, the holders of these shares are entitled to notice of the registration and have the right, subject to limitations that the underwriters may impose on the number of shares included in the registration, to include their shares in the registration. Other than with respect to the shares of the selling stockholders described in this prospectus, these rights have been waived in connection with this offering.
Form S-3 Registration Rights
The holders of an aggregate of shares of our Class A Common Stock will be entitled to certain Form S-3 registration rights. The holders of these shares can make a request that we register their shares on Form S-3 if we are qualified to file a registration statement on Form S-3 and if the reasonably anticipated aggregate gross proceeds of the shares offered would be more than $2 million. We will not be required to effect more than two registrations on Form S-3 within any 12-month period or any registration requested within 180 days following the effectiveness of a registration statement relating to a public offering of our securities, and we will not be required to effect any registration on Form S-3 if the Board determines in good faith that such registration would be seriously detrimental to us and our stockholders at that time. In addition, the holders of these shares will have executed lock-up agreements with the underwriters in this offering, which will prevent these holders from requiring registration of their shares until after the expiration of the lock-up period.
ANTI-TAKEOVER EFFECTS OF DELAWARE LAW AND OUR RESTATED CERTIFICATE OF INCORPORATION AND BYLAWS
Certain provisions of Delaware law, our amended and restated certificate of incorporation and our amended and restated bylaws to become effective upon completion of this offering contain provisions that could have the effect of delaying, deferring or discouraging another party from acquiring control of us. These provisions, which are summarized below, are expected to discourage certain types of coercive takeover practices and inadequate takeover bids. These provisions are also designed, in part, to encourage persons seeking to acquire control of us to first negotiate with our Board of Directors. We believe that the benefits of increased protection of our potential ability to negotiate with an unfriendly or unsolicited acquirer outweigh the disadvantages of discouraging such proposals, including proposals that are priced above the then-current market value of our common stock, because, among other reasons, the negotiation of such proposals could result in an improvement of their terms.
130
Table of Contents
Description of capital stock
Certificate of Incorporation and Bylaws—Our third amended and restated certificate of incorporation and amended and restated bylaws to become effective upon completion of this offering include provisions that:
| Ø | authorize the Board of Directors to issue, without further action by the stockholders, up to shares of undesignated preferred stock; |
| Ø | require that any action to be taken by our stockholders be effected at a duly called annual or special meeting and not by written consent; |
| Ø | specify that special meetings of our stockholders can be called only by the Board of Directors, the chairman of the board, the chief executive officer or the president; |
| Ø | provide that our Board of Directors will be classified, with directors serving staggered three-year terms; |
| Ø | provide that directors may be removed only for cause; |
| Ø | provide that vacancies on our Board of Directors may be filled only by a majority of directors then in office, even though less than a quorum; |
| Ø | provide for a 66 2/3% vote of stockholders to amend the foregoing provisions of our certificate of incorporation or to amend our bylaws in the absence of approval by the Board of Directors; and |
| Ø | establish an advance notice procedure for stockholder proposals to be brought before an annual meeting of our stockholders, including proposed nominations of persons for election to the Board of Directors. |
Delaware Anti-Takeover Statute—We are subject to the provisions of Section 203 of the DGCL regulating corporate takeovers. In general, Section 203 prohibits a publicly-held Delaware corporation from engaging, under certain circumstances, in a business combination with an interested stockholder for a period of three years following the date the person became an interested stockholder unless:
| Ø | prior to the date of the transaction, the Board of Directors of the corporation approved either the business combination or the transaction which resulted in the stockholder becoming an interested stockholder; |
| Ø | upon completion of the transaction that resulted in the stockholder becoming an interested stockholder, the interested stockholder owned at least 85% of the voting stock of the corporation outstanding at the time the transaction commenced, excluding for purposes of determining the voting stock outstanding, but not the outstanding voting stock owned by the interested stockholder, (1) shares owned by persons who are directors and also officers and (2) shares owned by employee stock plans in which employee participants do not have the right to determine confidentially whether shares held subject to the plan will be tendered in a tender or exchange offer; or |
| Ø | at or subsequent to the date of the transaction, the business combination is approved by the Board of Directors of the corporation and authorized at an annual or special meeting of stockholders, and not by written consent, by the affirmative vote of at least 66 2/3% of the outstanding voting stock which is not owned by the interested stockholder. |
Generally, a “business combination” includes a merger, asset or stock sale, or other transaction resulting in a financial benefit to the “interested stockholder.” Generally, an “interested stockholder” is a person who, together with affiliates and associates, owns or, within three years prior to the determination of interested stockholder status, did own 15% or more of a corporation’s outstanding voting stock. We expect the existence of this provision to have an anti-takeover effect with respect to transactions our Board of Directors does not approve in advance. We also anticipate that Section 203 may discourage business combinations or other attempts that might result in a premium over the market price for the shares of common stock held by our stockholders.
131
Table of Contents
Description of capital stock
The provisions of Delaware law, our restated certificate of incorporation and our amended and restated bylaws to become effective upon completion of this offering could have the effect of discouraging others from attempting hostile takeovers and, as a consequence, they may also inhibit temporary fluctuations in the market price of our common stock that often result from actual or rumored hostile takeover attempts. These provisions may also have the effect of preventing changes in our management. It is possible that these provisions could make it more difficult to accomplish transactions that stockholders may otherwise deem to be in their best interests.
TRANSFER AGENT AND REGISTRAR
The transfer agent and registrar for our common stock is BNY Mellon Shareowner Services.
LISTING
We have applied to list our common stock on the Nasdaq Global Market under the symbol “REGI.”
132
Table of Contents
Shares eligible for future sale
Prior to this offering, there has been no public market for our common stock. We cannot predict the effect, if any, that market sales of shares or the availability of shares for sale will have on the market price prevailing from time to time. Upon completion of this offering we will have two classes of common stock, the Common Stock sold in this offering and Class A Common Stock. As described below, no shares of Class A Common Stock will be available for public sale shortly after this offering due to contractual and legal restrictions on resale. Nevertheless, sales of our common stock in the public market after the restrictions lapse, or the perception that those sales may occur, could cause the prevailing market price to decrease or to be lower than it might be in the absence of those sales or perceptions.
Upon completion of this offering, we will have outstanding shares of common stock consisting of shares of Common Stock and shares of Class A Common Stock. The shares of Common Stock being sold in this offering will be freely tradable, other than by any of our “affiliates” as defined in Rule 144 under the Securities Act, without restriction or registration under the Securities Act.
The shares of Class A Common Stock outstanding after this offering will not be listed for trading on any stock exchange and will not be fungible with our Common Stock, and as a result, will be restricted. Additionally, a substantial majority of our Class A Common Stock will be further restricted as a result of securities laws and the lock-up agreements described below. Following the expiration of the lock-up period, the Class A Common Stock will automatically convert into shares of Common Stock and all of such shares will be eligible for resale in compliance with Rule 144, in accordance with our registration statement on Form S-8 (File No. 333-168374) or as a result of originally being issued in a registered transaction. “Restricted securities,” as defined under Rule 144, were issued and sold by us in reliance on exemptions from the registration requirements of the Securities Act. These shares may be sold in the public market only if registered or pursuant to an exemption from registration, such as Rule 144 under the Securities Act.
To the extent that the underwriters’ over-allotment option is not exercised, or the net proceeds of the over-allotment option are less than $15.0 million, upon expiration of the 30-day option period, we are obligated to issue up to 400,000 additional shares of Series B preferred stock to the former holders of Series A preferred stock. The number of shares of Series B preferred stock issued will be reduced proportionately for any exercise of the over-allotment option resulting in net proceeds in excess of $5.0 million and less than $15.0 million.
SALE OF SHARES
As a result of the lock-up agreements, other contractual restrictions on resale and the provisions of Rule 144, described below and the fact that certain shares were previously issued in registered transactions, the Common Stock issuable upon conversion of the Class A Common Stock will be available for sale in the public market as follows:
| Number of Shares | Date | |
| On the date of this prospectus. | ||
| At various times after 180 days from the date of this prospectus (subject, in some cases, to volume limitations). | ||
133
Table of Contents
Shares eligible for future sale
LOCK-UP AGREEMENTS
Our directors, executive officers, all of our selling stockholders and holders of all of the shares of our outstanding Class A Common Stock and warrants to purchase our common stock have agreed (or are effectively locked-up by virtue of holding the restricted Class A Common Stock) with limited exceptions that they will not sell any shares of common stock owned by them without the prior written consent of UBS Securities LLC and Piper Jaffray & Co. on behalf of the underwriters for a period of 180 days from the date of this prospectus, subject to extension as described below. At any time and without public notice, UBS Securities LLC and Piper Jaffray & Co. may in their sole discretion release some or all of the securities from these lock-up agreements. To the extent shares are released before the expiration of the lock-up period and these shares are sold into the market, the market price of our common stock could decline. Immediately following the 180-day lock-up period, shares of our common stock outstanding after this offering (including the Class A Common Stock that will automatically convert into Common Stock) will become available for sale, subject to legal restrictions on resale. The 180-day lock-up period may be extended under certain circumstances where we release, or pre-announce a release of, our earnings or announce material news or a material event shortly before or after the termination of the 180-day period. We have agreed not to convert or exchange any shares of Class A Common Stock into shares of Common Stock during the lock-up period without the consent of UBS Securities LLC and Piper Jaffray & Co. See “Underwriting—No Sale of Similar Securities” herein.
RULE 144
In general, under Rule 144 a person who is not our affiliate and has not been our affiliate at any time during the preceding three months will be entitled to sell any shares of our common stock that such person has beneficially owned for at least six months, including the holding period of any prior owner other than one of our affiliates, without regard to volume limitations. Sales of our common stock by any such person would be subject to the availability of current public information about us if the shares to be sold were beneficially owned by such person for less than one year.
In addition, under Rule 144, a person may sell shares of our common stock acquired from us immediately upon the closing of this offering, without regard to volume limitations or the availability of public information about us, if:
| · | the person is not our affiliate and has not been our affiliate at any time during the preceding three months; and |
| · | the person has beneficially owned the shares to be sold for at least six months, including the holding period of any prior owner other than one of our affiliates. |
Our affiliates who have beneficially owned shares of our common stock for at least six months, including the holding period of any prior owner other than one of our affiliates, would be entitled to sell within any three-month period a number of shares that does not exceed the greater of:
| · | 1% of the number of shares of our common stock then-outstanding, which will equal approximately shares immediately after this offering; and |
| · | the average weekly trading volume in our common stock during the four calendar weeks preceding the date of filing of a Notice of Proposed Sale of Securities Pursuant to Rule 144 with respect to the sale. |
Any sales by affiliates under Rule 144 are also limited by manner of sale provisions and notice requirements and the availability of current public information about us.
134
Table of Contents
Shares eligible for future sale
REGISTRATION RIGHTS
Upon completion of this offering, the holders of shares of Class A Common Stock that were issued or are issuable upon the conversion of our Series A preferred stock, assuming the conversion of certain of our Series A preferred stock into Class A Common Stock effective immediately prior to the closing of this offering, or their transferees, will be entitled to various rights with respect to the registration of these shares under the Securities Act. Registration of these shares under the Securities Act would result in these shares becoming fully tradable without restriction under the Securities Act immediately upon the effectiveness of the registration. See “Description of capital stock—Registration Rights” for additional information.
135
Table of Contents
Material United States federal income and estate tax considerations to non-United States holders
The following discussion summarizes material United States federal income and estate tax consequences of the ownership and disposition of our Common Stock by certain non-United States holders (as defined below). This discussion only applies to non-United States holders who purchase and hold our Common Stock as a capital asset for United States federal income tax purposes (generally property held for investment). This discussion does not describe all of the tax consequences that may be relevant to a non-United States holder in light of such holder’s particular circumstances.
For purposes of this discussion, a “non-United States holder” means a person that for United States federal income tax purposes is not a partnership and is not any of the following:
| Ø | an individual citizen or resident of the United States, |
| Ø | a corporation (or any other entity treated as a corporation for United States federal income tax purposes) created or organized in or under the laws of the United States, any state thereof or the District of Columbia, |
| Ø | an estate, the income of which is subject to United States federal income taxation regardless of its source, or |
| Ø | a trust (1) whose administration is subject to the primary supervision of a United States court and that has one or more United States persons who have the authority to control all substantial decisions of the trust, or (2) that has a valid election in effect under applicable Treasury regulations to be treated as a United States person. |
This discussion is based on provisions of the Internal Revenue Code of 1986, as amended, or the Code, and Treasury regulations, administrative rulings and judicial decisions as of the date hereof. These authorities may change, perhaps retroactively, which could result in United States federal income and estate tax consequences different from those summarized below. This discussion does not address all aspects of United States federal income and estate taxes and does not describe any non-United States, state, local or other tax considerations that may be relevant to non-United States holders in light of their particular circumstances. In addition, this discussion does not describe the United States federal income and estate tax consequences applicable to a non-United States holder who is subject to special treatment under United States federal income tax laws (including, without limitation, certain former citizens and former long-term residents, a “controlled foreign corporation,” a “passive foreign investment company,” a corporation that accumulates earnings to avoid United States federal income tax, a partnership or other “pass through” entity or an investor in any such entity, a tax-exempt organization, a bank or other financial institution, a broker, dealer or trader in securities, commodities or currencies, a person holding our Common Stock as part of a hedging, conversion, straddle, constructive sale or other risk reduction transaction or an insurance company). We cannot assure you that a change in law will not significantly alter the tax considerations that we describe in this discussion.
If a partnership (or any other entity treated as a partnership for United States federal income tax purposes) holds our Common Stock, the United States federal income tax treatment of a partner of that partnership will generally depend upon the status of the partner and the activities of the partnership. If you are a partner of a partnership holding our Common Stock, you should consult your tax advisors.
YOU SHOULD CONSULT YOUR OWN TAX ADVISOR REGARDING THE PARTICULAR UNITED STATES FEDERAL, STATE AND LOCAL AND FOREIGN INCOME AND OTHER TAX CONSEQUENCES TO YOU OF THE PURCHASE, OWNERSHIP AND DISPOSITION OF OUR COMMON STOCK.
136
Table of Contents
Certain material United States federal income and estate tax considerations to non-United States holders
DISTRIBUTIONS ON COMMON STOCK
In general, if distributions are made with respect to our Common Stock, such distributions will be treated as dividends to the extent of our current and accumulated earnings and profits as determined for United States federal income tax purposes and will be subject to withholding as discussed below. Any portion of a distribution that exceeds our current and accumulated earnings and profits will first be applied to reduce the non-United States holder’s basis in the Common Stock, but not below zero, and, to the extent such portion exceeds the non-United States holder’s basis, the excess will be treated as gain from the disposition of the Common Stock, the tax treatment of which is discussed below under “Dispositions of Common Stock.”
Dividends paid to a non-United States holder of our Common Stock generally will be subject to withholding of United States federal income tax at a rate of 30 percent of the gross amount of the dividend or such lower rate as may be specified by an applicable income tax treaty. However, dividends that are effectively connected with the conduct of a trade or business by the non-United States holder within the United States (and, where an income tax treaty applies, are attributable to a permanent establishment maintained by the non-United States holder in the United States) are not subject to the withholding tax, provided certain certification and disclosure requirements are satisfied. Instead, such dividends are subject to United States federal income tax on a net income basis in the same manner as if the non-United States holder were a United States person as defined under the Code. Any such effectively connected dividends received by a foreign corporation may be subject to an additional “branch profits tax” at a 30 percent rate or such lower rate as may be specified by an applicable income tax treaty.
A non-United States holder of our Common Stock who wishes to claim the benefit of an applicable income tax treaty for dividends will be required to provide us with a valid Internal Revenue Service Form W-8BEN (or other applicable form) and certify under penalties of perjury that such holder is not a United States person as defined under the Code and is eligible for treaty benefits. If our Common Stock is held through a foreign partnership or foreign intermediary, the foreign partnership or foreign intermediary will also be required to comply with additional certification requirements under applicable Treasury regulations.
A non-United States holder of our Common Stock eligible for a reduced rate of United States withholding tax pursuant to an income tax treaty may obtain a refund of any excess amounts withheld by filing an appropriate claim for refund with the Internal Revenue Service.
DISPOSITIONS OF COMMON STOCK
Any gain realized by a non-United States holder on the disposition of our Common Stock generally will not be subject to United States federal income tax unless:
| Ø | the gain is effectively connected with the non-United States holder’s conduct of a trade or business in the United States (and, if an income tax treaty applies, the gain is attributable to a permanent establishment maintained by the non-United States holder in the United States); |
| Ø | the non-United States holder is an individual who is present in the United States for 183 days or more in the calendar year of that disposition, and certain other conditions are met; or |
| Ø | we are or have been a United States real property holding corporation, as such term is defined in section 897(c) of the Code, during the shorter of the five-year period ending on the date of disposition or your holding period of our Common Stock. As long as our Common Stock is regularly traded on an established securities market, within the meaning of section 897(c)(3) of the Code, these rules will |
137
Table of Contents
Certain material United States federal income and estate tax considerations to non-United States holders
| apply only if you actually or constructively hold more than five percent of such regularly traded common stock at any time during the applicable period that is specified in the Code. We believe we are not and do not expect to become a United States real property holding corporation. |
Gain described in the first bullet point immediately above will be subject to tax on the net gain derived from the sale under regular graduated United States federal income tax rates. A non-United States holder that is a corporation may also be subject to a branch profits tax equal to 30 percent , or such lower rate as may be specified by an applicable income tax treaty, of its effectively connected earnings and profits for the taxable year, as adjusted for certain items. An individual non-United States holder described in the second bullet point immediately above will be required to pay (subject to applicable income tax treaties) a flat 30 percent tax on the gain derived from the sale, which may be offset by United States source capital losses, even though the individual is not considered a resident of the United States. A non-United States holder subject to the rules described in the third bullet point above will be required to pay United States federal income tax under regular graduated United States federal income tax rates with respect to the gain recognized.
UNITED STATES FEDERAL ESTATE TAX
Our Common Stock beneficially owned by an individual who is not a citizen or resident of the United States (as defined for United States federal estate tax purposes) at the time of death will generally be includable in the decedent’s gross estate for United States federal estate tax purposes, unless an applicable estate tax treaty provides otherwise.
INFORMATION REPORTING AND BACKUP WITHHOLDING
We must report annually to the Internal Revenue Service and to each non-United States holder the amount of dividends paid to such non-United States holder and the tax withheld with respect to such dividends, regardless of whether withholding was required. Copies of the information returns reporting such dividends and withholding may also be made available to the tax authorities in the country in which the non-United States holder resides under the provisions of an applicable income tax treaty or tax information exchange agreement.
Payments of dividends in respect of, or proceeds on the disposition of, our Common Stock made to a non-United States holder may be subject to additional information reporting and backup withholding unless such non-United States holder establishes an exemption, for example by properly certifying that such holder is not a United States person as defined under the Code on an Internal Revenue Service Form W-8BEN or another appropriate version of Form W-8 (and the payor does not have actual knowledge or reason to know that such non-United States holder is a United States person as defined under the Code).
Backup withholding is not an additional tax. Any amounts withheld under the backup withholding rules will reduce the non-United States holder’s United States federal income tax liability. If withholding results in an overpayment of taxes, a refund or credit may generally be obtained from the Internal Revenue Service provided the required information is timely furnished to the Internal Revenue Service.
RECENT LEGISLATIVE DEVELOPMENTS
Recently enacted legislation will generally impose a 30 percent withholding tax on dividends on our Common Stock and the gross proceeds of a disposition of our Common Stock paid after December 31, 2012 to (i) a foreign financial institution unless such institution enters into an agreement with the
138
Table of Contents
Certain material United States federal income and estate tax considerations to non-United States holders
United States Treasury requiring, among other things, that such institution undertake to identify accounts held by certain United States persons or certain foreign entities wholly or partially owned by United States persons, annually report certain information about such accounts and withhold at a rate of 30 percent on payments to account holders whose actions prevent it from complying with these reporting and other requirements, and (ii) a non-financial foreign entity unless such entity provides the payor with a certification identifying the direct and indirect United States owners of the entity. Accordingly, the entity through which our Common Stock is held will affect the determination of whether such withholding is required. Under certain circumstances, a non-United States holder of our Common Stock may be eligible for refunds or credits of such taxes. Investors are encouraged to consult with their own tax advisors regarding the possible implications of this legislation on their investment in our Common Stock.
139
Table of Contents
We and the selling stockholders are offering the shares of our Common Stock described in this prospectus through the underwriters named below. UBS Securities LLC and Piper Jaffray & Co. are acting as joint book-running managers of this offering and as the representatives of the underwriters. We and the selling stockholders have entered into an underwriting agreement with the representatives. Subject to the terms and condition of the underwriting agreement, each of the underwriters has severally agreed to purchase, and we and the selling stockholders have agreed to sell to the underwriters, the number of shares of common stock listed next to its name in the following table.
| Underwriters | Number of shares | |
| UBS Securities LLC |
||
| Piper Jaffray & Co. |
||
| Stifel, Nicolaus & Company, Incorporated |
||
| Canaccord Genuity Inc. |
||
|
| ||
| Total |
||
|
|
The underwriting agreement provides that the underwriters must buy all of the shares of Common Stock if they buy any of them. However, the underwriters are not required to pay for the shares covered by the underwriters’ over-allotment option described below.
Our Common Stock is offered subject to a number of conditions, including:
| Ø | receipt and acceptance of our Common Stock by the underwriters; and |
| Ø | the underwriters’ right to reject orders in whole or in part. |
We have been advised by the representatives that the underwriters intend to make a market in our Common Stock but that they are not obligated to do so and may discontinue making a market at any time without notice.
In connection with this offering, certain of the underwriters or securities dealers may distribute prospectuses electronically.
OVER-ALLOTMENT OPTION
We have granted the underwriters an option to buy up to an aggregate of additional shares of our Common Stock. The underwriters may exercise this option solely for the purpose of covering over-allotments, if any, made in connection with this offering. The underwriters have 30 days from the date of this prospectus to exercise this option. If the underwriters exercise this option, they will each purchase additional shares of Common Stock approximately in proportion to the amounts specified in the table above.
COMMISSIONS AND DISCOUNTS
Shares sold by the underwriters to the public will initially be offered at the initial offering price set forth on the cover of this prospectus. Any shares sold by the underwriters to securities dealers may be sold at a discount of up to $ per share from the initial public offering price. Sales of shares made outside of
140
Table of Contents
Underwriting
the United States may be made by affiliates of the underwriters. If all the shares are not sold at the initial public offering price, the representatives may change the offering price and the other selling terms. Upon execution of the underwriting agreement, the underwriters will be obligated to purchase the shares at the prices and upon the terms stated therein. The representatives of the underwriters have informed us that they do not expect to sell more than an aggregate of five percent of the total number of shares of Common Stock offered by them to accounts over which such representatives exercise discretionary authority.
The following table shows the per share and total underwriting discounts and commissions we and the selling stockholders will pay to the underwriters assuming both no exercise and full exercise of the underwriters’ option to purchase up to additional shares.
| No exercise | Full exercise | |||||||
| Paid by us |
||||||||
| Per share |
$ | $ | ||||||
| Total |
$ | $ | ||||||
| Paid by selling stockholders |
||||||||
| Per share |
$ | $ | ||||||
| Total |
$ | $ | ||||||
We estimate that the total expenses of the offering payable by us, not including the underwriting discounts and commissions, will be approximately $ million.
NO SALES OF SIMILAR SECURITIES
After this offering, the existing holders of our common stock and warrants to purchase our common stock will hold only shares of, or warrants exercisable for shares of, our Class A Common Stock, which shares will not be listed for trading on any stock exchange and will not be fungible with our Common Stock during the lock-up period described below. We, our executive officers and directors, the selling stockholders and holders of a substantial majority of our Class A Common Stock and warrants to purchase our common stock have also entered into lock-up agreements with the underwriters. Under the lock-up agreements, subject to certain exceptions, we and each of these persons may not, without the prior written approval of UBS Securities LLC and Piper Jaffray & Co., offer, sell, contract to sell, pledge, or otherwise dispose of, directly or indirectly, or hedge our common stock or securities convertible into or exchangeable or exercisable for our common stock, except in the circumstances described below. We have also agreed not to exchange or convert any shares of Class A Common Stock into shares of Common Stock during the lock-up period. These restrictions will be in effect for a period of 180 days after the date of this prospectus, which period is subject to extension in the circumstances described in the paragraph below. At any time and without public notice, UBS Securities LLC and Piper Jaffray & Co. may, in their sole discretion, release some or all the securities from these lock-up agreements.
Notwithstanding the above, if (i) during the period beginning on the date that is 15 calendar days plus three business days before the last day of the 180-day period described in the paragraph above, or the initial lock-up period, and ends on the last day of the initial lock-up period, we issue an earnings release or material news or a material event relating to us occurs; or (ii) prior to the expiration of the initial lock-up period, we announce that we will release earnings results during the 16 day period beginning on the last day of the initial lock-up period, then the restrictions imposed by these lock-up agreements will continue to apply until the expiration of the date that is 15 calendar days plus three business days after the date on which the issuance of the earnings release or the material news or material event occurs.
141
Table of Contents
Underwriting
INDEMNIFICATION
We and the selling stockholders have agreed to indemnify the several underwriters against certain liabilities, including certain liabilities under the Securities Act. If we and the selling stockholders are unable to provide this indemnification, we and the selling stockholders have agreed to contribute to payments the underwriters may be required to make in respect of those liabilities.
NASDAQ GLOBAL MARKET QUOTATION
We have applied to have our common stock approved for listing on the Nasdaq Global Market under the symbol “REGI.”
PRICE STABILIZATION, SHORT POSITIONS
In connection with this offering, the underwriters may engage in activities that stabilize, maintain or otherwise affect the price of our Common Stock during and after this offering, including:
| Ø | stabilizing transactions; |
| Ø | short sales; |
| Ø | purchases to cover positions created by short sales; |
| Ø | imposition of penalty bids; and |
| Ø | syndicate covering transactions. |
Stabilizing transactions consist of bids or purchases made for the purpose of preventing or retarding a decline in the market price of our common stock while this offering is in progress. These transactions may also include making short sales of our common stock, which involve the sale by the underwriters of a greater number of shares of common stock than they are required to purchase in this offering and purchasing shares of common stock on the open market to cover short positions created by short sales. Short sales may be “covered short sales,” which are short positions in an amount not greater than the underwriters’ over-allotment option referred to above, or may be “naked short sales,” which are short positions in excess of that amount.
The underwriters may close out any covered short position by either exercising their over-allotment option, in whole or in part, or by purchasing shares in the open market. In making this determination, the underwriters will consider, among other things, the price of shares available for purchase in the open market as compared to the price at which they may purchase shares through the over-allotment option.
Naked short sales are short sales made in excess of the over-allotment option. The underwriters must close out any naked short position by purchasing shares in the open market. A naked short position is more likely to be created if the underwriters are concerned that there may be downward pressure on the price of the common stock in the open market that could adversely affect investors who purchased in this offering.
The underwriters also may impose a penalty bid. This occurs when a particular underwriter repays to the underwriters a portion of the underwriting discount received by it because the representatives have repurchased shares sold by or for the account of that underwriter in stabilizing or short covering transactions.
142
Table of Contents
Underwriting
As a result of these activities, the price of our common stock may be higher than the price that otherwise might exist in the open market. If these activities are commenced, they may be discontinued by the underwriters at any time. The underwriters may carry out these transactions on the Nasdaq Global Market, in the over-the-counter market or otherwise. Neither we nor the underwriters make any representation or prediction as to the effect that the transactions described above may have on the price of the shares.
DETERMINATION OF OFFERING PRICE
Prior to this offering, there was no public market for our common stock. The initial public offering price will be determined by negotiation among us, the selling stockholders, and the representatives of the underwriters. The principal factors to be considered in determining the initial public offering price include:
| Ø | the information set forth in this prospectus and otherwise available to representatives; |
| Ø | our history and prospects and the history and prospects for the industry in which we compete; |
| Ø | our past and present financial performance and an assessment of our management; |
| Ø | our prospects for future earnings and the present state of our development; |
| Ø | the general condition of the securities market at the time of this offering; |
| Ø | the recent market prices of, and demand for, publicly traded common stock of generally comparable companies; and |
| Ø | other factors deemed relevant by the underwriters, the selling stockholders and us. |
The estimated public offering price range set forth on the cover page of this preliminary prospectus is subject to change as a result of market conditions and other factors. Neither we nor the underwriters can assure investors that an active trading market will develop for our Common Stock or that the Common Stock will trade in the public market at or above the initial public offering price.
AFFILIATIONS
The underwriters and their respective affiliates are full service financial institutions engaged in various activities, which may include securities trading, commercial and investment banking, financial advisory, investment management, investment research, principal investment, hedging, financing and brokerage activities. The underwriters and their affiliates may from time to time in the future engage with us or the selling stockholders and perform services for us or the selling stockholders in the ordinary course of their business for which they will receive customary fees and expenses. In the ordinary course of their various business activities, the underwriters and their respective affiliates may make or hold a broad array of investments and actively trade debt and equity securities (or related derivative securities) and financial instruments (including bank loans) for their own account and for the accounts of their customers, and such investment and securities activities may involve securities and/or instruments of us or the selling stockholder. The underwriters and their respective affiliates may also make investment recommendations and/or publish or express independent research views in respect of these securities or instruments and may at any time hold, or recommend to clients that they acquire, long and/or short positions in these securities and instruments.
143
Table of Contents
Underwriting
NOTICE TO INVESTORS
Notice to prospective investors in the European Economic Area
In relation to each member state of the European Economic Area (“EEA”) that has implemented the Prospectus Directive (each, a “relevant member state”), other than Germany, with effect from and including the date on which the Prospectus Directive is implemented in that relevant member state (the “relevant implementation date”), an offer of securities described in this prospectus may not be made to the public in that relevant member state other than:
| Ø | to any legal entity which is a qualified investor as defined in the Prospectus Directive; |
| Ø | by the Managers to fewer than 100, or, if the relevant member state has implemented the relevant provisions of the 2010 PD Amending Directive, 150, natural or legal persons (other than qualified investors as defined in the Prospectus Directive), as permitted under the Prospectus Directive, subject to obtaining the prior consent of the Bookrunners for any such offer; or |
| Ø | in any other circumstances falling within Article 3(2) of the Prospectus Directive, |
provided that no such offer of securities shall require us or any underwriter to publish a prospectus pursuant to Article 3 of the Prospectus Directive.
For purposes of this provision, the expression an “offer of securities to the public” in any relevant member state means the communication in any form and by any means of sufficient information on the terms of the offer and the securities to be offered so as to enable an investor to decide to purchase or subscribe for the securities, as the expression may be varied in that member state by any measure implementing the Prospectus Directive in that member state, and the expression “Prospectus Directive” means Directive 2003/71/EC (and amendments thereto, including the 2010 PD Amending Directive, to the extent implemented in the relevant member state), and includes any relevant implementing measure in the relevant member state, and includes any relevant implementing measure in each relevant member state. The expression “2010 PD Amending Directive” means Directive 2010/73/EU.
We have not authorized and do not authorize the making of any offer of securities through any financial intermediary on their behalf, other than offers made by the underwriters with a view to the final placement of the securities as contemplated in this prospectus. Accordingly, no purchaser of the securities, other than the underwriters, is authorized to make any further offer of the securities on behalf of us or the underwriters.
The EEA selling restriction is in addition to any other selling restrictions set out in this prospectus.
Notice to prospective investors in Australia
This offering memorandum is not a formal disclosure document and has not been, nor will be, lodged with the Australian Securities and Investments Commission. It does not purport to contain all information that an investor or their professional advisers would expect to find in a prospectus or other disclosure document (as defined in the Corporations Act 2001 (Australia)) for the purposes of Part 6D.2 of the Corporations Act 2001 (Australia) or in a product disclosure statement for the purposes of Part 7.9 of the Corporations Act 2001 (Australia), in either case, in relation to the securities.
The securities are not being offered in Australia to “retail clients” as defined in sections 761G and 761GA of the Corporations Act 2001 (Australia). This offering is being made in Australia solely to “wholesale clients” for the purposes of section 761G of the Corporations Act 2001 (Australia) and, as such, no prospectus, product disclosure statement or other disclosure document in relation to the securities has been, or will be, prepared.
144
Table of Contents
Underwriting
This offering memorandum does not constitute an offer in Australia other than to wholesale clients. By submitting an application for our securities, you represent and warrant to us that you are a wholesale client for the purposes of section 761G of the Corporations Act 2001 (Australia). If any recipient of this prospectus is not a wholesale client, no offer of, or invitation to apply for, our securities shall be deemed to be made to such recipient and no applications for our securities will be accepted from such recipient. Any offer to a recipient in Australia, and any agreement arising from acceptance of such offer, is personal and may only be accepted by the recipient. In addition, by applying for our securities you undertake to us that, for a period of 12 months from the date of issue of the securities, you will not transfer any interest in the securities to any person in Australia other than to a wholesale client.
Notice to prospective investors in Hong Kong
Our securities may not be offered or sold in Hong Kong, by means of this prospectus or any document other than (i) to “professional investors” within the meaning of the Securities and Futures Ordinance (Cap.571, Laws of Hong Kong) and any rules made thereunder, or (ii) in circumstances which do not constitute an offer to the public within the meaning of the Companies Ordinance (Cap.32, Laws of Hong Kong), or (iii) in other circumstances which do not result in the document being a “prospectus” within the meaning of the Companies Ordinance (Cap.32, Laws of Hong Kong). No advertisement, invitation or document relating to our securities may be issued or may be in the possession of any person for the purpose of issue (in each case whether in Hong Kong or elsewhere) which is directed at, or the contents of which are likely to be accessed or read by, the public in Hong Kong (except if permitted to do so under the securities laws of Hong Kong) other than with respect to the securities which are or are intended to be disposed of only to persons outside Hong Kong or only to “professional investors” within the meaning of the Securities and Futures Ordinance (Cap. 571, Laws of Hong Kong) and any rules made thereunder.
Notice to prospective investors in Japan
Our securities have not been and will not be registered under the Financial Instruments and Exchange Law of Japan (the “Financial Instruments and Exchange Law”) and our securities will not be offered or sold, directly or indirectly, in Japan, or to, or for the benefit of, any resident of Japan (which term as used herein means any person resident in Japan, including any corporation or other entity organized under the laws of Japan), or to others for re-offering or resale, directly or indirectly, in Japan, or to a resident of Japan, except pursuant to an exemption from the registration requirements of, and otherwise in compliance with, the Financial Instruments and Exchange Law and any other applicable laws, regulations and ministerial guidelines of Japan.
Notice to prospective investors in Singapore
This document has not been registered as a prospectus with the Monetary Authority of Singapore and in Singapore, the offer and sale of our securities is made pursuant to exemptions provided in sections 274 and 275 of the Securities and Futures Act, Chapter 289 of Singapore (“SFA”). Accordingly, this prospectus and any other document or material in connection with the offer or sale, or invitation for subscription or purchase, of our securities may not be circulated or distributed, nor may our securities be offered or sold, or be made the subject of an invitation for subscription or purchase, whether directly or indirectly, to persons in Singapore other than (i) to an institutional investor as defined in Section 4A of the SFA pursuant to Section 274 of the SFA, (ii) to a relevant person as defined in section 275(2) of the SFA pursuant to Section 275(1) of the SFA, or any person pursuant to Section 275(1A) of the SFA, and in accordance with the conditions specified in Section 275 of the SFA, or (iii) otherwise pursuant to, and
145
Table of Contents
Underwriting
in accordance with the conditions of, any other applicable provision of the SFA, in each case subject to compliance with the conditions (if any) set forth in the SFA. Moreover, this document is not a prospectus as defined in the SFA. Accordingly, statutory liability under the SFA in relation to the content of prospectuses would not apply. Prospective investors in Singapore should consider carefully whether an investment in our securities is suitable for them.
Where our Common Stock is subscribed or purchased under Section 275 of the SFA by a relevant person which is:
| (a) | by a corporation (which is not an accredited investor as defined in Section 4A of the SFA) the sole business of which is to hold investments and the entire share capital of which is owned by one or more individuals, each of whom is an accredited investor; or |
| (b) | for a trust (where the trustee is not an accredited investor) whose sole purpose is to hold investments and each beneficiary of the trust is an individual who is an accredited investor; |
shares of that corporation or the beneficiaries’ rights and interest (howsoever described) in that trust shall not be transferable for six months after that corporation or that trust has acquired the shares under Section 275 of the SFA, except:
| (a) | to an institutional investor (for corporations under Section 274 of the SFA) or to a relevant person defined in Section 275(2) of the SFA, or any person pursuant to an offer that is made on terms that such shares of that corporation or such rights and interest in that trust are acquired at a consideration of not less than S$200,000 (or its equivalent in a foreign currency) for each transaction, whether such amount is to be paid for in cash or by exchange of securities or other assets, and further for corporations, in accordance with the conditions, specified in Section 275 of the SFA; |
| (b) | where no consideration is given for the transfer; or |
| (c) | where the transfer is by operation of law. |
In addition, investors in Singapore should note that the securities acquired by them are subject to resale and transfer restrictions specified under Section 276 of the SFA, and they, therefore, should seek their own legal advice before effecting any resale or transfer of their securities.
Notice to prospective investors in Switzerland
This Prospectus does not constitute an issue prospectus pursuant to Article 652a or Article 1156 of the Swiss Code of Obligations (“CO”) and the shares will not be listed on the SIX Swiss Exchange. Therefore, the Prospectus may not comply with the disclosure standards of the CO and/or the listing rules (including any prospectus schemes) of the SIX Swiss Exchange. Accordingly, the shares may not be offered to the public in or from Switzerland, but only to a selected and limited circle of investors, which do not subscribe to the shares with a view to distribution.
Notice to prospective investors in the United Kingdom
This prospectus is only being distributed to and is only directed at: (1) persons who are outside the United Kingdom; (2) investment professionals falling within Article 19(5) of the Financial Services and Markets Act 2000 (Financial Promotion) Order 2005 (the “Order”); or (3) high net worth companies,
146
Table of Contents
Underwriting
and other persons to whom it may lawfully be communicated, falling within Article 49(2)(a) to (d) of the Order (all such persons falling within (1)-(3) together being referred to as “relevant persons”). The shares are only available to, and any invitation, offer or agreement to subscribe, purchase or otherwise acquire such shares will be engaged in only with, relevant persons. Any person who is not a relevant person should not act or rely on this prospectus or any of its contents.
147
Table of Contents
The validity of the shares of Common Stock offered hereby will be passed upon for us by Pillsbury Winthrop Shaw Pittman LLP, San Francisco, California. Skadden, Arps, Slate, Meagher & Flom LLP, New York, New York is acting as counsel to the underwriters in this offering.
The consolidated financial statements and the related financial statement schedule as of December 31, 2010 and 2009 and for each of the three years in the period ended December 31, 2010 included in this prospectus, have been audited by Deloitte & Touche LLP, an independent registered public accounting firm, as stated in their report appearing herein. Such financial statements and financial statement schedule are included in reliance upon the report of such firm given upon their authority as experts in accounting and auditing.
Where you can find additional information
We have filed with the SEC a registration statement on Form S-1 under the Securities Act with respect to the shares of Common Stock offered hereby. This prospectus, which constitutes a part of the registration statement, does not contain all of the information set forth in the registration statement or the exhibits and schedules filed therewith. For further information about us and the Common Stock offered hereby, we refer you to the registration statement and the exhibits and schedules filed thereto. We currently file annual, quarterly and current reports, proxy statements and other information with the SEC and we will continue to make such filings after the completion of this offering. None of such reports or filings are being incorporated by reference into this prospectus. You may read and copy this information at the Public Reference Room of the SEC, 100 F Street, N.E., Room 1580, Washington D.C. 20549. You may obtain information on the operation of the public reference rooms by calling the SEC at 1-800-SEC-0330. The SEC also maintains an Internet website that contains reports, proxy statements and other information about issuers, like us, that file electronically with the SEC. The address of that site is www.sec.gov. We maintain a website at www.REGI.com. You may access our annual reports on Form 10-K, quarterly reports on Form 10-Q, current reports on Form 8-K and amendments to such reports filed or furnished pursuant to section 13(a) or 15(d) of the Exchange Act with the SEC free of charge at our website as soon as reasonably practicable after such material is filed or furnished to the SEC. The reference to our website does not constitute an incorporation by reference of the information on our website into this prospectus.
148
Table of Contents
| Page | ||||
| Consolidated financial statements of Renewable Energy Group, Inc. and subsidiaries |
||||
| Financial Statements for the years ended December 31, 2010 and 2009 |
||||
| F-2 | ||||
| Consolidated Balance Sheets as of December 31, 2010 and 2009 |
F-3 | |||
| Consolidated Statements of Operations for the years ended December 31, 2010, 2009 and 2008 |
F-4 | |||
| F-5 | ||||
| Consolidated Statements of Cash Flows for the years ended December 31, 2010 and 2009 |
F-6 | |||
| F-8 | ||||
| Schedule I - Financial Statements of Parent Company as of December 31, 2010 and 2009 |
||||
| F-64 | ||||
| Condensed Statements of Operations for the years ended December 31, 2010, 2009 and 2008 |
F-65 | |||
| F-66 | ||||
| Condensed Statements of Cash flows for the years ended December 31, 2010 and 2009 |
F-67 | |||
| Condensed Consolidated Financial Statements for the three months ended June 30, 2011 and 2010 (unaudited) |
||||
| Condensed Consolidated Balance Sheet (unaudited) as of June 30, 2011 and December 31, 2010 |
F-68 | |||
| F-69 | ||||
| F-71 | ||||
| F-72 | ||||
| Notes to the Condensed Consolidated Financial Statements (unaudited) |
F-74 |
F-1
Table of Contents
Report of independent registered public accounting firm
To the Board of Directors and Stockholders of
Renewable Energy Group, Inc.
Ames, Iowa
We have audited the accompanying consolidated balance sheets of Renewable Energy Group, Inc. and subsidiaries (the “Company”) as of December 31, 2010 and 2009, and the related consolidated statements of operations, redeemable preferred stock and equity (deficit), and cash flows for each of the three years in the period ended December 31, 2010. Our audits also included the financial statement schedule listed in the Index at Item 16b. These financial statements and financial statement schedule are the responsibility of the Company’s management. Our responsibility is to express an opinion on the financial statements and financial statement schedule based on our audits.
We conducted our audits in accordance with the standards of the Public Company Accounting Oversight Board (United States). Those standards require that we plan and perform the audit to obtain reasonable assurance about whether the financial statements are free of material misstatement. The Company is not required to have, nor were we engaged to perform, an audit of its internal control over financial reporting. Our audits included consideration of internal control over financial reporting as a basis for designing audit procedures that are appropriate in the circumstances, but not for the purpose of expressing an opinion on the effectiveness of the Company’s internal control over financial reporting. Accordingly, we express no such opinion. An audit also includes examining, on a test basis, evidence supporting the amounts and disclosures in the financial statements, assessing the accounting principles used and significant estimates made by management, as well as evaluating the overall financial statement presentation. We believe that our audits provide a reasonable basis for our opinion.
In our opinion, such consolidated financial statements present fairly, in all material respects, the financial position of Renewable Energy Group, Inc. and subsidiaries as of December 31, 2010 and 2009, and the results of their operations and their cash flows for each of the three years in the period ended December 31, 2010, in conformity with accounting principles generally accepted in the United States of America. Also, in our opinion, the financial statement schedule, when considered in relation to the basic consolidated financial statements taken as a whole, presents fairly in all material respects the information set forth therein.
/s/ Deloitte & Touche LLP
Des Moines, Iowa
March 31, 2011 (July 15, 2011 as to the effects of earnings per share described in Note 2)
F-2
Table of Contents
Renewable Energy Group, Inc. and Subsidiaries
As of December 31, 2010 and 2009
(In thousands, except share amounts)
| 2010 | 2009 | |||||||
| ASSETS | ||||||||
| Current assets: |
||||||||
| Cash and cash equivalents |
$ | 4,259 | $ | 5,855 | ||||
| Restricted cash |
2,667 | 2,156 | ||||||
| Accounts receivable, net (includes amounts owed by related parties of $1,146 and $2,328 as of December 31, 2010 and 2009, respectively) |
18,801 | 12,162 | ||||||
| Inventories |
28,985 | 12,840 | ||||||
| Prepaid expenses and other assets (includes amounts paid to related parties of $269 as of December 31, 2009) |
3,933 | 4,689 | ||||||
|
|
|
|
|
|||||
| Total current assets |
58,645 | 37,702 | ||||||
|
|
|
|
|
|||||
| Property, plant and equipment, net |
166,391 | 124,429 | ||||||
| Property, plant and equipment, net—Seneca Landlord, LLC |
42,692 | — | ||||||
| Goodwill |
84,864 | 16,080 | ||||||
| Intangible assets, net |
3,169 | 7,203 | ||||||
| Deferred income taxes |
1,500 | 1,500 | ||||||
| Investments |
4,259 | 6,149 | ||||||
| Other assets |
7,821 | 7,495 | ||||||
| Restricted cash |
302 | — | ||||||
|
|
|
|
|
|||||
| Total assets |
$ | 369,643 | $ | 200,558 | ||||
|
|
|
|
|
|||||
| LIABILITIES AND EQUITY (DEFICIT) | ||||||||
| Current liabilities: |
||||||||
| Revolving line of credit |
$ | 9,550 | $ | 350 | ||||
| Current maturities of notes payable |
25,551 | 2,756 | ||||||
| Accounts payable (includes amounts owed to related parties of $3,827 and $5,415 as of December 31, 2010 and 2009, respectively) |
14,237 | 14,133 | ||||||
| Accrued expenses and other liabilities |
3,549 | 4,197 | ||||||
| Deferred revenue |
9,339 | 5,480 | ||||||
|
|
|
|
|
|||||
| Total current liabilities |
62,226 | 26,916 | ||||||
| Unfavorable lease obligation |
11,293 | 11,783 | ||||||
| Preferred stock embedded conversion feature derivatives |
61,761 | 4,104 | ||||||
| Seneca Holdco liability, at fair value |
10,406 | — | ||||||
| Notes payable |
24,774 | 25,749 | ||||||
| Notes payable—Seneca Landlord, LLC |
36,250 | — | ||||||
| Other liabilities |
5,381 | 10,015 | ||||||
|
|
|
|
|
|||||
| Total liabilities |
212,091 | 78,567 | ||||||
|
|
|
|
|
|||||
| Commitments and contingencies (note 23) |
||||||||
| Redeemable preferred stock ($.0001 par value; 14,000,000 shares authorized; 13,455,522 and 12,464,357 shares outstanding at December 31, 2010 and 2009, respectively; redemption amount $222,016 and $247,587 at December 31, 2010 and 2009, respectively) |
122,436 | 149,122 | ||||||
| Equity (deficit): |
||||||||
| Company stockholders’ equity (deficit): |
||||||||
| Common stock ($.0001 par value; 140,000,000 shares authorized; 33,129,553 and 19,575,117 shares outstanding at December 31, 2010 and 2009, respectively) |
3 | 2 | ||||||
| Common stock—additional paid-in-capital |
82,634 | 15,676 | ||||||
| Warrants—additional paid-in-capital |
4,820 | 4,619 | ||||||
| Accumulated deficit |
(52,341 | ) | (60,905 | ) | ||||
|
|
|
|
|
|||||
| Total stockholders’ equity (deficit) |
35,116 | (40,608 | ) | |||||
| Noncontrolling interests |
— | 13,477 | ||||||
|
|
|
|
|
|||||
| Total equity (deficit) |
35,116 | (27,131 | ) | |||||
|
|
|
|
|
|||||
| Total liabilities and equity (deficit) |
$ | 369,643 | $ | 200,558 | ||||
|
|
|
|
|
|||||
See notes to consolidated financial statements.
F-3
Table of Contents
Renewable Energy Group, Inc. and Subsidiaries
CONSOLIDATED STATEMENTS OF OPERATIONS
For the years ended December 31, 2010, 2009 and 2008
(in thousands, except share and per share amounts)
| 2010 | 2009 | 2008 | ||||||||||
| Revenues: |
||||||||||||
| Biodiesel sales |
$ | 203,641 | $ | 91,870 | $ | 58,786 | ||||||
| Biodiesel sales—related parties |
4,261 | 17,157 | 10,723 | |||||||||
| Biodiesel government incentives |
7,240 | 19,465 | 6,564 | |||||||||
|
|
|
|
|
|
|
|||||||
| 215,142 | 128,492 | 76,073 | ||||||||||
| Services |
653 | 1,888 | 4,143 | |||||||||
| Services—related parties |
660 | 1,121 | 5,236 | |||||||||
|
|
|
|
|
|
|
|||||||
| 216,455 | 131,501 | 85,452 | ||||||||||
|
|
|
|
|
|
|
|||||||
| Costs of goods sold: |
||||||||||||
| Biodiesel |
81,125 | 73,994 | 39,387 | |||||||||
| Biodiesel—related parties |
112,891 | 53,379 | 39,349 | |||||||||
| Services |
516 | 1,177 | 4,470 | |||||||||
| Services—related parties |
291 | — | — | |||||||||
|
|
|
|
|
|
|
|||||||
| 194,823 | 128,550 | 83,206 | ||||||||||
| Gross profit |
21,632 | 2,951 | 2,246 | |||||||||
| Selling, general, and administrative expenses (includes related party amounts of $1,601, $1,836 and $1,946 for the years ended December 31, 2010, 2009 and 2008, respectively) |
22,187 | 25,565 | 24,048 | |||||||||
| Gain on sale of assets—related party |
— | (2,254 | ) | — | ||||||||
| Impairment of assets |
7,494 | 833 | 160 | |||||||||
|
|
|
|
|
|
|
|||||||
| Loss from operations |
(8,049 | ) | (21,193 | ) | (21,962 | ) | ||||||
|
|
|
|
|
|
|
|||||||
| Other income (expense), net: |
||||||||||||
| Change in fair value of preferred stock conversion feature embedded derivatives |
(8,208 | ) | (2,339 | ) | 2,118 | |||||||
| Change in fair value of interest rate swap |
469 | 382 | (1,413 | ) | ||||||||
| Change in fair value of Seneca Holdco liability |
(4,179 | ) | — | — | ||||||||
| Other income (includes related party amounts of $355 for the year ended December 31, 2009) |
956 | 3,147 | — | |||||||||
| Interest expense (includes related party amounts of $334 and $26 for the years ended December 31, 2010 and 2009, respectively) |
(4,940 | ) | (2,414 | ) | (1,902 | ) | ||||||
| Interest income (includes related party amounts of $180 for the year ended December 31, 2010) |
200 | 60 | 279 | |||||||||
| Impairment of investments |
(400 | ) | (200 | ) | (1,400 | ) | ||||||
|
|
|
|
|
|
|
|||||||
| (16,102 | ) | (1,364 | ) | (2,318 | ) | |||||||
|
|
|
|
|
|
|
|||||||
| Loss before income taxes and loss from equity investments |
(24,151 | ) | (22,557 | ) | (24,280 | ) | ||||||
| Income tax benefit (expense) |
3,252 | (45,212 | ) | 9,414 | ||||||||
| Loss from equity investments |
(689 | ) | (1,089 | ) | (1,013 | ) | ||||||
|
|
|
|
|
|
|
|||||||
| Net loss |
(21,588 | ) | (68,858 | ) | (15,879 | ) | ||||||
|
|
|
|
|
|
|
|||||||
| Less—net loss attributable to noncontrolling interest |
— | 7,953 | 2,788 | |||||||||
|
|
|
|
|
|
|
|||||||
| Net loss attributable to the company |
(21,588 | ) | (60,905 | ) | (13,091 | ) | ||||||
| Effects of recapitalization |
8,521 | — | — | |||||||||
| Less—accretion of preferred stock to redemption value |
(27,239 | ) | (44,181 | ) | (26,692 | ) | ||||||
| Less: undistributed dividends allocated to preferred stockholders |
(10,027 | ) | (14,036 | ) | (11,145 | ) | ||||||
|
|
|
|
|
|
|
|||||||
| Net loss attributable to the company’s common stockholders |
$ | (50,333 | ) | $ | (119,122 | ) | $ | (50,928 | ) | |||
|
|
|
|
|
|
|
|||||||
| Net loss per share attributable to common stockholders: |
||||||||||||
| Basic |
$ | (1.71 | ) | $ | (6.14 | ) | $ | (3.07 | ) | |||
|
|
|
|
|
|
|
|||||||
| Diluted |
$ | (1.71 | ) | $ | (6.14 | ) | $ | (3.07 | ) | |||
|
|
|
|
|
|
|
|||||||
| Weighted-average shares used to compute net loss per share attributable to common stockholders: |
||||||||||||
| Basic |
29,427,120 | 19,407,227 | 16,593,555 | |||||||||
|
|
|
|
|
|
|
|||||||
| Diluted |
29,427,120 | 19,407,227 | 16,593,555 | |||||||||
|
|
|
|
|
|
|
|||||||
| Pro forma net loss per share attributable to common stockholders (unaudited): |
||||||||||||
| Basic |
$ | |||||||||||
|
|
|
|||||||||||
| Diluted |
$ | |||||||||||
|
|
|
|||||||||||
| Pro forma weighted-average shares used to compute net loss per share attributable to common stockholders (unaudited): |
||||||||||||
| Basic |
||||||||||||
|
|
|
|||||||||||
| Diluted |
||||||||||||
|
|
|
|||||||||||
See notes to consolidated financial statements.
F-4
Table of Contents
Renewable Energy Group, Inc. and Subsidiaries
CONSOLIDATED STATEMENTS OF REDEEMABLE PREFERRED STOCK AND EQUITY (DEFICIT)
For the years ended December 31, 2010, 2009 and 2008 (in thousands except share amounts)
| Company stockholders’ equity (deficit) | ||||||||||||||||||||||||||||||||||||
| Redeemable preferred stock shares |
Redeemable preferred stock |
Common stock shares |
Common stock |
Common Stock - additional paid-in capital |
Warrants - additional paid-in capital |
Retained earnings (accumulated deficit) |
Noncontrolling interest |
Total | ||||||||||||||||||||||||||||
| BALANCE, January 1, 2008 |
8,578,945 | $ | 43,707 | 13,334,874 | $ | 1 | $ | 62,629 | $ | 4,556 | $ | 25,723 | $ | 807 | $ | 93,716 | ||||||||||||||||||||
| Issuance of preferred stock, net of $246 of issuance cost and $302 for embedded derivative |
3,855,059 | 34,208 | — | — | — | — | — | — | — | |||||||||||||||||||||||||||
| Issuance of common stock, net of $234 of issuance costs |
— | — | 5,970,243 | 1 | 5,080 | — | — | — | 5,081 | |||||||||||||||||||||||||||
| Issuance of warrants |
— | — | — | — | (63 | ) | 63 | — | — | — | ||||||||||||||||||||||||||
| Contributions |
— | — | — | — | — | — | — | 22,820 | 22,820 | |||||||||||||||||||||||||||
| Removal of noncontrolling interest as a result of deconsolidation |
— | — | — | — | — | — | — | (602 | ) | (602 | ) | |||||||||||||||||||||||||
| Stock compensation expense |
— | — | — | — | 3,574 | — | — | — | 3,574 | |||||||||||||||||||||||||||
| Accretion of preferred stock to redemption value |
— | 26,692 | — | — | (14,060 | ) | — | (12,632 | ) | — | (26,692 | ) | ||||||||||||||||||||||||
| Net loss |
— | — | — | — | — | — | (13,091 | ) | (2,788 | ) | (15,879 | ) | ||||||||||||||||||||||||
|
|
|
|
|
|
|
|
|
|
|
|
|
|
|
|
|
|
|
|||||||||||||||||||
| BALANCE, December 31, 2008 |
12,434,004 | 104,607 | 19,305,117 | 2 | 57,160 | 4,619 | — | 20,237 | 82,018 | |||||||||||||||||||||||||||
| Issuance of preferred stock |
30,353 | 334 | — | — | — | — | — | — | — | |||||||||||||||||||||||||||
| Issuance of common stock |
— | — | 270,000 | — | 1,368 | — | — | — | 1,368 | |||||||||||||||||||||||||||
| Stock compensation expense |
— | — | — | — | 2,522 | — | — | — | 2,522 | |||||||||||||||||||||||||||
| Accretion of preferred stock to redemption value |
— | 44,181 | — | — | (44,181 | ) | — | — | — | (44,181 | ) | |||||||||||||||||||||||||
| Increase in Blackhawk Biofuels LLC members’ equity from issuance of common stock |
— | — | — | — | (1,193 | ) | — | — | 1,193 | — | ||||||||||||||||||||||||||
| Net loss |
— | — | — | — | — | — | (60,905 | ) | (7,953 | ) | (68,858 | ) | ||||||||||||||||||||||||
|
|
|
|
|
|
|
|
|
|
|
|
|
|
|
|
|
|
|
|||||||||||||||||||
| BALANCE, December 31, 2009 |
12,464,357 | 149,122 | 19,575,117 | 2 | 15,676 | 4,619 | (60,905 | ) | 13,477 | (27,131 | ) | |||||||||||||||||||||||||
| Derecognition of REG Holdco preferred stock, common stock, and common stock warrants |
(12,464,357 | ) | (158,475 | ) | (19,575,117 | ) | (2 | ) | (6,323 | ) | (4,619 | ) | — | — | (10,944 | ) | ||||||||||||||||||||
| Issuance of preferred stock, common stock, and common stock warrants to REG Holdco, net of $52,394 for embedded derivatives |
13,164,357 | 102,287 | 18,875,117 | 2 | 14,221 | 4,619 | — | — | 18,842 | |||||||||||||||||||||||||||
| Issuance of common stock in acquisitions, net of $862 for issue cost |
— | — | 13,754,436 | 1 | 79,304 | — | — | — | 79,305 | |||||||||||||||||||||||||||
| Issuance of preferred stock in acquisitions, net of $1,158 for embedded derivatives |
291,165 | 2,263 | — | — | — | — | — | — | — | |||||||||||||||||||||||||||
| Issuance of warrants in acquisitions |
— | — | — | — | — | 1,269 | — | — | 1,269 | |||||||||||||||||||||||||||
| Issuance of common stock |
— | — | 500,000 | — | 3,015 | — | — | — | 3,015 | |||||||||||||||||||||||||||
| Conversion of warrants to restricted stock units |
— | — | — | — | 1,068 | (1,068 | ) | — | — | — | ||||||||||||||||||||||||||
| Blackhawk Biofuels LLC deconsolidation and transition adjustment |
— | — | — | — | 1,192 | — | 30,152 | (13,477 | ) | 17,867 | ||||||||||||||||||||||||||
| Stock compensation expense |
— | — | — | — | 1,720 | — | — | — | 1,720 | |||||||||||||||||||||||||||
| Accretion of preferred stock to redemption value |
— | 27,239 | — | — | (27,239 | ) | — | — | — | (27,239 | ) | |||||||||||||||||||||||||
| Net loss |
— | — | — | — | — | — | (21,588 | ) | — | (21,588 | ) | |||||||||||||||||||||||||
|
|
|
|
|
|
|
|
|
|
|
|
|
|
|
|
|
|
|
|||||||||||||||||||
| BALANCE, December 31, 2010 |
13,455,522 | $ | 122,436 | 33,129,553 | $ | 3 | $ | 82,634 | $ | 4,820 | $ | (52,341 | ) | $ | — | $ | 35,116 | |||||||||||||||||||
|
|
|
|
|
|
|
|
|
|
|
|
|
|
|
|
|
|
|
|||||||||||||||||||
See notes to consolidated financial statements.
F-5
Table of Contents
Renewable Energy Group, Inc. and Subsidiaries
CONSOLIDATED STATEMENTS OF CASH FLOWS
For the years ended December 31, 2010, 2009 and 2008
(In thousands)
| 2010 | 2009 | 2008 | ||||||||||
| Cash flows from operating activities: |
||||||||||||
| Net loss |
$ | (21,588 | ) | $ | (68,858 | ) | $ | (15,879 | ) | |||
| Adjustments to reconcile net loss to net cash flows from operating activities: |
||||||||||||
| Depreciation expense |
5,291 | 4,438 | 1,798 | |||||||||
| Amortization expense of assets and liabilities, net |
637 | 1,334 | (716 | ) | ||||||||
| Gain on sale of property, plant & equipment |
— | (2,254 | ) | (127 | ) | |||||||
| Provision (benefit) for doubtful accounts |
105 | (1,432 | ) | 740 | ||||||||
| Stock compensation expense |
1,376 | 2,522 | 3,574 | |||||||||
| Loss from equity method investees |
689 | 1,089 | 1,013 | |||||||||
| Deferred tax expense (benefit) |
(3,252 | ) | 45,212 | (8,268 | ) | |||||||
| Impairment of intangible assets |
7,336 | — | — | |||||||||
| Impairment of investments |
400 | 200 | 1,400 | |||||||||
| Impairment of long lived assets |
158 | 833 | 160 | |||||||||
| Change in fair value of preferred stock conversion feature embedded derivatives |
8,208 | 2,339 | (2,118 | ) | ||||||||
| Change in fair value of Seneca Holdco liability |
3,742 | — | — | |||||||||
| Distributions received from equity method investees |
100 | 110 | 363 | |||||||||
| Expense settled with stock issuance |
— | 334 | 867 | |||||||||
| Changes in asset and liabilities, net of effects from mergers and acquisitions: |
||||||||||||
| Accounts receivable |
(4,876 | ) | (3,671 | ) | 10,585 | |||||||
| Inventories |
(15,937 | ) | (1,045 | ) | 2,162 | |||||||
| Prepaid expenses and other assets |
1,866 | 2,915 | 362 | |||||||||
| Accounts payable |
(3,378 | ) | 3,443 | (1,346 | ) | |||||||
| Accrued expenses and other liabilities |
671 | (1,087 | ) | 2,718 | ||||||||
| Deferred revenue |
3,859 | 5,480 | — | |||||||||
| Billings in excess of costs and estimated earnings on uncompleted contracts |
— | (111 | ) | (924 | ) | |||||||
|
|
|
|
|
|
|
|||||||
| Net cash flows from operating activities |
(14,593 | ) | (8,209 | ) | (3,636 | ) | ||||||
|
|
|
|
|
|
|
|||||||
| Cash flows from investing activities: |
||||||||||||
| Cash paid for purchase of property, plant and equipment |
(4,550 | ) | (7,350 | ) | (67,235 | ) | ||||||
| Proceeds from the sale of fixed assets |
303 | 3,032 | 1,315 | |||||||||
| Change in restricted cash |
(513 | ) | 4,689 | 15,904 | ||||||||
| Cash received from escrow for purchase of investments |
— | — | 500 | |||||||||
| Cash provided through Blackhawk transaction |
— | — | 2,225 | |||||||||
| Cash provided through USBG acquisition |
— | — | 16,895 | |||||||||
| Return of investment in Bell, LLC |
— | — | 4,223 | |||||||||
| Deconsolidation of Blackhawk |
(206 | ) | — | — | ||||||||
| Cash provided through Blackhawk acquisition |
1 | — | — | |||||||||
| Cash provided through Central Iowa Energy acquisition |
403 | — | — | |||||||||
|
|
|
|
|
|
|
|||||||
| Net cash flows from investing activities |
(4,562 | ) | 371 | (26,173 | ) | |||||||
|
|
|
|
|
|
|
|||||||
| Cash flows from financing activities: |
||||||||||||
| Borrowings on line of credit |
9,400 | 880 | 5,522 | |||||||||
| Repayments on line of credit |
(750 | ) | (1,822 | ) | (4,230 | ) | ||||||
| Cash received for issuance of note payable |
— | 100 | 28,821 | |||||||||
| Cash paid on notes payable |
(2,109 | ) | (776 | ) | (3,270 | ) | ||||||
| Cash proceeds from investment in Seneca Landlord |
4,000 | — | — | |||||||||
| Cash received from issuance of common stock to ARES Corporation |
8,000 | — | — | |||||||||
| Cash paid for issuance cost of common and preferred stock |
(280 | ) | — | (480 | ) | |||||||
| Cash paid for debt issuance costs |
(702 | ) | — | (208 | ) | |||||||
|
|
|
|
|
|
|
|||||||
| Net cash flows from financing activities |
17,559 | (1,618 | ) | 26,155 | ||||||||
|
|
|
|
|
|
|
|||||||
| Net change in cash and cash equivalents |
(1,596 | ) | (9,456 | ) | (3,654 | ) | ||||||
| Cash and cash equivalents, Beginning of period |
5,855 | 15,311 | 18,965 | |||||||||
|
|
|
|
|
|
|
|||||||
| Cash and cash equivalents, End of period |
$ | 4,259 | $ | 5,855 | $ | 15,311 | ||||||
|
|
|
|
|
|
|
|||||||
| (continued) | ||||||||||||
F-6
Table of Contents
Renewable Energy Group, Inc. and Subsidiaries
CONSOLIDATED STATEMENTS OF CASH FLOWS
For the years ended December 31, 2010, 2009 and 2008
(In thousands)
| 2010 | 2009 | 2008 | ||||||||||
| Supplemental disclosures of cash flows information: |
||||||||||||
| Cash received for income taxes |
$ | 584 | $ | 2,827 | $ | 2,535 | ||||||
|
|
|
|
|
|
|
|||||||
| Cash paid for interest |
$ | 4,226 | $ | 2,128 | $ | 2,582 | ||||||
|
|
|
|
|
|
|
|||||||
| Supplemental disclosure of non-cash investing and financing activities: |
||||||||||||
| Effects of recapitalization |
$ | 8,521 | ||||||||||
|
|
|
|||||||||||
| Accretion of preferred stock to redemption value |
$ | 27,239 | $ | 44,181 | $ | 26,692 | ||||||
|
|
|
|
|
|
|
|||||||
| Amounts included in period-end accounts payable for: |
||||||||||||
| Purchases of property, plant and equipment |
$ | 192 | $ | 38 | $ | 1,020 | ||||||
|
|
|
|
|
|
|
|||||||
| Equity method investment received from REG, LLC |
$ | 63 | ||||||||||
|
|
|
|||||||||||
| Removal of cost method investee as a result of consolidation |
$ | 1,000 | ||||||||||
|
|
|
|||||||||||
| Issuance of common stock for debt financing cost |
$ | 3,015 | ||||||||||
|
|
|
|||||||||||
| Reduction of accounts payable in exchange for assets |
$ | 773 | ||||||||||
|
|
|
|||||||||||
| Removal of equity method investee as a result of consolidation |
$ | 3,969 | $ | 2,000 | ||||||||
|
|
|
|
|
|||||||||
| Property, plant and equipment acquired through the assumption of liabilities |
$ | 39,314 | ||||||||||
|
|
|
|||||||||||
| Issuance of restricted stock units for equity issuance cost |
$ | 582 | ||||||||||
|
|
|
|||||||||||
| Assets (liabilities) acquired through the issuance of stock: |
||||||||||||
| Cash |
$ | 8,404 | $ | — | $ | — | ||||||
| Restricted cash |
2,302 | — | 22,749 | |||||||||
| Other current assets |
1,342 | — | 61 | |||||||||
| Property, plant, and equipment |
89,597 | — | 9,420 | |||||||||
| Goodwill |
68,784 | — | — | |||||||||
| Intangible assets |
3,027 | — | 410 | |||||||||
| Deferred tax assets |
— | — | 27,383 | |||||||||
| Other noncurrent assets |
231 | 1,359 | 67 | |||||||||
| Line of credit |
(900 | ) | — | — | ||||||||
| Other current liabilities |
(5,548 | ) | — | (3,059 | ) | |||||||
| Debt |
(72,668 | ) | — | — | ||||||||
| Unfavorable lease obligation |
— | — | (12,128 | ) | ||||||||
| Noncontrolling interest |
— | — | (24,820 | ) | ||||||||
| Other noncurrent liabilities |
(11,454 | ) | — | — | ||||||||
|
|
|
|
|
|
|
|||||||
| $ | 83,117 | $ | 1,359 | $ | 20,083 | |||||||
|
|
|
|
|
|
|
|||||||
| See “Note 7 - Variable Interest Entities” for noncash items related to the deconsolidation of Blackhawk |
| |||||||||||
| (concluded) | ||||||||||||
See notes to consolidated financial statements.
F-7
Table of Contents
Renewable Energy Group, Inc. and Subsidiaries
NOTES TO THE CONSOLIDATED FINANCIAL STATEMENTS
For the three years ended December 31, 2010, 2009 and 2008
(In thousands, except share and per share amounts)
Note 1—Organization, Presentation, and Nature of the Business
On February 26, 2010, Renewable Energy Group, Inc. (the Company) (formerly known as REG Newco, Inc.) completed its acquisitions of REG Biofuels, Inc. (Biofuels) (formerly known as Renewable Energy Group, Inc. and REG Intermediate Holdco, Inc.) and Blackhawk Biofuels, LLC (Blackhawk) and on March 8, 2010 the Company completed its asset purchase of Central Iowa Energy, LLC (CIE) (collectively, the Acquisitions).
On February 26, 2010, a wholly owned subsidiary of the Company was merged with and into Biofuels (the Biofuels Merger). As a result of the Biofuels Merger, each share of Biofuels’ common stock issued and outstanding immediately prior to the effective time was converted into the right to receive one share of the Company’s common stock, $0.0001 par value per share (the Common Stock), and each share of the Biofuels’ preferred stock issued and outstanding immediately prior to the effective time was converted into the right to receive one share of the Company’s Series A Preferred Stock, $0.0001 par value per share (the Series A Preferred Stock).
Also on February 26, 2010, a wholly owned subsidiary of the Company was merged with and into Blackhawk (the Blackhawk Merger). Blackhawk was renamed REG Danville, LLC (REG Danville) immediately following the merger. As a result of the Blackhawk Merger, each outstanding Blackhawk Series A Unit (other than such units held by Biofuels or any affiliate of Biofuels) was converted into 0.4479 shares of Common Stock and 0.0088 shares of Series A Preferred Stock. Each outstanding warrant for the purchase of Series A Units of Blackhawk became a warrant for the purchase of shares of Common Stock, with the number of shares and exercise price per share adjusted based on the 0.4479 common shares exchange ratio. The former members of Blackhawk received 132,680 shares of Series A Preferred Stock, 6,753,311 shares of Common Stock and 335,924 warrants. See “Note 6—Acquisitions and Equity Transactions” for a description of the acquisition and its accounting treatment.
On March 8, 2010, the Company acquired substantially all of the assets and liabilities of CIE (CIE Asset Purchase) in exchange for an aggregate of 4,252,830 shares of Common Stock and 158,485 shares of Series A Preferred Stock. The assets and liabilities were acquired from CIE by REG Newton, LLC (REG Newton), a wholly owned subsidiary of the Company. See “Note 6—Acquisitions and Equity Transactions” for a description of the acquisition and its accounting treatment.
On April 9, 2010, the Company entered into a series of agreements related to the asset purchase agreement with Nova Biosource Fuels, Inc. See “Note 6—Acquisitions and Equity Transactions” for a description of the acquisition and its accounting treatment.
On July 16, 2010, the Company acquired certain assets from Tellurian Biodiesel, Inc. (Tellurian) and American BDF, LLC (ABDF). ABDF was a joint venture owned by Golden State Service Industries, Restaurant Technologies, Inc. (RTI) and Tellurian Biodiesel. See “Note 6—Acquisitions and Equity Transactions” for a description of the acquisition and its accounting treatment.
On September 21, 2010, the Company acquired substantially all of the assets of Clovis Biodiesel, LLC (Clovis), a wholly owned subsidiary of ARES Corporation, and received $8,000 cash in exchange for the Company’s Common Stock. See “Note 6—Acquisitions and Equity Transactions” for a description of the acquisition and its accounting treatment.
F-8
Table of Contents
Renewable Energy Group, Inc. and Subsidiaries
NOTES TO THE CONSOLIDATED FINANCIAL STATEMENTS — (Continued)
For the three years ended December 31, 2010, 2009 and 2008
(In thousands, except share and per share amounts)
Prior to February 26, 2010, the Company refers to the business, results of operations and cash flows of Biofuels, which is considered the accounting predecessor to the Company. For the period after February 26, 2010, the Company refers to the business, results of operations and cash flows of Renewable Energy Group, Inc. (formerly, REG Newco, Inc.) and its consolidated subsidiaries, including Biofuels, REG Danville, and REG Newton.
Nature of business
As of December 31, 2010, the Company owned biodiesel production facilities with a total of 182 million gallons per year (mmgy) of production capacity, which includes a 60 mmgy biodiesel facility in Seneca, Illinois leased by the Company from a consolidated variable interest entity (see Note 6—Acquisitions and Equity Transactions).
In 2007, the Company commenced construction of a 60 mmgy production capacity facility near New Orleans, Louisiana and a 60 mmgy production capacity facility in Emporia, Kansas. In 2008, the Company halted construction of these facilities as a result of conditions in the biodiesel industry and the credit markets. The Company continues to pursue financing and intends to finish the New Orleans, Louisiana facility, which is approximately 50% complete, and the facility in Emporia, Kansas, which is approximately 20% complete, when industry conditions improve and financing becomes available. In September 2010, the Company purchased the assets of Clovis which includes a partially completed 15 mmgy biodiesel plant located in Clovis, New Mexico. The plant is approximately 70% complete. The Company continues to be in discussions with lenders in an effort to obtain financing for facilities under construction and capital improvement projects. The city incentive package for the Emporia construction project has been renewed for an additional three years starting July 1, 2010. Additionally, as a result of halting construction, the Company performed an analysis to evaluate if the assets under construction were impaired. Based on the projected gross cash flows of the projects the Company determined that no impairment has occurred.
As of December 31, 2010, the Company managed one other biodiesel production facility owned primarily by an independent investment group with an aggregate of 30 mmgy capacity (hereafter referred to as Network Plant). For this facility, the Company has entered into an agreement to manage the facility while the investment group determines how to raise capital for production facility upgrades. In 2009, the Company provided notice to five networks facilities that it would be terminating services under the Management and Operational Services Agreement (MOSA) twelve months from the date notice was provided as permitted by the MOSAs. Of the five cancellation notices given in 2009, three facilities did not renew their MOSA, the Company is managing one while the facility is working on raising capital and another facility was purchased through an asset purchase agreement.
The biodiesel industry and the Company’s business have relied on the continuation of certain federal and state incentives and mandates. On December 17, 2010, Congress reinstated the federal biodiesel tax credit retroactive to January 1, 2010 with an expiration date of December 31, 2011. Current incentives to the biodiesel industry may not continue beyond their scheduled expiration date or, if they continue, the incentives may not be at the same level. The revocation or amendment of any one or more of those laws, regulations or programs could adversely affect the financial results of the Company. Revenues include amounts related to federal subsidies and regulatory support totaling $7,240, $19,465 and $6,564 for the years ended December 31, 2010, 2009 and 2008, respectively.
F-9
Table of Contents
Renewable Energy Group, Inc. and Subsidiaries
NOTES TO THE CONSOLIDATED FINANCIAL STATEMENTS — (Continued)
For the three years ended December 31, 2010, 2009 and 2008
(In thousands, except share and per share amounts)
Note 2—Summary of Significant Accounting Policies
Basis of consolidation
The accompanying consolidated financial statements include the accounts of the Company, consolidated with the accounts of all of its subsidiaries and affiliates in which the Company holds a controlling financial interest as of the financial statement date. Normally, a controlling financial interest reflects ownership of a majority of the voting interests. Other factors considered in determining whether a controlling financial interest is held include whether the Company possesses the authority to purchase or sell assets or make other operating decisions that significantly affect the entity’s results of operations and whether the Company is the primary beneficiary of the economic benefits and financial risks of the entity. Intercompany accounts and transactions have been eliminated.
Pro Forma for Recapitalization
The pro forma earnings per share (EPS) gives effect to the one-time conversion of Series A Preferred Stock and certain common stock warrants into shares of newly-issued common stock and up to 3,000,000 shares of $75,000 aggregate liquidation preference Series B preferred stock with cumulative dividends of 4.50% per annum payable in cash or common stock. On June 30, 2015, each holder of Series B preferred stock will have the right to require us to redeem its shares at the Redemption Price. At any time following the expiration of the underwriters’ lock-up period described under the section entitled “Underwriting” in the prospectus, which we refer to as the lock-up expiration date, the holder of any shares of Series B preferred stock will have the right to convert such shares, together with accumulated and unpaid dividends (whether or not declared) into shares of Common Stock at the conversion rate in effect at such time. If, at any time following the lock-up expiration date, the closing sale price of the Common Stock exceeds certain pricing thresholds, then we may, at our option, cause up to all of the then outstanding shares of Series B preferred stock (and corresponding accumulated and unpaid dividends) to be converted into shares of our common stock at the then-applicable conversion rate.
Cash and cash equivalents
Cash and cash equivalents consists of money market funds and demand deposits with financial institutions. The Company considers all highly liquid debt instruments purchased with an original maturity of three months or less to be cash equivalents.
Restricted cash
Restricted cash consists of project funds and debt reserve funds that are invested in money market mutual funds related to various Company entities totaling $2,969 and $2,156 as of December 31, 2010 and 2009, respectively, which have been restricted in accordance with the terms of loan agreements. The Company classifies restricted cash between current and non-current assets based on the length of time of the restricted use.
Accounts receivable
Accounts receivable are carried on a gross basis, less allowance for doubtful accounts. Management estimates the allowance for doubtful accounts based on existing economic conditions, the financial conditions of customers, and the amount and age of past due accounts. Receivables are considered past
F-10
Table of Contents
Renewable Energy Group, Inc. and Subsidiaries
NOTES TO THE CONSOLIDATED FINANCIAL STATEMENTS — (Continued)
For the three years ended December 31, 2010, 2009 and 2008
(In thousands, except share and per share amounts)
due if full payment is not received by the contractual due date. Past due accounts are generally written off against the allowance for doubtful accounts only after reasonable collection attempts have been exhausted. A significant portion of the reserves as of December 31, 2008 was established as a result of past due receivables with a single customer. During 2009, the Company settled the outstanding receivable. Activity regarding the allowance for doubtful accounts was as follows:
| Balance, January 1, 2008 |
$ | 1,955 | ||||
| Amount charged to selling, general and administrative expenses |
740 | |||||
| Charge-offs, net of recovery |
(165 | ) | ||||
|
|
|
|||||
| Balance, December 31, 2008 |
2,530 | |||||
| Amount charged (benefited) to selling, general and administrative expenses |
(1,432 | ) | ||||
| Charge-offs, net of recovery |
(885 | ) | ||||
|
|
|
|||||
| Balance, December 31, 2009 |
213 | |||||
| Amount charged to selling, general and administrative expenses |
103 | |||||
| Charge-offs, net of recovery |
— | |||||
|
|
|
|||||
| Balance, December 31, 2010 |
$ | 316 | ||||
|
|
|
|||||
Inventories
Inventories consist of raw materials, work in process and finished goods and are valued at the lower of cost or market. Inventory values as of December 31, 2010 and 2009 include adjustments to reduce inventory to the lower of cost or market in the amount of $35 and $194, respectively. Cost is determined based on the first-in, first-out method.
Derivative instruments and hedging activities
The Company has entered into derivatives to hedge its exposure to price risk related to feedstock inventory and biodiesel finished goods inventory. Additionally, the Company has entered into an interest rate swap with the objective of managing risk caused by fluctuations in interest rates associated with the REG Danville note payable.
These derivative contracts are accounted for in accordance with ASC Topic 815, Derivatives and Hedging (ASC Topic 815). ASC Topic 815 requires that an entity recognize and record all derivatives on the balance sheet at fair value. All of the Company’s derivatives are designated as non-hedge derivatives and are utilized to manage cash flow. Although the contracts may be effective economic hedges of specified risks, they are not designated as, nor accounted for, as hedging instruments. Unrealized gains and losses on commodity futures, swaps, and options contracts used to hedge feedstock purchases or biodiesel inventory are recognized as a component of biodiesel costs of goods sold reflected in current results of operations. Unrealized gains and losses on the interest rate swap are recorded in change in fair value of interest rate swap in the Company’s statements of operations.
Valuation of preferred stock conversion feature embedded derivatives
As stated in “Note 1—Organization, Presentation and Nature of the Business”, in connection with the Biofuels Merger, all outstanding shares of Biofuels preferred stock were converted into Company Series A Preferred Stock.
F-11
Table of Contents
Renewable Energy Group, Inc. and Subsidiaries
NOTES TO THE CONSOLIDATED FINANCIAL STATEMENTS — (Continued)
For the three years ended December 31, 2010, 2009 and 2008
(In thousands, except share and per share amounts)
The Series A Preferred Stock terms provide for voluntary and, under certain circumstances, automatic conversion of the Series A Preferred Stock to Common Stock based on a prescribed formula. In addition, shares of Series A Preferred Stock are subject to redemption at the election of the holder beginning February 26, 2014. The redemption price is equal to the greater of (i) an amount equal to $13.75 per share of Series A Preferred Stock plus any and all accrued dividends, not to exceed $16.50 per share, or (ii) the fair market value of the Series A Preferred Stock. Under ASC Topic 815, the Company is required to bifurcate and account for as a separate liability certain derivatives embedded in its contractual obligations. An “embedded derivative” is a provision within a contract, or other instrument, that affects some or all of the cash flows or the value of that contract, similar to a derivative instrument. Essentially, the embedded provision within the contract contains all of the attributes of a free-standing derivative, such as an underlying market variable, a notional amount or payment provision, and can be settled “net,” but the contract, in its entirety, does not meet the ASC Topic 815 definition of a derivative.
The Company has determined that the conversion feature of the Series A Preferred Stock is an embedded derivative because the redemption feature allows the holder to redeem Series A Preferred Stock for cash at a price which can vary based on the fair market value of the Series A Preferred Stock, which effectively provides the holders with a mechanism to “net settle” the conversion option. Consequently, the embedded conversion option must be bifurcated and accounted for separately because the economic characteristics of this conversion option are not considered to be clearly and closely related to the economic characteristics of the Series A Preferred Stock, which is considered more akin to a debt instrument than equity.
Upon issuance of the Series A Preferred Stock, the Company recorded a liability representing the estimated fair value of the right of holders of the Series A Preferred Stock to receive the fair market value of the Common Stock issuable upon conversion of the Series A Preferred Stock on the redemption date. This liability is adjusted each quarter based on changes in the estimated fair value of such right, and a corresponding income or expense is recorded in change in fair value of the Series A Preferred Stock conversion feature embedded derivatives in the Company’s statements of operations.
The Company uses the option pricing method to value the embedded derivative. The Company used the Black-Scholes options pricing model to estimate the fair value of the conversion option embedded in each series of Biofuels preferred stock prior to February 26, 2010 and the Series A Preferred Stock as of and subsequent to February 26, 2010. The Black-Scholes options pricing model requires the development and use of highly subjective assumptions. These assumptions include the expected volatility of the value of the Company’s equity, the expected conversion date, an appropriate risk-free interest rate, and the estimated fair value of the Company’s equity. The expected volatility of the Company’s equity is estimated based on the volatility of the value of the equity of publicly traded companies in a similar industry and general stage of development as the Company. The expected term of the conversion option is based on the period remaining until the contractually stipulated redemption date of February 26, 2014. The risk-free interest rate is based on the yield on U.S. Treasury STRIPs with a remaining term equal to the expected term of the conversion option. The development of the estimated fair value of the Company’s equity is discussed below in “Valuation of the Company’s Equity.”
F-12
Table of Contents
Renewable Energy Group, Inc. and Subsidiaries
NOTES TO THE CONSOLIDATED FINANCIAL STATEMENTS — (Continued)
For the three years ended December 31, 2010, 2009 and 2008
(In thousands, except share and per share amounts)
The significant assumptions utilized in the Company’s valuation of the embedded derivative are as follows:
| December 31, 2010 |
February 26, 2010 |
December 31, 2009 |
December 31, 2008 |
June 30, 2008 |
||||||||||||||||
| Expected volatility |
40.00 | % | 40.00 | % | 50.00 | % | 55.00 | % | 55.00 | % | ||||||||||
| Risk-free rate |
4.10 | % | 4.40 | % | 4.11 | % | 4.39 | % | 4.58 | % | ||||||||||
Valuation of seneca holdco liability
Associated with the Company’s transaction with Nova Biosource Fuels, LLC (See Note 6—Acquisitions and Equity Transactions), the Company has the option to purchase (Call Option) and Seneca Holdco, LLC has the option to require the Company to purchase (Put Option) the membership interest of Seneca Landlord, LLC (Landlord) whose assets consist primarily of a biodiesel plant located in Seneca, Illinois. Both the Put Option and the Call Option have a term of seven years and are exercisable by either party at a price based on a pre-defined formula. The Company has determined the fair value of the amounts financed by Seneca Holdco, LLC, the Put Option, and the Call Option using an option pricing model. The fair value represents the probability weighted present value of the gain, or loss, that is realized upon exercise of each option. The option pricing model requires the development and use of highly subjective assumptions. These assumptions include (i) the value of the Landlord’s equity, (ii) expectations regarding future changes in the value of the Landlord’s equity, (iii) expectations about the probability of either option being exercised, including the Company’s ability to list its securities on an exchange or complete a public offering, and (iv) an appropriate risk-free rate. Company management considered current public equity markets, relevant regulatory issues, industry conditions and the Company’s position within the industry when estimating the probability that the Company will raise additional capital. Differences in the estimated probability and timing of this event may significantly impact the fair value assigned to the Seneca Holdco Liability as management has determined it is not likely that the Put Option will become exercisable in the absence of this event.
The significant assumptions utilized in the Company’s valuation of the Seneca Holdco liability are as follows:
| December 31, 2010 |
April 9, 2010 |
|||||||
| Expected volatility |
50.00 | % | 50.00 | % | ||||
| Risk-free rate |
4.10 | % | 4.60 | % | ||||
| Probability of IPO |
70.00 | % | 60.00 | % | ||||
Preferred stock accretion
Beginning October 1, 2007, the date that the Company determined that there was a more than remote likelihood that the then issued and outstanding preferred stock would become redeemable, the Company commenced accretion of the carrying value of the preferred stock over the period until the earliest redemption date, which was August 1, 2011, to the Biofuels preferred stock’s redemption value, plus accrued but unpaid dividends using the effective interest method. This determination was based upon the
F-13
Table of Contents
Renewable Energy Group, Inc. and Subsidiaries
NOTES TO THE CONSOLIDATED FINANCIAL STATEMENTS — (Continued)
For the three years ended December 31, 2010, 2009 and 2008
(In thousands, except share and per share amounts)
current state of the public equity markets which was restricting the Company’s ability to execute a qualified public offering, the Company’s historical operating results, and the volatility in the biodiesel and renewable fuels industries which have resulted in lower projected profitability. Prior to October 1, 2007, the Company had determined that it was not probable that the preferred stock would become redeemable; therefore, the carrying value was not adjusted in accordance with ASC Topic 480-10-S99, Classification and Measurement of Redeemable Securities.
On February 26, 2010, the date the Company determined that there was a more than remote likelihood that the Series A Preferred Stock would become redeemable, the Company commenced accretion of the carrying value of the Series A Preferred Stock over the period until the earliest redemption date (February 26, 2014) to the Series A Preferred Stock’s redemption value, plus accrued but unpaid dividends using the effective interest method. This determination was based upon the current state of the public equity markets which is restricting the Company’s ability to execute a qualified public offering, the Company’s historical operating results, and the volatility in the biodiesel and renewable fuels industries which have resulted in lower projected profitability.
Accretion of $27,239, $44,181 and $26,692 for the years ended December 31, 2010, 2009 and 2008, respectively, has been recognized as a reduction to income available to common stockholders in accordance with paragraph 15 of ASC Topic 480-10-S99.
Valuation of the company’s equity
The Company considered three generally accepted valuation approaches to estimate the fair value of the aggregate equity of the Company: the income approach, the market approach and the cost approach. Ultimately, the estimated fair value of the aggregate equity of the Company was developed using the Income Approach - Discounted Cash Flow (DCF) method.
Material underlying assumptions in the DCF analysis include the gallons produced and managed, gross margin per gallon, expected long-term growth rates and an appropriate discount rate. Gallons produced and managed as well as the gross margin per gallon were determined based on historical and forward-looking market data.
The discount rate used in the DCF analysis is based on macroeconomic, industry and Company-specific factors and reflects the perceived degree of risk associated with realizing the projected cash flows. The selected discount rate represents the weighted average rate of return that a market participant investor would require on an investment in the Company’s debt and equity. The percent of total capital assumed to be comprised of debt and equity when developing the weighted average cost of capital was based on a review of the capital structures of the Company’s publicly traded industry peers. The cost of debt was estimated utilizing the adjusted average Baa-rated corporate bond rate during the previous 12 months representing a reasonable market participant rate based on the Company’s publicly traded industry peers. The Company’s cost of equity was estimated utilizing the capital asset pricing model, which develops an estimated market rate of return based on the appropriate risk-free rate adjusted for the risk of the alternative energy industry relative to the market as a whole, an equity risk premium and a company specific risk premium. The risk premiums included in the discount rate were based on historical and forward looking market data.
F-14
Table of Contents
Renewable Energy Group, Inc. and Subsidiaries
NOTES TO THE CONSOLIDATED FINANCIAL STATEMENTS — (Continued)
For the three years ended December 31, 2010, 2009 and 2008
(In thousands, except share and per share amounts)
Discount rates utilized in the Company’s DCF model are as follows:
| December 31, 2010 |
February 26, 2010 |
December 31, 2009 |
December 31, 2008 |
June 30, 2008 |
||||||||||||||||
| Discount rate |
16.00 | % | 15.00 | % | 13.00 | % | 15.00 | % | 13.50 | % | ||||||||||
Valuations derived from this model are subject to ongoing verification and review. Selection of inputs involves management’s judgment and may impact net income. This analysis is performed on a regular basis and takes into account factors that have changed from the last measurement date or the time of the last Common Stock issuance. Other factors affecting our assessment of price include recent purchases or sales of our Common Stock, if available.
Non-monetary exchanges
The Company records assets acquired and liabilities assumed through the exchange of non-monetary assets based on the fair value of the assets and liabilities acquired or the fair value of the consideration exchanged, whichever is more readily determinable.
Property, plant and equipment
Property, plant and equipment is recorded at cost, including applicable construction-period interest, less accumulated depreciation. Maintenance and repairs are expensed as incurred. Depreciation expense is computed on a straight-line method based upon estimated useful lives of the assets. Estimated useful lives are as follows:
| Automobiles and trucks |
5 years | |
| Computers and office equipment |
5 years | |
| Office furniture and fixtures |
7 years | |
| Machinery and equipment |
5-30 years | |
| Leasehold improvements |
the lesser of the lease term or 30 years | |
| Buildings and improvements |
30-40 years |
The Company capitalizes interest incurred on debt during the construction of assets in accordance with ASC Topic 838, Interest. For the years ended December 31, 2010, 2009 and 2008, the Company capitalized $713, $0 and $876, respectively, of interest primarily resulting from the construction of the Blackhawk and Seneca biodiesel production facilities.
Goodwill
The Company accounts for goodwill in accordance with ASC Topic 350, Intangibles—Goodwill and Other. Goodwill is reviewed for impairment by reporting unit annually on July 31 or between annual periods when management believes impairment indicators exist. If the carrying value of the reporting unit goodwill is considered impaired, a loss is recognized based on the amount by which the carrying value exceeds the fair market value of the reporting unit goodwill. Fair value is determined using a
F-15
Table of Contents
Renewable Energy Group, Inc. and Subsidiaries
NOTES TO THE CONSOLIDATED FINANCIAL STATEMENTS — (Continued)
For the three years ended December 31, 2010, 2009 and 2008
(In thousands, except share and per share amounts)
discounted cash flow methodology involving a significant level of judgment in the assumptions used. Changes to the Company’s strategy or market conditions could significantly impact these judgments and require adjustments to recorded amounts of goodwill. There was no impairment of goodwill recorded in the periods presented.
The following table summarizes goodwill for the Company’s business segments:
| Biodiesel | Services | Total | ||||||||||
| Beginning balance—January 1, 2009 |
$ | — | $ | 16,080 | $ | 16,080 | ||||||
| Acquisitions |
— | — | — | |||||||||
|
|
|
|
|
|
|
|||||||
| Ending balance—December 31, 2009 |
— | 16,080 | 16,080 | |||||||||
| Blackhawk Biofuels acquisition |
44,191 | — | 44,191 | |||||||||
| CIE acquisition |
24,593 | — | 24,593 | |||||||||
|
|
|
|
|
|
|
|||||||
| Ending balance—December 31, 2010 |
$ | 68,784 | $ | 16,080 | $ | 84,864 | ||||||
|
|
|
|
|
|
|
|||||||
Impairment of assets
The Company reviews long-lived assets, including property, plant and equipment and definite-lived assets, for impairment in accordance with ASC Topic 360, Property, Plant and Equipment. Asset impairment charges are recorded for long-lived assets and intangible assets subject to amortization when events and circumstances indicate that such assets may be impaired and the undiscounted net cash flows estimated to be generated by those assets are less than their carrying amounts. If estimated future undiscounted cash flows are not sufficient to recover the carrying value of the assets, an impairment charge is recorded for the amount by which the carrying amount of the assets exceeds its fair value. Fair value is determined by management estimates using discounted cash flow calculations.
During 2010, the raw material supply agreements for the New Orleans and Emporia facilities were cancelled. The original agreements were recorded as an intangible asset in the amount of $7,025. As a result of the cancellations, the full amount was charged off during the year ended December 31, 2010.
The Company also impaired deferred financing cost related to the New Orleans project GoZone bonds. The Company determined that it was not probable that the GoZone bonds allocation would be extended past the December 14, 2010 deadline or that the bonds would be issued prior to the deadline, and accordingly, the Company returned its allocation prior to the deadline. The amount of the impairment for the year ended December 31, 2010 was $311.
Total asset impairment charges of $7,494, $833 and $160 were recorded for the years ended December 31, 2010, 2009 and 2008, respectively.
Investments
In connection with the construction of biodiesel production facility for SoyMor Biodiesel, LLC (SoyMor) (collectively with Bell, LLC referred to as “Equity Method Investees”), the Company made an equity
F-16
Table of Contents
Renewable Energy Group, Inc. and Subsidiaries
NOTES TO THE CONSOLIDATED FINANCIAL STATEMENTS — (Continued)
For the three years ended December 31, 2010, 2009 and 2008
(In thousands, except share and per share amounts)
investment in this entity. Because the Company has the ability to influence the operating and financial decisions and maintains a position on the board of directors of the Equity Method Investees, the investments are accounted for using the equity method in accordance with ASC Topic 323, Investments—Equity Method and Joint Ventures (ASC Topic 323). Under the equity method, the initial investment is recorded at cost and adjusted to recognize the Company’s ratable share of earnings of the Equity Method Investees. The Company made equity investments in connection with the construction of biodiesel production facilities for Central Iowa Energy, LLC (CIE), Western Iowa Energy, LLC (WIE), Western Dubuque Biodiesel, LLC (WDB) and East Fork Biodiesel, LLC (EFB). Because the Company does not have the ability to influence the operating and financial decisions and does not maintain a position on the board of directors, these investments are accounted for using the cost method in accordance with ASC Topic 323. During 2010, the Company changed its method of accounting for investments in WIE and WDB from the equity method to the cost method due to the Company no longer having the ability to influence the operating and financial decisions of these entities. Under the cost method, the initial investment is recorded at cost and assessed for impairment. The equity investment related to CIE was removed during the purchase price allocation process on March 8, 2010. During the years ended December 31, 2010, 2009 and 2008, the Company recorded impairments in the amount of $400, $200 and $1,400, respectively, on its investment in EFB that was determined to have been other-than-temporarily impaired.
Other noncurrent assets
Other noncurrent assets include costs related to the issuance of debt, spare parts inventory and raw material supply agreement. The debt issuance costs are amortized to interest expense over the life of the related debt agreement. The supply agreement is amortized over the term of the agreement according to the volume of feedstock used in operation.
Revenue recognition
The Company recognizes revenues from the following sources:
| · | the sale of biodiesel and its co-products—both purchased and produced by the Company |
| · | fees received from federal and state incentive programs for renewable fuels |
| · | fees received for the marketing and sales of biodiesel produced by third parties and from managing operations of third party facilities |
Biodiesel sales revenues are recognized where there is persuasive evidence of an arrangement, delivery has occurred, the price has been fixed or is determinable and collectability can be reasonably assured.
Revenues associated with the governmental incentive programs are recognized when the amount to be received is determinable, collectability is reasonably assured, and the sale of product giving rise to the incentive has been recognized.
Fees for managing ongoing operations of third party plants, marketing biodiesel produced by third party plants and from other services are recognized as services are provided. The Company also has
F-17
Table of Contents
Renewable Energy Group, Inc. and Subsidiaries
NOTES TO THE CONSOLIDATED FINANCIAL STATEMENTS — (Continued)
For the three years ended December 31, 2010, 2009 and 2008
(In thousands, except share and per share amounts)
performance based incentive agreements that are included as management service revenues. These performance incentives are recognized as revenues when the amount to be received is determinable and collectability is reasonably assured.
The Company acts as a sales agent for certain third parties, thus the Company recognizes revenues on a net basis in accordance with ASC Topic 605-45, Revenue Recognition (ASC Topic 605-45).
Freight
The Company accounts for shipping and handling revenues and costs in accordance with ASC Topic 605-45. The Company presents all amounts billed to the customer for freight as a component of biodiesel sales. Costs incurred for freight are reported as a component of costs of goods sold—biodiesel.
Advertising costs
Advertising and promotional expenses are charged to earnings during the period in which they are incurred. Advertising and promotional expenses were $80, $235 and $798 for the years ended December 31, 2010, 2009 and 2008, respectively.
Research and development
The Company expenses research and development costs as incurred. Research and development costs totaled $89, $187 and $59 for the years ended December 31, 2010, 2009 and 2008, respectively.
Employee benefits plan
The Company sponsors an employee savings plan under Section 401(k) of the Internal Revenue Code. The Company makes matching contributions equal to 50% of the participant’s pre-tax contribution up to a maximum of 6% of the participant’s eligible earnings. Total expense related to the Company’s defined contribution plan was approximately $245, $218 and $186 for the years ended December 31, 2010, 2009 and 2008, respectively.
Stock-based compensation
The Company has two stock incentive plans. On July 31, 2006, the Biofuels Board of Directors (Biofuels Board) approved the 2006 Stock Incentive Plan. On May 6, 2009, the Company Board of Directors (Company Board) approved the 2009 Stock Incentive Plan. Eligible award recipients are employees, non-employee directors and advisors who provide service to the Company. The Company accounted for stock-based compensation in accordance with ASC Topic 718, Stock Compensation (ASC Topic 718). Compensation expense is measured at the grant-date fair value of the award and recognized as compensation expense over the vesting period.
Income taxes
The Company recognizes deferred taxes by the asset and liability method. Under this method, deferred income taxes are recognized for differences between the financial statement and tax bases of assets and liabilities at enacted statutory tax rates in effect for the years in which differences are expected to reverse.
F-18
Table of Contents
Renewable Energy Group, Inc. and Subsidiaries
NOTES TO THE CONSOLIDATED FINANCIAL STATEMENTS — (Continued)
For the three years ended December 31, 2010, 2009 and 2008
(In thousands, except share and per share amounts)
The effect on deferred taxes of a change in tax rates is recognized in income in the period that includes the enactment date. In addition, the carrying amount of deferred tax assets are reviewed to determine whether the establishment of a valuation allowance is necessary. If it is more-likely-than-not that all or a portion of the Company’s deferred tax assets will not be realized, based on all available evidence, a deferred tax valuation allowance would be established. Consideration is given to positive and negative evidence related to the realization of the deferred tax assets. Significant judgment is required in making this assessment.
Deferred tax liabilities were recorded during the year ended December 31, 2010 as a result of the Blackhawk Merger and CIE Asset Purchase. As the deferred tax liabilities were recorded, the resulting decrease in net deferred tax assets required a lower valuation allowance. The release of the associated valuation allowance resulted in an income tax benefit.
Prior to deconsolidation on January 1, 2010 and the Blackhawk Merger, Blackhawk was treated as a partnership for federal and state income tax purposes and generally did not incur income taxes. Instead, its earnings and losses were included in the income tax returns of its members. Therefore, no provision or liability for federal or state income taxes was included in the consolidated financial statements of the Company aside from its pro-rata share determined based on its ownership interest.
Loss Per Share
Basic and diluted net income (loss) per common share are presented in conformity with the two-class method required for participating securities. The two-class method includes an earnings allocation formula that determines earnings for each class of common stock according to dividends declared and undistributed earnings for the period.
The holders of the Series A Preferred Stock accrue dividends at the rate of $0.88 per share per annum. Dividends are cumulative, accrue on a daily basis from the date of issuance and compound annually from the date of issuance. If dividends on the Series A Preferred Stock have not been paid or declared, the deficiency shall be paid or declared before any dividend is declared for Common Stock. Dividends in arrears do not bear interest. Holders of the Series A Preferred Stock are allowed to participate in the dividends to common stockholders in the event that dividends on Common Stock exceed that of the Series A Preferred Stock as if the Series A Preferred Stock had been converted to Common Stock at the beginning of the year.
The Company calculates the effects of the convertible Series A Preferred Stock on diluted EPS under the if-converted method unless the conversion of the convertible preferred stock is anti-dilutive to basic EPS. The effects of Common Stock options, warrants and restricted stock units on diluted EPS are calculated using the treasury stock method unless the effects are anti-dilutive to EPS.
F-19
Table of Contents
Renewable Energy Group, Inc. and Subsidiaries
NOTES TO THE CONSOLIDATED FINANCIAL STATEMENTS — (Continued)
For the three years ended December 31, 2010, 2009 and 2008
(In thousands, except share and per share amounts)
The following potentially dilutive securities were excluded from the calculation of diluted net loss per share attributable to common stockholders during the periods presented as the effect was anti-dilutive:
| Year ended December 31, | ||||||||||||
| 2010 | 2009 | 2008 | ||||||||||
| Options to purchase common stock |
218,816 | 2,208,552 | 2,284,552 | |||||||||
| Restricted stock units |
2,885,223 | — | — | |||||||||
| Warrants to purchase common stock |
1,054,824 | 977,435 | 977,435 | |||||||||
| Redeemable preferred shares |
13,455,522 | 12,464,357 | 12,434,004 | |||||||||
|
|
|
|
|
|
|
|||||||
| Total |
17,614,385 | 15,650,344 | 15,695,991 | |||||||||
|
|
|
|
|
|
|
|||||||
Pro Forma Net Loss Per Share
Pro forma basic and diluted net income (loss) per share were computed to give effect to (i) the conversion of the Series A Preferred Stock and the exchange of certain common stock warrants into shares of common stock and $75,000 aggregate liquidation preference Series B Preferred Stock with cumulative dividends of 4.50% per annum using the if-converted method and (ii) the issuance of certain shares of common stock pursuant to the termination agreement relating to the glycerin option agreement with USRG Holdco IX, LLC, as though the conversion, exchange and issuance, which are both contingent upon the completion of this offering, had occurred as of the beginning of the period.
The following table presents the calculation of basic and diluted pro forma net income per share (in thousands, except share and per share data):
| Year ended December 31, |
||||
| 2010 | ||||
| Net loss attributable to the company’s common stockholders |
$ | (50,333 | ) | |
| Plus: undistributed dividends allocated to Series A preferred stockholders |
10,027 | |||
| Plus: accretion of Series A preferred stock to redemption value |
27,239 | |||
| Plus: loss due to change in fair value of Series A preferred stock conversion feature embedded derivatives |
|
8,208 |
| |
| Less: effects of issuance of common stock pursuant to the termination agreement related to the glycerin option agreement |
||||
| Less: dividends on Series B preferred stock |
||||
| Less: effects of recapitalization |
||||
|
|
|
|||
| Pro forma net loss attributable to the company’s common stockholders |
$ | |||
|
|
|
|||
| Basic shares: |
||||
| Weighted-average shares used to compute basic net loss per share |
29,427,120 | |||
| Pro forma adjustment to reflect assumed conversion of Series A preferred stock to occur upon consummation of the company’s expected initial public offering |
||||
| Pro forma adjustment to reflect assumed conversion of warrants to occur upon consummation of the company’s expected initial public offering |
||||
| Pro forma adjustment to reflect issuance of common stock pursuant to the termination agreement related to the glycerin option agreement |
||||
|
|
|
|||
| Weighted-average shares used to compute basic pro forma net loss per share |
||||
|
|
|
|||
| Pro forma net income per share attributable to the company’s common stockholders |
||||
| Basic |
$ | |||
|
|
|
|||
| Diluted |
$ | |||
|
|
|
|||
F-20
Table of Contents
Renewable Energy Group, Inc. and Subsidiaries
NOTES TO THE CONSOLIDATED FINANCIAL STATEMENTS — (Continued)
For the three years ended December 31, 2010, 2009 and 2008
(In thousands, except share and per share amounts)
Warrants
The Company estimates the fair value of warrants issued and records that balance in additional paid-in-capital in the consolidated balance sheet. Because the warrants relate to the common and preferred stock issued, additional paid-in-capital of common and preferred stock was decreased by a like amount. Subsequent changes in the fair value of the warrants are not recognized in accordance with ASC Topic 815-40, Derivatives and Hedging.
Use of estimates
The preparation of financial statements in conformity with accounting principles generally accepted in the United States of America (GAAP) requires management to make estimates and assumptions that affect the reported amounts of assets and liabilities, disclosure of contingent assets and liabilities at the dates of the financial statements and reported amounts of revenues and expenses during the reporting periods. These estimates are based on information that is currently available to management and on various assumptions that the Company believes to be reasonable under the circumstances. Actual results could differ from those estimates.
New accounting pronouncements
In June 2009, the FASB issued ASU No. 2009-17, Improvements to Financial Reporting by Enterprises Involved with Variable Interest Entities, which amends ASC Topic 810, Consolidations (ASU No. 2009-17). This Statement requires a qualitative analysis to determine the primary beneficiary of a Variable Interest Entity (VIE). The analysis identifies the primary beneficiary as the enterprise that has both the power to direct the activities of a VIE that most significantly impact the VIE’s economic performance and the obligation to absorb losses or the right to receive benefits that could be significant to the VIE. The Statement also requires additional disclosures about an enterprise’s involvement in a VIE. The effective date is the beginning of fiscal year 2010. The Company adopted this statement effective January 1, 2010 which resulted in the deconsolidation of Blackhawk and additional disclosure requirements. See “Note 7 —Variable Interest Entities” for additional information.
In January 2010, the FASB issued Accounting Standards Update (ASU) No. 2010-06, Fair Value Measurements and Disclosures (ASU 2010-06), which amends ASC Topic 820, adding new requirements for disclosures for Levels 1 and 2, separate disclosures of purchases, sales issuances, and settlements related to Level 3 measurements and clarification of existing fair value disclosures. ASU 2010-06 is in effect for interim and annual periods beginning after December 15, 2009, except for the requirement to provide Level 3 activity of purchases, sales, issuances, and settlements on a gross basis, which will be effective for fiscal years beginning after December 15, 2010. The adoption of this guidance did not have a material effect on the Company’s financial statements and the Company does not anticipate the remaining disclosures will have a material effect on the Company’s financial statements.
F-21
Table of Contents
Renewable Energy Group, Inc. and Subsidiaries
NOTES TO THE CONSOLIDATED FINANCIAL STATEMENTS — (Continued)
For the three years ended December 31, 2010, 2009 and 2008
(In thousands, except share and per share amounts)
Note 3—Stockholders’ Equity of The Company
Common stock
On February 26, 2010, the Company filed its restated certificate of incorporation with the Secretary of State of Delaware. The restated certificate of incorporation authorized 140,000,000 shares of Common Stock at a par value of $0.0001 per share. See “Note 6—Acquisitions and Equity Transactions” for information related to Common Stock issued in connection with the Acquisitions.
Each holder of Common Stock is entitled to one vote for each share of Common Stock held on all matters submitted to a vote of stockholders. Subject to preferences that may apply to shares of outstanding Series A Preferred Stock as outlined below, the holders of outstanding shares of the Common Stock are entitled to receive dividends. After the payment of all preferential amounts required to the holders of Series A Preferred Stock, all of the remaining assets of the Company available for distribution shall be distributed ratably among the holders of Common Stock.
Common stock issued during 2008:
On May 9, 2008, the Company issued 1,980,488 shares of common stock in conjunction with Blackhawk’s purchase of a 45 mmgy biodiesel plant in Danville, Illinois. See “Note 5—Blackhawk” for information related to the Blackhawk transaction.
On June 26, 2008 and October 21, 2008, the Company issued 3,726,830 and 136,585 shares of common stock, respectively, in connection with the acquisition of a 35 mmgy biodiesel production facility located in Houston, Texas from U.S. Biodiesel Group. See “Note 6—Acquisitions and Equity Transactions” for information related to the acquisition.
On October 21, 2008, the Company issued 126,340 shares of common stock to a third party in exchange for certain manufacturing equipment. The shares issued were then transferred from the third party to U.S. Biodiesel Group.
Common stock issued during 2009:
On August 3, 2009, the Company issued 10,000 and 10,000 shares of common stock to Todd & Sargent, Inc. and The Weitz Group, LLC, respectively, in exchange for renegotiating a note payable.
On August 17, 2009, the Company issued 250,000 shares of common stock to GATX Corporation in conjunction with renegotiating rail car leases.
Common stock issued during 2010:
On February 26, 2010, the Company issued 6,753,311 shares of Common Stock to the shareholders of Blackhawk in exchange for outstanding shares of Blackhawk.
On March 8, 2010, the Company issued 4,252,830 shares of Common Stock to CIE and to Houlihan Smith & Company in connection with the purchase of substantially all CIE company assets.
On April 9, 2010, the Company issued 500,000 shares of Common Stock to West LB in connection with the issuance of a Revolving Credit Agreement to the Company.
F-22
Table of Contents
Renewable Energy Group, Inc. and Subsidiaries
NOTES TO THE CONSOLIDATED FINANCIAL STATEMENTS — (Continued)
For the three years ended December 31, 2010, 2009 and 2008
(In thousands, except share and per share amounts)
On July 16, 2010, the Company issued 598,295 shares of Common Stock in connection with the purchase of substantially all Tellurian and ABDF assets.
On September 21, the Company issued 2,150,000 shares of Common Stock to ARES Corporation in connection with the purchase of substantially all the assets held by Clovis and cash.
Common stock warrants
Under the Company’s outstanding warrants, the holder may purchase the number of shares of Common Stock underlying each warrant held for a purchase price ranging from $2.23 to $11.00 per share. The warrant holder may “net exercise” the warrants and use the common shares received upon exercise of the warrants outstanding as the consideration for payment of the exercise price.
The warrant holders are generally protected from anti-dilution by adjustments for any stock dividends, stock split, combination, or other recapitalization.
The following table summarizes the number of shares reserved for the exercise of common stock purchase warrants as of December 31:
| Issued to | Issuance date | Expiration date | Exercise price per share |
Warrants outstanding 2009 |
Warrants outstanding 2010 |
|||||||||||
| Viant |
*August 1, 2006 | August 1, 2011 | $ | 9.50 | 41,474 | — | ||||||||||
| Viant |
*August 11, 2006 | August 11, 2011 | $ | 9.50 | 10,526 | — | ||||||||||
| Viant |
*September 15, 2006 | September 15, 2011 | $ | 9.50 | 26,956 | — | ||||||||||
| Viant |
*December 22, 2006 | December 22, 2011 | $ | 9.50 | 69,053 | — | ||||||||||
| Viant |
April 25, 2008 | April 25, 2018 | $ | 10.00 | 100,000 | — | ||||||||||
| Natural Gas Partners VIII |
August 1, 2006 | August 1, 2014 | $ | 9.50 | 70,313 | 70,313 | ||||||||||
| Entities affiliated with NGP Energy Technology Partners |
August 1, 2006 | August 1, 2014 | $ | 9.50 | 70,312 | 70,312 | ||||||||||
| Natural Gas PartnersVIII |
December 22, 2006 | December 22, 2014 | $ | 9.50 | 117,187 | 117,187 | ||||||||||
| Entities affiliated with NGP Energy Technology Partners |
December 22, 2006 | December 22, 2014 | $ | 9.50 | 117,188 | 117,188 | ||||||||||
| Viant |
June 26, 2007 | June 26, 2015 | $ | 11.00 | 10,526 | — | ||||||||||
| Natural Gas Partners VIII |
July 18, 2007 | July 18, 2015 | $ | 11.00 | 22,727 | 22,727 | ||||||||||
| NGP Energy Technologies |
July 18, 2007 | July 18, 2015 | $ | 11.00 | 22,727 | 22,727 | ||||||||||
| West Central |
July 18, 2007 | July 18, 2015 | $ | 11.00 | 22,727 | 22,727 | ||||||||||
| E D & F Man |
July 18, 2007 | July 18, 2015 | $ | 11.00 | 22,727 | 22,727 | ||||||||||
| Bunge |
July 18, 2007 | July 18, 2015 | $ | 11.00 | 9,090 | 9,090 | ||||||||||
| U.S. Biodiesel Group |
June 26, 2008 | June 26, 2018 | $ | 10.25 | 243,902 | 243,902 | ||||||||||
| Blackhawk warrant holders |
February 26, 2010 | February 25, 2015 | $ | 2.53 | — | 335,924 | ||||||||||
|
|
|
|
|
|||||||||||||
| 977,435 | 1,054,824 | |||||||||||||||
|
|
|
|
|
|||||||||||||
| * | The Company reissued these warrants on April 25, 2008 at terms not substantially different from the original date noted here. |
F-23
Table of Contents
Renewable Energy Group, Inc. and Subsidiaries
NOTES TO THE CONSOLIDATED FINANCIAL STATEMENTS — (Continued)
For the three years ended December 31, 2010, 2009 and 2008
(In thousands, except share and per share amounts)
The fair value of the warrants issued in April and June 2008 and February 2010 was determined using the common stock value as of June 30, 2008 and February 26, 2010. The deemed fair value of the underlying common stock on June 30, 2008 and February 26, 2010 was $0.89 and $6.03, respectively. The methodology used to determine the fair value of the Company’s common stock on those dates is further discussed in “Note 2—Summary of Significant Accounting Policies”. Because the Company’s stock is not publicly traded, the Company used the average historical volatility rate for publicly traded companies that are engaged in similar alternative fuel activities to those of the Company for a similar time period as the expected life of the warrants. The expected life of the warrants was determined based upon the contractual term of the agreements.
No common stock warrants were issued during 2009. For purposes of determining the fair value of common stock warrants issued, the Company used the Black-Scholes option pricing model and the assumptions set forth in the table below:
| 2010 | 2008 | |||||||
| The weighted average fair value of warrants issued (per warrant) |
$ | 3.28 - $3.86 | $ | 0.19 | ||||
| Dividend yield |
0 | % | 0 | % | ||||
| Weighted average risk-free interest rate |
2.2 | % | 3.0 | % | ||||
| Weighted average expected volatility |
45 | % | 55 | % | ||||
| Expected life in years |
1.00 - 6.00 | 10.00 | ||||||
Stock issuance costs
In addition to the warrants, other direct costs of obtaining capital by issuing the common and preferred stock were deducted from related proceeds with the net amount recorded as preferred stock or stockholders’ equity. Direct costs incurred for the years ended December 31, 2010 and 2008 were $862 and $480, respectively. There were no stock issuance costs during 2009.
Note 4—Redeemable Preferred Stock
The Company’s restated certificate of incorporation filed on February 26, 2010 authorizes 60,000,000 shares of preferred stock, including 14,000,000 shares of Series A preferred stock, with a par value of $0.0001. The Company’s Board of Directors has discretion, subject to the approval of certain shareholders, as to the designation of voting rights, dividend rights, redemption price, liquidation preference and other provisions of each issuance. See “Note 6 – Acquisitions and Equity Transactions” for information related to the cancellation of all outstanding Biofuels preferred stock on February 26, 2010 and the issuance of Series A Preferred Stock in connection with the Acquisitions.
The following summarizes each series of Preferred Stock as of December 31:
| 2009 | ||||||||||||||||||||
| Series A preferred stock |
Series B preferred stock |
Series AA preferred stock |
Series BB preferred stock |
Total | ||||||||||||||||
| Shares outstanding |
6,578,947 | 2,236,361 | 558,140 | 3,090,909 | 12,464,357 | |||||||||||||||
| Carrying amount |
$ | 71,870 | $ | 36,721 | $ | 4,994 | $ | 35,537 | $ | 149,122 | ||||||||||
| Redemption amount |
$ | 146,850 | $ | 55,405 | $ | 6,000 | $ | 39,332 | $ | 247,587 | ||||||||||
F-24
Table of Contents
Renewable Energy Group, Inc. and Subsidiaries
NOTES TO THE CONSOLIDATED FINANCIAL STATEMENTS — (Continued)
For the three years ended December 31, 2010, 2009 and 2008
(In thousands, except share and per share amounts)
In connection with the Company’s acquisition of Biofuels and Blackhawk, the Company cancelled the four outstanding series of preferred stock and each share of Biofuels preferred share was converted into a share of Series A preferred stock.
The following summarizes the changes in outstanding shares for each series of Preferred Stock for fiscal years ended December 31:
| Series A preferred stock |
Series B preferred stock |
Series AA preferred stock |
Series BB Preferred stock |
Total | ||||||||||||||||
| January 1, 2008 |
6,578,947 | 1,999,998 | — | — | 8,578,945 | |||||||||||||||
| Issuances |
— | 206,010 | 558,140 | 3,090,909 | 3,855,059 | |||||||||||||||
|
|
|
|
|
|
|
|
|
|
|
|||||||||||
| December 31, 2008 |
6,578,947 | 2,206,008 | 558,140 | 3,090,909 | 12,434,004 | |||||||||||||||
| Issuances |
— | 30,353 | — | — | 30,353 | |||||||||||||||
|
|
|
|
|
|
|
|
|
|
|
|||||||||||
| December 31, 2009 |
6,578,947 | 2,236,361 | 558,140 | 3,090,909 | 12,464,357 | |||||||||||||||
| Exchange of REG Holdco preferred stock |
(6,578,947 | ) | (2,236,361 | ) | (558,140 | ) | (3,090,909 | ) | (12,464,357 | ) | ||||||||||
| Issuances |
13,455,522 | — | — | — | 13,455,522 | |||||||||||||||
|
|
|
|
|
|
|
|
|
|
|
|||||||||||
| December 31, 2010 |
13,455,522 | — | — | — | 13,455,522 | |||||||||||||||
|
|
|
|
|
|
|
|
|
|
|
|||||||||||
The rights, preferences, privileges and restrictions granted to and imposed on the Preferred Stock are set forth below. The holders of Preferred Stock are generally protected from anti-dilution by adjustments for any stock dividends, stock split, combination or other recapitalization.
Dividend provisions
The holders of the Series A Preferred Stock accrue dividends at the rate of $0.88 per share per annum. Dividends are cumulative, accrue on a daily basis from the date of issuance and compound annually from the date of issuance. If dividends on the Series A Preferred Stock have not been paid or declared, the deficiency shall be paid or declared before any dividend is declared for Common Stock. Dividends in arrears do not bear interest. Holders of the Series A Preferred Stock are allowed to participate in the dividends to common stockholders in the event that dividends on Common Stock exceed that of the Series A Preferred Stock as if the Series A Preferred Stock had been converted to Common Stock at the beginning of the year. Holders of at least seventy-five percent of the outstanding shares of the Series A Preferred Stock that were issued in exchange for shares of the Series A, Series AA, Series B or Series BB Biofuels Preferred Stock, pursuant to the Biofuels Merger agreement (Preferred Supermajority) may vote to waive the timing or amount of any dividend payment. The Company has not declared any dividends on the Series A Preferred Stock outstanding. Dividends previously accrued on the Biofuels preferred stock were forgone in connection with the Biofuels Merger and issuance of the Series A Preferred Stock. There were $10,027 of the Series A Preferred Stock dividends in arrears as of December 31, 2010 and $33,388 of Biofuels preferred stock dividends in arrears as of December 31, 2009.
F-25
Table of Contents
Renewable Energy Group, Inc. and Subsidiaries
NOTES TO THE CONSOLIDATED FINANCIAL STATEMENTS — (Continued)
For the three years ended December 31, 2010, 2009 and 2008
(In thousands, except share and per share amounts)
Liquidation rights
Upon the occurrence of a voluntary or involuntary liquidation (including consolidations, mergers or sale of assets as defined by the preferred stock agreement), if the remaining net assets of the Company are sufficient, the holders of the Series A Preferred Stock shall be paid no less than liquidation value plus all dividends in arrears (whether or not declared), out of the assets of the Company legally available for distribution to its stockholders, before any payment or distribution is made to any holders of Common Stock.
If upon any liquidation or dissolution, the remaining net assets of the Company are insufficient to pay the amount that the Series A Preferred Stock holders are due as indicated above, the holders of Series A Preferred Stock will share ratably in any distribution of the remaining assets of the Company.
Conversion rights
All shares of the Series A Preferred Stock will be converted into shares of Common Stock at a 1 to 1 conversion ratio:
| a) | of a closing of the sale of shares of Common Stock at a level at or exceeding $22.00, in a Qualified Public Offering (QPO), requiring aggregate proceeds to the Company of at least $40 million, or |
| b) | specified in a written contract or agreement of the Preferred Supermajority, or |
| c) | the shares of Common Stock have a closing price on NASDAQ or any national securities exchange in excess of $24.75 per share for ninety (90) consecutive trading days with an average daily trading volume on such trading days of at least US $8,000. |
Voting rights
Each holder of the Series A Preferred Stock is entitled to the number of votes equal to the number of shares of Common Stock into which the Series A Preferred Stock held by such holder are convertible.
Additionally, the Company is prohibited, without obtaining the approval of the Preferred Supermajority from performing certain activities including, but not limited to, amending shareholder agreements, redeeming or purchasing any outstanding shares of the Company, declaring dividends, making certain capital expenditures and merging or consolidating with other entities.
Redemption rights
On or after February 26, 2014, the Preferred Supermajority may require that the Company redeem all or part of the issued and outstanding shares of the Series A Preferred Stock out of funds lawfully available; provided, however, that any such redemptions equal in the aggregate $5,000. The redemption price is the greater of the fair market value per share at the date of the redemption election or $13.75 per share of the Series A Preferred Stock, plus accrued and unpaid preferred stock dividends, not to exceed $16.50 per share.
F-26
Table of Contents
Renewable Energy Group, Inc. and Subsidiaries
NOTES TO THE CONSOLIDATED FINANCIAL STATEMENTS — (Continued)
For the three years ended December 31, 2010, 2009 and 2008
(In thousands, except share and per share amounts)
The following table demonstrates certain preferred stock attributes. All amounts are per share:
| Series A preferred stock |
||||
| Original issue price |
$ | 11.00 | ||
| Dividend rate per annum |
$ | 0.88 | ||
| Common stock price to trigger automatic conversion |
$ | 22.00 | ||
| Series A Preferred Stock holders required for super majority |
75 | % | ||
| Redemption option price |
$ | 13.75 | ||
| Liquidation price |
$ | 13.75 | ||
The following table demonstrates the redemption requirements for each of the next five fiscal years ended December 31:
| Series A preferred stock |
||||
| 2011 |
$ | — | ||
| 2012 |
— | |||
| 2013 |
— | |||
| 2014 |
222,016 | |||
| 2015 |
— | |||
Preferred stock issued during 2008:
On May 9, 2008, the Company issued 127,273 shares of Series B Preferred Stock to Bunge as part of the Blackhawk Biofuels, LLC acquisition of a biodiesel facility in Danville, Illinois.
On June 26, 2008, the Company issued 558,140 and 3,090,909 shares of Series AA Preferred and Series BB Preferred, respectively, as part of the Company’s acquisition of a 35 mmgy biodiesel production facility in Houston, Texas and a terminal facility in Stockton, California.
During 2008, the Company issued 78,737 shares of Series B Preferred Stock to West Central as payment for administrative services.
Preferred stock issued during 2009:
On April 8, 2009, the Company issued 30,353 shares of Series B Preferred to West Central for payment of administrative services.
Preferred stock issued during 2010:
On February 26, 2010, the Company exchanged 700,000 shares of Common Stock issued to USRG Holdco V LLC, Ohana Holdings LLC, ED&F Man Holdings B.V. and others for 700,000 shares of Series A Preferred Stock.
F-27
Table of Contents
Renewable Energy Group, Inc. and Subsidiaries
NOTES TO THE CONSOLIDATED FINANCIAL STATEMENTS — (Continued)
For the three years ended December 31, 2010, 2009 and 2008
(In thousands, except share and per share amounts)
The Company applied the guidance in EITF Topic No. D-42: The Effect on the Calculation of Earnings per Share for the Redemption or Induced Conversion of Preferred Stock (codified to ASC 260-10 S99-2) in regards to the exchange of common shares for preferred shares and the exchange of one series of preferred shares for a different series of preferred shares.
The Company compared the fair value of the preferred shares issued to the carrying amount of the preferred and common shares that were redeemed. The excess of the carrying amount of preferred and common shares that were redeemed over the fair value of the preferred shares issued was recorded as an increase in additional paid-in capital and was added to net earnings available to common shareholders.
On February 26, 2010, the Company issued 132,680 shares of Series A Preferred Stock to the shareholders of Blackhawk in exchange for the outstanding Series A Units of Blackhawk.
On March 8, 2010, the Company issued 158,485 shares of Series A Preferred Stock to CIE and to Houlihan Smith & Company in connection with the purchase of substantially all of CIE company assets.
Note 5—Blackhawk
On May 9, 2008 the Company was party to a transaction, whereby Blackhawk purchased a 45 mmgy biodiesel production facility under construction located in Danville, Illinois from Biofuels Company of America, LLC. Blackhawk received the plant assets under construction and assumed a term construction loan with principal outstanding of $24,650 in exchange for $5,250 in cash and 1,980,488 shares of Common Stock of the Company set forth in the purchase agreement at $10.25 per share. Additionally, the Company issued 127,273 shares of Series B Preferred Stock with a per share value of $11.00 as established in the purchase agreement, to Bunge North America, Inc. (Bunge) on behalf of Blackhawk. In exchange for the Series B Preferred Stock Blackhawk entered into a soy oil supply agreement with Bunge. In exchange for the Biofuels Common and Biofuels Preferred Stock issued, the Company received a subordinated convertible note from Blackhawk with a par value of $21,700.
Simultaneously with this transaction the Company entered into a MOSA with Blackhawk to manage the operations of the newly acquired plant as well as a design-build agreement to perform construction services retrofitting the plant to produce biodiesel using alternative feedstocks. Finally, the Company received 51,563 warrants to purchase membership units in Blackhawk at $0.01 per share at anytime with no scheduled expiration. The warrants were received by the Company as compensation for providing a guarantee of $1.5 million in indebtedness of Blackhawk under the term construction loan and they vest 20% per year after the date of issuance until fully vested.
The Company held 1,000,000 membership units of Blackhawk as of May 9, 2008 and subsequently received an additional 327,017 units, 658,052 units and 145,307 units in 2008, 2009 and 2010, respectively, in lieu of interest on the subordinated convertible note. The Company’s interest represents ownership interests in Blackhawk of 11.6% and 12.4% as of December 31, 2009 and February 26, 2010, respectively.
Prior to January 1, 2010, the Company consolidated Blackhawk according to the then requirements of ASC Topic 810 as they were determined to be the primary beneficiary (PB). The Company determined it was the PB as it holds significant variable interests resulting in it receiving the majority of Blackhawk’s
F-28
Table of Contents
Renewable Energy Group, Inc. and Subsidiaries
NOTES TO THE CONSOLIDATED FINANCIAL STATEMENTS — (Continued)
For the three years ended December 31, 2010, 2009 and 2008
(In thousands, except share and per share amounts)
expected losses or the majority of its expected residual returns. Variable interests in Blackhawk held by the Company are the subordinated convertible note, membership units, guaranty of indebtedness of up to $1,500, warrants, MOSA, and the design-build agreement.
As a result of the consolidation, all accounts of Blackhawk have been included with the Company’s financial statements as of May 9, 2008, the date of the transaction. As required by ASC Topic 810 the assets, including cash of $2,225, and liabilities consolidated by the Company were recorded at their relative fair values. The fair value of the Biofuels Common and Biofuels Preferred Stock transferred as consideration was determined as further discussed in “Note 2—Summary of Significant Accounting Policies” and is summarized as follows:
| Fair value | Fair value per share |
|||||||
| Common |
$ | 1,763 | $ | 0.89 | ||||
| Series B Preferred |
1,231 | $ | 9.67 | |||||
|
|
|
|||||||
| Total |
$ | 2,994 | ||||||
|
|
|
|||||||
The assets and liabilities consolidated by the Company from Blackhawk did not represent a business as defined in ASC Topic 805, Business Combinations, therefore no goodwill was recorded. Accordingly, the Company consolidated Blackhawk and accounts for the membership units not held by the Company as a noncontrolling interest.
On January 1, 2010, the Company deconsolidated Blackhawk as a result of adopting ASU No. 2009-17, as it was determined that the Company was no longer the PB (Blackhawk Deconsolidation). Although the financial arrangements mentioned above resulted in the Company holding substantial variable interests in Blackhawk, they did not give the Company the power to direct the activities that most significantly impact Blackhawk’s economic performance. Consequently, subsequent to adopting this accounting pronouncement, the Company deconsolidated Blackhawk. See “Note 7—Variable Interest Entities” for additional information. Upon deconsolidation, an equity investment in Blackhawk of $3,969 and a subordinated convertible note receivable of $24,298 were recognized at fair value using the option available under ASC Topic 825, Financial Instruments, and the previously consolidated amounts were removed from the consolidated balance sheet. The difference between the amounts recognized at fair value and the removal of the previously consolidated amounts was recorded to retained earnings (accumulated deficit).
On February 26, 2010, the Company completed the Blackhawk Merger. See “Note 6—Acquisitions and Equity Transactions” for additional information regarding the accounting for the Blackhawk Merger.
Note 6—Acquisitions and Equity Transactions
On February 26, 2010, the Company completed its mergers with Biofuels and Blackhawk and on March 8, 2010 the Company completed the asset purchase of CIE. The Company also completed the asset purchase of Nova Biosource Fuels, Inc. on April 8, 2010, an asset purchase of Tellurian and ABDF on July 16, 2010 and an asset purchase of Clovis on September 21, 2010.
F-29
Table of Contents
Renewable Energy Group, Inc. and Subsidiaries
NOTES TO THE CONSOLIDATED FINANCIAL STATEMENTS — (Continued)
For the three years ended December 31, 2010, 2009 and 2008
(In thousands, except share and per share amounts)
REG Biofuels, Inc.
On February 26, 2010, the Company completed its merger with Biofuels.
Pursuant to the Second Amended and Restated Agreement and Plan of Merger, executed November 20, 2009, dated and effective as of the original execution date, May 11, 2009, REG Merger Sub, Inc., a Delaware corporation and wholly owned subsidiary of the Company was merged with and into Biofuels. Upon consummation of the merger, Biofuels became a wholly owned subsidiary of the Company. At the closing, each share of Biofuels’ Common Stock issued and outstanding immediately prior to the effective time was converted into the right to receive one share of the Common Stock, $0.0001 par value per share, and each share of Biofuels’ preferred stock issued and outstanding immediately prior to the effective time was converted into the right to receive one share of the Series A Preferred Stock, $0.0001 par value per share.
The Company accounted for the Biofuels Merger as a business combination in accordance with ASC Topic 805. When accounting for the exchange of shares between entities under common control, the entity that receives the net assets shall initially recognize the assets and liabilities transferred at their carrying amounts in the accounts of the transferring entity at the date of transfer.
As the transaction was accounted for with carryover basis, no goodwill was recognized in conjunction with the Biofuels Merger, and no significant contingent assets or liabilities were acquired or assumed in the Biofuels Merger.
Blackhawk Biofuels LLC
On February 26, 2010, the Company completed the Blackhawk Merger.
Pursuant to the Second Amended and Restated Agreement and Plan of Merger, executed November 21, 2009, dated and effective as of the original execution date, May 11, 2009, REG Danville, LLC, a wholly owned subsidiary of the Company, was merged with and into Blackhawk. Upon consummation of the merger, Blackhawk became a wholly owned subsidiary of the Company and changed its name to REG Danville, LLC. Pursuant to the Blackhawk Merger, each outstanding Blackhawk Series A Units (other than such units held by Biofuels or any affiliate of Biofuels) was converted into 0.4479 shares of Common Stock and 0.0088 shares of Series A Preferred Stock. Each outstanding warrant for the purchase of Series A units of Blackhawk became exercisable for the purchase of shares of Common Stock, with the number of shares and exercise price per share adjusted appropriately based on the 0.4479 shares exchange ratio. The former members of Blackhawk have received 132,680 shares of Series A Preferred Stock and 6,753,311 shares of Common Stock.
F-30
Table of Contents
Renewable Energy Group, Inc. and Subsidiaries
NOTES TO THE CONSOLIDATED FINANCIAL STATEMENTS — (Continued)
For the three years ended December 31, 2010, 2009 and 2008
(In thousands, except share and per share amounts)
The following table summarizes the final allocations of the purchase price to the fair values of the assets acquired and liabilities assumed at the date of acquisition:
| Allocation at February 26, 2010 |
||||
| Assets (liabilities) acquired: |
||||
| Cash |
$ | 1 | ||
| Restricted cash |
2,002 | |||
| Other current assets |
859 | |||
| Property, plant and equipment |
55,253 | |||
| Goodwill |
44,191 | |||
| Other noncurrent assets |
231 | |||
| Line of credit |
(350 | ) | ||
| Other current liabilities |
(3,621 | ) | ||
| Notes payable |
(48,743 | ) | ||
| Other noncurrent liabilities |
(6,802 | ) | ||
|
|
|
|||
| Fair value of common and preferred stock issued |
$ | 43,021 | ||
|
|
|
|||
The acquisition price is summarized as follows:
| Value at February 26, 2010 | ||||||||
| Fair value | Fair value per share |
|||||||
| Fair value of stock issued: |
||||||||
| Warrants |
$ | 1,269 | $ | 3.78 | ||||
| Common Stock |
40,721 | $ | 6.03 | |||||
| Series A Preferred Stock |
1,031 | $ | 7.77 | |||||
|
|
|
|||||||
| Total |
$ | 43,021 | ||||||
|
|
|
|||||||
Since all of REG Danville’s revenues for the period from February 26, 2010 through December 31, 2010 consisted entirely of tolling fees from REG Marketing & Logistics Group, LLC (REG Marketing), they were eliminated on a consolidated basis.
Central Iowa Energy LLC
On March 8, 2010, the Company completed its acquisition of substantially all of the assets of CIE.
Pursuant to the Second Amended and Restated Asset Purchase Agreement, executed November 20, 2009, dated and effective as of the original execution date, May 8, 2009, REG Newton, LLC, a wholly owned subsidiary of the Company, acquired substantially all assets and liabilities of CIE. At closing, the Company delivered to CIE an aggregate of 158,485 shares of Series A Preferred Stock and 4,252,830 shares of Common Stock.
F-31
Table of Contents
Renewable Energy Group, Inc. and Subsidiaries
NOTES TO THE CONSOLIDATED FINANCIAL STATEMENTS — (Continued)
For the three years ended December 31, 2010, 2009 and 2008
(In thousands, except share and per share amounts)
The following table summarizes the final allocation of the purchase price to the fair values of the assets acquired and liabilities assumed at the date of acquisition:
| Allocation at March 8, 2010 |
||||
| Assets (liabilities) acquired: |
||||
| Cash |
$ | 403 | ||
| Restricted cash |
300 | |||
| Other current assets |
483 | |||
| Property, plant and equipment |
32,153 | |||
| Goodwill |
24,593 | |||
| Line of credit |
(550 | ) | ||
| Other current liabilities |
(1,927 | ) | ||
| Notes payable |
(23,925 | ) | ||
| Other noncurrent liabilities |
(4,652 | ) | ||
|
|
|
|||
| Fair value of common and preferred stock issued |
$ | 26,878 | ||
|
|
|
|||
The acquisition price is summarized as follows:
| Final value at March 8, 2010 | ||||||||
| Fair value | Fair value per share |
|||||||
| Fair value of stock issued: |
||||||||
| Common Stock |
$ | 25,645 | $ | 6.03 | ||||
| Series A Preferred Stock |
1,233 | $ | 7.77 | |||||
|
|
|
|||||||
| Total |
$ | 26,878 | ||||||
|
|
|
|||||||
Since all of REG Newton’s revenues for the period from March 8, 2010 through December 31, 2010 consisted entirely of contract manufacturing fees from REG Marketing, they were eliminated on a consolidated basis.
The following pro forma condensed combined results of operations assume that the Blackhawk Merger and CIE Asset Acquisition were completed as of January 1, 2010, 2009, and 2008, respectively:
| 2010 | 2009 | 2008 | ||||||||||
| Revenues |
$ | 216,609 | $ | 135,216 | $ | 157,901 | ||||||
| Net loss |
$ | (24,633 | ) | $ | (74,890 | ) | $ | (18,613 | ) | |||
Nova Biosource Fuels, Inc.
On April 8, 2010, the Company entered into a series of agreements related to the asset purchase agreement with Nova Biosource Fuels, Inc. In September 2009, the United States Bankruptcy Court for the District of Delaware entered an order authorizing the sale of assets by Nova Biofuels Seneca, LLC
F-32
Table of Contents
Renewable Energy Group, Inc. and Subsidiaries
NOTES TO THE CONSOLIDATED FINANCIAL STATEMENTS — (Continued)
For the three years ended December 31, 2010, 2009 and 2008
(In thousands, except share and per share amounts)
(Nova Seneca) and Nova Biosource Technologies, LLC, (Nova Technologies), to a wholly owned subsidiary of Biofuels, pursuant to terms of an Asset Purchase Agreement, dated as of September 23, 2009 (the Nova Asset Purchase Agreement). The assets of Nova Seneca and Nova Technologies (the Seneca Assets), including the 60 mmgy biodiesel facility located in Seneca, Illinois (Seneca Facility) was acquired from Chapter 11 debtors in possession initially by the Company and immediately thereafter was sold to an entity named Seneca Landlord, LLC (Landlord) which is indirectly owned by three significant stockholders of the Company or their affiliates: Bunge North America, Inc., USRG Holdco V, LLC and West Central Cooperative. These stockholder parties facilitated the transactions described above by, among other things, creating Landlord, agreeing to invest $4,000 for repairs to the Seneca Facility and in consideration therefore received guarantees of certain payments and other obligations from the Company described below.
REG Seneca and Landlord entered into a Lease Agreement that governs REG Seneca’s lease of the Seneca Facility from Landlord. The Lease has a term of 7 years on a net lease basis covering the debt service on $36,250 of mortgage indebtedness against the Seneca Facility, as well as taxes, utilities, maintenance and other operating expenses.
REG Seneca will pay Landlord a $600 per year fee (Fee), payable $150 per quarter, which is guaranteed by the Company. During the term of the lease, Seneca Holdco has a put option to the Company of the Landlord equity interests after one year, April 8, 2011, provided the Company has a minimum excess net working capital (as defined) of 1.5 times the put/call price. During this time, the Company also has a call option of the Landlord equity interests. The put/call price is the greater of three times the initial investment or an amount yielding a 35% internal rate of return. If the put/call is exercised within three years, the Fee and distributions in the first three years are credited to the put/call price. At the time the put or call is exercised, the Company will issue 150,000 shares of Common Stock to Seneca Holdco.
The Company determined that the Seneca Assets do not constitute a business as defined under ASC Topic 805 on the basis that the Seneca Assets are not an integrated set of activities or assets that are capable of being conducted or managed in a manner that would provide any economic benefit or return to the Company. As a result, the Company accounted for the purchase of the Seneca Assets as an asset acquisition. Neither goodwill nor a gain from a bargain purchase was recognized in conjunction with the acquisition, and no significant contingent assets or liabilities were acquired or assumed in the acquisition.
See “Note 7—Variable Interest Entities” for information on the accounting of the aforementioned transaction.
Tellurian Biodiesel, Inc. and American BDF, LLC
On July 16, 2010, the Company issued 598,295 shares and up to an additional 731,250 shares of Common Stock for certain assets of Tellurian and ABDF. Tellurian was a California-based biodiesel company and marketer. ABDF was a joint venture owned by Golden State Service Industries, RTI and Tellurian and had previously focused on building a national array of small biodiesel plants that would convert used cooking oil into high quality, sustainable biodiesel. The purchase connects RTI’s national used cooking oil collection system, with more than 16,000 installations, with the Company’s national network of biodiesel manufacturing facilities. The fair value of the Common Stock issued as consideration, of $3,027, was allocated to a supply agreement intangible asset. The fair value of any additional shares of Common Stock issued will be allocated to a supply agreement intangible asset
F-33
Table of Contents
Renewable Energy Group, Inc. and Subsidiaries
NOTES TO THE CONSOLIDATED FINANCIAL STATEMENTS — (Continued)
For the three years ended December 31, 2010, 2009 and 2008
(In thousands, except share and per share amounts)
as additional shares are earned by ABDF upon the Company’s purchase of certain volumes of used cooking oil in proportion to annual targeted amounts in accordance with the supply agreement. Amounts allocated to the supply agreement intangible asset will be amortized over the term of the supply agreement.
Clovis Biodiesel, LLC
On September 21, 2010, REG Clovis, LLC, a wholly owned subsidiary of the Company, acquired substantially all assets of Clovis Biodiesel, LLC, a wholly owned subsidiary of the ARES Corporation. At closing, the Company delivered to ARES Corporation 2,150,000 shares of Common Stock in exchange for the assets of Clovis and $8,000 cash.
The Company determined that the Clovis assets do not constitute a business as defined under ASC Topic 805 on the basis that the Clovis assets are not an integrated set of activities or assets that are capable of being conducted or managed in a manner that would provide any economic benefit or return to the Company. As a result, the Company accounted for the purchase of the Clovis assets as an asset acquisition. Neither goodwill nor a gain from a bargain purchase was recognized in conjunction with the acquisition, and no significant contingent assets or liabilities were acquired or assumed in the acquisition.
The following table summarizes the final allocation of the purchase price to the fair values of the assets acquired and liabilities assumed at the date of acquisition:
| Final allocation at September 21, 2010 |
||||
| Assets acquired: |
||||
| Cash |
$ | 8,000 | ||
| Property, plant and equipment |
2,191 | |||
|
|
|
|||
| Fair value of common stock issued |
$ | 10,191 | ||
|
|
|
|||
The final acquisition price is summarized as follows:
| Final value at September 21, 2010 | ||||||||
| Fair value | Fair value per share |
|||||||
| Fair value of stock issued: |
||||||||
| Common Stock |
$ | 10,191 | $ | 4.74 | ||||
Note 7—Variable Interest Entities
In June 2009, the FASB amended its guidance on accounting for VIEs through the issuance of ASU No. 2009-17. The new accounting guidance resulted in a change in our accounting policy effective January 1, 2010. Among other things, the new guidance requires a qualitative analysis to determine the PB of a VIE, requires continuous assessments of whether an enterprise is the PB of a VIE and amends certain guidance for determining whether an entity is a VIE. Under the new guidance, a VIE must be consolidated if the enterprise has both (a) the power to direct the activities of the VIE that most significantly impact the entity’s economic performance and (b) the obligation to absorb losses or the right to receive benefits from the VIE that could potentially be significant to the VIE. This new accounting guidance was effective for the Company on January 1, 2010 and was applied prospectively.
F-34
Table of Contents
Renewable Energy Group, Inc. and Subsidiaries
NOTES TO THE CONSOLIDATED FINANCIAL STATEMENTS — (Continued)
For the three years ended December 31, 2010, 2009 and 2008
(In thousands, except share and per share amounts)
On January 1, 2010, the Company deconsolidated Blackhawk after performing a reassessment under this new guidance. Blackhawk had previously been consolidated due to the variable interests held by the Company. Variable interests in Blackhawk held by the Company as of January 1, 2010 included a subordinated convertible note, membership units, guaranty of indebtedness of up to $1,500, warrants and the MOSA. Although these financial arrangements resulted in the Company holding substantial variable interests in Blackhawk, they did not empower the Company to direct the activities that most significantly impact Blackhawk’s economic performance. Consequently, subsequent to this change in accounting policy, the Company deconsolidated Blackhawk.
The Company accounted for its interests in Blackhawk using the fair value options available under ASC Topic 825, Financial Instruments, from the date of deconsolidation on January 1, 2010 until the date of merger on February 26, 2010. The following table represents the deconsolidating entries as of January 1, 2010:
| As reported January 1, 2010 |
Adjustment | As adopted | ||||||||||
| ASSETS | ||||||||||||
| Current assets: |
||||||||||||
| Cash |
$ | 5,855 | $ | (206 | ) | $ | 5,649 | |||||
| Restricted cash |
2,156 | (2,002 | ) | 154 | ||||||||
| Current assets |
29,691 | 1,098 | 30,789 | |||||||||
|
|
|
|
|
|
|
|||||||
| Total current assets |
37,702 | (1,110 | ) | 36,592 | ||||||||
|
|
|
|
|
|
|
|||||||
| Property, plant and equipment, net |
124,429 | (43,209 | ) | 81,220 | ||||||||
| Goodwill |
16,080 | — | 16,080 | |||||||||
| Noncurrent assets |
22,347 | 27,731 | 50,078 | |||||||||
|
|
|
|
|
|
|
|||||||
| Total assets |
$ | 200,558 | $ | (16,588 | ) | $ | 183,970 | |||||
|
|
|
|
|
|
|
|||||||
| LIABILITIES AND EQUITY (DEFICIT) | ||||||||||||
| Current liabilities: |
||||||||||||
| Revolving line of credit |
$ | 350 | $ | (350 | ) | $ | — | |||||
| Current maturities of notes payable |
2,756 | (815 | ) | 1,941 | ||||||||
| Current liabilities |
23,810 | (1,144 | ) | 22,666 | ||||||||
|
|
|
|
|
|
|
|||||||
| Total current liabilities |
26,916 | (2,309 | ) | 24,607 | ||||||||
| Notes payable |
25,749 | (23,630 | ) | 2,119 | ||||||||
| Other liabilities |
25,902 | (8,516 | ) | 17,386 | ||||||||
|
|
|
|
|
|
|
|||||||
| Total liabilities |
78,567 | (34,455 | ) | 44,112 | ||||||||
|
|
|
|
|
|
|
|||||||
| Redeemable preferred stock |
149,122 | — | 149,122 | |||||||||
| Equity (deficit): |
||||||||||||
| Company stockholders’ equity (deficit): |
||||||||||||
| Common stock |
2 | — | 2 | |||||||||
| Common stock—additional paid-in-capital |
15,676 | 1,192 | 16,868 | |||||||||
| Warrants—additional paid-in-capital |
4,619 | — | 4,619 | |||||||||
| Retained earnings (accumulated deficit) |
(60,905 | ) | 30,152 | (30,753 | ) | |||||||
|
|
|
|
|
|
|
|||||||
| Total stockholders’ equity (deficit) |
(40,608 | ) | 31,344 | (9,264 | ) | |||||||
| Noncontrolling interests |
13,477 | (13,477 | ) | — | ||||||||
|
|
|
|
|
|
|
|||||||
| Total equity (deficit) |
(27,131 | ) | 17,867 | (9,264 | ) | |||||||
|
|
|
|
|
|
|
|||||||
| Total liabilities and equity (deficit) |
$ | 200,558 | $ | (16,588 | ) | $ | 183,970 | |||||
|
|
|
|
|
|
|
|||||||
F-35
Table of Contents
Renewable Energy Group, Inc. and Subsidiaries
NOTES TO THE CONSOLIDATED FINANCIAL STATEMENTS — (Continued)
For the three years ended December 31, 2010, 2009 and 2008
(In thousands, except share and per share amounts)
The Company has invested in four network plants owned by independent investment groups. Those companies are SoyMor Biodiesel, LLC (SoyMor), Western Iowa Energy, LLC (WIE), Western Dubuque Biodiesel, LLC (WDB) and East Fork Biodiesel, LLC (EFB). See “Note 11—Investments” for the investment amounts and the related condensed financial information of these investments. The Company evaluated each investment and determined we do not hold an interest in any of our investments in network plants that would give us the power to direct the activities that most significantly impact the economic performance of the network plant. As a result, the Company is not the PB and does not consolidate these VIE’s.
The Company has 50% ownership in 416 S. Bell, a joint venture where control is equally shared. The Company determined that neither partner in the joint venture has the power to direct the activities that most significantly impact the economic performance of the joint venture individually. As a result, the Company is not the PB and does not consolidate this VIE.
The carrying values and maximum exposure for all unconsolidated VIE’s as of December 31, 2010 are as follows:
| Investments | Maximum exposure |
|||||||
| Investment: |
||||||||
| SoyMor |
$ | 1,107 | $ | 1,119 | ||||
| WIE |
576 | 576 | ||||||
| WDB |
2,005 | 2,005 | ||||||
| 416 S Bell |
571 | 2,949 | ||||||
|
|
|
|
|
|||||
| $ | 4,259 | $ | 6,649 | |||||
|
|
|
|
|
|||||
On April 8, 2010, the Company determined that Landlord was a VIE and was consolidated into the Company’s financial statements as it is the PB. See “Note 6—Acquisitions and Equity Transactions” for a description of the acquisition. The Company has a put/call option with Seneca Holdco to purchase Landlord and currently leases the plant for production of biodiesel, both of which represent a variable interest in Landlord that are significant to the VIE. Although the Company does not have an ownership interest in Seneca Holdco, it was determined that the Company is the PB due to the related party nature of the entities involved, the Company’s ability to direct the activities that most significantly impact Landlord’s economic performance and the design of Landlord that ultimately gives the Company the majority of the benefit from the use of Seneca’s assets. The Company has elected the fair value option available under ASC Topic 825 on the $4,000 investment made by Seneca Holdco and the associated put and call options (the Seneca Holdco Liability). Changes in the fair value after the date of the transaction are recorded in earnings. Those assets are owned by, and those liabilities are obligations of, Landlord, not the Company.
F-36
Table of Contents
Renewable Energy Group, Inc. and Subsidiaries
NOTES TO THE CONSOLIDATED FINANCIAL STATEMENTS — (Continued)
For the three years ended December 31, 2010, 2009 and 2008
(In thousands, except share and per share amounts)
As of December 31, 2010, the Company has finalized the allocation of fair value in the Seneca transaction to the assets acquired and liabilities assumed. There was no change in valuation between the preliminary and final allocation. The following table summarizes the allocation of the purchase price to the fair values of the assets and liabilities recorded by the Company as a result of the transaction and subsequent consolidation of Landlord:
| Final allocation at April 8, 2010 |
||||
| Assets (liabilities) acquired: |
||||
| Restricted cash |
$ | 4,000 | ||
| Property, plant and equipment |
39,314 | |||
| Current liabilities |
(400 | ) | ||
| Seneca Holdco liability |
(6,664 | ) | ||
| Notes payable |
(36,250 | ) | ||
|
|
|
|||
| Fair value of consideration |
$ | — | ||
|
|
|
|||
Note 8—Inventories
Inventories consist of the following at December 31:
| 2010 | 2009 | |||||||
| Raw materials |
$ | 7,297 | $ | 743 | ||||
| Work in process |
281 | 22 | ||||||
| Finished goods |
21,407 | 12,075 | ||||||
|
|
|
|
|
|||||
| Total |
$ | 28,985 | $ | 12,840 | ||||
|
|
|
|
|
|||||
Note 9—Property, Plant and Equipment
Company owned property, plant and equipment consists of the following at December 31:
| 2010 | 2009 | |||||||
| Land |
$ | 704 | $ | — | ||||
| Building and improvements |
21,834 | 12,122 | ||||||
| Leasehold improvements |
6,556 | 4,932 | ||||||
| Machinery and equipment |
82,007 | 51,801 | ||||||
|
|
|
|
|
|||||
| 111,101 | 68,855 | |||||||
| Accumulated depreciation |
(12,647 | ) | (10,488 | ) | ||||
|
|
|
|
|
|||||
| 98,454 | 58,367 | |||||||
| Construction in process |
67,937 | 66,062 | ||||||
|
|
|
|
|
|||||
| Total |
$ | 166,391 | $ | 124,429 | ||||
|
|
|
|
|
|||||
F-37
Table of Contents
Renewable Energy Group, Inc. and Subsidiaries
NOTES TO THE CONSOLIDATED FINANCIAL STATEMENTS — (Continued)
For the three years ended December 31, 2010, 2009 and 2008
(In thousands, except share and per share amounts)
Seneca Landlord property, plant and equipment consists of the following at December 31:
| 2010 | 2009 | |||||||
| Building and improvements |
$ | 18,445 | $ | — | ||||
| Leasehold improvements |
6 | — | ||||||
| Machinery and equipment |
24,824 | — | ||||||
|
|
|
|
|
|||||
| 43,275 | — | |||||||
| Accumulated depreciation |
(723 | ) | — | |||||
|
|
|
|
|
|||||
| 42,552 | — | |||||||
| Construction in process |
140 | — | ||||||
|
|
|
|
|
|||||
| Total |
$ | 42,692 | $ | — | ||||
|
|
|
|
|
|||||
Note 10—Intangible Assets
Intangible assets consist of the following at December 31:
| 2010 | 2009 | |||||||
| Raw material supply agreement intangibles |
$ | 3,027 | $ | 7,025 | ||||
| Ground lease |
200 | 200 | ||||||
| Accumulated amortization |
(58 | ) | (22 | ) | ||||
|
|
|
|
|
|||||
| Total intangible assets |
$ | 3,169 | $ | 7,203 | ||||
|
|
|
|
|
|||||
The raw material supply agreement acquired during 2010 (see “Note 6—Acquisitions and Equity Transactions”) is amortized over its 15 year term based on actual usage under the agreement. The Company determined the estimated amount of raw materials to be purchased over the life of the agreement to calculate a per pound rate of consumption. The rate is then multiplied by the actual usage each period for expense reporting purposes. As discussed in Note 2—Summary of Significant Accounting Policies, the raw material supply agreement intangible recorded as of December 31, 2009 was charged off during 2010.
Amortization expense of $36, $22 and $0 for intangible assets is include in cost of goods—biodiesel in the statement of operations for the years ended December 31, 2010, 2009 and 2008, respectively.
Estimated amortization expense for fiscal years ended December 31 is as follows:
| 2011 |
$ | 125 | ||
| 2012 |
125 | |||
| 2013 |
173 | |||
| 2014 |
181 | |||
| 2015 |
189 | |||
| Thereafter |
2,376 | |||
|
|
|
|||
| Total |
$ | 3,169 | ||
|
|
|
F-38
Table of Contents
Renewable Energy Group, Inc. and Subsidiaries
NOTES TO THE CONSOLIDATED FINANCIAL STATEMENTS — (Continued)
For the three years ended December 31, 2010, 2009 and 2008
(In thousands, except share and per share amounts)
Note 11—Investments
Investments consist of the following at December 31:
| 2010 | 2009 | |||||||||||||||
| Ownership | Balance | Ownership | Balance | |||||||||||||
| Investment and accumulated earnings in: |
||||||||||||||||
| SoyMor |
9 | % | $ | 1,107 | 9 | % | $ | 1,354 | ||||||||
| WIE (a) |
2 | % | 576 | 2 | % | 602 | ||||||||||
| WDB (b) |
8 | % | 2,005 | 8 | % | 2,195 | ||||||||||
| 416 S Bell |
50 | % | 571 | 50 | % | 598 | ||||||||||
| CIE (c) |
— | 4 | % | 1,000 | ||||||||||||
| EFB (d) |
— | 4 | % | 400 | ||||||||||||
|
|
|
|
|
|||||||||||||
| Total (e) |
$ | 4,259 | $ | 6,149 | ||||||||||||
|
|
|
|
|
|||||||||||||
| (a) | As of May 2010, the accounting method for this investment changed from the equity method to the cost method due to the Company no longer having the ability to significantly influence the operations of WIE, since at that time the Company no longer managed that facility and no employee of the Company held a position on the WIE Board of Directors. |
| (b) | As of August 2010, the accounting method for this investment was changed from the equity method to the cost method due to the Company no longer having the ability to significantly influence the operations of WDB, since at that time the Company no longer managed that facility. |
| (c) | During the first quarter of 2010, the Company purchased Central Iowa Energy LLC (See Note 6—Acquisitions and Equity Transactions). Through the purchase price allocation, the Company eliminated its investment in Central Iowa Energy. |
| (d) | As of June 2010, the Company impaired the remaining investment amount of $400. On December 28, 2010, East Fork Biodiesel (EFB) filed its Articles of Dissolution with the Iowa Secretary of State. |
| (e) | The investments include deferred tax assets of $942 and $677 as of December 31, 2010 and 2009, respectively, fully offset by a valuation allowance. |
The condensed financial information of equity method investments as of and for the years ended December 31, is as follows:
| 2010 | 2009 | |||||||||||
| Condensed balance sheet: |
||||||||||||
| Total current assets |
$ | 352 | $ | 15,530 | ||||||||
|
|
|
|
|
|||||||||
| Total noncurrent assets |
$ | 23,407 | $ | 90,846 | ||||||||
|
|
|
|
|
|||||||||
| Total current liabilities |
$ | 585 | $ | 31,260 | ||||||||
|
|
|
|
|
|||||||||
| Total noncurrent liabilities |
$ | 5,270 | $ | 9,303 | ||||||||
|
|
|
|
|
|||||||||
| 2010 | 2009 | 2008 | ||||||||||
| Condensed statement of operations: |
||||||||||||
| Sales |
$ | 6,895 | $ | 74,164 | $ | 144,734 | ||||||
| Costs of goods sold |
(5,970 | ) | (70,859 | ) | (139,515 | ) | ||||||
| Operating and other expenses |
(6,838 | ) | (6,551 | ) | (10,753 | ) | ||||||
|
|
|
|
|
|
|
|||||||
| Net loss |
$ | (5,913 | ) | $ | (3,246 | ) | $ | (5,534 | ) | |||
|
|
|
|
|
|
|
|||||||
F-39
Table of Contents
Renewable Energy Group, Inc. and Subsidiaries
NOTES TO THE CONSOLIDATED FINANCIAL STATEMENTS — (Continued)
For the three years ended December 31, 2010, 2009 and 2008
(In thousands, except share and per share amounts)
Note 12—Other Assets
Prepaid expense and other current assets consist of the following at December 31:
| 2010 | 2009 | |||||||
| Income taxes receivable |
$ | — | $ | 553 | ||||
| Commodity derivatives and related collateral, net |
1,636 | 1,774 | ||||||
| Prepaid insurance |
1,088 | 1,105 | ||||||
| Prepaid service contracts |
215 | 272 | ||||||
| Prepaid raw materials |
— | 325 | ||||||
| Deposits |
306 | — | ||||||
| Network Plant notes receivable(a) |
— | 483 | ||||||
| Other |
688 | 177 | ||||||
|
|
|
|
|
|||||
| Total |
$ | 3,933 | $ | 4,689 | ||||
|
|
|
|
|
|||||
| a) | The Company has certain arrangements with the Network Plants that require funds to be remitted to the Network Plant upon sale of product to the end customer before amounts have been collected by the Company. In exchange, the Network Plant agrees to pay the Company a fee equal to 50 basis points in excess of the Company’s cost of working capital as computed from time to time. |
Other noncurrent assets consist of the following at December 31:
| 2010 | 2009 | |||||||
| Debt issuance costs (net of accumulated amortization of $1,381 in 2010 and $318 in 2009) |
$ | 2,790 | $ | 1,420 | ||||
| Spare parts inventory |
4,498 | 4,726 | ||||||
| Prepaid taxes |
— | 412 | ||||||
| Other |
533 | 937 | ||||||
|
|
|
|
|
|||||
| Total |
$ | 7,821 | $ | 7,495 | ||||
|
|
|
|
|
|||||
Note 13—Accrued Expenses and Other Liabilities
Accrued expenses and other liabilities consist of the following at December 31:
| 2010 | 2009 | |||||||
| Accrued property taxes |
$ | 916 | $ | 792 | ||||
| Accrued employee compensation |
987 | 858 | ||||||
| Accrued interest |
249 | 193 | ||||||
| Unfavorable lease obligation, current portion |
1,129 | 1,829 | ||||||
| Other |
268 | 525 | ||||||
|
|
|
|
|
|||||
| Total |
$ | 3,549 | $ | 4,197 | ||||
|
|
|
|
|
|||||
F-40
Table of Contents
Renewable Energy Group, Inc. and Subsidiaries
NOTES TO THE CONSOLIDATED FINANCIAL STATEMENTS — (Continued)
For the three years ended December 31, 2010, 2009 and 2008
(In thousands, except share and per share amounts)
Other noncurrent liabilities consist of the following at December 31:
| 2010 | 2009 | |||||||
| Fair value of interest rate swap |
$ | 612 | $ | 1,031 | ||||
| Liability for unrecognized tax benefits |
1,500 | 1,500 | ||||||
| Deferred grant revenue |
745 | — | ||||||
| Straight-line lease liability |
2,524 | — | ||||||
| Deferred credit related to investment in Blackhawk |
— | 7,484 | ||||||
|
|
|
|
|
|||||
| Total |
$ | 5,381 | $ | 10,015 | ||||
|
|
|
|
|
|||||
As a result of the merger with Blackhawk on February 26, 2010, the Company recognized a deferred tax asset and an associated deferred credit related to excess taxable basis over book basis on its investment in Blackhawk. The Company reflected the related amounts on its consolidated balance sheet as of December 31, 2009 as the acquisition represented a recognizable subsequent event that will reverse in the foreseeable future. The deferred credit was reversed through retained earnings (accumulated deficit) on January 1, 2010 upon adoption of ASU 2009-17 resulting in the deconsolidation of Blackhawk.
In connection with the acquisition of U.S. Biodiesel Group on June 26, 2008, the Company assumed a ground lease associated with its terminal facility in Houston, Texas. The terms of the lease require the Company to pay above market rentals through the remainder of the lease term expiring in 2021. The Company has recorded an intangible liability for this arrangement that will be amortized as an adjustment to lease expense over the remaining lease term.
The unfavorable lease obligation consists of the following:
| 2010 | 2009 | |||||||
| Unfavorable lease obligation |
$ | 13,612 | $ | 13,612 | ||||
| Accumulated amortization |
(1,190 | ) | — | |||||
|
|
|
|
|
|||||
| Total unfavorable lease obligation |
12,422 | 13,612 | ||||||
| Current portion |
(1,129 | ) | (1,829 | ) | ||||
|
|
|
|
|
|||||
| $ | 11,293 | $ | 11,783 | |||||
|
|
|
|
|
|||||
The unfavorable lease obligation is amortized over the contractual period the Company is required to make rental payments under the lease.
An amortization benefit of $1,190 and $0 for the years ended December 31, 2010 and 2009, respectively, for noncurrent liabilities is included in the cost of biodiesel sales.
F-41
Table of Contents
Renewable Energy Group, Inc. and Subsidiaries
NOTES TO THE CONSOLIDATED FINANCIAL STATEMENTS — (Continued)
For the three years ended December 31, 2010, 2009 and 2008
(In thousands, except share and per share amounts)
Estimated amortization benefit for the fiscal years ending December 31 is as follows:
| 2011 |
$ | 1,129 | ||
| 2012 |
1,129 | |||
| 2013 |
1,129 | |||
| 2014 |
1,129 | |||
| 2015 |
1,129 | |||
| Thereafter |
6,777 | |||
|
|
|
|||
| $ | 12,422 | |||
|
|
|
On May 1, 2010, the Company amended its lease of a terminal facility in Houston, Texas. The amended agreement is through December 2021 and changes the monthly lease payment. For the year ending December 31, 2010, the fixed payment is reduced from $515 to $165. For the year ending December 31, 2011, the fixed monthly lease payment will increase on a quarterly basis throughout the year resulting in monthly lease payments of $215, $275, $350 and $450. From January 1, 2012, and continuing thereafter, the monthly lease payment will be $515, subject to escalation, on an annual basis, utilizing the producer price index. Due to the scheduled increase in lease payments over the life of the lease, the Company is recording a straight-line lease liability related to the monthly payments pursuant to ASC Topic 840, Leases. The straight-line lease liability is recorded in other liabilities on the consolidated balance sheet.
Note 14—Borrowings
The Company’s borrowings are as follows:
| 2010 | 2009 | |||||||
| REG Danville term loan |
$ | 23,634 | $ | 24,445 | ||||
| REG Newton term loan |
23,611 | — | ||||||
| Revenue bond |
2,030 | 2,360 | ||||||
| Other |
1,050 | 1,700 | ||||||
|
|
|
|
|
|||||
| Total Notes Payable |
$ | 50,325 | $ | 28,505 | ||||
|
|
|
|
|
|||||
| Seneca Landlord term loan |
$ | 36,250 | $ | — | ||||
|
|
|
|
|
|||||
On February 26, 2010, in connection with the Blackhawk Merger, one of the Company’s subsidiaries, REG Danville, assumed a $24,600 term loan. The term loan matures November 2011. The Illinois Finance Authority guarantees 61% of the term loan and the remaining amount is secured by the Danville facility. The term loan bears interest at a fluctuating rate per annum equal to the LIBOR rate plus the applicable margin of 400 basis points through December 31, 2010 and 2009 (effective rate at December 31, 2010 and 2009 was 4.26% and 4.23%, respectively). Amounts outstanding on the term loan were $23,634 and $24,445 as of December 31, 2010 and 2009, respectively. Until June 30, 2010, REG Danville was required to make only monthly payments of accrued interest. Beginning on July 1, 2010, REG Danville is required to make monthly principal payments equal to $135 plus accrued interest. In addition to these monthly payments, as the result of an amendment to the loan agreement, REG Danville is required to make annual principal payments equal to 50% of REG Danville’s Excess Cash Flow, or the 50% Excess Payment, with respect to each fiscal year until $2,500 has been paid from the Excess Cash Flow. Excess Cash Flow is equal to EBITDA less certain cash payments made during the
F-42
Table of Contents
Renewable Energy Group, Inc. and Subsidiaries
NOTES TO THE CONSOLIDATED FINANCIAL STATEMENTS — (Continued)
For the three years ended December 31, 2010, 2009 and 2008
(In thousands, except share and per share amounts)
period including principal payments, lease payments, interest payments, tax payments, approved distributions and capital expenditures. Excess Cash Flow is measured annually; therefore, no amounts have yet been paid. Thereafter, REG Danville is required to make annual payments equal to 25% of its Excess Cash Flow. The entire outstanding balance on the loan is included in current liabilities because the loan matures in November 2011.
REG Danville also had a revolving line-of-credit with a borrowing capacity of $190 which expired on November 30, 2010. The revolving line of credit accrues interest at the prime rate plus 25 basis points or the 30-day LIBOR plus 300 basis points as determined at the election of REG Danville at the time of borrowing and is secured by all plant assets owned by REG Danville. Borrowings outstanding under the line-of-credit were $0 and $350 as of December 31, 2010 and 2009, respectively.
In March 2010, as part of the CIE Asset Purchase, REG Newton assumed the term debt of CIE and refinanced the term debt (AgStar Loan). Amounts outstanding as of December 31, 2010 of $23,611 require interest to be accrued based on 30-day LIBOR or 2.00%, whichever is higher, plus 300 basis points (effective rate at December 31, 2010 was 5.00%). The debt is secured by all plant assets owned by REG Newton. The Company has a limited guarantee related to the obligations under the AgStar Loan, which provides that the company will not be liable for more than the unpaid interest on the AgStar Loan that has accrued during an 18-month period beginning on March 8, 2010. REG Newton is required to make interest only payments on a monthly basis through February 2011. Beginning in March 2011, REG Newton will be required to make reduced principal payments of $60 plus interest through September 2011. Beginning in October 2011, REG Newton will be required to make principal payments of $120 plus interest until the maturity date of March 8, 2013. Beginning on January 1, 2011, under the AgStar Loan, REG Newton is required to maintain a debt service reserve account (Debt Reserve) equal to 12-monthly payments of principal and interest on the AgStar Loan. At each fiscal year end thereafter until such time as the balance in the Debt Reserve contains the required 12-months of payments, REG Newton must deposit an amount equal to its Excess Cash Flow. The AgStar Loan agreement defines Excess Cash Flow as EBITDA, less the sum of required debt payments, interest expense, any increase in working capital from the prior year until working capital exceeds $6,000, up to $500 in maintenance capital expenditure, allowed distributions and payments to fund the Debt Reserve. Also beginning on January 1, 2011, provided that REG Newton is in compliance with the working capital ratios and the Debt Reserve is funded, REG Newton must make an annual payment equal to 50% of its Excess Cash Flow calculated based upon the prior year’s audited financial statements within 120 days of the fiscal year end.
In March 2010, REG Newton obtained a revolving line-of-credit (AgStar Line) with an aggregate borrowing capacity of $2,350 which expired on March 7, 2011. The debt is secured by REG Newton’s account receivable and inventory. The Company has guaranteed the obligations under the AgStar Line. The revolving line of credit accrues interest at 30-day LIBOR or 2.00%, whichever is higher, plus 300 basis points (effective rate at December 31, 2010 was 5.00%). Borrowings outstanding under the line-of-credit were $550 as of December 31, 2010.
On April 9, 2010, Landlord entered into a note payable agreement with West LB. The balance of the note as of December 31, 2010 is $36,250. The note requires that interest be accrued at different rates based on whether it is a Base Rate Loan or Eurodollar Loan at either 2.0% over the higher of 50 basis points above the Federal Funds Effective Rate or the WestLB prime rate for Base Rate Loans or 3.0%
F-43
Table of Contents
Renewable Energy Group, Inc. and Subsidiaries
NOTES TO THE CONSOLIDATED FINANCIAL STATEMENTS — (Continued)
For the three years ended December 31, 2010, 2009 and 2008
(In thousands, except share and per share amounts)
over adjusted LIBOR for Eurodollar Loans. The loan was a Eurodollar Loan through December 31, 2010 (effective rate at December 31, 2010 was 3.26%). Interest is paid monthly. Principal payments have been deferred until April 2012. At that time, Landlord will be required to make estimated monthly principal payments of $201 with remaining unpaid principal due at maturity on April 8, 2017. The note payable is secured by the property located at the Seneca location.
On April 9, 2010, REG Marketing & Logistics Group, LLC and REG Services, together with the Company as guarantor, (the WestLB Loan Parties) entered into a Revolving Credit Agreement (WestLB Revolver) with WestLB AG (WestLB). The initial available credit amount under the WestLB Revolver is $10,000 with additional lender increases up to a maximum commitment of $18,000. Advances under the WestLB Revolver are limited to the amount of certain qualifying assets of the WestLB Loan Parties that secure amounts borrowed. The WestLB Revolver requires the WestLB Loan Parties to maintain compliance with certain financial covenants. The term of the WestLB Revolver is two years. The interest rate varies depending on the loan type designation and is either 2.0% over the higher of 50 basis points above the Federal Funds Effective Rate or the WestLB prime rate for base rate loans or 3.0% over adjusted LIBOR for Eurodollar loans (effective rate at December 31, 2010 was 3.26%). The WestLB Revolver is secured by assets and ownership interests of REG Marketing and REG Services. Borrowings outstanding under the line-of-credit were $9,000 as of December 31, 2010.
The credit agreements of the subsidiaries mentioned above contain various customary affirmative and negative covenants. Many of the agreements, but not all, also contain certain financial covenants, including a current ratio, net worth ratio, fixed charge coverage ratio, maximum funded debt to earnings before interest depreciation and amortization ratio and a maximum capital expenditure limitation. Negative covenants include restrictions on incurring certain liens; making certain payments, such as distributions and dividend payments; making certain investments; transferring or selling assets; making certain acquisitions; and incurring additional indebtedness. The agreements generally provide that the payment of obligations may be accelerated upon the occurrence of customary events of default, including, but not limited to, non-payment, change of control, or insolvency.
The Company was in compliance with all restrictive financial covenants associated with its borrowings as of December 31, 2010 with the exception to the REG Danville bank debt. REG Danville received a waiver from the bank that cured the financial covenants noncompliance on the bank debt as of December 31, 2010. We expect that REG Danville will not be in compliance as of March 31, 2011, which will require us to obtain another waiver.
Maturities of the borrowings are as follows for the years ending December 31:
| 2011 |
$ | 25,551 | ||
| 2012 |
3,740 | |||
| 2013 |
24,234 | |||
| 2014 |
2,766 | |||
| 2015 |
2,757 | |||
| Thereafter |
27,527 | |||
|
|
|
|||
| Total |
86,575 | |||
| Less: current portion |
(25,551 | ) | ||
|
|
|
|||
| $ | 61,024 | |||
|
|
|
F-44
Table of Contents
Renewable Energy Group, Inc. and Subsidiaries
NOTES TO THE CONSOLIDATED FINANCIAL STATEMENTS — (Continued)
For the three years ended December 31, 2010, 2009 and 2008
(In thousands, except share and per share amounts)
Note 15—Income Taxes
The tax effects of temporary differences that give rise to the Company’s deferred tax assets and liabilities at December 31 are as follows:
| 2010 | 2009 | |||||||||||||||
| Current | Noncurrent | Current | Noncurrent | |||||||||||||
| Deferred Tax Assets: |
||||||||||||||||
| Property, plant and equipment |
$ | — | $ | — | $ | — | $ | 4,932 | ||||||||
| Goodwill |
— | 14,028 | — | 15,720 | ||||||||||||
| Net operating loss carryforwards |
— | 24,029 | — | 12,057 | ||||||||||||
| Tax credit carryforwards |
— | 3,068 | — | 3,068 | ||||||||||||
| Alternative minimum tax carryforwards |
— | — | — | 211 | ||||||||||||
| Start-up costs |
— | 1,580 | — | — | ||||||||||||
| Stock-based compensation |
— | 1,725 | — | 5,332 | ||||||||||||
| Investment in Blackhawk |
— | — | — | 6,163 | ||||||||||||
| Seneca Holdco liability |
— | 4,014 | — | — | ||||||||||||
| Notes payable—Seneca Landlord, LLC |
— | 13,983 | — | — | ||||||||||||
| Deferred revenue |
3,599 | 287 | 2,192 | — | ||||||||||||
| Houston terminal lease |
— | 1,673 | — | 823 | ||||||||||||
| Other |
1,248 | 579 | 600 | 559 | ||||||||||||
|
|
|
|
|
|
|
|
|
|||||||||
| Deferred tax assets |
4,847 | 64,966 | 2,792 | 48,865 | ||||||||||||
| Deferred Tax Liabilities: |
||||||||||||||||
| Prepaid expenses |
(536 | ) | — | (534 | ) | — | ||||||||||
| Property, plant and equipment |
— | (10,022 | ) | — | — | |||||||||||
| Property, plant and equipment—Seneca Landlord, LLC |
— | (16,477 | ) | — | — | |||||||||||
| Deferred revenue cost of goods sold |
(3,450 | ) | — | (1,279 | ) | — | ||||||||||
| Other |
(67 | ) | (41 | ) | — | (141 | ) | |||||||||
|
|
|
|
|
|
|
|
|
|||||||||
| Deferred tax liabilities |
(4,053 | ) | (26,540 | ) | (1,813 | ) | (141 | ) | ||||||||
|
|
|
|
|
|
|
|
|
|||||||||
| Net deferred tax assets |
794 | 38,426 | 979 | 48,724 | ||||||||||||
| Valuation allowance |
(794 | ) | (36,926 | ) | (979 | ) | (47,224 | ) | ||||||||
|
|
|
|
|
|
|
|
|
|||||||||
| Net deferred taxes |
$ | — | $ | 1,500 | $ | — | $ | 1,500 | ||||||||
|
|
|
|
|
|
|
|
|
|||||||||
The Company reviews the carrying amount of its deferred tax assets to determine whether the establishment of a valuation allowance is necessary. If it is more-likely-than-not that all or a portion of the Company’s deferred tax assets will not be realized, based on all available evidence, a deferred tax valuation allowance would be established. Consideration is given to positive and negative evidence related to the realization of the deferred tax assets. Significant judgment is required in making this assessment.
In evaluating the available evidence, management considers, among other factors, historical financial performance, expectation of future earnings, length of statutory carry forward periods, experience with operating loss and tax credit carry forwards not expiring unused, tax planning strategies and time of
F-45
Table of Contents
Renewable Energy Group, Inc. and Subsidiaries
NOTES TO THE CONSOLIDATED FINANCIAL STATEMENTS — (Continued)
For the three years ended December 31, 2010, 2009 and 2008
(In thousands, except share and per share amounts)
reversals of temporary differences. In evaluating losses, management considers the nature, frequency and severity of losses in light of the conditions giving rise to those losses. As of December 31, 2010, management concluded that the book and tax losses that result in cumulative losses represent negative evidence. This evidence provides negative evidence that cannot be overcome by positive and objectively verifiable evidence. Based on this evaluation, management has concluded a valuation allowance was required for the entire amount of the Company’s net deferred tax assets since positive, objectively verifiable evidence was not available to prove that it was more-likely-that-not that the Company would be able to realize these assets.
If future results provide positive, objectively verifiable evidence, that evidence will be considered in determining whether some or all of the valuation allowance will be reversed.
Income tax benefit (expense) for the years ended December 31 is as follows:
| 2010 | 2009 | 2008 | ||||||||||
| Current income tax (expense) benefit |
||||||||||||
| Federal |
$ | — | $ | — | $ | 628 | ||||||
| State |
— | — | 518 | |||||||||
|
|
|
|
|
|
|
|||||||
| — | — | 1,146 | ||||||||||
| Deferred income tax (expense) benefit |
||||||||||||
| Federal |
(9,419 | ) | (3,267 | ) | (219 | ) | ||||||
| State |
(962 | ) | (467 | ) | (79 | ) | ||||||
| Net operating loss carryforwards |
11,972 | 7,041 | 8,566 | |||||||||
| Other |
(481 | ) | (316 | ) | — | |||||||
|
|
|
|
|
|
|
|||||||
| 1,110 | 2,991 | 8,268 | ||||||||||
|
|
|
|
|
|
|
|||||||
| Income tax benefit before valuation allowances |
1,110 | 2,991 | 9,414 | |||||||||
| Deferred tax valuation allowances |
2,142 | (48,203 | ) | — | ||||||||
|
|
|
|
|
|
|
|||||||
| Income tax benefit (expense) |
$ | 3,252 | $ | (45,212 | ) | $ | 9,414 | |||||
|
|
|
|
|
|
|
|||||||
Income tax expense attributable to operations differed from the expense computed using the federal statutory rate primarily as a result of the change in tax status of the Company from its predecessors, state income taxes, net of federal income tax effects, income or loss from the change in fair value of embedded conversion feature of preferred stock, incentive stock options and various tax credits available to the Company as a result of its manufacture and sale of biodiesel. A comparison of the statutory and effective income tax benefits and reasons for related differences follows:
| 2010 | 2009 | 2008 | ||||||||||
| U.S. Federal income tax benefit at a statutory rate of 35 percent |
$ | (8,452 | ) | $ | (7,895 | ) | $ | (8,853 | ) | |||
| Minority interest taxed at member level |
— | 3,177 | 976 | |||||||||
| State taxes, net of federal income tax benefit |
(863 | ) | (1,128 | ) | (981 | ) | ||||||
| (Gain)/loss on embedded derivative |
3,166 | 936 | (834 | ) | ||||||||
| Transaction costs |
386 | 1,210 | — | |||||||||
| Conversion of stock options to restricted stock units |
3,917 | — | — | |||||||||
| Other, net |
736 | 709 | 278 | |||||||||
|
|
|
|
|
|
|
|||||||
| Total benefits for income taxes before valuation allowances |
(1,110 | ) | (2,991 | ) | (9,414 | ) | ||||||
| Valuation allowances |
(2,142 | ) | 48,203 | — | ||||||||
|
|
|
|
|
|
|
|||||||
| Total (benefits) expenses for income taxes |
$ | (3,252 | ) | $ | 45,212 | $ | (9,414 | ) | ||||
|
|
|
|
|
|
|
|||||||
F-46
Table of Contents
Renewable Energy Group, Inc. and Subsidiaries
NOTES TO THE CONSOLIDATED FINANCIAL STATEMENTS — (Continued)
For the three years ended December 31, 2010, 2009 and 2008
(In thousands, except share and per share amounts)
In accordance with ASC Topic 740, Income Taxes, the Company periodically reviews its portfolio of uncertain tax positions. An uncertain tax position represents the Company’s expected treatment of a tax position taken in a filed tax return, or planned to be taken in a tax return not yet filed, that has not been reflected in measuring income tax expense for financial reporting purposes. The Company does not recognize income tax benefits associated with uncertain tax positions where it is determined that it is not more-likely-than-not, based on the technical merits, that the position will be sustained upon examination.
A reconciliation of the total amounts of unrecognized tax benefits at December 31 is as follows:
| 2010 | 2009 | 2008 | ||||||||||
| Beginning of year balance |
$ | 1,500 | $ | 1,500 | $ | — | ||||||
| Increases to tax positions expected to be taken |
— | — | 1,500 | |||||||||
| Increases to tax positions taken during prior years |
— | — | — | |||||||||
| Decreases to tax positions taken during prior years |
— | — | — | |||||||||
| Decreases due to lapse of statute of limitations |
— | — | — | |||||||||
|
|
|
|
|
|
|
|||||||
| End of year balance |
$ | 1,500 | $ | 1,500 | $ | 1,500 | ||||||
|
|
|
|
|
|
|
|||||||
The amount of unrecognized tax benefits at December 31, 2010, 2009 and 2008 that would affect the effective tax rate if the tax benefits were recognized was $1,028. The remaining liability was related to tax positions for which there is a related deferred tax asset. The Company does not believe it is reasonably possible that the amounts of unrecognized tax benefits will significantly increase or decrease over the next twelve months. Interest and penalties related to unrecognized tax benefits are recognized in income tax expense. The Company has not recorded any such amounts in the periods presented.
The Company files it’s tax returns according to the tax laws of the jurisdictions in which it operates, which includes the U.S. federal jurisdictions, and various state jurisdictions. The U.S. Internal Revenue Service has completed its examination of the Company’s federal income tax returns for all periods through 2008. Various state income tax returns also remain subject to examination by taxing authorities.
Note 16—Stock-based Compensation
Renewable Energy Group:
On July 31, 2006, the Biofuels Board approved the 2006 Stock Incentive Plan (the 2006 Plan). The 2006 Plan provides for 2,500,000 shares of Biofuels Common Stock to be available for option grants. Option grants are awarded at the discretion of the Board. Options expire ten years from the date of the grant. There are no performance conditions associated with the options.
The Biofuels Common Stock options are generally protected from anti-dilution via adjustments for any stock dividends, stock split, combination or other recapitalization.
On May 6, 2009, the Company’s Board approved the 2009 Stock Incentive Plan (the 2009 Plan). The 2009 Plan provides for 5,400,000 shares of Company Common Stock to be made issuable under the plan. Restricted stock or restricted stock units may be awarded under the plan at the discretion of the Board. Restricted stock units may not be sold, transferred, pledged, assigned, or otherwise alienated until
F-47
Table of Contents
Renewable Energy Group, Inc. and Subsidiaries
NOTES TO THE CONSOLIDATED FINANCIAL STATEMENTS — (Continued)
For the three years ended December 31, 2010, 2009 and 2008
(In thousands, except share and per share amounts)
the lapse of the period of restriction. The restrictions will lapse with respect to the restricted stock units upon vesting, at which point each restricted stock unit (RSU) will be immediately converted into one share of common stock. The restricted stock units have no conversion price.
In connection with a change of control, Biofuels, at its discretion, may cancel options in exchange for a payment per share in cash of an amount equal to the excess, if any, of the change of control price per share over the exercise price of the option. On August 18, 2010, the Biofuels Board cancelled the stock options held by company employees. This cancellation was concurrent with the issuance of the restricted stock units under the 2009 Plan. The remaining options held by non-employees were assumed by the Company and will remain outstanding under the 2009 Plan with the same conditions as under the 2006 Plan.
There were no newly issued stock options granted during 2009 or 2010. For purposes of determining the fair value of stock options awarded in 2008, the Company used a Black-Scholes option pricing model and the assumptions set forth in the table below:
| 2008 | ||
| Weighted average fair value of options granted (per option) |
$ 0.06 | |
| Dividend yield |
0% | |
| Range of risk-free interest rates |
2.94 - 4.96% | |
| Weighted average risk-fee interest rate |
4.78% | |
| Weighted average expected volatility |
88% | |
| Weighted average expected life in years |
5.6 | |
| Weighted average fair value of common stock |
$ 0.89 |
As provided for by ASC Topic 718, the Company applied the simplified method in estimating the average expected life of the options. The simplified method assumes that early exercise of the option will occur between the vesting date and expiration date of the option.
Because the Company’s stock is not publicly traded, the Company used the average historical volatility rate for publicly traded companies that are engaged in similar alternative fuel activities to those of the Company. In order to estimate the expected volatility as of the grant date, the Company used a simple average of the volatility for a similar time period as the expected life of the options and the current implied volatility of exchange traded options.
F-48
Table of Contents
Renewable Energy Group, Inc. and Subsidiaries
NOTES TO THE CONSOLIDATED FINANCIAL STATEMENTS — (Continued)
For the three years ended December 31, 2010, 2009 and 2008
(In thousands, except share and per share amounts)
The following table summarizes information about Common Stock options granted, exercised, forfeited, vested and exercisable:
| Amount of options |
Weighted average exercise price |
Weighted average contractual term |
||||||||||
| Options outstanding—January 1, 2008 |
2,303,052 | $ | 9.54 | 9.2 years | ||||||||
| Granted |
35,000 | $ | 10.25 | |||||||||
| Exercised |
— | |||||||||||
| Forfeited |
(53,500 | ) | $ | 9.78 | ||||||||
|
|
|
|||||||||||
| Options outstanding—December 31, 2008 |
2,284,552 | $ | 9.55 | 7.7 years | ||||||||
| Granted |
— | |||||||||||
| Exercised |
— | |||||||||||
| Forfeited |
(76,000 | ) | $ | 9.93 | ||||||||
|
|
|
|||||||||||
| Options outstanding—December 31, 2009 |
2,208,552 | $ | 9.54 | 6.8 years | ||||||||
| Granted |
— | |||||||||||
| Exercised |
— | |||||||||||
| Forfeited |
(30,500 | ) | $ | 9.50 | 7.1 years | |||||||
| Cancelled |
(1,959,236 | ) | $ | 9.55 | 6.5 years | |||||||
|
|
|
|||||||||||
| Options outstanding—December 31, 2010 |
218,816 | $ | 9.50 | 5.6 years | ||||||||
|
|
|
|||||||||||
| Options exercisable—December 31, 2010 |
218,816 | $ | 9.50 | 5.6 years | ||||||||
|
|
|
|||||||||||
The following table summarizes additional information about stock options as of December 31:
| 2010 | 2009 | 2008 | ||||||||||
| Estimated unrecognized compensation cost for nonvested options |
$ | — | $ | 144 | $ | 1,989 | ||||||
| Weighted average term the expense will be recognized |
0.0 years | 0.7 years | 0.9 years | |||||||||
All stock options that remain outstanding are fully vested and exercisable.
There was no intrinsic value of options granted, exercised or outstanding during the periods presented.
On August 18, 2010, the Company Board approved the distribution of restricted stock units to employees of the Company. The cancellation of the 2006 Plan stock options and issuance of the restricted stock units was accounted for in accordance with ASC Topic 718. We followed modification accounting which requires the Company to recognize expense based upon the excess fair value of the new awards over the original awards as determined on the modification date. The excess fair value was calculated based upon the difference between the fair value of the restricted stock unit price at issuance and the fair value of the stock options cancelled utilizing the Black-Scholes options pricing model as of the same date. The Company used the assumptions set forth in the table below for the Black-Scholes options pricing model:
| 2010 | ||
| The weighted average fair value of restricted stock units issued (per unit) |
$0.13 - $0.75 | |
| Dividend yield |
0% | |
| Weighted average risk-free interest rate |
0.5% - 1.4% | |
| Weighted average expected volatility |
40% - 50% | |
| Expected life in years |
1.25 - 4.00 |
F-49
Table of Contents
Renewable Energy Group, Inc. and Subsidiaries
NOTES TO THE CONSOLIDATED FINANCIAL STATEMENTS — (Continued)
For the three years ended December 31, 2010, 2009 and 2008
(In thousands, except share and per share amounts)
The 2009 Plan is generally protected from anti-dilution via adjustments for any stock dividends, stock split, combination or other recapitalization.
The following table summarizes information about the Company’s Common Stock restricted stock units granted, exercised, forfeited, vested and exercisable:
| Amount of awards |
Weighted average issue price |
|||||||
| Awards outstanding—December 31, 2009 |
— | |||||||
| Issued |
2,890,723 | $ | 5.00 | |||||
| Forfeited |
(5,500 | ) | $ | 4.74 | ||||
|
|
|
|||||||
| Awards outstanding—December 31, 2010 |
2,885,223 | $ | 5.00 | |||||
|
|
|
|||||||
The restricted stock units issued will cliff vest at the earlier of expressly provided service or performance conditions. The service period for these RSU awards is a three year period from the grant date. The performance conditions provide for immediate vesting upon various conditions including a change in control or other common stock liquidity events. The Company is recording the stock compensation expense over the three year service period.
Stock-based compensation cost relating to the stock options and restricted stock units was $1,376, $2,522 and $3,574 for the years ended December 31, 2010, 2009 and 2008, respectively. The stock-based compensation costs were included as a component of selling, general and administrative expenses. The remaining expense yet to be recorded for the restricted stock unit awards is $10,580 over a period of 2.7 years.
Blackhawk:
Blackhawk had an equity-based compensation plan which provided for the issuance of options to purchase an aggregate of 650,000 units of Blackhawk to members of the Blackhawk Board of Managers, for the purpose of providing services to facilitate the construction and planned future operations of the plant. Options to purchase the entire 650,000 units were issued on June 30, 2006. The options are exercisable at a purchase price of $1.00 per unit at any time from and after the date on which the plant commences operations (vesting date) and will continue for a period of one year following such date, after which all such rights shall terminate. During December 2008, Blackhawk commenced operations and at that time the unit options were fully vested.
On May 9, 2008, Blackhawk issued an option for the purchase of an additional 100,000 units to an outside consultant for services related to the project. This option is exercisable at a purchase price of $2.00 per unit at any time from and after the date on which the plant commences operations and will continue for a period of seven years following such date, after which all such rights shall terminate.
The following table presents the weighted average assumptions used to estimate the fair values of the units underlying the options granted to members of the board of managers and consultant in the periods
F-50
Table of Contents
Renewable Energy Group, Inc. and Subsidiaries
NOTES TO THE CONSOLIDATED FINANCIAL STATEMENTS — (Continued)
For the three years ended December 31, 2010, 2009 and 2008
(In thousands, except share and per share amounts)
presented, using the Black-Scholes option pricing model. The risk-free interest rate for periods within the contractual life of the option is based on the U.S. Treasury yield curve in effect at the time of grant.
| 2008 | ||||
| Weighted average fair value of options granted (per option) |
$ | 1.00 | ||
| Dividend yield |
0 | % | ||
| Weighted average—risk fee interest rate |
5 | % | ||
| Weighted average—expected volatility |
25 | % | ||
| Weighted average—expected life in years |
3 | |||
On February 26, 2010, the Blackhawk stock-based compensation plan was cancelled due to the merger with the Company. The outstanding options at the time of the merger were converted into Common Stock warrants of the Company.
F-51
Table of Contents
Renewable Energy Group, Inc. and Subsidiaries
NOTES TO THE CONSOLIDATED FINANCIAL STATEMENTS — (Continued)
For the three years ended December 31, 2010, 2009 and 2008
(In thousands, except share and per share amounts)
Note 17—Related Party Transactions
Related parties include certain investors as well as entities in which the company has an equity method investment or an investment combined with a MOSA or board seat. Investors defined as related parties include (i) the investor having ten percent or more ownership, including convertible preferred stock, in the Company or (ii) the investor holding a board seat on the Company’s Board of Directors.
Summary of Related Party Transactions
| 2010 | 2009 | 2008 | ||||||||||||
| Revenues—Biodiesel sales |
$ | 4,261 | (a) | $ | 17,157 | (a) | $ | 10,723 | (a) | |||||
| Revenues—Services |
$ | 660 | (b) | $ | 1,121 | (b) | $ | 5,236 | (b) | |||||
| Cost of goods sold—Biodiesel |
$ | 112,891 | (c) | $ | 53,379 | (c) | $ | 39,349 | (c) | |||||
| Cost of goods sold—Services |
$ | 291 | (d) | $ | — | (d) | $ | — | (d) | |||||
| Selling, general, and administrative expenses |
$ | 1,601 | (e) | $ | 1,836 | (e) | $ | 1,946 | (e) | |||||
| Other income |
$ | — | (f) | $ | 355 | (f) | $ | — | (f) | |||||
| Interest expense |
$ | 334 | (g) | $ | 26 | (g) | $ | — | (g) | |||||
| Interest income |
$ | 180 | (h) | $ | — | (h) | $ | — | (h) | |||||
| Purchase of property, plant and equipment |
$ | — | (i) | $ | — | (i) | $ | 416 | (i) | |||||
| Proceeds from the sale of long lived assets |
$ | — | (j) | $ | 3,032 | (j) | $ | — | (j) | |||||
| (a) |
Represents transactions with related parties as follows: |
|||||||||||||
| West Central |
$ | 20 | $ | 11 | $ | 30 | ||||||||
| E D & F Man |
4,241 | 14,299 | 10,023 | |||||||||||
| Bunge |
— | 2,807 | — | |||||||||||
| Network Plants |
— | 40 | 670 | |||||||||||
|
|
|
|
|
|
|
|||||||||
| $ | 4,261 | $ | 17,157 | $ | 10,723 | |||||||||
|
|
|
|
|
|
|
|||||||||
| (b) |
Represents transactions with related parties as follows: |
|||||||||||||
| Network Plants |
$ | 660 | $ | 1,121 | $ | 4,843 | ||||||||
| E D & F Man |
— | — | 393 | |||||||||||
|
|
|
|
|
|
|
|||||||||
| $ | 660 | $ | 1,121 | $ | 5,236 | |||||||||
|
|
|
|
|
|
|
|||||||||
| (c) |
Represents transactions with related parties as follows: |
|||||||||||||
| West Central |
$ | 14,739 | $ | 21,893 | $ | 38,851 | ||||||||
| Network plants |
1,493 | — | — | |||||||||||
| Bunge |
96,659 | 31,183 | — | |||||||||||
| E D & F Man |
— | 303 | 498 | |||||||||||
|
|
|
|
|
|
|
|||||||||
| $ | 112,891 | $ | 53,379 | $ | 39,349 | |||||||||
|
|
|
|
|
|
|
|||||||||
| (d) |
Represents transactions with Network Plants |
|||||||||||||
| (e) |
Represents transactions with related parties as follows: |
|||||||||||||
| West Central |
$ | 174 | $ | 328 | $ | 1,309 | ||||||||
| 416 S. Bell, LLC |
344 | 688 | 603 | |||||||||||
| Bunge |
993 | 617 | — | |||||||||||
| E D & F Man |
90 | 203 | 34 | |||||||||||
|
|
|
|
|
|
|
|||||||||
| $ | 1,601 | $ | 1,836 | $ | 1,946 | |||||||||
|
|
|
|
|
|
|
|||||||||
| (f) |
Represents transactions with ED&F Man |
|||||||||||||
| (g) |
Represents transactions with related parties as follows: |
|||||||||||||
| West Central |
$ | 123 | $ | — | $ | — | ||||||||
| Bunge |
211 | 26 | — | |||||||||||
|
|
|
|
|
|
|
|||||||||
| $ | 334 | $ | 26 | $ | — | |||||||||
|
|
|
|
|
|
|
|||||||||
| (h) |
Represents transactions with Blackhawk Biofuels |
|||||||||||||
| (i) |
Represents transactions with West Central |
|||||||||||||
| (j) |
Represents transactions with ED&F Man |
|||||||||||||
F-52
Table of Contents
Renewable Energy Group, Inc. and Subsidiaries
NOTES TO THE CONSOLIDATED FINANCIAL STATEMENTS — (Continued)
For the three years ended December 31, 2010, 2009 and 2008
(In thousands, except share and per share amounts)
Summary of Related Party Balances
| 2010 | 2009 | |||||||||
| Accounts receivable |
$ | 1,146(a) | $ | 2,328(a) | ||||||
| Prepaid inventory |
$ | — (b) | $ | 269(b) | ||||||
| Accounts payable |
$ | 3,827(c) | $ | 5,415(c) | ||||||
| (a) |
Represents balances with related parties as follows: |
|||||||||
| West Central |
$ | 22 | $ | 123 | ||||||
| Network Plants |
12 | 1,065 | ||||||||
| Bunge |
46 | 24 | ||||||||
| E D & F Man |
1,066 | 1,116 | ||||||||
|
|
|
|
|
|||||||
| $ | 1,146 | $ | 2,328 | |||||||
|
|
|
|
|
|||||||
| (b) |
Represents balances with Bunge |
|||||||||
| (c) |
Represents balances with related parties as follows: |
|||||||||
| West Central |
$ | 2,539 | $ | 2,951 | ||||||
| Network Plants |
2 | 2,293 | ||||||||
| Bunge |
1,286 | 127 | ||||||||
| E D & F Man |
— | 44 | ||||||||
|
|
|
|
|
|||||||
| $ | 3,827 | $ | 5,415 | |||||||
|
|
|
|
|
|||||||
West Central Cooperative
The Company purchases once-refined soy oil from West Central. Purchases from West Central were $14,739 $21,893 and $38,848 for the years ended December 31, 2010, 2009 and 2008, respectively. The Company also had biodiesel and co-product sales which totaled $20, $11 and $30 for the years ended December 31, 2010, 2009 and 2008, respectively.
West Central leases the land under the Company’s production facility at Ralston, Iowa to the Company at an annual cost of one dollar. The Company is responsible for the property taxes, insurance, utilities and repairs for the facility relating to this lease. The lease has an initial term of twenty years and the Company has options to renew the lease for an additional thirty years.
At the time of the signing of the contribution agreement, the Company executed an asset use agreement with West Central to provide the use of certain assets, such as office space, maintenance equipment and utilities. The agreement requires the Company to pay West Central its proportionate share of certain costs incurred by West Central. This agreement has the same term as the land lease. Selling, general and administrative expenses included in the statement of operations related to this agreement totaled $40, $40 and $40 for the years ended December 31, 2010, 2009 and 2008, respectively.
At the time of the signing of the contribution agreement, the Company entered into a contract for services with West Central, to provide certain corporate and administrative services such as human resources, information technology, and accounting. The agreement requires the Company to pay West Central the proportionate share of the costs associated with the provision of services, plus a 15% margin. The agreement had an initial one-year term and is cancellable thereafter upon six months notice by either
F-53
Table of Contents
Renewable Energy Group, Inc. and Subsidiaries
NOTES TO THE CONSOLIDATED FINANCIAL STATEMENTS — (Continued)
For the three years ended December 31, 2010, 2009 and 2008
(In thousands, except share and per share amounts)
party. Selling, general, and administrative expenses included in the statement of operations related to this agreement totaled $134, 288 and $1,269 for the years ended December 31, 2010, 2009 and 2008, respectively.
In addition to the amounts above, the Company recorded $0, $0 and $3 of other costs of goods sold for the years ended December 31, 2010, 2009 and 2008, respectively.
The Company also acquired $0, $0 and $416 of property, plant and equipment from West Central during the years ended December 31, 2010, 2009 and 2008, respectively.
In addition to the amounts above, the Company recorded interest expense of and $123, $0 and $0 for the December 31, 2010, 2009 and 2008, respectively.
Accounts receivable includes net balances due from West Central of $22 and $123 at December 31, 2010 and 2009, respectively. Accounts payable includes net balances due to West Central of $2,539 and $2,951 at December 31, 2010 and 2009, respectively.
Bunge North America
The Company purchases feedstocks for the production of biodiesel. Purchases from Bunge were $96,659, $31,183 and $0 for the years ended December 31, 2010, 2009 and 2008, respectively. The Company also made sales of biodiesel and raw materials to Bunge of $0, $2,807 and $0 for the years ended December 31, 2010, 2009 and 2008, respectively.
During July 2009, the Company entered into an agreement for Bunge to provide services related to the procurement of raw materials and the purchase and resale of biodiesel produced by the Company. The agreement is a three-year term and either party has the ability to cancel the agreement after the term ends. Selling, general and administrative expenses included in the statement of operations related to this agreement totaled $480 and $461 for the years ended December 31, 2010 and 2009, respectively. The Company incurred $211 and $26 in interest expense for the years ended December 31, 2010 and 2009, respectively, related to the purchase and resale of biodiesel. Also, as part of the agreement, the Company is required to pay an incentive fee to Bunge for meeting certain hedging goals utilizing Bunge’s advice. Selling, general and administrative expenses included in the statement of operations include incentive fees of $513 and $156 for the years ended December 31, 2010 and 2009, respectively.
The Company has accounts receivable due from Bunge of $46 and $24 as of December 31, 2010 and 2009, respectively. The Company has prepaid inventory balance of $0 and $269 as of December 31, 2010 and 2009, respectively. The Company has accounts payable due to Bunge of $1,286 and $127 as of December 31, 2010 and 2009, respectively.
E D & F Man Holdings Ltd.
In August 2006, at the time of the initial closing of its preferred stock investment, the Company entered into a glycerin marketing agreement and various terminal lease agreements with one of E D & F’s then wholly owned subsidiaries, Westway Feed Products, Inc. (Westway). Under the glycerin marketing
F-54
Table of Contents
Renewable Energy Group, Inc. and Subsidiaries
NOTES TO THE CONSOLIDATED FINANCIAL STATEMENTS — (Continued)
For the three years ended December 31, 2010, 2009 and 2008
(In thousands, except share and per share amounts)
agreement, Westway has an exclusive right to market the glycerin produced at each of the Company’s owned and managed facilities in the animal nutrition market. For the years ended December 31, 2010, 2009 and 2008, fees of $90, $203 and $34, respectively, were paid according to the agreement. This contract has a term of five years and automatically renews in one-year periods thereafter unless terminated by either party. The Company also has entered into a master terminal lease agreement and several leases for terminals with another wholly-owned subsidiary of E D & F, Westway Terminal Company, Inc. These leases have terms ranging from one month to four years. The Company leased two terminals for aggregate fees of $0, $303 and $498 during the years ended December 31, 2010, 2009 and 2008, respectively. Additionally, the Company received $0, $355 and $393 in terminal lease revenue from Westway during the years ended December 31, 2010, 2009 and 2008, respectively, related to its terminal facility located in Stockton, California. In July 2009, the Company sold the Stockton terminal facility to Westway for $3,032, resulting in a gain of $2,254.
The Company also entered into a tolling agreement with E D & F for biodiesel to be produced out of the Company’s Houston, Texas biodiesel production facility. Revenues on biodiesel from this toll agreement and from other biodiesel sales were $4,241, $12,659 and $10,023 for the years ended December 31, 2010, 2009 and 2008, respectively. Additionally, revenues from raw material sales totaled $0, $1,640 and $0 for the years ended December 31, 2010, 2009 and 2008, respectively.
The Company had accounts receivable due from E D & F Man of $1,066 and $1,116 as of December 31, 2010 and 2009, respectively. The Company had accounts payable due to E D & F Man of $0 and $44 as of December 31, 2010 and 2009, respectively.
Network Plants
The Company receives certain fees for the marketing and sale of product produced by and the management of the Network Plants’ operations, in which the Company has also invested. As an additional incentive to the Company and additional compensation for the marketing, sales and management services being rendered, the Network Plants pay a bonus to the Company on an annual basis equal to a percentage of the net income of the Network Plant, as defined by the management agreement. Total related party management service revenues recognized by the Company related to investees were $660, $1,121 and $4,843 for the years ended December 31, 2010, 2009 and 2008, respectively. Additionally, revenues from biodiesel sales totaled $0, $40 and $670 for the years ended December 31, 2010, 2009 and 2008, respectively. The Company also incurred fees related to the production of biodiesel in the amount of $1,493 for the year ended December 31, 2010.
The Company had accounts receivable due from the Network Plants of $12 and $1,065 at December 31, 2010 and 2009, respectively. The Company had accounts payable due to the Network Plants of $2 and $2,293 at December 31, 2010 and 2009, respectively.
416 S. Bell, LLC
The Company rents a building for administrative uses under an operating lease from 416 S. Bell, LLC. Rent payments made under this lease totaled $344, $688 and $603 for the years ended December 31, 2010, 2009 and 2008, respectively.
F-55
Table of Contents
Renewable Energy Group, Inc. and Subsidiaries
NOTES TO THE CONSOLIDATED FINANCIAL STATEMENTS — (Continued)
For the three years ended December 31, 2010, 2009 and 2008
(In thousands, except share and per share amounts)
Note 18—Operating Leases
The Company acts as a lessee for certain land and equipment under operating leases. Total rent expense under operating leases was $5,950, $8,171 and $4,361 for the years ended December 31, 2010, 2009 and 2008, respectively. For each of the next five calendar years and thereafter, future minimum lease payments under operating leases that have initial or remaining noncancelable lease terms in excess of one year are as follows:
| Related party payments |
Other payments |
Total payments |
||||||||||
| 2011 |
$ | 690 | $ | 6,578 | $ | 7,268 | ||||||
| 2012 |
690 | 7,508 | 8,198 | |||||||||
| 2013 |
690 | 7,183 | 7,873 | |||||||||
| 2014 |
690 | 7,038 | 7,728 | |||||||||
| 2015 |
690 | 6,843 | 7,533 | |||||||||
| Thereafter |
1,379 | 49,235 | 50,614 | |||||||||
|
|
|
|
|
|
|
|||||||
| Total minimum payments |
$ | 4,829 | $ | 84,385 | $ | 89,214 | ||||||
|
|
|
|
|
|
|
|||||||
The Company leases consist primarily of: accesses to distribution terminals, biodiesel storage facilities, railcars and vehicles. At the end of the lease term the Company, generally, has the option to (a) return the leased equipment to the lessor, (b) purchase the property at its then fair value or (c) renew its lease at the then fair rental value on a year-to-year basis or for an agreed upon term. Certain leases allow for adjustment to minimum rentals in future periods as determined by the Consumer Price Index.
Note 19—Derivative Instruments
From time to time the Company enters into derivative transactions to hedge its exposure to interest rate and commodity price fluctuations. The Company does not enter into derivative transactions for trading purposes.
As of December 31, 2010, the Company has entered into heating oil and soy oil derivative instruments and an interest rate swap agreement. The Company has entered into heating oil and soy oil commodity-based derivatives in order to protect gross profit margins from potentially adverse effects of price volatility on biodiesel sales where the prices are set at a future date. As of December 31, 2010, the Company had 269 open commodity contracts. In addition, the Company manages interest rate risk associated with the REG Danville variable interest rate note payable using a fixed rate swap. The interest rate swap agreement has an outstanding notional value of $20,747 as of December 31, 2010. The agreement effectively fixes the variable component of the interest rate on the Term Loan at 3.67% through November 2011. The fair value of the interest rate swap agreement was $612 and $1,031 at December 31, 2010 and 2009, respectively, and is recorded in the other noncurrent liabilities. The interest rate swap was not designated as an accounting hedge under ASC Topic 815 and thus all gains and losses are recorded currently in earnings.
ASC 815 requires all derivative financial instruments to be recorded on the balance sheet at fair value. The Company’s derivatives are not designated as hedges and are utilized to manage cash flow. The changes in fair value of the derivative instruments are recorded through earnings in the period of change.
F-56
Table of Contents
Renewable Energy Group, Inc. and Subsidiaries
NOTES TO THE CONSOLIDATED FINANCIAL STATEMENTS — (Continued)
For the three years ended December 31, 2010, 2009 and 2008
(In thousands, except share and per share amounts)
REG Danville’s interest rate swap contains a credit support arrangement that is directly linked to the notes payable with the same counterparty. Therefore, the interest rate swap counterparty would have access to the debt service fund or other collateral posted by REG Danville as a result of any failure to perform under the interest rate swap agreement. As of December 31, 2010, the Company posted $2,119 of collateral associated with its commodity-based derivatives with a net liability position of $483.
The Company’s preferred stock embedded conversion feature is further discussed in “Note 2 – Summary of Significant Accounting Policies”.
The following tables provide details regarding the Company’s derivative financial instruments:
| As of December 31, 2009 |
||||||||||||
| Asset Derivatives |
Liability Derivatives |
|||||||||||
| Balance sheet location |
Fair value |
Balance sheet location |
Fair value |
|||||||||
| Embedded derivative |
Preferred stock embedded conversion feature derivatives | $ | 4,104 | |||||||||
| Interest rate swap |
Other liabilities | 1,031 | ||||||||||
| Commodity derivatives |
Prepaid expenses and other assets | $ | 47 | Prepaid expenses and other assets | 300 | |||||||
|
|
|
|
|
|||||||||
| Total derivatives |
$ | 47 | $ | 5,435 | ||||||||
|
|
|
|
|
|||||||||
| As of December 31, 2010 |
||||||||||||
| Asset derivatives |
Liability Derivatives |
|||||||||||
| Balance sheet location |
Fair value |
Balance sheet location |
Fair value |
|||||||||
| Embedded derivative |
Preferred stock embedded conversion feature derivatives |
$ | 61,761 | |||||||||
| Interest rate swap |
Other liabilities |
612 | ||||||||||
| Commodity derivatives |
Prepaid expenses and other assets |
$78 | Prepaid expenses and other assets |
561 | ||||||||
|
|
|
|
|
|||||||||
| Total derivatives |
$78 | $ | 62,934 | |||||||||
|
|
|
|
|
|||||||||
|
Location of gain (loss) recognized in income |
2010 | 2009 | ||||||||
| Amount of gain (loss) recognized in income on derivatives |
Amount of gain (loss) recognized in income on derivatives |
|||||||||
| Embedded derivative |
Change in fair value of preferred stock conversion feature embedded derivatives | $ | (8,208 | ) | $ | (2,339 | ) | |||
| Interest rate swap |
Change in fair value of interest rate swap | 469 | 382 | |||||||
| Commodity derivatives |
Cost of goods sold—Biodiesel | (1,213 | ) | (1,086 | ) | |||||
|
|
|
|
|
|||||||
| Total |
$ | (8,952 | ) | $ | (3,043 | ) | ||||
|
|
|
|
|
|||||||
F-57
Table of Contents
Renewable Energy Group, Inc. and Subsidiaries
NOTES TO THE CONSOLIDATED FINANCIAL STATEMENTS — (Continued)
For the three years ended December 31, 2010, 2009 and 2008
(In thousands, except share and per share amounts)
Note 20—Fair Value Measurement
ASC Topic 820 establishes a framework for measuring fair value in GAAP and expands disclosures about fair market value measurements. ASC Topic 820 clarifies that fair value is an exit price, representing the amount that would be received to sell an asset or paid to transfer a liability in an orderly transaction between market participants. As such, fair value is a market-based measurement that should be determined based on assumptions that market participants would use in pricing an asset or liability. As a basis for considering assumptions, ASC Topic 820 establishes a three-tier fair value hierarchy, which prioritizes the inputs used in measuring fair value as follows:
| · | Level 1—Quoted prices for identical instruments in active markets. |
| · | Level 2—Quoted prices for similar instruments in active markets, quoted prices for identical or similar instruments in markets that are not active and model-derived valuations, in which all significant inputs are observable in active markets. |
| · | Level 3—Unobservable inputs in which there is little or no market data, which require the reporting entity to develop its own assumptions. |
In addition, ASC Topic 820 requires disclosures about the use of fair value to measure assets and liabilities to enable the assessment of inputs used to develop fair value measures, and for unobservable inputs, to determine the effects of the measurements on earnings.
A summary of assets (liabilities) measured at fair value as of December 31, 2009 and 2010 is as follows:
| As of December 31, 2009 | ||||||||||||||||
| Total | Level 1 | Level 2 | Level 3 | |||||||||||||
| Preferred stock embedded derivatives |
$ | (4,104 | ) | $ | — | $ | — | $ | (4,104 | ) | ||||||
| Interest rate swap |
$ | (1,031 | ) | — | (1,031 | ) | — | |||||||||
| Commodity derivatives |
$ | (253 | ) | — | (253 | ) | — | |||||||||
|
|
|
|
|
|
|
|
|
|||||||||
| $ | (5,388 | ) | $ | — | $ | (1,284 | ) | $ | (4,104 | ) | ||||||
|
|
|
|
|
|
|
|
|
|||||||||
| As of December 31, 2010 | ||||||||||||||||
| Total | Level 1 | Level 2 | Level 3 | |||||||||||||
| Preferred stock embedded derivatives |
$ | (61,761 | ) | $ | — | $ | — | $ | (61,761 | ) | ||||||
| Interest rate swap |
$ | (612 | ) | — | (612 | ) | — | |||||||||
| Seneca Holdco liability |
$ | (10,406 | ) | — | — | (10,406 | ) | |||||||||
| Restricted cash |
$ | 401 | 401 | — | — | |||||||||||
| Commodity derivatives |
$ | (483 | ) | — | (483 | ) | — | |||||||||
|
|
|
|
|
|
|
|
|
|||||||||
| $ | (72,861 | ) | $ | 401 | $ | (1,095 | ) | $ | (72,167 | ) | ||||||
|
|
|
|
|
|
|
|
|
|||||||||
F-58
Table of Contents
Renewable Energy Group, Inc. and Subsidiaries
NOTES TO THE CONSOLIDATED FINANCIAL STATEMENTS — (Continued)
For the three years ended December 31, 2010, 2009 and 2008
(In thousands, except share and per share amounts)
The following is a reconciliation of the beginning and ending balances for liabilities measured at fair value on a recurring basis using significant unobservable inputs (Level 3) during the years ended December 31, 2010 and 2009:
| Preferred stock embedded derivatives |
Seneca holdco liability |
Blackhawk subordinated debt |
Blackhawk unit interest |
|||||||||||||
| Ending balance—December 31, 2008 |
$ | (1,765 | ) | $ | — | $ | — | $ | — | |||||||
| Total unrealized gains (losses) |
(2,339 | ) | — | — | — | |||||||||||
| Purchases, issuance, and settlements, net |
— | — | — | — | ||||||||||||
|
|
|
|
|
|
|
|
|
|||||||||
| Ending balance—December 31, 2009 |
(4,104 | ) | — | — | — | |||||||||||
| Total unrealized gains (losses) |
— | (4,179 | ) | — | — | |||||||||||
| Deconsolidation of Blackhawk |
(8,208 | ) | — | 24,298 | 3,678 | |||||||||||
| Purchases, issuance, and settlements, net |
(49,448 | ) | 437 | — | 291 | |||||||||||
| Purchase accounting consolidation |
(1 | ) | (6,664 | ) | (24,298 | ) | (3,969 | ) | ||||||||
|
|
|
|
|
|
|
|
|
|||||||||
| Ending balance—December 31, 2010 |
$ | (61,761 | ) | $ | (10,406 | ) | $ | — | $ | — | ||||||
|
|
|
|
|
|
|
|
|
|||||||||
The company used the following methods and assumptions to estimate fair value of its financial instruments:
Valuation of Preferred Stock embedded conversion feature derivatives: The estimated fair value of the derivative instruments embedded in the Company’s outstanding preferred stock is determined using the option pricing method to allocate the fair value of the underlying stock to the various components comprising the security, including the embedded derivative. The allocation was performed based on each class of preferred stock’s liquidation preference and relative seniority. Derivative liabilities are adjusted to reflect fair value at each period end. The effects of interactions between embedded derivatives are calculated and accounted for in arriving at the overall fair value of the financial instruments.
Interest rate swap: The fair value of the interest swap was determined based on a discounted cash flow approach using market observable swap curves.
Restricted cash: This instrument consists of money market mutual funds whose fair value is based on quoted prices of identical assets in an active exchange-traded market and are reflected in Level 1.
Commodity derivatives: The instruments held by the Company consist primarily of futures contracts, swap agreements, purchased put options, and written call options. The fair value of contracts based on quoted prices of identical assets in an active exchange-traded market is reflected in Level 1. Contracts whose fair value is determined based on quoted prices of similar contracts in over-the-counter markets are reflected in Level 2.
Seneca Holdco liability: The liability represents the combination of the Call Option and the Put Option related to the purchase of membership interest of Seneca Landlord, LLC. The fair value of the Seneca Holdco liability is determined using an option pricing model and represents the probability weighted present value of the gain that is realized upon exercise of each option.
F-59
Table of Contents
Renewable Energy Group, Inc. and Subsidiaries
NOTES TO THE CONSOLIDATED FINANCIAL STATEMENTS — (Continued)
For the three years ended December 31, 2010, 2009 and 2008
(In thousands, except share and per share amounts)
Notes payable and lines of credit: The fair value of long-term debt and lines of credit was established using discounted cash flow calculations and current market rates.
The estimated fair values of the Company’s financial instruments, which are not recorded at fair value are as follows as of December 31, 2010 and 2009:
| 2010 | 2009 | |||||||||||||||
| Asset (liability) carrying amount |
Estimated fair value |
Asset (liability) carrying amount |
Estimated fair value |
|||||||||||||
| Financial Liabilities: |
||||||||||||||||
| Notes payable and lines of credit |
(96,125 | ) | (96,228 | ) | (28,855 | ) | (29,124 | ) | ||||||||
Note 21—Business Concentrations
Certain customers represented greater than 10% of the total consolidated revenues of the Company for the three years ended December 31, 2010, 2009 and 2008. All customer amounts disclosed in the table are related to biodiesel sales:
| 2010 | 2009 | 2008 | ||||||||||
| Customer A |
$ | 10,779 | ||||||||||
| Customer B |
$ | 4,241 | $ | 14,299 | 10,023 | |||||||
| Customer C |
62,632 | 31,947 | ||||||||||
The Company maintains cash balances at financial institutions, which may at times exceed the $250 coverage by the U.S. Federal Deposit Insurance Company.
Note 22—Operating Segments
The Company reports its operating segments based on services provided to customers, which includes Biodiesel, Services and Corporate and Other activities. The accounting policies of the segments are the same as those described in the summary of significant accounting policies. The Company has chosen to differentiate the operating segments based on the products and services each segment offers.
The Biodiesel segment processes waste vegetable oils, animal fats, virgin vegetable oils and other feedstocks and methanol into biodiesel. The Biodiesel segment also includes the Company’s purchases and resale of biodiesel produced by third parties. Revenue is derived from the sale of the processed biodiesel, related byproducts and renewable energy government incentive payments. The Services segment offers services for managing the construction of biodiesel production facilities and managing ongoing operations of third party plants and collects fees related to the services provided. The Company does not allocate items that are of a non-operating nature or corporate expenses to the business segments. Intersegment revenues are reported by the Services segment which manages the construction and operations of facilities included in the Biodiesel segment. Revenues are recorded by the Services segment at cost. Corporate expenses consist of corporate office expenses including compensation, benefits, occupancy and other administrative costs, including management service expenses. Subsequent to the original issuance of the financial statements, the Company has included total assets and goodwill for 2008.
F-60
Table of Contents
Renewable Energy Group, Inc. and Subsidiaries
NOTES TO THE CONSOLIDATED FINANCIAL STATEMENTS — (Continued)
For the three years ended December 31, 2010, 2009 and 2008
(In thousands, except share and per share amounts)
The following table represents the significant items by operating segment for the results of operations for the years ended December 31, 2010, 2009 and 2008:
| 2010 | 2009 | 2008 | ||||||||||
| Net sales: |
||||||||||||
| Biodiesel |
$ | 215,142 | $ | 128,492 | $ | 76,073 | ||||||
| Services |
9,484 | 5,396 | 34,472 | |||||||||
| Intersegment revenues |
(8,171 | ) | (2,387 | ) | (25,093 | ) | ||||||
|
|
|
|
|
|
|
|||||||
| $ | 216,455 | $ | 131,501 | $ | 85,452 | |||||||
|
|
|
|
|
|
|
|||||||
| Loss before income taxes and loss from equity investments: |
||||||||||||
| Biodiesel |
$ | 21,126 | $ | 1,119 | $ | (2,663 | ) | |||||
| Services |
506 | 1,832 | 4,909 | |||||||||
| Corporate and other (a) |
(45,783 | ) | (25,508 | ) | (26,526 | ) | ||||||
|
|
|
|
|
|
|
|||||||
| $ | (24,151 | ) | $ | (22,557 | ) | $ | (24,280 | ) | ||||
|
|
|
|
|
|
|
|||||||
| Depreciation and amortization expense, net: |
||||||||||||
| Biodiesel |
$ | 5,928 | $ | 5,772 | $ | 1,082 | ||||||
|
|
|
|
|
|
|
|||||||
| Purchases of property, plant, and equipment: |
||||||||||||
| Biodiesel |
$ | 4,550 | $ | 7,350 | $ | 67,235 | ||||||
|
|
|
|
|
|
|
|||||||
| 2010 | 2009 | 2008 | ||||||||||
| Goodwill: |
||||||||||||
| Biodiesel |
$ | 68,784 | $ | — | $ | — | ||||||
| Services |
16,080 | 16,080 | 16,080 | |||||||||
|
|
|
|
|
|
|
|||||||
| $ | 84,864 | $ | 16,080 | $ | 16,080 | |||||||
|
|
|
|
|
|
|
|||||||
| Assets: |
||||||||||||
| Biodiesel |
$ | 310,021 | $ | 147,807 | $ | 153,675 | ||||||
| Services |
20,799 | 17,829 | 18,755 | |||||||||
| Corporate and other (b) |
38,823 | 34,922 | 79,554 | |||||||||
|
|
|
|
|
|
|
|||||||
| $ | 369,643 | $ | 200,558 | $ | 251,984 | |||||||
|
|
|
|
|
|
|
|||||||
| (a) | Corporate and other includes income/(expense) not associated with the business segments, such as corporate general and administrative expenses, shared service expenses, interest expense and interest income, all reflected on an accrual basis of accounting. |
| (b) | Corporate and other includes cash and other assets not associated with the business segments, including investments. |
Note 23—Commitments and Contingencies
On May 8, 2009 the Company entered into a series of agreements with one of its shareholders, Bunge, whereby Bunge would purchase raw material inputs for later resale to the Company and use in producing biodiesel. Additionally, the agreements provide for Bunge to purchase biodiesel produced by
F-61
Table of Contents
Renewable Energy Group, Inc. and Subsidiaries
NOTES TO THE CONSOLIDATED FINANCIAL STATEMENTS — (Continued)
For the three years ended December 31, 2010, 2009 and 2008
(In thousands, except share and per share amounts)
the Company for resale to the Company’s customers. These agreements provide financing for the Company’s raw material and finished goods inventory not to exceed aggregate amounts outstanding of $10,000. In exchange for this financing, Bunge will receive fees equal to the greater of 30-day LIBOR plus 7.5% or 10% as determined based on the amount of inventory financed, plus a monthly service fee of $40 and incentive fees not to exceed $1,500 per annum. As of December 31, 2010 and 2009, there was $280 and $86, respectively, in incentive fees due to Bunge.
The Company is involved in legal proceedings in the normal course of business. The Company currently believes that any ultimate liability arising out of such proceedings will not have a material adverse effect on the Company’s financial position, results of operations or cash flows.
Note 24—Supplemental Information
The following table represents the significant items for the results of operations on a quarterly basis for the years ended December 31, 2010 and 2009:
| Three months ended March 31, 2010 |
Three months ended June 30, 2010 |
Three months ended September 30, 2010 |
Three months ended December 31, 2010 |
Total | ||||||||||||||||
| Revenues |
$ | 37,489 | $ | 46,337 | $ | 63,122 | $ | 69,507 | $ | 216,455 | ||||||||||
| Gross profit |
2,250 | 5,094 | 6,485 | 7,803 | 21,632 | |||||||||||||||
| Selling, general, and administrative expenses |
5,086 | 5,731 | 5,782 | 5,588 | 22,187 | |||||||||||||||
| Income (loss) from operations |
(2,977 | ) | (637 | ) | (6,633 | ) | 2,198 | (8,049 | ) | |||||||||||
| Other income (expense), net |
(55 | ) | 3,011 | (811 | ) | (18,247 | ) | (16,102 | ) | |||||||||||
| Net loss attributable to noncontrolling interest |
— | — | — | — | — | |||||||||||||||
| Net income (loss) attributable to the Company |
3,081 | (392 | ) | (7,617 | ) | (16,660 | ) | (21,588 | ) | |||||||||||
| Three months March 31, |
Three months June 30, 2009 |
Three months ended September 30, 2009 |
Three months ended December 31, 2009 |
Total | ||||||||||||||||
| Revenues |
$ | 18,964 | $ | 30,132 | $ | 42,689 | $ | 39,716 | $ | 131,501 | ||||||||||
| Gross profit (loss) |
(2,016 | ) | (859 | ) | 1,976 | 3,850 | 2,951 | |||||||||||||
| Selling, general, and administrative expenses |
5,073 | 7,200 | 7,643 | 5,649 | 25,565 | |||||||||||||||
| Loss from operations |
(7,089 | ) | (8,059 | ) | (3,413 | ) | (2,632 | ) | (21,193 | ) | ||||||||||
| Other income (expense), net |
1,970 | 160 | (2,988 | ) | (506 | ) | (1,364 | ) | ||||||||||||
| Net loss attributable to noncontrolling interest |
2,951 | 1,941 | 1,448 | 1,613 | 7,953 | |||||||||||||||
| Net loss attributable to the Company |
(1,223 | ) | (4,026 | ) | (3,515 | ) | (52,141 | ) | (60,905 | ) | ||||||||||
F-62
Table of Contents
Renewable Energy Group, Inc. and Subsidiaries
NOTES TO THE CONSOLIDATED FINANCIAL STATEMENTS — (Continued)
For the three years ended December 31, 2010, 2009 and 2008
(In thousands, except share and per share amounts)
Note 25—Subsequent Events
The Company has performed an evaluation of subsequent events through the date the financial statements were issued.
The AgStar Line expired on March 7, 2011. The Company was able to extend the terms of the line of credit with the bank. The borrowing capacity of the line of credit remained at $2,350 and matures on March 5, 2012.
F-63
Table of Contents
Renewable Energy Group, Inc.
SCHEDULE I
FINANCIAL INFORMATION OF PARENT COMPANY
Condensed balance sheets
As of December 31, 2010 and 2009
(In thousands, except share amounts)
| 2010 | 2009 | |||||||
| ASSETS | ||||||||
| Current assets: |
||||||||
| Cash and cash equivalents |
$ | 1,457 | $ | 168 | ||||
| Restricted cash |
— | 155 | ||||||
| Notes receivables |
4,664 | — | ||||||
| Prepaid expenses and other assets |
2 | 10,639 | ||||||
|
|
|
|
|
|||||
| Total current assets |
6,123 | 10,962 | ||||||
|
|
|
|
|
|||||
| Property, plant and equipment, net |
2,191 | 69,810 | ||||||
| Property, plant and equipment, net—Seneca Landlord, LLC |
2,497 | — | ||||||
| Intangible assets, net |
3,006 | 7,025 | ||||||
| Deferred income taxes |
1,500 | 1,500 | ||||||
| Investment in subsidiaries |
211,679 | 54,066 | ||||||
| Notes receivable |
— | 21,700 | ||||||
| Intercompany receivables |
844 | — | ||||||
| Other assets |
17 | 2,467 | ||||||
|
|
|
|
|
|||||
| Total Assets |
$ | 227,857 | 167,530 | |||||
|
|
|
|
|
|||||
| LIABILITIES AND EQUITY (DEFICIT) | ||||||||
| Current liabilities: |
||||||||
| Current maturities of notes payable |
$ | — | $ | 10 | ||||
| Accounts payable |
201 | 3,590 | ||||||
| Accrued expenses |
— | 229 | ||||||
|
|
|
|
|
|||||
| 201 | 3,829 | |||||||
| Preferred stock embedded conversion feature derivatives |
61,761 | 4,104 | ||||||
| Seneca Holdco liability, at fair value |
6,843 | — | ||||||
| Notes payable |
— | 89 | ||||||
| Intercompany payables |
— | 28,533 | ||||||
| Other liabilities |
1,500 | 8,984 | ||||||
|
|
|
|
|
|||||
| Total liabilities |
70,305 | 45,539 | ||||||
|
|
|
|
|
|||||
| Commitments and contingencies |
||||||||
| Redeemable preferred stock ($.0001 par value; 14,000,000 shares authorized; 13,455,522 and 12,464,357 shares outstanding at December 31, 2010 and 2009, respectively; redemption amount $222,016 and $247,587 at December 31, 2010 and 2009, respectively) |
122,436 | 149,122 | ||||||
| Equity (deficit): |
||||||||
| Company stockholders’ equity (deficit): |
||||||||
| Common stock ($.0001 par value; 140,000,000 shares authorized; 33,129,553 and 19,575,117 shares outstanding at December 31, 2010 and 2009, respectively) |
3 | 2 | ||||||
| Common stock—additional paid-in-capital |
82,634 | 15,676 | ||||||
| Warrants - additional paid-in-capital |
4,820 | 4,619 | ||||||
| Accumulated deficit |
(52,341 | ) | (60,905 | ) | ||||
|
|
|
|
|
|||||
| Total stockholders’ equity (deficit) |
35,116 | (40,608 | ) | |||||
| Noncontrolling interest |
— | 13,477 | ||||||
|
|
|
|
|
|||||
| Total equity (deficit) |
35,116 | (27,131 | ) | |||||
|
|
|
|
|
|||||
| Total liabilities and equity (deficit) |
$ | 227,857 | $ | 167,530 | ||||
|
|
|
|
|
|||||
See notes to the Renewable Energy Group, Inc. and subsidiaries consolidated financial statements included elsewhere herein.
F-64
Table of Contents
Renewable Energy Group, Inc.
SCHEDULE I
FINANCIAL INFORMATION OF PARENT COMPANY
Condensed statements of operations
For the years ended December 31, 2010, 2009 and 2008
(In thousands)
| 2010 | 2009 | 2008 | ||||||||||
| Revenues: |
||||||||||||
| Equity in losses of subsidiaries of continuing operations |
$ | (9,218 | ) | $ | (11,305 | ) | $ | (15,014 | ) | |||
| Services |
490 | 2,771 | 2,770 | |||||||||
|
|
|
|
|
|
|
|||||||
| Operating loss |
(8,728 | ) | (8,534 | ) | (12,244 | ) | ||||||
| General and administrative expenses |
(3,951 | ) | (13,117 | ) | (16,632 | ) | ||||||
| Impairment on long lived asset |
— | (833 | ) | — | ||||||||
| Change in fair value of preferred stock conversion feature embedded derivatives |
(8,208 | ) | (2,339 | ) | 2,118 | |||||||
| Change in fair value of seneca holdco liability |
(4,179 | ) | — | — | ||||||||
| Other income |
19 | 405 | 334 | |||||||||
| Interest expense |
(2 | ) | (7 | ) | — | |||||||
| Interest income |
209 | 1,178 | 1,131 | |||||||||
|
|
|
|
|
|
|
|||||||
| Loss before income taxes and loss from equity investments |
(24,840 | ) | (23,247 | ) | (25,293 | ) | ||||||
| Income tax benefit (expense) |
3,252 | (45,212 | ) | 9,414 | ||||||||
| Loss from equity investments |
— | (399 | ) | — | ||||||||
|
|
|
|
|
|
|
|||||||
| Net loss |
(21,588 | ) | (68,858 | ) | (15,879 | ) | ||||||
|
|
|
|
|
|
|
|||||||
| Less—net loss attributable to noncontrolling interest |
— | 7,953 | 2,788 | |||||||||
|
|
|
|
|
|
|
|||||||
| Net loss attributable to the company |
(21,588 | ) | (60,905 | ) | (13,091 | ) | ||||||
| Effects of recapitalization |
8,521 | — | — | |||||||||
| Less—accretion of preferred stock to redemption value |
(27,239 | ) | (44,181 | ) | (26,692 | ) | ||||||
| Less—undistributed dividends allocated to preferred stockholders |
(10,027 | ) | (14,036 | ) | (11,145 | ) | ||||||
|
|
|
|
|
|
|
|||||||
| Net loss attributable to the company’s common stockholders |
$ | (50,333 | ) | $ | (119,122 | ) | $ | (50,928 | ) | |||
|
|
|
|
|
|
|
|||||||
See notes to the Renewable Energy Group, Inc. and subsidiaries consolidated financial statements elsewhere herein. The accompanying 2010, 2009, and 2008 parent company financial statements have been corrected to include undistributed dividends allocated to preferred stockholders, that the Company had not included in the previously filed schedule.
F-65
Table of Contents
Renewable Energy Group, Inc.
SCHEDULE I
FINANCIAL INFORMATION OF PARENT COMPANY
Condensed statements of redeemable preferred stock and equity (deficit)
for the years ended December 31, 2010, 2009 And 2008 (in thousands except share amounts)
|
|
|
Company Stockholders’ Equity (Deficit) |
|
|
||||||||||||||||||||||||||||||||
| Redeemable preferred stock shares |
Redeemable preferred stock |
Common stock shares |
Common stock |
Common stock - additional paid-in capital |
Warrants - additional paid-in capital |
Retained earnings (accumulated deficit) |
Noncontrolling Interest |
Total | ||||||||||||||||||||||||||||
| BALANCE, January 1, 2008 |
8,578,945 | $ | 43,707 | 13,334,874 | $ | 1 | $ | 62,629 | $ | 4,556 | $ | 25,723 | $ | 807 | $ | 93,716 | ||||||||||||||||||||
| Issuance of preferred stock, net of $246 of issuance cost and $302 for embedded derivative |
3,855,059 | 34,208 | — | — | — | — | — | — | — | |||||||||||||||||||||||||||
| Issuance of common stock, net of $234 of issuance costs |
— | — | 5,970,243 | 1 | 5,080 | — | — | — | 5,081 | |||||||||||||||||||||||||||
| Issuance of warrants |
— | — | — | — | (63 | ) | 63 | — | — | — | ||||||||||||||||||||||||||
| Contributions |
— | — | — | — | — | — | — | 22,820 | 22,820 | |||||||||||||||||||||||||||
| Removal of noncontrolling interest as a result of deconsolidation |
— | — | — | — | — | — | — | (602 | ) | (602 | ) | |||||||||||||||||||||||||
| Stock compensation expense |
— | — | — | — | 3,574 | — | — | — | 3,574 | |||||||||||||||||||||||||||
| Accretion of preferred stock to redemption value |
— | 26,692 | — | — | (14,060 | ) | — | (12,632 | ) | — | (26,692 | ) | ||||||||||||||||||||||||
| Net loss |
— | — | — | — | — | — | (13,091 | ) | (2,788 | ) | (15,879 | ) | ||||||||||||||||||||||||
|
|
|
|
|
|
|
|
|
|
|
|
|
|
|
|
|
|
|
|||||||||||||||||||
| BALANCE, December 31, 2008 |
12,434,004 | 104,607 | 19,305,117 | 2 | 57,160 | 4,619 | — | 20,237 | 82,018 | |||||||||||||||||||||||||||
| Issuance of preferred stock |
30,353 | 334 | — | — | — | — | — | — | — | |||||||||||||||||||||||||||
| Issuance of common stock |
— | — | 270,000 | — | 1,368 | — | — | — | 1,368 | |||||||||||||||||||||||||||
| Stock compensation expense |
— | — | — | — | 2,522 | — | — | — | 2,522 | |||||||||||||||||||||||||||
| Accretion of preferred stock to redemption value |
— | 44,181 | — | — | (44,181 | ) | — | — | — | (44,181 | ) | |||||||||||||||||||||||||
| Increase in Blackhawk Biofuels LLC members’ equity from issuance of common stock |
— | — | — | — | (1,193 | ) | — | — | 1,193 | — | ||||||||||||||||||||||||||
| Net loss |
— | — | — | — | — | — | (60,905 | ) | (7,953 | ) | (68,858 | ) | ||||||||||||||||||||||||
|
|
|
|
|
|
|
|
|
|
|
|
|
|
|
|
|
|
|
|||||||||||||||||||
| BALANCE, December 31, 2009 |
12,464,357 | 149,122 | 19,575,117 | 2 | 15,676 | 4,619 | (60,905 | ) | 13,477 | (27,131 | ) | |||||||||||||||||||||||||
| Derecognition of REG Holdco preferred stock, common stock, and common stock warrants |
(12,464,357 | ) | (158,475 | ) | (19,575,117 | ) | (2 | ) | (6,323 | ) | (4,619 | ) | — | — | (10,944 | ) | ||||||||||||||||||||
| Issuance of preferred stock, common stock, and common stock warrants to REG Holdco, net of $52,394 for embedded derivatives |
13,164,357 | 102,287 | 18,875,117 | 2 | 14,221 | 4,619 | — | — | |
— 18,842 |
| |||||||||||||||||||||||||
| Issuance of common stock in acquisitions, net of $862 for issue cost |
— | — | 13,754,436 | 1 | 79,304 | — | — | — | 79,305 | |||||||||||||||||||||||||||
| Issuance of preferred stock in acquisitions, net of $1,158 for embedded derivatives |
291,165 | 2,263 | — | — | — | — | — | — | — | |||||||||||||||||||||||||||
| Issuance of warrants in acquisitions |
— | — | — | — | — | 1,269 | — | — | 1,269 | |||||||||||||||||||||||||||
| Issuance of common stock |
— | — | 500,000 | — | 3,015 | — | — | — | 3,015 | |||||||||||||||||||||||||||
| Conversion of warrants to restricted stock units |
— | — | — | — | 1,068 | (1,068 | ) | — | — | — | ||||||||||||||||||||||||||
| Blackhawk Biofuels LLC deconsolidation and transition adjustment |
— | — | — | — | 1,192 | — | 30,152 | (13,477 | ) | 17,867 | ||||||||||||||||||||||||||
| Stock compensation expense |
— | — | — | — | 1,720 | — | — | — | 1,720 | |||||||||||||||||||||||||||
| Accretion of preferred stock to redemption value |
— | 27,239 | — | — | (27,239 | ) | — | — | — | (27,239 | ) | |||||||||||||||||||||||||
| Net loss |
— | — | — | — | — | — | (21,588 | ) | — | (21,588 | ) | |||||||||||||||||||||||||
|
|
|
|
|
|
|
|
|
|
|
|
|
|
|
|
|
|
|
|||||||||||||||||||
| BALANCE, December 31, 2010 |
13,455,522 | $ | 122,436 | 33,129,553 | $ | 3 | $ | 82,634 | $ | 4,820 | $ | (52,341 | ) | $ | — | $ | 35,116 | |||||||||||||||||||
|
|
|
|
|
|
|
|
|
|
|
|
|
|
|
|
|
|
|
|||||||||||||||||||
See notes to the Renewable Energy Group, Inc. and subsidiaries consolidated financial statements included elsewhere herein.
F-66
Table of Contents
Renewable Energy Group, Inc.
SCHEDULE I
FINANCIAL INFORMATION OF PARENT COMPANY
Condensed Statements of Cash Flows
For the years ended December 31, 2010, 2009 and 2008
(in thousands)
| 2010 | 2009 | 2008 | ||||||||||
| Cash flows from operating activities: |
||||||||||||
| Net loss |
$ | (21,588 | ) | $ | (68,858 | ) | $ | (15,879 | ) | |||
| Adjustments to reconcile net loss to net cash flows from operating activities: |
||||||||||||
| Equity in losses of continuing operations |
9,218 | 11,305 | 15,014 | |||||||||
| Depreciation expense |
241 | 389 | 90 | |||||||||
| Amortization expense |
92 | 175 | — | |||||||||
| Stock compensation expense |
1,376 | 2,522 | 3,574 | |||||||||
| Loss from equity method investees |
— | 399 | — | |||||||||
| Impairment of long-lived assets |
— | 833 | — | |||||||||
| Deferred tax expense (benefit) |
(3,252 | ) | 45,212 | (8,268 | ) | |||||||
| Change in fair value of preferred stock conversion feature embedded derivatives |
8,208 | 2,339 | (2,118 | ) | ||||||||
| Change in fair value of Seneca Holdco liability |
4,179 | — | — | |||||||||
| Expense settled with stock issuance |
— | 334 | — | |||||||||
| Changes in asset and liabilities, net of effects from mergers and acquisitions: |
||||||||||||
| Accounts receivable |
(633 | ) | — | — | ||||||||
| Prepaid expenses and other assets |
536 | (6,245 | ) | 521 | ||||||||
| Accounts payable |
1,728 | 3,980 | 8 | |||||||||
| Accrued expenses |
— | (845 | ) | 1,673 | ||||||||
|
|
|
|
|
|
|
|||||||
| Net cash flows from operating activities |
105 | (8,460 | ) | (5,385 | ) | |||||||
|
|
|
|
|
|
|
|||||||
| Cash flows from investing activities: |
||||||||||||
| Change in investments in subsidiaries |
(1,855 | ) | 9,439 | (18,476 | ) | |||||||
| Cash paid for purchase of property, plant and equipment |
(15 | ) | (1,426 | ) | (1,434 | ) | ||||||
| Cash provided through Blackhawk acquisition |
— | (155 | ) | — | ||||||||
| Cash provided through USBG acquisition |
— | — | 16,895 | |||||||||
|
|
|
|
|
|
|
|||||||
| Net cash flows from investing activities |
(1,870 | ) | 7,858 | (3,015 | ) | |||||||
|
|
|
|
|
|
|
|||||||
| Cash flows from financing activities: |
||||||||||||
| Cash received for issuance of note payable |
— | 100 | — | |||||||||
| Cash paid on note payable |
(2 | ) | (1 | ) | — | |||||||
| Cash paid on note receivables to subsidiaries |
(4,664 | ) | — | — | ||||||||
| Cash received from issuance of common stock to ARES Corporation |
8,000 | — | — | |||||||||
| Cash paid for issuance cost of common and preferred stock |
(280 | ) | — | (480 | ) | |||||||
|
|
|
|
|
|
|
|||||||
| Net cash flows from financing activities |
3,054 | 99 | (480 | ) | ||||||||
|
|
|
|
|
|
|
|||||||
| Net change in cash and cash equivalents |
1,289 | (503 | ) | (8,880 | ) | |||||||
| Cash and cash equivalents, Beginning of period |
168 | 671 | 9,551 | |||||||||
|
|
|
|
|
|
|
|||||||
| Cash and cash equivalents, End of period |
$ | 1,457 | $ | 168 | $ | 671 | ||||||
|
|
|
|
|
|
|
|||||||
See notes to the Renewable Energy Group, Inc. and subsidiaries consolidated financial statements included elsewhere herein.
F-67
Table of Contents
Renewable Energy Group, Inc.
RENEWABLE ENERGY GROUP, INC. AND SUBSIDIARIES
CONDENSED CONSOLIDATED BALANCE SHEETS (Unaudited)
AS OF JUNE 30, 2011 AND DECEMBER 31, 2010
(IN THOUSANDS, EXCEPT SHARE AMOUNTS)
| June 30, 2011 |
December 31, 2010 |
Pro forma June 30, 2011 |
||||||||||
| ASSETS |
||||||||||||
| CURRENT ASSETS: |
||||||||||||
| Cash and cash equivalents |
$ | 9,125 | $ | 4,259 | $ | |||||||
| Restricted cash |
2,268 | 2,667 | ||||||||||
| Accounts receivable, net (includes amounts owed by related parties of $234 and $1,146 as of June 30, 2011 and December 31, 2010, respectively) |
26,132 | 18,801 | ||||||||||
| Inventories |
41,024 | 28,985 | ||||||||||
| Prepaid expenses and other assets |
10,437 | 3,933 | ||||||||||
|
|
|
|
|
|
|
|||||||
| Total current assets |
88,986 | 58,645 | ||||||||||
|
|
|
|
|
|
|
|||||||
| Property, plant and equipment, net |
165,055 | 166,391 | ||||||||||
| Property, plant and equipment, net—variable interest entities |
47,833 | 42,692 | ||||||||||
| Goodwill |
84,864 | 84,864 | ||||||||||
| Intangible assets, net |
3,778 | 3,169 | ||||||||||
| Deferred income taxes |
1,500 | 1,500 | ||||||||||
| Investments |
3,545 | 4,259 | ||||||||||
| Other assets |
8,084 | 7,821 | ||||||||||
| Restricted cash |
304 | 302 | ||||||||||
|
|
|
|
|
|
|
|||||||
| TOTAL ASSETS |
$ | 403,949 | $ | 369,643 | $ | |||||||
|
|
|
|
|
|
|
|||||||
| LIABILITIES AND EQUITY |
||||||||||||
| CURRENT LIABILITIES: |
||||||||||||
| Revolving line of credit |
$ | 10,550 | $ | 9,550 | $ | |||||||
| Current maturities of notes payable |
24,463 | 25,551 | ||||||||||
| Current maturities of notes payable—variable interest entities |
797 | — | ||||||||||
| Accounts payable (includes amounts owed to related parties of $13,265 and $3,827 as of June 30, 2011 and December 31, 2010, respectively) |
27,270 | 14,237 | ||||||||||
| Accrued expenses and other liabilities |
4,831 | 3,549 | ||||||||||
| Deferred revenue |
1,616 | 9,339 | ||||||||||
|
|
|
|
|
|
|
|||||||
| Total current liabilities |
69,527 | 62,226 | ||||||||||
| Unfavorable lease obligation |
10,729 | 11,293 | ||||||||||
| Preferred stock embedded conversion feature derivatives |
78,849 | 61,761 | ||||||||||
| Seneca Holdco liability, at fair value |
11,629 | 10,406 | ||||||||||
| Notes payable |
23,989 | 24,774 | ||||||||||
| Notes payable—variable interest entities |
40,118 | 36,250 | ||||||||||
| Other liabilities |
6,741 | 5,381 | ||||||||||
|
|
|
|
|
|
|
|||||||
| Total liabilities |
241,582 | 212,091 | ||||||||||
|
|
|
|
|
|
|
|||||||
| COMMITMENTS AND CONTINGENCIES |
||||||||||||
| Redeemable preferred stock ($.0001 par value; 14,000,000 shares authorized; 13,455,522 shares outstanding at June 30, 2011 and December 31, 2010; redemption amount $222,016 at June 30, 2011 and December 31, 2010) |
134,512 | 122,436 | ||||||||||
| EQUITY: |
||||||||||||
| Company stockholders’ equity: |
||||||||||||
| Common stock ($.0001 par value; 140,000,000 shares authorized; 33,150,511 and 33,129,553 shares issued and outstanding at June 30, 2011 and December 31, 2010) |
3 | 3 | ||||||||||
| Common stock—additional paid-in-capital |
73,708 | 82,634 | ||||||||||
| Warrants—additional paid-in-capital |
3,698 | 4,820 | ||||||||||
| Accumulated deficit |
(49,554 | ) | (52,341 | ) | ||||||||
|
|
|
|
|
|
|
|||||||
| Total stockholders’ equity |
27,855 | 35,116 | ||||||||||
|
|
|
|
|
|
|
|||||||
| TOTAL LIABILITIES AND EQUITY |
$ | 403,949 | $ | 369,643 | $ | |||||||
|
|
|
|
|
|
|
|||||||
See notes to condensed consolidated financial statements.
F-68
Table of Contents
Renewable Energy Group, Inc. and Subsidiaries
CONDENSED CONSOLIDATED STATEMENTS OF OPERATIONS (Unaudited)
For the three and six months ended June 30, 2011 and 2010
(in thousands, except per share amounts)
| Three months 2011 |
Three months 2010 |
Six months 2011 |
Six months 2010 |
|||||||||||||
| Revenues: |
||||||||||||||||
| Biodiesel sales |
$ | 182,998 | $ | 45,290 | $ | 280,960 | $ | 76,885 | ||||||||
| Biodiesel sales—related parties |
1,349 | 879 | 3,461 | 2,259 | ||||||||||||
| Biodiesel government incentives |
11,926 | 22 | 16,266 | 3,674 | ||||||||||||
|
|
|
|
|
|
|
|
|
|||||||||
| 196,273 | 46,191 | 300,687 | 82,818 | |||||||||||||
| Services |
15 | 77 | 16 | 398 | ||||||||||||
| Services—related parties |
24 | 69 | 44 | 610 | ||||||||||||
|
|
|
|
|
|
|
|
|
|||||||||
| 196,312 | 46,337 | 300,747 | 83,826 | |||||||||||||
|
|
|
|
|
|
|
|
|
|||||||||
| Costs of goods sold: |
||||||||||||||||
| Biodiesel |
84,713 | 15,969 | 137,411 | 28,237 | ||||||||||||
| Biodiesel—related parties |
81,182 | 25,156 | 124,673 | 47,712 | ||||||||||||
| Services |
24 | 118 | 42 | 242 | ||||||||||||
| Services—related parties |
— | — | — | 291 | ||||||||||||
|
|
|
|
|
|
|
|
|
|||||||||
| 165,919 | 41,243 | 262,126 | 76,482 | |||||||||||||
|
|
|
|
|
|
|
|
|
|||||||||
| Gross Profit |
30,393 | 5,094 | 38,621 | 7,344 | ||||||||||||
| Selling, general, and administrative expenses (includes related party amounts of $394 and $703 for the three and six months ended June 30, 2011, respectively, and $454 and $814 for the three and six months ended June 30, 2010, respectively) |
7,812 | 5,731 | 14,090 | 10,817 | ||||||||||||
| Impairment of assets |
— | — | — | 141 | ||||||||||||
|
|
|
|
|
|
|
|
|
|||||||||
| Income (loss) from operations |
22,581 | (637 | ) | 24,531 | (3,614 | ) | ||||||||||
|
|
|
|
|
|
|
|
|
|||||||||
| Other income (expense), net: |
||||||||||||||||
| Change in fair value of preferred stock conversion feature embedded derivatives |
(19,645 | ) | 5,001 | (17,088 | ) | 5,001 | ||||||||||
| Change in fair value of interest rate swap |
166 | 116 | 332 | 188 | ||||||||||||
| Change in fair value of Seneca Holdco liability |
(2,250 | ) | (371 | ) | (1,523 | ) | (371 | ) | ||||||||
| Interest expense (includes related party amounts of $168 and $228 for the three and six months ended June 30, 2011, respectively, and $151 and $204 for the three and six months ended June 30, 2010, respectively) |
(1,751 | ) | (1,394 | ) | (3,459 | ) | (1,735 | ) | ||||||||
| Other income (includes related party amounts of $180 for the six months ended June 30, 2010) |
34 | 59 | 142 | 273 | ||||||||||||
| Impairment of investments |
— | (400 | ) | — | (400 | ) | ||||||||||
|
|
|
|
|
|
|
|
|
|||||||||
| (23,446 | ) | 3,011 | (21,596 | ) | 2,956 | |||||||||||
|
|
|
|
|
|
|
|
|
|||||||||
| Income (loss) before income taxes and loss from equity investments |
(865 | ) | 2,374 | 2,935 | (658 | ) | ||||||||||
| Income tax benefit (expense) |
— | (2,600 | ) | — | 3,728 | |||||||||||
| Loss from equity investments |
(83 | ) | (166 | ) | (148 | ) | (381 | ) | ||||||||
|
|
|
|
|
|
|
|
|
|||||||||
| Net income (loss) |
(948 | ) | (392 | ) | 2,787 | 2,689 | ||||||||||
|
|
|
|
|
|
|
|
|
|||||||||
(continued)
F-69
Table of Contents
Renewable Energy Group, Inc. and Subsidiaries
CONDENSED CONSOLIDATED STATEMENTS OF OPERATIONS (Unaudited)
For the three and six months ended June 30, 2011 and 2010
(in thousands, except per share amounts)
| Three months 2011 |
Three months 2010 |
Six months 2011 |
Six months 2010 |
|||||||||||||
| Effects of recapitalization |
— | — | — | 8,521 | ||||||||||||
| Accretion of preferred stock to redemption value |
(6,180 | ) | (5,178 | ) | (12,076 | ) | (16,246 | ) | ||||||||
| Less—undistributed dividends allocated to preferred stockholders |
(3,185 | ) | (2,926 | ) | (6,246 | ) | (4,073 | ) | ||||||||
|
|
|
|
|
|
|
|
|
|||||||||
| Net loss attributable to the company’s common stockholders |
$ | (10,313 | ) | $ | (8,496 | ) | $ | (15,535 | ) | $ | (9,109 | ) | ||||
|
|
|
|
|
|
|
|
|
|||||||||
| Net loss per share attributable to common stockholders: |
||||||||||||||||
| Basic |
$ | (0.31 | ) | $ | (0.28 | ) | $ | (0.47 | ) | $ | (0.34 | ) | ||||
|
|
|
|
|
|
|
|
|
|||||||||
| Diluted |
$ | (0.31 | ) | $ | (0.28 | ) | $ | (0.47 | ) | $ | (0.34 | ) | ||||
|
|
|
|
|
|
|
|
|
|||||||||
| Weighted average shares used to compute net loss per share attributable to common stockholders: |
||||||||||||||||
| Basic |
33,193,874 | 30,337,302 | 33,171,531 | 26,686,936 | ||||||||||||
|
|
|
|
|
|
|
|
|
|||||||||
| Diluted |
33,193,874 | 30,337,302 | 33,171,531 | 26,686,936 | ||||||||||||
|
|
|
|
|
|
|
|
|
|||||||||
See notes to condensed consolidated financial statements.
F-70
Table of Contents
Renewable Energy Group, Inc. and Subsidiaries
CONDENSED CONSOLIDATED STATEMENTS OF REDEEMABLE PREFERRED STOCK AND EQUITY (DEFICIT) (Unaudited)
For the six months ended June 30, 2011 and 2010 (In thousands, except share amounts)
|
|
|
Company stockholders’ equity |
|
|
||||||||||||||||||||||||||||||||
| Redeemable shares |
Redeemable preferred stock |
Common shares |
Common stock |
Common stock - capital |
Warrants - additional paid-in capital |
Accumulated deficit |
Noncontrolling interest |
Total | ||||||||||||||||||||||||||||
| BALANCE, December 31, 2009 |
12,464,357 | $ | 149,122 | 19,575,117 | $ | 2 | $ | 15,676 | $ | 4,619 | $ | (60,905 | ) | $ | 13,477 | $ | (27,131 | ) | ||||||||||||||||||
| Exchange of REG Holdco preferred stock, common stock, and common stock warrants |
(12,464,357 | ) | (158,475 | ) | (19,575,117 | ) | (2 | ) | (6,323 | ) | (4,619 | ) | — | — | (10,944 | ) | ||||||||||||||||||||
| Issuance of preferred stock, common stock, and common stock warrants to REG Holdco, net of $52,394 for embedded derivatives |
13,164,357 | 102,287 | 18,875,117 | 2 | 14,221 | 4,619 | — | — | 18,842 | |||||||||||||||||||||||||||
| Issuance of common stock in acquisitions |
— | — | 11,006,141 | 1 | 66,366 | — | — | — | 66,367 | |||||||||||||||||||||||||||
| Issuance of preferred stock in acquisitions, net of $1,158 for embedded derivatives |
291,165 | 2,263 | — | — | — | — | — | — | — | |||||||||||||||||||||||||||
| Issuance of warrants in acquisition |
— | — | — | — | — | 1,269 | — | — | 1,269 | |||||||||||||||||||||||||||
| Issuance of common stock |
— | — | 500,000 | — | 3,015 | — | — | — | 3,015 | |||||||||||||||||||||||||||
| Blackhawk Biofuels LLC deconsolidation transition adjustment |
— | — | — | — | 1,192 | — | 30,152 | (13,477 | ) | 17,867 | ||||||||||||||||||||||||||
| Stock compensation expense |
— | — | — | — | 68 | — | — | — | 68 | |||||||||||||||||||||||||||
| Accretion of preferred stock to redemption value |
— | 16,246 | — | — | (16,246 | ) | — | — | — | (16,246 | ) | |||||||||||||||||||||||||
| Net income |
— | — | — | — | — | — | 2,689 | — | 2,689 | |||||||||||||||||||||||||||
|
|
|
|
|
|
|
|
|
|
|
|
|
|
|
|
|
|
|
|||||||||||||||||||
| BALANCE, June 30, 2010 |
13,455,522 | $ | 111,443 | 30,381,258 | $ | 3 | $ | 77,969 | $ | 5,888 | $ | (28,064 | ) | $ | — | $ | 55,796 | |||||||||||||||||||
|
|
|
|
|
|
|
|
|
|
|
|
|
|
|
|
|
|
|
|||||||||||||||||||
| BALANCE, December 31, 2010 |
13,455,522 | $ | 122,436 | 33,129,553 | $ | 3 | $ | 82,634 | $ | 4,820 | $ | (52,341 | ) | $ | — | $ | 35,116 | |||||||||||||||||||
| Warrants exercised |
— | — | 20,958 | — | 128 | (80 | ) | — | — | 48 | ||||||||||||||||||||||||||
| Warrants expired |
— | — | — | — | 1,042 | (1,042 | ) | — | — | — | ||||||||||||||||||||||||||
| Stock compensation expense |
— | — | — | — | 1,980 | — | — | — | 1,980 | |||||||||||||||||||||||||||
| Accretion of preferred stock to redemption value |
— | 12,076 | — | — | (12,076 | ) | — | — | — | (12,076 | ) | |||||||||||||||||||||||||
| Net income |
— | — | — | — | — | — | 2,787 | — | 2,787 | |||||||||||||||||||||||||||
|
|
|
|
|
|
|
|
|
|
|
|
|
|
|
|
|
|
|
|||||||||||||||||||
| BALANCE, June 30, 2011 |
13,455,522 | $ | 134,512 | 33,150,511 | $ | 3 | $ | 73,708 | $ | 3,698 | $ | (49,554 | ) | $ | — | $ | 27,855 | |||||||||||||||||||
|
|
|
|
|
|
|
|
|
|
|
|
|
|
|
|
|
|
|
|||||||||||||||||||
See notes to condensed consolidated financial statements.
F-71
Table of Contents
Renewable Energy Group, Inc. and Subsidiaries
CONDENSED CONSOLIDATED STATEMENTS OF CASH FLOWS (Unaudited)
For the six months ended June 30, 2011 and 2010
(In thousands)
| Six months June 30, 2011 |
Six months June 30, 2010 |
|||||||
| Cash flows from operating activities: |
||||||||
| Net income |
$ | 2,787 | $ | 2,689 | ||||
| Adjustments to reconcile net income to net cash flows from operating activities: |
||||||||
| Depreciation expense |
3,394 | 2,230 | ||||||
| Amortization expense of assets and liabilities, net |
637 | 68 | ||||||
| Provision (benefit) for doubtful accounts |
595 | (45 | ) | |||||
| Stock compensation expense |
1,980 | 68 | ||||||
| Loss from equity method investees |
148 | 381 | ||||||
| Deferred tax benefit |
— | (3,728 | ) | |||||
| Impairment of investments |
— | 400 | ||||||
| Impairment of long lived assets |
— | 141 | ||||||
| Change in fair value of preferred stock conversion feature embedded derivatives |
17,088 | (5,001 | ) | |||||
| Change in fair value of Seneca Holdco liability |
1,223 | 371 | ||||||
| Distributions received from equity method investees |
— | 50 | ||||||
| Changes in asset and liabilities, net of effects from mergers and acquisitions: |
||||||||
| Accounts receivable |
(7,926 | ) | 8,211 | |||||
| Inventories |
(12,039 | ) | (527 | ) | ||||
| Prepaid expenses and other assets |
(6,688 | ) | (61 | ) | ||||
| Accounts payable |
12,074 | (5,357 | ) | |||||
| Accrued expenses and other liabilities |
1,376 | 3,485 | ||||||
| Deferred revenue |
(7,723 | ) | (5,480 | ) | ||||
|
|
|
|
|
|||||
| Net cash flows from operating activities |
6,926 | (2,105 | ) | |||||
|
|
|
|
|
|||||
| Cash flows from investing activities: |
||||||||
| Cash paid for purchase of property, plant and equipment |
(1,206 | ) | (2,064 | ) | ||||
| Proceeds from the sale of fixed assets |
— | 320 | ||||||
| Change in restricted cash |
397 | 152 | ||||||
| Consolidation of Bell, LLC |
22 | — | ||||||
| Deconsolidation of Blackhawk |
— | (206 | ) | |||||
| Cash provided through Blackhawk acquisition |
— | 1 | ||||||
| Cash provided through Central Iowa Energy acquisition |
— | 403 | ||||||
|
|
|
|
|
|||||
| Net cash flows from investing activities |
(787 | ) | (1,394 | ) | ||||
|
|
|
|
|
|||||
| Cash flows from financing activities: |
||||||||
| Borrowings on line of credit |
1,000 | — | ||||||
| Cash paid on notes payable |
(1,965 | ) | (614 | ) | ||||
| Cash proceeds from investment in Seneca Landlord |
— | 4,000 | ||||||
| Cash received upon exercise of warrants |
48 | — | ||||||
| Cash paid for pending issuance of common and preferred stock |
(283 | ) | — | |||||
| Cash paid for debt issuance costs |
(73 | ) | (457 | ) | ||||
|
|
|
|
|
|||||
| Net cash flows from financing activities |
(1,273 | ) | 2,929 | |||||
|
|
|
|
|
|||||
| Net change in cash and cash equivalents |
4,866 | (570 | ) | |||||
| Cash and cash equivalents, Beginning of period |
4,259 | 5,855 | ||||||
|
|
|
|
|
|||||
| Cash and cash equivalents, End of period |
$ | 9,125 | $ | 5,285 | ||||
|
|
|
|
|
|||||
(continued)
F-72
Table of Contents
Renewable Energy Group, Inc. and Subsidiaries
CONDENSED CONSOLIDATED STATEMENTS OF CASH FLOWS (Unaudited)
For the six months ended June 30, 2011 and 2010
(In thousands)
| Six Months June 30, 2011 |
Six Months June 30, 2010 |
|||||||
| Supplemental disclosures of cash flows information: |
||||||||
| Cash (received) paid for income taxes |
$ | (211 | ) | $ | 579 | |||
|
|
|
|
|
|||||
| Cash paid for interest |
$ | 2,553 | $ | 1,602 | ||||
|
|
|
|
|
|||||
| Supplemental disclosure of non-cash investing and financing activities: |
||||||||
| Effects of recapitalization |
$ | 8,521 | ||||||
|
|
|
|||||||
| Accretion of preferred stock to redemption value |
$ | 12,076 | $ | 16,246 | ||||
|
|
|
|
|
|||||
| Amounts included in period-end accounts payable for: |
||||||||
| Purchases of property, plant and equipment |
$ | 304 | $ | 412 | ||||
|
|
|
|
|
|||||
| Debt issuance costs |
$ | 5 | ||||||
|
|
|
|||||||
| Equity issuance costs |
$ | 856 | ||||||
|
|
|
|||||||
| Incentive common stock liability for supply agreement |
$ | 682 | ||||||
|
|
|
|||||||
| Removal of cost method investee as a result of consolidation |
$ | 1,000 | ||||||
|
|
|
|||||||
| Removal of equity method investee as a result of consolidation |
$ | 3,969 | ||||||
|
|
|
|||||||
| Issuance of common stock for debt financing cost |
$ | 3,015 | ||||||
|
|
|
|||||||
| Property, plant and equipment acquired through the assumption of liabilities |
$ | 36,650 | ||||||
|
|
|
|||||||
| Assets (liabilities) acquired through consolidation of 416 Bell, LLC |
||||||||
| Cash |
$ | 22 | ||||||
| Property, plant and equipment |
5,881 | |||||||
| Other noncurrent assets |
4 | |||||||
| Other current liabilities |
(17 | ) | ||||||
| Debt |
(4,757 | ) | ||||||
| Other noncurrent liabilities |
(567 | ) | ||||||
|
|
|
|||||||
| Removal of equity method investee as a result of consolidation |
$ | 566 | ||||||
|
|
|
|||||||
| Assets (liabilities) acquired through the issuance of stock: |
||||||||
| Cash |
$ | 404 | ||||||
| Restricted cash |
2,302 | |||||||
| Other current assets |
1,342 | |||||||
| Property, plant, and equipment |
87,406 | |||||||
| Goodwill |
69,059 | |||||||
| Other noncurrent assets |
231 | |||||||
| Line of credit |
(900 | ) | ||||||
| Other current liabilities |
(5,548 | ) | ||||||
| Debt |
(72,668 | ) | ||||||
| Other noncurrent liabilities |
(11,729 | ) | ||||||
|
|
|
|||||||
| $ | 69,899 | |||||||
|
|
|
|||||||
See notes to condensed consolidated financial statements.
(concluded)
F-73
Table of Contents
Renewable Energy Group, Inc. and Subsidiaries
NOTES TO THE CONDENSED CONSOLIDATED FINANCIAL STATEMENTS—Unaudited
For the three and six months ended June 30, 2011 and 2010
(In thousands, except share and per share amounts)
Note 1—Organization, Presentation, and Nature of The Business
The consolidated financial statements have been prepared by Renewable Energy Group, Inc. and its subsidiaries (the Company), without audit, pursuant to the rules and regulations of the U.S. Securities and Exchange Commission (SEC). Certain information and footnote disclosures normally included in annual financial statements prepared in accordance with accounting principles generally accepted in the United States of America (GAAP) have been condensed or omitted as permitted by such rules and regulations. All adjustments, consisting of normal recurring adjustments, have been included. Management believes that the disclosures are adequate to present fairly the financial position, results of operations and cash flows at the dates and for the periods presented. It is suggested that these interim financial statements be read in conjunction with the consolidated financial statements and the notes thereto appearing in the Company’s latest annual report on Form 10-K. Results for interim periods are not necessarily indicative of those to be expected for the fiscal year.
As of June 30, 2011, the Company owned biodiesel production facilities with a total of 182 million gallons per year (mmgy) of nameplate production capacity, which includes a 60 mmgy biodiesel facility in Seneca, Illinois leased by the Company from a consolidated Variable Interest Entity (VIE).
On February 26, 2010, the Company merged with Blackhawk Biofuels, LLC (Blackhawk) adding a biodiesel production facility with 45 mmgy of production capacity. On March 8, 2010 the Company acquired substantially all of the assets and liabilities of Central Iowa Energy, LLC (CIE) adding a biodiesel production facility with 30 mmgy of production capacity. On April 9, 2010 the Company entered into a series of agreements related to the asset purchase agreement with Nova Biofuels, Inc. (Nova) that resulted in the consolidation of a VIE, Seneca Landlord, LLC (Landlord). Landlord’s primary asset includes a biodiesel production facility with a 60 mmgy production capacity. On July 15, 2010, the Company acquired certain assets from Tellurian Biodiesel, Inc. (Tellurian) and American BDF, LLC (ABDF). ABDF was a joint venture owned by Golden State Service Industries, Restaurant Technologies, Inc. (RTI) and Tellurian. Finally, on September 21, 2010 the Company acquired substantially all of the assets of Clovis Biodiesel, LLC (Clovis) consisting primarily of a partially completed biodiesel production facility.
Prior to February 26, 2010, the Company refers to the business, results of operations and cash flows of REG Biofuels, Inc. (Biofuels), which is considered the accounting predecessor to the Company. For the period after February 26, 2010, the Company refers to the business, results of operations and cash flows of Renewable Energy Group, Inc. (formerly, REG Newco, Inc.) and its consolidated subsidiaries, including Biofuels, REG Danville, LLC (REG Danville) and REG Newton, LLC.
In 2007, the Company commenced construction of a 60 mmgy production capacity facility near New Orleans, Louisiana and a 60 mmgy production capacity facility in Emporia, Kansas. In 2008, the Company halted construction of these facilities as a result of conditions in the biodiesel industry and the credit markets. The Company continues to pursue financing and intends to finish the New Orleans, Louisiana facility, which is approximately 45% complete, and the facility in Emporia, Kansas, which is approximately 20% complete, when industry conditions improve and financing becomes available. The city incentive package for the Emporia construction project was renewed for an additional three years starting July 1, 2010. Additionally, as a result of halting construction, the Company performed an analysis to evaluate if the assets under construction were impaired. Based on the projected gross cash
F-74
Table of Contents
Renewable Energy Group, Inc. and Subsidiaries
NOTES TO THE CONDENSED CONSOLIDATED FINANCIAL STATEMENTS—Unaudited — (Continued)
For the three and six months ended June 30, 2011 and 2010
(In thousands, except share and per share amounts)
flows of the projects, the Company determined that no impairment has occurred. The Company continues to be in discussions with lenders in an effort to obtain financing for facilities under construction and capital improvement projects.
During 2007, the Company invested, through a wholly-owned subsidiary, in 416 South Bell, LLC (Bell, LLC), whereby the Company owns 50% of the outstanding units. Bell, LLC owns and leases to the Company its corporate office building located in Ames, Iowa. On January 1, 2011, the Company determined it was the primary beneficiary of Bell, LLC and consolidated Bell, LLC into the Company’s financial statements in accordance with ASC Topic 810, Consolidation (ASC Topic 810). See “Note 5—Variable Interest Entities” for a description of the consolidation.
As of June 30, 2011, the Company managed one other biodiesel production facility that was owned primarily by an independent investment group with an aggregate of 30 mmgy capacity. During July 2011, the Company completed its purchase of substantially all the assets of SoyMor Biodiesel, LLC and SoyMor Cooperative. See “Note 13—Subsequent Events” for a description of the transaction.
Note 2—Summary of Significant Accounting Policies
Basis of Consolidation
The accompanying condensed consolidated financial statements include the accounts of the Company, consolidated with the accounts of all of its subsidiaries and affiliates in which the Company holds a controlling financial interest as of the financial statement date. Normally, a controlling financial interest reflects ownership of a majority of the voting interests. Other factors considered in determining whether a controlling financial interest is held include whether the Company possesses the authority to purchase or sell assets or make other operating decisions that significantly affect the entity’s results of operations and whether the Company is the primary beneficiary of the economic benefits and financial risks of the entity. Intercompany accounts and transactions have been eliminated.
Pro Forma for Recapitalization
The pro forma balance sheet and earnings per share (EPS) gives effect to the one-time conversion of Series A Preferred Stock and certain common stock warrants into shares of newly-issued Common Stock and up to shares of $75,000 aggregate liquidation preference Series B Preferred Stock with cumulative dividends of 4.50% per annum. On June 30, 2015, each holder of Series B Preferred stock will have the right to require us to redeem its shares at the Redemption Price. At any time following the expiration of the underwriters’ lock-up period described under the section entitled “Underwriting”, in the prospectus, which we refer to as the lock-up expiration date, the holder of any shares of Series B Preferred Stock will have the right to convert such shares, together with accumulated and unpaid dividends (whether or not declared) into shares of Common Stock at the conversion rate in effect at such time. If, at any time following the lock-up expiration date, the closing sale price of the Common Stock exceeds certain pricing thresholds, then we may, at our option, cause up to all of the then outstanding shares of Series B Preferred Stock (and corresponding accumulated and unpaid dividends) to be converted into shares of our Common Stock at the then-applicable conversion rate.
F-75
Table of Contents
Renewable Energy Group, Inc. and Subsidiaries
NOTES TO THE CONDENSED CONSOLIDATED FINANCIAL STATEMENTS—Unaudited — (Continued)
For the three and six months ended June 30, 2011 and 2010
(In thousands, except share and per share amounts)
Accounts receivable
Accounts receivable are carried on a gross basis, less allowance for doubtful accounts. Management estimates the allowance for doubtful accounts based on existing economic conditions, the financial conditions of customers and the amount and age of past due accounts. Receivables are considered past due if full payment is not received by the contractual due date. Past due accounts are generally written off against the allowance for doubtful accounts only after reasonable collection attempts have been exhausted.
Inventories
Inventories consist of raw materials, work in process and finished goods and are valued at the lower of cost or market. Inventory values as of June 30, 2011 and December 31, 2010 include adjustments to reduce inventory to the lower of cost or market in the amount of $1 and $35, respectively. Cost is determined based on the first-in, first-out method.
Valuation of preferred stock conversion feature embedded derivatives
The Series A Preferred Stock terms provide for voluntary and, under certain circumstances, automatic conversion of the Series A Preferred Stock to Common Stock based on a prescribed formula. In addition, shares of Series A Preferred Stock are subject to redemption at the election of the holder beginning February 26, 2014. The redemption price is equal to the greater of (i) an amount equal to $13.75 per share of Series A Preferred Stock plus any and all accrued dividends, not to exceed $16.50 per share, or (ii) the fair market value of the Series A Preferred Stock. In accordance with ASC Topic 815, Derivatives and Hedging (ASC Topic 815), the Company is required to bifurcate and account for as a separate liability certain derivatives embedded in its contractual obligations. An “embedded derivative” is a provision within a contract, or other instrument, that affects some or all of the cash flows or the value of that contract, similar to a derivative instrument. Essentially, the embedded provision within the contract contains all of the attributes of a free-standing derivative, such as an underlying market variable, a notional amount or payment provision and can be settled “net,” but the contract, in its entirety, does not meet the ASC Topic 815 definition of a derivative.
The Company has determined that the conversion feature of the Series A Preferred Stock is an embedded derivative because the redemption feature allows the holder to redeem Series A Preferred Stock for cash at a price which can vary based on the fair market value of the Series A Preferred Stock, which effectively provides the holders with a mechanism to “net settle” the conversion option. Consequently, the embedded conversion option must be bifurcated and accounted for separately because the economic characteristics of this conversion option are not considered to be clearly and closely related to the economic characteristics of the Series A Preferred Stock, which is considered more akin to a debt instrument than equity.
Upon issuance of the Series A Preferred Stock, the Company recorded a liability representing the estimated fair value of the right of holders of the Series A Preferred Stock to receive the fair market value of the Common Stock issuable upon conversion of the Series A Preferred Stock on the redemption date. This liability is adjusted each quarter based on changes in the estimated fair value of such right, and a corresponding income or expense is recorded in change in fair value of the Series A Preferred Stock conversion feature embedded derivatives in the Company’s statements of operations.
F-76
Table of Contents
Renewable Energy Group, Inc. and Subsidiaries
NOTES TO THE CONDENSED CONSOLIDATED FINANCIAL STATEMENTS—Unaudited — (Continued)
For the three and six months ended June 30, 2011 and 2010
(In thousands, except share and per share amounts)
The Company uses the option pricing method to value the embedded derivative. The Company used the Black-Scholes options pricing model to estimate the fair value of the conversion option embedded in each series of Biofuels preferred stock prior to February 26, 2010 and the Series A Preferred Stock as of and subsequent to February 26, 2010. The Black-Scholes options pricing model requires the development and use of highly subjective assumptions. These assumptions include the expected volatility of the value of the Company’s equity, the expected conversion date, an appropriate risk-free interest rate and the estimated fair value of the Company’s equity. The expected volatility of the Company’s equity is estimated based on the volatility of the value of the equity of publicly traded companies in a similar industry and general stage of development as the Company. The expected term of the conversion option is based on the period remaining until the contractually stipulated redemption date of February 26, 2014. The risk-free interest rate is based on the yield on U.S. Treasury STRIPs with a remaining term equal to the expected term of the conversion option. The development of the estimated fair value of the Company’s equity is discussed below in “Valuation of the Company’s Equity.”
The significant assumptions utilized in the Company’s valuation of the embedded derivative are as follows:
| June 30, 2011 |
December 31, 2010 |
|||||||
| Expected volatility |
40.00 | % | 40.00 | % | ||||
| Risk-free rate |
4.10 | % | 4.10 | % | ||||
Valuation of Seneca Holdco liability
Associated with the Company’s transaction with Nova Biosource Fuels, LLC, the Company has the option to purchase (Call Option) and Seneca Holdco, LLC (Seneca Holdco) has the option to require the Company to purchase (Put Option) the membership interest of Landlord whose assets consist primarily of a biodiesel plant located in Seneca, Illinois. Both the Put Option and the Call Option have a term of seven years and are exercisable by either party at a price based on a pre-defined formula. The Company has determined the fair value of the amounts financed by Seneca Holdco, the Put Option and the Call Option using an option pricing model. The fair value represents the probability weighted present value of the gain, or loss, that is realized upon exercise of each option. The option pricing model requires the development and use of highly subjective assumptions. These assumptions include (i) the value of Landlord’s equity, (ii) expectations regarding future changes in the value of Landlord’s equity, (iii) expectations about the probability of either option being exercised, including the Company’s ability to list its securities on an exchange or complete a public offering and (iv) an appropriate risk-free rate. Company management considered current public equity markets, relevant regulatory issues, industry conditions and the Company’s position within the industry when estimating the probability that the Company will raise additional capital. Differences in the estimated probability and timing of this event may significantly impact the fair value assigned to the Seneca Holdco liability as management has determined it is not likely that the Put Option will become exercisable in the absence of this event.
F-77
Table of Contents
Renewable Energy Group, Inc. and Subsidiaries
NOTES TO THE CONDENSED CONSOLIDATED FINANCIAL STATEMENTS—Unaudited — (Continued)
For the three and six months ended June 30, 2011 and 2010
(In thousands, except share and per share amounts)
The significant assumptions utilized in the Company’s valuation of the Seneca Holdco liability are as follows:
| June 30, 2011 |
December 31, 2010 |
|||||||
| Expected volatility |
50.00 | % | 50.00 | % | ||||
| Risk-free rate |
2.05 | % | 2.45 | % | ||||
| Probability of IPO |
75.00 | % | 70.00 | % | ||||
Preferred stock accretion
Beginning October 1, 2007, the date that the Company determined that there was a more than remote likelihood that the then issued and outstanding preferred stock would become redeemable, the Company commenced accretion of the carrying value of the preferred stock over the period until the earliest redemption date, which is August 1, 2011, to the Biofuels preferred stock’s redemption value, plus accrued but unpaid dividends using the effective interest method. This determination was based upon the state of the public equity markets which was restricting the Company’s ability to execute a qualified public offering, the Company’s historical operating results and the volatility in the biodiesel industry which resulted in lower projected profitability. Prior to October 1, 2007, the Company had determined that it was not probable that the preferred stock would become redeemable; therefore, the carrying value was not adjusted in accordance with ASC Topic 480-10-S99, Classification and Measurement of Redeemable Securities (ASC Topic 480-10-S99).
On February 26, 2010, the date the Company determined that there was a more than remote likelihood that the Series A Preferred Stock would become redeemable, the Company commenced accretion of the carrying value of the Series A Preferred Stock over the period until the earliest redemption date (February 26, 2014) to the Series A Preferred Stock’s redemption value, plus accrued but unpaid dividends using the effective interest method. This determination was based on the state of the public equity markets at the time which was restricting the Company’s ability to execute a qualified public offering, the Company’s historical operating results and the volatility in the biodiesel industry which have resulted in lower projected profitability.
Accretion of $6,180 and $12,076 for the three and six months ended June 30, 2011, respectively, and $5,178 and $16,246 for the three and six months ended June 30, 2010, respectively, has been recognized as a reduction to income available to common stockholders in accordance with paragraph 15 of ASC Topic 480-10-S99.
Valuation of the company’s equity
The Company considered three generally accepted valuation approaches to estimate the fair value of the aggregate equity of the Company: the income approach, the market approach and the cost approach. Ultimately, the estimated fair value of the aggregate equity of the Company was developed using the Income Approach—Discounted Cash Flow (DCF) method.
Material underlying assumptions in the DCF analysis include the gallons produced and managed, gross margin per gallon, expected long-term growth rates and an appropriate discount rate. Gallons produced and managed as well as the gross margin per gallon were determined based on historical and forward-looking market data.
F-78
Table of Contents
Renewable Energy Group, Inc. and Subsidiaries
NOTES TO THE CONDENSED CONSOLIDATED FINANCIAL STATEMENTS—Unaudited — (Continued)
For the three and six months ended June 30, 2011 and 2010
(In thousands, except share and per share amounts)
The discount rate used in the DCF analysis is based on macroeconomic, industry and Company-specific factors and reflects the perceived degree of risk associated with realizing the projected cash flows. The selected discount rate represents the weighted average rate of return that a market participant investor would require on an investment in the Company’s debt and equity. The percent of total capital assumed to be comprised of debt and equity when developing the weighted average cost of capital was based on a review of the capital structures of the Company’s publicly traded industry peers. The cost of debt was estimated utilizing the adjusted average Baa-rated corporate bond rate during the previous 12 months representing a reasonable market participant rate based on the Company’s publicly traded industry peers. The Company’s cost of equity was estimated utilizing the capital asset pricing model, which develops an estimated market rate of return based on the appropriate risk-free rate adjusted for the risk of the alternative energy industry relative to the market as a whole, an equity risk premium and a company specific risk premium. The risk premiums included in the discount rate were based on historical and forward looking market data.
Discount rates utilized in the Company’s DCF model are as follows:
| June 30, 2011 |
December 31, 2010 |
|||||||
| Discount rate |
19.50 | % | 16.00 | % | ||||
Valuations derived from this model are subject to ongoing verification and review. Selection of inputs involves management’s judgment and may impact net income. This analysis is performed on a regular basis and takes into account factors that have changed from the last measurement date or the time of the last Common Stock issuance. Other factors affecting our assessment of price include recent purchases or sales of our Common Stock, if available.
Non-monetary exchanges
The Company records assets acquired and liabilities assumed through the exchange of non-monetary assets based on the fair value of the assets and liabilities acquired or the fair value of the consideration exchanged, whichever is more readily determinable.
Property, plant and equipment
Property, plant and equipment is recorded at cost, including applicable construction-period interest, less accumulated depreciation. Maintenance and repairs are expensed as incurred. Depreciation expense is computed on a straight-line method based upon estimated useful lives of the assets. Estimated useful lives are as follows:
| Automobiles and trucks |
5 years | |
| Computers and office equipment |
5 years | |
| Office furniture and fixtures |
7 years | |
| Machinery and equipment |
5-30 years | |
| Leasehold improvements |
the lesser of the lease term or 30 years | |
| Buildings and improvements |
30-40 years |
F-79
Table of Contents
Renewable Energy Group, Inc. and Subsidiaries
NOTES TO THE CONDENSED CONSOLIDATED FINANCIAL STATEMENTS—Unaudited — (Continued)
For the three and six months ended June 30, 2011 and 2010
(In thousands, except share and per share amounts)
Goodwill
The Company accounts for goodwill in accordance with ASC Topic 350, Intangibles—Goodwill and Other. Goodwill is reviewed for impairment by reporting unit annually on July 31 or between annual periods when management believes impairment indicators exist. If the carrying value of the reporting unit goodwill is considered impaired, a loss is recognized based on the amount by which the carrying value exceeds the fair market value of the reporting unit goodwill. Fair value is determined using a discounted cash flow methodology involving a significant level of judgment in the assumptions used. Changes to the Company’s strategy or market conditions could significantly impact these judgments and require adjustments to recorded amounts of goodwill. There was no impairment of goodwill recorded in the periods presented.
Impairment of assets
The Company reviews long-lived assets, including property, plant and equipment and definite-lived assets, for impairment in accordance with ASC Topic 360, Property, Plant and Equipment. Asset impairment charges are recorded for long-lived assets and intangible assets subject to amortization when events and circumstances indicate that such assets may be impaired and the undiscounted net cash flows estimated to be generated by those assets are less than their carrying amounts. If estimated future undiscounted cash flows are not sufficient to recover the carrying value of the assets, an impairment charge is recorded for the amount by which the carrying amount of the assets exceeds its fair value. Fair value is determined by management estimates using discounted cash flow calculations.
The Company impaired capitalized expenses related to various capital investment projects. There were no asset impairment charges for the six months ended June 30, 2011. Asset impairment charges of $141 were recorded for the six months ended June 30, 2010.
Other noncurrent assets
Other noncurrent assets include costs related to the issuance of debt, spare parts inventory and a raw material supply agreement. The debt issuance costs are amortized to interest expense over the life of the related debt agreement. The supply agreement is amortized over the term of the agreement according to the volume of feedstock used in operation.
Revenue recognition
The Company recognizes revenues from the following sources:
| · | the sale of biodiesel and its co-products, as well as Renewable Identification Numbers (RINs) and raw material feedstocks, purchased by us or produced by us at owned and leased manufacturing facilities and manufacturing facilities with which we have tolling arrangements |
| · | fees received under toll manufacturing agreements with third parties |
| · | fees received from federal and state incentive programs for renewable fuels |
| · | fees received for the marketing and sales of biodiesel produced by third parties and from managing operations of third party facilities |
F-80
Table of Contents
Renewable Energy Group, Inc. and Subsidiaries
NOTES TO THE CONDENSED CONSOLIDATED FINANCIAL STATEMENTS—Unaudited — (Continued)
For the three and six months ended June 30, 2011 and 2010
(In thousands, except share and per share amounts)
Biodiesel and raw material feedstock revenues are recognized where there is persuasive evidence of an arrangement, delivery has occurred, the price has been fixed or is determinable and collectability can be reasonably assured.
Fees received under toll manufacturing agreements with third parties are generally established as an agreed upon amount per gallon of biodiesel produced. The fees are recognized where there is persuasive evidence of an arrangement, delivery has occurred, the price has been fixed or is determinable and collectability can be reasonably assured.
Revenues associated with the governmental incentive programs are recognized when the amount to be received is determinable, collectability is reasonably assured and the sale of product giving rise to the incentive has been recognized.
Fees for managing ongoing operations of third party plants, marketing biodiesel produced by third party plants and from other services are recognized as services are provided. The Company also has performance based incentive agreements that are included as management service revenues. These performance incentives are recognized as revenues when the amount to be received is determinable and collectability is reasonably assured.
During 2010, the Company acted as a sales agent for certain third parties, thus the Company recognized these revenues on a net basis in accordance with ASC Topic 605-45, Revenue Recognition (ASC Topic 605-45).
Stock-based compensation
The Company has two stock incentive plans. Eligible award recipients are employees, non-employee directors and advisors who provide service to the Company. The Company accounted for stock-based compensation in accordance with ASC Topic 718, Stock Compensation (ASC Topic 718). Compensation expense of $990 and $1,980 for the three and six months ended June 30, 2011, respectively, and $32 and $68 for the three and six months ended June 30, 2010, respectively, was recorded for stock options and restricted stock units awarded to employees and non-employee directors in return for services. Compensation expense is measured at the grant-date fair value of the award and recognized as compensation expense over the vesting period.
Income taxes
The Company recognizes deferred taxes by the asset and liability method. Under this method, deferred income taxes are recognized for differences between the financial statement and tax bases of assets and liabilities at enacted statutory tax rates in effect for the years in which differences are expected to reverse. The effect on deferred taxes of a change in tax rates is recognized in income in the period that includes the enactment date. In addition, the carrying amount of deferred tax assets are reviewed to determine whether the establishment of a valuation allowance is necessary. If it is more-likely-than-not that all or a portion of the Company’s deferred tax assets will not be realized, based on all available evidence, a deferred tax valuation allowance would be established. Consideration is given to positive and negative evidence related to the realization of the deferred tax assets. Judgment is required in making this assessment.
F-81
Table of Contents
Renewable Energy Group, Inc. and Subsidiaries
NOTES TO THE CONDENSED CONSOLIDATED FINANCIAL STATEMENTS—Unaudited — (Continued)
For the three and six months ended June 30, 2011 and 2010
(In thousands, except share and per share amounts)
In evaluating the available evidence, the Company considers, among other factors, historical financial performance, expectation of future earnings, length of statutory carry forward periods, experience with operating loss and tax credit carry forwards not expiring unused, tax planning strategies and timing of reversals of temporary differences. The Company concluded that recent historical book and tax losses that result in cumulative losses represent negative evidence that cannot be overcome by positive and objectively verifiable evidence. Based on this evaluation, the Company concluded a valuation allowance was required. As of June 30, 2011 and December 31, 2010, respectively, the Company had net deferred income tax assets of $31,177 and $39,220 with an offsetting valuation allowance of $29,677 and $37,720, which resulted in a net deferred tax asset of $1,500 and $1,500. The net amount is offset by an accrued liability for uncertain tax benefits in the amount of $1,500 as of June 30, 2011 and December 31, 2010.
Loss Per Share
Basic and diluted net loss per common share are presented in conformity with the two-class method required for participating securities. The two-class method includes an earnings allocation formula that determines earnings for each class of common stock according to dividends declared and undistributed earnings for the period.
The holders of the Series A Preferred Stock accrue dividends at the rate of $0.88 per share per annum. Dividends are cumulative, accrue on a daily basis from the date of issuance and compound annually from the date of issuance. If dividends on the Series A Preferred Stock have not been paid or declared, the deficiency shall be paid or declared before any dividend is declared for Common Stock. Dividends in arrears do not bear interest. Holders of the Series A Preferred Stock are allowed to participate in the dividends to common stockholders in the event that dividends on Common Stock exceed that of the Series A Preferred Stock as if the Series A Preferred Stock had been converted to Common Stock at the beginning of the year.
The Company calculates the effects of the convertible Series A Preferred Stock on diluted EPS under the if-converted method unless the conversion of the convertible preferred stock is anti-dilutive to basic EPS. The effects of Common Stock options, warrants and restricted stock units on diluted EPS are calculated using the treasury stock method unless the effects are anti-dilutive to EPS.
The following potentially dilutive weighted average securities were excluded from the calculation of diluted net loss per share attributable to common stockholders during the periods presented as the effect was anti-dilutive:
| Three Months Ended June 30, 2011 |
Three Months Ended June 30, 2010 |
Six Months Ended June 30, 2011 |
Six Months Ended June 30, 2010 |
|||||||||||||
| Options to purchase common stock |
218,143 | 2,208,492 | 218,478 | 2,208,522 | ||||||||||||
| Restricted stock units |
2,885,113 | — | 2,885,168 | — | ||||||||||||
| Warrants to purchase common stock |
981,241 | 1,313,359 | 1,017,829 | 1,209,427 | ||||||||||||
| Redeemable preferred shares |
13,455,522 | 13,455,522 | 13,455,522 | 13,140,107 | ||||||||||||
|
|
|
|
|
|
|
|
|
|||||||||
| Total |
17,540,019 | 16,977,373 | 17,576,997 | 16,558,056 | ||||||||||||
|
|
|
|
|
|
|
|
|
|||||||||
F-82
Table of Contents
Renewable Energy Group, Inc. and Subsidiaries
NOTES TO THE CONDENSED CONSOLIDATED FINANCIAL STATEMENTS—Unaudited — (Continued)
For the three and six months ended June 30, 2011 and 2010
(In thousands, except share and per share amounts)
Unaudited Pro Forma Net Income (Loss) Per Share
Pro forma basic diluted net income (loss) per share were computed to give effect to (i) the conversion of the Series A Preferred Stock and the exchange of certain common stock warrants into shares of Common Stock and $75,000 aggregate liquidation preference Series B Preferred Stock with cumulative dividends of 4.50% per annum using the if-converted method and (ii) the issuance of certain shares of Common Stock pursuant into the termination agreement relating to the glycerin option agreement with USRG Holdco IX, LLC, as though the conversion, exchange and issuance, which are both contingent upon the completion of this offering, had occurred as of the beginning of the period.
The following table presents the calculation of basic and diluted pro forma net income per share (in thousands, except share and per share data):
| Three Months Ended June 30, 2011 |
Six Months Ended June 30, 2011 |
|||||||
| Net loss attributable to the company’s common stockholders: |
$ | (10,313 | ) | $ | (15,535 | ) | ||
| Plus: undistributed dividends allocated to preferred stockholders |
3,185 | 6,246 | ||||||
| Plus: accretion of preferred stock to redemption value |
6,180 | 12,076 | ||||||
| Plus: (gain) loss due to change in fair value of Series A preferred stock conversion feature embedded derivative |
19,645 | 17,088 | ||||||
| Less: dividends on Series B preferred stock |
||||||||
| Less: effects of recapitalization |
||||||||
|
|
|
|
|
|||||
| Unaudited pro forma net income attributable to the Companies stockholders |
$ | $ | ||||||
|
|
|
|
|
|||||
| Basic shares: |
||||||||
| Weighted-average shares used to compute basic net income (loss) per share |
33,193,874 | 33,171,531 | ||||||
| Pro forma adjustment to reflect assumed conversion of Series A preferred stock to occur upon consummation of the Company’s expected initial public offering |
||||||||
| Pro forma adjustment to reflect assumed conversion of warrants to occur upon consummation of the company’s expected initial public offering |
||||||||
| Pro forma adjustment to reflect issuance of common stock pursuant to the termination agreement related to the glycerin option agreement |
||||||||
|
|
|
|
|
|||||
| Weighted-average shares used to compute basic pro forma net income (loss) per share |
||||||||
|
|
|
|
|
|||||
| Pro forma net income per share attributable to common stockholders |
||||||||
| Basic |
||||||||
|
|
|
|
|
|||||
| Diluted |
||||||||
|
|
|
|
|
|||||
F-83
Table of Contents
Renewable Energy Group, Inc. and Subsidiaries
NOTES TO THE CONDENSED CONSOLIDATED FINANCIAL STATEMENTS—Unaudited — (Continued)
For the three and six months ended June 30, 2011 and 2010
(In thousands, except share and per share amounts)
Use of estimates
The preparation of financial statements in conformity with GAAP requires management to make estimates and assumptions that affect the reported amounts of assets and liabilities, disclosure of contingent assets and liabilities at the dates of the financial statements and reported amounts of revenues and expenses during the reporting periods. These estimates are based on information that is currently available to management and on various assumptions that the Company believes to be reasonable. Actual results could differ from those estimates.
New accounting pronouncements
In January 2010, the FASB issued Accounting Standards Update (ASU) No. 2010-06, Fair Value Measurements and Disclosures (ASU 2010-06), which amends ASC Topic 820, adding new requirements for disclosures for Levels 1 and 2, separate disclosures of purchases, sales issuances and settlements related to Level 3 measurements and clarification of existing fair value disclosures. ASU 2010-06 is in effect for interim and annual periods beginning after December 15, 2009, except for the requirement to provide Level 3 activity of purchases, sales, issuances and settlements on a gross basis, which was effective for the interim period beginning January 1, 2011. The adoption of this guidance did not have a material effect on the Company’s financial statements. See “Note 10—Fair Value Measurement”.
Note 3—Stockholders’ Equity of the Company
Common Stock
On February 26, 2010, the Company filed its restated certificate of incorporation with the Secretary of State of Delaware. The restated certificate of incorporation authorized 140,000,000 shares of Common Stock at a par value of $0.0001 per share.
Each holder of Common Stock is entitled to one vote for each share of Common Stock held on all matters submitted to a vote of stockholders. Subject to preferences that may apply to shares of outstanding Series A Preferred Stock as outlined below, the holders of outstanding shares of Common Stock are entitled to receive dividends. After the payment of all preferential amounts required to the holders of Series A Preferred Stock, all of the remaining assets of the Company available for distribution shall be distributed ratably among the holders of Common Stock.
Common Stock Warrants
Under the Company’s outstanding warrants, the holder may purchase the number of shares of Common Stock underlying each warrant held for a purchase price ranging from $4.47 to $11.00 per share. The warrant holder may “net exercise” the warrants and use the common shares received upon exercise of the warrants outstanding as the consideration for payment of the exercise price.
The warrant holders are generally protected from anti-dilution by adjustments for any stock dividends, stock split, combination or other recapitalization.
During June 2011, certain warrant holders exercised 20,958 warrants to purchase common shares and 270,176 warrants expired during the month without being exercised.
F-84
Table of Contents
Renewable Energy Group, Inc. and Subsidiaries
NOTES TO THE CONDENSED CONSOLIDATED FINANCIAL STATEMENTS—Unaudited — (Continued)
For the three and six months ended June 30, 2011 and 2010
(In thousands, except share and per share amounts)
Note 4—Redeemable Preferred Stock
The Company’s restated certificate of incorporation filed on February 26, 2010 authorizes 60,000,000 shares of preferred stock, including 14,000,000 shares of Series A preferred stock, with a par value of $0.0001. The Company’s Board of Directors has discretion, subject to the approval of certain shareholders, as to the designation of voting rights, dividend rights, redemption price, liquidation preference and other provisions of each issuance.
Dividend Provisions
The holders of the Series A Preferred Stock accrue dividends at the rate of $0.88 per share per annum. Dividends are cumulative, accrue on a daily basis from the date of issuance and compound annually from the date of issuance. If dividends on the Series A Preferred Stock have not been paid or declared, the deficiency shall be paid or declared before any dividend is declared for Common Stock. Dividends in arrears do not bear interest. Holders of the Series A Preferred Stock are allowed to participate in the dividends to common stockholders in the event that dividends on Common Stock exceed that of the Series A Preferred Stock as if the Series A Preferred Stock had been converted to Common Stock at the beginning of the year. Holders of at least seventy-five percent of the outstanding shares of the Series A Preferred Stock that were issued (Preferred Supermajority) may vote to waive the timing or amount of any dividend payment. The Company has not declared any dividends on the Series A Preferred Stock outstanding. There were $16,273 and $10,027 of the Series A Preferred Stock dividends in arrears as of June 30, 2011 and December 31, 2010, respectively.
Liquidation Rights
Upon the occurrence of a voluntary or involuntary liquidation (including consolidations, mergers or sale of assets as defined by the preferred stock agreement), if the remaining net assets of the Company are sufficient, the holders of the Series A Preferred Stock shall be paid no less than liquidation value plus all dividends in arrears (whether or not declared), out of the assets of the Company legally available for distribution to its stockholders, before any payment or distribution is made to any holders of Common Stock.
If upon any liquidation or dissolution, the remaining net assets of the Company are insufficient to pay the amount that the Series A Preferred Stock holders are due as indicated above, the holders of Series A Preferred Stock will share ratably in any distribution of the remaining assets of the Company.
Conversion Rights
All shares of the Series A Preferred Stock will be converted into shares of Common Stock at a 1 to 1 conversion ratio:
| a) | upon a closing of the sale of shares of Common Stock at a level at or exceeding $22.00, in a Qualified Public Offering (QPO), requiring aggregate proceeds to the Company of at least $40 million, or |
| b) | if specified in a written contract or agreement of the Preferred Supermajority, or |
| c) | if the shares of Common Stock have a closing price on NASDAQ or any national securities exchange in excess of $24.75 per share for ninety (90) consecutive trading days with an average daily trading volume on such trading days of at least US $8,000. |
F-85
Table of Contents
Renewable Energy Group, Inc. and Subsidiaries
NOTES TO THE CONDENSED CONSOLIDATED FINANCIAL STATEMENTS—Unaudited — (Continued)
For the three and six months ended June 30, 2011 and 2010
(In thousands, except share and per share amounts)
Voting Rights
Each holder of the Series A Preferred Stock is entitled to the number of votes equal to the number of shares of Common Stock into which the Series A Preferred Stock held by such holder are convertible.
Additionally, the Company is prohibited, without obtaining the approval of the Preferred Supermajority, from performing certain activities including, but not limited to, amending shareholder agreements, redeeming or purchasing any outstanding shares of the Company, declaring dividends, making certain capital expenditures and merging or consolidating with other entities.
Redemption Rights
On or after February 26, 2014, the Preferred Supermajority may require that the Company redeem all or part of the issued and outstanding shares of the Series A Preferred Stock out of funds lawfully available; provided, however, that any such redemptions equal in the aggregate $5,000. The redemption price is the greater of the fair market value per share at the date of the redemption election or $13.75 per share of the Series A Preferred Stock, plus accrued and unpaid preferred stock dividends, not to exceed $16.50 per share.
Note 5—Variable Interest Entities
In June 2009, the FASB amended its guidance on accounting for VIEs through the issuance of ASU No. 2009-17. The new accounting guidance resulted in a change in our accounting policy effective January 1, 2010. Among other things, the new guidance requires a qualitative analysis to determine the primary beneficiary of a VIE, requires continuous assessments of whether an enterprise is the primary beneficiary of a VIE and amends certain guidance for determining whether an entity is a VIE. Under the new guidance, a VIE must be consolidated if the enterprise has both (a) the power to direct the activities of the VIE that most significantly impact the entity’s economic performance and (b) the obligation to absorb losses or the right to receive benefits from the VIE that could potentially be significant to the VIE. This new accounting guidance was effective for the Company on January 1, 2010 and was applied prospectively.
The Company has invested in four plants owned by independent investment groups. Those companies are SoyMor Biodiesel, LLC (SoyMor), Western Iowa Energy, LLC (WIE), Western Dubuque Biodiesel, LLC (WDB) and East Fork Biodiesel, LLC (EFB). During 2010, the Company impaired the remaining investment balance in EFB. See “Note 7—Investments” for the investment amounts and the related condensed financial information of these investments. The Company evaluated each investment and determined we do not hold an interest in any of our investments in third party network plants that would give us the power to direct the activities that most significantly impact the economic performance of the network plant. As a result, the Company is not the primary beneficiary and does not consolidate these VIE’s. During July 2011, the Company completed its purchase of substantially all the assets of SoyMor. See “Note 13—Subsequent Events” for a description of the transaction.
F-86
Table of Contents
Renewable Energy Group, Inc. and Subsidiaries
NOTES TO THE CONDENSED CONSOLIDATED FINANCIAL STATEMENTS—Unaudited — (Continued)
For the three and six months ended June 30, 2011 and 2010
(In thousands, except share and per share amounts)
The carrying values and maximum exposure for all unconsolidated VIE’s are as follows:
| June 30, 2011 | December 31, 2010 | |||||||||||||||
| Investment: | Investments | Maximum exposure |
Investments | Maximum exposure |
||||||||||||
| SoyMor |
$ | 964 | $ | 977 | $ | 1,107 | $ | 1,119 | ||||||||
| WIE |
576 | 576 | 576 | 576 | ||||||||||||
| WDB |
2,005 | 2,005 | 2,005 | 2,005 | ||||||||||||
| Bell, LLC |
— | — | 571 | 2,949 | ||||||||||||
|
|
|
|
|
|
|
|
|
|||||||||
| $ | 3,545 | $ | 3,558 | $ | 4,259 | $ | 6,649 | |||||||||
|
|
|
|
|
|
|
|
|
|||||||||
On April 8, 2010, the Company determined that Landlord was a VIE and was consolidated into the Company’s financial statements as it is the primary beneficiary. The Company has a put/call option with Seneca Holdco to purchase Landlord and currently leases the plant for production of biodiesel, both of which represent a variable interest in Landlord that are significant to the VIE. Although the Company does not have an ownership interest in Seneca Holdco, it was determined that the Company is the primary beneficiary due to the related party nature of the entities involved, the Company’s ability to direct the activities that most significantly impact Landlord’s economic performance and the design of Landlord that ultimately gives the Company the majority of the benefit from the use of Seneca’s assets. The Company has elected the fair value option available under ASC Topic 825 on the $4,000 investment made by Seneca Holdco and the associated put /call option (the Seneca Holdco liability). Changes in the fair value after the date of the transaction are recorded in earnings. Those assets are owned by, and those liabilities are obligations of, Landlord, not the Company.
The Company has 50% ownership in Bell, LLC, a VIE joint venture that owns and leases to the Company its corporate office building in Ames, Iowa. Commencing January 1, 2011, the Company has the right to execute a call option with the joint venture member, Dayton Park, LLC, to purchase Bell, LLC; therefore, the Company determined it was the primary beneficiary of Bell, LLC and consolidated Bell, LLC into the Company’s financial statements. The Company is the primary beneficiary due to its ownership interest and having an exercisable call option that allows the Company to direct the activities that most significantly impact Bell, LLC’s economic performance and gives the Company the majority of the benefit from the use of Bell, LLC’s assets. Through consolidation of Bell, LLC on January 1, 2011, the Company had an outstanding promissory note balance of $4,757 with interest accrued monthly at a rate of 5.7% per annum, with a maturity date of February 15, 2013. The note is secured by a mortgage interest in the office building.
F-87
Table of Contents
Renewable Energy Group, Inc. and Subsidiaries
NOTES TO THE CONDENSED CONSOLIDATED FINANCIAL STATEMENTS—Unaudited — (Continued)
For the three and six months ended June 30, 2011 and 2010
(In thousands, except share and per share amounts)
The following table summarizes the fair values of the assets and liabilities recorded by the Company as a result of the consolidation of Bell, LLC:
| Final allocation at January 1, 2011 |
||||
| Assets/(liabilities) acquired: |
||||
| Cash |
$ | 22 | ||
| Property, plant and equipment |
5,881 | |||
| Noncurrent assets |
4 | |||
| Other current liabilities |
(17 | ) | ||
| Debt |
(4,757 | ) | ||
| Other noncurrent liabilities |
(567 | ) | ||
|
|
|
|||
| Carrying value of previously held equity method investment |
$ | 566 | ||
|
|
|
|||
Note 6—Inventories
Inventories consist of the following:
| June 30, 2011 |
December 31, 2010 |
|||||||
| Raw materials |
$ | 16,062 | $ | 7,297 | ||||
| Work in process |
891 | 281 | ||||||
| Finished goods |
24,071 | 21,407 | ||||||
|
|
|
|
|
|||||
| Total |
$ | 41,024 | $ | 28,985 | ||||
|
|
|
|
|
|||||
Note 7—Investments
Investments consist of the following:
| June 30, 2011 | December 31, 2010 | |||||||||||||||
| Ownership | Balance | Ownership | Balance | |||||||||||||
| Investment and accumulated earnings in: |
||||||||||||||||
| SoyMor(a) |
9 | % | $ | 964 | 9 | % | $ | 1,107 | ||||||||
| WIE(b) |
2 | % | 576 | 2 | % | 576 | ||||||||||
| WDB(c) |
8 | % | 2,005 | 8 | % | 2,005 | ||||||||||
| Bell, LLC(d) |
— | 50 | % | 571 | ||||||||||||
|
|
|
|
|
|||||||||||||
| Total(e) |
$ | 3,545 | $ | 4,259 | ||||||||||||
|
|
|
|
|
|||||||||||||
| (a) | During July 2011, the Company completed its purchase of substantially all the assets of SoyMor. See “Note 13—Subsequent Events” for a description of the transaction. |
| (b) | As of May 2010, the accounting method for this investment changed from equity method to cost method due to the Company no longer having the ability to significantly influence the operations of WIE. |
F-88
Table of Contents
Renewable Energy Group, Inc. and Subsidiaries
NOTES TO THE CONDENSED CONSOLIDATED FINANCIAL STATEMENTS—Unaudited — (Continued)
For the three and six months ended June 30, 2011 and 2010
(In thousands, except share and per share amounts)
| (c) | As of August 2010, the accounting method for this investment was changed from equity method to cost method due to the Company no longer having the ability to significantly influence the operations of WDB. |
| (d) | As of January 1, 2011, the Company consolidated Bell, LLC. Due to the consolidation, the investment was eliminated. |
| (e) | The investments include deferred tax assets of $942 as of June 30, 2011 and December 31, 2010, respectively, fully offset by a valuation allowance. |
The condensed financial information of equity method investments is as follows:
| June 30, 2011 |
December 31, 2010 |
|||||||
| Condensed balance sheet: |
||||||||
| Total current assets |
$ | 142 | $ | 352 | ||||
|
|
|
|
|
|||||
| Total noncurrent assets |
$ | 16,479 | $ | 23,407 | ||||
|
|
|
|
|
|||||
| Total current liabilities |
$ | 468 | $ | 585 | ||||
|
|
|
|
|
|||||
| Total noncurrent liabilities |
$ | 657 | $ | 5,270 | ||||
|
|
|
|
|
|||||
| Three Months ended June 30, 2011 |
Three Months ended June 30, 2010 |
Six Months ended June 30, 2011 |
Six Months ended June 30, 2010 |
|||||||||||||
| CONDENSED STATEMENT OF OPERATIONS: |
||||||||||||||||
| Sales |
$ | — | $ | 2,667 | $ | — | $ | 6,378 | ||||||||
| Costs of goods sold |
— | (123 | ) | — | (5,201 | ) | ||||||||||
| Operating and other expenses |
(837 | ) | (3,746 | ) | (1,545 | ) | (5,274 | ) | ||||||||
|
|
|
|
|
|
|
|
|
|||||||||
| Net loss |
$ | (837 | ) | $ | (1,202 | ) | $ | (1,545 | ) | $ | (4,097 | ) | ||||
|
|
|
|
|
|
|
|
|
|||||||||
F-89
Table of Contents
Renewable Energy Group, Inc. and Subsidiaries
NOTES TO THE CONDENSED CONSOLIDATED FINANCIAL STATEMENTS—Unaudited — (Continued)
For the three and six months ended June 30, 2011 and 2010
(In thousands, except share and per share amounts)
Note 8—Related Party Transactions
Related parties include certain investors as well as entities in which the company has an equity method investment or an investment combined with a MOSA or board seat. Investors defined as related parties include (i) the investor having ten percent or more ownership, including convertible preferred stock, in the Company or (ii) the investor holding a board seat on the Company’s Board of Directors.
Summary of related party transactions
| Three Months ended June 30, 2011 |
Three Months ended June 30, 2010 |
Six Months ended June 30, 2011 |
Six Months ended June 30, 2010 |
|||||||||||||||||||||||
| Revenues—Biodiesel sales |
$ | 1,349 | (a) | $ | 879 | (a) | $ | 3,461 | (a) | $ | 2,259 | (a) | ||||||||||||||
| Revenues—Services |
$ | 24 | (b) | $ | 69 | (b) | $ | 44 | (b) | $ | 610 | (b) | ||||||||||||||
| Cost of goods sold—Biodiesel |
$ | 81,182 | (c) | $ | 25,156 | (c) | $ | 124,673 | (c) | $ | 47,712 | (c) | ||||||||||||||
| Cost of goods sold—Services |
$ | — | (d) | $ | — | (d) | $ | — | (d) | $ | 291 | (d) | ||||||||||||||
| Selling, general, and administrative expenses |
$ | 394 | (e) | $ | 454 | (e) | $ | 703 | (e) | $ | 814 | (e) | ||||||||||||||
| Interest expense |
$ | 168 | (f) | $ | 151 | (f) | $ | 228 | (f) | $ | 204 | (f) | ||||||||||||||
| Interest income |
$ | — | (g) | $ | — | (g) | $ | — | (g) | $ | 180 | (g) | ||||||||||||||
| (a) |
Represents transactions with related parties as follows: |
|||||||||||||||||||||||||
| West Central |
$ | 1 | $ | 3 | $ | 3 | $ | 5 | ||||||||||||||||||
| E D & F Man |
1,348 | 876 | 1,358 | 2,254 | ||||||||||||||||||||||
| Bunge |
— | — | 2,100 | — | ||||||||||||||||||||||
|
|
|
|
|
|
|
|
|
|||||||||||||||||||
| $ | 1,349 | $ | 879 | $ | 3,461 | $ | 2,259 | |||||||||||||||||||
|
|
|
|
|
|
|
|
|
|||||||||||||||||||
| (b) |
Represents transactions with Third Party Network Plants |
|||||||||||||||||||||||||
| (c) |
Represents transactions with related parties as follows: |
|||||||||||||||||||||||||
| West Central |
$ | 13,292 | $ | 511 | $ | 24,271 | $ | 6,446 | ||||||||||||||||||
| Third Party Network plants |
— | — | — | 1,493 | ||||||||||||||||||||||
| Bunge |
60,201 | 24,645 | 91,746 | 39,773 | ||||||||||||||||||||||
| E D & F Man |
7,689 | — | 8,656 | — | ||||||||||||||||||||||
|
|
|
|
|
|
|
|
|
|||||||||||||||||||
| $ | 81,182 | $ | 25,156 | $ | 124,673 | $ | 47,712 | |||||||||||||||||||
|
|
|
|
|
|
|
|
|
|||||||||||||||||||
| (d) |
Represents transactions with Third Party Network Plants |
|||||||||||||||||||||||||
| (e) |
Represents transactions with related parties as follows: |
|||||||||||||||||||||||||
| West Central |
$ | 29 | $ | 47 | $ | 70 | $ | 93 | ||||||||||||||||||
| 416 S. Bell, LLC |
— | 86 | — | 172 | ||||||||||||||||||||||
| Bunge |
365 | 272 | 633 | 472 | ||||||||||||||||||||||
| E D & F Man |
— | 49 | — | 77 | ||||||||||||||||||||||
|
|
|
|
|
|
|
|
|
|||||||||||||||||||
| $ | 394 | $ | 454 | $ | 703 | $ | 814 | |||||||||||||||||||
|
|
|
|
|
|
|
|
|
|||||||||||||||||||
| (f) |
Represents transactions with related parties as follows: |
|||||||||||||||||||||||||
| West Central |
$ | 35 | $ | 32 | $ | 65 | $ | 77 | ||||||||||||||||||
| Bunge |
133 | 119 | 163 | 127 | ||||||||||||||||||||||
|
|
|
|
|
|
|
|
|
|||||||||||||||||||
| $ | 168 | $ | 151 | $ | 228 | $ | 204 | |||||||||||||||||||
|
|
|
|
|
|
|
|
|
|||||||||||||||||||
| (g) |
Represents transactions with Blackhawk Biofuels |
|||||||||||||||||||||||||
F-90
Table of Contents
Renewable Energy Group, Inc. and Subsidiaries
NOTES TO THE CONDENSED CONSOLIDATED FINANCIAL STATEMENTS—Unaudited — (Continued)
For the three and six months ended June 30, 2011 and 2010
(In thousands, except share and per share amounts)
Summary of related party balances
| As
of June 30, 2011 |
As of December 31, 2010 |
|||||||||||||||||
| Accounts receivable | $ | 234 | (a | ) | $ | 1,146 | (a | ) | ||||||||||
| Accounts payable | $ | 13,265 | (b | ) | $ | 3,827 | (b | ) | ||||||||||
| (a) |
Represents balances with related parties as follows: | |||||||||||||||||
| West Central | $ | 20 | $ | 22 | ||||||||||||||
| Third Party Network Plants | 18 | 12 | ||||||||||||||||
| Bunge | — | 46 | ||||||||||||||||
| E D & F Man | 196 | 1,066 | ||||||||||||||||
|
|
|
|
|
|||||||||||||||
| $ | 234 | $ | 1,146 | |||||||||||||||
|
|
|
|
|
|||||||||||||||
| (b) |
Represents balances with related parties as follows: | |||||||||||||||||
| West Central | $ | 2,566 | $ | 2,539 | ||||||||||||||
| Third Party Network Plants | — | 2 | ||||||||||||||||
| Bunge | 10,399 | 1,286 | ||||||||||||||||
| E D & F Man | 300 | — | ||||||||||||||||
|
|
|
|
|
|||||||||||||||
| $ | 13,265 | $ | 3,827 | |||||||||||||||
|
|
|
|
|
|||||||||||||||
West Central Cooperative
The Company purchases once-refined soybean oil from West Central Cooperative (West Central) and is required to pay interest for amounts owed on extended trade terms. The Company also had biodiesel and co-product sales.
West Central leases the land under the Company’s production facility at Ralston, Iowa to the Company at an annual cost of one dollar. The Company is responsible for the property taxes, insurance, utilities and repairs for the facility relating to this lease. The lease has an initial term of twenty years and the Company has options to renew the lease for an additional thirty years.
At the time of the signing of the contribution agreement, the Company executed an asset use agreement with West Central to provide for the use of certain assets, such as office space, maintenance equipment and utilities. The agreement requires the Company to pay West Central its proportionate share of certain costs incurred by West Central. This agreement has the same term as the land lease.
At the time of the signing of the contribution agreement, the Company entered into a contract for services with West Central, to provide certain corporate and administrative services such as human resources, information technology and accounting. The agreement requires the Company to pay West Central the proportionate share of the costs associated with the provision of services, plus a 15% margin. The agreement had an initial one-year term and is cancellable thereafter upon six months notice by either party.
F-91
Table of Contents
Renewable Energy Group, Inc. and Subsidiaries
NOTES TO THE CONDENSED CONSOLIDATED FINANCIAL STATEMENTS—Unaudited — (Continued)
For the three and six months ended June 30, 2011 and 2010
(In thousands, except share and per share amounts)
Bunge North America
The Company purchases feedstocks from Bunge North America, Inc. (Bunge) for the production of biodiesel. The costs associated with the purchased feedstocks are reflected in costs of goods sold – biodiesel when sold to the end customer. The Company also made sales of biodiesel and raw materials to Bunge.
During July 2009, the Company entered into an agreement for Bunge to provide services related to the procurement of raw materials and the purchase and resale of biodiesel produced by the Company. The Company is required to pay interest for the aggregate outstanding amounts owed to Bunge. The agreement has a three-year term and either party has the ability to cancel the agreement after the term ends. Also, as part of the agreement, the Company is required to pay an incentive fee to Bunge for meeting certain hedging goals utilizing Bunge’s advice.
E D & F Man Holdings Ltd.
In August 2006, at the time of the initial closing of its preferred stock investment, the Company entered into a glycerin marketing agreement and various terminal lease agreements with one of E D & F Man Holdings Ltd’s (E D & F) then wholly-owned subsidiaries, Westway Feed Products, Inc. (Westway). Under the glycerin marketing agreement, Westway has an exclusive right to market the glycerin produced at each of the Company’s owned and managed facilities into the animal nutrition market. This contract has a term of five years and automatically renews in one-year periods thereafter unless terminated by either party.
The Company also entered into a tolling agreement with E D & F for biodiesel to be produced out of the Company’s Houston, Texas biodiesel production facility. Additionally, the Company purchased biodiesel from E D & F.
Third Party Network Plants
The Company receives certain fees for the marketing and sale of product produced by and the management of Third Party Network Plants’ operations, in which the Company has also invested. As an additional incentive to the Company and additional compensation for the marketing, sales and management services being rendered, the Third Party Network Plant pays a bonus to the Company on an annual basis equal to a percentage of the net income of the Third Party Network Plant, as defined by the management agreement. As of June 30, 2011, the Company managed one other biodiesel production facility owned primarily by an independent investment group with an aggregate of 30 mmgy capacity. During July 2011, the Company completed its purchase of substantially all the assets of SoyMor. See “Note 13—Subsequent Events” for a description of the transaction.
Bell, LLC
The Company rents a building for administrative uses under an operating lease from Bell, LLC.
Note 9—Derivative Instruments
The Company has entered into derivatives to hedge its exposure to price risk related to feedstock inventory and biodiesel finished goods inventory. Additionally, the Company has entered into an interest
F-92
Table of Contents
Renewable Energy Group, Inc. and Subsidiaries
NOTES TO THE CONDENSED CONSOLIDATED FINANCIAL STATEMENTS—Unaudited — (Continued)
For the three and six months ended June 30, 2011 and 2010
(In thousands, except share and per share amounts)
rate swap with the objective of managing risk caused by fluctuations in interest rates associated with the REG Danville note payable. The Company does not enter into derivative transactions for trading purposes.
These derivative contracts are accounted for in accordance with ASC Topic 815. ASC Topic 815 requires that an entity recognize and record all derivatives on the balance sheet at fair value. All of the Company’s derivatives are designated as non-hedge derivatives and are utilized to manage cash flow. Although the contracts may be effective economic hedges of specified risks, they are not designated as, nor accounted for, as hedging instruments. Unrealized gains and losses on commodity futures, swaps and options contracts used to hedge feedstock purchases or biodiesel inventory are recognized as a component of biodiesel costs of goods sold reflected in current results of operations. Commodity hedge gains and losses are generally offset by other corresponding changes in gross margin through changes in either biodiesel sales price and/or feedstock price. Unrealized gains and losses on the interest rate swap are recorded in change in fair value of interest rate swap in the Company’s statements of operations. ASC 815 requires all derivative financial instruments to be recorded on the balance sheet at fair value. The Company’s derivatives are not designated as hedges and are utilized to manage cash flow. The changes in fair value of the derivative instruments are recorded through earnings in the period of change.
As of June 30, 2011, the Company has entered into heating oil and soybean oil derivative instruments and an interest rate swap agreement. The Company has entered into heating oil and soybean oil commodity-based derivatives in order to protect gross profit margins from potentially adverse effects of price volatility on biodiesel sales where the prices are set at a future date. As of June 30, 2011, the Company had 1,253 open commodity contracts. In addition, the Company manages interest rate risk associated with the REG Danville variable interest rate note payable using a fixed rate swap. The interest rate swap agreement had outstanding notional values of $19,515 and $20,747 as of June 30, 2011 and December 31, 2010, respectively. The agreement effectively fixes the variable component of the interest rate on the Term Loan at 3.67% through November 2011. The fair value of the interest rate swap agreement was $280 and $612 at June 30, 2011 and December 31, 2010, respectively, and is recorded in accrued expense and other liabilities and other noncurrent liabilities, respectively. The interest rate swap was not designated as an accounting hedge under ASC Topic 815 and thus all gains and losses are recorded currently in earnings.
REG Danville’s interest rate swap contains a credit support arrangement that is directly linked to the notes payable with the same counterparty. Therefore, the interest rate swap counterparty would have access to the debt service fund or other collateral posted by REG Danville as a result of any failure to perform under the interest rate swap agreement. As of June 30, 2011 and December 31, 2010, the Company posted $4,377 and $2,119, respectively, of collateral associated with its commodity-based derivatives with a net liability position of $572 and $483, respectively.
The Company’s preferred stock embedded conversion feature is further discussed in “Note 2—Summary of Significant Accounting Policies”.
F-93
Table of Contents
Renewable Energy Group, Inc. and Subsidiaries
NOTES TO THE CONDENSED CONSOLIDATED FINANCIAL STATEMENTS—Unaudited — (Continued)
For the three and six months ended June 30, 2011 and 2010
(In thousands, except share and per share amounts)
The following tables provide details regarding the Company’s derivative financial instruments:
| As of December 31, 2010 |
||||||||||||
| Asset Derivatives |
Liability Derivatives |
|||||||||||
| Balance sheet location |
Fair value |
Balance sheet location |
Fair value |
|||||||||
| Embedded derivative | Preferred stock embedded conversion feature derivatives |
$ | 61,761 | |||||||||
| Interest rate swap |
Other liabilities | 612 | ||||||||||
| Commodity swaps |
Prepaid expenses and other assets | $ | 78 | Prepaid expenses and other assets |
561 | |||||||
|
|
|
|
|
|||||||||
| Total derivatives |
$ | 78 | $ | 62,934 | ||||||||
|
|
|
|
|
|||||||||
| As of June 30, 2011 |
||||||||||||
| Asset Derivatives |
Liability Derivatives |
|||||||||||
| Balance sheet location |
Fair value |
Balance sheet location |
Fair value |
|||||||||
| Embedded derivative |
Preferred stock embedded conversion feature derivatives |
$ | 78,849 | |||||||||
| Interest rate swap |
Other liabilities | 280 | ||||||||||
| Commodity swaps |
Prepaid expenses and other assets | $ | 1,220 | Prepaid expenses and other assets |
1,766 | |||||||
| Commodity options |
Prepaid expenses and other assets | 227 | Prepaid expenses and other assets |
253 | ||||||||
|
|
|
|
|
|||||||||
| Total derivatives |
$ | 1,447 | $ | 81,148 | ||||||||
|
|
|
|
|
|||||||||
F-94
Table of Contents
Renewable Energy Group, Inc. and Subsidiaries
NOTES TO THE CONDENSED CONSOLIDATED FINANCIAL STATEMENTS—Unaudited — (Continued)
For the three and six months ended June 30, 2011 and 2010
(In thousands, except share and per share amounts)
| Three months ended June 30, 2011 |
Three months ended June 30, 2010 |
Six months ended June 30, 2011 |
Six months ended June 30, 2010 |
|||||||||||||||
| Location of gain (loss) recognized in income |
Amount of recognized in income on derivatives |
Amount of in income on derivatives |
Amount
of derivatives |
Amount of recognized in income on derivatives |
||||||||||||||
| Embedded derivative |
Change in fair value of preferred stock conversion feature embedded derivatives | $ | (19,645 | ) | $ | 5,001 | $ | (17,088 | ) | $ | 5,001 | |||||||
| Interest rate swap |
Change in fair value of interest rate swap | 166 | 116 | 332 | 188 | |||||||||||||
| Commodity futures |
Cost of goods sold—Biodiesel | (87 | ) | — | (87 | ) | — | |||||||||||
| Commodity swaps |
Cost of goods sold—Biodiesel | 1,293 | 704 | (2,503 | ) | 498 | ||||||||||||
| Commodity options |
Cost of goods sold—Biodiesel | 466 | — | 525 | — | |||||||||||||
|
|
|
|
|
|
|
|
|
|||||||||||
| Total |
$ | (17,807 | ) | $ | 5,821 | $ | (18,821 | ) | $ | 5,687 | ||||||||
|
|
|
|
|
|
|
|
|
|||||||||||
Note 10—Fair Value Measurement
ASC Topic 820 establishes a framework for measuring fair value in GAAP and expands disclosures about fair market value measurements. ASC Topic 820 clarifies that fair value is an exit price, representing the amount that would be received to sell an asset or paid to transfer a liability in an orderly transaction between market participants. As such, fair value is a market-based measurement that should be determined based on assumptions that market participants would use in pricing an asset or liability. As a basis for considering assumptions, ASC Topic 820 establishes a three-tier fair value hierarchy, which prioritizes the inputs used in measuring fair value as follows:
| · | Level 1—Quoted prices for identical instruments in active markets. |
| · | Level 2—Quoted prices for similar instruments in active markets, quoted prices for identical or similar instruments in markets that are not active and model-derived valuations, in which all significant inputs are observable in active markets. |
| · | Level 3—Unobservable inputs in which there is little or no market data, which require the reporting entity to develop its own assumptions. |
In addition, ASC Topic 820 requires disclosures about the use of fair value to measure assets and liabilities to enable the assessment of inputs used to develop fair value measures, and for unobservable inputs, to determine the effects of the measurements on earnings.
F-95
Table of Contents
Renewable Energy Group, Inc. and Subsidiaries
NOTES TO THE CONDENSED CONSOLIDATED FINANCIAL STATEMENTS—Unaudited — (Continued)
For the three and six months ended June 30, 2011 and 2010
(In thousands, except share and per share amounts)
A summary of assets (liabilities) measured at fair value as of December 31, 2010 and June 30, 2011 is as follows:
| As of December 31, 2010 | ||||||||||||||||
| Total | Level 1 | Level 2 | Level 3 | |||||||||||||
| Preferred stock embedded derivatives |
$ | (61,761 | ) | $ | — | $ | — | $ | (61,761 | ) | ||||||
| Interest rate swap |
(612 | ) | — | (612 | ) | — | ||||||||||
| Seneca Holdco liability |
(10,406 | ) | — | — | (10,406 | ) | ||||||||||
| Restricted cash |
401 | 401 | — | — | ||||||||||||
| Commodity derivatives |
(483 | ) | — | (483 | ) | — | ||||||||||
|
|
|
|
|
|
|
|
|
|||||||||
| $ | (72,861 | ) | $ | 401 | $ | (1,095 | ) | $ | (72,167 | ) | ||||||
|
|
|
|
|
|
|
|
|
|||||||||
| As of June 30, 2011 | ||||||||||||||||
| Total | Level 1 | Level 2 | Level 3 | |||||||||||||
| Preferred stock embedded derivatives |
$ | (78,849 | ) | $ | — | $ | — | $ | (78,849 | ) | ||||||
| Interest rate swap |
(280 | ) | — | (280 | ) | — | ||||||||||
| Seneca Holdco liability |
(11,629 | ) | — | — | (11,629 | ) | ||||||||||
| Cash and cash equivalents |
312 | 312 | — | — | ||||||||||||
| Restricted cash |
2,008 | 2,008 | — | — | ||||||||||||
| Commodity swaps |
(546 | ) | — | (546 | ) | — | ||||||||||
| Commodity options |
(26 | ) | — | (26 | ) | — | ||||||||||
|
|
|
|
|
|
|
|
|
|||||||||
| $ | (89,010 | ) | $ | 2,320 | $ | (852 | ) | $ | (90,478 | ) | ||||||
|
|
|
|
|
|
|
|
|
|||||||||
F-96
Table of Contents
Renewable Energy Group, Inc. and Subsidiaries
NOTES TO THE CONDENSED CONSOLIDATED FINANCIAL STATEMENTS—Unaudited — (Continued)
For the three and six months ended June 30, 2011 and 2010
(In thousands, except share and per share amounts)
The following is a reconciliation of the beginning and ending balances for liabilities measured at fair value on a recurring basis using significant unobservable inputs (Level 3) during the six months ended June 30, 2011 and 2010:
| Preferred stock embedded derivatives |
Seneca holdco liability |
Blackhawk subordinated debt |
Blackhawk unit interest |
|||||||||||||
| Ending balance—December 31, 2009 |
$ | (4,104 | ) | $ | — | $ | — | $ | — | |||||||
| Total unrealized gains (losses) |
— | — | — | — | ||||||||||||
| Deconsolidation of Blackhawk |
— | — | 24,298 | 3,678 | ||||||||||||
| Purchases, issuance, and settlements, net |
(49,448 | ) | — | — | 291 | |||||||||||
| Purchase accounting consolidation |
— | — | (24,298 | ) | (3,969 | ) | ||||||||||
|
|
|
|
|
|
|
|
|
|||||||||
| Ending balance—March 31, 2010 |
(53,552 | ) | — | — | — | |||||||||||
| Total unrealized gains (losses) |
5,001 | (371 | ) | — | — | |||||||||||
| Purchases, issuance, and settlements, net |
— | — | — | — | ||||||||||||
| Purchase accounting consolidation |
(1 | ) | (7,096 | ) | — | — | ||||||||||
|
|
|
|
|
|
|
|
|
|||||||||
| Ending balance—June 30, 2010 |
$ | (48,552 | ) | $ | (7,467 | ) | $ | — | $ | — | ||||||
|
|
|
|
|
|
|
|
|
|||||||||
| Ending balance—December 31, 2010 |
$ | (61,761 | ) | $ | (10,406 | ) | $ | — | $ | — | ||||||
| Total unrealized gains |
2,557 | 727 | — | — | ||||||||||||
| Purchases |
— | — | — | — | ||||||||||||
| Issuance |
— | — | — | — | ||||||||||||
| Settlements |
— | 150 | — | — | ||||||||||||
|
|
|
|
|
|
|
|
|
|||||||||
| Ending balance—March 31, 2011 |
(59,204 | ) | (9,529 | ) | — | — | ||||||||||
| Total unrealized gains |
(19,645 | ) | (2,250 | ) | — | — | ||||||||||
| Purchases |
— | — | — | — | ||||||||||||
| Issuance |
— | — | — | — | ||||||||||||
| Settlements |
— | 150 | — | — | ||||||||||||
|
|
|
|
|
|
|
|
|
|||||||||
| Ending balance—June 30, 2011 |
$ | (78,849 | ) | $ | (11,629 | ) | $ | — | $ | — | ||||||
|
|
|
|
|
|
|
|
|
|||||||||
The company used the following methods and assumptions to estimate fair value of its financial instruments:
Valuation of Preferred Stock embedded conversion feature derivatives: The estimated fair value of the derivative instruments embedded in the Company’s outstanding preferred stock is determined using the option pricing method to allocate the fair value of the underlying stock to the various components comprising the security, including the embedded derivative. The allocation was performed based on each class of preferred stock’s liquidation preference and relative seniority. Derivative liabilities are adjusted to reflect fair value at each period end. The effects of interactions between embedded derivatives are calculated and accounted for in arriving at the overall fair value of the financial instruments.
Interest rate swap: The fair value of the interest rate swap was determined based on a discounted cash flow approach using market observable swap curves.
F-97
Table of Contents
Renewable Energy Group, Inc. and Subsidiaries
NOTES TO THE CONDENSED CONSOLIDATED FINANCIAL STATEMENTS—Unaudited — (Continued)
For the three and six months ended June 30, 2011 and 2010
(In thousands, except share and per share amounts)
Restricted cash: This instrument consists of money market mutual funds whose fair value is based on quoted prices of identical assets in an active exchange-traded market and are reflected in Level 1.
Commodity derivatives: The instruments held by the Company consist primarily of futures contracts, swap agreements, purchased put options and written call options. The fair value of contracts based on quoted prices of identical assets in an active exchange-traded market is reflected in Level 1. Contracts whose fair value is determined based on quoted prices of similar contracts in over-the-counter markets are reflected in Level 2.
Seneca Holdco liability: The liability represents the combination of the Call Option and the Put Option related to the purchase of the membership interest of Landlord. The fair value of the Seneca Holdco liability is determined using an option pricing model and represents the probability weighted present value of the gain that is realized upon exercise of each option.
Notes payable and lines of credit: The fair value of long-term debt and lines of credit was established using discounted cash flow calculations and current market rates.
The estimated fair values of the Company’s financial instruments, which are not recorded at fair value, are as follows:
| June 30, 2011 | December 31, 2010 | |||||||||||||||
| Asset (liability) carrying amount |
Fair value | Asset (liability) carrying amount |
Fair value | |||||||||||||
| Financial Liabilities: |
||||||||||||||||
| Notes payable and lines of credit |
$ | (99,917 | ) | $ | (100,133 | ) | $ | (96,125 | ) | $ | (96,228 | ) | ||||
Note 11—Segments
The Company reports its operating segments based on services provided to customers, which include Biodiesel, Services and Corporate and other activities. The accounting policies of the segments are the same as those described in the summary of significant accounting policies. The Company has chosen to differentiate the segments based on the products and services each segment offers.
The Biodiesel segment processes waste vegetable oils, inedible animal fats, virgin vegetable oils and other feedstocks and methanol into biodiesel. The Biodiesel segment also includes the Company’s purchases and resale of biodiesel and raw material feedstocks produced by third parties. Revenue is derived from the sale of the processed biodiesel, fees from toll manufacturing arrangements, related byproducts, RINs and renewable energy government incentive payments. The Services segment offers services for managing the construction of biodiesel production facilities and managing ongoing operations of third party plants and collects fees related to the services provided. The Company does not allocate items that are of a non-operating nature or corporate expenses to the business segments. Intersegment revenues are reported by the Services segment, which manages the construction and operations of facilities included in the Biodiesel segment. Revenues are recorded by the Services segment at cost. Corporate expenses consist of corporate office expenses including compensation, benefits, occupancy and other administrative costs, including management service expenses.
F-98
Table of Contents
Renewable Energy Group, Inc. and Subsidiaries
NOTES TO THE CONDENSED CONSOLIDATED FINANCIAL STATEMENTS—Unaudited — (Continued)
For the three and six months ended June 30, 2011 and 2010
(In thousands, except share and per share amounts)
The following table represents the significant items by segment for the results of operations for the three and six months ended June 30, 2011 and 2010 and as of June 30, 2011 and December 31, 2010:
| Three months ended June 30, 2011 |
Three months ended June 30, 2010 |
Six months ended June 30, 2011 |
Six months ended June 30, 2010 |
|||||||||||||
| Revenues: |
||||||||||||||||
| Biodiesel |
$ | 196,273 | $ | 46,191 | $ | 300,687 | $ | 82,818 | ||||||||
| Services |
1,792 | 890 | 3,916 | 2,538 | ||||||||||||
| Intersegment revenues |
(1,753 | ) | (744 | ) | (3,856 | ) | (1,530 | ) | ||||||||
|
|
|
|
|
|
|
|
|
|||||||||
| $ | 196,312 | $ | 46,337 | $ | 300,747 | $ | 83,826 | |||||||||
|
|
|
|
|
|
|
|
|
|||||||||
| Income (loss) before income taxes and loss from equity investments: |
||||||||||||||||
| Biodiesel |
$ | 30,378 | $ | 5,066 | $ | 38,603 | $ | 6,869 | ||||||||
| Services |
15 | 28 | 18 | 475 | ||||||||||||
| Corporate and other (a) |
(31,258 | ) | (2,720 | ) | (35,686 | ) | (8,002 | ) | ||||||||
|
|
|
|
|
|
|
|
|
|||||||||
| $ | (865 | ) | $ | 2,374 | $ | 2,935 | $ | (658 | ) | |||||||
|
|
|
|
|
|
|
|
|
|||||||||
| Depreciation and amortization expense: |
||||||||||||||||
| Biodiesel |
$ | 1,702 | $ | 1,373 | $ | 3,716 | $ | 2,298 | ||||||||
| Services |
1 | — | 1 | — | ||||||||||||
| Corporate and other |
314 | — | 314 | — | ||||||||||||
|
|
|
|
|
|
|
|
|
|||||||||
| $ | 2,017 | $ | 1,373 | $ | 4,031 | $ | 2,298 | |||||||||
|
|
|
|
|
|
|
|
|
|||||||||
| Purchases of property, plant, and equipment: |
||||||||||||||||
| Biodiesel |
$ | 255 | $ | 2,003 | $ | 992 | $ | 2,064 | ||||||||
| Services |
33 | — | 33 | — | ||||||||||||
| Corporate and other |
181 | — | 181 | — | ||||||||||||
|
|
|
|
|
|
|
|
|
|||||||||
| $ | 469 | $ | 2,003 | $ | 1,206 | $ | 2,064 | |||||||||
|
|
|
|
|
|
|
|
|
|||||||||
| June 30, 2011 |
December 31, 2010 |
|||||||||||||||
| Goodwill: |
||||||||||||||||
| Biodiesel |
$ | 68,784 | $ | 68,784 | ||||||||||||
| Services |
16,080 | 16,080 | ||||||||||||||
|
|
|
|
|
|||||||||||||
| $ | 84,864 | $ | 84,864 | |||||||||||||
|
|
|
|
|
|||||||||||||
| Assets: |
||||||||||||||||
| Biodiesel |
$ | 323,080 | $ | 310,021 | ||||||||||||
| Services |
20,788 | 20,799 | ||||||||||||||
| Corporate and other (b) |
60,081 | 38,823 | ||||||||||||||
|
|
|
|
|
|||||||||||||
| $ | 403,949 | $ | 369,643 | |||||||||||||
|
|
|
|
|
|||||||||||||
F-99
Table of Contents
Renewable Energy Group, Inc. and Subsidiaries
NOTES TO THE CONDENSED CONSOLIDATED FINANCIAL STATEMENTS—Unaudited — (Continued)
For the three and six months ended June 30, 2011 and 2010
(In thousands, except share and per share amounts)
| (a) | Corporate and other includes income/(expense) not associated with the business segments, such as corporate general and administrative expenses, shared service expenses, interest expense and interest income, all reflected on an accrual basis of accounting. |
| (b) | Corporate and other includes cash and other assets not associated with the business segments, including investments. |
Note 12—Commitments And Contingencies
During July 2009 the Company entered into a series of agreements with one of its shareholders, Bunge, whereby Bunge would purchase raw material inputs for later resale to the Company and use in producing biodiesel. Additionally, the agreements provide for Bunge to purchase biodiesel produced by the Company for resale to the Company’s customers. These agreements provide financing for the Company’s raw material and finished goods inventory not to exceed aggregate amounts outstanding of $10,000. In exchange for this financing, Bunge will receive fees equal to the greater of 30 day LIBOR plus 7.5% or 10% as determined based on the amount of inventory financed, plus a monthly service fee of $40 and incentive fees not to exceed $1,500 per annum. As of June 30, 2011 and December 31, 2010, there was $245 and $280, respectively, in incentive fees due to Bunge.
The Company is involved in legal proceedings in the normal course of business. The Company currently believes that any ultimate liability arising out of such proceedings will not have a material effect on the Company’s financial position, results of operations or cash flows.
The Company was in compliance with all restrictive financial covenants associated with its borrowings as of June 30, 2011.
Note 13—Subsequent Events
The Company has performed an evaluation of subsequent events through the date the financial statements were issued.
On July 12, 2011, the Company and REG Albert Lea, LLC (REG Albert Lea), a subsidiary of the Company, completed its asset acquisition of SoyMor Cooperative and SoyMor Biodiesel, LLC (collectively known as SoyMor Assets). Pursuant to the Asset Purchase Agreement, dated June 8, 2011, the Company issued 1,850,000 shares of its Common Stock in exchange for the transfer of substantially all of the SoyMor Assets and assumed certain liabilities. The assets of SoyMor consisted primarily of a 30 mmgy nameplate capacity biodiesel facility located in Albert Lea, Minnesota, as well as, a co-located soy lecithin production facility. Of the 1,850,000 shares issued, REG will own 166,139 shares due to its original investment in SoyMor Biodiesel, LLC.
On July 15, 2011, holders of the Company’s Series A Preferred Stock approved a second amended and restated certificate of incorporation, to be effective immediately prior to the completion of the Company’s proposed initial public offering, to, among other things, convert and redeem the Company’s outstanding Series A Preferred Stock for a combination of Common Stock, Series B preferred stock and a contingent cash payment.
F-100
Table of Contents
Renewable Energy Group, Inc. and Subsidiaries
NOTES TO THE CONDENSED CONSOLIDATED FINANCIAL STATEMENTS—Unaudited — (Continued)
For the three and six months ended June 30, 2011 and 2010
(In thousands, except share and per share amounts)
On July 18, 2011, the Company issued a press release pursuant to Rule 134 under the Securities Act of 1933, as amended, announcing the filing of its registration statement on Form S-1 with the Securities and Exchange Commission for the purposes of an initial public offering.
On August 4, 2011, REG Albert Lea entered into a Loan Agreement with USRG Holdco IX, LLC (“USRG”) and USRG Management Company, LLC, under which USRG agreed to loan REG Albert Lea $10 million (the “Loan”) for the purpose of purchasing feedstocks and chemicals for REG Albert Lea’s biodiesel production facility located in Freeborn County, Minnesota. The Loan is secured by the assets and operations of the facility.
F-101
Table of Contents

Table of Contents
Part II
Information not required in prospectus
Item 13. Other Expenses of Issuance and Distribution
The following table sets forth the various expenses expected to be incurred by Renewable Energy Group, Inc. (the “Registrant”) in connection with the sale and distribution of the securities being registered hereby, other than underwriting discounts and commissions. All amounts are estimated except the United States Securities and Exchange Commission, or SEC, registration fee and the Financial Industry Regulatory Authority filing fee.
| SEC registration fee |
$ | 11,610 | ||
| Financial Industry Regulatory Authority filing fee |
$ | 10,500 | ||
| Initial listing fee |
* | |||
| Accounting fees and expenses |
* | |||
| Legal fees and expenses |
* | |||
| Printing and engraving expenses |
* | |||
| Registrar and Transfer Agent’s fees |
* | |||
| Blue Sky fees and expenses |
* | |||
| Miscellaneous fees and expenses |
* | |||
|
|
|
|||
| Total |
$ | * |
| * | To be filed by amendment |
Item 14. Indemnification of Directors and Officers
Section 102 of the Delaware General Corporation Law, or DGCL, allows a corporation to eliminate the personal liability of directors of a corporation to the corporation or its stockholders for monetary damages for breach of fiduciary duty as a director, except where the director breached the duty of loyalty, failed to act in good faith, engaged in intentional misconduct or knowingly violated a law, authorized the payment of a dividend or approved a stock repurchase in violation of the DGCL or obtained an improper personal benefit.
Section 145 of the DGCL provides, among other things, that we may indemnify any person who was or is a party or is threatened to be made a party to any threatened, pending or completed action, suit or proceeding—other than an action by or in the right of the Registrant—by reason of the fact that the person is or was a director, officer, agent or employee of the Registrant, or is or was serving at our request as a director, officer, agent or employee of another corporation, partnership, joint venture, trust or other enterprise against expenses, including attorneys’ fees, judgments, fines and amounts paid in settlement actually and reasonably incurred by the person in connection with such action, suit or proceeding. The power to indemnify applies (a) if such person is successful on the merits or otherwise in defense of any action, suit or proceeding, or (b) if such person acting in good faith and in a manner he or she reasonably believed to be in the best interest, or not opposed to the best interest, of the Registrant, and with respect to any criminal action or proceeding had no reasonable cause to believe his or her conduct was unlawful. The power to indemnify applies to actions brought by or in the right of the Registrant as well but only to the extent of defense expenses, including attorneys’ fees but excluding amounts paid in settlement, actually and reasonably incurred and not to any satisfaction of judgment or settlement of the claim itself, and with the further limitation that in such actions no indemnification shall be made in the event of any adjudication of liability to the Registrant, unless the court believes that in light of all the circumstances indemnification should apply.
II-1
Table of Contents
Information not required in prospectus
Section 174 of the DGCL provides, among other things, that a director, who willfully or negligently approves of an unlawful payment of dividends or an unlawful stock purchase or redemption, may be held liable for such actions. A director who was either absent when the unlawful actions were approved or dissented at the time, may avoid liability by causing his or her dissent to such actions to be entered in the books containing minutes of the meetings of the Board of Directors at the time such action occurred or immediately after such absent director receives notice of the unlawful acts.
The Registrant’s amended and restated bylaws provide that the Registrant shall indemnify its directors and executive officers to the fullest extent not prohibited by the DGCL or any other applicable law. In addition, the Registrant has entered into separate indemnification agreements, with its directors and officers which would require the Registrant, among other things, to indemnify them against certain liabilities which may arise by reason of their status or service as directors or officers to the fullest extent not prohibited by law. These indemnification provisions and the indemnification agreements may be sufficiently broad to permit indemnification of the Registrant’s officers and directors for liabilities, including reimbursement of expenses incurred, arising under the Securities Act of 1933, as amended, which we refer to as the Securities Act. The Registrant also maintains director and officer liability insurance.
The form of Underwriting Agreement, to be attached as Exhibit 1.1 hereto, provides for indemnification by the Underwriters of us and our officers and directors for certain liabilities, including liabilities arising under the Securities Act, and affords certain rights of contribution with respect thereto.
Item 15. Recent Sales of Unregistered Securities
WestLB Revolving Credit Agreement
On April 8, 2010, REG Seneca LLC, a wholly-owned subsidiary of the Registrant, agreed to lease and operate a biodiesel production facility in Seneca, Illinois. Concurrently with the execution of the lease, certain subsidiaries of the Registrant entered into a Revolving Credit Agreement with WestLB, AG, under which the Registrant issued 500,000 shares of its common stock to WestLB, AG. See “Certain Relationships and Related Party Transactions” on page 112 for a full discussion of the transaction.
Tellurian Biodiesel, Inc. and American BDF, LLC Acquisition
On July 16, 2010, the Registrant issued 598,295 shares of its common stock for certain assets of Tellurian Biodiesel, Inc. and American BDF, LLC with ongoing obligations to issue up to an additional 731,250 shares of common stock, in accordance with the asset purchase agreement.
Clovis Biodiesel, LLC Acquisition
On September 21, 2010, the Registrant issued 2,150,000 shares of its common stock to ARES Corporation in exchange for the assets of Clovis Biodiesel, LLC, a wholly owned subsidiary of the ARES Corporation, and $8.0 million cash.
SoyMor Acquisition
On July 1, 2011, the Registrant issued 80,000 and 1,770,000 shares of its common stock to SoyMor Cooperative and SoyMor Biodiesel, LLC, respectively, in exchange for substantially all the assets of SoyMor Biodiesel, LLC and SoyMor Cooperative’s soy lecithin assets.
II-2
Table of Contents
Information not required in prospectus
Since February 26, 2010, the Registrant has issued warrants to purchase an aggregate of 763,690 shares of its common stock at exercise prices ranging from $4.47 to $11.00.
Unless otherwise stated, the sales of the above securities were deemed to be exempt from registration under the Securities Act in reliance upon Section 4(2) of the Securities Act (or Regulation D or Regulation S promulgated thereunder), or Rule 701 promulgated under Section 3(b) of the Securities Act as transactions by an issuer not involving any public offering or pursuant to benefit plans and contracts relating to compensation as provided under Rule 701. The recipients of the securities in each of these transactions represented their intentions to acquire the securities for investment only and not with a view to or for sale in connection with any distribution thereof, and appropriate legends were placed upon the stock certificates issued in these transactions. All recipients had adequate access, through their relationships with the Registrant, to information about the Registrant. The sales of these securities were made without any general solicitation or advertising.
Item 16. Exhibits and Financial Statement Schedules
| (a) | Exhibits |
The following exhibits are included herein or incorporated herein by reference:
| Exhibit Number |
Description | |
| 1.1* | Form of Underwriting Agreement | |
| 3.1(a) | Amended and Restated Certificate of Incorporation of Renewable Energy Group, Inc. (the “Registrant”), effective as of February 26, 2010 (incorporated by reference to Exhibit 3.1 to the Registrant’s Current Report on Form 8-K filed March 4, 2010) | |
| 3.1(b)# | Form of Second Amended and Restated Certificate of Incorporation of the Registrant, to be in effect prior to the completion of this offering | |
| 3.1(c)# | Form of Third Amended and Restated Certificate of Incorporation, to be in effect upon the completion of this offering | |
| 3.2(a) | Amended and Restated Bylaws of the Registrant (incorporated by reference to Exhibit 3.2 to the Registrant’s Annual Report on Form 10-K for the year ended December 31, 2010) | |
| 3.2(b)* | Form of Amended and Restated Bylaws of the Registrant, to be in effect upon the completion of this offering | |
| 3.3 | Certificate of Designation of Series and Determination of Rights and Preferences of Series A Convertible Preferred Stock of the Registrant (incorporated by reference to Exhibit 3.3 to the Registrant’s Annual Report on Form 10-K for the year ended December 31, 2010) | |
| 4.1* | Form of Common Stock Certificate of the Registrant | |
| 4.2 | Form of warrant issued by the Registrant to entities affiliated with Natural Gas Partners (incorporated by reference to Exhibit 4.3 to the Registrant’s Registration Statement on Form S-4/A filed August 10, 2009) | |
| 4.3 | Schedule of warrants issued by the Registrant to Natural Gas Partners VIII, L.P. and entities affiliated with NGP Energy Technology Partners (incorporated by reference to Exhibit 4.4 to the Registrant’s Registration Statement on Form S-4/A filed August 10, 2009) | |
| 4.4 | Form of warrant issued by the Registrant to the purchasers of the Registrant’s Series B Convertible Preferred Stock (incorporated by reference to Exhibit 4.5 to the Registrant’s Registration Statement on Form S-4/A filed August 10, 2009) | |
II-3
Table of Contents
Information not required in prospectus
| Exhibit Number |
Description | |
| 4.5 | Schedule of warrants issued by the Registrant to the purchasers of the Registrant’s Series B Convertible Preferred Stock (incorporated by reference to Exhibit 4.6 to the Registrant’s Registration Statement on Form S-4/A filed August 10, 2009) | |
| 4.6 | Form of warrant issued by the Registrant to the purchasers of the Registrant’s Series AA and Series BB Convertible Preferred Stock (incorporated by reference to Exhibit 4.7 to the Registrant’s Registration Statement on Form S-4/A filed August 10, 2009) | |
| 4.7 | Schedule of warrants issued by the Registrant to the purchasers of the Registrant Series AA and Series BB Convertible Preferred Stock (incorporated by reference to Exhibit 4.8 to the Registrant’s Registration Statement on Form S-4/A filed August 10, 2009) | |
| 4.8 | Form of warrant issued by the Registrant to ED&F Man Holdings B.V. (incorporated by reference to Exhibit 4.9 to the Registrant’s Registration Statement on Form S-4/A filed August 10, 2009) | |
| 4.9 | Schedule of warrants issued by the Registrant to ED&F Man Holdings B.V. (incorporated by reference to Exhibit 4.10 to the Registrant’s Registration Statement on Form S-4/A filed August 10, 2009) | |
| 4.10 | Form of warrant issued by REG to members of the former board of managers and executive officers of Blackhawk (incorporated by reference to Exhibit 4.11 to the Registrant’s Annual Report on Form 10-K for the year ended December 31, 2010) | |
| 4.11 | Schedule of warrants issued by REG to members of the former board of managers and executive officers of Blackhawk (incorporated by reference to Exhibit 4.12 to the Registrant’s Annual Report on Form 10-K for the year ended December 31, 2010) | |
| 5.1* | Opinion of Pillsbury Winthrop Shaw Pittman LLP | |
| 10.1# | Master Loan Agreement, dated as of March 8, 2010, by and between AgStar Financial Services, PCA and REG Newton, LLC | |
| 10.2# | First Supplement to the Master Loan Agreement, dated as of March 8, 2010, between AgStar Financial Services, PCA and REG Newton, LLC (incorporated by reference to Exhibit 10.2 to the Registrant’s Quarterly Report on Form 10-Q for the three months ended March 31, 2010) | |
| 10.3# | Second Supplement to the Master Loan Agreement, dated as of March 8, 2010, between AgStar Financial Services, PCA and REG Newton, LLC | |
| 10.4# | REG Newton, LLC Revolving Line of Credit Note, dated March 8, 2010 (incorporated by reference to Exhibit 10.4 to the Registrant’s Quarterly Report on Form 10-Q for the three months ended March 31, 2010) | |
| 10.5# | REG Newton, LLC Term Note, dated March 8, 2010 (incorporated by reference to Exhibit 10.5 to the Registrant’s Quarterly Report on Form 10-Q for the three months ended March 31, 2010) | |
| 10.6# | First Amendment to Second Supplement to the Master Loan Agreement, dated as of March 8, 2010, between AgStar Financial Services, PCA and REG Newton, LLC | |
| 10.7 | First Allonge to Revolving Line of Credit Note, dated March 7, 2010 (incorporated by reference to Exhibit 10.7 to the Registrant’s Annual Report on Form 10-K for the year ended December 31, 2010) | |
II-4
Table of Contents
Information not required in prospectus
| Exhibit Number |
Description | |
| 10.8 | Corporate Guaranty (Revolving Line of Credit Loan), dated March 7, 2010 (incorporated by reference to Exhibit 10.8 to the Registrant’s Quarterly Report on Form 10-Q for the three months ended March 31, 2010) | |
| 10.9 | Corporate Guaranty (Term Loan), dated March 8, 2010 (incorporated by reference to Exhibit 10.9 to the Registrant’s Quarterly Report on Form 10-Q for the three months ended March 31, 2010) | |
| 10.10 | Loan Agreement, dated May 9, 2008, between Blackhawk Biofuels, LLC and Fifth Third Bank (incorporated by reference to Exhibit 10.3 to the Quarterly Report on Form 10-Q filed by Blackhawk Biofuels, LLC for the quarter ended March 31, 2008) | |
| 10.11 | Second Amendment to Loan Agreement by and among Fifth Third Bank and Blackhawk Biofuels, LLC dated November 25, 2009 (incorporated by reference to Exhibit 2.1 to the Current Report on Form 8-K filed by Blackhawk Biofuels, LLC on December 3, 2009) | |
| 10.12# | Third Amendment to Loan Agreement, dated February 26, 2010, by and between Fifth Third Bank and Blackhawk Biofuels, LLC | |
| 10.13 | Fourth Amendment to Loan Agreement and First Amendment to Revolving Credit Loan Note dated September 30, 2010, by and between Fifth Third Bank and Blackhawk Biofuels, LLC (incorporated by reference to Exhibit 10.13 to the Registrant’s Annual Report on Form 10-K for the year ended December 31, 2010) | |
| 10.14 | Stockholder Agreement, dated February 26, 2010, by and among REG Newco, Inc., certain holders of REG Newco, Inc. common stock and certain holders of REG Newco, Inc. Series A Preferred Stock (incorporated by reference to Exhibit 10.1 to the Registrant’s Current Report on Form 8-K filed March 4, 2010) | |
| 10.15 | First Amendment to the Stockholder Agreement of REG Newco, Inc. dated June 29, 2010 (incorporated by reference to Exhibit 10.15 to the Registrant’s Annual Report on Form 10-K for the year ended December 31, 2010) | |
| 10.16 | Registration Rights Agreement, dated February 26, 2010, by and among REG Newco, Inc., certain holders of REG Newco, Inc. common stock and certain holders of REG Newco, Inc. Series A Preferred Stock (incorporated by reference to Exhibit 10.16 to the Registrant’s Annual Report on Form 10-K for the year ended December 31, 2010) | |
| 10.17# | Amended and Restated Credit Agreement, dated as of April 8, 2010, among Seneca Landlord, LLC and WestLB AG, New York Branch | |
| 10.18 | Lease Agreement, dated as of April 8, 2010, by and between Seneca Landlord, LLC and REG Seneca, LLC (incorporated by reference to Exhibit 10.1 to the Registrant’s Current Report on Form 8-K filed April 15, 2010) | |
| 10.19 | Funding, Investor Fee and Put/Call Agreement, dated as of April 8, 2010, by and among Seneca Biodiesel Holdco, LLC, Seneca Landlord, LLC, Renewable Energy Group, Inc., REG Intermediate Holdco, Inc., and REG Seneca, LLC (incorporated by reference to Exhibit 10.2 to the Registrant’s Current Report on Form 8-K filed April 15, 2010) | |
| 10.20 | Accounts Agreement, dated as of April 8, 2010, by and among Seneca Landlord, LLC, REG Seneca, LLC, Sterling Bank, and WestLB AG, New York Branch (incorporated by reference to Exhibit 10.3 to the Registrant’s Current Report on Form 8-K filed April 15, 2010) | |
| 10.21# | Revolving Credit Agreement dated as of April 8, 2010, by and among REG Marketing and Logistics Group, LLC, REG Services Group, LLC, Renewable Energy Group, Inc. and WestLB AG, New York Branch | |
II-5
Table of Contents
Information not required in prospectus
| Exhibit Number |
Description | |
| 10.22 | Registration Rights Agreement dated as of February 26, 2010 by and between REG Newco, Inc. and Biofuels Company of America, LLC (incorporated by reference to Exhibit 10.22 to the Registrant’s Annual Report on Form 10-K for the year ended December 31, 2010) | |
| 10.23 | Master Services Agreement by and between the Registrant and Bunge dated May 8, 2009 (incorporated by reference to Exhibit 10.6 to the Registrant’s Registration Statement on Form S-4/A filed November 12, 2009) | |
| 10.24 | Contract for Services by and between West Central Cooperative and the Registrant dated August 1, 2006 (incorporated by reference to Exhibit 10.8 to the Registrant’s Registration Statement on Form S-4/A filed October 5, 2009) | |
| 10.25 | Ground Lease by and between West Central Cooperative and the Registrant dated July 31, 2006 (incorporated by reference to Exhibit 10.9 to the Registrant’s Registration Statement on Form S-4/A filed October 5, 2009) | |
| 10.26 | Asset Use Agreement by and between West Central Cooperative and the Registrant dated August 1, 2006 (incorporated by reference to Exhibit 10.10 to the Registrant’s Registration Statement on Form S-4/A filed October 5, 2009) | |
| 10.27 | Extended Payment Terms Agreement by and between West Central Cooperative and the Registrant dated June 29, 2009 (incorporated by reference to Exhibit 10.11 to the Registrant’s Registration Statement on Form S-4/A filed November 12, 2009) | |
| 10.28 | Form of Indemnification Agreement executed by each of the Registrant’s executive officers and directors (incorporated by reference to Exhibit 10.13 to the Registrant’s Registration Statement on Form S-4/A filed November 23, 2009) | |
| 10.29 | 2009 Stock Incentive Plan (incorporated by reference to Exhibit 10.1 to the Registrant’s Quarterly Report on Form 10-Q for the three months ended June 30, 2010) | |
| 10.30 | Agreement for Purchase and Sale of Assets and Common Stock by and among ARES Corporation, Clovis Biodiesel, LLC, REG Clovis, LLC and the Registrant dated August 24, 2010 (incorporated by reference to Exhibit 10.1 to the Registrant’s Quarterly Report on Form 10-Q for the three months ended September 30, 2010) | |
| 10.31 | Investment Agreement, dated as of July 15, 2011, by and among the Registrant and certain holders of the Registrant’s Series A Preferred Stock (incorporated by reference to Exhibit 10.1 to the Registrant’s Current Report on Form 8-K filed July 21, 2011) | |
| 10.32 | Second Amendment to Stockholders Agreement, dated as of July 15, 2011, by and among the Registrant and certain stockholders of the Registrant (incorporated by reference to Exhibit 10.2 to the Registrant’s Current Report on Form 8-K filed July 21, 2011) | |
| 10.33 | Consent and Amendment to Registration Rights Agreement, dated as of July 15, 2011, by and among the Registrant and certain stockholders of the Registrant (incorporated by reference to Exhibit 10.3 to the Registrant’s Current Report on Form 8-K filed July 21, 2011) | |
| 10.34# | Form of Warrant Exchange Agreement | |
| 10.35#† | Biodiesel Purchase Agreement by and between the Registrant and Pilot Travel Centers LLC dated January 1, 2011 | |
| 10.36# | Limited Waiver Agreement, dated as of May 13, 2011, by and between Fifth Third Bank and REG Danville LLC | |
| 10.37# | Feedstock Purchase and Sale Agreement, dated as of July 6, 2009, by and among Blackhawk Biofuels, LLC (the predecessor in interest to REG Danville LLC), REG Marketing & Logistics Group, LLC, and Bunge North America, Inc. | |
II-6
Table of Contents
Information not required in prospectus
| Exhibit Number |
Description | |
| 10.38 | Employment Agreement, dated as of August 1, 2006, by and between the Registrant and Daniel J. Oh (incorporated by reference to Exhibit 10.38 to the Registrant’s Registration Statement on Form S-1/A filed August 24, 2011) | |
| 10.39# | Biodiesel Purchase and Sale Agreement, dated as of October 22, 2009, by and among REG Marketing & Logistics Group, LLC, Central Iowa Energy LLC (the predecessor in interest to REG Newton LLC) and Bunge North America, Inc. | |
| 10.40#† | Toll Agreement, dated as of September 25, 2009, by and between REG Houston, LLC and ED&F Man Biofuels, Inc. | |
| 10.41# | Termination Agreement and Mutual Release, dated as of July 15, 2011, by and among USRG Holdco IX, LLC, the Registrant, and REG Services, LLC | |
| 10.42# | Loan Agreement, dated as of August 4, 2011, by and between USRG Holdco IX, LLC, REG Albert Lea, LLC, and USRG Management Company, LLC | |
| 10.43 | Note of REG Alberta Lea, LLC. dated August 4, 2011 (incorporated by reference to Exhibit 10.2 to the Registrant’s Current Report on Form 8-K filed August 10, 2011) | |
| 10.44 | Pledge Agreement, dated as of August 4, 2011, by and among Renewable Energy Group, Inc. and USRG Holdco IX, LLC (incorporated by reference to Exhibit 10.3 to the Registrant’s Current Report on Form 8-K filed August 10, 2011) | |
| 10.45 | Guaranty of Renewable Energy Group, Inc. of the obligations of REG Alberta Lea, LLC (incorporated by reference to Exhibit 10.4 to the Registrant’s Current Report on Form 8-K filed August 10, 2011) | |
| 10.46# | Summary of oral agreement between West Central and the Registrant regard Jeffrey Stroburg’s Compensation | |
| 21.1* | List of Subsidiaries | |
| 23.1 | Consent of Deloitte & Touche LLP, Independent Registered Public Accounting Firm | |
| 23.2* | Consent of Pillsbury Winthrop Shaw Pittman LLP (included in Exhibit 5.1) | |
| 24.1# | Power of Attorney (included in the signature page to this Registration Statement on Form S-1) | |
| * | To be filed by amendment |
| † | Confidential treatment requested |
| # | Previously Filed |
| (b) | Financial Statement Schedules |
Financial statement schedule I is included on page F-64. All other schedules are omitted because they are not required, or not applicable or the information is included in the consolidated financial statements or notes thereto.
Item 17. Undertakings
Insofar as indemnification for liabilities arising under the Securities Act of 1933 may be permitted to directors, officers and controlling persons of the registrant pursuant to the foregoing provisions, or otherwise, the registrant has been advised that in the opinion of the Securities and Exchange Commission
II-7
Table of Contents
such indemnification is against public policy as expressed in the Act and is, therefore, unenforceable. In the event that a claim for indemnification against such liabilities (other than the payment by the registrant of expenses incurred or paid by a director, officer or controlling person of the registrant in the successful defense of any action, suit or proceeding) is asserted by such director, officer or controlling person in connection with the securities being registered, the registrant will, unless in the opinion of its counsel the matter has been settled by controlling precedent, submit to a court of appropriate jurisdiction the question whether such indemnification by it is against public policy as expressed in the Act and will be governed by the final adjudication of such issue.
The undersigned registrant hereby undertakes that:
| (1) | For purposes of determining any liability under the Securities Act of 1933, the information omitted from the form of prospectus filed as part of this registration statement in reliance upon Rule 430A and contained in a form of prospectus filed by the registrant pursuant to Rule 424(b)(1) or (4) or 497(h) under the Securities Act shall be deemed to be part of this registration statement as of the time it was declared effective. |
| (2) | For the purpose of determining any liability under the Securities Act of 1933, each post-effective amendment that contains a form of prospectus shall be deemed to be a new registration statement relating to the securities offered therein, and the offering of such securities at that time shall be deemed to be the initial bona fide offering thereof. |
II-8
Table of Contents
SIGNATURES
Pursuant to the requirements of the Securities Act of 1933, the registrant has duly caused this registration statement to be signed on its behalf by the undersigned, thereunto duly authorized in the City of Ames, State of Iowa, on September 19, 2011.
| RENEWABLE ENERGY GROUP, INC. | ||
| (Registrant) | ||
| By: |
/s/ Jeffrey Stroburg | |
| Jeffrey Stroburg | ||
| Chairman and Chief Executive Officer | ||
Pursuant to the requirements of the Securities Act of 1933, this registration statement has been signed by the following persons in the capacities and on the dates indicated.
| Date | ||||
| /s/ Jeffrey Stroburg Jeffrey Stroburg |
Chairman and Chief Executive Officer (Principal Executive Officer) | September 19, 2011 | ||
| /s/ Chad Stone Chad Stone |
Chief Financial Officer (Principal Financial Officer) |
September 19, 2011 | ||
| * Chad Baker |
Controller (Principal Accounting Officer) |
September 19, 2011 | ||
| * Paul Chatterton |
Director | September 19, 2011 | ||
| * Scott P. Chesnut |
Director | September 19, 2011 | ||
| * Delbert Christensen |
Director |
September 19, 2011 | ||
| * Randolph L. Howard |
Director |
September 19, 2011 | ||
| * Eric Hakmiller |
Director |
September 19, 2011 | ||
| * Michael A. Jackson |
Director |
September 19, 2011 | ||
II-9
Table of Contents
Signatures
| Date | ||||
| * Jonathan Koch |
Director |
September 19, 2011 | ||
| * Christopher Sorrells |
Director |
September 19, 2011 | ||
| * Don Huyser |
Director |
September 19, 2011 | ||
| * Ronald Mapes |
Director |
September 19, 2011 | ||
| *By: | /s/ Chad Stone | |
| Chad Stone, Attorney-in-fact | ||
II-10
Table of Contents
Exhibit index
| Exhibit Number |
Description | |
| 1.1* | Form of Underwriting Agreement | |
| 3.1(a) | Amended and Restated Certificate of Incorporation of Renewable Energy Group, Inc. (the “Registrant”), effective as of February 26, 2010 (incorporated by reference to Exhibit 3.1 to the Registrant’s Current Report on Form 8-K filed March 4, 2010) | |
| 3.1(b)# | Form of Second Amended and Restated Certificate of Incorporation of the Registrant, to be in effect prior to the completion of this offering | |
| 3.1(c)# | Form of Third Amended and Restated Certificate of Incorporation, to be in effect upon the completion of this offering | |
| 3.2(a) | Amended and Restated Bylaws of the Registrant (incorporated by reference to Exhibit 3.2 to the Registrant’s Annual Report on Form 10-K for the year ended December 31, 2010). | |
| 3.2(b)* | Form of Amended and Restated Bylaws of the Registrant, to be in effect immediately prior to the completion of this offering | |
| 3.3 | Certificate of Designation of Series and Determination of Rights and Preferences of Series A Convertible Preferred Stock of the Registrant (incorporated by reference to Exhibit 3.3 to the Registrant’s Annual Report on Form 10-K for the year ended December 31, 2010) | |
| 4.1* | Form of Common Stock Certificate of the Registrant | |
| 4.2 | Form of warrant issued by the Registrant to entities affiliated with Natural Gas Partners (incorporated by reference to Exhibit 4.3 to the Registrant’s Registration Statement on Form S-4/A filed August 10, 2009) | |
| 4.3 | Schedule of warrants issued by the Registrant to Natural Gas Partners VIII, L.P. and entities affiliated with NGP Energy Technology Partners (incorporated by reference to Exhibit 4.4 to the Registrant’s Registration Statement on Form S-4/A filed August 10, 2009) | |
| 4.4 | Form of warrant issued by the Registrant to the purchasers of the Registrant’s Series B Convertible Preferred Stock (incorporated by reference to Exhibit 4.5 to the Registrant’s Registration Statement on Form S-4/A filed August 10, 2009) | |
| 4.5 | Schedule of warrants issued by the Registrant to the purchasers of the Registrant’s Series B Convertible Preferred Stock (incorporated by reference to Exhibit 4.6 to the Registrant’s Registration Statement on Form S-4/A filed August 10, 2009) | |
| 4.6 | Form of warrant issued by the Registrant to the purchasers of the Registrant’s Series AA and Series BB Convertible Preferred Stock (incorporated by reference to Exhibit 4.7 to the Registrant’s Registration Statement on Form S-4/A filed August 10, 2009) | |
| 4.7 | Schedule of warrants issued by the Registrant to the purchasers of the Registrant Series AA and Series BB Convertible Preferred Stock (incorporated by reference to Exhibit 4.8 to the Registrant’s Registration Statement on Form S-4/A filed August 10, 2009) | |
| 4.8 | Form of warrant issued by the Registrant to ED&F Man Holdings B.V. (incorporated by reference to Exhibit 4.9 to the Registrant’s Registration Statement on Form S-4/A filed August 10, 2009) | |
| 4.9 | Schedule of warrants issued by the Registrant to ED&F Man Holdings B.V. (incorporated by reference to Exhibit 4.10 to the Registrant’s Registration Statement on Form S-4/A filed August 10, 2009) | |
Table of Contents
Exhibit index
| Exhibit Number |
Description | |
| 4.10 | Form of warrant issued by REG to members of the former board of managers and executive officers of Blackhawk (incorporated by reference to Exhibit 4.11 to the Registrant’s Annual Report on Form 10-K for the year ended December 31, 2010) | |
| 4.11 | Schedule of warrants issued by REG to members of the former board of managers and executive officers of Blackhawk (incorporated by reference to Exhibit 4.12 to the Registrant’s Annual Report on Form 10-K for the year ended December 31, 2010) | |
| 5.1* | Opinion of Pillsbury Winthrop Shaw Pittman LLP | |
| 10.1# | Master Loan Agreement, dated as of March 8, 2010, by and between AgStar Financial Services, PCA and REG Newton, LLC | |
| 10.2# | First Supplement to the Master Loan Agreement, dated as of March 8, 2010, by and between AgStar Financial Services, PCA and REG Newton, LLC (incorporated by reference to Exhibit 10.2 to the Registrant’s Quarterly Report on Form 10-Q for the three months ended March 31, 2010) | |
| 10.3# | Second Supplement to the Master Loan Agreement, dated as of March 8, 2010, between AgStar Financial Services, PCA and REG Newton, LLC | |
| 10.4# | REG Newton, LLC Revolving Line of Credit Note, dated March 8, 2010 (incorporated by reference to Exhibit 10.4 to the Registrant’s Quarterly Report on Form 10-Q for the three months ended March 31, 2010) | |
| 10.5# | REG Newton, LLC Term Note, dated March 8, 2010 (incorporated by reference to Exhibit 10.5 to the Registrant’s Quarterly Report on Form 10-Q for the three months ended March 31, 2010) | |
| 10.6# | First Amendment to Second Supplement to the Master Loan Agreement, dated as of March 8, 2010, between AgStar Financial Services, PCA and REG Newton, LLC | |
| 10.7 | First Allonge to Revolving Line of Credit Note, dated March 8, 2010 (incorporated by reference to Exhibit 10.7 to the Registrant’s Annual Report on Form 10-K for the year ended December 31, 2010) | |
| 10.8 | Corporate Guaranty (Revolving Line of Credit Loan), dated March 7, 2010 (incorporated by reference to Exhibit 10.8 to the Registrant’s Quarterly Report on Form 10-Q for the three months ended March 31, 2010) | |
| 10.9 | Corporate Guaranty (Term Loan), dated March 7, 2010 (incorporated by reference to Exhibit 10.9 to the Registrant’s Quarterly Report on Form 10-Q for the three months ended March 31, 2010) | |
| 10.10 | Loan Agreement, dated May 9, 2008, between Blackhawk Biofuels, LLC and Fifth Third Bank (incorporated by reference to Exhibit 10.3 to the Quarterly Report on Form 10-Q filed by Blackhawk Biofuels, LLC for the quarter ended March 31, 2008) | |
| 10.11 | Second Amendment to Loan Agreement by and among Fifth Third Bank and Blackhawk Biofuels, LLC dated November 25, 2009 (incorporated by reference to Exhibit 2.1 to the Current Report on Form 8-K filed by Blackhawk Biofuels, LLC on December 3, 2009) | |
| 10.12# | Third Amendment to Loan Agreement, dated February 26, 2010, by and between Fifth Third Bank and Blackhawk Biofuels, LLC | |
| 10.13 | Fourth Amendment to Loan Agreement, and First Amendment to Revolving Credit Loan Note dated September 30, 2010, by and between Fifth Third Bank and Blackhawk Biofuels, LLC (incorporated by reference to Exhibit 10.13 to the Registrant’s Annual Report on Form 10-K for the year ended December 31, 2010) | |
Table of Contents
Exhibit index
| Exhibit Number |
Description | |
| 10.14 | Stockholder Agreement, dated February 26, 2010, by and among REG Newco, Inc., certain holders of REG Newco, Inc. common stock and certain holders of REG Newco, Inc. Series A Preferred Stock (incorporated by reference to Exhibit 10.1 to the Registrant’s Current Report on Form 8-K filed March 4, 2010) | |
| 10.15 | First Amendment to the Stockholder Agreement of REG Newco, Inc. dated June 29, 2010 (incorporated by reference to Exhibit 10.15 to the Registrant’s Annual Report on Form 10-K for the year ended December 31, 2010) | |
| 10.16 | Registration Rights Agreement, dated February 26, 2010, by and among REG Newco, Inc., certain holders of REG Newco, Inc. common stock and certain holders of REG Newco, Inc. Series A Preferred Stock (incorporated by reference to Exhibit 10.16 to the Registrant’s Annual Report on Form 10-K for the year ended December 31, 2010) | |
| 10.17# | Amended and Restated Credit Agreement, dated as of April 8, 2010, among Seneca Landlord, LLC and WestLB AG, New York Branch | |
| 10.18 | Lease Agreement, dated as of April 8, 2010, by and between Seneca Landlord, LLC and REG Seneca, LLC (incorporated by reference to Exhibit 10.1 to the Registrant’s Current Report on Form 8-K filed April 15, 2010) | |
| 10.19 | Funding, Investor Fee and Put/Call Agreement, dated as of April 8, 2010, by and among Seneca Biodiesel Holdco, LLC, Seneca Landlord, LLC, Renewable Energy Group, Inc., REG Intermediate Holdco, Inc., and REG Seneca, LLC (incorporated by reference to Exhibit 10.2 to the Registrant’s Current Report on Form 8-K filed April 15, 2010) | |
| 10.20 | Accounts Agreement, dated as of April 8, 2010, by and among Seneca Landlord, LLC, REG Seneca, LLC, Sterling Bank, and WestLB AG, New York Branch (incorporated by reference to Exhibit 10.3 to the Registrant’s Current Report on Form 8-K filed April 15, 2010) | |
| 10.21# | Revolving Credit Agreement dated as of April 8, 2010, by and among REG Marketing and Logistics Group, LLC, REG Services Group, LLC, Renewable Energy Group, Inc. and WestLB AG, New York Branch | |
| 10.22 | Registration Rights Agreement dated as of February 26, 2010 by and between REG Newco, Inc. and Biofuels Company of America LLC (incorporated by reference to Exhibit 10.22 to the Registrant’s Annual Report on Form 10-K for the year ended December 31, 2010) | |
| 10.23 | Master Services Agreement by and between the Registrant and Bunge dated May 8, 2009 (incorporated by reference to Exhibit 10.6 to the Registrant’s Registration Statement on Form S-4/A filed November 12, 2009) | |
| 10.24 | Contract for Services by and between West Central Cooperative and the Registrant dated August 1, 2006 (incorporated by reference to Exhibit 10.8 to the Registrant’s Registration Statement on Form S-4/A filed October 5, 2009) | |
| 10.25 | Ground Lease by and between West Central Cooperative and the Registrant dated July 31, 2006 (incorporated by reference to Exhibit 10.9 to the Registrant’s Registration Statement on Form S-4/A filed October 5, 2009) | |
| 10.26 | Asset Use Agreement by and between West Central Cooperative and the Registrant dated August 1, 2006 (incorporated by reference to Exhibit 10.10 to the Registrant’s Registration Statement on Form S-4/A filed October 5, 2009) | |
| 10.27 | Extended Payment Terms Agreement by and between West Central Cooperative and the Registrant dated June 29, 2009 (incorporated by reference to Exhibit 10.11 to the Registrant’s Registration Statement on Form S-4/A filed November 12, 2009) | |
Table of Contents
Exhibit index
| Exhibit Number |
Description | |
| 10.28 | Form of Indemnification Agreement executed by each of the Registrant’s executive officers and directors (incorporated by reference to Exhibit 10.13 to the Registrant’s Registration Statement on Form S-4/A filed November 23, 2009) | |
| 10.29 | 2009 Stock Incentive Plan (incorporated by reference to Exhibit 10.1 to the Registrant’s Quarterly Report on Form 10-Q for the three months ended June 30, 2010) | |
| 10.30 | Agreement for Purchase and Sale of Assets and Common Stock by and among ARES Corporation, Clovis Biodiesel, LLC, REG Clovis, LLC and the Registrant dated August 24, 2010 (incorporated by reference to Exhibit 10.1 to the Registrant’s Quarterly Report on Form 10-Q for the three months ended September 30, 2010) | |
| 10.31 | Investment Agreement, dated as of July 15, 2011, by and among the Registrant and certain holders of the Registrant’s Series A Preferred Stock (incorporated by reference to Exhibit 10.1 to the Registrant’s Current Report on Form 8-K filed July 21, 2011) | |
| 10.32 | Second Amendment to Stockholders Agreement, dated as of July 15, 2011, by and among the Registrant and certain stockholders of the Registrant (incorporated by reference to Exhibit 10.2 to the Registrant’s Current Report on Form 8-K filed July 21, 2011) | |
| 10.33 | Consent and Amendment to Registration Rights Agreement, dated as of July 15, 2011, by and among the Registrant and certain stockholders of the Registrant (incorporated by reference to Exhibit 10.3 to the Registrant’s Current Report on Form 8-K filed July 21, 2011) | |
| 10.34# | Form of Warrant Exchange Agreement | |
| 10.35#† | Biodiesel Purchase Agreement by and between the Registrant and Pilot Travel Centers LLC dated January 1, 2011 | |
| 10.36# | Limited Waiver Agreement, dated as of May 13, 2011, by and between Fifth Third Bank and REG Danville, LLC | |
| 10.37# | Feedstock Purchase and Sale Agreement, dated as of July 6, 2009, by and among Blackhawk Biofuels, LLC (the predecessor in interest to REG Danville LLC), REG Marketing & Logistics Group, LLC, and Bunge North America, Inc. | |
| 10.38 | Employment Agreement, dated as of August 1, 2006, by and between the Registrant and Daniel J. Oh (incorporated by reference to Exhibit 10.38 to the Registrant’s Registration Statement on Form S-1/A filed August 24, 2011) | |
| 10.39# | Biodiesel Purchase and Sale Agreement, dated as of October 22, 2009, by and among REG Marketing & Logistics Group, LLC, Central Iowa Energy LLC (the predecessor in interest to REG Newton LLC) and Bunge North America, Inc. | |
| 10.40#† | Toll Agreement, dated as of September 25 , 2009, by and between REG Houston, LLC and ED&F Man Biofuels, Inc. | |
| 10.41# | Termination Agreement and Mutual Release, dated as of July 15, 2011, by and among USRG Holdco IX, LLC, the Registrant, and REG Services, LLC | |
| 10.42# | Loan Agreement, dated as of August 4, 2011, by and between USRG Holdco IX, LLC, REG Albert Lea, LLC, and USRG Management Company, LLC | |
| 10.43 | Note of REG Alberta Lea, LLC. dated August 4, 2011 (incorporated by reference to Exhibit 10.2 to the Registrant’s Current Report on Form 8-K filed August 10, 2011) | |
| 10.44 | Pledge Agreement, dated as of August 4, 2011, by and among Renewable Energy Group, Inc. and USRG Holdco IX, LLC (incorporated by reference to Exhibit 10.3 to the Registrant’s Current Report on Form 8-K filed August 10, 2011) | |
Table of Contents
Exhibit index
| Exhibit Number |
Description | |
| 10.45 | Guaranty of Renewable Energy Group, Inc. of the obligations of REG Alberta Lea, LLC (incorporated by reference to Exhibit 10.4 to the Registrant’s Current Report on Form 8-K filed August 10, 2011) | |
| 10.46# | Summary of oral agreement between West Central and the Registrant regard Jeffrey Stroburg’s Compensation | |
| 21.1* | List of Subsidiaries | |
| 23.1 | Consent of Deloitte & Touche LLP, Independent Registered Public Accounting Firm | |
| 23.2* | Consent of Pillsbury Winthrop Shaw Pittman LLP (included in Exhibit 5.1) | |
| 24.1# | Power of Attorney (included in the signature page to this Registration Statement on Form S-1) | |
| * | To be filed by amendment |
| † | Confidential treatment requested |
| # | Previously Filed |
| (b) | Financial Statement Schedules |
Financial statement schedule I is included on page F-64. All other schedules are omitted because they are not required, or not applicable or the information is included in the consolidated financial statements or notes thereto.