Attached files
| file | filename |
|---|---|
| 8-K - FORM 8-K - EXELON GENERATION CO LLC | d233218d8k.htm |
 Bank
of America Merrill Lynch 2011
Power and
Gas Leaders
Conference
Christopher
M
Crane
–
President
and
COO,
Exelon
Corp.
September 20, 2011
EXHIBIT 99.1 |
 Cautionary Statements Regarding
Forward-Looking Information
2
Except for the historical information contained herein, certain of the matters discussed in this
communication constitute “forward-looking statements” within the meaning of the
Securities Act of 1933 and the Securities Exchange Act of 1934, both as amended by the Private
Securities Litigation Reform Act of 1995. Words such as “may,” “will,”
“anticipate,” “estimate,” “expect,” “project,”
“intend,” “plan,” “believe,” “target,” “forecast,” and words and terms of
similar substance used in connection with any discussion of future plans, actions, or events identify
forward-looking statements. These forward-looking statements include, but are not
limited to, statements regarding benefits of the proposed merger of Exelon Corporation (Exelon)
and Constellation Energy Group, Inc. (Constellation), integration plans and expected synergies,
the expected timing of completion of the transaction, anticipated future financial and
operating performance and results, including estimates for growth. These statements are based on the
current expectations of management of Exelon and Constellation, as applicable. There are a
number of risks and uncertainties that could cause actual results to differ materially from the
forward-looking statements included in this communication regarding the proposed merger.
For example, (1) the companies may be unable to obtain shareholder approvals required for the
merger; (2) the companies may be unable to obtain regulatory approvals required for the merger,
or required regulatory approvals may delay the merger or result in the imposition of conditions
that could have a material adverse effect on the combined company or cause the companies to abandon
the merger; (3) conditions to the closing of the merger may not be satisfied; (4) an unsolicited offer
of another company to acquire assets or capital stock of Exelon or Constellation could
interfere with the merger; (5) problems may arise in successfully integrating the businesses of
the companies, which may result in the combined company not operating as effectively and
efficiently as expected; (6) the combined company may be unable to achieve cost- cutting
synergies or it may take longer than expected to achieve those synergies; (7) the merger may involve
unexpected costs, unexpected liabilities or unexpected delays, or the effects of purchase accounting
may be different from the companies’ expectations; (8) the credit ratings of the combined
company or its subsidiaries may be different from what the companies expect; (9) the businesses
of the companies may suffer as a result of uncertainty surrounding the merger; (10) the
companies may not realize the values expected to be obtained for properties expected or
required to be divested; (11) the industry may be subject to future regulatory or legislative actions that
could adversely affect the companies; and (12) the companies may be adversely affected by other
economic, business, and/or competitive factors. Other unknown or unpredictable factors could
also have material adverse effects on future results, performance or achievements of Exelon,
Constellation or the combined company.
|
 Cautionary Statements Regarding
Forward-Looking Information (Continued)
3
Discussions of some of these other important factors and assumptions are contained in Exelon’s
and Constellation’s respective filings with the Securities and Exchange Commission (SEC),
and available at the SEC’s website at www.sec.gov, including: (1) Exelon’s 2010
Annual Report on Form 10-K in (a) ITEM 1A. Risk Factors, (b) ITEM 7. Management’s
Discussion and Analysis of Financial Condition and Results of Operations and (c) ITEM 8. Financial
Statements and Supplementary Data: Note 18; (2) Exelon’s Quarterly Report on Form 10-Q
for the quarterly period ended June 30, 2011 in (a) Part II, Other Information, ITEM 1A. Risk
Factors, (b) Part 1, Financial Information, ITEM 2. Management’s Discussion and Analysis
of Financial Condition and Results of Operations and (c) Part I, Financial Information, ITEM 1.
Financial Statements: Note 13; (3) Constellation’s 2010 Annual Report on Form 10-K in (a) ITEM
1A. Risk Factors, (b) ITEM 7. Management’s Discussion and Analysis of Financial Condition and
Results of Operations and (c) ITEM 8. Financial Statements and Supplementary Data: Note 12; and
(4) Constellation’s Quarterly Report on Form 10-Q for the quarterly period ended June
30, 2011 in (a) Part II, Other Information, ITEM 1A. Risk Factors and ITEM 5. Other
Information, (b) Part I, Financial Information, ITEM 2. Management’s Discussion and Analysis of Financial
Condition and Results of Operations and (c) Part I, Financial Information, ITEM 1. Financial
Statements: Notes to Consolidated Financial Statements, Commitments and Contingencies. These
risks, as well as other risks associated with the proposed merger, are more fully discussed in
the preliminary joint proxy statement/prospectus included in Amendment No. 1 to the
Registration Statement on Form S-4 that Exelon filed with the SEC on August 17, 2011 in
connection with the proposed merger. In light of these risks, uncertainties, assumptions and
factors, the forward-looking events discussed in this communication may not occur. Readers
are cautioned not to place undue reliance on these forward-looking statements, which speak
only as of the date of this communication. Neither Exelon nor Constellation undertake any
obligation to publicly release any revision to its forward-looking statements to reflect events or
circumstances after the date of this communication. Additional
Information and Where to Find It
This communication does not constitute an offer to sell or the solicitation of an offer to buy any
securities, or a solicitation of any vote or approval, nor shall there be any sale of
securities in any jurisdiction in which such offer, solicitation or sale would be unlawful
prior to registration or qualification under the securities laws of any such jurisdiction. On August 17,
2011, Exelon filed with the SEC Amendment No. 1 to its Registration Statement on Form S-4 that
included a preliminary joint proxy statement/prospectus and other relevant documents to be
mailed by Exelon and Constellation to their respective security holders in connection with the
proposed merger of Exelon and Constellation. |
 Additional Information and Where to Find It
These materials are not yet final and may be amended. WE URGE INVESTORS AND
SECURITY HOLDERS TO READ THE PRELIMINARY JOINT PROXY STATEMENT/PROSPECTUS
AND THE DEFINITIVE JOINT PROXY STATEMENT/PROSPECTUS AND ANY OTHER RELEVANT
DOCUMENTS WHEN THEY BECOME AVAILABLE, BECAUSE
THEY
CONTAIN
OR
WILL
CONTAIN
IMPORTANT
INFORMATION
about
Exelon,
Constellation
and
the
proposed
merger.
Investors
and
security
holders
will
be
able
to
obtain
these
materials
(when
they
are
available)
and
other
documents filed with the SEC free of charge at the SEC's website,
www.sec.gov. In addition, a copy of the preliminary joint proxy
statement/prospectus and definitive joint proxy statement/prospectus (when it becomes available) may be obtained
free of charge from Exelon Corporation, Investor Relations, 10 South Dearborn
Street, P.O. Box 805398, Chicago, Illinois 60680-5398, or from
Constellation Energy Group, Inc., Investor Relations, 100 Constellation Way, Suite 600C, Baltimore,
MD 21202. Investors and security holders may also read and copy any reports,
statements and other information filed by Exelon, or Constellation, with the
SEC, at the SEC public reference room at 100 F Street, N.E., Washington, D.C. 20549.
Please call the SEC at 1-800-SEC-0330 or visit the SEC’s website
for further information on its public reference room. Participants in the
Merger Solicitation Exelon,
Constellation,
and
their
respective
directors,
executive
officers
and
certain
other
members
of
management
and
employees may be deemed to be participants in the solicitation of proxies in
respect of the proposed transaction. Information regarding Exelon’s
directors and executive officers is available in its proxy statement filed with the SEC by
Exelon on March 24, 2011 in connection with its 2011 annual meeting of
shareholders, and information regarding Constellation’s directors and
executive officers is available in its proxy statement filed with the SEC by Constellation on
April 15, 2011 in connection with its 2011 annual meeting of shareholders. Other
information regarding the participants in the
proxy
solicitation
and
a
description
of
their
direct
and
indirect
interests,
by
security
holdings
or
otherwise,
is
contained
in the preliminary joint proxy statement/prospectus and will be contained in the
definitive joint proxy statement/prospectus. 4
|
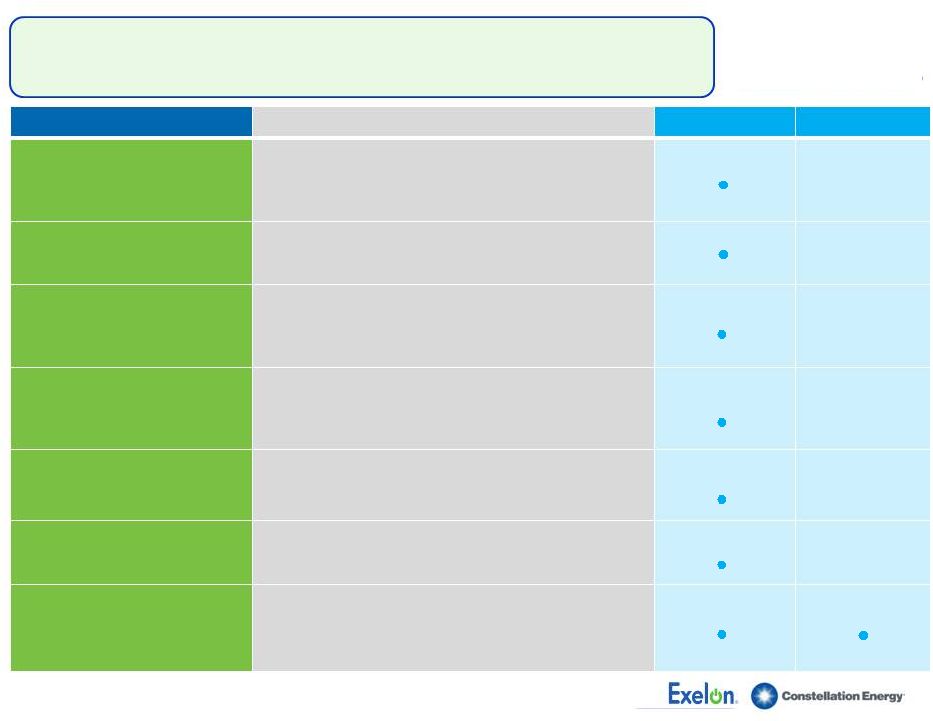
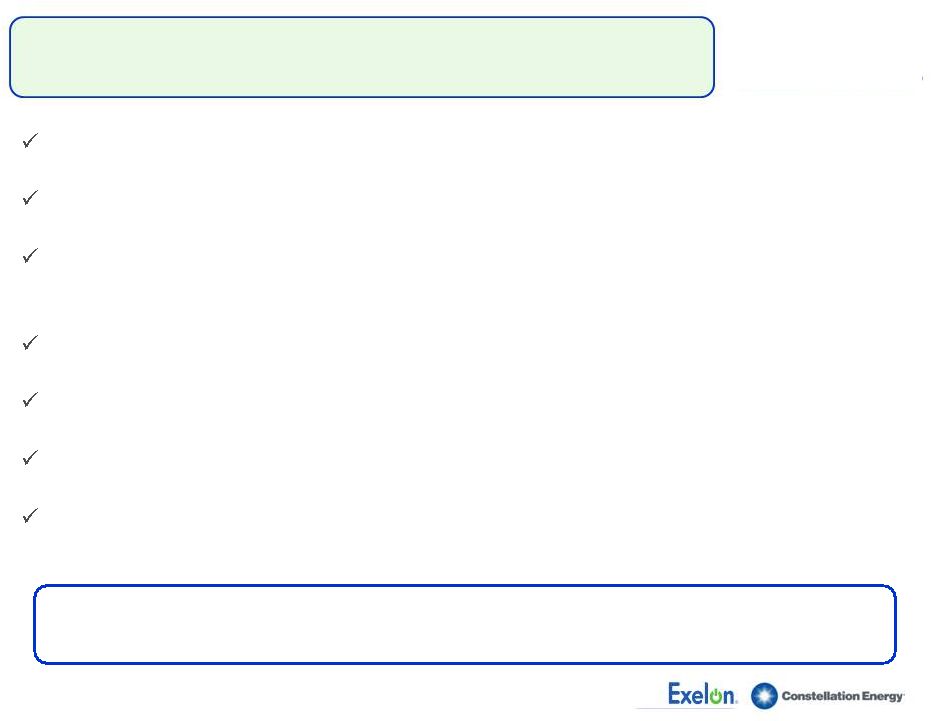 Creating Value
Through a Strategic Merger Delivers financial benefits to both sets of
shareholders Increases scale and scope of the business across the value
chain Matches the industry’s premier clean merchant generating fleet
with the leading retail and wholesale customer platform
Diversifies the generation portfolio
Continued upside to power market recovery
Maintains a strong regulated earnings profile with large urban utilities
Successful integration experience from prior mergers and acquisitions
Combining Exelon’s generation fleet and Constellation’s
customer-facing businesses creates a strong platform for growth and
delivers benefits to investors and customers
5 |
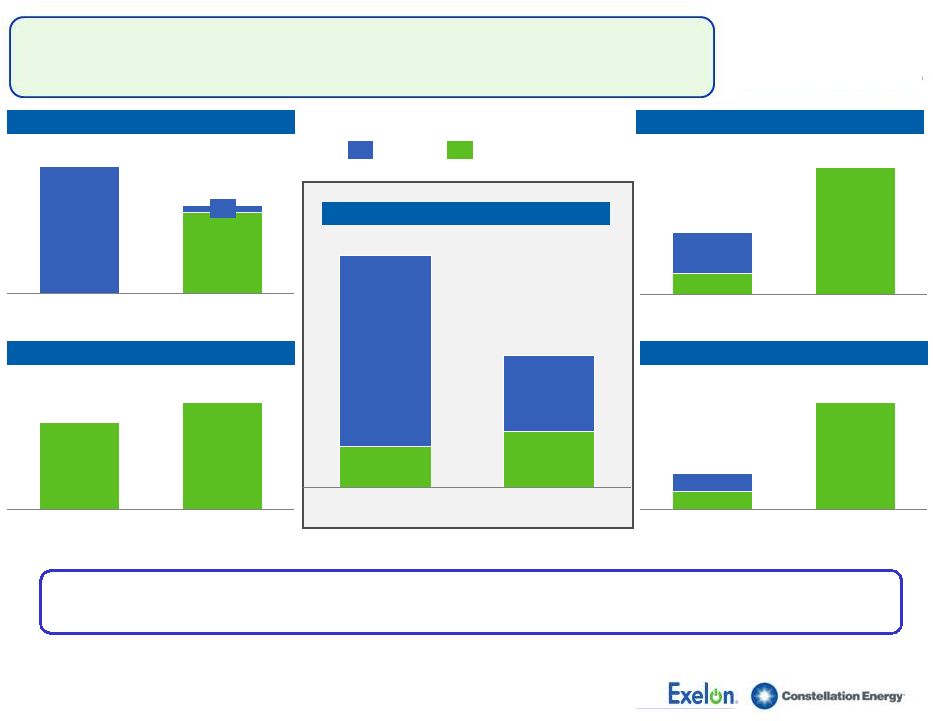
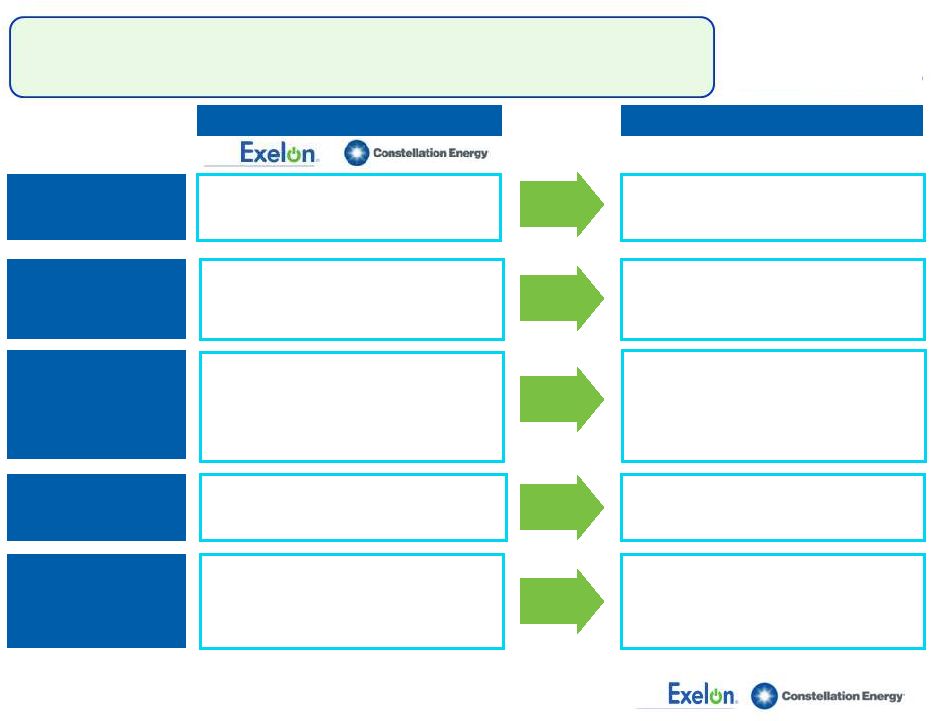 Combination Will Result in Enhanced Scale,
Scope, Flexibility and Financial Strength
•
$8 billion
•
$11 billion
•
11,980 (Total)
•
1,921 (Nuclear)
•
1.2 mil. (MD)
•
0.7 mil. (MD)
•
44 states & D.C.
(5)
•
~110 TWh/yr
•
29% Generation
•
44% Utility
•
27% NewEnergy
Market Value and
Enterprise
Value
(1)
Pro forma
Standalone
Owned
Generation
(in MW)
(2)
Regulated
Utilities
Competitive
Retail &
Wholesale
(4)
Business
Mix
(6)
•
$28 billion
•
$41 billion
•
26,339 (Total)
•
17,047 (Nuclear)
Electric customers
•
5.4 mil. (IL, PA)
Gas customers
•
0.5 mil. (PA)
•
4 states
•
~59
TWh/yr
2011 EBITDA
•
61% Generation
•
39% Utilities
•
$35 billion
•
$52 billion
•
44 states & D.C.
(5)
•
~169
TWh energy sales
•
Expect >50% pro forma EBITDA
from competitive business
•
35,671
(Total)
(3)
•
18,968 (Nuclear)
•
6.6 million electric & gas customers
in IL, PA and MD
Note: Data as of 12/31/10 unless stated otherwise.
(1) Market Value as of 9/14/11. Enterprise Value represents Market Value plus
Net Debt as of 6/30/11. (2) Exelon data includes 720 MW for Wolf Hollow.
Constellation data includes 2,950 MW for Boston Generation assets. (3)
Net of physical market mitigation assumed to be 2,648 MW. (4) TWh/yr
represents 2011 booked electric sales as of 12/31/2010. Exelon load includes ComEd swap. Data also includes 2011 partial
year
estimated electric sales from StarTex and MXEnergy (acquired by
Constellation). (5) Competitive and wholesale business also active in
Alberta, British Columbia and Ontario, Canada. (6) Exelon EBITDA
estimates per equity research. Constellation EBITDA estimates per company guidance from Q1 2011.
6 |
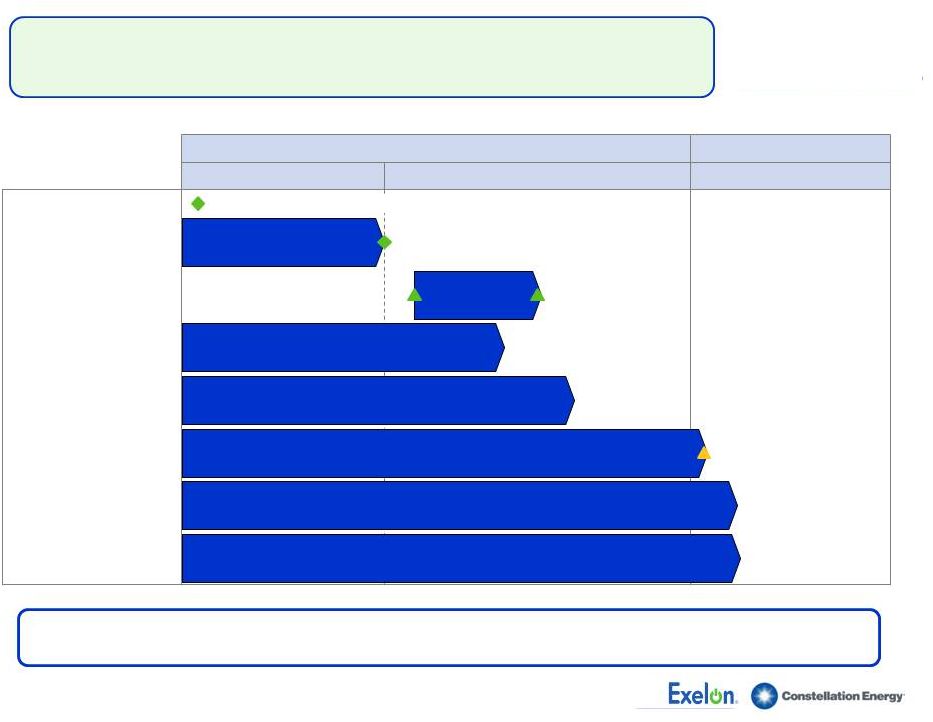 On
Track for Merger Close in Early Q1 2012 2011
2012
Q3
Q4
Q1
Filed for indirect transfer of Constellation Energy licenses on
May 12, 2011
Expect approval in Q4
Filed merger approval application related filings on
May 20, 2011
Submitted HSR filing on May 31, 2011 for review under U.S. antitrust laws
Filed for approval with the Maryland PSC on May 25, 2011
Approvals
Shareholder vote
Shareholder vote
1/5/12
Decision deadline
SEC
NRC
Texas PUCT
Secured approval from Texas
FERC
DOJ
NY PSC
MD PSC
Regulatory
proceedings
are
progressing
well
and
we
are
on
track
to
close
in
early Q1, 2012
Proxy mailing
SEC has completed its
review of S-4
7 |
 Project
Nuclear Uprates
Wind
Wolf Hollow Acquisition
RiteLine
Investment
$3.3 billion
$490 million
$305 million
$1.1 billion
Capacity
1,300 MW
230 MW
720 MW
N.A.
States
IL, PA
MI
TX
IL, IN,OH
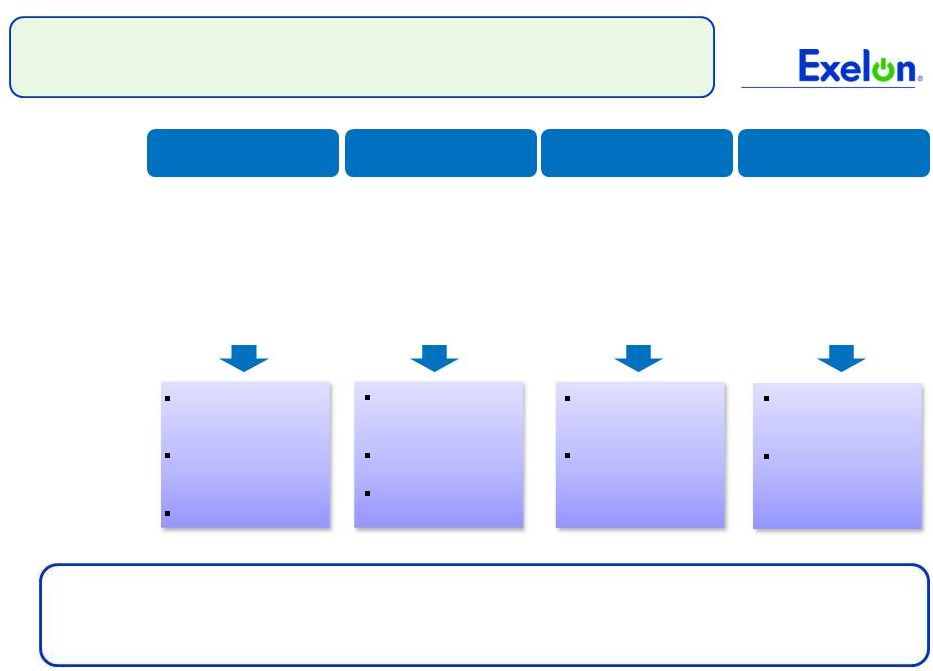
Committed To Value Driven Growth
8
Capitalize on
operational
excellence
Straight forward
regulatory approval
process
Investment flexibility
Efficient tax
structure and
equity recovery
Low risk and
stable cash flows
Expansion in a
new market (MI)
Commitment to
competitive
markets
Attractive
purchase price
and upside
opportunity in TX
Pre-determined
and guaranteed
return on equity
Enhance reliability
and support
renewable
integration
Nuclear
Renewables
CCGT
Transmission
These investments further our commitment to Exelon 2020 and a low carbon future,
while providing attractive financial returns and diversifying our earnings
within the merchant segment of our business |
 Three
Major Categories of Exelon Uprates Uprates
Overnight
Cost
(1)
MUR (Measurement Uncertainty Recapture)
•
Through the use of advanced techniques and more precise
instrumentation, reactor power can be more accurately calculated
•
Can achieve up to 1.7% additional output
•
Requires NRC approval
197–233 MW
$330M
2-3 years
745–826 MW
$2,155M
EPU (Extended Power Uprate)
•
Through a combination of more sophisticated analysis and
upgrades to plant equipment, uprates can increase output by as
much as 20% of original licensed power level
•
Requires NRC approval
3 -
6
years
234–255 MW
$790M
Megawatt Recovery and Component Upgrades
•
Replacement of major components in the plant occur in the
normal
life
cycle
process
–
with
newer
technology,
replacements
result in increased efficiency
•
Equipment includes generators, turbines, motors and transformers
•
Megawatt Recovery and Component Upgrades must conform to
NRC standards, but do not require additional NRC approval
3-4 years
~1,175–1,300 MW
$3,275M
Project
Duration
(1)
In 2011 dollars. Overnight costs do not include financing costs or cost
escalation. Estimated
Internal Rate
of Return
12-14%
13-16%
10-14%
Refined
scenario
analysis
highlights
that
uprates
continue
to
be
economic
9 |
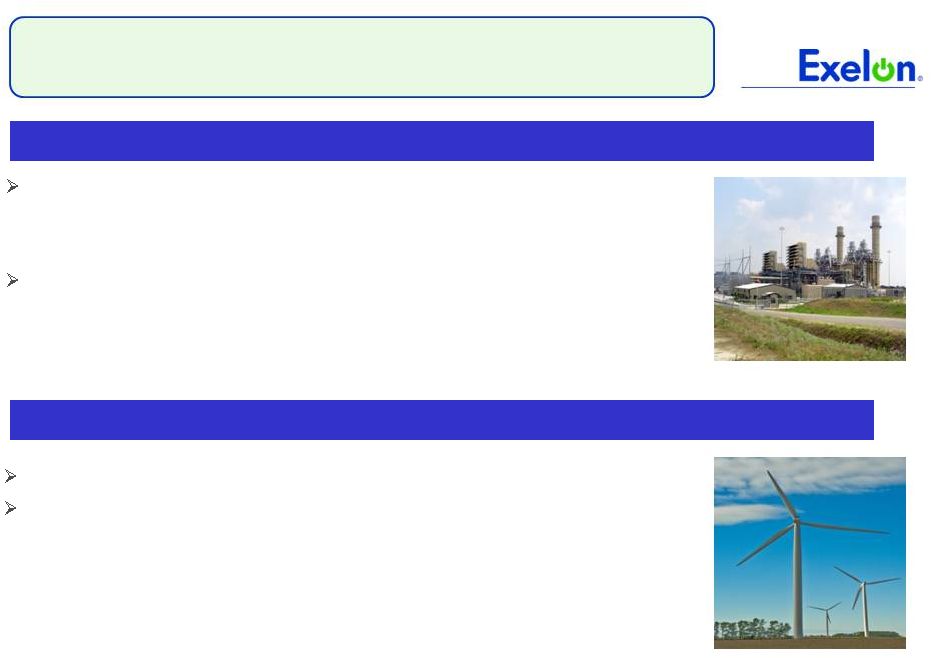 Wolf
Hollow Acquisition and Exelon Wind Diversifies generation portfolio :
•
Expands geographic and fuel characteristics of fleet
•
Advances our merger strategy of matching load with generation
Creates value for shareholders :
•
$305M purchase price compares favorably to recent transactions
•
Free cash flow accretive beginning in 2012
•
Opportunity
to
benefit
from
future
market
heat
rate
expansion
in
ERCOT
ERCOT : Electric Reliability Council of Texas; COD : Commercial
Operation Date
Wolf
Hollow
Acquisition
–
Successfully
closed
on
August
24,
2011
Exelon Wind –
Successfully executing on development projects
Successfully
acquired
and
integrated
a
sizeable
wind
generation
portfolio
Moving ahead with three development projects
•
Michigan Wind 2 project (90 MWs) expected COD December 2011
•
Harvest II wind project (59.4 MWs) expected COD December 2012
•
Blissfield wind project (81 MW) expected COD December 2012
10 |
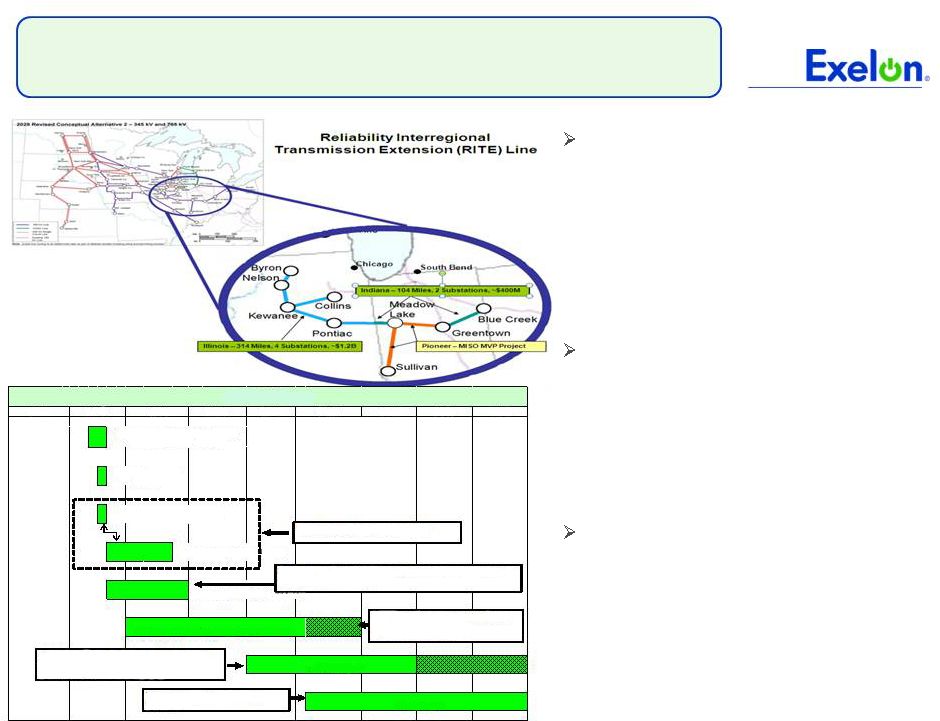 RITE
Line Project Update Project Background
•
420 miles of 765kV transmission
stretches from Northern Illinois to
Ohio. The RITE Line will be built
from the existing 765kV system in
Ohio in the East to the West
•
Estimated construction to begin
2015 pending regulatory approvals
and siting
Strategic and Financial Objectives
•
Ensures reliability, enables states to
meet RPS standards, and supports
the integration of more renewables
•
ComEd/Exelon investment ~ $1.1
billion
•
Requested ROE 12.70%
Latest Developments
•
Signed partnership agreement with
ETA on July 13
•
Completed FERC incentive rate
filing on July 18. Expect FERC ruling
by October 2011.
Note: ETA = Electric Transmission America
RPS = Renewable Portfolio Standards
RTEP = Regional Transmission Expansion Planning
11
2016
2017
2018
FERC Final Rule on NOPR
PJM Compliance Filing
2010
State Local Outreach & Project Siting
Establish Definitive Agreement
Between Exelon & ETA
2012
FERC Incentive
Construction
RITE Line
2013
2011
2015
In-Service
Pursue PJM RTEP Approval
RTEP Approval expected by
2012, depending on
PJM Planning criteria
Time length is dependent on:
1. Land negotiations
2. Receipt of State
Line
can
be
in-serviced
in
phases
Construction
can
range
from
3-5
yrs
depending on the length of time
needed to site the project
Non
Project Specific Events
2014
Filing
- |
 Exelon Generation Hedging Disclosures
(as of June 30, 2011)
12 |
 Important Information
13
The following slides are intended to provide additional information regarding the hedging
program at Exelon Generation and to serve as an aid for the purposes of modeling Exelon
Generation’s gross margin (operating revenues less purchased power and fuel expense). The
information on the following slides is not intended to represent earnings guidance or a forecast
of future events. In fact, many of the factors that ultimately will determine Exelon
Generation’s actual gross margin are based upon highly variable market factors outside of
our control. The information on the following slides is as of June 30, 2011. We
update this information on a quarterly basis.
Certain information on the following slides is based upon an internal simulation model that
incorporates assumptions regarding future market conditions, including power and commodity
prices, heat rates, and demand conditions, in addition to operating performance and dispatch
characteristics of our generating fleet. Our simulation model and the assumptions therein are
subject to change. For example, actual market conditions and the dispatch profile of our
generation fleet in future periods will likely differ – and may differ significantly –
from the assumptions underlying the simulation results included in the slides. In addition,
the forward- looking information included in the following slides will likely change over time
due to continued refinement of our simulation model and changes in our views on future market
conditions. |
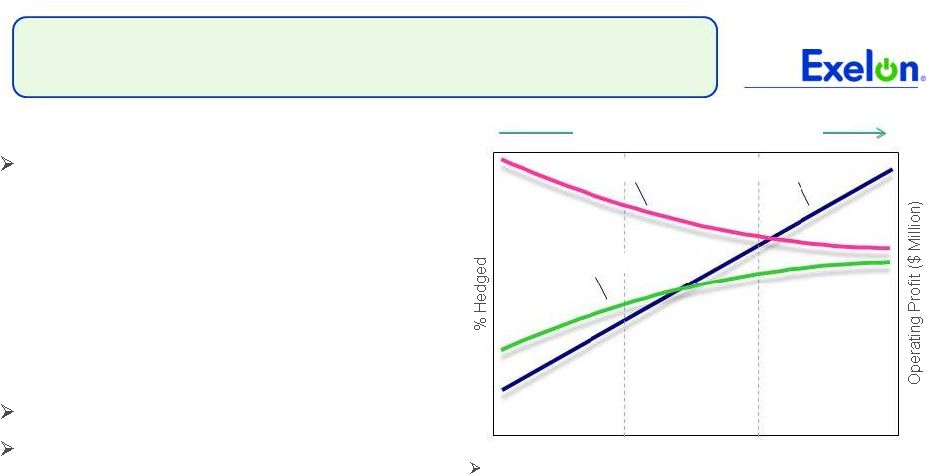 Portfolio Management Objective
Align Hedging Activities with Financial Commitments
Power Team utilizes several product types
and channels to market
•
Wholesale and retail sales
•
Block products
•
Load-following products
and load auctions
•
Put/call options
Exelon’s hedging program is designed to
protect the long-term value of our
generating fleet and maintain an
investment-grade balance sheet
•
Hedge enough commodity risk to meet future cash
requirements if prices drop
•
Consider: financing policy (credit rating objectives,
capital structure, liquidity); spending (capital and
O&M); shareholder value return policy
Consider market, credit, operational risk
Approach to managing volatility
•
Increase hedging as delivery approaches
•
Have enough supply to meet peak load
•
Purchase fossil fuels as power is sold
•
Choose hedging products based on generation
portfolio
–
sell what we own
•
Heat rate options
•
Fuel products
•
Capacity
•
Renewable credits
% Hedged
High End of Profit
Low End of Profit
Open Generation
with LT Contracts
Portfolio
Optimization
Portfolio
Management
Portfolio Management Over Time
14 |
 Percentage of Expected
Generation Hedged
•
How many equivalent MW have been
hedged at forward market prices; all hedge
products used are converted to an
equivalent average MW volume
•
Takes ALL
hedges into account whether
they are power sales or financial products
Equivalent MWs Sold
Expected Generation
=
Our normal practice is to hedge commodity risk on a ratable basis
over the three years leading to the spot market
•
Carry operational length into spot market to manage forced outage and
load-following risks
•
By
using
the
appropriate
product
mix,
expected
generation
hedged
approaches
the
mid-90s percentile as the delivery period approaches
•
Participation in larger procurement events, such as utility auctions, and some
flexibility in the timing of hedging may mean the hedge program is not
strictly ratable from quarter to quarter
Exelon Generation Hedging Program
15 |
 2011
2012
2013
Estimated
Open
Gross
Margin
($
millions)
(1)(2)
$5,450
$5,000
$5,600
Open gross margin assumes all expected generation is sold
at the Reference Prices listed below
Reference Prices
(1)
Henry Hub Natural Gas ($/MMBtu)
NI-Hub ATC Energy Price ($/MWh)
PJM-W ATC Energy Price ($/MWh)
ERCOT
North
ATC
Spark
Spread
($/MWh)
(3)
$4.37
$33.18
$46.07
$3.77
$4.84
$33.10
$46.02
$1.40
$5.16
$34.45
$47.45
$2.27
Exelon Generation Open Gross Margin and
Reference Prices
16
(1)
Based on June 30, 2011 market conditions.
(2)
Gross margin is defined as operating revenues less fuel expense and purchased power expense, excluding
the impact of decommissioning and other incidental revenues. Open gross margin is estimated
based upon an internal model that is developed by dispatching our expected generation to current market power and fossil fuel prices. Open
gross margin assumes there is no hedging in place other than fixed assumptions for capacity cleared in
the RPM auctions and uranium costs for nuclear power plants. Open gross margin contains
assumptions for other gross margin line items such as various ISO bill and ancillary revenues and costs and PPA capacity revenues and payments. The
estimation of open gross margin incorporates management discretion and modeling assumptions that are
subject to change.
(3)
ERCOT North ATC spark spread using Houston Ship Channel Gas, 7,200 heat rate, $2.50 variable
O&M. |
 2011
2012
2013
Expected Generation
(GWh)
(1)
166,100
165,600
163,000
Midwest
99,000
97,900
95,800
Mid-Atlantic
56,300
57,100
56,500
South & West
10,800
10,600
10,700
Percentage of Expected Generation Hedged
(2)
95-98%
82-85%
49-52%
Midwest
95-98
81-84
48-51
Mid-Atlantic
96-99
85-88
50-53
South & West
86-89
63-66
45-48
Effective Realized Energy Price
($/MWh)
(3)
Midwest
$43.00
$41.00
$40.00
Mid-Atlantic
$57.00
$50.00
$50.50
South & West
$4.50
$0.00
($2.00)
Generation Profile
17
(1)
Expected generation represents the amount of energy estimated to be generated or purchased through
owned or contracted for capacity. Expected generation is based upon a simulated dispatch
model that makes assumptions regarding future market conditions, which are calibrated to market quotes
for power, fuel, load following products, and options. Expected generation assumes 12 refueling
outages in 2011 and 10 refueling outages in 2012 and 2013 at Exelon-operated nuclear plants and Salem. Expected generation assumes capacity factors of 93.0%, 93.4% and 93.2% in
2011, 2012 and 2013 at Exelon-operated nuclear plants. These estimates of expected generation in
2012 and 2013 do not represent guidance or a forecast of future results as Exelon has not
completed its planning or optimization processes for those years.
(2)
Percent of expected generation hedged is the amount of equivalent sales divided by the expected
generation. Includes all hedging products, such as wholesale and retail sales of power, options,
and swaps. Uses expected value on options. Reflects decision to permanently retire Cromby
Station and Eddystone Units 1&2 as of May 31, 2011. (3)
Effective realized energy price is representative of an all-in hedged price, on a per MWh basis,
at which expected generation has been hedged. It is developed by considering the energy revenues
and costs associated with our hedges and by considering the fossil fuel that has been purchased to
lock in margin. It excludes uranium costs and RPM capacity revenue, but includes the mark-to-
market value of capacity contracted at prices other than RPM clearing prices including our load
obligations. It can be compared with the reference prices used to calculate open gross margin in
order to determine the mark-to-market value of Exelon Generation's energy hedges.
|
 Gross Margin Sensitivities with Existing Hedges ($ millions)
(1)
Henry Hub Natural Gas
+ $1/MMBtu
-
$1/MMBtu
NI-Hub ATC Energy Price
+$5/MWH
-$5/MWH
PJM-W ATC Energy Price
+$5/MWH
-$5/MWH
Nuclear Capacity Factor
+1% / -1%
2011
$5
$(5)
$5
$(5)
$5
$(5)
+/-
$25
2012
$85
$(35)
$95
$(75)
$55
$(55)
+/-
$45
2013
$340
$(290)
$250
$(245)
$155
$(150)
+/-
$50
Exelon Generation Gross Margin Sensitivities
(with Existing Hedges)
18
(1)
Based on June 30, 2011 market conditions and hedged position. Gas price sensitivities are based on an
assumed gas-power relationship derived from an internal model that is updated
periodically. Power prices sensitivities are derived by adjusting the power price assumption while keeping all other prices inputs constant. Due to correlation of the various
assumptions, the hedged gross margin impact calculated by aggregating individual sensitivities may not
be equal to the hedged gross margin impact calculated when correlations
between the various assumptions are also considered. |
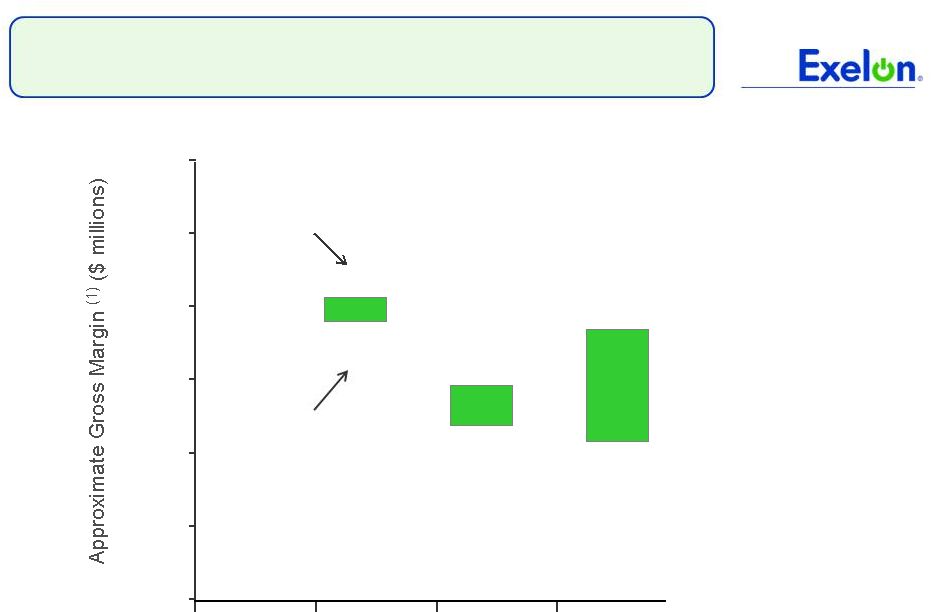 95% case
5% case
$5,500
$7,100
$6,900
$6,000
Exelon Generation Gross Margin Upside / Risk
(with Existing Hedges)
$3,000
$4,000
$5,000
$6,000
$7,000
$8,000
$9,000
2011
2012
2013
$6,800
$5,200
19
(1)
Represents an approximate range of expected gross margin, taking into account hedges in place, between
the 5th and 95th percent confidence levels assuming all unhedged supply is sold into the spot
market. Approximate gross margin ranges are based upon an internal simulation model and are subject to change based upon market inputs, future
transactions and potential modeling changes. These ranges of approximate gross margin in 2012 and 2013
do not represent earnings guidance or a forecast of future results as Exelon has not completed
its planning or optimization processes for those years. The price distributions that generate this range are calibrated to market quotes for power, fuel,
load following products, and options as of June 30, 2011.
|
 Illustrative Example
of Modeling Exelon Generation 2011 Gross Margin
(with Existing Hedges)
20
Midwest
Mid-Atlantic
South & West
Step 1
Start
with
fleetwide
open
gross
margin
$5.45 billion
Step 2
Determine
the
mark-to-market
value
of
energy hedges
99,000GWh * 96% *
($43.00/MWh-$33.18MWh)
= $0.93 billion
56,300GWh * 97% *
($57.00/MWh-$46.07MWh)
= $0.60 billion
10,800GWh * 87% *
($4.50/MWh-$3.77MWh)
= $0.00 billion
Step 3
Estimate
hedged
gross
margin
by
adding open gross margin to mark-to-
market value of energy hedges
Open
gross
margin:
$5.45
billion
MTM
value
of
energy
hedges:
$0.93
billion
+
$0.60
billion
+
$0.00
billion
Estimated
hedged
gross
margin:
$6.98
billion |
 20
25
30
35
40
45
8/10
9/10
10/10
11/10
12/10
1/11
2/11
3/11
4/11
5/11
6/11
7/11
8/11
35
40
45
50
55
60
65
70
75
8/10
9/10
10/10
11/10
12/10
1/11
2/11
3/11
4/11
5/11
6/11
7/11
8/11
4.0
4.5
5.0
5.5
6.0
6.5
7.0
8/10
9/10
10/10
11/10
12/10
1/11
2/11
3/11
4/11
5/11
6/11
7/11
8/11
50
55
60
65
70
75
80
85
90
95
8/10
9/10
10/10
11/10
12/10
1/11
2/11
3/11
4/11
5/11
6/11
7/11
8/11
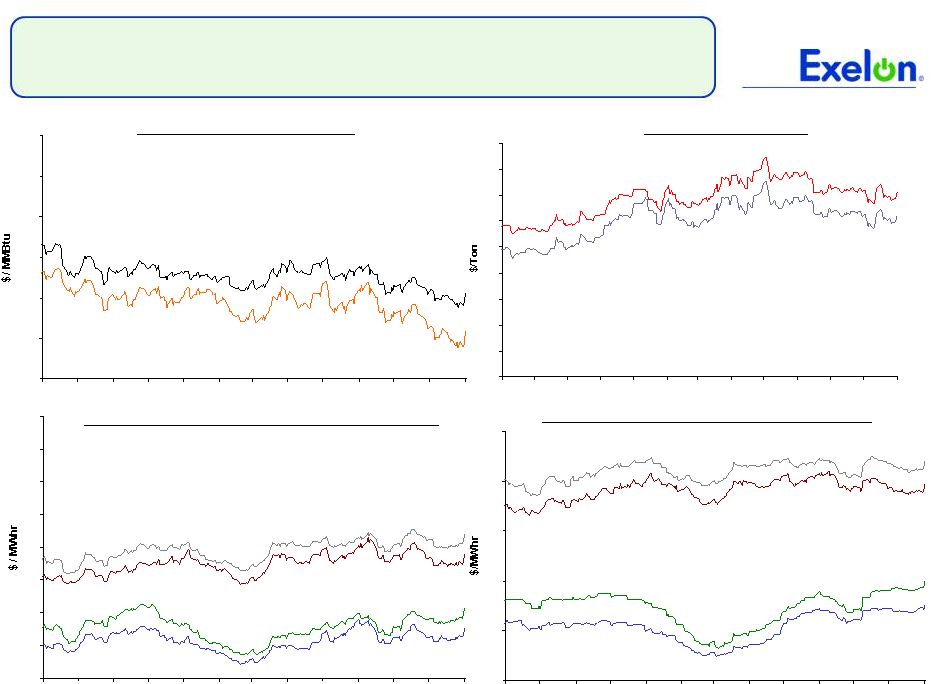
Market Price Snapshot
Forward NYMEX Natural Gas
PJM-West and Ni-Hub On-Peak Forward Prices
PJM-West and Ni-Hub Wrap Forward Prices
2012
$4.58
2013 $5.05
Forward NYMEX Coal
2012
$81.06
2013
$85.51
2012 Ni-Hub $42.62
2013 Ni-Hub
$45.58
2013 PJM-West $56.91
2012 PJM-West
$53.84
2012 Ni-Hub
$27.61
2013 Ni-Hub
$30.00
2013 PJM-West
$42.07
2012 PJM-West
$39.62
21
Rolling
12
months,
as
of
August
31 2011.
Source:
OTC
quotes
and
electronic
trading
system.
Quotes
are
daily.
st |
 4.5
5.5
6.5
7.5
8.5
9.5
10.5
11.5
12.5
13.5
8/10
9/10
10/10
11/10
12/10
1/11
2/11
3/11
4/11
5/11
6/11
7/11
8/11
8.2
8.4
8.6
8.8
9.0
9.2
9.4
9.6
9.8
10.0
10.2
10.4
10.6
8/10
9/10
10/10
11/10
12/10
1/11
2/11
3/11
4/11
5/11
6/11
7/11
8/11
35
40
45
50
55
60
65
8/10
9/10
10/10
11/10
12/10
1/11
2/11
3/11
4/11
5/11
6/11
7/11
8/11
3.5
4.0
4.5
5.0
5.5
6.0
6.5
7.0
8/10
9/10
10/10
11/10
12/10
1/11
2/11
3/11
4/11
5/11
6/11
7/11
8/11
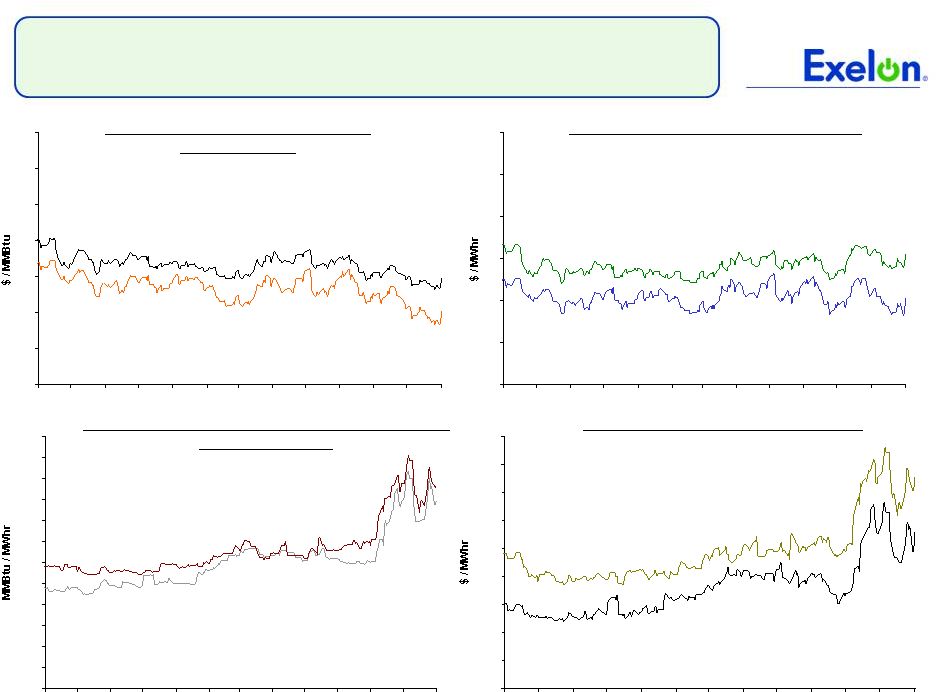
Market Price Snapshot
2013
10.14
2012
10.00
2012
$45.27
2013
$50.53
2012
$4.53
2013
$4.99
Houston Ship Channel Natural Gas
Forward Prices
ERCOT North On-Peak Forward Prices
ERCOT North On-Peak v. Houston Ship Channel
Implied Heat Rate
2012
$10.09
2013
$12.06
ERCOT North On Peak Spark Spread
Assumes a 7.2 Heat Rate, $1.50 O&M, and $.15 adder
22
Rolling
12
months,
as
of
August
31 2011.
Source:
OTC
quotes
and
electronic
trading
system.
Quotes
are
daily.
st |
 Appendix
23 |
 MISO (TWh)
PJM (TWh)
South
(1)
(TWh)
ISO-NE & NY ISO
(2)
(TWh)
West (TWh)
The combination establishes an industry-leading platform with regional
diversification of the generation fleet
(1)
Represents load and generation in ERCOT, SERC and SPP.
(2)
Constellation load includes ~0.7TWh of load served in Ontario.
31.8
147.3
Load
102.1
43.4
58.7
Generation
179.1
Constellation
Exelon
Load
6.3
5.8
0.5
Generation
9.1
9.1
29.5
Load
Generation
14.2
4.8
9.4
2.4
Load
Generation
0.8
0.4
0.4
28.5
23.2
Load
Generation
24
Portfolio Matches Generation with Load in
Key Competitive Markets
Data
for
Exelon
and
Constellation
represents
expected
generation
(owned
and
contracted)
and
booked
electric
sales
for
2011
as
of
12/31/10. This data also includes 2011 partial year generation from Wolf
Hollow (acquired by Exelon). Data also includes 2011 partial year estimated
electric sales from StarTex and MXEnergy (acquired by Constellation). Exelon
load includes ComEd Swap, load sold through affiliates, fixed and indexed load sales and load sold through POLR auctions.
Constellation load includes load sold through affiliates, fixed and indexed load
sales and load sold through POLR auctions. Note:
|
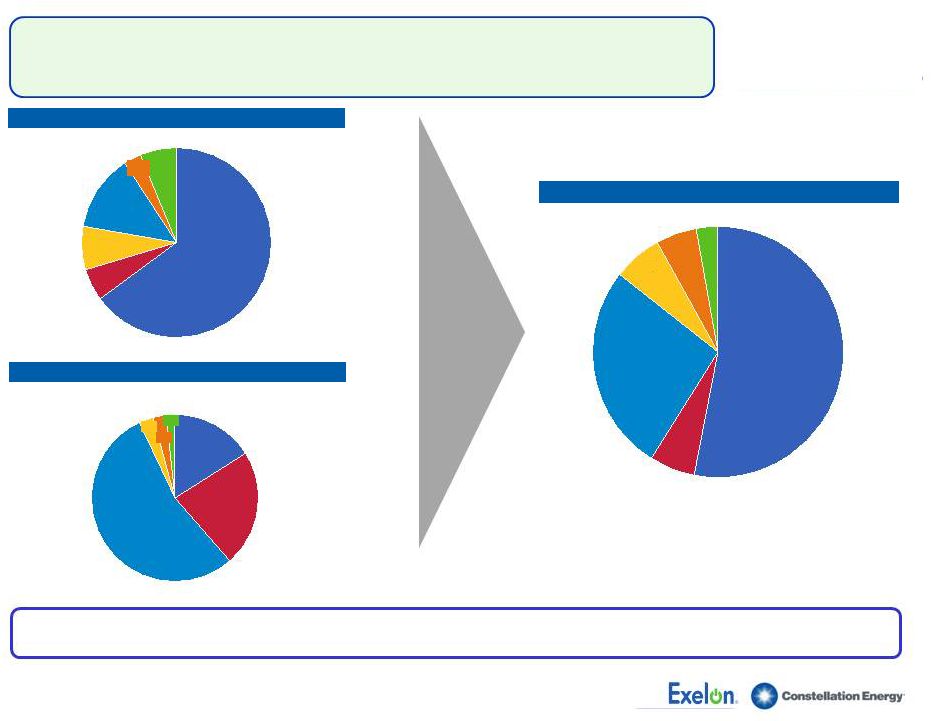 A
Clean Generation Profile Creates Long- Term Value in Competitive
Markets (1)
Exelon
generation
includes
Wolf
Hollow
acquisition
(720
MW
of
natural
gas).
Constellation
generation
includes
Boston
Generation
acquisition
(2,950
MW
of
natural gas). Constellation nuclear reflects 50.01% interest in Constellation Energy
Nuclear Group LLC. Generation capacity doesn’t reflect contracted
capacity.
(2)
Net of physical market mitigation assumed to be 2,648 MW.
Exelon Standalone
(1)
Total Generation: 26,339 MW
Constellation Standalone
(1)
Total Generation: 11,980 MW
Pro forma Company (Net of Mitigation)
(2)
Total Generation: 35,671 MW
Hydro
6%
Wind/Solar/Other
Gas
13%
Oil
Coal
5%
Nuclear
65%
Wind/Solar/Other
Hydro
Oil
Gas
54%
Coal
23%
Nuclear
16%
Wind/Solar/Other
3%
Hydro
5%
Oil
Gas
27%
Coal
6%
Nuclear
53%
25
Combined company remains the premier low-cost generator
7%
6%
3%
3%
2%
2% |
 Merger
Approvals Process on Schedule (as of 9/15/11)
26
Stakeholder
Status of Key Milestones
Filed
Approved
•
SEC has completed its review of the amended S-4
Registration Statement
•
Shareholder
approval
anticipated
in
mid
November
2011
•
Submitted Hart-Scott-Rodino filing on May 31, 2011
for review under U.S. antitrust laws
•
Approval expected by January 2012
•
Filed merger approval application and related filings
on May 20, 2011, which assesses market power-
related issues
•
Approval expected in Q4 2011
•
Filed for indirect transfer of Constellation Energy
licenses on May 12, 2011
•
Approval expected by January 2012
•
Filed for approval with the Maryland Public Service
Commission on May 25, 2011
•
Approval expected by January 5, 2012
•
Filed for approval with the New York State Public
Service Commission on May 17, 2011
•
Approval expected in Q4 2011
•
Filed for approval with the Public Utility Commission of
Texas on May 17, 2011
•
Approval received on August 3, 2011
Securities and Exchange
Commission (SEC)
(File No. 333-175162)
Department of Justice
(DOJ)
Federal Energy Regulatory
Commission (FERC)
(Docket No. EC 11-83)
Nuclear Regulatory
Commission
(Docket Nos. 50-317, 50-318, 50-220,
50-410, 50-244, 72-8, 72-67)
Maryland PSC
(Case No. 9271)
New York PSC
(Case No. 11-E-0245)
Texas PUC
(Case No. 39413) |
 Significant Events
Date of Event
•
Filing of Application
May 25, 2011
•
Intervention Deadline
June 24, 2011
•
Prehearing Conference
June 28, 2011
•
Filing of Staff, Office of People Counsel and Intervenor Testimony
September 16, 2011*
•
Filing of Rebuttal Testimony
October 12, 2011*
•
Filing of Surrebuttal Testimony
October 26, 2011
•
Status Conference
October 28, 2011
•
Evidentiary Hearings
October 31, 2011 -
November 10, 2011
•
Public Comment Hearings
November 29, December 1 &
December 5, 2011
•
Filing of Initial Briefs
December 1, 2011
•
Filing of Reply Briefs
December 15, 2011
•
Decision Deadline
January 5, 2012
Maryland PSC Review Schedule
27
* Initial
intervenor
testimony
with
respect
to
market
power
is
due
on
September
23
rd
for
all
parties except for the Independent Market Monitor, and rebuttal testimony with
respect to market
power
is
due
on
October
17
th
. |
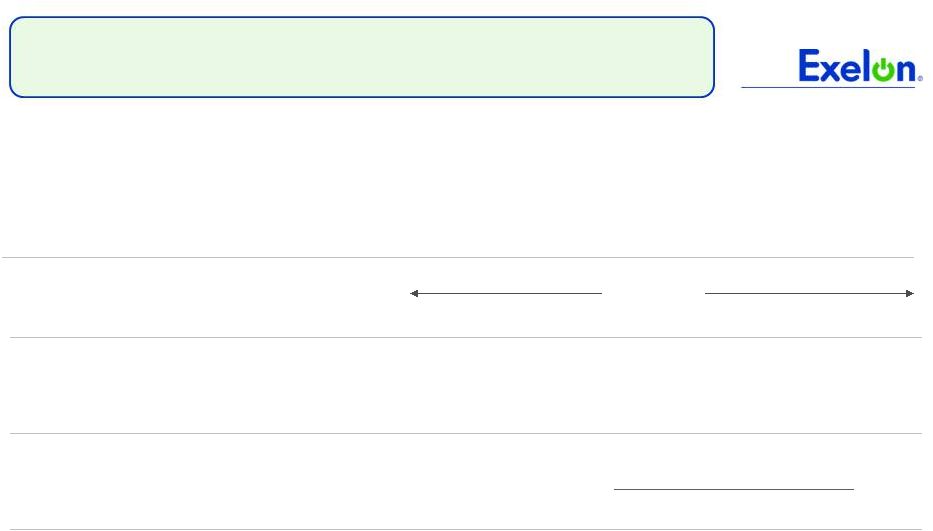
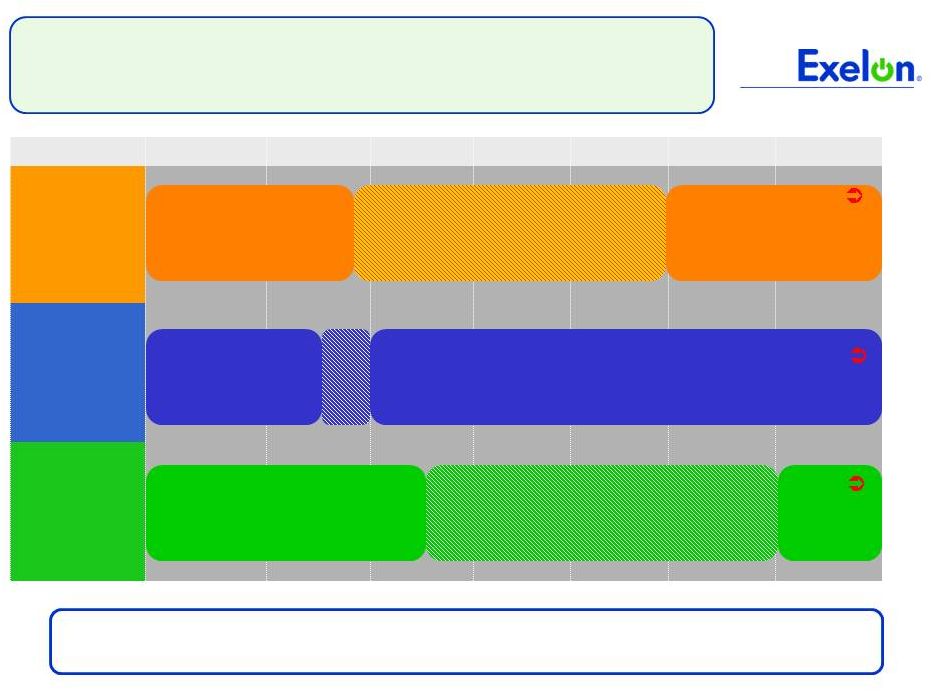 EPA
Regulations Are Moving Forward Develop Toxics Rule
EPA regulations will provide regulatory certainty and
significant environmental benefits
Pre Compliance Period
Compliance With Toxics
Rule
Develop Cross-
State Air Pollution
Rule
Compliance With Cross-State Air Pollution Rule (CSAPR)
Develop 316(b) Regulations
Pre
Compliance Period
Phase In Of
Compliance
28
2010
2011
2012
2013
2014
2015
2016
Hazardous Air
Pollutants
Criteria
Pollutants
Cooling Water
For definition of the EPA regulations referred to on this slide, please see the EPA’s Terms of
Environment (http://www.epa.gov/OCEPAterms/). |
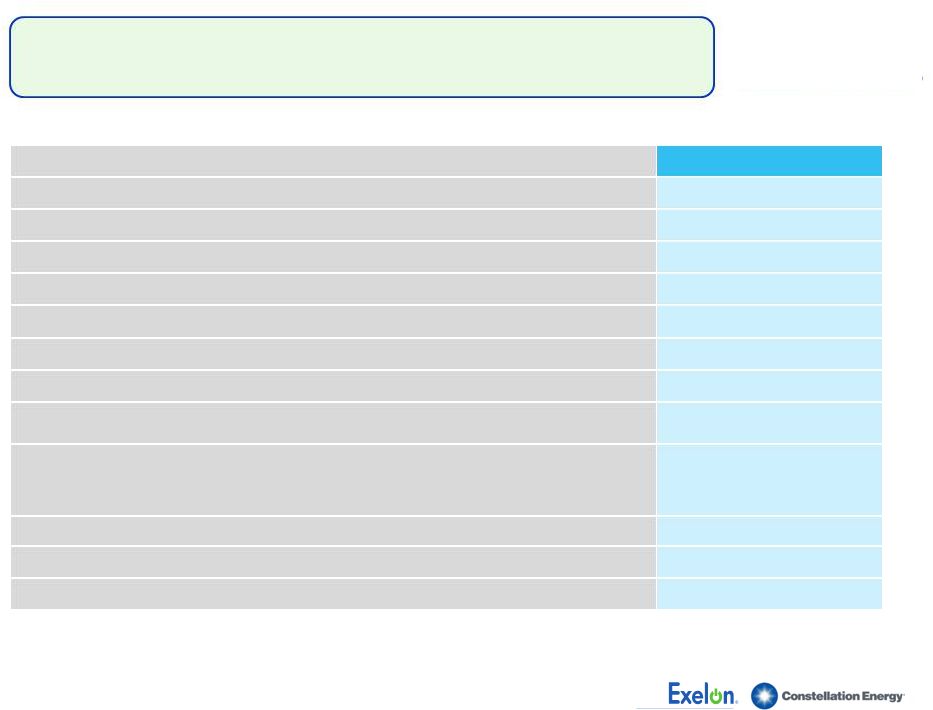
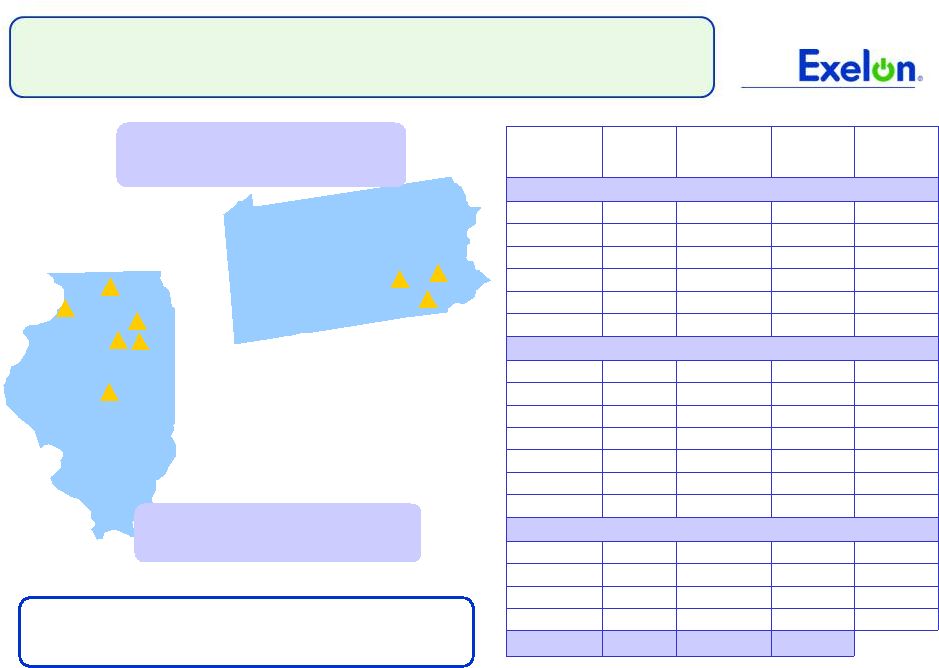 Multi-Regional Nuclear Uprate Program
Station
Base Case
MW
Max Potential
MW
MW Online
to Date
Year of Full
Operation
by Unit
MW Recovery & Component Upgrades:
Quad Cities
97
104
99
2011 / 2010
Dresden
3
3
2013 / 2012
Peach Bottom
25
32
2011 / 2012
Dresden
103
110
19
2012 / 2013
Limerick
4
4
2012 / 2013
Peach Bottom
2
2
2014 / 2015
MUR:
LaSalle
35
39
39
2011 / 2011
Limerick
33
41
30
2011 / 2011
Braidwood
34
42
2012 / 2012
Byron
34
42
2012 / 2012
Quad Cities
21
23
2014 / 2014
Dresden
28
31
2014 / 2015
TMI
12
15
2014
EPU:
Clinton
2
2
2
2010
Peach Bottom
134
148
2015 / 2016
LaSalle
303
336
2016 / 2015
Limerick
306
340
2016 / 2017
Total
1,176
1,314
189
TMI
Limerick
Peach
Bottom
Total Midwest Uprates:
660-732 MW
Total Mid-Atlantic Uprates:
516-582 MW
Quad
Cities
Dresden
Byron
LaSalle
Clinton
Braidwood
Notes: MW shown at ownership. An additional 11 MW expected to come
online by end of 2011 at Peach Bottom 3.
Executing uprate projects across our
geographically diverse nuclear fleet
29 |
 Exelon
Nuclear
Fleet
Overview
-
IL
Plant
Location
Type/
Containment
Water Body
License Extension
Status / License
Expiration
(1)
Ownership
Spent Fuel Storage/
Date to lose full
core discharge
capacity
(2)
Braidwood, IL
(Units 1 and 2)
PWR
Concrete/Steel
Lined
Kankakee
River
Expect to file
application in 2013/
2026, 2027
100%
Dry Cask (Fall 2011)
Byron, IL
(Units 1 and 2)
PWR
Concrete/Steel
Lined
Rock River
Expect to file
application in 2013/
2024, 2026
100%
Dry Cask
Clinton, IL
(Unit 1)
BWR
Concrete/Steel
Lined
Clinton Lake
2026
100%
2018
Dresden, IL
(Units 2 and 3)
BWR
Steel Vessel
Kankakee
River
Renewed / 2029,
2031
100%
Dry cask
LaSalle, IL
(Units 1 and 2)
BWR
Concrete/Steel
Lined
Illinois River
2022, 2023
100%
Dry Cask
Quad Cities, IL
(Units 1 and 2)
BWR
Steel Vessel
Mississippi
River
Renewed / 2032
75% Exelon, 25%
Mid-American
Holdings
Dry cask
30
Exelon pursues license extensions well in advance of expiration to ensure adequate time
for review by the NRC
(1)
Operating license renewal process takes approximately 4-5 years from commencement until completion
of NRC review.
(2)
The date for loss of full core reserve identifies when the on-site storage pool will no longer
have sufficient space to receive a full complement of fuel from the reactor core. Dry cask
storage will be in operation at those sites prior to losing full core discharge capacity in their on-site storage pools. |
 Exelon Nuclear Fleet Overview –
PA and NJ
Plant, Location
Type,
Containment
Water Body
License Extension
Status / License
Expiration
(1)
Ownership
Spent Fuel Storage/
Date to lose full
core discharge
capacity
(2)
Limerick, PA
(Units 1 and 2)
BWR
Concrete/Steel
Lined
Schuylkill
River
Filed application in
June 2011
(decision expected
in 2013)/ 2024,
2029
100%
Dry cask
Oyster Creek, NJ
(Unit 1)
BWR
Steel Vessel
Barnegat Bay
Renewed / 2029
(3)
100%
Dry cask
Peach Bottom, PA
(Units 2 and 3)
BWR
Steel Vessel
Susquehanna
River
Renewed / 2033,
2034
50% Exelon,
50% PSEG
Dry cask
TMI, PA (Unit 1)
PWR
Concrete/Steel
Lined
Susquehanna
River
Renewed / 2034
100%
2023
Salem, NJ (Units 1
and 2)
PWR
Concrete/Steel
Lined
Delaware
River
Renewed / 2036,
2040
42.6% Exelon,
57.4% PSEG
Dry Cask
Exelon pursues license extensions well in advance of expiration to ensure adequate
time
for review by the NRC
31
(1)
Operating license renewal process takes approximately 4-5 years from commencement until completion
of NRC review.
(2)
The date for loss of full core reserve identifies when the on-site storage pool will no longer
have sufficient space to receive a full complement of fuel from the reactor core. Dry cask
storage will be in operation at those sites prior to losing full core discharge capacity in their on-site storage pools.
(3)
On December 8, 2010, Exelon announced that Generation will permanently cease generation operations at
Oyster Creek by December 31, 2019. The current NRC license for Oyster Creek expires in
2029. |
 2011
Projected Sources and Uses of Cash 32
($ millions)
Exelon
(8)
Beginning Cash Balance
(1)
$800
Cash
Flow
from
Operations
(2)
375
875
3,175
4,350
CapEx (excluding Nuclear Fuel, Nuclear
Uprates, Exelon Wind, Utility Growth CapEx
and Wolf Hollow)
(725)
(325)
(850)
(1,950)
Nuclear Fuel
n/a
n/a
(1,050)
(1,050)
Dividend
(3)
(1,400)
Nuclear
Uprates
and
Exelon
Wind
(4)
n/a
n/a
(625)
(625)
Wolf Hollow Acquisition
n/a
n/a
(300)
(300)
Utility Growth CapEx
(5)
(300)
(125)
n/a
(425)
Net Financing (excluding Dividend):
Planned
Debt
Issuances
(6)
1,000
--
--
1,000
Planned Debt Retirements
(6)
(350)
(250)
--
(600)
Other
(7)
300
(125)
200
550
Ending Cash Balance
(1)
$350
(1) Excludes counterparty collateral activity. (2) Cash
Flow from Operations primarily includes net cash flows provided by operating activities and net cash flows used in investing activities other than capital expenditures.
(3)
Assumes 2011 dividend of $2.10/share. Dividends are subject to declaration by the Board of Directors.
(4) Includes $400 million in Nuclear Uprates and $225 million for Exelon Wind spend. (5)
Represents new business, smart grid/smart meter investment and transmission growth projects.
(6) Planned Issuances of $1B at ComEd reflect the $600M January 18, 2011 issuance and $400M of
ComEd’s $600M September 7, 2011 issuance. Incremental $200M of financing was primarily utilized
to retire $191M of tax-exempt debt at ComEd. (7)
“Other” includes proceeds from options and expected changes in short-term debt.
(8) Includes cash flow activity from Holding Company, eliminations, and other corporate
entities.
.
Note: Projected cash flows are as of 6/30/2011
|
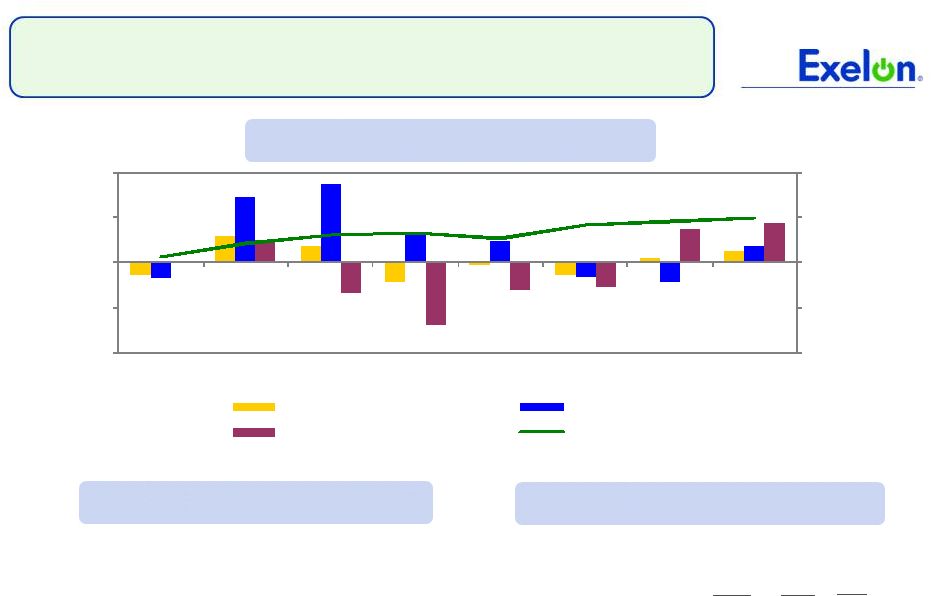 ComEd
Load Trends Chicago
U.S.
Unemployment rate
(1)
9.3%
9.2%
2011 annualized growth in
gross domestic/metro product
(2)
2.5%
Note: C&I = Commercial & Industrial
Weather-Normalized Load Year-over-Year
Key Economic Indicators
Weather-Normalized Load
2010
2Q11 2011E
Average Customer Growth
0.2%
0.4%
Average Use-Per-Customer
(1.4)%
(2.0)%
Total Residential
(1.2)%
(1.6)%
Small C&I
(0.6)%
(0.2)%
Large C&I
2.6%
(0.9)%
All Customer Classes
0.2%
(0.8)%
(1)
Source: U.S. Dept. of Labor (June 2011) and Illinois
Department of Security (June 2011)
(2) Source: Global Insight (May 2011)
-6.0%
-3.0%
0.0%
3.0%
6.0%
-6.0%
-3.0%
0.0%
3.0%
6.0%
1Q10
2Q10
3Q10
4Q10
1Q11
2Q11
3Q11
4Q11
All Customer Classes
Large C&I
Residential
Gross Metro Product
33
0.4%
0.0%
0.4%
(0.3)%
0.0%
0.0%
2.7% |
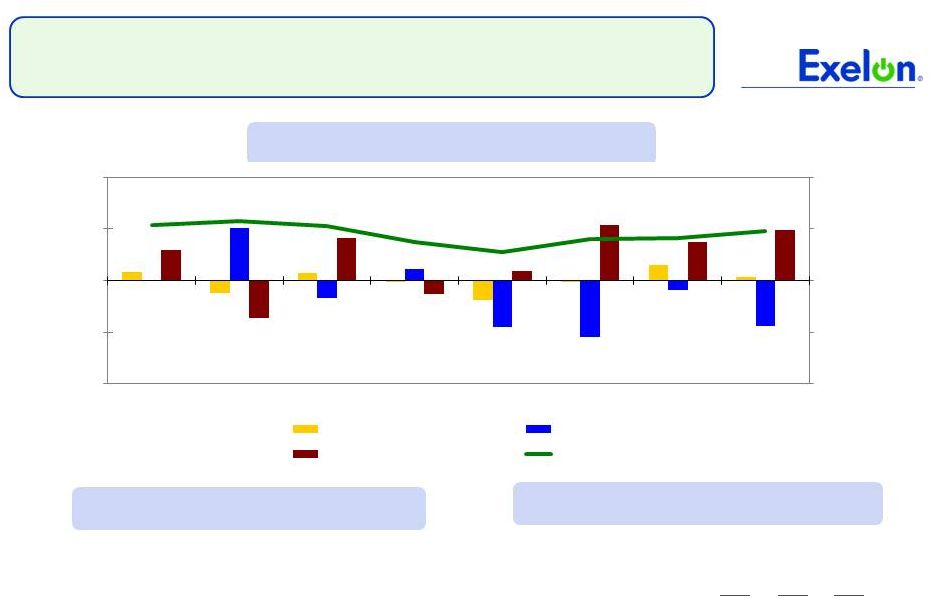 PECO
Load Trends Philadelphia
U.S.
Unemployment rate
(1)
7.9%
9.2%
2011 annualized growth in
gross domestic/metro product
(2)
2.4%
2.7% Note: C&I = Commercial & Industrial
Weather-Normalized Load Year-over-Year
Key Economic Indicators
Weather-Normalized Load
2010
2Q11 2011E
Average Customer Growth
0.3%
0.5%
0.4%
Average Use-Per-Customer
0.3%
2.8%
1.7%
Total Residential
0.5%
3.2% 2.2%
Small C&I
(1.9)%
1.7% 0.7%
Large C&I
0.8%
(3.3)% (2.3)%
All Customer Classes
0.1%
(0.1)% (0.0)%
(1)
Source:
U.S
Dept.
of
Labor
data
June
2011
-
US
U.S
Dept.
of
Labor
prelim.
data
May
2011
-
Philadelphia
(2) Source: Global Insight May 2011
34
-6.0%
-3.0%
0.0%
3.0%
6.0%
-
6.0%
-
3.0%
0.0%
3.0%
6.0%
1Q10
2Q10
3Q10
4Q10
1Q11
2Q11
3Q11
4Q11
All Customer Classes
Large C&I
Residential
Gross Metro Product |