Attached files
| file | filename |
|---|---|
| EX-23.2 - CONSENT OF DELOITTE & TOUCHE LLP - Mascoma Corp | d230618dex232.htm |
| EX-23.1 - CONSENT OF DELOITTE & TOUCHE LLP - Mascoma Corp | d230618dex231.htm |
Table of Contents
As filed with the Securities and Exchange Commission on September 16, 2011.
Registration No. 333-
UNITED STATES SECURITIES AND EXCHANGE COMMISSION
Washington, D.C. 20549
FORM S-1
REGISTRATION STATEMENT
UNDER
THE SECURITIES ACT OF 1933
MASCOMA CORPORATION
(Exact Name of Registrant As Specified in Its Charter)
| Delaware | 2869 | 20-3639247 | ||
| (State or Other Jurisdiction of Incorporation or Organization) |
(Primary Standard Industrial Classification Code Number) |
(I.R.S. Employer Identification Number) |
67 Etna Road, Suite 300
Lebanon, New Hampshire 03766
(603) 676-3320
(Address, Including Zip Code, and Telephone Number, Including Area Code, of Registrant’s Principal Executive Offices)
William J. Brady
President and Chief Executive Officer
Mascoma Corporation
67 Etna Road, Suite 300
Lebanon, New Hampshire 03766
(603) 676-3320
(Name, address, including zip code, and telephone number, including area code, of agent for service)
Copies to:
| Jocelyn M. Arel, Esq. Michael J. Minahan, Esq. William J. Schnoor, Jr., Esq. Goodwin Procter LLP Exchange Place Boston, Massachusetts 02109 (617) 570-1000 |
Deanna L. Kirkpatrick, Esq. Richard D. Truesdell, Jr., Esq. Davis Polk & Wardwell LLP 450 Lexington Avenue New York, New York 10017 (212) 450-4000 |
Approximate date of commencement of proposed sale to the public: As soon as practicable after the effective date of this registration statement.
If any of the securities being registered on this Form are to be offered on a delayed or continuous basis pursuant to Rule 415 under the Securities Act of 1933, check the following box. ¨
If this Form is filed to register additional securities for an offering pursuant to Rule 462(b) under the Securities Act, please check the following box and list the Securities Act registration statement number of the earlier effective registration statement for the same offering. ¨
If this Form is a post-effective amendment filed pursuant to Rule 462(c) under the Securities Act, check the following box and list the Securities Act registration statement number of the earlier effective registration statement for the same offering. ¨
If this Form is a post-effective amendment filed pursuant to Rule 462(d) under the Securities Act, check the following box and list the Securities Act registration statement number of the earlier effective registration statement for the same offering. ¨
Indicate by check mark whether the registrant is a large accelerated filer, an accelerated filer, a non-accelerated filer, or a smaller reporting company. See the definitions of “large accelerated filer,” “accelerated filer” and “smaller reporting company” in Rule 12b-2 of the Exchange Act.
| Large Accelerated Filer ¨ | Accelerated Filer ¨ | |||
| Non-Accelerated Filer x(Do not check if a smaller reporting company) | Smaller Reporting Company ¨ | |||
CALCULATION OF REGISTRATION FEE
|
| ||||
| Title of Each Class of Securities to Be Registered |
Proposed Maximum Aggregate |
Amount of Registration Fee | ||
| Common Stock, par value $0.001 per share |
$100,000,000 | $11,610 | ||
|
| ||||
|
| ||||
| (1) | Estimated solely for the purpose of calculating the registration fee in accordance with Rule 457(o) under the Securities Act of 1933. |
| (2) | Includes additional shares of Common Stock that the underwriters have an option to purchase. |
The registrant hereby amends this registration statement on such date or dates as may be necessary to delay its effective date until the registrant shall file a further amendment which specifically states that this registration statement shall thereafter become effective in accordance with Section 8(a) of the Securities Act of 1933 or until the registration statement shall become effective on such date as the Commission, acting pursuant to such Section 8(a), may determine.
Table of Contents
The information in this prospectus is not complete and may be changed. We may not sell these securities until the registration statement filed with the Securities and Exchange Commission is effective. This prospectus is not an offer to sell these securities and we are not soliciting offers to buy these securities in any state where the offer or sale is not permitted.
PROSPECTUS (Subject to Completion)
Issued , 2011
Shares

COMMON STOCK
Mascoma Corporation is offering shares of its common stock. This is our initial public offering and no public market exists for our shares. We anticipate that the initial public offering price will be between $ and $ per share.
We have applied to list our common stock on the under the symbol “ .”
Investing in our common stock involves risks. See “Risk Factors” beginning on page 11 .
PRICE $ A SHARE
| Price to |
Underwriting |
Proceeds to | ||||
| Per Share |
$ | $ | $ | |||
| Total |
$ | $ | $ |
We have granted the underwriters the right to purchase up to an additional shares of common stock.
The Securities and Exchange Commission and state securities regulators have not approved or disapproved these securities, or determined if this prospectus is truthful or complete. Any representation to the contrary is a criminal offense.
The underwriters expect to deliver the shares of common stock to purchasers on , 2011.
| MORGAN STANLEY | UBS INVESTMENT BANK | CREDIT SUISSE |
| BAIRD | CANACCORD GENUITY |
, 2011
Table of Contents
We and the underwriters have not authorized anyone to provide you with additional or different information from that contained in this prospectus or any free writing prospectus. We and the underwriters take no responsibility for, and can provide no assurance as to the reliability of, any other information that others may give you. We and the underwriters are offering to sell, and seeking offers to buy, shares of our common stock only in jurisdictions where offers and sales are permitted. The information contained in this prospectus is accurate only as of the date on the front cover of this prospectus, or other earlier date stated in this prospectus or in such free-writing prospectus, regardless of the time of delivery of this prospectus or of any sale of our common stock.
For investors outside of the United States: Neither we nor any of the underwriters has done anything that would permit this offering outside the United States or to permit the possession or distribution of this prospectus outside the United States. Persons outside the United States who come into possession of this prospectus must inform themselves about, and observe any restrictions relating to, the offering of the shares of common stock and the distribution of this prospectus outside of the United States.
Unless otherwise indicated, information contained in this prospectus concerning our industry and the markets in which we operate, and those which we intend to target, is based on information from various sources (including industry publications, surveys and forecasts and our internal research), on assumptions that we have made, which we believe to be reasonable, based on that data and other similar sources and on our knowledge of those markets. In most cases, our internal research has not been verified by any independent source. While we believe the industry information included in this prospectus is generally reliable, such information is inherently based on a number of assumptions and limitations and is therefore imprecise. In addition, projections, assumptions and estimates of our future performance and the future performance of the industries in which we operate are necessarily subject to a high degree of uncertainty and risk due to a variety of factors, including those described in the section entitled “Risk Factors” and elsewhere in this prospectus. These and other factors could cause results to differ materially from those expressed in the estimates made by the independent parties and by us.
Mascoma, MGT, the Mascoma logo and other trademarks or service marks of Mascoma appearing in this prospectus are the property of Mascoma. This prospectus contains additional tradenames, trademarks and service marks of other companies.
Until and including, , 2011 (25 days after commencement of this offering), all dealers that buy, sell, or trade shares of our common stock, whether or not participating in this offering, may be required to deliver a prospectus. This delivery requirement is in addition to the obligation of dealers to deliver a prospectus when acting as underwriters and with respect to their unsold allotments or subscriptions.
i
Table of Contents
This summary highlights information contained elsewhere in this prospectus. This summary does not contain all of the information that you should consider in making your investment decision. Before investing in our common stock, you should carefully read this entire prospectus, including our financial statements and the related notes included elsewhere in this prospectus. You should also consider, among other things, the matters described in the sections entitled “Risk Factors” and “Management’s Discussion and Analysis of Financial Condition and Results of Operations,” in each case appearing elsewhere in this prospectus. Unless otherwise stated, all references to “us,” “our,” “Mascoma,” “we,” the “Company” and similar designations in this prospectus refer to Mascoma Corporation and its subsidiaries. In addition, all references to “our hardwood CBP facilities” refer to the first two hardwood CBP facilities that will be built, owned and operated by our collaborators in Kinross, Michigan and Drayton Valley, Alberta and to which we intend to license our technology.
Mascoma Corporation
Overview
We are a renewable fuels company that has developed innovative technology for the low-cost conversion of abundant biomass. Our highly adaptable technology has also been demonstrated to convert biomass to renewable chemicals. Using our proprietary consolidated bioprocessing, or CBP, technology platform, we have developed genetically-modified yeasts and other microorganisms to reduce costs and improve yields in the production of renewable fuels and chemicals. Our CBP technology provides us with the ability to use a variety of feedstocks to produce multiple renewable fuel and chemical end-products. We plan to initially target the large and established first generation corn ethanol industry with our proprietary Mascoma Grain Technology, or MGT, yeast product. We are also working with leading industry participants to develop and construct commercial scale facilities to convert hardwood feedstocks into cellulosic ethanol. We believe that these facilities will offer compelling economic value to us and our collaborators based on the expected operating costs of these facilities and today’s market prices for fuel and feedstocks. In the future, we plan to expand the application of our CBP technology to develop advanced biorefineries that produce multiple high-value end-products, such as advanced fuels and chemicals, from many different feedstocks.
Conversion of cellulosic biomass typically involves a difficult process of breaking down the complex sugars found in plant material into simple, easy-to-process sugars and then converting these simple sugars into end-products. Our proprietary microorganisms, and our methodology for producing them, allow us to streamline the biomass conversion process and alleviate the need to purchase most of the expensive enzymes used in the process. Our microorganisms have been demonstrated to convert different types of plant material into fuel and chemical end-products in industrial processing conditions. We have built on decades of research to develop and acquire intellectual property related to biomass conversion technologies, including in the fields of pretreatment, hydrolysis, metabolic pathway engineering, enzyme expression and processes for biomass conversion. As of September 1, 2011, we owned or had licensed rights to approximately 75 distinct patent families in the United States, Canada and various other foreign jurisdictions covering our products, technologies and processes, which included approximately 9 issued patents and approximately 205 pending patent applications in the United States and various foreign jurisdictions.
We have established a staged strategy for the commercialization of our innovative CBP technology platform in the renewable fuels and chemicals industries. Our first commercial application of CBP technology is our genetically-modified MGT yeast product that can be used by corn ethanol producers as a drop-in substitute for existing yeasts. We expect to begin selling this product in 2012. We believe this product is capable of significantly improving the economics of corn ethanol production with negligible capital expenditures and will generate near-term revenue and gross margin for our company. We intend to capture, through a license
1
Table of Contents
agreement or other arrangement, a significant portion of the incremental margin generated by our line of MGT yeast products. We plan to pursue the corn ethanol market first in order to capitalize on the size and maturity of this market, the technologically advanced nature of our MGT product compared to conventional yeasts and our ability to cost-effectively deploy our CBP technology. Our initial MGT product adds value by alleviating the need to purchase most of the expensive enzymes currently used in corn ethanol production, lowering production costs. Based on laboratory test runs and management estimates of ethanol production costs, we believe that our initial MGT product will reduce the cost of producing corn ethanol by approximately $0.01 to $0.02 per gallon. As a result, we believe that this product can create significant and immediate value to corn ethanol producers, which collectively produced over 13 billion gallons of corn ethanol in the United States in 2010. Future generations of our MGT product are also expected to improve ethanol yields, further lowering production costs and potentially increasing revenue for corn ethanol producers. Based on laboratory test runs, we believe future generations of our MGT product will be capable of ethanol yield improvements of up to 4%. Our MGT yeast products are subject to scientific review by the Center for Veterinary Medicine, or CVM, section of the Food and Drug Administration. See the section entitled “Business—Regulatory Matters” for more information about this regulatory process.
We are also working with leading industry participants to develop and construct commercial scale facilities to convert abundant and low-cost hardwood pulpwood to cellulosic ethanol. Based on pilot production runs at our demonstration facility in Rome, New York, we have achieved hardwood to ethanol conversion yields of 67 gallons per bone dry short ton of hardwood. In a laboratory setting we have achieved ethanol conversion yields of 71 gallons per bone dry short ton of hardwood and we are working to continue to improve conversion yields. At our planned 20 million gallon per year commercial-scale hardwood CBP facility in Kinross, Michigan, we expect to achieve hardwood to ethanol conversion yields of 83 gallons per bone dry short ton of hardwood with unsubsidized cash operating costs of approximately $1.77 per gallon. These estimates assume a hardwood feedstock cost of $66 per bone dry short ton of hardwood and are based on a 20 million gallon per year facility. Over the next several years we are targeting unsubsidized cash operating costs, net of revenue from the sale of co-products such as electricity, of less than $1.00 per gallon based on ethanol yields of 87 gallons per bone dry short ton of hardwood, increases in process efficiencies, economies of scale and ongoing improvements in enzyme expression and metabolic engineering in our microorganisms.
We expect that our first two hardwood CBP facilities will be built in Kinross, Michigan and Drayton Valley, Alberta. We anticipate construction of our hardwood CBP facility in Kinross, Michigan to start in the next 3 to 6 months and construction of our hardwood CBP facility in Drayton Valley, Alberta to start within 12 to 24 months. Our hardwood CBP commercialization strategy is “capital-light,” in that rather than build and operate the hardwood CBP facilities directly, we expect to collaborate with third parties to fund, build, develop and operate the facilities, while we contribute technology and receive fees and/or an equity interest in the facilities. For these two initial hardwood CBP facilities we expect to use government grants in addition to equity funding from strategic partners, but for future facilities we expect to rely primarily on financing from strategic and financial partners.
In the future, we plan to expand the application of our CBP technology to develop advanced biorefineries that produce multiple fuel and chemical end-products from a variety of feedstocks. Beyond corn and hardwood, we have already shown the flexibility of our CBP technology platform through the conversion into ethanol of a number of additional feedstocks in a laboratory setting, including corn stover, sugarcane bagasse, palm residue, softwood, miscanthus, switchgrass, paper sludge and sorghum, many of which are abundant and have limited end uses. We believe our feedstock flexibility will enable us to more effectively enter new geographic markets. In terms of end-products, we have demonstrated in a laboratory setting the production of propanol and fatty acids. These chemicals can in turn be used to create propylene and alkanes, which are the building blocks of many petrochemical replacements, and we plan to continue to expand the number of potential end-products.
2
Table of Contents
Market Opportunity
As a result of our highly adaptable CBP technology platform, we intend to operate across the renewable fuels and chemicals industries, with a near-term focus on ethanol. We believe there is a significant market need for a low-cost, more sustainable alternative to petroleum-based products that is less volatile with respect to price and supply.
First Generation Ethanol
Virtually all the ethanol produced globally today is from edible sugar and starch sources, including corn in the United States and sugarcane in Brazil. These fuels are commonly referred to as first generation biofuels. The ethanol industry has grown significantly over the past several years. According to the Renewable Fuels Association, or RFA, U.S. corn ethanol production increased from 3.6 billion gallons in 2005 to over 13 billion gallons in 2010, which represented a compound annual growth rate of over 30% for that period, and ethanol exports in 2010 hit a record high of 350 million gallons. As of 2010, over 200 ethanol plants existed in the United States. We believe this large and established industry presents a compelling market for our drop-in MGT yeast product. In addition, current ethanol producers benefit from a volumetric ethanol excise tax credit from the Internal Revenue Service of $0.45 per gallon of ethanol produced or sold domestically. With the potential expiration of this credit in the near-term, we believe corn ethanol producers will be motivated to purchase products that reduce operating costs and improve ethanol yields to support their margins.
Second Generation Ethanol
As the demand for biofuels continues to grow, we believe production will shift increasingly from food-based to non-food based sources. Fuels produced from municipal solid waste and non-food plant materials such as hardwood, bagasse, corn stover and dedicated energy crops like switchgrass and miscanthus, are commonly referred to as second generation biofuels. While corn is expected to remain the primary feedstock for ethanol production in the United States in the near-term, there is an increasing push to produce ethanol and other biofuels from non-food plant materials. The U.S. Renewable Fuel Standard Program, or RFS, was established by the U.S. Environmental Protection Agency, or EPA, in 2005 under the Energy Policy Act of 2005. As required by the Energy Independence and Security Act of 2007, the standards were revised in February 2010. We refer to these modifications as RFS2, which, among other requirements, mandate that 36 billion gallons of renewable fuels (such as biofuels) from multiple sources be blended into transportation fuels by 2022. Of the 36 billion gallons of renewable fuels mandated by 2022, 20 billion gallons are mandated to be advanced biofuels (excluding 1 billion gallons of biomass-based diesel), with at least 16 billion gallons required to be cellulosic biofuels. Biofuels are primarily produced from corn, cereal grains, sugarcane and other organic materials. Advanced biofuels are renewable fuels that produce at least 50% less greenhouse gases, or GHG, on a life cycle basis compared to GHG emissions of petroleum products as measured in 2005. Cellulosic biofuels are renewable fuels produced from wood, grasses or non-edible parts of plants that produce at least 60% less GHG on a life cycle basis compared to GHG emissions of petroleum products as measured in 2005. The vast majority of ethanol consumed in the United States today is produced from corn and does not satisfy RFS2 advanced biofuels requirements. We expect the ethanol produced at our hardwood CBP facilities will be a cellulosic biofuel and we intend to capitalize on this mandated market.
Market Challenges
The market for renewable fuels and chemicals has evolved significantly over the past several years, with many companies seeking to capitalize on the growing market potential and the environmental benefits offered by these products. However, many challenges exist and we believe that companies will need to satisfy the following criteria to succeed in this market:
| • | Demonstrated and Validated Technology. Numerous technologies have been offered as solutions for producing renewable fuels and chemicals. However, in order to become economically viable, many |
3
Table of Contents
| of these emerging technologies rely on anticipated technological improvements and future cost reductions. We believe there is a clear market demand for technologies that have been demonstrated and are expected to be cost-competitive at a commercial scale. We believe that the validation and adoption of a particular technology by independent third parties, whether as engineering, off-take or feedstock partners, are critical. |
| • | Comprehensive, Integrated Process. Many of the emerging technologies in the second generation biofuels markets are focused on just one of the steps in the biomass conversion process. These solutions rely on compatibility with, and often improvements in, other stages of the process by third parties in order to achieve economic viability. As a result, we believe there is a strong need for a comprehensive and viable biochemical solution that facilitates biomass conversion without dependence on other pending emerging technologies. |
| • | Low Cost. We believe that market participants are focused on a technology’s all-in cost, which takes into account upfront capital spending as well as ongoing operating costs. Most of the non-feedstock operating costs in current processes are related to the need to purchase most of the expensive enzymes required to make the technology work. For example, we believe enzymes may account for approximately $0.50 per gallon in operating costs for cellulosic ethanol facilities. As a result, we believe a process that eliminates or reduces enzyme and associated costs would have an advantage over other technologies. |
| • | Flexibility. Currently, the vast majority of biofuels are developed from food-based feedstocks such as corn, cereal grains and sugarcane. Given their dependence on a single feedstock, corn ethanol producers have been significantly impacted by volatility in the price of corn. It is expected that future growth in this industry will come from non-food feedstocks. The technologies utilized by producers of first generation ethanol are currently used to produce one primary end-product and are generally unable to process inputs other than their primary feedstock. We believe ethanol producers and other industry participants are looking for a flexible technology that can be applied to different feedstocks and can produce various end-products. |
Our Competitive Strengths
We believe that we benefit from the following competitive strengths:
| • | Proven CBP Technology. We have demonstrated the performance of our MGT yeast product and hardwood CBP technology as follows: |
| • | Validation of the performance of our initial MGT yeast product by ICM, Inc., the leading provider of engineering services to the ethanol industry; |
| • | Successful production runs using our hardwood CBP microorganisms, including more than 1,000 continuous hours of operating data on a fully-integrated basis at our demonstration facility in Rome, New York; |
| • | Validation of our hardwood CBP technology by independent engineers at the U.S. Department of Energy and by independent third parties; and |
| • | Proven commercial use of the core equipment used in our biomass conversion process, with the front-end pretreatment equipment traditionally used in the pulp and paper industries, and the back-end distillation equipment used in the fuels and petrochemical industries. |
| • | Comprehensive and Efficient Biochemical Solution for Biomass Conversion. We know of no other company that provides a comprehensive biochemical solution for the production of renewable fuels and chemicals from multiple feedstocks that covers the full spectrum of the biomass conversion process, including pretreatment, hydrolysis and fermentation. By controlling key aspects of our manufacturing process, we are not reliant on technological improvements or cost reductions by third parties to be |
4
Table of Contents
| cost-competitive. We believe our CBP technology platform, which converts cellulosic biomass into high-value end-products in a single step, increases our ability to reduce costs for both corn ethanol producers and producers of second generation ethanol and provides us with a competitive advantage over other technologies and processes. |
| • | Low All-in Cost Solution. CBP is distinct from other, less integrated configurations, in that it alleviates the need to purchase most of the expensive enzymes associated with most other ethanol production methods while also improving yields. In doing so, the technology enables the cost-effective conversion of cellulosic biomass into renewable fuels and chemicals, and lowers costs in first generation ethanol production. Our substantial experience with CBP technology has enabled us to develop an integrated biomass conversion solution that is differentiated by its cost-effectiveness today, without government subsidies or incentives or third-party improvements in technology or yield. In addition, we believe there will be significant future cost reduction opportunities using our CBP technology as we gain experience with commercial processing and benefit from economies of scale. |
| • | Capital-Light Path to Revenue Generation. The commercialization of our initial MGT yeast product is not dependent on any meaningful capital expenditures by us or any third parties. Our hardwood CBP commercialization strategy is “capital-light,” in that rather than build and operate the hardwood CBP facilities directly, we intend to collaborate with third parties to fund, build, develop and operate the facilities, while we contribute technology and receive fees from and/or an equity interest in each facility to provide us with a share of that facility’s profits and related cash flow. As a result, we believe our business model has the potential to generate significant financial returns while minimizing our operational and financial risk. |
| • | Feedstock Flexible and Adaptable Technology. CBP is a flexible technology that we believe can be adapted for a wide variety of potential feedstocks. As a result, we expect that we will be able to adjust our focus based on long-term changes in the market demand for particular feedstocks. Being feedstock flexible also allows us to provide a value-add product to the mature first generation ethanol market in the near-term, while, over time, adapting our technology for use in different regions based on the feedstock that is the least expensive and most abundant in the region. To date, in addition to our proven ability to convert corn and hardwood, we have also successfully demonstrated in a laboratory setting the ability to convert a number of additional feedstocks including corn stover, bagasse, palm residue, softwood, miscanthus, switchgrass, paper sludge and sorghum. In the long-term, we believe our adaptable CBP technology will also enable us to produce a variety of end-products, including advanced fuels and chemicals. |
| • | Deep Domain Expertise. We believe that our business is differentiated by our ability to leverage the deep domain expertise of an exceptional and distinguished group of executives, scientists and partners. Our management team has a strong, demonstrated record of leadership and growth in the fuel, chemical and biotechnology industries. We were founded by pioneers in consolidated bioprocessing and cellulose conversion, Dr. Lee Lynd and Dr. Charles Wyman, who, together with Dr. Michael Ladisch, are our key science officers. They possess deep domain knowledge of cellulosic biomass, biomass conversion, pretreatment, fermentation and related processes and regularly provide us with insight into important technical and engineering aspects of the conversion of cellulosic biomass into renewable fuels and chemicals. We believe that our combination of management, intellectual property, know-how and technical expertise sets us apart in the industry. |
5
Table of Contents
Our Strategy
We have a staged approach for the commercialization of our CBP technology. We intend to go to market first with our genetically-modified MGT yeast product while also working with leading industry participants to develop and construct commercial scale facilities to convert hardwood feedstocks into cellulosic ethanol. Our long-term goal is to provide the leading technology to advanced biorefineries for the conversion of biomass from non-food plants to fuels and chemicals.
| • | Deploy our Proprietary MGT Product to the Large and Established Corn Ethanol Market. Our first commercial application of CBP technology is our proprietary MGT product, which is a genetically-modified yeast product that can be used by corn ethanol producers as a drop-in substitute for conventional fermenting yeast. Following the completion of CVM review and approval, we intend to market this product to the more than 200 corn ethanol plants that, according to the RFA, produced over 13 billion gallons of ethanol in the United States in 2010. We believe our initial MGT product is capable of significantly improving the economics for corn ethanol producers and will generate near-term revenue and gross margin for our company and requires negligible capital expenditures. Based on laboratory test runs, we believe future generations of our MGT product will be capable of ethanol yield improvements in commercial-scale ethanol production of up to 4%. We believe this compelling value proposition will drive rapid adoption of our MGT products among first generation ethanol producers, solidify our technology leadership position and help establish our credibility in the larger fuel market. |
| • | Convert Hardwood Pulpwood into Cellulosic Ethanol on a Commercial Scale. We believe that converting hardwood to cellulosic ethanol is the best entry point into the advanced biofuels market given the abundant supply and low cost of hardwood feedstock. We are working with leading industry participants to develop and construct our first two hardwood CBP facilities in Kinross, Michigan and Drayton Valley, Alberta. We expect construction of our hardwood CBP facility in Kinross, Michigan to start in the next 3 to 6 months and construction of our hardwood CBP facility in Drayton Valley, Alberta to start within 12 to 24 months. We believe that our hardwood CBP facilities will serve as the foundation for our expansion into new feedstocks and end-products and that the success of our initial hardwood CBP facilities may facilitate the use of traditional project financing for future facilities. |
| • | Expand into New Geographies and Different Feedstocks. Upon successful commercial application of our CBP technology platform to hardwood feedstocks in North America, we believe we will be able to apply this highly adaptable technology to different feedstocks and enter new geographic markets. For example, we believe there is significant market opportunity to adapt our CBP technology through the development of microorganisms to convert sugarcane bagasse and cane trash into ethanol, which are abundant and low-cost feedstocks in Brazil and other geographies. We are also exploring the application of our technology in other countries including Canada, China, India and South Africa. |
| • | Enable Advanced Biorefineries. Our long-term goal is to enable the development of advanced biorefineries that utilize multiple feedstocks to produce a wide variety of high-value fuels and chemicals. The biorefinery concept is analogous to petroleum refineries that currently produce a wide spectrum of fuels and chemicals from petroleum. However, unlike petroleum refineries, a biorefinery utilizing our technology could be adapted for a different feedstock or end-product without significant changes to its installed infrastructure. Through a biorefinery approach, we intend to expand into the industrial chemicals market through conversion of biomass feedstock into higher-value chemicals such as ethylene and propylene derivatives by adding on to existing hardwood CBP facilities and by developing dedicated biomass-to-chemical refineries. The markets for these chemicals are global, growing and significant, and we believe that in the future we will be able to access these markets with our technology platform. |
6
Table of Contents
Risk Factors
Our business is subject to many risks and uncertainties, as more fully described in the section entitled “Risk Factors” in this prospectus, of which you should be aware before investing in our common stock. For example:
| • | We have a limited operating history, a history of losses and the expectation of continuing losses. |
| • | We may not achieve or sustain positive cash flow and we may be unable to obtain additional financing to grow our business, develop or enhance our products or respond to competitive pressures. |
| • | In order to sell any of our MGT yeast products to corn ethanol producers we must obtain regulatory approval, and any delays in receiving approval could have a material adverse effect on our business, financial condition and results of operations. |
| • | Our MGT yeast products may not perform as expected or be accepted by ethanol producers. |
| • | We will rely on third parties to manufacture, validate and commercialize our MGT yeast product, and actions by these third parties may adversely affect the commercialization and market acceptance of our MGT products. |
| • | We have no experience applying our CBP technology to the production of renewable fuels or chemicals at commercial scale and our management has limited experience in the renewable fuels and chemicals business, and as a result, we may not be successful in commercializing our hardwood CBP technology. |
| • | We will rely on third parties to commercialize our hardwood CBP technology and as a result the successful implementation of our technology will be dependent on these parties performing satisfactorily. |
| • | We and our collaborators may encounter unforeseen operational and financial difficulties in constructing our hardwood CBP facilities in Kinross, Michigan and Drayton Valley, Alberta. |
| • | The government grants and awards that we receive are subject to certain conditions and obligations and if we fail to meet our obligations the research funded by these grants and the construction of our initial commercial-scale hardwood CBP facilities may be materially delayed. |
| • | Our hardwood CBP commercialization strategy relies heavily on our ability to negotiate and execute definitive agreements with third parties. |
| • | The market for renewable fuels and chemicals may not develop as anticipated. |
Our Corporate Information
We were incorporated in the state of Delaware on October 14, 2005. Our principal executive offices are located at 67 Etna Road, Suite 300, Lebanon, New Hampshire 03766 and our telephone number is (603) 676-3320. Our website address is www.mascoma.com. We do not incorporate the information on or accessible through our website into this prospectus, and you should not consider any information on, or that can be accessed through, our website as part of this prospectus.
7
Table of Contents
| Common stock offered by us |
shares |
| Common stock to be outstanding after this offering |
shares |
| Underwriter’s option to purchase additional shares |
The underwriters have an option to purchase a maximum of additional shares of common stock from us. The underwriters can exercise this option at any time within 30 days from the date of this prospectus. |
| Use of proceeds |
We estimate that we will receive net proceeds from the sale of shares of our common stock in this offering of approximately $ , or $ if the underwriters fully exercise their option to purchase additional shares, after deducting underwriting discounts and commissions and estimated offering expenses payable by us. We intend to use the net proceeds from this offering for working capital and other general corporate purposes, including for sales and marketing activities related to our MGT yeast product and for research and development activities, including those related to our next-generation MGT yeast products, the scale-up of our hardwood CBP technology and the application of our technology to other potential feedstocks and end-products, including renewable chemicals. We may also use net proceeds for possible investments in, or acquisitions of, complementary businesses, services or technologies. See the section entitled “Use of Proceeds.” |
| Risk factors |
You should read carefully the section entitled “Risk Factors” for a discussion of factors that you should consider before deciding to invest in shares of our common stock. |
The number of shares of our common stock to be outstanding after this offering is based on 54,043,199 shares of our common stock outstanding as of June 30, 2011, and excludes:
| • | 9,535,916 shares of our common stock issuable upon exercise of outstanding options as of June 30, 2011 at a weighted-average exercise price of $2.14 per share; |
| • | 4,986,648 shares of common stock issuable upon the exercise of outstanding warrants as of June 30, 2011 at a weighted-average exercise price of $3.48 per share; and |
| • | 4,513,742 shares of our common stock reserved as of June 30, 2011 for future issuance under our equity incentive plans that are not issued or subject to outstanding grants. |
Except as otherwise indicated, all information in this prospectus is as of June 30, 2011 and reflects or assumes:
| • | the filing of our amended and restated certificate of incorporation and the adoption of our amended bylaws as part of the consummation of this offering; |
| • | the conversion of the outstanding shares of our convertible preferred stock into an aggregate of 46,318,457 shares of our common stock upon the consummation of this offering; and |
| • | no exercise by the underwriters of their option to purchase up to an additional shares of our common stock in this offering. |
8
Table of Contents
SUMMARY CONSOLIDATED FINANCIAL DATA
The following table presents our summary consolidated financial data for the periods indicated. The summary consolidated statement of operations data for the years ended December 31, 2008, 2009 and 2010 presented below are derived from our audited consolidated financial statements that are included elsewhere in this prospectus. The summary consolidated statement of operations data for the six months ended June 30, 2010 and 2011 and the summary condensed consolidated balance sheet data as of June 30, 2011 are derived from our unaudited consolidated financial statements that are included elsewhere in this prospectus. Historical results are not necessarily indicative of the results for future periods. You should read this summary consolidated financial data in conjunction with the sections entitled “Capitalization,” “Selected Consolidated Financial Data” and “Management’s Discussion and Analysis of Financial Condition and Results of Operations” in this prospectus and our consolidated financial statements and the related notes included elsewhere in this prospectus.
| Years Ended December 31, | Six Months Ended June 30, | |||||||||||||||||||
| 2008 | 2009 | 2010 | 2010 | 2011 | ||||||||||||||||
| (in thousands, except share and per share data) | ||||||||||||||||||||
| Consolidated statements of operations data: |
||||||||||||||||||||
| Total revenues |
$ | 3,896 | $ | 8,436 | $ | 15,492 | $ | 5,711 | $ | 6,668 | ||||||||||
|
|
|
|
|
|
|
|
|
|
|
|||||||||||
| Cost or product sales and operating expenses |
||||||||||||||||||||
| Cost of product sales |
— | — | 1,120 | — | 455 | |||||||||||||||
| Research and development(1) |
24,327 | 28,270 | 26,539 | 12,450 | 13,203 | |||||||||||||||
| Selling, general and administrative(1) |
9,344 | 5,059 | 10,212 | 3,947 | 5,036 | |||||||||||||||
| Loss on asset disposals and lease abandonment |
799 | 9,213 | — | — | — | |||||||||||||||
|
|
|
|
|
|
|
|
|
|
|
|||||||||||
| Total cost and operating expenses |
34,470 | 42,542 | 37,871 | 16,397 | 18,694 | |||||||||||||||
|
|
|
|
|
|
|
|
|
|
|
|||||||||||
| Loss from operations |
(30,574 | ) | (34,106 | ) | (22,379 | ) | (10,686 | ) | (12,026 | ) | ||||||||||
| Other income (expense), net |
113 | (1,366 | ) | (3,407 | ) | 288 | (2,337 | ) | ||||||||||||
| Equity in loss of equity method investment |
— | — | (143 | ) | — | (173 | ) | |||||||||||||
|
|
|
|
|
|
|
|
|
|
|
|||||||||||
| Net loss |
(30,461 | ) | (35,472 | ) | (25,929 | ) | (10,398 | ) | (14,536 | ) | ||||||||||
| Amount attributable to redeemable noncontrolling interest |
— | (2,830 | ) | 201 | 87 | 19 | ||||||||||||||
|
|
|
|
|
|
|
|
|
|
|
|||||||||||
| Net loss attributable to Mascoma Corporation |
(30,461 | ) | (38,302 | ) | (25,728 | ) | (10,311 | ) | (14,517 | ) | ||||||||||
| Accretion of redeemable convertible preferred stock |
(216 | ) | (253 | ) | (205 | ) | (124 | ) | (279 | ) | ||||||||||
|
|
|
|
|
|
|
|
|
|
|
|||||||||||
| Net loss attributable to common stockholders of Mascoma Corporation |
$ | (30,677 | ) | $ | (38,555 | ) | $ | (25,933 | ) | $ | (10,435 | ) | $ | (14,796 | ) | |||||
|
|
|
|
|
|
|
|
|
|
|
|||||||||||
| Net loss attributable to Mascoma common stockholders per share—basic and diluted |
$ | (12.25 | ) | $ | (12.61 | ) | $ | (5.39 | ) | $ | (3.15 | ) | $ | (1.92 | ) | |||||
|
|
|
|
|
|
|
|
|
|
|
|||||||||||
| Weighted-average common shares outstanding—basic and diluted |
2,505,159 | 3,058,138 | 4,813,191 | 3,315,566 | 7,724,742 | |||||||||||||||
| Pro forma net loss attributable to Mascoma common stockholders per share (unaudited)—basic and diluted(2) |
$ | (0.52 | ) | $ | (0.27 | ) | ||||||||||||||
| Pro forma weighted-average common shares outstanding (unaudited)—basic and diluted(2) |
49,798,315 | 54,043,199 | ||||||||||||||||||
9
Table of Contents
| (1) | Includes stock-based compensation expense (see the section entitled “Management’s Discussion and Analysis of Financial Condition and Results of Operations—Critical Accounting Policies and Estimates—Stock-Based Compensation” elsewhere in this prospectus for additional information). |
| (2) | Net loss used in computing pro forma basic and diluted net loss per share and the number of weighted-average common shares used in computing pro forma basic and diluted net loss per share give effect to the automatic conversion of all of our outstanding convertible preferred stock into 46,318,457 shares of common stock upon the completion of this offering as if such conversion had occurred at the beginning of the period. |
| As of June 30, 2011 | ||||||||||
| Actual | Pro forma(1) | Pro forma as adjusted(2) | ||||||||
| (in thousands) | ||||||||||
| Consolidated Balance Sheet Data: |
||||||||||
| Cash, cash equivalents and short-term investments |
$ | 12,092 | $ | 12,092 | ||||||
| Working capital |
6,382 | 6,382 | ||||||||
| Total assets |
85,826 | 85,826 | ||||||||
| Long-term debt (including current portion) |
10,000 | 10,000 | ||||||||
| Redeemable convertible preferred stock |
158,269 | — | ||||||||
| Redeemable common stock |
1,172 | — | ||||||||
| Warrant liabilities |
7,429 | — | ||||||||
| Stockholders’ (deficit) equity |
(118,722 | ) | 48,148 | |||||||
| (1) | The pro forma consolidated balance sheet data gives effect to (i) the conversion of all of our outstanding convertible preferred stock in connection with the completion of this offering, (ii) the termination of the put rights held by the holder of our redeemable common stock, and (iii) conversion of all of our warrants for convertible preferred stock into warrants for common stock and the related reclassification of the warrant liabilities to stockholders’ equity upon the completion of this offering. |
| (2) | The pro forma as adjusted consolidated balance sheet data gives effect to (i) the conversion of all of our outstanding convertible preferred stock in connection with the completion of this offering, (ii) the termination of the put rights held by the holder of our redeemable common stock, and (iii) conversion of all of our warrants for convertible preferred stock into warrants for common stock and the related reclassification of the warrant liabilities to stockholders’ equity upon the completion of this offering, and (iv) the sale of shares of common stock in this offering at the initial public offering price of $ per share, after deducting the estimated underwriting discounts and commissions and estimated offering expenses payable by us. |
10
Table of Contents
Investing in our common stock involves a high degree of risk. You should carefully consider the following risks and uncertainties, together with all other information in this prospectus, including our consolidated financial statements and related notes, before investing in our common stock. Any of the risk factors we describe below could adversely affect our business, financial condition or results of operations. The market price of our common stock could decline if one or more of these risks or uncertainties actually occurs, causing you to lose all or part of your investment. Certain statements below are forward-looking statements. See the section entitled “Cautionary Note Regarding Forward-Looking Statements.”
Risks Related to Our Business and Our Industry
We have a limited operating history, a history of losses and the expectation of continuing losses.
Our company has only been in existence since October 2005 and we have no experience in the markets in which we intend to operate. Through June 30, 2011, we generated revenue primarily from government grants and product sales consisting of equipment for the pretreatment of biomass feedstocks. In the year ended December 31, 2010, our total revenue was $15.5 million with government grants constituting 86% of our revenue and product sales and other service agreements constituting 14% of our revenue. We have incurred substantial net losses since our inception, including net losses of $30.5 million, $35.5 million and $25.9 million for the years ended December 31, 2008, 2009 and 2010, respectively, and $14.5 million for the six months ended June 30, 2011. We expect these losses to continue. As of June 30, 2011, we had an accumulated deficit of $138.0 million. We have not yet commercialized any of our products and technologies. We intend to sell our Mascoma Grain Technology, or MGT, yeast product to corn ethanol producers but have not yet negotiated agreements for the manufacture or sale of our MGT yeast product. We also intend to participate in the development and construction of facilities in Kinross, Michigan and Drayton Valley, Alberta for the production of ethanol from hardwood feedstocks, however we and our collaborators have not yet secured financing for the development and construction of these facilities. The risks associated with our ability to commercialize our MGT yeast product and our hardwood consolidated bioprocessing, or CBP, technology are described in more detail below. We expect to continue to incur substantial costs and expenses in connection with our planned commercialization of our MGT yeast product, the planned construction and scale-up of our hardwood CBP facilities in Kinross, Michigan and Drayton Valley, Alberta and the expansion of our research and development activities. We will need to generate and sustain increased revenue levels in future periods in order to become profitable. We cannot assure you that we will ever achieve or sustain profitability on a quarterly or annual basis. Any assessments of our business and predictions you make about our future success or viability may not be as accurate as they could be if we had an operating history on which you could base your assessments and predictions, including our ability to generate revenue and execute our business plan.
We may not achieve or sustain positive cash flow and we may be unable to obtain additional financing to grow our business, develop or enhance our products or respond to competitive pressures.
We are entirely dependent on financing activities to fund our capital expenditures and working capital requirements. To develop our products and technology, we have made significant investments in research and development. Our cash used in operating activities and capital expenditures was $54.5 million, $31.7 million and $22.7 million in the years ended December 31, 2008, 2009 and 2010, respectively, and $11.1 million in the six months ended June 30, 2011. Since our inception through June 30, 2011, we have raised an aggregate of $135.3 million from private placements of equity securities and debt financing, including $105.3 million in proceeds from the sale of preferred equity securities, $10.0 million in proceeds from the sale of convertible notes, and $20.0 million in borrowings under our secured debt financing arrangements. In addition, for our two initial hardwood CBP facilities we expect to use government grants in addition to equity funding from strategic partners, and for future facilities we expect to rely primarily on financing from strategic and financial partners. We anticipate that we will continue to have negative cash flow for the next several years as we continue to incur substantial costs and expenses related to the development and expansion of our business, including our research,
11
Table of Contents
testing and development expenses. Our business will also require significant amounts of working capital to support our growth. Any required additional financing may not be available on terms acceptable to us, or at all. If we raise additional funds by issuing equity securities, you may experience significant dilution of your ownership interest, and the newly-issued securities may have rights senior to those of the holders of our common stock. If we raise additional funds by obtaining loans from third parties, our interest expense would increase. Our inability to generate positive cash flow in the future or raise additional capital on reasonable terms would materially and adversely affect our business, financial condition and results of operations.
In order to sell any of our MGT yeast products to corn ethanol producers, we must obtain regulatory approval, and any delays in receiving approval will have a material adverse effect on our business, financial condition and results of operations.
We intend to sell our proprietary MGT yeast product to corn ethanol producers. Certain by-products of the corn ethanol conversion process are used as animal feed. Our MGT products are genetically modified and are considered to be processing aids in the production of animal feed. As a result, our MGT products are subject to regulation by the U.S. Food and Drug Administration’s Center for Veterinary Medicine, or CVM, and must subsequently be approved by the American Association of Feed Control Officers, or AAFCO. The first release of our MGT product, or MGT 1.0, is currently under scientific review at CVM. Because our MGT product is a genetically modified organism, or GMO, the CVM review process may require significant time. While we expect CVM to complete its review in the fourth quarter of 2011 or early 2012, such reviews can take years, and there is no guarantee the scientific review of our MGT yeast product will result in a positive outcome. Further, approval by CVM does not guarantee approval by AAFCO. We are also developing next-generation MGT product releases that increase yields in addition to further reducing the need for exogenous enzymes, and we will also need to secure regulatory approval of these and any future MGT products used as processing aids in the production of animal feed. We have spent considerable time and resources developing our line of MGT yeast products. Other than government grants and sales of pretreatment equipment, the planned sale of our MGT product to corn ethanol producers is our only potential near-term source of revenue. Any delay in receiving regulatory clearance will slow or prevent the commercialization of these products, which will have a material adverse effect on our business, financial condition and results of operations.
Our MGT yeast products may not perform as expected or be accepted by ethanol producers.
Subject to CVM review and approval and the execution of agreements with third parties required for the manufacture and commercialization of our MGT 1.0 product, we intend to begin selling our MGT 1.0 yeast product to corn ethanol producers for use in the ethanol production process. However, the yeast products currently being used by corn ethanol producers have been used for many years and corn ethanol producers may not be willing to add, or may be skeptical of adding, a new product to their production process. We expect new customers, particularly early adopters, to conduct tests of our products and/or to initially use our products for a limited percentage of their operations in order to confirm for themselves the products’ efficacy and performance. These trials may result in a slower roll-out than expected. ICM, Inc., the leading provider of engineering services to the ethanol industry, has validated the performance of our MGT 1.0 product, however, this product has not yet been tested by a broad range of potential customers or at commercial scale. In addition, while ICM is also in the process of testing our next-generation MGT product, the expected yield increases associated with that product have not yet been validated by any third parties. There can be no assurance that the results of any future tests by ICM, potential customers or other third parties of our MGT products will be consistent with results achieved by us in a pilot or laboratory setting. There can be no assurance that these or any future generations of our MGT product will perform as expected or that the cost savings to corn ethanol producers will meet our or their expectations. Any revenue from our MGT product will be primarily based on the incremental cost savings to corn ethanol producers from using our MGT product and their actual cost savings may not meet our expectations. We intend to sell our MGT product at a higher price than corn ethanol producers currently pay for conventional fermenting yeast. To be successful, we will need to convince corn ethanol producers that the higher price of our
12
Table of Contents
product is justified by the benefits that the product provides. We cannot guarantee that our efforts to educate corn ethanol producers about the benefits of our genetically-modified MGT products will be effective. Even if effective, these efforts may take a significant amount of time and corn ethanol producers may delay large purchases of our MGT product until the benefits are demonstrated at additional test sites. Further, even if producers adopt our MGT 1.0 product, there is no assurance that they will also adopt future releases of our MGT products. Failure by us to successfully market and sell our MGT product to one or more of the corn ethanol industry’s leading participants would directly limit our market penetration and could influence the credibility of our MGT product. If corn ethanol producers do not adopt our MGT product, our business and results of operations will be materially and adversely affected.
We will rely on third parties to manufacture, validate and commercialize our MGT yeast product, and actions by these third parties may adversely affect the commercialization and market acceptance of our MGT products.
While we have not finalized any commercial arrangements, we expect to rely on third parties for the manufacture of our MGT yeast product. Our use of third parties reduces our control over our product and exposes us to certain risks. For example, our operations could be materially disrupted if we lose one of our manufacturers or if one of our manufacturers experiences a significant interruption in its business and is unable meet our demand. If it is necessary to replace our manufacturers, either with toll manufacturers or with our internal resources, we may need to incur additional costs. If any of these manufacturers do not fulfill their contractual duties, meet expected deadlines or provide quality products, we may not be able to meet our obligations to our customers, which could result in damage to our reputation and adversely affect our business and results of operations. We may also rely on our yeast manufacturer or other third parties to assist in the sale of our MGT product to corn ethanol producers. These third parties may not be effective at selling our products. If the third parties we rely on to sell our products do not fulfill their contractual duties or perform effectively, our business, results of operations and financial condition could be materially and adversely affected. Further, if we rely on a single or small number of third parties for the manufacture of our MGT product, we will be exposed to the credit risk of those third parties.
In addition, while we have not yet entered into a definitive agreement, our commercialization strategy for our MGT product also relies in part on our relationship with ICM. ICM is an ethanol plant engineering company that has designed approximately 60% of the operating ethanol production capacity in the United States. ICM helps test and, if the results warrant, validate our MGT product. To date, ICM has provided independent validation of the performance of our initial MGT product and is currently in the process of validating our next-generation MGT product. There can be no assurance that these or future generations of our MGT products will receive validation from ICM or any other third parties on the schedule we expect or at all. We may experience difficulty commercializing these products without third party validation. We expect to rely on ICM to facilitate the adoption of the MGT product by third party corn ethanol producers in their production process. We cannot be certain that a definitive agreement with ICM with regard to the testing of our MGT product will be reached or that ICM will agree to facilitate the adoption of our products by corn ethanol producers. If we do not enter into an agreement or if our relationship with ICM is terminated for any reason or if ICM fails to validate our products, we may encounter difficulties in commercializing our products and accordingly, our business and prospects could be materially and adversely affected.
We have no experience applying our CBP technology to the production of renewable fuels or chemicals at commercial scale and our management has limited experience in the renewable fuels and chemicals business, and as a result, we may not be successful in commercializing our hardwood CBP technology.
To date, we have only produced renewable fuels at pilot scale and have only produced renewable chemicals in a laboratory setting. To successfully commercialize our CBP technology, we must be able to deploy our technology to enable the production of cellulosic ethanol on a cost-competitive basis at commercial scale. We cannot provide any assurance that we will be able to do so. Our management team has significant experience in
13
Table of Contents
our technology, however, the skills and knowledge gained in operating our demonstration facility in Rome, New York may prove insufficient to successfully scale our technology for use at a commercial-scale facility. While we have demonstrated CBP for the conversion of hardwood feedstock into cellulosic ethanol at our demonstration facility in Rome, New York, there are still significant technical, logistical and financial hurdles for us to overcome prior to commercialization. Our management has limited experience with facilities of commercial scale and as a result, we and our collaborators may not be able to resolve technological challenges associated with biomass conversion at this scale. We can provide no assurance that our technology will perform as expected when applied at commercial scale. We are working with leading industry participants to develop and construct our initial hardwood CBP facilities in Kinross, Michigan and Drayton Valley, Alberta. If constructed, these facilities will be the first of their kind in the world. As a result, we and our collaborators will not be able to benefit from the experience of others and are likely to encounter unexpected problems and challenges in the construction and operation of these facilities. The failure of our technology to perform as expected at commercial scale would have a material adverse effect on our business, financial condition and results of operations.
We will rely on third parties to commercialize our hardwood CBP technology and as a result the successful implementation of our technology will be dependent on third parties performing satisfactorily.
While we have not finalized commercial arrangements, we expect to collaborate with third parties to fund, build, develop and operate the commercial-scale hardwood CBP facilities in Kinross, Michigan and Drayton Valley, Alberta, and for future facilities. Our reliance on third parties reduces our control over the funding and construction of these facilities and the production and sale of the ethanol produced using our technology, including the operating costs of the facilities, which will expose us to certain risks. These facilities are first-of-kind projects, and we cannot assure you that our collaborators will be able to complete construction on schedule, effectively operate our CBP technology, produce cellulosic ethanol of sufficient quality or convert hardwood into ethanol at high enough yields and low enough costs to be profitable. If and when these facilities are completed, we will have limited or no control over the amount or timing of resources that our collaborators commit to our collaboration. Our collaborators may experience a change of policy or priorities or may fail to perform their obligations as expected. These collaborators may breach or terminate their agreements with us or otherwise fail to conduct their collaborative activities successfully and in a timely manner. Further, our collaborators may not devote sufficient resources to the manufacturing, marketing or sale of cellulosic ethanol produced using our CBP technology. Moreover, disagreements with a collaborator regarding strategic direction, economics of our relationship, intellectual property or other matters could develop, and any such conflict could reduce our ability to enter into future collaboration agreements and negatively impact our relationships with one or more existing strategic collaborators. In addition, our collaborators may also pursue competing technologies that may ultimately prove more compelling than ours. If any of these events occur, we may not be able to successfully commercialize our hardwood CBP technology. Additionally, our business could be negatively impacted if any of our collaborators undergo a change of control or assigns the rights or obligations under any of our agreements. If any of our collaborators were to assign these agreements to our competitors or to a third party who is not willing to work with us on the same terms or commit the same resources as the current collaborator, our business and prospects could be materially and adversely affected.
We and our collaborators may encounter unforeseen operational and financial difficulties in constructing our hardwood CBP facilities in Kinross, Michigan and Drayton Valley, Alberta.
Currently, our hardwood CBP facilities in Kinross, Michigan and Drayton Valley, Alberta are only in the planning stages and therefore we cannot assure you that these facilities will be completed on the schedules we expect or at all. If and when our collaborators complete construction of our initial-scale hardwood CBP facilities, our collaborators may not be able to process hardwood feedstocks at anticipated yields and volumes, and we and our collaborators may be unable to improve its performance. Constructing a commercial-scale biomass conversion facility of this type and size is a complex and lengthy undertaking that requires sophisticated, multi-disciplinary planning and precise execution. The successful processing of hardwood feedstocks will require integrating the multiple steps in the process into one continuous operation. The production of cellulosic ethanol
14
Table of Contents
in our hardwood CBP facility in Kinross, Michigan represents a “first of its kind” commercialization, and the complete process from sourcing the feedstock to producing ethanol has not yet been demonstrated in one contiguous operation at commercial scale.
Our CBP technology platform is highly complex and the specifications for the pretreatment, hydrolysis, fermentation and distillation processes may need to be adjusted to meet required feedstock, end-product or volume specifications. These adjustments may require additional resources or equipment which could increase costs and delay commercialization. For example, we may not be able to successfully integrate distinct pretreatment processes piloted at our demonstration facility in Rome, New York into a single unit at our planned hardwood CBP facilities. The volume, characteristics and purity of our products may not meet expectations and we may not achieve the economies of scale that we expect. The optimal metabolic pathways needed to reach our targeted yield levels may be patented by other companies, making it expensive or impossible for us to utilize those pathways. If any of these risks were to occur, it would impact the viability and credibility of our CBP technology. We may be unable to lower operating costs and increase our overall yields in order to produce renewable fuels and chemicals on a cost-competitive basis with existing petroleum-based fuel products without government incentives.
Our hardwood CBP facilities will have substantial capital costs, which pose significant risks to the economic viability of these facilities and may make it more difficult to attract government grants, third party investors and collaborators to fund these projects. If we fail to receive expected financing, or if we require additional financing, we may need to seek out new collaborators, which would create delays and increased costs. As described in more detail below, we and our collaborators are relying to some extent on government funding to build these facilities. If these grant agreements are terminated, our and our collaborators’ ability to complete the construction of our planned facilities could be impaired. The construction of additional facilities in the future may also be delayed by increased costs, weather delays, and the receipt of approvals and permits from various regulatory agencies, which may materially impact our business, financial condition and results of operations. Any significant delays in the timing or our commercialization strategy could materially and adversely affect our business, financial condition and results of operations.
The government grants and awards that we receive are subject to certain conditions and obligations and if we fail to meet our obligations the research funded by these grants and the construction of our initial commercial-scale hardwood CBP facilities may be materially delayed.
We are the recipient of government grants and awards, including an award from the U.S. Department of Energy, or DOE, providing for a cost share arrangement related to the construction of a hardwood CBP facility in Kinross, Michigan. The terms of this award require us to use the funds for the construction of an industrial scale fermenter system and the design, construction and operation of an integrated cellulosic ethanol plant for transforming locally grown mixed hardwoods or switchgrass into ethanol. Under this grant, the DOE will provide us with up to approximately $20.0 million, payable in phases and dependent on the results of each phase. As of June 30, 2011, we have received approximately $16.5 million under this award. We are required to make periodic progress reports on the status of our project and notify the DOE of any significant favorable or adverse events during the course of the project. If the DOE terminates this or any other grant agreements with us, our ability to complete the construction of our planned hardwood CBP facility in Kinross, Michigan could be impaired, which could harm our business.
We have also received a grant of up to $20.0 million from the Michigan Strategic Fund, or MSF, to fund our planned hardwood CBP facility in Kinross, Michigan. These funds are to be paid in installments upon certain milestones such as filing required environmental permits and finalizing commercial agreements relating to supply, construction and operation of the planned facility. As of June 30, 2011, we have received approximately $12.1 million from MSF. Our ongoing obligations under this grant agreement include providing regular progress reports on the status of the project and the milestones achieved. Unless earlier terminated for default for, among other things, the failure to meet certain milestones identified in the grant agreement, the term of this grant
15
Table of Contents
agreement lasts through December 2013. If the MSF terminates this grant, our ability to complete the construction of our planned hardwood CBP facility in Kinross, Michigan could be impaired, which could harm our business.
We have also received additional government grants, including grants from the Province of Alberta, Canada, in connection with our planned commercial hardwood CBP facility in Drayton Valley, Alberta and from the BioEnergy Science Center, or BESC, in connection with our research into CBP processing of biomass into ethanol and other end-products. As of June 30, 2011, we have received approximately $5.1 million from BESC. The loss of any of our government grants, for any reason, could materially and adversely impact our research and development efforts and our ability to execute on our staged commercialization strategy. For the year ended December 31, 2010, approximately 86% of our revenue was derived from government grants, and any termination or reduction in this funding, or ability to secure additional government funding, will materially and adversely impact our results of operations and financial condition.
Our hardwood CBP commercialization strategy relies heavily on our ability to negotiate and execute definitive agreements with third parties.
In order to commercialize our hardwood CBP technology, we need to negotiate and enter into definitive agreements with our collaborators for the financing, construction and operation of our planned hardwood CBP facilities in Kinross, Michigan and Drayton Valley, Alberta, as well as enzyme and feedstock supply agreements. We do not have any such definitive agreements in place, and we have no prior experience negotiating these types of agreements. Each of these agreements is crucial to our staged commercialization strategy and we cannot be certain of entering into definitive agreements with any of these parties. If we lose our business relationships with any of our collaborators or potential collaborators for any reason, our business and prospects could be adversely affected.
The market for renewable fuels and chemicals may not develop as anticipated.
We intend to deploy our CBP technology to convert hardwood feedstocks into renewable fuels for use in the biofuels market. However, this market may not develop as quickly as we expect or at all. The market for advanced biofuels, including cellulosic biofuels, is heavily influenced by foreign, federal, state and local government regulations and policies. If the cost of oil decreases significantly, the outlook for the long-term supply of oil to the United States improves or gasoline prices decline over extended periods of time, the perception in government and the private sector could change to our detriment. That is, a diminished belief that cheaper, more readily available energy alternatives should be developed or produced could change and thus reduce the demand for renewable fuels. Changes to existing or adoption of new domestic or foreign federal, state and local legislative initiatives that impact the production, distribution or sale of biofuels may reduce the demand for our technology. The cellulosic biofuels market is still at an early stage of development. There can be no assurance that governmental support for, and commercial interest in, this industry will continue. If the number and capacity of cellulosic biomass conversion facilities does not reach anticipated levels, there will be less demand for our cellulosic conversion technology and our business and results of operations would be adversely affected. In addition, while we utilize a biochemical process for the production of cellulosic ethanol, there are several competing technologies for producing cellulosic ethanol, including a thermochemical process, and we can provide no assurance that these other technologies will not prove to be more effective or successful than ours.
The production of cellulosic biofuels will require significant amounts of feedstock, and our collaborators may experience difficulties obtaining such feedstock.
Following the completion of our planned commercial-scale hardwood CBP facilities in Kinross, Michigan and Drayton Valley, Alberta, the successful production of cellulosic biofuels using our CBP technology will require our collaborators to acquire and process large amounts of hardwood feedstock. We cannot predict the future availability of hardwood or be sure that our collaborators’ feedstock suppliers will be able to supply it in
16
Table of Contents
sufficient quantities, at acceptable prices or in a timely manner. Feedstock availability may be adversely affected by growing-season disruptions, crop yields, increased demand by competitors, crop disease, droughts, floods, infestations, heavy rain storms, hail storms, freezing conditions, hurricanes, fires, other natural disasters, farming decisions or government policies and subsidies. These planned hardwood CBP facilities may be unable to secure access to hardwood feedstock or to secure the transportation of such feedstock on terms acceptable to our collaborators or at all. If these facilities are unable to secure cost-effective access to feedstock, the ability of our technology to produce renewable fuels and, in the long term, chemicals and our ability to execute our business plan would be adversely affected.
We and our collaborators may be unable to locate future facilities near low-cost, abundant and sustainable sources of biomass and adequate infrastructure, which may have an adverse effect on the ability to produce cost-effective renewable fuels and chemicals.
Following the completion of our planned commercial-scale hardwood CBP facilities in Kinross, Michigan and Drayton Valley, Alberta, we expect to locate additional future hardwood CBP facilities in proximity to large sources of hardwood biomass and partner with local project developers and feedstock providers. Our ability to place future facilities in locations where our collaborators can economically produce renewable fuels and chemicals from nearby feedstock and transport those fuels to potential customers will be subject to the availability and cost of land, the availability of adequate infrastructure and skilled labor resources in such areas, the legal and regulatory risks related to land use, permitting and environmental regulations, as well as our collaborators’ ability to finance these facilities. If we and our collaborators are unable to locate facilities at sites that allow economical production and transport of end-products, the ability to cost-effectively produce renewable fuels and chemicals using our technology could be adversely affected.
Our growth depends on customer acceptance of and demand for cellulosic biofuels.
At our planned and future commercial-scale hardwood CBP facilities, we expect to receive fees and/or an equity interest in the hardwood facilities, which would provide us with a share in the returns of the facilities. As a result, we expect our results of operations will be directly impacted by our collaborators’ abilities to successfully market and sell the cellulosic ethanol they produce. Cellulosic ethanol is typically used as a blendstock and consumers of these products frequently impose lengthy and complex product qualification procedures on any new blendstocks, based on finished product specifications, processing considerations, regulatory issues and other factors. Potential customers may be reluctant to adopt new blendstocks due to a lack of familiarity with the cellulosic ethanol to be produced at our hardwood CBP facilities. Any off-take agreements for the sale and purchase of cellulosic ethanol to be produced at our hardwood CBP facilities will be subject to the satisfaction of certain technical, commercial and production requirements, and will contain detailed product specifications. If we do not satisfy these contractual requirements, demand for the cellulosic ethanol to be produced at our hardwood CBP facilities may be adversely affected. In addition, given the rapid technological change and product innovation in our industry, it is possible that the cellulosic ethanol to be produced at our hardwood CBP facilities will be less competitive or less desirable than fuels made using alternative processes and technologies. Any technological breakthroughs in our industry or innovations in alternative sources of energy could reduce demand for the cellulosic ethanol to be produced at our hardwood CBP facilities. If the cellulosic ethanol to be produced at our hardwood CBP facilities does not meet customers’ requirements or if there are technological breakthroughs that reduce customer demand for these products, our business will be adversely affected.
We may face substantial and varied competition, possibly from companies with greater experience and resources.
In the near-term, we expect to sell our MGT yeast product to corn ethanol producers as a drop-in substitute for conventional yeast products that alleviates the need for exogenous enzymes. As a result, our product will compete with both conventional yeast producers as well as companies, such as Novozymes A/S and Genencor, that sell the enzyme that is replaced in part by our MGT product. Many of these companies are substantially larger than us and may have substantially greater resources and larger patent portfolios than we do, and these
17
Table of Contents
companies may reduce the prices of their enzymes in order to compete with our MGT product and retain market share. In addition, we can provide no assurance that these companies will not start developing products that compete with ours.
In addition, we intend to initially deploy our CBP technology to convert hardwood feedstocks into ethanol. While we utilize a biochemical process for the production of cellulosic ethanol, there are several competing technologies for the production of cellulosic ethanol, including a thermochemical process, and we can provide no assurance that these other technologies will not prove to be more effective or successful than ours. In the production of cellulosic biofuels, key competitors include Abengoa Bioenergy, BP, p.l.c., DuPont Danisco Cellulosic Ethanol L.L.C., which is a joint venture between Danisco A/S and E.I. Du Pont De Nemours and Company, and POET, LLC, all of which are developing biological approaches to break down biomass into end-products. None of these companies use exactly the same technological platform or processes as we currently use. More broadly, we expect that the cellulosic ethanol produced at our hardwood CBP facilities will compete with other cellulosic biofuels, advanced biofuels, and renewable fuels developed by established enterprises and new companies that seek to produce these renewable fuels to satisfy RFS2 mandates.
Our ability to compete successfully in these markets will depend on our ability to develop proprietary technologies that produce fuel and chemical products in large volumes and at costs below the prevailing market prices for these products. Many of our competitors have substantially greater production, financial, research and development, personnel and marketing resources and patent portfolios than we do. In addition, certain of our competitors may also benefit from local government programs and incentives that are not available to us. As a result, our competitors may be able to develop competing and/or superior technologies and processes, and compete more aggressively and sustain that competition over a longer period of time than we could. Of immediate concern, a competitor might beat us to the market with a more cost-effective form of consolidated bioprocessing. In addition, certain of our collaborators may purchase products or license technology from, or invest in, our competitors or in technologies that compare with our CBP technology.
Moreover, our technologies and products may be rendered uneconomical or otherwise obsolete by technological advances or entirely different approaches developed by one or more of our competitors. As more companies develop new intellectual property in our markets, the possibility of a competitor acquiring patent or other rights that may limit our freedom to operate, including our ability to exploit products or potential products increases, which could lead to litigation and harm our competitive advantage. In addition, various governments have recently announced a number of spending programs focused on the development of clean technology, including alternatives to petroleum-based fuels and the reduction of carbon emissions. Such spending programs could lead to increased funding for our competitors or the rapid increase in the number of competitors within those markets.
Our limited resources relative to many of our competitors may cause us to fail to anticipate or respond adequately to new developments and other competitive pressures. This failure could reduce our competitiveness and market share, adversely affect our results of operations and financial position, and prevent us from achieving or maintaining profitability.
The price of renewable fuel credits may reduce demand for our technology.
RFS2 allows additional RIN credits to be granted to any refiner or importer of gasoline or diesel fuel who blend into their fuel more than the required percentage of renewable fuels in a given year. These credits may be traded to other parties or may be used in subsequent years to satisfy RFS2 requirements. The trading prices of renewable fuel and advanced biofuel RIN credits are influenced by, among other factors, the transportation costs associated with renewable fuels, the mandated level of renewable fuel use for a specific year, the possibility of waivers of renewable fuel mandates and the expected supply of renewable fuel products. Any reduction in the price of RIN credits could reduce the demand for the cellulosic ethanol produced at our hardwood CBP facilities. Our future success may depend on the ability of our collaborators to produce cellulosic ethanol with our CBP
18
Table of Contents
technology without government incentives on a cost-competitive basis with petroleum-based fuels. If RIN credits, or other current or anticipated government incentives, are reduced significantly or eliminated and petroleum-based fuel prices are lower or comparable to the cost of the cellulosic ethanol to be produced at our hardwood CBP facilities, demand for such products may decline, which could adversely affect our future results of operations.
We may incur significant costs complying with environmental laws and regulations, and failure to comply with these laws and regulations could expose us to significant liabilities.
Our operations are subject to a variety of foreign, federal, state and local environmental laws and regulations governing, among other matters, emissions and discharges to the air, ground and water, and the use, treatment, storage, generation, manufacture and disposal of hazardous and biological materials. For example, we use biological materials and GMOs in our demonstration facility in Rome, New York and such materials will be used in our planned commercial-scale hardwood CBP facilities. Our fermentation process utilizes a GMO which, when used in an industrial process, is regulated as a new microorganism under the Toxic Substances Control Act program, or TSCA, of the U.S. Environmental Protection Agency, or EPA. TSCA requires us to comply with the EPA’s Microbial Commercial Activity Notice submission process to operate our hardwood CBP facilities. In the event of contamination or injury from the use, treatment, storage, generation, manufacture, release, or disposal of these or other hazardous materials, we could be held liable for any resulting damages, and any liability could exceed our insurance coverage. There can be no assurance that violations of environmental, health and safety laws will not occur as a result of human error, accident, equipment failure or other causes.
Compliance with applicable environmental laws and regulations, including current and future greenhouse gas regulation, may be expensive, and the failure to comply with past, present, or future laws could result in, among other things, the imposition of fines or other penalties, regulatory oversight costs, responsibility for third party property damage, product liability and personal injury claims, investigation and remediation costs, the suspension of production, or a cessation of operations. Additionally, we could be jointly and severally liable for environmental damage or contamination at our current or former facilities, including for historical contamination caused by former owners and operators of such facilities. We may also be held liable at third party sites where we have disposed or arranged for disposal of hazardous materials. We expect to encounter similar laws and regulations in most, if not all, of the countries in which we may seek to establish production capabilities. Environmental laws and regulations could become more stringent over time, which could impose greater compliance costs, increase risks and penalties associated with violations, impair our research, development or production efforts and harm our business. The costs of complying with environmental, health and safety laws and regulations, and claims concerning noncompliance or liability with respect to such laws and regulations, could have a material adverse effect on our financial condition or operating results.
Changes in government regulation, including mandates, tax credits, subsidies and other incentives, could have a material adverse effect upon our business and results of operations.
The market for renewable fuels is heavily influenced by foreign, federal, state and local government regulation and policies. Changes to existing or adoption of new domestic or foreign federal, state or local legislative initiatives that impact the production, distribution, sale or import and export of renewable fuels may harm our business. For example, the Energy Independence and Security Act of 2007 set targets for alternative sourced liquid transportation fuels (approximately 14 billion gallons in 2011, increasing to 36 billion gallons by 2022). Of the 2022 target amount, a minimum of 21 billion gallons must be advanced biofuels. In the United States and in a number of other countries, regulations and policies like the U.S. Renewable Fuel Standard Program have been modified in the past and may be modified again in the future. In the United States, the Administrator of the EPA, in consultation with the Secretary of Energy and the Secretary of Agriculture, may waive certain renewable fuels standards, on his or her own motion or in response to a petition requesting such waiver, to avert economic harm or in response to inadequate supply. The Administrator of the EPA is also required to reduce the mandate for cellulosic biofuel use if projected supply for a given year falls below a minimum threshold for that year. The elimination of, or any reduction in, mandated requirements for fuel
19
Table of Contents
alternatives and additives to gasoline may cause demand for biofuels to decline and may deter investment in the research and development of renewable fuels. The Administrator of the EPA could also revise qualification standards for renewable fuels in ways that increase production expenses by requiring different feedstocks, imposing extensive tracking and sourcing requirements, or preventing ethanol produced using our CBP technology from qualifying as a renewable fuel under applicable standards.
In addition, the U.S. Congress has passed legislation, including the Volumetric Ethanol Excise Tax Credit, commonly known as the Blender’s Credit, that extends tax credits to blenders of certain renewable fuel products. However, there is no assurance that this or any other favorable legislation will remain in place. In fact, the Senate recently voted to end the Blender’s Credit, and it is possible that the credit, which currently expires December 31, 2011, will not ultimately be extended by Congress or will survive in a greatly diminished form. Any reduction in, phasing out or elimination of existing tax credits, subsidies and other incentives in the United States and foreign markets for renewable fuels, or any inability of our customers or collaborators to access such credits, subsidies and incentives, may adversely affect demand for our products and increase the overall cost of commercialization of our renewable fuels, which would adversely affect our business. Any inability to address these requirements and any regulatory or policy changes could have a material adverse effect on our business, financial condition and results of operations. In addition, concerns associated with renewable fuels, including land usage, national security interests and food crop usage, are receiving legislative, industry and public attention. To the extent these concerns adversely impact the business of the corn ethanol producers to which we intend to sell our products, our business may also be adversely affected. Any inability to address these requirements and any regulatory or policy changes could have a material adverse effect on our business or the business of our collaborators or customers, and consequently our financial condition and our results of operations.
Ethical, legal and social concerns about genetically engineered products and processes, and similar concerns about the production of fuel from food-based feedstocks, could limit or prevent the use of our products, processes and technologies and limit our revenues.
Some of our products and processes involve the use of GMOs, or genetic engineering technologies. The use of GMOs is subject to laws and regulations in many countries, some of which are new and some of which are still evolving. Our ability to develop and commercialize one or more of our technologies, products, or processes could be limited by the following factors:
| • | public attitudes about the safety and environmental hazards of, and ethical concerns over, genetic research and genetically engineered products and processes, which could influence public acceptance of our technologies, products and processes; |
| • | public attitudes regarding, and potential changes to laws governing, ownership of genetic material, which could harm our intellectual property rights with respect to our genetic material and discourage others from supporting, developing or commercializing our products, processes and technologies; |
| • | public attitudes and ethical concerns surrounding production of feedstocks on land that could be used for other purposes, which could influence public acceptance of our technologies, products and processes or could result in delays or inhibit our ability to construct our initial hardwood CBP facilities; |
| • | governmental reaction to negative publicity concerning GMOs, which could result in greater government regulation of genetic research and derivative products; and |
| • | governmental reaction to negative publicity concerning feedstocks produced on land which could be used for other purposes, which could result in greater government regulation of feedstock sources. |
Any of the risks discussed above could result in increased expenses, delays or other impediments to the public acceptance and commercialization of our products and technologies. In addition, genetically engineered organisms and the production of fuel from food-based feedstocks have received negative publicity and have been the subject of public debate. This adverse publicity could lead to greater regulation and trade restrictions on imports of genetically engineered products or feedstocks grown on land suitable for food production or other purposes.
20
Table of Contents
If we lose key personnel or are unable to attract and retain additional key personnel, it could harm our research and development efforts, delay the commercialization of our products, delay launch of products in our development pipeline and impair our ability to meet our business objectives.
Our business spans a variety of disciplines and requires a management team and employee workforce that is knowledgeable in the many areas necessary for our operations. The loss of any key member of our management team, such as our Chief Executive Officer, or key research and development or operational employees, or the failure to attract and retain such employees, could prevent us from developing and commercializing our products for our target markets and executing our business plans. In particular, our key science officers play an active role in guiding the direction of our research and development program, and the loss of any of these individuals may impact our research and development efforts. We may not be able to attract or retain qualified employees due to the intense competition for qualified personnel among biotechnology and other technology-based businesses and the scarcity of personnel with the qualifications or experience necessary for our business. Hiring, training and successfully integrating qualified personnel into our operation is lengthy and expensive. The market for qualified personnel is very competitive because of the limited number of people available with the necessary technical skills and understanding of our technology and anticipated products. If we are not able to attract and retain the necessary personnel to accomplish our business objectives, we may experience staffing constraints that will adversely affect our ability to support our internal research and development programs or satisfy customer demands for our products. In particular, our product development and research and development programs are dependent on our ability to attract and retain highly skilled scientific, technical and operational personnel. Competition for such personnel from numerous companies and academic and other research institutions may limit our ability to do so on acceptable terms, or at all. Many of our employees are at-will employees, which means that either the employee or we may terminate their employment at any time.
We receive part of our research and development funding through government grants, and a decrease in government support could negatively affect our research and development efforts.
A portion of our research and development activities is funded through government grants. In the year ended December 31, 2010, we recognized $13.3 million in government grant revenues, as compared to total research and development expense of $26.5 million. Based solely on currently secured grants, government funding of our programs will decrease over the next several years. There is no guarantee that we will be able to secure additional grants in the future. The level of government funding of research and development is unpredictable and subject to a variety of factors, including the political process. We may also be subject to audits by government agencies as part of routine audits of our activities funded by government grants. Our ongoing obligations under these grants may include providing regular progress reports on the status of the relevant project and the milestones achieved. Funds available under grants must be applied by us toward the research and development programs specified by the granting agencies, rather than for all of our programs generally. If any of our costs are found to be allocated improperly, the costs may not be reimbursed and any costs already reimbursed may have to be refunded. Accordingly, an audit could result in an adjustment to our revenues and results of operations. In addition to audits, as a recipient of government funding, we are subject to employment standards and diversity requirements, all of which may require management attention and expenditures to ensure compliance.
The rapid growth of our company may place significant demands on our management and our infrastructure.
We have experienced, and may continue to experience, expansion of our business as we continue to make efforts to develop and commercialize our CBP technology. Our growth has placed, and will continue to place, significant demands on our management and our operational and financial infrastructure. In particular, continued growth could strain our ability to:
| • | develop and improve our operational, financial and management controls; |
| • | enhance our reporting systems and procedures; |
| • | recruit, train and retain highly skilled personnel; |
21
Table of Contents
| • | develop and maintain our relationships with existing and potential collaborators; |
| • | maintain our quality standards; and |
| • | ensure customer satisfaction. |
Managing our growth will require significant expenditures and allocation of valuable management resources. If we fail to achieve the necessary level of efficiency in our organization as it grows, our business, results of operations and financial condition would be harmed.
Our prospects and our ability to execute on our business plan are subject to fluctuations in the price of petroleum.
We believe that some of the present and projected demand for advanced biofuels results from relatively recent increases in the cost of petroleum. We intend to use our CBP technology to enable the production of renewable fuels and chemicals as alternatives to corresponding petroleum-based products. If the prices of petroleum-based products decline, the cellulosic ethanol and other products produced using our CBP technology may not be cost-effective alternatives to their petroleum-based counterparts or may be unable to be cost-effective without government incentives. Declining oil prices, or the perception of a future decline in oil prices, would adversely affect corn ethanol prices and the prices our collaborators will be able to obtain for the cellulosic ethanol produced using our CBP technology. As a result, any economic conditions and other factors that impact the price of oil indirectly impact our business. Lower petroleum prices over extended periods of time may change the perceptions in government and the private sector that cheaper, more readily available energy alternatives should be developed and produced. If petroleum prices were to decline from present levels and remain at lower levels for extended periods of time, the demand for renewable fuels could be reduced, and our results of operations and financial condition may be adversely affected. In the future, we will also encounter similar risks in our specialty chemicals business, where declines in the price of oil may make petroleum-based hydrocarbons less expensive, which could reduce the competitiveness of our CBP technology.
Our business will be subject to fluctuations in feedstock prices, such as hardwood, corn and sugar, as well as the price of ethanol.
We expect the success of our planned hardwood CBP facilities to be dependent on the price of hardwood, corn, sugar and other feedstocks. A decrease in the availability of some or all of these feedstocks or an increase in the price may have a material adverse effect on our financial condition and operating results. At certain levels, feedstock prices may make production of ethanol and other products uneconomical, as our collaborators may be unable to pass the full amount of feedstock cost increases on to customers. The price and availability of these feedstocks may be influenced by general economic, market and regulatory factors. These factors include weather conditions, farming decisions, government policies and subsidies with respect to agriculture and international trade, and global demand and supply. The significance and relative impact of these factors on the price of our feedstocks is difficult to predict. In addition, our MGT yeast business will be dependent on the price of, demand for and cost to produce ethanol. Changes in the price of ethanol, whether caused by changes in ethanol production, gasoline prices, regulations, such as the expiration of the Blender’s Credit, seasonal fluctuations or otherwise, will likely impact the demand for our products. To the extent that ethanol production costs increase or the price of ethanol decreases, earnings from ethanol production could suffer, which could have a material adverse effect on our business.
We may not be successful in expanding our business into new geographies, and even if we are successful, we will be exposed to additional risks that we do not face in the United States, which could have an adverse effect on our operations.
Following the construction of our initial commercial-scale hardwood CBP facility in Kinross, Michigan, we expect that we will begin expanding into other new geographies with large sources of feedstocks. We believe Canada and Brazil are attractive markets for our products and technology, however there can be no assurance that
22
Table of Contents
our expansion plans will be realized, or if realized, be successful. There are significant regulatory, business and scientific hurdles to overcome in each of these markets and while we have begun planning for a hardwood CBP facility in Drayton Valley, Alberta, we currently have no immediate plans in Brazil. If we are unable to capitalize on these potential markets, or if we expend significant time and resources on expansion plans that fail or are delayed, our business will be adversely affected. In addition, our Canadian, Brazilian and any other future international business operations could be harmed by a variety of factors relating to international operations, including:
| • | political, economic, diplomatic or social instability; |
| • | tariffs, export or import restrictions, restrictions on remittances abroad or repatriation of profits, duties or taxes that limit our ability to move our products out of these countries or interfere with the import of essential materials into these countries; |
| • | difficulties and increased expenses in complying with a variety of U.S. and foreign laws, regulations and trade standards, including the Foreign Corrupt Practices Act and labor and environmental laws; |
| • | inflation and changing interest rates; |
| • | fluctuation in currency exchange rates; |
| • | tax burden and policies; |
| • | changes in laws, regulations and policies related to renewable fuels and chemicals; |
| • | delays or failures in securing licenses, permits or other governmental approvals necessary to build and operate facilities and use our yeast strains to produce products; |
| • | an inability, or reduced ability, to protect our intellectual property, including any effect of compulsory licensing imposed by government action; |
| • | insufficient investment in developing countries in public infrastructure, including transportation infrastructure, and disruption of transportation and logistics services; and |
| • | difficulties and costs of staffing and managing foreign operations. |
These and other factors could have a material adverse impact on our business, financial condition and results of operations.
If we engage in any acquisitions, we will incur a variety of costs and may potentially face numerous risks that could adversely affect our business and operations.
If appropriate opportunities become available, we may acquire additional businesses, assets, technologies, or products to enhance our business in the future. For example, in 2010 we acquired a pretreatment equipment business from SunOpta Inc. In connection with any future acquisitions, we could issue additional equity securities which would dilute our current stockholders, incur substantial debt to fund the acquisitions, or assume significant liabilities. Acquisitions involve numerous risks, including problems integrating the purchased operations, technologies or products, unanticipated costs, environmental and other liabilities, diversion of management’s attention from our core businesses, adverse effects on existing business relationships with current and/or prospective collaborators, customers and/or suppliers, risks associated with entering markets in which we have no or limited prior experience and potential loss of key employees. We do not have extensive experience in managing the integration process and we may not be able to successfully integrate any businesses, assets, products, technologies or personnel that we might acquire in the future without a significant expenditure of operating, financial and management resources, if at all. The integration process could divert management time from focusing on operating our business, result in a decline in employee morale and cause retention issues to arise from changes in compensation, reporting relationships, future prospects or the direction of the business. Acquisitions may also require us to record goodwill and non-amortizable intangible assets that will be subject to impairment testing on a regular basis and potential periodic impairment charges, incur amortization expenses
23
Table of Contents
related to certain intangible assets, and incur large and immediate write offs and restructuring and other related expenses, all of which could harm our operating results and financial condition. In addition, we may acquire companies that have insufficient internal financial controls, which could impair our ability to integrate the acquired company and adversely impact our financial reporting. If we fail in our integration efforts with respect to any of our acquisitions and are unable to efficiently operate as a combined organization, our business and financial condition may be adversely affected.
If we fail to continue to develop new products and technologies and identify additional market opportunities for our existing products and technologies, our future financial performance would be materially adversely affected.
In competitive, dynamic and rapidly changing industries such as the renewable fuels and chemicals industries, it is critical that we continue to improve our technology and develop new products and these technologies in a timely manner with demonstrable improvements in performance and cost-effectiveness. As new products and technologies enter the market, our products and technologies may become obsolete and customer preference for new products and technologies may adversely impact our business. Our product and technology development efforts has required, and will require, that we expend significant financial and management resources. We have incurred, and we expect to continue to incur, significant research and development expenses. If we are unable to devote adequate resources to develop new products or cannot otherwise successfully develop new products or enhancements that meet customer requirements on a timely basis, our products could lose market share, our revenue could decline and we could experience operating losses. We will need to be able to quickly adapt our development and production processes to meet the advancing needs of the biofuels and advanced chemicals industries. The products we currently derive from our processes, and the feedstocks we use in the production of our products, may not be applicable or compatible with demands in existing or future markets. We may not be able to identify new opportunities as they arise since future applications of any given product may not be readily determinable, and we cannot reasonably estimate the size of any markets that may develop. If we are not able to successfully develop new products, we may be unable to expand or maintain our business.
The terms of our loan and security agreements with Pinnacle may restrict our ability to engage in certain transactions.
In June 2011, we entered into an amended and restated loan agreement and various security agreements with Pinnacle Ventures, L.L.C., or Pinnacle. Pursuant to the terms of these loan and security agreements, we cannot engage in certain actions, including disposing of certain assets, granting or otherwise allowing the imposition of a lien against certain assets, incurring certain kinds of additional indebtedness, acquiring or merging with another entity, or declaring dividends unless we receive the prior approval of Pinnacle. In addition, we granted security interests in substantially all of our assets as collateral for the loan, including all of our registrations or applications for registrations of patents in or to which we have any right, title, interest, claim or demand. If Pinnacle does not consent to any of the actions that we desire to take, we could be prohibited from engaging in transactions which could be beneficial to our business and our stockholders or could be forced to pay the outstanding balance of the loan in full. As of August 31, 2011, the aggregate outstanding principal and interest under the loan from Pinnacle was approximately $10.0 million.
Our stockholders’ deficit, recurring net losses and history of negative cash flows from operations have raised substantial doubt regarding our ability to continue as a going concern.
Our stockholders’ deficit, recurring net losses and history of negative cash flows from operations raise substantial doubt about our ability to continue as a going concern. As a result, our independent registered public accounting firm included an explanatory paragraph in its report on our financial statements as of and for the year ended December 31, 2010 with respect to this uncertainty. We have limited current sources of revenue to sustain our present activities, and we do not expect to generate significant revenue until, and unless, we increase revenue from pretreatment equipment or CVM approves MGT 1.0 and we successfully commercialize MGT 1.0.
24
Table of Contents
Accordingly, to continue as a going concern, we will need to obtain additional financing to fund our operations. Any perceived doubts about our ability to continue as a going concern may make it more difficult for us to obtain financing for the continuation of our operations and could result in the loss of confidence by current and potential collaborators or customers.
Our results of operations will be adversely affected if we fail to realize the full value of our intangible assets.
As of June 30, 2011, our total assets included $28.7 million of net intangible assets. Net intangible assets consist of goodwill and intangible assets associated with the August 2010 acquisition of SunOpta BioProcess Inc., or SBI. We now refer to that business as Mascoma Canada. We test goodwill for impairment on December 31 of each year, and more frequently if potential impairment indicators arise. Our amortizing intangible assets are evaluated for impairment should discrete events occur that call into question the recoverability of the intangible assets. Adverse changes in our business, or adverse changes in the assumptions used to determine the fair value of the Mascoma Canada reporting unit, including our failure to implement our planned commercialization strategy for pretreatment technologies of Mascoma Canada, may result in impairment of our goodwill and intangible assets, which could adversely affect our results of operations.
We have a history of material weaknesses in our internal control over financial reporting, including a material weakness that remains unremediated at December 31, 2010. Failure to achieve and maintain effective internal control over financial reporting could result in our failure to accurately report our financial results.
Management has identified, and our independent registered public accounting firm has noted in its communications with our audit committee in connection with the audits of our financial statements for the years ended December 31, 2008, 2009 and 2010, that we had material weaknesses in the design and operating effectiveness of our internal control over financial reporting. The term material weakness is a deficiency, or a combination of deficiencies, in internal control over financial reporting such that there is a reasonable possibility that a material misstatement of the registrant’s annual or interim financial statements will not be prevented or detected on a timely basis. These material weaknesses resulted in a number of audit adjustments to our financial statements for the periods under audit.
For the years ended December 31, 2008, 2009 and 2010, we have had a material weakness due to insufficient personnel within our accounting function possessing an appropriate level of experience to provide reasonable assurance that transactions were being appropriately recorded in accordance with generally accepted accounting principles. This material weakness remains unremediated at December 31, 2010. Also, for the year ended December 31, 2009, we had a material weakness regarding our failure to have adequate controls to ensure that property and equipment is properly valued and that such assets exist.
During 2010 and 2011 we commenced actions to remediate these material weaknesses, which relate in large part to inadequate staffing. In 2010, we implemented additional procedures and controls and we concluded that the material weakness relating to our controls over the valuation and existence of property and equipment was remediated by December 31, 2010. As is common for companies of our size and development stage, we have outsourced certain administrative functions to a third party, including aspects of our finance and accounting operations. We are, however, in the process of sourcing and hiring additional staff members to our finance organization to continue to address and remediate our remaining material weakness. Any additional weakness in our internal control over financial reporting or failure to make all necessary improvements to address the existing material weakness would require continued disclosure of a material weakness in future filings with the SEC, which could cause our reputation to be harmed and our stock price to decline.
If we fail to maintain an effective system of internal controls, we might be unable to report our financial results accurately or prevent fraud; in that case, our stockholders could lose confidence in our financial reporting, which would harm our business and could negatively impact the price of our stock.
Effective internal controls are necessary for us to provide reliable financial reports and prevent fraud. In addition, Section 404 of the Sarbanes-Oxley Act of 2002, as amended, or the Sarbanes-Oxley Act, will require us and our independent registered public accounting firm to evaluate and report on our internal control over
25
Table of Contents
financial reporting beginning with our Annual Report on Form 10-K for the year ending December 31, 2012. The process of implementing our internal controls and complying with Section 404 will be expensive and time consuming, and will require significant attention of management. We cannot be certain that these measures will ensure that we implement and maintain adequate controls over our financial processes and reporting in the future. Even if we conclude that our internal control over financial reporting provides reasonable assurance regarding the reliability of financial reporting and the preparation of financial statements for external purposes in accordance with generally accepted accounting principles, because of its inherent limitations, internal control over financial reporting may not prevent or detect all fraud or misstatements. Failure to implement required new or improved controls, or difficulties encountered in their implementation, could harm our results of operations or cause us to fail to meet our reporting obligations. If we discover a material weakness, the disclosure of that fact, even if quickly remedied, could reduce the market’s confidence in our financial statements and harm our stock price. In addition, a delay in compliance with Section 404 could subject us to a variety of administrative sanctions, including Securities and Exchange Commission, or SEC, action, ineligibility for short form resale registration, the suspension or delisting of our common stock from and the inability of registered broker-dealers to make a market in our common stock, which would further reduce our stock price and could harm our business.
During the ordinary course of business, we may become subject to lawsuits or indemnity claims, which could materially and adversely affect our business and results of operations.
From time to time, we may in the ordinary course of business be named as a defendant in lawsuits, claims and other legal proceedings. These actions may seek, among other things, compensation for alleged personal injury, workers compensation, employment discrimination, environmental violations or liabilities, breach of contract, property damages or civil penalties and other losses or injunctive or declaratory relief. In the event that such actions or indemnities are ultimately resolved unfavorably at amounts exceeding our accrued liability, or at material amounts, the outcome could materially and adversely affect our reputation, business and results of operations. In addition, payments of significant amounts, even if reserved, could adversely affect our liquidity position.
Our business could be harmed by natural disasters, accidents, systems failures or other unanticipated business interruptions.
We are vulnerable to natural or man-made disasters and other events that could disrupt our and our collaborators’ construction and operations, such as earthquakes, hurricanes, riots, civil disturbances, war, terrorist acts, flood, contamination in our laboratory or production facilities or those of our collaborators, and other events beyond our control. In addition, telecommunications failures or other unanticipated catastrophes, such as computer viruses or other cyber-attacks could cause interruptions in our operations. System failures could cause disruption in our laboratory processes. Disruption in transportation infrastructure could cause delays in shipments to our customers, which could result in the loss of sales and damage to our reputation. In addition, even in the absence of direct damage to our or our collaborators’ operations, these events could have a significant impact on our customers’ businesses, which in turn could result in a negative impact on our results of operations. Extensive or multiple disruptions in our or our collaborators’ operations or our customers’ businesses due to unanticipated catastrophes could have a material adverse effect on our results of operations. In addition, we may not carry sufficient business interruption insurance to compensate us for losses that may occur. Any losses or damages we incur could have a material adverse effect on our cash flows and success as an overall business.
Our ability to use our net operating loss carryforwards to offset future taxable income may be subject to certain limitations.
In general, under Sections 382 and 383 of the U.S. Internal Revenue Code of 1986, as amended, or the Code, a corporation that undergoes an “ownership change” is subject to limitations on its ability to utilize its pre-change net operating loss carryforwards, or NOLs, and its excess credits to offset future taxable income. We have not performed a detailed analysis to determine whether an ownership change as defined in Section 382 of the Code has
26
Table of Contents
occurred after each of our previous issuances of common stock, preferred stock and convertible debt. In addition, if we undergo an ownership change in connection with or after this public offering, our ability to utilize NOLs and excess credits could be limited by Sections 382 and 383 of the Code. Future changes in our stock ownership, some of which are outside of our control, could result in an ownership change as defined in Section 382 of the Code. Furthermore, our ability to utilize NOLs of companies that we may acquire in the future may be subject to limitations. Furthermore, we operate both in the United States and in certain jurisdictions outside the United States. Our non-U.S. operations may in the future generate taxable income that is subject to income or other taxes in the jurisdictions in which those operations are conducted. We cannot utilize NOLs attributable to our U.S. operations to reduce our liability for any such non-U.S. taxes, and we may also be limited in our ability to offset our U.S. taxable income with NOLs from foreign jurisdictions in which we operate.
Risks Related to Our Intellectual Property
Our patents and other protective measures may not adequately protect our products and technologies, and any loss of our intellectual property or unauthorized use of our technologies by others could materially adversely affect our business, financial condition and results of operations.
Our intellectual property portfolio is a valuable asset of our business. To protect our proprietary rights, we rely on a combination of patent, copyright, trademark and trade secret laws, confidentiality procedures and contractual provisions, and physical security measures in the United States and in certain foreign jurisdictions. As of September 1, 2011, we owned or had licensed rights to approximately 75 distinct patent families in the United States, Canada and various other foreign jurisdictions covering our products, technologies and processes. More specifically, as of September 1, 2011, we owned approximately 42 pending United States patent applications (including 8 provisional applications), 5 issued foreign patents, 97 pending foreign applications, and 11 Patent Cooperation Treaty, or PCT, applications eligible for nationalization. As of June 30, 2011, we had licensed rights to approximately 3 issued United States patents, 17 pending United States patent applications (including 3 provisional applications), 1 issued foreign patent, 34 pending foreign applications and 4 PCT applications eligible for nationalization.
In addition, we generally enter into confidentiality and assignment of inventions agreements with our employees, consultants, contractors, collaboration partners and scientific and other business advisers. Such patents and agreements and various other measures we take to protect our intellectual property from use by others may not be effective for various reasons, including, but not limited to, the following:
| • | we may fail to apply for patents on important technologies or processes in a timely fashion, or at all, or we may also abandon applications when we determine that a product or method is no longer of interest; |
| • | there can be no assurance that our pending patent applications will result in issued patents for various reasons, including the existence of conflicting patents or defects in our applications, or that any patents that issue from such pending patent applications will adequately protect our intellectual property, or that such patents will not be challenged by third parties or found by a judicial authority to be invalid or unenforceable; |
| • | we do not know whether the examination of any of our patent applications by the U.S. Patent and Trademark Office or any similar foreign patent offices will require us to narrow any of the claims in our pending patent applications; |
| • | we may not be able to obtain patent protection for some or many of our innovations, and even if we receive patent protection, the scope of our intellectual property rights pursuant to such patents may offer insufficient protection from competition or unauthorized use of our innovations by third parties; |
| • | our products and processes may rely on the technology of others and, therefore, require us to obtain intellectual property licenses from third parties in order for us to manufacture or commercialize our products or practice our processes and we may not be able to obtain or continue to obtain licenses and technologies from these third parties on reasonable terms, or at all; |
27
Table of Contents
| • | the patents we have been granted may not include claims covering our products and processes, may lapse or expire, be challenged, invalidated, circumvented or be deemed unenforceable because of the pre-existence of similar patented or unpatented intellectual property rights or for other reasons, or we may subsequently abandon them; |
| • | our confidentiality agreements may not effectively prevent disclosure or use of confidential information and may not provide an adequate remedy in the event of unauthorized disclosure or use; |
| • | the costs associated with enforcing patents, confidentiality and invention assignment agreements or other intellectual property rights may make effective enforcement prohibitive; |
| • | we may not be aware of infringements or misappropriation, or we may be unable to prevent them; |
| • | our efforts to safeguard our trade secrets may be insufficient to prohibit the dissemination of this confidential information; |
| • | even if we enforce our rights aggressively, injunctions, fines and other penalties may be insufficient to deter violations of our intellectual property rights; |
| • | if we seek to enforce our rights, we may be subject to claims that our intellectual property rights are invalid, otherwise unenforceable, or are licensed to the party against whom we are asserting the claim; and |
| • | other persons may independently develop proprietary technology, information and processes that are functionally equivalent or superior to our proprietary intellectual property and processes but do not infringe or conflict with our patented or unpatented proprietary rights, or may use their own proprietary intellectual property rights to block us from taking full advantage of the market. |
Our patent rights may not provide commercially meaningful protection against competition.
Our success will depend in part on our ability and our licensors’ ability to obtain patents and other intellectual property rights to protect various aspects of our technologies, processes and products. We have adopted a strategy of seeking patents and patent licenses in the United States and in certain foreign countries with respect to certain technologies used in, or relating to, our products and processes.
The scope and validity of patents and success in prosecuting patent applications involve complex legal and factual questions, and, consequently, the issuance, scope, validity, and enforceability of patent positions in our industry are generally uncertain. Patents issued or licensed to us may be challenged, invalidated or circumvented. Moreover, third parties could practice our inventions in secret and/or in territories where we do not have patent protection. Such third parties may then try to sell or import products made using our inventions in and into the United States or other territories. We may be unable to prove that such products were made using our inventions. Additional uncertainty may result from patent reform legislation proposed by the U.S. Congress (including the “America Invents Act” recently approved by the U.S. Congress) and other national governments and from interpretations of the patent laws of the U.S. and other countries by applicable courts and agencies. In addition, because patent applications in the United States and many foreign jurisdictions are typically not published until 18 months after filing, or in some cases not at all, and because publication of discoveries in the scientific literature often lags behind the actual discoveries, there may be additional uncertainty as to the inventorship, and therefore the validity, of any of our owned or licensed issued patents. Accordingly, we cannot be certain that any of our or our licensors’ patent applications will result in issued patents, or even if issued, be sure of their validity or enforceability. Moreover, we cannot predict whether any of our or our licensors’ patent rights will be broad enough in scope to provide commercial advantage and prevent circumvention. In any event, patents are enforceable only upon issuance and only for a limited term. Further, at present, we have a limited number of issued patents and most of our owned and licensed patent portfolio is comprised of pending applications. As a result, our owned and licensed patent portfolio may not provide us with sufficient rights to exclude others from commercializing products similar or identical to ours or otherwise provide us with a competitive advantage.
28
Table of Contents
We may not be able to enforce our intellectual property rights throughout the world.
We may in the future build, or collaborate with others in building, manufacturing facilities using our technologies in countries other than the United States. However, the laws of some foreign countries do not protect intellectual property rights to the same extent as federal and state laws in the United States. Many companies have encountered significant problems in protecting and enforcing intellectual property rights in certain foreign jurisdictions. The legal systems of certain countries, particularly certain developing countries, do not favor the enforcement of patents and other intellectual property protection, particularly those relating to bioindustrial technologies. This could make it difficult for us or our licensors to stop any infringement of our or our licensors’ patents or misappropriation of the subject matter of our other proprietary or intellectual property rights. Proceedings or litigation that we or our licensors initiate to enforce our and our licensors’ patents and other proprietary rights in the U.S. or foreign jurisdictions could result in substantial costs and divert our efforts and attention from other aspects of our business, and put our patents at risk of being invalidated or interpreted narrowly and our patent applications at risk of not issuing. Additionally, we may provoke third parties to assert claims against us. We may not prevail in any lawsuits that we initiate and the damages or other remedies awarded, if any, may not be commercially valuable. Accordingly, our efforts to enforce our intellectual property rights around the world may be inadequate to obtain a significant commercial advantage from the intellectual property that we develop or in-license.
Claims that the operation of our business infringes or misappropriates the intellectual property rights of others could seriously harm our business, operating results and financial condition.
We may not be able to operate our business without infringing third-party patents. Our ability to manufacture and commercialize our proposed technologies, processes and products depends on our and our licensors’ ability to develop, manufacture, market, license and/or sell our proposed technologies, processes and products without infringing the proprietary rights of third parties. Numerous U.S. and foreign patents and pending patent applications owned by third parties exist in fields that relate to our proposed technologies, processes and products and our underlying methodologies and discoveries. In addition, many companies have employed intellectual property litigation as a way to gain a competitive advantage. Third parties may allege that our proposed technologies, processes and products or our methods infringe their patent rights. It is possible that infringement claims may occur as the number of products and competitors in our market increases. In addition, to the extent that we gain greater visibility and market exposure as a public company, we face a greater risk of being the subject of intellectual property infringement claims. We cannot be certain that the conduct of our business does not and will not infringe intellectual property or other proprietary rights of others in the United States and in foreign jurisdictions. If the making, using, selling, offering for sale or importing of our proposed products or practice of our proprietary technologies or processes are found to infringe third party patent rights, we could be prohibited from manufacturing and commercializing the infringing technology, process or product unless we obtain a license under the applicable third party patent and pay royalties or are able to design around such patent. We may be unable to obtain a license on terms acceptable to us, or at all, and we may not be able to redesign our products, microorganisms or processes to avoid infringement. Even if we are able to redesign our products, microorganisms or processes to avoid an infringement claim, our efforts to design around the patent could require significant time, effort and expense and ultimately may lead to an inferior or more costly product and/or process. Any claim of infringement by a third party, even those without merit, could cause us to incur substantial costs defending against the claim and could distract our management from our business. Furthermore, if any such claim is successful, a court could order us to pay substantial damages, including compensatory damages for any infringement, plus prejudgment interest and could, in certain circumstances, treble the compensatory damages and award attorney fees. These damages could be substantial and could harm our reputation, business, financial condition and operating results. A court also could enter orders that temporarily, preliminarily or permanently prohibit us, our licensees and our customers from making, using, selling, offering to sell or importing one or more of our products or practicing our proprietary technologies or processes, or could enter an order mandating that we undertake certain remedial activities. Any of these events could seriously harm our business, operating results and financial condition.
29
Table of Contents
In addition to our patent rights, we rely in part on a combination of trade secret laws, confidentiality procedures and contractual provisions, and physical security measures to protect our proprietary technology. Trade secrets can be difficult to protect and enforce. Confidentiality agreements with employees and others may not adequately prevent disclosures of trade secrets and other proprietary information.
We rely in part on trade secret laws and contractual restrictions to protect some of our confidential and proprietary information, technology and processes, particularly where we do not believe patent protection is appropriate or obtainable. We have taken various measures to protect our trade secrets and other confidential or proprietary information, including requiring our employees and consultants to execute confidentiality agreements upon the commencement of employment or consulting engagement with us. However, trade secrets are difficult to maintain and protect and our security measures may not be effective or sufficient to prevent circumvention or disclosure. In addition, our strategy for scale-up of production and collaborating with third party manufacturers requires us to share confidential and proprietary information with our business partners and other third parties. Our business partners’ employees, consultants, contractors or scientific and other business advisers may unintentionally or willfully breach their confidentiality and/or non-use obligations, including by disclosing our confidential or proprietary information to our competitors. Such agreements may be deemed unenforceable, not provide adequate remedies, or be the subject of disputes that may not be resolved in our favor. Enforcement of claims that a third party has illegally obtained and is using trade secrets is expensive, time consuming and uncertain. In addition, foreign courts are sometimes less willing than U.S. courts to protect trade secrets. If our competitors independently develop equivalent knowledge, methods and know-how, we would not be able to assert our trade secrets against them. To the extent that our employees, consultants or contractors use intellectual property owned by others in their work for us, disputes may arise as to the rights in related or resulting know-how and inventions. Our failure to obtain or maintain trade secret protection could adversely affect our competitive business position.
If our microorganisms are stolen, misappropriated or reverse engineered, others could use these microorganisms to produce processes or products that compete with ours.
A number of third parties, including various collaborators, contract manufacturers, university scientists and researchers, customers and those involved in the shipping and handling of our microorganisms and our primary fermentation products, have access to our proprietary microorganisms and related technologies, including, our genetically modified yeasts and bacteria. If our microorganisms, or the genes that code for our microorganisms, were stolen, misappropriated or reverse engineered based on our disclosures in our patent applications or otherwise, they could be used by third parties for their own commercial gain. In addition, third parties may independently develop substantially similar, analogous or alternative information and technologies to ours. If any of this were to occur, it could be difficult for us to discover, challenge or stop them from using or commercializing our technology, especially in countries with limited intellectual property protection.
Our rights to key intellectual property are licensed to us by third parties and termination of the related agreements would be highly detrimental to us.
We are a party to certain license agreements, pursuant to which we have the right to develop and commercialize key intellectual property underlying certain technology used in our business. Certain of these license agreements impose various diligence, milestone, payment, royalty, insurance and other obligations on us. If we fail to comply with any of these obligations, the applicable licensors may have the right to convert an exclusive license of intellectual property to a nonexclusive license or to terminate the license completely, in which case our competitors may gain access to these important licensed technologies or we may be unable to develop or market products, technologies or processes covered by the licensed intellectual property. Some of our licensors have the right to control the filing, prosecution, maintenance and defense of all licensed intellectual property and, if a third party infringes on any of the licensed intellectual property, to control any legal or other proceedings instituted against that third party for infringement. As a result, our licensors may take actions or make decisions relating to these matters with which we do not agree or which could harm our business or impact our license rights.
30
Table of Contents
There can be no assurance that we will be successful in maintaining our relationships with our licensors or any other research institutions or others or in negotiating additional in-licensing agreements on terms acceptable to us or at all, or that any such arrangements will be successful. In addition, there can be no assurance that other third parties will not enter into arrangements with our licensors or collaboration partners for the development or commercialization of the same or similar products or technologies or that the parties with whom we have made such arrangements will not pursue alternative technologies or develop products on their own or in collaboration with others, including our competitors. If we do not establish sufficient in-licensing arrangements, or if we are unable to maintain or renew our existing agreements in the future, or if we are unable to obtain additional licenses to add to or replace them as the technology advances, or if such rights are licensed to competitors, our business, financial condition and results of operations may be adversely affected. We may enter into additional licenses in the future, and if we fail to comply with obligations under those agreements, we could suffer similar consequences.
We and certain colleges and universities that license intellectual property to us, receive funding from U.S. government agencies, which could negatively affect our intellectual property rights.
Some of our research, as well as some of the research undertaken by the colleges and universities with which we have relationships, has been funded by grants from U.S. government agencies. When new technologies are developed with U.S. government funding, the government obtains certain rights in any resulting patents and technical data, generally including, at a minimum, a nonexclusive license authorizing the government to use the invention or technical data for noncommercial purposes. U.S. government funding must be disclosed in any resulting patent applications, and our rights in such inventions will normally be subject to government license rights, periodic progress reporting, foreign manufacturing restrictions and march-in rights. March-in rights refer to the right of the U.S. government, under certain limited circumstances, to require us to grant a license to technology developed under a government grant to a responsible applicant, or, if we refuse, to grant such a license itself. March-in rights can be triggered if the government determines that we have failed to work sufficiently towards achieving practical application of a technology or if action is necessary to alleviate health or safety needs, to meet requirements of federal regulations or to give preference to U.S. industry. If we breach the terms of our grants, the government may gain rights to the intellectual property developed in our related research.
Furthermore, the terms of our research grants from U.S. government agencies may prohibit us from using the new technologies we have developed using those grants in non-U.S. manufacturing plants, which could adversely affect our business. Under the Bayh-Dole Act of 1980, a party that acquires an exclusive license for an invention that was funded in whole or in part by a federal research grant is subject to the following government rights:
| • | products using the invention that are sold in the United States are to be manufactured substantially in the United States, unless a waiver is obtained; |
| • | the government may force the granting of a license to a third party who will make and sell the needed product if the licensee does not pursue reasonable commercialization of a needed product using the invention; and |
| • | the U.S. government may use the invention for its own needs. |
If we fail to meet these guidelines, we would lose our exclusive rights to these inventions and we would lose potential revenue derived from these inventions.
We may not retain exclusive rights to intellectual property created as a result of our collaborations.
Under certain of our license agreements, our license rights are limited to a certain field of use and/or our licensors have retained certain rights in and outside of our field of use. In addition, under certain of our license agreements and agreements with our research, development or collaboration partners, we are obligated to grant such licensors and collaborators certain rights in and outside of our field of use under any new technology or
31
Table of Contents
intellectual property created as a result of our research, development or collaborations. Such provisions may limit our ability to gain commercial benefit from some of the intellectual property we develop and may lead to costly or time-consuming disputes with parties with whom we have commercial relationships over rights to certain innovations.
Risks Related to Our Common Stock
Our stock price may fluctuate significantly.
Prior to this offering, you could not buy or sell our common stock publicly. An active public market for our common stock may not develop or be sustained after the completion of this offering. We will negotiate and determine the initial public offering price with the underwriters based on several factors. This price may vary from the market price of our common stock after this offering. You may be unable to sell your shares of common stock at or above the initial offering price. The market price of our common stock could fluctuate significantly after this offering. In recent years, the stock market has experienced significant volatility, particularly with respect to technology stocks. The volatility of technology stocks often does not relate to the operating performance of the companies represented by the stock. These and other factors may cause the market price and demand for our common stock to fluctuate substantially, which may limit or prevent investors from readily selling their shares of common stock and may otherwise negatively affect the liquidity of our common stock. In addition, in the past, when the market price of a stock has been volatile, holders of that stock have instituted securities class action litigation against the company that issued the stock. If any of our stockholders brought a lawsuit against us, we could incur substantial costs defending the lawsuit. Such a lawsuit could also divert the time and attention of our management from other business concerns.
If equity research analysts do not publish research or reports about our business or if they issue unfavorable commentary or downgrade our common stock, the price of our common stock could decline.
The trading market for our common stock will rely in part on the research and reports that equity research analysts publish about us and our business. We do not control these analysts. The price of our common stock could decline if one or more equity analysts downgrade our common stock or if analysts issue other unfavorable commentary or cease publishing reports about us or our business.
Future sales of shares by existing stockholders could cause our stock price to decline.
If our existing stockholders sell, or indicate an intent to sell, substantial amounts of our common stock in the public market after the 180-day contractual lock-up and other legal restrictions on resale discussed in this prospectus lapse, the trading price of our common stock could decline significantly and could decline below the initial public offering price. We cannot predict the effect, if any, that future public sales of these shares or the availability of these shares for sale will have on the market price of our common stock. Based on shares of common stock outstanding as of , upon the completion of this offering, we will have outstanding shares of common stock. Of these shares, shares of common stock, plus any shares sold pursuant to the underwriters’ option to purchase additional shares, will be immediately freely tradable, without restriction, in the public market. Our officers, directors and certain stockholders have executed lock-up agreements preventing them from selling any stock they hold for a period of 180 days from the date of this prospectus, subject to certain limited exceptions and extensions described under the section entitled “Underwriting.” The representatives of the underwriters may, in their sole discretion, permit our officers, directors and current stockholders to sell shares prior to the expiration of these lock-up agreements.
After the lock-up agreements pertaining to this offering expire, an additional shares will be eligible for sale in the public market in accordance with and subject to the limitation on sales by affiliates as provided in Rule 144 under the Securities Act of 1933, as amended, or the Securities Act. In addition, as of June 30, 2011, 4,513,742 shares reserved for future issuance under our equity incentive plans, that are not issued or subject to outstanding grants, will become eligible for sale in the public market in the future, subject to certain legal and contractual limitations. Moreover, 180 days after the completion of this offering, holders of shares of our
32
Table of Contents
common stock will have the right to require us to register these shares under the Securities Act pursuant to a registration rights agreement. If our existing stockholders sell substantial amounts of our common stock in the public market, or if the public perceives that such sales could occur, this could have an adverse impact on the market price of our common stock, even if there is no relationship between such sales and the performance of our business.
We will have broad discretion in how we use the net proceeds of this offering. We may not use these proceeds effectively, which could affect our results of operations and cause our stock price to decline.
We will have considerable discretion in the application of the net proceeds of this offering. We currently intend to use the net proceeds from this offering for working capital and other general corporate purposes, including for sales and marketing activities related to our MGT yeast product and for research and development activities, including those related to our next-generation MGT yeast products, the scale-up of our hardwood CBP technology at our initial hardwood CBP facilities and the application of our technology to other feedstocks and end-products, including renewable chemicals. We may also use net proceeds for possible investments in, or acquisitions of, complementary businesses, services or technologies. As a result, investors will be relying upon management’s judgment with only limited information about our specific intentions for the use of the net proceeds of this offering. We may use the net proceeds for purposes that do not yield a significant return or any return at all for our stockholders. In addition, pending their use, we may invest the net proceeds from this offering in a manner that does not produce income or that loses value.
Provisions of Delaware law, our charter documents and our loan agreements could delay or prevent an acquisition of our company, even if the acquisition would be beneficial to our stockholders, and could make it more difficult for you to change management.
Provisions of Delaware law and our amended and restated certificate of incorporation and amended and restated by-laws, which will be effective upon the completion of this offering, may discourage, delay or prevent a merger, acquisition or other change in control that stockholders may consider favorable, including transactions in which stockholders might otherwise receive a premium for their shares. These provisions may also prevent or delay attempts by stockholders to replace or remove our current management or members of our board of directors. These provisions include:
| • | a classified board of directors; |
| • | limitations on the removal of directors; |
| • | advance notice requirements for stockholder proposals and nominations; |
| • | the inability of stockholders to act by written consent or to call special meetings; |
| • | the ability of our board of directors to make, alter or repeal our amended and restated by-laws; and |
| • | the authority of our board of directors to issue preferred stock with such terms as our board of directors may determine. |
The affirmative vote of the holders of at least 75% of our shares of capital stock entitled to vote, and not less than 75% of the outstanding shares of each class entitled to vote thereon as a class, is generally necessary to amend or repeal the above provisions that are contained in our amended and restated certificate of incorporation. Also, absent approval of our board of directors, our amended and restated by-laws may only be amended or repealed by the affirmative vote of the holders of at least 75% of our shares of capital stock entitled to vote. In addition, upon the closing of this offering, we will be subject to the provisions of Section 203 of the Delaware General Corporation Law, which limits business combination transactions with stockholders of 15% or more of our outstanding voting stock that our board of directors has not approved. These provisions and other similar provisions make it more difficult for stockholders or potential acquirers to acquire us without negotiation. These provisions may apply even if some stockholders may consider the transaction beneficial to them. As a result, these provisions could limit the price that investors are willing to pay in the future for shares of our common
33
Table of Contents
stock. These provisions might also discourage a potential acquisition proposal or tender offer, even if the acquisition proposal or tender offer is at a premium over the then current market price for our common stock.
We do not intend to pay cash dividends. We have never paid dividends on our capital stock and we do not anticipate paying any dividends in the foreseeable future. Consequently, any gains from an investment in our common stock will likely depend on whether the price of our common stock increases.
We have not paid dividends on any of our capital stock to date and we currently intend to retain our future earnings, if any, to fund the development and growth of our business. In addition, the terms of our outstanding indebtedness restrict our ability to pay dividends, and any future indebtedness that we may incur could preclude us from paying dividends. Investors should not purchase our common stock with the expectation of receiving cash dividends. As a result, capital appreciation, if any, of our common stock will be your sole source of gain for the foreseeable future. Consequently, in the foreseeable future, you will likely only experience a gain from your investment in our common stock if the price of our common stock increases.
An active trading market for our common stock may not develop, and you may not be able to resell your shares at or above the initial public offering price.
Prior to this offering, there has been no public market for shares of our common stock. Although we have applied to have our shares of common stock listed on the in connection with this offering, an active trading market for our shares may never develop or be sustained following this offering. The initial public offering price of our common stock will be determined through negotiations between us and the underwriters. This initial public offering price may not be indicative of the market price of our common stock after this offering. In the absence of an active trading market for our common stock, investors may not be able to sell their common stock at or above the initial public offering price or at the time that they would like to sell.
We will incur significant increased costs as a result of operating as a public company, and our management will be required to devote substantial time to new compliance initiatives.
We have never operated as a stand-alone public company. As a public company, we will incur significant legal, accounting and other expenses that we did not incur as a private company. As a public company, we will be subject to rules and regulations that regulate corporate governance practices of public companies, including the Securities Exchange Act of 1934, as amended, the Sarbanes-Oxley Act, and rules promulgated by . We expect that compliance with these public company requirements will make some activities more time consuming and may result in a diversion of management’s time and attention from revenue-generating activities. For example, we will create new board committees, adopt new internal controls and disclosure controls and procedures, and devote significant management resources to our SEC reporting requirements. A number of those requirements will require us to carry out activities we have not done previously. For example, beginning with our Annual Report on Form 10-K filed after our fiscal year ended December 31, 2012, we will need to document and test our internal control procedures, our management will need to assess and report on our internal control over financial reporting and our independent registered public accounting firm will need to issue an opinion on that assessment and the effectiveness of those controls. Furthermore, if we identify any issues in complying with those requirements (for example, if we or our independent registered public accounting firm identify a material weakness in our internal control over financial reporting), we may be required to devote additional management attention to rectify those issues, and the existence of those issues could adversely affect us, our reputation or investor perceptions of us.
Investors in this offering will pay a much higher price than the book value of our common stock.
If you purchase common stock in this offering, you will pay more for your shares than the amounts paid by existing stockholders for their shares. You will incur immediate and substantial dilution of $ per share, representing the difference between our pro forma net tangible book value per share after giving effect to this offering and an assumed initial public offering price of $ per share, which is the midpoint of the estimated price range set forth on the cover page of this prospectus.
34
Table of Contents
CAUTIONARY NOTE REGARDING FORWARD-LOOKING STATEMENTS
This prospectus contains forward-looking statements that are based on our management’s belief and assumptions and on information currently available to our management. Although we believe that the expectations reflected in these forward-looking statements are reasonable, these statements relate to future events or our future financial performance, and involve known and unknown risks, uncertainties and other factors that may cause our actual results, levels of activity, performance or achievements to be materially different from any future results, levels of activity, performance or achievements expressed or implied by these forward-looking statements.
In some cases, you can identify forward-looking statements by terminology such as “may,” “will,” “should,” “expects,” “intends,” “plans,” “anticipates,” “believes,” “estimates,” “predicts,” “potential,” “continue” or the negative of these terms or other comparable terminology. These statements are only predictions. You should not place undue reliance on forward-looking statements because they involve known and unknown risks, uncertainties and other factors, which are, in some cases, beyond our control and which could materially affect results. Factors that may cause actual results to differ materially from current expectations include, among other things, those listed in the section entitled “Risk Factors” and elsewhere in this prospectus. If one or more of these risks or uncertainties occur, or if our underlying assumptions prove to be incorrect, actual events or results may vary significantly from those implied or projected by the forward-looking statements. No forward-looking statement is a guarantee of future performance. You should read this prospectus and the documents that we reference in this prospectus and have filed with the Securities and Exchange Commission as exhibits to the registration statement, of which this prospectus is a part, completely and with the understanding that our actual future results may be materially different from any future results expressed or implied by these forward-looking statements.
In particular, forward-looking statements in this prospectus include statements about:
| • | the size and growth potential of the potential markets for renewable fuels and advanced fuels and chemicals, and our ability to serve these markets; |
| • | the rate and degree of market acceptance of our initial MGT product and of any future product releases by corn ethanol producers; |
| • | the ability of our MGT product to improve corn ethanol producers’ gross margins in the near-term and to improve corn ethanol yields in the future and our ability to capture some of the economics of these improvements; |
| • | our ability to attract strategic partners with development and commercialization expertise; |
| • | the acceptance and success of our capital-light model for the application of our technology platform at our hardwood CBP facilities; |
| • | the timing of the construction and commencement of operations at our planned hardwood CBP facilities; |
| • | the availability of suitable and cost-competitive feedstock; |
| • | the expected operating costs, cost competitiveness and relative performance attributes of our hardwood CBP facilities, including ethanol yields; |
| • | the ability of our technology to facilitate the production of renewable fuels at commercial scale; |
| • | our research and development activities, including development of new products, and projected expenditures; |
| • | our plans to develop, manufacture and commercialize our products with respect to multiple feedstocks, and to expand into new geographic markets; |
| • | changes in laws, regulations, and policies, including those relating to environmental requirements and renewable fuel standards; |
35
Table of Contents
| • | our ability to expand the application of our CBP technology to develop advanced biorefineries that produce advanced fuels and chemicals; |
| • | the ethanol produced at facilities using our hardwood CBP technology qualifying as cellulosic biofuel and thereby satisfying the RFS2 advanced biofuels requirements; |
| • | our ability to obtain and maintain regulatory approval for our products; |
| • | timing of commercial sales of our products; |
| • | our plans to develop, manufacture, and commercialize our products; |
| • | our use of the proceeds of this offering; |
| • | our ability to obtain and maintain intellectual property protection for our products and processes; |
| • | the accuracy of our estimates regarding expenses, future revenues, capital requirements and needs for additional financing and our ability to obtain additional financing; |
| • | the future price of corn and other renewable feedstocks; |
| • | the future price of petroleum and products derived from petroleum; |
| • | our ability to secure continued government grant funding; and |
| • | our share of the cash flow from our hardwood CBP facilities. |
The forward-looking statements in this prospectus represent our views as of the date of this prospectus. We anticipate that subsequent events and developments may cause our views to change. However, while we may elect to update these forward-looking statements at some point in the future, we have no current intention of doing so except to the extent required by applicable law. Therefore, these forward-looking statements do not represent our views as of any date other than the date of this prospectus.
36
Table of Contents
We estimate that our net proceeds from the sale of the shares of our common stock in this offering will be approximately $ , or $ if the underwriters fully exercise their option to purchase additional shares, based upon an assumed initial public offering price of $ per share, which represents the midpoint of the estimated price range set forth on the cover page of this prospectus, and after deducting underwriting discounts and commissions and estimated offering expenses payable by us.
We currently intend to use the net proceeds of this offering for working capital and other general corporate purposes, including for sales and marketing activities related to our MGT yeast product and for research and development activities, including those related to our next-generation MGT products, the scale-up of our hardwood CBP technology and the application of our technology to other potential feedstocks and end-products, including renewable chemicals. We may also use net proceeds for possible investments in, or acquisitions of, complementary businesses, services or technologies. We have no current agreements or commitments with respect to any investment or acquisition and we currently are not engaged in negotiations with respect to any investment or acquisition. In addition, the amount of what, and timing of when, we actually spend for these purposes may vary significantly and will depend on a number of factors, including our future revenue and cash generated by operations and the other factors described in the section entitled “Risk Factors” in this prospectus. Accordingly, our management will have broad discretion in applying the net proceeds of this offering. Pending specific application of our net proceeds, we intend to invest the net proceeds in high quality, investment grade, short-term fixed income instruments which include corporate, financial institution, federal agency or U.S. government obligations.
37
Table of Contents
We have never declared or paid dividends on our common stock. We do not anticipate paying any dividends on our common stock in the foreseeable future. We currently intend to retain all available funds and any future earnings to fund the development and growth of our business. Any future determination to declare dividends will be subject to the discretion of our board of directors and will depend on various factors, including applicable laws, our results of operations, financial condition, future prospects and any other factors deemed relevant by our board of directors. In addition, the terms of our outstanding indebtedness restrict our ability to pay dividends, and any future indebtedness that we may incur could preclude us from paying dividends. Investors should not purchase our common stock with the expectation of receiving cash dividends.
38
Table of Contents
The following table sets forth our cash, cash equivalents and short-term investments, and capitalization as of June 30, 2011:
| • | on an actual basis; |
| • | on a pro forma basis to give effect to the conversion of the outstanding shares of our convertible preferred stock, par value $0.001 per share, into an aggregate of 46,318,457 shares of our common stock, the termination of the put rights held by the holder of our redeemable common stock, and conversion of all of our warrants for convertible preferred stock into warrants for common stock and the related reclassification of the warrant liabilities to stockholders’ equity; and |
| • | on a pro forma as adjusted basis to give further effect to the filing of our amended and restated certificate of incorporation and our sale in this offering of shares of our common stock at an assumed initial public offering price of $ per share, which represents the midpoint of the estimated price range set forth on the cover page of this prospectus, and after deducting underwriting discounts and commissions and estimated offering expenses payable by us. |
You should read this table in conjunction with the sections entitled “Selected Consolidated Financial Data” and “Management’s Discussion and Analysis of Financial Condition and Results of Operations” and our financial statements and related notes included elsewhere in this prospectus.
| As of June 30, 2011 | ||||||||||||
| Actual | Pro Forma |
Pro Forma as Adjusted(1) |
||||||||||
| (in thousands, except share and per share data) | ||||||||||||
| Cash, cash equivalents and short-term investments |
$ | 12,092 | $ | 12,092 | ||||||||
|
|
|
|
|
|
|
|||||||
| Long-term debt, including current portion |
$ | 10,000 | $ | 10,000 | ||||||||
|
|
|
|
|
|||||||||
| Warrant liabilities |
7,429 | — | — | |||||||||
|
|
|
|
|
|||||||||
| Redeemable noncontrolling interests |
2,610 | 2,610 | ||||||||||
|
|
|
|
|
|||||||||
| Total redeemable convertible preferred stock |
158,269 | — | — | |||||||||
|
|
|
|
|
|||||||||
| Redeemable common stock |
1,172 | — | ||||||||||
|
|
|
|
|
|||||||||
| Stockholders’ equity (deficit): |
||||||||||||
| Common stock; $0.001 par value, 75,000,000 shares authorized, actual and pro forma; shares authorized, pro forma as adjusted; 7,884,738 shares issued and 7,324,742 outstanding, actual; 54,043,199 shares issued and outstanding pro forma; shares issued and outstanding, pro forma as adjusted |
7 | 54 | ||||||||||
| Additional paid-in capital |
19,716 | 186,539 | ||||||||||
| Accumulated deficit |
(137,975 | ) | (137,975 | ) | ||||||||
| Treasury stock |
(470 | ) | (470 | ) | ||||||||
|
|
|
|
|
|
|
|||||||
| Total stockholders’ (deficit) equity |
(118,722 | ) | 48,148 | — | ||||||||
|
|
|
|
|
|
|
|||||||
| Total capitalization |
$ | 60,758 | $ | 60,758 | $ | — | ||||||
|
|
|
|
|
|
|
|||||||
| (1) | Each $1.00 increase (decrease) in the expected initial public offering price of $ per share would increase (decrease) each of our unaudited pro forma as adjusted cash and cash equivalents and short term investments, additional paid-in capital, total stockholders’ equity (deficit) and total capitalization by approximately $ million, assuming that the number of shares offered by us under this prospectus remains the same, and after deducting underwriting discounts and commissions and estimated offering expenses paid or payable by us. |
39
Table of Contents
If you invest in our common stock, your investment will be diluted immediately to the extent of the difference between the initial public offering price per share of our common stock in this offering and the pro forma net tangible book value per share of our common stock immediately after completion of this offering.
Our historical net tangible book value (deficit) as of June 30, 2011, was approximately ($147.4) million , or ($20.13) per share, based on 7,324,742 shares of common stock outstanding as of June 30, 2011. Historical net tangible book value (deficit) per share is determined by dividing our total tangible assets less total liabilities and redeemable noncontrolling interests, redeemable convertible preferred stock and redeemable common stock by the actual number of outstanding shares of our common stock. Our pro forma net tangible book value as of June 30, 2011 was approximately $19.4 million, or approximately $0.36 per share, based on 54,043,199 shares of common stock outstanding after giving effect to the conversion of shares of our convertible preferred stock into an aggregate of 46,318,457 shares of our common stock upon the completion of this offering. Pro forma net tangible book value per share represents the amount of our total tangible assets less total liabilities and redeemable noncontrolling interests, divided by the pro forma number of shares of common stock outstanding before giving effect to this offering.
After giving effect to our sale of shares of common stock in this offering based on an assumed initial public offering price of $ per share, which represents the midpoint of the estimated price range set forth on the cover of the prospectus, and after deducting underwriting discounts and commissions and estimated offering expenses payable by us, our pro forma net tangible book value as of June 30, 2011 would have been $ per share. This represents an immediate increase in pro forma net tangible book value per share of $ to existing stockholders and immediate dilution in pro forma net tangible book value of $ per share to new investors purchasing our common stock in this offering at the initial public offering price. Dilution per share to new investors is determined by subtracting pro forma net tangible book value per share after this offering from the assumed initial public offering price per share paid by a new investor. The following table illustrates the per share dilution without giving effect to the over-allotment option granted to the underwriters:
| Assumed initial public offering price per share(1) |
$ | |||||||
| Pro forma net tangible book value per share as of June 30, 2011 |
$ | 0.36 | ||||||
| Increase per share attributable to new investors |
||||||||
| Pro forma net tangible book value per share after this offering |
||||||||
|
|
|
|||||||
| Dilution per share to new investors |
$ |
| (1) | The midpoint of the estimated price range set forth on the cover page of this prospectus. |
The following table summarizes as of June 30, 2011 the number of shares of our common stock purchased from us, the total cash consideration paid to us and the average price per share paid to us by existing stockholders and by new investors in this offering at an assumed initial public offering price of $ per share, which represents the midpoint of the estimated price range set forth on the cover page of this prospectus, before deducting underwriting discounts and commissions and estimated offering expenses payable by us:
| Shares Purchased | Total Consideration | Average Price Per Share |
||||||||||||||||||
| Number | Percent | Amount | Percent | |||||||||||||||||
| Existing stockholders |
54,043,199 | 100 | % | $ | 166,510,487 | 100 | % | $ | 3.08 | |||||||||||
| New investors |
||||||||||||||||||||
|
|
|
|
|
|||||||||||||||||
| Total |
% | $ | % | $ | ||||||||||||||||
|
|
|
|
|
|||||||||||||||||
40
Table of Contents
The above discussion and tables are based on 54,043,199 shares of common stock issued and outstanding as of June 30, 2011 and also reflects the conversion of shares of our convertible preferred stock into an aggregate of 46,318,457 shares of our common stock upon the completion of this offering, and excludes:
| • | 9,535,916 shares of our common stock issuable upon exercise of outstanding options as of June 30, 2011 at a weighted-average exercise price of $2.14 per share; |
| • | 4,986,648 shares of common stock issuable upon the exercise of outstanding warrants as of June 30, 2011 at a weighted-average exercise price of $3.48 per share; and |
| • | 4,513,742 shares of our common stock reserved as of June 30, 2011 for future issuance under our equity incentive plans that are not issued or subject to outstanding grants. |
To the extent that outstanding options, warrants or other equity awards are exercised or become vested or any additional options, warrants or other equity awards are granted and exercised or become vested or other issuances of shares of our common stock are made, you will experience further dilution. In addition, we may choose to raise additional capital due to market conditions or strategic considerations even if we believe we have sufficient funds for our current or future operating plans. To the extent that additional capital is raised through the sale of equity or convertible debt securities, the issuance of these securities may result in further dilution to our stockholders.
41
Table of Contents
SELECTED CONSOLIDATED FINANCIAL DATA
You should read the selected consolidated financial data presented below in conjunction with the section entitled “Management’s Discussion and Analysis of Financial Condition and Results of Operations” in this prospectus and our consolidated financial statements and the related notes included elsewhere in this prospectus. Historical results are not necessarily indicative of results for future periods. The selected consolidated financial data presented below under the heading “Consolidated Statement of Operations Data” for the years ended December 31, 2008, 2009 and 2010 and the selected consolidated financial data presented below under the heading “Consolidated Balance Sheet Data” as of December 31, 2009 and 2010, have been derived from our audited consolidated financial statements included elsewhere in this prospectus. The selected consolidated financial data presented below under the heading “Consolidated Statement of Operations Data” for the six months ended June 30, 2010 and 2011 and the selected consolidated financial data presented below under the heading “Consolidated Balance Sheet Data” as of June 30, 2011, have been derived from our unaudited consolidated financial statements included elsewhere in this prospectus.
42
Table of Contents
The selected consolidated financial data presented below under the headings “Consolidated Statement of Operations Data” for the years ended December 31, 2006 and 2007 and under “Consolidated Balance Sheet Data” as of December 31, 2006, 2007 and 2008, have been derived from consolidated financial statements not included in this prospectus. Our historical results are not necessarily indicative of the results of operations to be expected for future periods.
| Years Ended December 31, | Six Months
Ended June 30, |
|||||||||||||||||||||||||||
| 2006 | 2007 | 2008 | 2009 | 2010(3) | 2010 | 2011 | ||||||||||||||||||||||
| (in thousands, except share and per share data) | ||||||||||||||||||||||||||||
| Total revenues |
$ | — | $ | — | $ | 3,896 | $ | 8,436 | $ | 15,492 | $ | 5,711 | $ | 6,668 | ||||||||||||||
|
|
|
|
|
|
|
|
|
|
|
|
|
|
|
|||||||||||||||
| Cost of product sales and operating expenses |
||||||||||||||||||||||||||||
| Cost of product sales |
— | — | — | — | 1,120 | — | 455 | |||||||||||||||||||||
| Research and development(1) |
2,462 | 15,089 | 24,327 | 28,270 | 26,539 | 12,450 | 13,203 | |||||||||||||||||||||
| Selling, general and administrative(1) |
2,731 | 9,886 | 9,344 | 5,059 | 10,212 | 3,947 | 5,036 | |||||||||||||||||||||
| Loss on asset disposals and lease abandonment |
— | — | 799 | 9,213 | — | — | — | |||||||||||||||||||||
|
|
|
|
|
|
|
|
|
|
|
|
|
|
|
|||||||||||||||
| Total cost and operating expenses |
5,193 | 24,975 | 34,470 | 42,542 | 37,871 | 16,397 | 18,694 | |||||||||||||||||||||
|
|
|
|
|
|
|
|
|
|
|
|
|
|
|
|||||||||||||||
| Loss from operations |
(5,193 | ) | (24,975 | ) | (30,574 | ) | (34,106 | ) | (22,379 | ) | (10,686 | ) | (12,026 | ) | ||||||||||||||
| Other income (expense) |
370 | 967 | 113 | (1,366 | ) | (3,407 | ) | 288 | (2,337 | ) | ||||||||||||||||||
| Equity in loss of equity method investment |
— | — | — | — | (143 | ) | — | (173 | ) | |||||||||||||||||||
|
|
|
|
|
|
|
|
|
|
|
|
|
|
|
|||||||||||||||
| Net loss |
(4,823 | ) | (24,008 | ) | (30,461 | ) | (35,472 | ) | (25,929 | ) | (10,398 | ) | (14,536 | ) | ||||||||||||||
| Amount attributable to redeemable noncontrolling interest |
— | — | — | (2,830 | ) | 201 | 87 | 19 | ||||||||||||||||||||
|
|
|
|
|
|
|
|
|
|
|
|
|
|
|
|||||||||||||||
| Net loss attributable to Mascoma Corporation |
(4,823 | ) | (24,008 | ) | (30,461 | ) | (38,302 | ) | (25,728 | ) | (10,311 | ) | (14,517 | ) | ||||||||||||||
| Accretion of redeemable convertible preferred stock |
(28 | ) | (52 | ) | (216 | ) | (253 | ) | (205 | ) | (124 | ) | (279 | ) | ||||||||||||||
|
|
|
|
|
|
|
|
|
|
|
|
|
|
|
|||||||||||||||
| Net loss attributable to common stockholders of Mascoma Corporation |
$ | (4,851 | ) | $ | (24,060 | ) | $ | (30,677 | ) | $ | (38,555 | ) | $ | (25,933 | ) | $ | (10,435 | ) | $ | (14,796 | ) | |||||||
|
|
|
|
|
|
|
|
|
|
|
|
|
|
|
|||||||||||||||
| Net loss per share attributable to Mascoma Corporation common stockholders per share—basic and diluted |
$ | (11.60 | ) | $ | (10.91 | ) | $ | (12.25 | ) | $ | (12.61 | ) | $ | (5.39 | ) | $ | (3.15 | ) | $ | (1.92 | ) | |||||||
|
|
|
|
|
|
|
|
|
|
|
|
|
|
|
|||||||||||||||
| Weighted-average common shares outstanding—basic and diluted |
418,244 | 2,204,499 | 2,505,159 | 3,058,138 | 4,813,191 | 3,315,566 | 7,724,742 | |||||||||||||||||||||
|
|
|
|
|
|
|
|
|
|
|
|
|
|
|
|||||||||||||||
| Pro forma net loss attributable to Mascoma common stockholders per share (unaudited)—basic and diluted(2) |
$ | (0.52 | ) | $ | (0.27 | ) | ||||||||||||||||||||||
|
|
|
|
|
|||||||||||||||||||||||||
| Pro forma weighted-average common shares outstanding (unaudited)—basic and diluted(2) |
49,798,315 | 54,043,199 | ||||||||||||||||||||||||||
|
|
|
|
|
|||||||||||||||||||||||||
| (1) | Includes stock-based compensation expense (see the section entitled “Management’s Discussion and Analysis of Financial Condition and Results of Operations—Critical Accounting Policies and Estimates—Stock-Based Compensation” elsewhere in this prospectus for additional information). |
| (2) | Net loss used in computing pro forma basic and diluted net loss per share and the number of weighted-average common shares used in computing pro forma basic and diluted net loss per share give effect to the automatic conversion of all of our outstanding convertible preferred stock into 46,318,457 shares of common stock upon the completion of this offering as if such conversion had occurred at the beginning of the period. |
| (3) | SunOpta BioProcess Inc. or SBI, was acquired on August 31, 2010, and our consolidated results of operations for the year ended December 31, 2010 include the results of operations of SBI in the period following the acquisition. |
43
Table of Contents
| As of December 31, | As of June 30, | |||||||||||||||||||||||
| 2006 | 2007 | 2008 | 2009 | 2010(1) | 2011 | |||||||||||||||||||
| (in thousands) | ||||||||||||||||||||||||
| Consolidated Balance Sheet Data: |
||||||||||||||||||||||||
| Cash, cash equivalents and short-term investments |
$ | 34,034 | $ | 9,289 | $ | 35,784 | $ | 15,989 | $ | 11,889 | $ | 12,092 | ||||||||||||
| Working capital |
32,737 | 4,428 | 25,364 | 6,175 | 4,275 | 6,382 | ||||||||||||||||||
| Total assets |
35,998 | 28,702 | 79,761 | 51,590 | 87,125 | 85,826 | ||||||||||||||||||
| Warrant liabilities |
101 | 399 | 2,395 | 2,597 | 5,445 | 7,429 | ||||||||||||||||||
| Long-term debt (including current portion) |
— | — | 10,008 | 7,415 | 3,451 | 10,000 | ||||||||||||||||||
| Total liabilities |
1,874 | 12,066 | 31,490 | 37,639 | 35,576 | 42,497 | ||||||||||||||||||
| Redeemable convertible preferred stock |
38,659 | 43,961 | 104,051 | 104,304 | 153,212 | 158,269 | ||||||||||||||||||
| Accumulated deficit |
(4,959 | ) | (28,967 | ) | (59,428 | ) | (97,730 | ) | (123,458 | ) | (137,975 | ) | ||||||||||||
| Stockholders’ deficit |
(4,883 | ) | (28,501 | ) | (57,652 | ) | (94,363 | ) | (105,080 | ) | (118,722 | ) | ||||||||||||
| (1) | Since SunOpta BioProcess Inc., or SBI, was acquired on August 31, 2010, our balance sheet as of December 31, 2010 includes SBI. |
44
Table of Contents
MANAGEMENT’S DISCUSSION AND ANALYSIS OF FINANCIAL
CONDITION AND RESULTS OF OPERATIONS
The following discussion and analysis of our financial condition and results of operations should be read together with our consolidated financial statements and the related notes and the other financial information included elsewhere in this prospectus. This discussion contains forward-looking statements that involve risks and uncertainties. Our actual results could differ materially from those anticipated in these forward-looking statements as a result of various factors, including those discussed below and elsewhere in this prospectus, particularly those in the section entitled “Risk Factors.” Dollars in tabular format are presented in thousands, except per share data or as otherwise indicated.
Overview
We are a renewable fuels company that has developed innovative technology for the low-cost conversion of abundant biomass. Our highly adaptable technology has also been demonstrated to convert biomass to renewable chemicals. Using our proprietary consolidated bioprocessing, or CBP, technology platform, we have developed genetically-modified yeasts and other microorganisms to reduce costs and improve yields in the production of renewable fuels and chemicals. According to the U.S. Department of Energy, or the DOE, CBP technology is the ultimate low-cost configuration for the hydrolysis and fermentation of cellulosic feedstocks. Our CBP technology provides us with the ability to use a variety of feedstocks to produce multiple renewable fuel and chemical end-products. We plan to initially target the large and established first generation corn ethanol industry with our proprietary Mascoma Grain Technology, or MGT, yeast product. We are also working with leading industry participants to develop and construct commercial scale facilities to convert hardwood feedstocks into cellulosic ethanol. We believe that these facilities will offer compelling economic value to us and our collaborators based on the expected operating costs of these facilities and today’s market prices for fuel and feedstocks. In the future, we plan to expand the application of our CBP technology to develop advanced biorefineries that produce multiple high-value end-products, such as advanced fuels and chemicals, from many different feedstocks.
We have established a staged strategy for the commercialization of our innovative CBP technology platform in the renewable fuels and chemicals industries. Our first commercial application of CBP technology is our genetically-modified MGT yeast product that can be used by corn ethanol producers as a drop-in substitute for existing yeasts. We expect to begin selling this product in 2012. We believe this product is capable of significantly improving the economics of corn ethanol production with negligible capital expenditures and will generate near-term revenue and gross margin for our company. We intend to capture, through a license agreement or other arrangement, a significant portion of the incremental margin generated by our line of MGT products. We plan to pursue the corn ethanol market first in order to capitalize on the size and maturity of this market, the technologically advanced nature of our MGT product compared to conventional yeasts and our ability to cost-effectively deploy our CBP technology. Our initial MGT product adds value by alleviating the need to purchase most of the expensive enzymes currently used in corn ethanol production, lowering production costs. Based on laboratory test runs and management estimates of ethanol production costs, we believe our initial MGT product will reduce the cost of producing corn ethanol by approximately $0.01 to $0.02 per gallon. As a result, we believe that this product can create significant and immediate value to corn ethanol producers, which collectively produced over 13 billion gallons of corn ethanol in the United States in 2010. Future generations of our MGT product are also expected to improve ethanol yields, further lowering production costs and potentially increasing revenue for corn ethanol producers. Based on laboratory test runs, we believe future generations of our MGT product will be capable of ethanol yield improvements of up to 4%. Certain by-products of the corn ethanol conversion process are used as animal feed. Our MGT products are genetically modified and are considered to be processing aids in the production of animal feed. As a result, our MGT products are subject to regulation by the U.S. Food and Drug Administration’s Center for Veterinary Medicine, or CVM, and must subsequently be approved by the American Association of Feed Control Officers, or AAFCO. See the section entitled “Business—Regulatory Matters” for more information about this regulatory process.
We are also working with leading industry participants to develop and construct commercial scale facilities to convert abundant and low-cost hardwood pulpwood into cellulosic ethanol. We expect that our first two
45
Table of Contents
hardwood CBP facilities will be built in Kinross, Michigan and Drayton Valley, Alberta. We anticipate construction of our hardwood CBP facility in Kinross, Michigan to start in the next 3 to 6 months and construction of our hardwood CBP facility in Drayton Valley, Alberta to start within 12 to 24 months. Based on pilot production runs at our demonstration facility in Rome, New York, we have achieved hardwood to ethanol conversion yields of 67 gallons per bone dry short ton of hardwood. In a laboratory setting we have achieved ethanol conversion yields of 71 gallons per bone dry short ton of hardwood and we are working to continue to improve conversion yields. At our planned 20 million gallon per year commercial-scale hardwood CBP facility in Kinross, Michigan, we expect to achieve hardwood to ethanol conversion yields of 83 gallons per bone dry short ton of hardwood with unsubsidized cash operating costs of approximately $1.77 per gallon. These estimates assume a hardwood feedstock cost of $66 per bone dry short ton of hardwood and are based on a 20 million gallon per year facility. Over the next several years we are targeting unsubsidized cash operating costs, net of revenue from the sale of co-products such as electricity, of less than $1.00 per gallon based on ethanol yields of 87 gallons per bone dry short ton of hardwood, increases in process efficiencies, economies of scale and ongoing improvements in enzyme expression and metabolic engineering in our microorganisms.
In the future, we plan to expand the application of our CBP technology to develop advanced biorefineries that produce multiple fuel and chemical end-products from a variety of feedstocks. Beyond corn and hardwood, we have already shown the flexibility of our CBP technology platform through the conversion into ethanol of a number of additional feedstocks in a laboratory setting, including corn stover, sugarcane bagasse, palm residue, softwood, miscanthus, switchgrass, paper sludge and sorghum, many of which are abundant and have limited end uses. We believe our feedstock flexibility will enable us to more effectively enter new geographic markets. In terms of end-products, we have demonstrated in a laboratory setting the production of propanol and fatty acids. These chemicals can in turn be used to create propylene and alkanes, which are the building blocks of many petrochemical replacements, and we plan to continue to expand the number of potential end-products.
Through June 30, 2011, we generated revenues primarily from government grants and product sales consisting of pretreatment equipment for biomass feedstocks. As we initiate the commercial launch of our initial MGT product, an increasing proportion of our revenues will be attributable to our CBP technology. As of June 30, 2011, we had an accumulated deficit of $138.0 million. We anticipate that we will continue to incur net losses as we prepare for and initiate the commercial launch our initial MGT product, scale-up our planned hardwood CBP facilities in Kinross, Michigan and Drayton Valley, Alberta, and expand our research and development activities. Since our inception through June 30, 2011, we have raised an aggregate of $135.3 million from private placements of equity securities and debt financing, including $105.3 million in proceeds from the sale of preferred equity securities, $10.0 million in proceeds from the sale of convertible notes, and $20.0 million in borrowings under our secured debt financing arrangements.
Our Commercialization Plan
Our MGT Yeast Products
Our first commercial application of CBP technology is our MGT yeast product. Our proprietary MGT product is a genetically-modified yeast product that can be used by corn ethanol producers as a drop-in substitute to conventional yeast.
Our first commercial product, MGT 1.0, is planned for commercial demonstration and launch in the next eight months, subject to regulatory review and approval. MGT 1.0 will be a first of a kind product – an advanced yeast which will provide significant value to ethanol producers by alleviating the need to purchase most of the expensive enzymes currently used in corn ethanol production. Our next MGT product, MGT 1.1, is planned for commercial demonstration and launch in the next two years. MGT 1.1 builds upon cost savings associated with our MGT 1.0 technology by significantly increasing the yield of ethanol per bushel of corn without any reduction in the robustness of the yeast.
We plan to establish partnerships with the leading yeast producers, such that they will manufacture, distribute, market and sell our MGT product to corn ethanol producers. We also plan to establish a small sales and marketing
46
Table of Contents
team to sell and promote our MGT product to corn ethanol producers, both directly and together with our yeast production partners, as well as providing technology support to customers. We intend to either enter into agreements directly with corn ethanol producers in which they agree to pay us a fee based on the incremental improvement in their margins or recoup such a payment through agreements with our yeast production partners.
We expect that the fundamental drivers of our MGT product revenues and gross margin will be the following:
| • | Penetration of the corn ethanol industry. We expect that the success of our MGT product will depend on our ability to grow market share, which depends upon our product efficacy, and number of customers. |
| • | Value creation. We expect that our MGT yeast products will deliver significant value to customers, as we believe they can improve both the costs and the revenues associated with the production of corn ethanol. |
| • | New releases of our MGT product. In order to grow our MGT business we will need to develop, secure regulatory approval for, and commercialize subsequent generations of our MGT product beyond MGT 1.0, which we believe will generate improved yields for corn ethanol producers. |
Our Hardwood CBP Technology
We have also used our CBP technology to convert hardwood feedstock into cellulosic ethanol. Our hardwood CBP commercialization strategy is “capital-light,” in that rather than build and operate the hardwood CBP facilities directly, we expect to collaborate with third parties to fund, build, develop and operate the facilities, while we contribute technology and receive fees and/or an equity interest in the facilities to provide us with a share of that facility’s profits and related cash flow. We are working with leading industry participants to develop and construct our first two hardwood CBP facilities in Kinross, Michigan and Drayton Valley, Alberta. We anticipate construction of our hardwood CBP facility in Kinross, Michigan to start in the next 3 to 6 months and construction of our hardwood CBP facility in Drayton Valley, Alberta to start within 12 to 24 months. For our initial hardwood CBP facilities we expect to receive contributions from government and strategic partners, but for future facilities we expect to focus on financing from strategic and financial partners. We believe that our hardwood CBP facilities will serve as the foundation for our expansion into new end-products and feedstocks and that successful use of our CBP technology platform with hardwood at our initial hardwood CBP facilities may also provide us with access to traditional project financing for future facilities.
Based on our laboratory and pilot-scale test runs, we believe we are able to convert hardwood feedstocks at costs that are competitive with costs to produce corn ethanol based on ethanol producers’ current yields and current corn prices. Our hardwood conversion process is cost competitive as a result of our streamlined biomass conversion process and the reduced need to purchase most of the expensive enzymes currently used in the process.
We expect that the fundamental drivers of our hardwood CBP revenues and gross margin will be the following:
| • | Yield improvements. We expect to be able to improve yields at our initial commercial-scale hardwood CBP facilities in the first few years of operation through ongoing improvements in enzyme expression and metabolic engineering in our microorganisms. The expected improvement in our hardwood plant yields will drive cost savings and generate additional revenues from the same amount of feedstock. |
| • | Operating experience. We expect the skills gained through the operation and management of larger scale plants will provide us and our collaborators with significant cost savings over time, driven by process improvements and increases in operating efficiencies. |
| • | Economies of scale. Our hardwood CBP facilities are expected to increase in size from our initial 20 million gallons per year facility in Kinross, Michigan and as a result we expect to increase cost savings and improve yields over time. |
47
Table of Contents
| • | Strategic collaborations. Our ability to develop, optimize, and maintain collaborations is central to our hardwood CBP strategy. We envision developing new plants through a network of partners to secure feedstock, offtake, and financing agreements. |
Pretreatment Equipment: SunOpta BioProcess Acquisition
In addition to our CBP technology platform, we also design our own proprietary pretreatment systems that can be used in conjunction with or independently from our hardwood CBP technology. We acquired our pretreatment equipment business from SunOpta Inc. in 2010. Pretreatment of the biomass feedstock is the first step in the process of converting biomass into sugars and fuels, to break down the structure of the biomass and make it more conducive to extracting usable sugars. Pretreatment is typically done chemically, using harsh acids and chemicals to break down biomass. Our pretreatment technology uses steam and pressure to break down biomass, in a simpler, less expensive method. We know of no other technology provider in the marketplace that provides a comprehensive biochemical solution to biofuels producers, from upstream pretreatment equipment to downstream CBP conversion technologies. We intend to sell our pretreatment equipment to the third parties that develop and construct our hardwood CBP facilities. We believe these facilities could benefit from synergies from using our pretreatment equipment in conjunction with our hardwood CBP technology. We also expect to pursue independent sales of our pretreatment equipment to customers other than those using our hardwood CBP technology, particularly in international markets where we do not intend to have a hardwood CBP presence. We currently manufacture our pretreatment equipment through third-party contract manufacturers and expect to continue to do so.
We expect that the fundamental drivers of our pretreatment equipment revenues and gross margin will be the following:
| • | Number of customers. Our ability to sell pretreatment equipment will largely depend upon the construction by us and our collaborators of new commercial-scale hardwood facilities and on increasing the customer base for our pretreatment technology. |
| • | Margin per equipment sale. As we continue to gain experience in developing and operating our pretreatment equipment business, we expect that we will be able to improve gross margin per equipment sale due to process and design innovations. |
Financial Operations Overview
Revenues
Currently, our revenues consist primarily of government grants and product sales. During the year ended December 31, 2010 and the six months ended June 30, 2011, we also received revenue from other service arrangements.
Government grants consist of payments from government entities. The terms of these grants generally provide us with cost reimbursement to conduct certain types of research and development activities over a contractually defined period. Revenues from government grants to conduct research and development are recognized in the period in which the underlying costs are incurred. Historically, we have received U.S. federal and state government grants as well as grants from Canada.
Current product sales consist of sales of pretreatment equipment for the conversion of biomass feedstocks. All of our product sales for the year ended December 31, 2010 related to a single customer. Revenues from product sales are recognized using the percentage of completion method.
Revenues from other service arrangements consist of research and development services that we provide to third parties, and revenues are recognized as services are performed by us. During 2010 and the six months ended June 30, 2011, we received revenue from one commercial research and development agreement. This agreement has been terminated as of June 30, 2011.
48
Table of Contents
Cost of Product Sales
Cost of product sales includes both internal and third-party fixed and variable costs, materials and supplies, labor, facilities and other overhead costs associated with our product sales.
Research and Development Expenses
Research and development expenses consist primarily of costs incurred to discover, develop and test our pretreatment equipment systems and our CBP technology and to develop related commercial applications. Research and development expenses include salaries and other personnel-related expenses (including stock-based compensation), facility costs, research and development equipment costs, supplies, depreciation of facilities and laboratory equipment, contract research and related services, license fees and other general costs related to research and development. We expense all of our research and development costs as they are incurred. We expect to continue to devote substantial resources to our research and development activities, and as we adapt our CBP technology to convert new feedstocks, such as Brazilian bagasse, and produce new end-products, such as renewable chemicals, we expect that research and development expenses will increase in the future.
Selling, General and Administrative Expenses
Selling, general and administrative expenses consist primarily of salaries and other personnel-related expenses (including stock-based compensation), hiring and training costs, facility costs, professional services expenses and consulting costs, marketing costs, depreciation of facilities, amortization of intangible assets, and travel expenses. We expect that our selling, general and administrative expenses will increase substantially in the future as we establish a sales and marketing team to sell and promote our MGT yeast product to corn ethanol producers, expand our finance and accounting staff, add infrastructure and incur additional costs associated with being a public company, including directors’ and officers’ liability insurance, investor relations programs and increased professional services fees.
Interest Expense and Other Financing Costs
We incur interest expense in connection with our financing arrangements, which is recorded as interest expense and other financing costs. We have historically issued warrants in connection with the issuance of our long-term debt. These warrants are initially recognized as debt discount and result in increased other financing costs over the term of the debt or upon issuance. Our outstanding warrants to purchase shares of our convertible preferred stock and warrants to purchase common stock that are not indexed to our own stock are required to be classified as liabilities and to be adjusted to fair value at the end of each reporting period. Any changes in the fair value of these warrant liabilities are recorded as interest expense and other financing costs in the period that the change in value occurs. Changes in fair value have been material in the past and we would expect that these changes in the future may be significant, which will generate significant volatility in our results. Upon the closing of this initial public offering and the conversion of the underlying preferred stock to common stock, all outstanding warrants to purchase shares of preferred stock will automatically convert into warrants to purchase shares of our common stock. The then-current aggregate fair value of these warrants will be reclassified from liabilities to additional paid-in capital, a component of stockholders’ equity, and we will cease to record any related periodic fair value adjustments.
Income Tax Expense
We are subject to federal and various state income taxes in the United States, and we use estimates in determining our provision for these income taxes. In addition, we are subject to Canadian taxes for profits generated from our wholly owned subsidiary. Deferred tax assets, related valuation allowances, current tax liabilities and deferred tax liabilities are determined separately by tax jurisdiction. At December 31, 2010, our deferred tax assets consisted primarily of federal net operating loss carryforwards and state research and development credit carryforwards. We assess the likelihood that deferred tax assets will be realized, and we
49
Table of Contents
recognize a valuation allowance if it is more likely than not that some portion of the deferred tax assets will not be realized. This assessment requires judgment as to the likelihood and amounts of future taxable income by tax jurisdiction. At December 31, 2010, we had a full valuation allowance against our deferred tax assets, which totaled approximately $41.4 million, due to the current uncertainty related to when, if ever, these assets will be realized. In the event that we determine in the future that we will be able to realize all or a portion of our net deferred tax asset, an adjustment to the deferred tax valuation allowance would increase earnings in the period in which such a determination is made.
Critical Accounting Policies and Estimates
The consolidated financial statements have been prepared in conformity with generally accepted accounting principles in the United States and include our accounts and the accounts of our subsidiaries. The preparation of our consolidated financial statements requires our management to make estimates, assumptions, and judgments that affect the reported amounts of assets and liabilities and disclosure of contingent assets and liabilities at the date of the financial statements, and the reported amounts of revenues and expenses during the applicable periods. Management bases its estimates, assumptions and judgments on historical experience and on various other factors that are believed to be reasonable under the circumstances. Different assumptions and judgments would change the estimates used in the preparation of our consolidated financial statements, which, in turn, could change the results from those reported. Our management evaluates its estimates, assumptions and judgments on an ongoing basis.
The critical accounting policies requiring estimates, assumptions, and judgments that we believe have the most significant impact on our consolidated financial statements are described below.
Revenue Recognition
We recognize revenue when the following criteria have been met: (i) persuasive evidence of an arrangement exists; (ii) delivery has occurred and risk of loss has passed; (iii) the seller’s price to the buyer is fixed or determinable; and (iv) collectability is reasonably assured. Revenue arrangements with multiple deliverables are divided into separate units of accounting when certain criteria are met.
Historically, the majority of our revenue has been generated through government grants and other research and development arrangements with the government, including the DOE. We currently have two ongoing arrangements with the DOE:
| • | Approved funding of $4.3 million for the development of an organism for the conversion of lignocellulose to ethanol. We recognized $1.4 million, $1.6 million and $0.6 million in revenue associated with the contract during the years ended December 31, 2008, 2009 and 2010, respectively, and $0.6 million during the six months ended June 30, 2011. As of June 30, 2011 there was approximately $0.1 million in revenue remaining to be recognized. |
| • | Approved funding of $20.0 million to design, construct, and operate an integrated cellulose ethanol plant for transforming locally-grown mixed hardwoods or switchgrass into ethanol. We recognized $1.1 million, $3.8 million and $10.0 million in revenue associated with the contract during the years ended December 31, 2008, 2009 and 2010, respectively, and $3.8 million during the six months ended June 30, 2011. As of June 30, 2011 there was approximately $1.3 million in revenue remaining to be recognized. |
Revenue from the arrangements with the DOE is recognized in the period during which the underlying research and development expenses are incurred. Funding for each project is based upon a budget that has been approved by the DOE; with the DOE funding a portion of the total project costs and the difference comprising our matching contribution. The approved DOE funding for the two projects described above comprises approximately 59% of the total projected costs for the first project and approximately 48% of the total projected costs for the second project.
50
Table of Contents
In October 2007, we were awarded $14.8 million from the New York State Energy Research and Development Authority, or NYSERDA, to build and operate a biomass-to-ethanol demonstration plant in Rome, New York. As of June 30, 2011, we have received $13.8 million in proceeds from NYSERDA, and the proceeds have been deferred and are being recognized ratably over the weighted-average depreciable life of the Rome demonstration plant, which was estimated to be approximately five years. We recognized $1.4 million, $3.1 million and $2.6 million in revenue associated with the grant during the years ended December 31, 2008, 2009 and 2010, respectively, and $1.4 million during the six months ended June 30, 2011.
In December 2008, we entered into a grant agreement with the Michigan Strategic Fund for an award of $20.0 million from the State of Michigan to promote the development, acceleration, and sustainability of energy excellence sectors in the State of Michigan. As of June 30, 2011, we received $12.1 million in proceeds from this award, which has been recorded as deferred revenue and is expected to be amortized to revenue when our hardwood CBP facility in Kinross, Michigan begins operations.
We consider these government funded programs an effective means of funding and advancing our own research and development efforts. We expect that revenue from research and development grants with the government will continue to be a significant portion of our revenues for at least the next twelve months, and we expect to continue to avail ourselves of these revenue arrangements to the extent that the government continues to fund such programs.
Product sales consist of sales of pretreatment equipment for biomass feedstocks. Revenues from product sales are recognized once the revenue recognition criteria have been met and using the percentage of completion method. We believe that this revenue model is appropriate given that these revenue arrangements are similar to long-term construction projects, with our product and services being delivered during the construction period. This methodology involves recognizing revenue over the term of the agreement, as underlying services are performed, and measured on the basis of input measures such as labor and other direct costs incurred. We believe that these input measures approximate the output measures as the costs incurred are directly proportional to the services that are being provided. However, many factors can and do change during the performance period of each revenue arrangement, which can result in changes to these estimates from one financial reporting period to another. We make adjustments, if necessary, to the estimates used in these calculations as work progresses and as such changes become known. Changes in estimates of total project costs and our estimates of state of completion can have a material impact on our financial statements and are reflected in our consolidated statement of operations when they become known. To date, the changes in estimates have not been material in any period.
If we successfully execute our commercialization strategy, product revenue will include revenue from fees associated with sales of our MGT products and use of our CBP technology.
Stock-Based Compensation
We recognize compensation expense related to share-based transactions, including the awarding of employee stock options, based on the grant date estimated fair value. We amortize the fair value of the employee stock options on a straight-line basis over the requisite service period of the award, which is generally the vesting period.
In future periods, our stock-based compensation expense is expected to increase as a result of our existing unrecognized stock-based compensation and as we issue additional stock-based awards in order to attract and retain employees and non-employee consultants.
51
Table of Contents
Our stock-based compensation expense is as follows (in thousands):
| Years Ended December 31, | Six Months Ended June 30, |
|||||||||||||||||||
| 2008 | 2009 | 2010 | 2010 | 2011 | ||||||||||||||||
| Research and development |
$ | 810 | $ | 1,328 | $ | 988 | $ | 667 | $ | 527 | ||||||||||
| Selling, general and administrative |
835 | 504 | 1,496 | 355 | 1,011 | |||||||||||||||
|
|
|
|
|
|
|
|
|
|
|
|||||||||||
| Total stock-based compensation expense |
$ | 1,645 | $ | 1,832 | $ | 2,484 | $ | 1,022 | $ | 1,538 | ||||||||||
|
|
|
|
|
|
|
|
|
|
|
|||||||||||
Stock-based compensation expense of approximately $7.4 million was unrecognized for non-vested awards as of June 30, 2011, and is expected to be recognized over a weighted-average period of 2.68 years.
Significant Factors, Assumptions and Methodologies Used in Determining Fair Value
We estimate the fair value of the share-based awards, including stock options, using the Black-Scholes option-pricing model. Determining the fair value of share-based awards requires the use of highly subjective assumptions, including the fair value of our common stock underlying the award, the expected term of the award and expected stock price volatility. These inputs are subjective and generally require significant judgment.
The fair value of employee stock options was estimated using the following weighted-average assumptions:
| Years Ended December 31, | Six Months
Ended June 30, |
|||||||||||||||||||
| 2008 | 2009 | 2010 | 2010 | 2011 | ||||||||||||||||
| Expected dividend yield |
0 | % | 0 | % | 0 | % | 0 | % | 0 | % | ||||||||||
| Risk-free interest rate |
1.42%-3.59 | % | 2.09%-3.11 | % | 1.36%-2.86 | % | 2.41%-2.86 | % | 2.03%-2.66 | % | ||||||||||
| Expected term (in years) |
5.39-9.28 | 5.00-6.32 | 5.00-6.32 | 5.00-6.32 | 5.00-6.76 | |||||||||||||||
| Expected volatility |
90 | % | 95 | % | 95 | % | 95 | % | 95 | % | ||||||||||
Our expected dividend yield was assumed to be zero as we have not paid, and do not anticipate paying, cash dividends on our shares of common stock.
Our risk-free interest rate is based on the U.S. Treasury yield curve in effect at the time of grant for zero coupon U.S. Treasury notes with maturities approximately equal to each option’s expected term.
Our expected term is estimated based on the simplified method, which uses the mid-point between the vesting date and the end of the contractual term. We use the simplified method because we do not have sufficient option exercise data to provide a reasonable basis upon which to estimate the expected term.
Our expected volatility is derived from the historical volatilities of several unrelated public companies within our industry over a period equal to the expected term of our options because we do not have any trading history to use for calculating the volatility of our own common stock.
We estimate our forfeiture rate based on historical pre-vesting forfeiture activity to generate the estimated future expected forfeitures. Because the majority of our awards include monthly and quarterly vesting provisions, the impact of forfeitures and changes in estimated rates of forfeitures has not had a material impact on our financial statements.
We also account for equity instruments issued to non-employee consultants at fair value. All transactions in which goods or services are the consideration received for the issuance of equity instruments are accounted for based on the fair value of the consideration received or the fair value of the equity instrument issued, whichever is more reliably measurable. The measurement date of the fair value of the equity instrument issued is the date on which the counterparty’s performance is complete. Awards to non-employee consultants have been nominal in the three years ended December 31, 2010 and through the six months ended June 30, 2011.
52
Table of Contents
The following table summarizes the options granted from January 1, 2010, through the date of this prospectus:
| Date of issuance |
Number of shares subject to options granted |
Per share exercise price of options |
Per share estimated fair value of common stock(1) |
Per share estimated fair value of options(2) |
||||||||||||
| January 26, 2010 |
2,040,019 | $ | 2.95 | $ | 2.95 | $ | 2.32 | |||||||||
| October 15, 2010 to November 18, 2010 |
1,098,000 | 1.97 | 1.97 | 1.46 | ||||||||||||
| January 26, 2011(3) |
2,846,000 | 1.97 | 1.97 | 1.70 | ||||||||||||
| April 27, 2011 |
33,000 | 1.97 | 1.97 | 1.57 | ||||||||||||
| July 22, 2011 |
2,054,325 | 2.93 | 2.93 | 2.25 | ||||||||||||
| August 22, 2011 |
16,000 | 2.93 | 2.93 | 2.25 | ||||||||||||
|
|
|
|||||||||||||||
| Total |
8,087,344 | |||||||||||||||
|
|
|
|||||||||||||||
| Weighted-Average |
$ | 2.46 | $ | 2.46 | $ | 1.97 | ||||||||||
| (1) | The per share estimated fair value of common stock represents the determination by our Board of Directors of the fair value of our common stock as of the date of grant, taking into account various objective and subjective factors. |
| (2) | The per share estimated fair value of options was estimated for the date of grant using the Black-Scholes options pricing model. |
| (3) | This grant includes 649,000 options that vest upon the achievement of the 2012 performance targets. As such the key terms and conditions of the award are not mutually agreed upon between the employees and the Company, the awards are not deemed granted for accounting purposes and no compensation expense was recognized through June 30, 2011. |
Based upon an assumed initial public offering price of $ per share, which represents the midpoint of the estimated price range set forth on the cover page of this prospectus, the aggregate intrinsic value of our outstanding stock options as of June 30, 2011 was $ million.
The fair value of the common stock underlying our stock options has historically been determined by our Board of Directors with input from management and a third party valuation firm. In the absences of a public trading market for our common stock, our Board of Directors has determined the fair value of the common stock utilizing methodologies, approaches and assumptions consistent with the American Institute of Certified Public Accountants Practice Guide, Valuation of Privately-Held-Company Equity Securities Issued as Compensation, referred to herein as the “AICPA Practice Guide.” In addition, our Board of Directors considered numerous objective and subjective factors including:
| • | the prices for our convertible preferred stock sold to outside investors in arm’s length transactions; |
| • | the prices of our common stock sold to investors in arm’s length transactions; |
| • | rights, preferences and privileges of the convertible preferred stock relative to those of our common stock; |
| • | our stage of development; |
| • | actual operating and financial performance based on management’s estimates; |
| • | the execution of strategic and development agreements; |
| • | the hiring of key personnel; |
| • | status of product development; |
| • | the risks inherent in the development and expansion of our products; |
| • | the lack of an active public market for our common and convertible preferred stock; |
53
Table of Contents
| • | the likelihood of achieving a liquidity event, such as an initial public offering or a sale of our company, given prevailing market conditions and the nature and history of our business; |
| • | the performance of similarly-situated companies in our industry; and |
| • | trends in the renewable fuels and chemicals industries as well as macro-economic conditions. |
We considered the factors outlined above, as well as the results of independent outside valuations performed as of the dates listed in the table below, in determining the underlying fair value of our common stock at each measurement date. Depending upon the circumstances, we used an option pricing method, or OPM, or the probability weighted expected return method, or PWERM, to estimate the fair value of our common stock.
| Valuation Date |
Fair Value Per Share | |||
| February 29, 2008 |
$ | 2.94 | ||
| October 31, 2008 |
2.86 | |||
| October 31, 2009 |
2.95 | |||
| August 31, 2010 |
1.97 | |||
| June 30, 2011 |
2.93 | |||
The OPM treats common stock and preferred stock as call options on the enterprise’s value, with exercise prices based on the liquidation preference of the preferred stock. Under this method, the common stock has value only if the funds available for distribution to shareholders exceed the value of the liquidation preference at the time of a liquidity event (for example, merger or sale), assuming the enterprise has funds available to make a liquidation preference meaningful and collectible by the shareholders. The common stock is modeled as a call option that gives its owner the right but not the obligation to buy the underlying enterprise value at a predetermined or exercise price. In the model, the exercise price is based on a comparison with the enterprise value rather than, as in the case of a “regular” call option, a comparison with a per-share stock price. Thus, common stock is considered to be a call option with a claim on the enterprise at an exercise price equal to the remaining value immediately after the preferred stock is liquidated. This method it is best used when the range of possible future outcomes and their corresponding time frames are uncertain.
Under a PWERM, the value of the common stock is estimated based upon an analysis of future values for the enterprise assuming various future outcomes. Share value is based upon the probability-weighted present value of expected future investment returns, considering each of the possible future outcomes available to the enterprise, as well as the rights of each share class. Although the future outcomes considered in any given valuation model will vary based upon the enterprise’s facts and circumstances, common future outcomes modeled might include an initial public offering, merger or sale, dissolution, or continued operation as a viable private enterprise. This method involves a forward-looking analysis of the possible future outcomes available to the enterprise, the estimation of ranges of future and present value under each outcome, and the application of a probability factor to each outcome as of the valuation date.
We utilized the OPM for all valuations that were performed prior to 2011. For the valuation that was performed in June 2011, we used the PWERM. In addition, we used the PWERM for a retrospective valuation as of January 26, 2011. The OPM was initially selected because we could reliably estimate the inputs in the OPM, specifically, we had evidence of the enterprise value as determined by the most recent round of preferred stock financing. The terms in these preferred stock transactions were assumed to reflect the expectations of future liquidity events and the values that may be realized in a future transaction. Conversely, the PWERM relies upon factors that could not be accurately estimated, specifically the enterprise value at a projected liquidity event and the estimated time to the liquidity event. Commencing with the 2011 valuations, we utilized the PWERM. The adoption of this method was deemed appropriate given the proposed initial public offering of our common stock and the expected probability as to valuation and timing of such an offering.
54
Table of Contents
Valuation for options granted between October 31, 2009 and January 26, 2010
In December 2009, we completed a valuation to estimate the fair market value of a share of our common stock as of October 31, 2009 using the OPM. To determine our estimated enterprise value, we applied a market-based approach based on the investment in our preferred stock by venture capital firms, including the issuance of 9.5 million shares of Series C preferred stock at a price of $6.40 per share in February, March and April 2008. When considering the time elapsed from the closing of the Series C financing and the October 31, 2009 valuation date, management considered the developments at the Company as well as the general market conditions, including the worldwide economic recession, and noted that there were no events or circumstances that would significantly impact the enterprise value. We used the OPM to allocate the estimated enterprise value between common and preferred stockholders. We used a volatility of 70% based upon three years of data from a set of comparable public company stocks. Applying an appropriate risk free interest rate of 0.90%, a term to liquidity of 2.25 years, and a 15% adjustment for the lack of marketability of our common stock, we estimated a fair market value at October 31, 2009 of $2.95 per common share. We used this fair value per common share for options granted between October 31, 2009 and January 26, 2010.
Valuation for options granted between October 15, 2010 and November 18, 2010
In September 2010, we completed a valuation to estimate the fair market value of a share of our common stock as of August 31, 2010 using the OPM. To determine our estimated enterprise value, we applied a market-based approach based on the investment in our preferred stock, including the issuance of 2.7 million shares of Series D preferred stock at a price of $3.75 per share in August 2010, and the issuance of 11.3 million shares of Series D preferred stock at a price of $3.75 per share and 3.8 million shares of common stock as consideration in our purchase of SunOpta Bioprocess, Inc. on August 31, 2010. We used the option-pricing method to allocate the estimated enterprise value between common and preferred stockholders. We used a volatility of 70% based upon three years of data from a set of comparable public company stocks. Applying an appropriate risk free interest rate of 0.39%, a term to liquidity of 1.3 years and a 15% adjustment for the lack of marketability of our common stock, we estimated a fair market value at October 31, 2009 of $1.97 per common share. We used this fair value per common share for options granted between October 15, 2010 and November 18, 2010.
Valuation for options granted on January 26, 2011 and April 27, 2011
Given the limited amount of time that elapsed from August 31, 2010 to January 26, 2011 and April 27, 2011, management relied upon the valuation performed as of August 31, 2010 in determining the fair value per common share for options granted on January 26, 2011 and April 27, 2011. In arriving at this determination, management considered the technological advancements and other developments occurring within the Company. In addition, management considered the actual operating and financial performance relative to management’s original estimates as well as trends in the renewable fuels and chemicals industries and macro-economic conditions. After consideration of these factors, management concluded that there were no facts or circumstances that would materially impact the fair value considerations that were included in the August 31, 2010 valuation. Furthermore, it was noted that the Company issued 1.3 million shares of our Series D preferred stock to a new investor at a price of $3.75 per share for gross proceeds of $5.0 million in January 2011. The sale of this stock to a new investor corroborates the conclusion that there were no substantive changes in the enterprise value. Finally, we retrospectively completed a valuation to estimate the fair market value of a share of our common stock as of January 26, 2011 using the PWERM. This valuation method took into consideration the following scenarios:
| • | Eight different scenarios for the completion of an initial public offering – four valuations with a shorter term view (i.e., completion of initial public offering by year-end 2011) and four valuations with a longer term view (i.e., completion of initial public offering by mid-year 2012); |
| • | a sale to a strategic acquirer at a significant premium to the liquidation preference; |
| • | a sale to a strategic acquirer at or below the liquidation preference; and |
| • | a restructuring as a result of no near-term liquidity event. |
55
Table of Contents
The aggregate probability of the four scenarios associated with the completion of an initial public offering in the shorter term (i.e., by year-end 2011) was estimated to be 20%. The aggregate probability of the four scenarios associated with the completion of an initial public offering in the longer term (i.e., by mid-year 2012) was estimated to be 20%. These four scenarios in each of the shorter term and longer term views were based on various expected enterprise values at the time of an initial public offering. The probability and expected enterprise value associated with each scenario was based, in part, on the enterprise value at the time of the initial public offering of other renewable fuels companies that recently completed such offerings and an assessment of our capabilities and competencies as compared to these companies. The aggregate probability of the completion of an initial public offering in the shorter term reflected our belief in the likelihood of obtaining regulatory clearance for our MGT technology and of obtaining commitment from an industry partner to invest in a commercial-scale hardwood cellulosic ethanol plant in Kinross, Michigan such that, together with federal and state government grants, the capital expenditures to construct and equip the facility would be fully funded, in light of prevailing market conditions and our relative financial condition at the time. The fair value of our common stock from this retrospective valuation corroborated the previous conclusion that there were no substantive changes in our enterprise value.
Valuation for options granted on July 22, 2011 and August 22, 2011
In August 2011, we completed a valuation to estimate the fair market value of a share of our common stock as of June 30, 2011 using the PWERM. This valuation method took into consideration the following scenarios:
| • | ten different scenarios for the completion of an initial public offering – five valuations with a short-term view (6 months) and five valuations with a longer term view (12 months); |
| • | a sale to a strategic acquirer at a significant premium to the liquidation preference; |
| • | a sale to a strategic acquirer at or below the liquidation preference; and |
| • | a restructuring as a result of no near-term liquidity event. |
The fair value of our common stock was determined to be $2.93 per share as of June 30, 2011, an increase of $0.96 from the prior fair value on April 27, 2011. The aggregate probability of the five scenarios associated with the completion of an initial public offering in the short-term (i.e., 6 months) was estimated to be 25%. The aggregate probability of the five scenarios associated with the completion of an initial public offering in the longer term (i.e., 12 months) was estimated to be 25%. These five scenarios in each of the short-term and longer term views were based on various expected enterprise values at the time of an initial public offering. The probability and expected enterprise value associated with each scenario was based, in part, on the enterprise value at the time of the initial public offering of other renewable fuels companies that recently completed such offerings and an assessment of our capabilities and competencies as compared to these companies. The aggregate probability of the completion of an initial public offering in the short-term reflected our belief in the increased likelihood of obtaining regulatory clearance for our MGT technology and of obtaining commitment from an industry partner to invest in a commercial-scale hardwood cellulosic ethanol plant in Kinross, Michigan such that, together with guaranteed federal and state government grants, the capital expenditures to construct and equip the facility would be fully funded, in light of prevailing market conditions and our relative financial condition at the time. The increase in the fair value of our common stock from April 27, 2011 was also determined to reflect the following factors:
| • | the holding of an organizational meeting with the representatives of the underwriters for the initial public offering of our common stock contemplated by this prospectus (July 2011); |
| • | ongoing discussions with CVM relating to the review and approval of our MGT submission; |
| • | additions to our management team, including the Executive Vice President of Research and Development and the Chief Financial Officer (March and June 2011, respectively); and |
| • | our liquidity and needs for financing, including our bridge note financing where we issued approximately $7.4 million in principal amount of bridge notes (August through September 2011). |
56
Table of Contents
The assumptions used in determining fair value of share-based awards represent management’s and our Board of Directors’ best estimates, but these estimates involve inherent uncertainties and the application of judgment. As a result, if factors change, and we use different assumptions, our share-based compensation expense could be materially different in the future. We believe that the valuation methodologies used in the valuations are reasonable and consistent with the AICPA Practice Aid.
Estimation of Fair Value of Warrants to Purchase Preferred Stock
Our outstanding warrants to purchase shares of our preferred stock and warrants to purchase common stock that are not considered indexed to our own stock are required to be classified as liabilities on our consolidated balance sheet at fair value. The warrants are subject to remeasurement at each balance sheet date, and any change in fair value is recognized as a component of interest expense and other financing costs in the consolidated statement of operations. For the year ended December 31, 2010 and the six months ended June 30, 2011, we recorded a credit of $0.8 million and a charge of $0.2 million, respectively, in interest expense and other financing costs to reflect the change in the fair value of the warrants. Adjustments to the fair value of the warrants were immaterial in 2008 and 2009. Upon the closing of this initial public offering and the conversion of the underlying preferred stock to common stock, all outstanding warrants to purchase shares of preferred stock will automatically convert into warrants to purchase shares of our common stock. The then-current aggregate fair value of these warrants will be reclassified from liabilities to additional paid-in capital, a component of stockholders’ equity, and we will cease to record any related periodic fair value adjustments. Accordingly, we estimated the fair value of these warrants at the respective balance sheet dates using the Black-Scholes option pricing model, the remaining contractual term of the warrant, risk-free interest rates and expected dividends on and expected volatility of the price of the underlying common stock. These estimates, especially the market value of the underlying common stock and the expected volatility, are highly judgmental and could differ materially in the future. When measuring the fair value of warrants that have a variable exercise price or include terms that have variable outcomes, we applied the lattice model to options pricing models.
Similar to the estimates discussed above related to measuring stock compensation at fair value, the estimates of the fair value of the warrant liabilities are based upon estimates, most significantly the estimates of the fair value of the classes of preferred stock and common stock which underlie the warrant. We have consistently applied the valuation approaches discussed above in estimating the fair value of the various classes of preferred stock and common stock. In addition, we have applied the following assumption in the Black-Scholes option-pricing models used to estimate fair value of the warrants at the respective measurement dates:
| For the Years Ended December 31, | For the Six Months Ended June 30, |
|||||||||||||||||||
| 2008 | 2009 | 2010 | 2010 | 2011 | ||||||||||||||||
| Risk-free rate |
1.87%-2.25 | % | 2.69%-3.85 | % | 2.01%-2.71 | % | 2.42%-3.28 | % | 1.00%-3.18 | % | ||||||||||
| Contractual term |
7.73-10.0 years | 4.62-9.0 years | 4.67-8.0 years | 1.12-8.85 years | 4.17-10.0 years | |||||||||||||||
| Expected volatility |
90 | % | 95 | % | 95 | % | 95 | % | 95 | % | ||||||||||
| Expected dividend |
0 | % | 0 | % | 0 | % | 0 | % | 0 | % | ||||||||||
Impairment of Goodwill and Intangible Assets and Other Long-lived Assets
We carry a variety of long-lived assets on our consolidated balance sheet. These are all currently classified as held for use. These include property and equipment, identifiable intangibles, and goodwill. An impairment review is undertaken on (1) an annual basis for assets such as goodwill; and (2) on an event-driven basis for all long-lived assets (including indefinite lived intangible assets and goodwill) when facts and circumstances suggest that cash flows emanating from such assets may be diminished. We have historically reviewed the carrying value of all these assets based partly on our projections of anticipated cash flows. These projections are, in part, dependent upon anticipated market conditions, operational performance, and legal status. Any impairment charge that is recorded negatively impacts our earnings. Cash flows are generally not impacted.
57
Table of Contents
Our Canadian segment is the only reporting unit with goodwill, which totals approximately $22.5 million at December 31, 2010 and June 30, 2011. As noted elsewhere, the goodwill recognized in our financial statements originated when we acquired SBI in August 2010. We have adopted a measurement date of December 31 for our annual impairment test. Because of the short time that had elapsed since the acquisition (only four months) and given that there were few (if any) changes in the expectations of the performance of that business and no significant changes in macro-economic environment or the industry in which that business operates, we concluded that, as of December 31, 2010, the fair value of the reporting unit was equal to the original purchase price. The fair value of the reporting unit exceeded the carrying value of the reporting unit at December 31, 2010, and no indications of impairment were indicated. While we believe that our estimates of fair value are reasonable, different assumptions regarding items such as future cash flows and the volatility inherent in markets which we serve could materially affect our valuations and result in impairment charges.
We assess impairment of long-lived assets when events or changes in circumstances indicate that their carrying amount may not be recoverable. Circumstances which could trigger a review include, but are not limited to, the following: significant decreases in the market price of the asset; significant adverse changes in the business climate or legal factors; accumulation of costs significantly in excess of the amount originally expected for the acquisition or construction of the asset; current period cash flow or operating losses combined with a history of losses or a forecast of continuing losses associated with the use of the asset; or current expectation that the asset will more likely than not be sold or disposed of significantly before the end of its estimated useful life.
Recoverability is initially assessed based on the sum of the undiscounted cash flows expected to result from the use and the eventual disposal of the asset. An impairment loss is recognized in the consolidated statements of operations when the carrying amount is not recoverable and exceeds fair value, which is determined on a discounted cash flow basis. The impairment charge recognized is measured as the difference between the carrying value of the asset and its estimated fair value.
We make estimates and judgments about future undiscounted cash flows and fair value. Although our cash flow forecasts are based on assumptions that are consistent with our plans, there is significant exercise of judgment involved in determining the cash flows attributable to a long-lived asset over its estimated remaining useful life. Our estimates of anticipated future cash flows could be reduced significantly in the future. As a result, the carrying amount of our long-lived assets could be reduced through impairment charges in the future. Changes in estimated future cash flows could also result in a shortening of the estimated useful life of long-lived assets including intangibles for depreciation and amortization purposes.
As a result of our decision to discontinue efforts to form an agreement relating to research and development activities and the design of a demonstration facility in the state of Tennessee, it was concluded that impairment indicators existed in 2008 and 2009. In 2008, management had concluded that substantially all of the design costs related to the Tennessee plant could be utilized for the planned construction of a similar facility in Michigan. Certain costs, totaling $0.8 million, which were deemed to have no value to the Michigan facility, were charged to operations in 2008. Due to delays in funding and changes in the proposed facility in Michigan, as well as ongoing uncertainty with respect to the Michigan facility in 2009, the remaining carrying value of the assets originally recognized for the Tennessee facility were deemed impaired and we recognized an impairment charge totaling $7.5 million in 2009. No goodwill or intangible asset impairment were identified in the periods presented.
58
Table of Contents
Results of Operations
Comparison of Six Months Ended June 30, 2010 and 2011
Revenues
Our total revenues for the six months ended June 30, 2010 and 2011 consisted of the following (in thousands):
| For the Six Months Ended June 30, | ||||||||||||||||
| 2010 | 2011 | $ Change | % Change | |||||||||||||
| Product sales |
$ | — | $ | 615 | $ | 615 | N/A | |||||||||
| Government grants |
5,645 | 5,953 | 308 | 5 | % | |||||||||||
| Other service arrangements |
66 | 100 | 34 | 52 | % | |||||||||||
|
|
|
|
|
|
|
|||||||||||
| Total revenues |
$ | 5,711 | $ | 6,668 | $ | 957 | 17 | % | ||||||||
|
|
|
|
|
|
|
|||||||||||
The $1.0 million increase in our total revenues in the six months ended June 30, 2011 as compared to the same period in 2010 was primarily attributable to a $0.6 million increase in product sales and a $0.3 million increase in government grants. The increase in product sales was a result of our acquisition of SBI in August 2010, which became our wholly-owned subsidiary, Mascoma Canada, Inc., or Mascoma Canada, and we then generated product sales of fiber preparation and pretreatment equipment from Mascoma Canada. The increase in government grants was largely due to increases in qualifying research and development expenses that are reimbursed under the revenue arrangements with the U.S. government.
Cost of Product Sales and Operating Expenses
Our total operating expenses for the six months ended June 30, 2010 and 2011 consisted of the following (in thousands):
| For the Six Months Ended June 30, | ||||||||||||||||
| 2010 | 2011 | $ Change | % Change | |||||||||||||
| Cost of product sales |
$ | — | $ | 455 | $ | 455 | N/A | |||||||||
| Research and development |
12,450 | 13,203 | 753 | 6 | % | |||||||||||
| Selling, general and administrative |
3,947 | 5,036 | 1,089 | 28 | % | |||||||||||
|
|
|
|
|
|
|
|||||||||||
| Total cost of product sales and operating expenses |
$ | 16,397 | $ | 18,694 | $ | 2,297 | 14 | % | ||||||||
|
|
|
|
|
|
|
|||||||||||
Cost of Product Sales
Our cost of product sales were $0.5 million, or 74% of net product sales, during the six months ended June 30, 2011, which were comprised of manufacturing costs associated with fiber preparation and pretreatment equipment at our Mascoma Canada subsidiary. We did not derive any product sales or cost of product sales during 2009, as these are related to fiber preparation and pretreatment equipment, which was as a result of our acquisition of SBI in August 2010.
Research and Development Expenses
Total research and development expenses incurred in the six months ended June 30, 2011 increased by $0.8 million, or 6%, from the six months ended June 30, 2010. The increase was primarily due to an increase of $0.9 million in compensation and benefits costs, principally related to the addition of Mascoma Canada employees, partially offset by $0.1 million decrease in spending in other areas.
59
Table of Contents
Selling, General and Administrative Expenses
Total selling, general and administrative expenses incurred in the six months ended June 30, 2011 increased by $1.1 million, or 28%, from the six months ended June 30, 2010. The increase was due primarily to an increase of $0.9 million in depreciation and amortization expense, related to the acquisition of SBI, which occurred in August 2010.
Other Income (Expense)
Our total other income (expense) for the six months ended June 30, 2010 and 2011 consisted of the following (in thousands):
| For the Six Months Ended June 30, | ||||||||||||||||
| 2010 | 2011 | $ Change | % Change | |||||||||||||
| Interest income |
$ | 83 | $ | 15 | $ | (68 | ) | -82 | % | |||||||
| Interest expense and other financing costs |
205 | (2,352 | ) | (2,557 | ) | < -100 | % | |||||||||
|
|
|
|
|
|
|
|||||||||||
| Total other income (expense) |
$ | 288 | $ | (2,337 | ) | $ | (2,625 | ) | < -100 | % | ||||||
|
|
|
|
|
|
|
|||||||||||
Interest Expense and Other Financing Costs
Our interest expense and other financing costs are comprised of interest expense in connection with our long-term debt, the change in the fair value of the outstanding warrants on our preferred and common stock, foreign currency transaction gain or loss, and other financing costs. Interest expense and other financing costs incurred in the six months ended June 30, 2011 increased by $2.6 million from the six months ended June 30, 2010 due primarily to an increase of $2.0 million in other financing costs related to the fair value of warrants for the purchase of common stock issued in conjunction with the issuance of our long-term debt in June 2011 and $0.3 million in other costs in connection with the issuance of our long-term debt in June 2011.
Net Loss
For the reasons stated above, we incurred a net loss of $14.5 million for the six months ended June 30, 2011 as compared to a net loss of $10.4 million for the six months ended June 30, 2010.
Years Ended December 31, 2008, 2009 and 2010
Revenues
Our total revenues for the years ended December 31, 2008, 2009 and 2010 consisted of the following (in thousands):
| For the Years Ended December 31, |
For the Years Ended December 31, 2010 and 2009 |
For the Years Ended December 31, 2009 and 2008 |
||||||||||||||||||||||||||
| 2008 | 2009 | 2010 | $ Change | % Change | $ Change | % Change | ||||||||||||||||||||||
| Product sales |
$ | — | $ | — | $ | 1,466 | $ | 1,466 | N/A | $ | — | N/A | ||||||||||||||||
| Government grants |
3,896 | 8,436 | 13,276 | 4,840 | 57 | % | 4,540 | > 100 | % | |||||||||||||||||||
| Other service arrangements |
— | — | 750 | 750 | N/A | — | N/A | |||||||||||||||||||||
|
|
|
|
|
|
|
|
|
|
|
|||||||||||||||||||
| Total revenues |
$ | 3,896 | $ | 8,436 | $ | 15,492 | $ | 7,056 | 84 | % | $ | 4,540 | > 100 | % | ||||||||||||||
|
|
|
|
|
|
|
|
|
|
|
|||||||||||||||||||
2010 as compared to 2009
The $7.1 million increase in our total revenues in 2010 as compared to 2009 was principally attributable to a $1.5 million increase in product sales, a $4.8 million increase in government grants, and a $0.8 million increase in other service arrangements, specifically revenues from one commercial research and development agreement.
60
Table of Contents
The increase in product sales was a result of our acquisition of SBI in August 2010, and the product sales of fiber preparation and pretreatment equipment from Mascoma Canada. The increase in government grants revenue was due to increases in qualifying research and development expenses that are reimbursed under the revenue arrangements with U.S. federal and state governments. In 2010, we had one commercial research and development agreement with a third party for which we recognized $0.8 million in 2010. There were no such revenue arrangements in 2009.
2009 as compared to 2008
Our total revenues increased by $4.5 million during the year ended December 31, 2009 as compared to the year ended December 31, 2008. The increase was due primarily to increased government grants as a result of increases in qualifying research and development expenses that are reimbursed under the revenue arrangements with U.S. federal and state governments.
Cost of Product Sales and Operating Expenses
Our total operating expenses for the years ended December 31, 2008, 2009 and 2010 consisted of the following (in thousands):
| For the Years Ended December 31, | For the Years Ended December 31, 2010 and 2009 |
For the Years Ended December 31, 2009 and 2008 |
||||||||||||||||||||||||||
| 2008 | 2009 | 2010 | $ Change | % Change | $ Change | % Change | ||||||||||||||||||||||
| Cost of product sales |
$ | — | $ | — | $ | 1,120 | $ | 1,120 | N/A | $ | — | N/A | ||||||||||||||||
| Research and development |
24,327 | 28,270 | 26,539 | (1,731 | ) | -6 | % | 3,943 | 16 | % | ||||||||||||||||||
| Selling general and administrative |
9,344 | 5,059 | 10,212 | 5,153 | > 100 | % | (4,285 | ) | -46 | % | ||||||||||||||||||
| Loss on asset disposals and lease abandonment |
799 | 9,213 | — | (9,213 | ) | -100 | % | 8,414 | > 100 | % | ||||||||||||||||||
|
|
|
|
|
|
|
|
|
|
|
|||||||||||||||||||
| Total cost of product sales and operating expenses |
$ | 34,470 | $ | 42,542 | $ | 37,871 | $ | (4,671 | ) | -11 | % | $ | 8,072 | 23 | % | |||||||||||||
|
|
|
|
|
|
|
|
|
|
|
|||||||||||||||||||
Cost of Product Sales
2010 as compared to 2009
Our cost of product sales were $1.1 million, or 76% of net product sales, during the year ended December 31, 2010, which were comprised of manufacturing costs associated with fiber preparation and pretreatment equipment at our Mascoma Canada subsidiary. We did not derive any product sales or cost of product sales during 2009, as these are related to fiber preparation and pretreatment equipment, which was as a result of our acquisition of SBI in August 2010.
Research and Development Expenses
2010 as compared to 2009
Total research and development expenses incurred in the year ended December 31, 2010 decreased by $1.7 million, or 6%, from the year ended December 31, 2009. The decrease was due primarily to a decrease of $1.6 million in compensation, benefits and stock compensation expense, and a decrease of $1.8 million in facilities costs, both of which were related to the 2009 closure of our Massachusetts facilities and relocation to our Lebanon, New Hampshire headquarters in 2009, including associated reductions in headcount. The decreases were partially offset by an increase of $1.5 million in non-capitalized equipment expense at our demonstration facility in Rome, New York.
61
Table of Contents
2009 as compared to 2008
Total research and development expenses incurred in the year ended December 31, 2009 increased by $3.9 million, or 16%, from the year ended December 31, 2008. The increase was due primarily to an increase of $2.6 million in facilities costs related to facilities in Massachusetts and our Lebanon, New Hampshire headquarters in 2009, as well as an increase of $3.9 million in depreciation expense related to our demonstration facility in Rome, New York, partially offset by a decrease of $2.2 million in research conducted by third parties and outside services expenses.
Selling, General and Administrative Expenses
2010 as compared to 2009
Total selling, general and administrative expenses incurred in the year ended December 31, 2010 increased by $5.2 million, or >100%, from the year ended December 31, 2009. The increase was due primarily to an increase of $3.1 million in legal fees and other professional services fees principally related to the acquisition of SBI, an increase of $1.0 million in stock compensation expense principally related to the hiring of a new chief executive officer, and an increase of $0.6 million in amortization expense related to intangible assets acquired in the acquisition of SBI.
2009 as compared to 2008
Total selling, general and administrative expenses incurred in the year ended December 31, 2009 decreased by $4.3 million, or 46%, from the year ended December 31, 2008. The decrease was due primarily to a decrease of $2.2 million in compensation, benefits, stock compensation expense and other personnel-related costs and a decrease of $1.8 million in legal fees and other professional services fees.
Loss on Asset Disposals and Lease Abandonment Expense
Loss on asset disposals and lease abandonment expenses increased from $0.8 million in 2008 to $9.2 million in 2009 and were not material in 2010. These changes were due primarily to discontinuing our efforts to form an agreement relating to research and development activities and the design of a demonstration facility in Tennessee during 2009 and our conclusion that impairment had occurred. As a result, we recorded an impairment charge of $7.5 million in 2009. In addition, during 2009 we exited two separate leases related to office and laboratory space in Boston and Woburn, Massachusetts and entered into subleases with subtenants for both leases. The excess lease obligations over the sublease income for the term of the leases in Boston and Woburn were recognized as a lease abandonment expense and a liability totaling $1.4 million was recorded in 2009.
Other Income (Expense)
Our total other income (expense) for the years ended December 30, 2008, 2009 and 2010 consisted of the following (in thousands):
| For the Years Ended December 31, |
For the Years Ended December 31, 2010 and 2009 |
For the Years Ended December 31, 2009 and 2008 |
||||||||||||||||||||||||||
| 2008 | 2009 | 2010 | $ Change | % Change | $ Change | % Change | ||||||||||||||||||||||
| Interest income |
$ | 975 | $ | 152 | $ | 62 | $ | (90 | ) | -59 | % | $ | (823 | ) | -84 | % | ||||||||||||
| Interest expense and other financing costs |
(862 | ) | (1,518 | ) | (3,469 | ) | (1,951 | ) | > 100 | % | (656 | ) | 76 | % | ||||||||||||||
|
|
|
|
|
|
|
|
|
|
|
|||||||||||||||||||
| Total Other Income (Expense) |
$ | 113 | $ | (1,366 | ) | $ | (3,407 | ) | $ | (2,041 | ) | > 100 | % | $ | (1,479 | ) | < -100 | % | ||||||||||
|
|
|
|
|
|
|
|
|
|
|
|||||||||||||||||||
62
Table of Contents
Interest Income
2010 as compared to 2009
Interest income earned in the year ended December 31, 2010 decreased by $0.1 million, or 59%, from the year ended December 31, 2009, as a result of the decrease in our cash and short-term investment balances.
2009 as compared to 2008
Interest income earned decreased from $1.0 million in the year ended December 31, 2008 to $0.2 million in the year ended December 31, 2009 as a result of the decrease in our cash and short-term investment balances.
Interest Expense and Other Financing Costs
2010 as compared to 2009
Interest expense and other financing costs incurred in the year ended December 31, 2010 increased by $2.0 million, or >100%, from the year ended December 31, 2009. The increase was due primarily to a $3.5 million charge related to preferred stock warrants issued in connection with convertible notes, partially offset by a decrease of $0.6 million in interest expense due to lower outstanding debt balances and a decrease of $0.9 million due to the change in the fair value of existing preferred stock warrants.
2009 as compared to 2008
Interest expense and other financing costs incurred in the year ended December 31, 2009 increased by $0.7 million, or 76%, from the year ended December 31, 2008. The increase was due primarily to a $1.0 million increase in interest expense as a result of outstanding principal on our long-term debt, partially offset by $0.3 million decrease in other financing costs.
Net Loss
2010 as compared to 2009
For the reasons stated above, we incurred a net loss of $25.9 million for the year ended December 31, 2010 as compared to a net loss of $35.5 million for the year ended December 31, 2009.
2009 as compared to 2008
For the reasons stated above, we incurred a net loss of $35.5 million for the year ended December 31, 2009 as compared to a net loss of $30.5 million for the year ended December 31, 2008.
Liquidity and Capital Resources
From our inception in 2005 through June 30, 2011, we have funded our operations primarily through $105.3 million in proceeds from the sale of preferred equity securities, $10.0 million in proceeds from the sale of convertible notes, $20.0 million in borrowings under our secured debt financing arrangements, and $34.5 million in revenue. As of June 30, 2011, our cash, cash equivalents and short-term investments totaled $12.1 million. Approximately $3.5 million of our total cash, cash equivalents and short-term investments as of June 30, 2011 is included in our Frontier subsidiary and is related to government grant proceeds to finance the cellulosic ethanol production facility in Michigan. In addition, we have $1.8 million of restricted cash primarily related to letters of credit to secure certain purchase commitments. As of June 30, 2011, we had total long-term debt, including the current portion, of $10.0 million.
In August and September 2011, we issued approximately $7.4 million in convertible notes to certain of our existing shareholders. These notes bear interest at 8.0% per annum, accrue interest for the period that they are
63
Table of Contents
outstanding, and are due to mature on or before August 2016. Under the terms of the note, if not previously converted or paid, the aggregate principal and accrued and unpaid interest under the notes shall automatically be converted into shares of common stock when we complete our initial public offering at a conversion price equal to a 30% discount to the issuance price of our common stock in our initial public offering. Upon the conversion of the convertible notes into shares of common stock upon an initial public offering we will realize a beneficial conversion charge in our consolidated statement of operations. Investors who participated at or above their pro rata participation amount are entitled to receive a warrant to purchase either our preferred stock at the price at which the securities are sold upon a qualified financing or our common stock at a 30% discount to the issuance price in our initial public offering, whichever occurs first.
In January 2011, we issued warrants to purchase an aggregate of 1.33 million shares of our Series D preferred stock at an exercise price of $3.75 per share to Diamond Alternative Energy, LLC, or Valero. In August 2011, Valero exercised this warrant for 1.33 million shares of our Series D preferred stock at an exercise price of $3.75 per share for gross proceeds of $5.0 million.
We believe that the net proceeds from this offering, together with our current cash, cash equivalents and short-term investments, proceeds of $6.9 million from the sale of our convertible notes and proceeds of $5.0 million from the exercise of warrants on our Series D preferred stock by Valero, will be sufficient to fund our current operations for at least the next 12 months. The proceeds of $6.9 million exclude the principal amount of the note issued to MPC Investment LLC in satisfaction of the approximately $0.4 million owed by us to Marathon Petroleum Company LP under the Master Engineering and Design Services Agreement, as described in more detail under the section entitled “Certain Relationships and Related Party Transactions” in this prospectus. However, it is possible that we may seek additional financing within this period of time. We may seek such financing through a combination of public or private financing, collaborative relationships and other arrangements. Additional funding may not be available to us or, if available, may not be on terms favorable to us. Further, any additional equity financing may be dilutive to stockholders, and debt financing, if available, may involve restrictive covenants. If additional funding is not available to us, we may need to implement cost reductions. Our failure to raise funds when needed or our need to reduce costs in response to a lack of or a delay in funding may harm our business and operating results.
Consistent with our planned commercial-scale hardwood CBP facility in Kinross, Michigan, we expect to scale up cellulosic ethanol production capacity in a capital-efficient manner by entering into agreements with partners, obtaining grants and loans from government entities and securing debt financing to fund capital expenditures necessary in building production capacity. Depending on the specifics of each facility and discussions with partners, government entities and sources of debt financing, we may choose to deploy some portion of the equity capital required to construct a hardwood CBP facility, as such capital contribution may influence the scope and timing of our relationship. We expect to evaluate the optimal amount of capital expenditures that we agree to fund on a case-by-case basis. As such, we may be required to access additional capital through equity or debt offerings. If we are unable to access additional capital, our growth may be limited due to the inability to build out additional cellulosic ethanol production capacity.
In February 2008, we entered into a loan and security agreement with Pinnacle Ventures that provided for a $20.0 million credit facility consisting of (i) up to a $10.0 million term loan that may be borrowed on or before April 30, 2008 and (ii) up to a $10.0 million term loan that may be borrowed on or before October 31, 2008. All borrowing under this loan and security agreement is secured by a first lien on all of our assets. In October 2008, we borrowed $10.0 million under this credit facility. The borrowings bore interest at a rate of 6.25% per annum and were subject to an end of term payment equal to 2.5% of the amount borrowed. In June 2011, we amended our loan and security agreement with Pinnacle Ventures to provide for an additional $20.0 million credit facility consisting of (i) up to a $10.0 million term loan upon execution of the amended agreement and (ii) up to a $10.0 million term loan that may be borrowed on or before December 31, 2011, with the amount available being determined by the amount of equity raised in a subsequent qualified financing. All borrowing under this amended loan and security agreement is secured by a first lien on all of our assets. The interest rate charged under the
64
Table of Contents
amended loan and security agreement are fixed at the time of loan execution and equals prime (based on the prime rate published in the Wall Street Journal) plus 7.75% per annum, but shall never be lower than 11.0% per annum. In June 2011, we borrowed $10.0 million under the amended loan and security agreement and, as a condition of this borrowing, repaid $1.4 million in outstanding principal under the prior loan and security agreement. This repayment used amounts borrowed pursuant to the amended loan and security agreement. The borrowings bear interest at a rate of 11.0% per annum and are subject to an end of term payment equal to 4.0% of the amount borrowed. The loan matures on June 30, 2014 and provides for interest only payment during the first six months with monthly interest and principal for the next 30 months.
Cash Flows
| For the Years Ended December 31, | For the Six Months
Ended June 30, |
|||||||||||||||||||
| (in thousands) |
2008 | 2009 | 2010 | 2010 | 2011 | |||||||||||||||
| Cash flows (used in) operating activities |
$ | (29,810 | ) | $ | (21,530 | ) | $ | (14,344 | ) | $ | (7,785 | ) | $ | (7,903 | ) | |||||
| Cash flows (used in) provided by investing activities |
(22,956 | ) | (18,265 | ) | 7,253 | 373 | (296 | ) | ||||||||||||
| Cash flows provided by financing activities |
79,261 | 11,859 | 5,984 | 8,030 | 11,294 | |||||||||||||||
Six Months Ended June 30, 2010 and 2011
Cash Flows from Operating Activities
During the six months ended June 30, 2011, our use of cash in operating activities was $7.9 million, which was due principally to our net loss of $14.5 million, adjusted for the following:
| • | a decrease of $1.5 million in deferred revenues, primarily as a result of continuing recognition of grant proceeds received from NYSERDA; |
| • | non-cash operating items of $8.8 million including stock-based compensation expense, depreciation and amortization, warrants issued for financing and debt discount amortization, and other non-cash items; |
| • | a decrease of $1.3 million in accounts payable; and |
| • | changes in other operating assets and liabilities of $0.7 million, which reflect timing differences between the receipt and payment of cash associated with certain transactions and when such transactions are recognized in our consolidated statement of operations. |
During the six months ended June 30, 2010, our use of cash in operating activities was $7.8 million, which was due principally to our net loss of $10.4 million adjusted for the following:
| • | a decrease of $1.3 million in deferred revenues, primarily as a result of continuing recognition of grant proceeds received from NYSERDA; |
| • | non-cash operating items of $4.4 million including stock-based compensation expense, depreciation and amortization, warrants issued for financing and debt discount amortization, and other non-cash items; and |
| • | changes in other operating assets and liabilities of ($0.5) million, which reflect timing differences between the receipt and payment of cash associated with certain transactions and when such transactions are recognized in our consolidated statement of operations. |
Cash Flows from Investing Activities
Cash used in investing activities was $0.3 million for the six months ended June 30, 2011, which was due primarily to $10.5 million in proceeds from the sale or maturity of short-term investments, partially offset by $7.6 million related to the purchase of short-term investments and $3.2 million of capital expenditures. These capital expenditures consisted primarily of laboratory equipment purchases and leasehold improvements in our laboratories.
65
Table of Contents
Cash provided by investing activities was $0.4 million for the six months ended June 30, 2010, which was due primarily to $5.6 million in proceeds from the sale or maturity of short-term investments, partially offset by $3.1 million related to the purchase of short-term investments and $2.0 million of capital expenditures. These capital expenditures consisted primarily of laboratory equipment purchases and leasehold improvements in our laboratories.
Cash Flows from Financing Activities
Cash provided by financing activities for the six months ended June 30, 2011 was $11.3 million, which was due primarily to $9.9 million in proceeds from the issuance of long-term debt, $4.9 million in net proceeds from issuance of preferred stock, partially offset by $3.5 million in principal payments on our debt obligations.
Cash provided by financing activities for the six months ended June 30, 2010 was $8.0 million, which was due primarily to $10.0 million in proceeds from the issuance of convertible debt, partially offset by $1.9 million in principal payments on our debt obligations.
Years Ended December 31, 2008, 2009 and 2010
Cash Flows from Operating Activities
During the year ended December 31, 2010, our use of cash in operating activities was $14.3 million, which was due principally to our net loss of $25.9 million, adjusted for the following:
| • | a decrease of $2.6 million in deferred revenues, primarily as a result of continuing recognition of grant proceeds received from NYSERDA; |
| • | non-cash operating items of $14.8 million including stock-based compensation expense, depreciation and amortization, warrants issued for financing and debt discount amortization, and other non-cash items; |
| • | a decrease of $1.1 million in accrued expenses and other liabilities; and |
| • | changes in other operating assets and liabilities of $0.5 million, which reflect timing differences between the receipt and payment of cash associated with certain transactions and when such transactions are recognized in our consolidated statement of operations. |
During the year ended December 31, 2009, our use of cash in operating activities was $21.5 million, which was due principally to our net loss of $35.5 million, adjusted for the following:
| • | a decrease of $3.1 million in deferred revenues, primarily as a result of continuing recognition of grant proceeds received from NYSERDA; |
| • | non-cash operating items of $18.9 million including $9.2 million of loss on asset disposal and lease abandonment, stock-based compensation expense, depreciation and amortization, warrants issued for financing and debt discount amortization, and other non-cash items; |
| • | a decrease of $4.1 million in accrued expenses and other liabilities; and |
| • | changes in other operating assets and liabilities of $2.2 million, which reflect timing differences between the receipt and payment of cash associated with certain transactions and when such transactions are recognized in our consolidated statement of operations. |
During the year ended December 31, 2008, our use of cash in operating activities was $29.8 million, which was due principally to our net loss of $30.5 million adjusted for the following:
| • | a decrease of $1.4 million in deferred revenues, primarily as a result of continuing recognition of grant proceeds received from NYSERDA; |
| • | non-cash operating items of $6.7 million including stock-based compensation expense, depreciation and amortization, warrants issued for financing and debt discount amortization, and other non-cash items; |
66
Table of Contents
| • | a decrease of $5.4 million in accounts payable; and |
| • | changes in other operating assets and liabilities of $0.8 million, which reflect timing differences between the receipt and payment of cash associated with certain transactions and when such transactions are recognized in our consolidated statement of operations. |
Cash Flows from Investing Activities
Cash provided by investing activities was $7.3 million in 2010, primarily attributable to the $11.1 million net cash received as part of our acquisition of SBI, $17.4 million in proceeds from the sale or maturity of short-term investments and $1.5 million increase in restricted cash, partially offset by $14.4 million related to the purchase of short-term investments and $8.4 million of capital expenditures. These capital expenditures consisted primarily of laboratory equipment purchases and leasehold improvements in our laboratories.
Cash used by investing activities was $18.3 million in 2009, primarily attributable to $17.1 million in purchases of short-term investments and $10.1 million in capital expenditures, partially offset by $9.0 million in proceeds from the sale or maturity of short-term investments.
Cash used by investing activities was $23.0 million in 2008, primarily attributable $24.7 million in capital expenditures, partially offset by a $1.8 million increase in restricted cash. The capital expenditures consisted primarily of laboratory equipment, computer and test equipment, and software purchases.
Cash Flows from Financing Activities
Cash provided by financing activities was $6.0 million in 2010, primarily attributable to $10.0 million in proceeds from the issuance of convertible debt, partially offset by $4.0 million in principal payments on our debt obligations.
Cash provided by financing activities was $11.9 million in 2009, primarily attributable to $14.7 million in proceeds from deferred grant revenue, partially offset by $2.6 million in principal payments on our debt obligations.
Cash provided by financing activities was $79.3 million in 2008, primarily attributable to $9.4 million in proceeds from deferred grant revenue, $60.2 million in proceeds from the issuance of preferred stock, and $10.0 million of proceeds from the issuance of long-term debt.
Contractual Obligations and Commitments
The following is a summary of our contractual obligations and commitments as of June 30, 2011 (in thousands).
| Total | July 1, 2011 - December, 31, 2011 |
2012 | 2013 | 2014 | 2015 and Thereafter |
|||||||||||||||||||
| Long-term debt, including current portion |
$ | 10,000 | $ | — | $ | 3,732 | $ | 4,063 | $ | 2,205 | $ | — | ||||||||||||
| Cash interest payments on long-term debt |
2,421 | 642 | 819 | 489 | 471 | — | ||||||||||||||||||
| Operating leases |
8,875 | 813 | 1,705 | 891 | 932 | 4,534 | ||||||||||||||||||
| Research and development commitments |
2,049 | 295 | 904 | 850 | — | — | ||||||||||||||||||
|
|
|
|
|
|
|
|
|
|
|
|
|
|||||||||||||
| Total |
$ | 23,345 | $ | 1,750 | $ | 7,160 | $ | 6,293 | $ | 3,608 | $ | 4,534 | ||||||||||||
|
|
|
|
|
|
|
|
|
|
|
|
|
|||||||||||||
In April 2006, we entered into a research agreement with the Trustees of Dartmouth College, or Dartmouth, to fund research at Dartmouth College for a total of $1.8 million over two years, with additional annual extensions at our option. We entered into a license agreement with Dartmouth in July 2006. We also agreed to reimburse Dartmouth for patent costs related to the licensed technology. Certain inventions arising from the research program become subject to the license agreement. Dartmouth granted us an option to obtain a
67
Table of Contents
worldwide, royalty bearing license on any other inventions arising from the research program. In March 2008, we amended the research agreement to provide at least $0.5 million per year in research support for five consecutive years commencing April 1, 2008. In December 2009, we further amended the research agreement to provide an aggregate total of at least $2.5 million in research support over the five consecutive years commencing April 1, 2008. The amounts paid under the research agreement are recognized as research and development expense in our consolidated statement of operations.
We entered into a license agreement with Koninklijke Nedalco B.V., a company incorporated under the laws of the Netherlands, dated November 23, 2006, providing Mascoma with a non-exclusive, royalty-bearing license to yeast strains and related technology for use in the field of production of ethanol and coproducts from cellulosic materials. We will likely owe royalties under this agreement for hardwood ethanol sales. Unless earlier terminated, the license agreement remains in force as long as any of the patents remain valid or the patent applications remain pending.
In December 2008, we and Longyear, a private natural resources company, formed Frontier to develop and operate an integrated commercial-scale cellulosic fuel production facility in the State of Michigan. At June 30, 2011, we had a 75% ownership interest in Frontier and Longyear owned the remaining 25%. At any time between the second and third anniversary of the date of commencement of development at the site, we have the right to acquire the noncontrolling interest held by Longyear. During that same period, Longyear has the right to put its interest in Frontier to us, or the put right. The amount to be paid under our call option and Longyear’s put right is equal to Longyear’s capital contribution plus a guaranteed 12% annual rate of return on Longyear’s capital contribution. Longyear’s put right has been accounted for as part of the carrying value of the non-controlling interest. Because the put right is not within our control, the noncontrolling interest has been classified with temporary equity as redeemable noncontrolling interest.
Off-Balance Sheet Arrangements
We did not have during the periods presented, and we do not currently have, any off-balance sheet arrangements, as defined under SEC rules, such as relationships with unconsolidated entities or financial partnerships, which are often referred to as structured finance or special purpose entities, established for the purpose of facilitating financing transactions that are not required to be reflected on our consolidated balance sheet.
Recent Accounting Pronouncements
From time to time, new accounting pronouncements are issued by the Financial Accounting Standards Board and are adopted by us as of the required effective dates. We have not identified any newly released pronouncements that we believe will have a material impact on our condensed consolidated financial position, consolidated statement of operations, or cash flows.
Quantitative and Qualitative Disclosures about Market Risk
We are exposed to financial market risks, primarily changes in interest rates and currency exchange rates. All of the potential changes noted below are based on sensitivity analyses performed on our financial positions as of June 30, 2011. Actual results may differ materially.
Interest Rate Risk
Our exposure to market risk for changes in interest rates relates primarily to our short-term investments and our outstanding debt obligations. As of December 31, 2010 and June 30, 2011, our short-term investments equaled $5.1 million and $2.3 million, respectively, and were invested in commercial paper, and U.S. treasury and government agency securities with remaining maturities of less than three months. These investments are
68
Table of Contents
subject to interest rate risk and will fall in market value if market interest rates increase. However, even if market interest rates for comparable investments were to increase immediately and uniformly by 100 basis points from levels at December 31, 2010 and June 30, 2011, this impact would not be material.
As of December 31, 2010 and June 30, 2011, our outstanding debt was fixed-rate debt and equaled $3.5 million and $10.0 million, respectively. If interest rates had increased by 100 basis points related to the outstanding amounts as of December 31, 2010 and June 30, 2011, this impact would not be material.
Foreign Currency Risk
All of our current product sales contracts are denominated in U.S. dollars and, therefore, our revenues are not currently subject to significant foreign currency risk. We do incur certain operating expenses in currencies other than the U.S. dollar in relation to our subsidiary, Mascoma Canada, and, therefore, are subject to volatility in cash flows due to fluctuations in foreign currency exchange rates, particularly changes in the Canadian dollar. We have previously entered into hedging contracts to manage Canadian dollar to U.S. dollar exchange rate fluctuations for Mascoma Canada, however, these have had minimal impact on our consolidated statement of operations and cash flows, and no such hedging contracts are outstanding as of June 30, 2011.
69
Table of Contents
We are a renewable fuels company that has developed innovative technology for the low-cost conversion of abundant biomass. Our highly adaptable technology has also been demonstrated to convert biomass to renewable chemicals. We plan to initially target the large and established first generation corn ethanol industry with our proprietary Mascoma Grain Technology, or MGT, yeast product. We are also working with leading industry participants to develop and construct commercial scale facilities to convert hardwood feedstocks into cellulosic ethanol. In the future, we plan to expand the application of our consolidated bioprocessing, or CBP, technology to develop advanced biorefineries that produce multiple high-value end-products, such as advanced fuels and chemicals, from many different feedstocks.
We believe that the industries that are important to our business are the renewable fuels and chemicals industries, particularly first and second generation ethanol, from an end-products perspective, and the wood product biomass industry from a feedstock perspective.
The Market Opportunity
As a result of our highly adaptable CBP technology platform, we intend to operate across the renewable fuels and chemicals industries, with a near-term focus on improving first generation ethanol. We believe the large and established ethanol industry in the United States presents a compelling market for our drop-in MGT yeast product. We believe there is a market need for a low-cost, more sustainable fuel such as cellulosic ethanol, or second generation ethanol, that is less volatile with respect to price and supply as compared to petroleum-based products, has lower greenhouse gas, or GHG, emissions, addresses concerns about depleting global food supplies and helps advance energy independence.
The Renewable Fuels Industry
Renewable fuels are fuels produced from renewable resources such as plant biomass, in contrast to fuels produced from non-renewable sources such as crude oil and natural gas. Ethanol is the primary renewable fuel consumed in the United States and is primarily used as an oxygenate to gasoline. According to the United States Energy Information Association, or EIA, approximately 123 billion gallons of gasoline were sold in the United States in 2010. In addition, according to the Renewable Fuels Association, or RFA, approximately 13 billion gallons of ethanol were sold in the United States in 2010 and ethanol replaced the need for approximately 445 million barrels of oil in the United States on an energy equivalent basis. The ability to create fuel from plant and non-plant biomass would help meet the increasing demand for renewable fuels to comply with rising federal and state blending requirements and help reduce American dependence on foreign oil imports.
The Current Ethanol Industry
The ethanol industry has grown significantly over the past several years. In 2010, there were over 200 ethanol plants in the United States producing over 13 billion gallons of ethanol and ethanol exports hit a record 350 million gallons. Virtually all the ethanol produced globally today is from edible sugar and starch sources, including corn in the United States and sugarcane in Brazil. These fuels are commonly referred to as first generation biofuels. According to the RFA, U.S. corn ethanol production increased from 3.6 billion gallons in 2005 to over 13 billion gallons in 2010, which represented a compound annual growth rate of over 30%. Demand for ethanol in the United States is expected to continue to increase, driven by multiple factors including the growing focus on reducing reliance on petroleum-based transportation fuels. We believe ethanol is important to the fuels market in the following ways:
Extends fuel supplies: Ethanol is a valuable blend component that is used by refiners in the United States to extend gasoline supplies. According to the EIA, from 2000 to 2010, ethanol as a component of the United States gasoline supply grew from 1.3% to 9.0%. Ethanol use is also being driven in part by the rise in flexible-fuel vehicles in the United States. A flexible-fuel vehicle is an automobile that can alternate between two or more sources of fuel such as gasoline or ethanol mixtures. Many flexible-fuel vehicles can accept a mixture of up to 85 percent ethanol, or
70
Table of Contents
E85, or up to 85 percent methanol, or M85, and 15 percent gasoline by volume. According to the U.S. Department of Energy, there were 8.4 million flexible-fuel vehicles on the road in 2009 as compared to 4.1 million in 2005.
EPA blending approvals. The relative proportion of ethanol that can be blended into the United States fuel stock has increased in the past several years, which has helped drive demand for ethanol. In October 2010, the EPA approved the use of E15 (a blend of gasoline and up to 15% ethanol by volume) in model year 2007 and newer passenger vehicles, including cars, SUVs, and light pickup trucks. In January 2011, the EPA approved the use of E15 in model year 2001 to 2006 passenger vehicles. With these approvals, over 129 million vehicles or 60% of the passenger vehicles in service as of January 2011 are eligible to use E15. We believe that ethanol blended in the United States gasoline supply is an important step towards the long-term introduction of more renewable fuels into the transportation sector.
Environmental benefits. Ethanol, when blended with gasoline, reduces vehicle GHG emissions. Oxygenated gasoline continues to be used to help meet separate federal and state air emission standards, and ethanol is the primary clean air oxygenate currently used. The Clean Air Act Amendments of 1990 mandated increased oxygen content for gasoline to meet ozone and carbon monoxide standards. In order to meet these requirements, gasoline refiners and blenders had to add an oxygenate to motor gasoline to allow it to burn more cleanly and to reduce ozone-forming compounds and carbon monoxide emissions. The two predominant oxygenates used to meet both oxy-fuel and reformulated gasoline requirements were methyl tertiary butyl ether, or MTBE, and ethanol. MTBE is an ether made from methanol produced from natural gas and was the most widely used oxygenate until it was voluntarily removed from the nation’s motor fuel supply due to public health and environmental concerns. Although the federal oxygenate requirement was eliminated in 2006, oxygenated gasoline continues to be used in order to help meet federal and state air emission standards. The refining industry has all but abandoned the use of MTBE, making ethanol the primary clean air oxygenate currently used.
Economic benefits. The ethanol industry is important economically, helping to reduce expensive oil imports, and supporting domestic manufacturing and job growth. According to the RFA, the ethanol industry contributed nearly $53.6 billion to U.S. GDP in 2010 and was responsible for 400,000 direct and indirect jobs and upwards of $36 billion in personal income.
Mandated Use of Renewable Fuels. Growth in ethanol usage has also been supported by legislative requirements dictating the use of renewable fuels, including ethanol. The U.S Renewable Fuel Standard Program, or RFS, is a United States renewable fuel volume mandate further described in more detail under the section entitled “—Government Programs, Incentives and Regulations.”
Second Generation Ethanol
As the demand for biofuels continues to grow, we believe production will shift increasingly from food-based to non-food based sources. Fuels produced from municipal solid waste and non-food plant materials such as hardwood, bagasse, corn stover and dedicated energy crops like switchgrass and miscanthus, are commonly referred to as second generation biofuels. While corn is expected to remain the primary feedstock for ethanol production in the United States in the near-term, there is an increasing push to produce second generation biofuels. This push is largely driven by concerns about strains placed on global food supplies and the environment by food-based feedstock sources. Aside from being sourced from non-food sources, second generation biofuels provide the additional advantage of offering significantly (at least 50%) lower lifecycle GHG emissions relative to gasoline and corn-based ethanol.
Government Programs, Incentives and Regulations
The renewable fuels industry benefits from government programs, incentives and regulations that seek to promote the development and commercialization of renewable fuel technologies, including renewable fuel standards, state and local programs and tax credits and incentives.
71
Table of Contents
Renewable Fuel Standard
RFS was created under the Energy Policy Act of 2005 and established the first renewable fuel volume mandate in the United States. According to the second stage of the RFS, which was established through a revision of RFS in 2010 (as required by the Energy Independence and Security Act of 2007, or EISA) and which we refer to as RFS2, any refiner or importer of gasoline or diesel fuel in the United States is an “obligated party” and must comply on an annual basis with volume requirements for both renewable fuels as a whole as well as those for each renewable fuel category. The regulation allows the total renewable fuel mandate to be met using 12 billion gallons of corn-derived renewable fuels in the United States in 2010, increasing annually by 0.6 million gallons to 15 billion gallons in 2015 and thereafter. The general renewable fuel requirement is set for 36 billion gallons by 2022, with the following additional specifications:
| • | Advanced Biofuels: Advanced biofuels are a subset of the renewable fuel category that reduces lifecycle GHG emissions by at least 50% compared to GHG emissions of petroleum products as measured in 2005, and does not include corn ethanol. Of the total RFS2 requirement for the volume of renewable fuel, at least 950 million gallons of renewable fuel was required by the EPA to be advanced biofuels in 2010, increasing to 20 billion gallons by 2022 (excluding 1 billion gallons of biomass-based diesel). |
| • | Cellulosic Biofuel: Cellulosic biofuel is a subset of the renewable fuel and the advanced biofuel categories that reduces lifecycle GHG emissions by at least 60% compared to GHG emissions of petroleum products as measured in 2005, and does not include corn ethanol. Of the total RFS2 requirement for the volume of renewable fuel, at least 100 million gallons of renewable fuel was required by the EPA to be cellulosic biofuel in 2010, increasing to 16 billion gallons by 2022. |
The size of the potential renewable fuel market for cellulosic biofuel in 2022 under RFS2 is the minimum cellulosic biofuels mandate of 16 billion gallons up to the entire renewable fuels mandate of 36 billion gallons. In 2022, total production of all renewable fuels, including those not considered to be cellulosic biofuels, is projected by the EIA to be 25.7 billion gallons versus 36 billion gallons required under the RFS2 mandate in 2022. It is expected that a significant portion of the shortfall will be due to a shortfall in cellulosic biofuels.
Mandated Renewable Fuels Production under RFS2
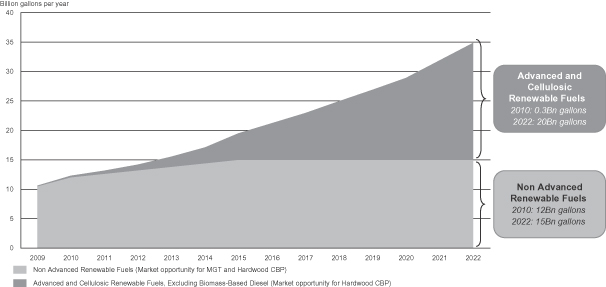
Source: EPA
72
Table of Contents
RINs and Waiver Credits
The EPA assigns Renewable Identification Numbers, or RINs, to each batch of renewable fuel produced or imported. RINs demonstrate compliance with, and are the credit currency of, RFS2. Each fuel category has a unique set of RINs. Each obligated party must obtain its requisite number of RINs for each fuel category based on its volume obligations. If an obligated party meets or exceeds its volume obligations, that obligated party may either trade its excess RINs to other refiners or use its excess RINs to satisfy its volume obligations in subsequent years.
Under RFS2, in any compliance year for which the projected volume of cellulosic biofuel production is less than the mandate required, the EPA is required to make waiver credits available for sale for that compliance year to ensure that obligated parties have the ability to meet their cellulosic biofuel RIN volume obligations. The EPA is required to sell the waiver credits for an inflation-adjusted price that is the higher of $0.25 per gallon or the amount by which $3.00 per gallon exceeds the average wholesale price of a gallon of gasoline in the Unites States for the preceding twelve months. For 2011, waiver credits are priced at $1.13 per gallon.
The RFS2 volume obligations combined with the waiver credits can operate as a floor price for cellulosic ethanol, since all refiners or importers of gasoline or diesel fuel in the United States must meet the RFS2 volume standard either by purchasing cellulosic ethanol RINs or by purchasing the waiver credit in a given compliance year where the projected production volume falls below the mandated volume. As a result, qualified cellulosic ethanol producers can expect to receive a floor price equal to the wholesale price of gasoline plus the price of a waiver credit for every gallon of qualified cellulosic ethanol produced in a compliance year.
Volumetric Ethanol Excise Tax Credit
Ethanol’s production economics are further enhanced in the United States by the Volumetric Ethanol Excise Tax Credit, or VEETC, commonly referred to as the Blender’s Credit. The Blender’s Credit, which was created by the American Jobs Creation Act of 2004, provides blenders and marketers of fuel with a federal tax credit of $0.45 on each gallon of ethanol blended with their gasoline. The Blender’s Credit is set to expire on December 31, 2011. All ethanol blended with gasoline in the United States qualifies for the Blender’s Credit, no matter the country of origin of the fuel ethanol. In connection with the Blender’s Credit, a 2.5 percent ad valorem tax and a tariff of $0.54 per gallon is imposed on imports of ethanol from all countries except Caribbean Basin Initiative countries. This tariff is in effect through December 31, 2011. In June 2011, the United States Senate voted 73-27 with bipartisan support not to extend the Blender’s Credit. With the increased likelihood of the credit and tariff expiring, we believe additional pressure will be put on the margins of corn ethanol producers and, as a result, we believe that they will be particularly interested in products that improve ethanol yields and reduce production costs.
Cellulosic Biofuel Producer Tax Credit
A cellulosic biofuel producer that is registered with the Internal Revenue Service may be eligible for a tax incentive, allowed as a credit against the producer’s income tax liability, in the amount of up to $1.01 per gallon of cellulosic biofuel that is:
| (i) | sold and used by the purchaser in the purchaser’s trade or business to produce a cellulosic biofuel mixture; |
| (ii) | sold and used by the purchaser as a fuel in a trade or business; |
| (iii) | sold at retail for use as a motor vehicle fuel; |
| (iv) | used by the producer in a trade or business to produce a cellulosic biofuel mixture; or |
| (v) | used by the producer as a fuel in a trade or business. |
If the cellulosic biofuel also qualifies for alcohol fuel tax credits, the credit amount is reduced to $0.46 per gallon for biofuel that is ethanol. For the purpose of the Cellulosic Biofuel Producer Tax Credit, cellulosic biofuel is defined as liquid fuel produced from any lignocellulosic or hemicellulosic matter that is available on a
73
Table of Contents
renewable basis, and meets the fuel and fuel additive registration requirements of the U.S. Environmental Protection Agency, or EPA. Alcohol with a proof of less than 150, fuel with a water or sediment content of more than 4%, and fuel with an ash content of more than 1% are not considered cellulosic biofuels. Under current law, only qualified fuel produced in the United States between January 1, 2009, and December 31, 2012 for use in the United States may be eligible.
Canada’s Renewable Fuel Standard and Biofuel Policies
Canada also represents a significant and growing market for biofuels with a total of 476 million gallons produced annually according to Ethanol Producer Magazine. Over the past decade, the Canadian government has made a clear commitment to renewable fuels and advanced green technologies through timely and effective programs and grants. In December 2010, the Canadian federal government began implementing its national renewable fuel standards as part of a strategy to meet its international GHG reduction commitments. Canada’s renewable fuel standards requires that a national average of 5% of gasoline be replaced by renewable fuels. This is expected to be achieved through the widespread use of E5, a gasoline blend with 5% ethanol by volume. In 2009, gasoline consumption in Canada was approximately 10.5 billion gallons. To meet the 5% requirement, Canada is expected to be a net importer of ethanol until domestic supply becomes available. As the Canadian supply of cellulosic ethanol increases, it is expected that Canada will follow the United States in mandating that 10% of gasoline be replaced by renewable fuels.
Cellulosic Feedstock Overview
We are working with leading industry participants to convert abundant and low-cost hardwood pulpwood biomass feedstocks into cellulosic ethanol. Cellulosic biomass feedstocks suited to ethanol production include the following:
| • | forest biomass and waste resources: logging residues such as hardwood and softwood chips, thinnings, pulpwood, mill residues and urban wood waste; |
| • | agricultural biomass and waste resources: crop residues such as corn stover (stalks, leaves, and cobs), sweet sorghum stubble, crop processing residues, and sugarcane residue such as bagasse; and |
| • | energy crops: perennial, fast-growing grasses such as switch grass and miscanthus, woody crops such as poplar, willow, southern pine and eucalyptus, and energy sorghum. |
Cellulosic biomass feedstocks are an abundant resource that can be used to produce substantial amounts of ethanol and other fuels to meet U.S. fuel demand. They are waste products or, in the case of trees and grasses grown specifically for ethanol production, can be grown on marginal lands not suitable for other crops. The use of cellulosic feedstock to produce ethanol also alleviates food supply concerns attendant to starch- and sugar-based feedstocks.
We believe that the wood product biomass industry provides a compelling alternative feedstock source for biofuels production, given the size of the ethanol market, the established infrastructure available to collect and transport the hardwood feedstock and the high energy content of the hardwood feedstock. According to the U.S. Department of Agriculture, or USDA, there are 226 million dry tons of total forestland resources currently in use and available for prices below $60 per dry ton, accounting for 48% of total current and potential biomass resources available in 2012 under baseline assumptions.
Wood Product Biomass Feedstock
The total forestland in the United States is approximately 750 million acres, about one-third of the nation’s total land area, according to a 2011 report by the USDA. Current removals from United States forestlands are about 320 million dry tons annually, which is estimated to be well below net annual forest growth. In 2006, forest growth net of harvesting, land clearing and mortality is estimated to have exceeded removals by 71%. The
74
Table of Contents
amount of forest biomass available is estimated to vary with price, and is expected to grow over time. As shown in the table below, at feedstock prices below $40 per dry ton nearly 80 million tons of forest biomass and wood wastes are available for use in 2012; and at prices of below $60 per dry ton of feedstock, nearly 100 million dry tons are projected to be available in 2012.
Estimated Forest Biomass Available in 2012 (Millions of dry tons)
| Feedstock price ($ per dry ton) |
Forest Residues | Urban Wood Waste | Mill Residues | Other | Total | |||||||||||||||
| < $20 |
14 | 12 | 7 | — | 33 | |||||||||||||||
| < $40 |
48 | 23 | 7 | 1 | 79 | |||||||||||||||
| < $60 |
55 | 32 | 7 | 3 | 97 | |||||||||||||||
| < $80 |
60 | 32 | 7 | 20 | 119 | |||||||||||||||
Source: USDA “U.S. Billion-Ton Update: Biomass Supply for a Bioenergy and Bioproducts Industry”, August 2011
Hardwood Feedstock
Hardwood trees make up a major component of U.S. forests and play an important role in the commercial wood products industry. According to the American Hardwood Export Council, approximately 25% of total annual U.S. production of lumber, plywood and veneer comprises hardwood, which makes the United States the largest hardwood producer in the world.
United States Biomass Resources (Forest Residues)
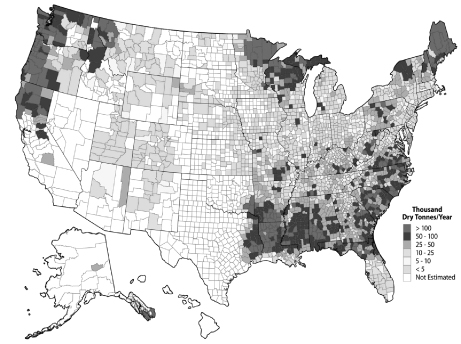
Source: USDA, U.S. Forest Service’s Timber Product Output database, 2007
According to the U.S. Forest Service, between 1953 and 2007, the volume of U.S. hardwood growing stock more than doubled from 5,210 million cubic meters to 11,326 million cubic meters. There was a 15% increase in growing stock between 1997 and 2007 despite strong growth in demand for hardwoods during this period. U.S.
75
Table of Contents
Forest Service forecasts indicate that further increases of 15-20% are expected in the hardwood growing stock inventory through 2030. Projections of hardwood growth and removals nationwide indicate that growth will continue to exceed removals through 2050.
The Industrial Chemicals Industry
The other industry that we believe is important to us from an end-products perspective is the industrial chemicals industry. Biomass feedstocks can be converted to organic chemicals that have similar characteristics as chemicals derived from fossil fuels such as petroleum. Through advanced development of our CBP platform technology, we expect to produce these primary petrochemicals using non-plant biomass feedstock. We intend to expand into the industrial chemicals market by adding additional production equipment to our hardwood CBP facilities or by developing dedicated biomass-to-chemical refineries.
76
Table of Contents
Overview
We are a renewable fuels company that has developed innovative technology for the low-cost conversion of abundant biomass. Our highly adaptable technology has also been demonstrated to convert biomass to renewable chemicals. Using our proprietary consolidated bioprocessing, or CBP, technology platform, we have developed genetically-modified yeasts and other microorganisms to reduce costs and improve yields in the production of renewable fuels and chemicals. According to the DOE, CBP technology is the ultimate low-cost configuration for the hydrolysis and fermentation of cellulosic feedstocks. Our CBP technology provides us with the ability to use a variety of feedstocks to produce multiple renewable fuel and chemical end-products. We plan to initially target the large and established first generation corn ethanol industry with our proprietary Mascoma Grain Technology, or MGT, yeast product. We are also working with leading industry participants to develop and construct commercial scale facilities to convert hardwood feedstocks into cellulosic ethanol. We believe that these facilities will offer compelling economic value to us and our collaborators based on the expected operating costs of these facilities and today’s market prices for fuel and feedstocks. In the future, we plan to expand the application of our CBP technology to develop advanced biorefineries that produce multiple high-value end-products, such as advanced fuels and chemicals, from many different feedstocks.
Conversion of cellulosic biomass typically involves a difficult process of breaking down the complex sugars found in plant material into simple, easy-to-process sugars and then converting these simple sugars into end-products. Our proprietary microorganisms, and our methodology for producing them, allow us to streamline the biomass conversion process and alleviate the need to purchase most of the expensive enzymes used in the process. Our microorganisms have been demonstrated to convert different types of plant material into fuel and chemical end-products in industrial processing conditions. We have built on decades of research to develop and acquire intellectual property related to biomass conversion technologies, including in the fields of pretreatment, hydrolysis, metabolic pathway engineering, enzyme expression and processes for biomass conversion. As of September 1, 2011, we owned or had licensed rights to approximately 75 distinct patent families in the United States, Canada and various other foreign jurisdictions covering our products, technologies and processes, which included approximately 9 issued patents and approximately 205 pending patent applications in the United States and various foreign jurisdictions.
We have established a staged strategy for the commercialization of our innovative CBP technology platform in the renewable fuels and chemicals industries. Our first commercial application of CBP technology is our genetically-modified MGT yeast product that can be used by corn ethanol producers as a drop-in substitute for existing yeasts. We expect to begin selling this product in 2012. We believe this product is capable of significantly improving the economics of corn ethanol production with negligible capital expenditures and will generate near-term revenue and gross margin for our company. We intend to capture, through a license agreement or other arrangement, a significant portion of the incremental margin generated by our line of MGT yeast products. We plan to pursue the corn ethanol market first in order to capitalize on the size and maturity of this market, the technologically advanced nature of our MGT product compared to conventional yeasts and our ability to cost-effectively deploy our CBP technology. Our initial MGT product adds value by alleviating the need to purchase most of the expensive enzymes currently used in corn ethanol production, lowering production costs. Based on laboratory test runs and management estimates of ethanol production costs, we believe that our initial MGT product will reduce the cost of producing corn ethanol by approximately $0.01 to $0.02 per gallon. As a result, we believe that this product can create significant and immediate value to corn ethanol producers, which collectively produced over 13 billion gallons of corn ethanol in the United States in 2010. Future generations of our MGT product are also expected to improve ethanol yields, further lowering production costs and potentially increasing revenue for corn ethanol products. Based on laboratory test runs, we believe future generations of our MGT product will be capable of ethanol yield improvements of up to 4%. Certain by-products of the corn ethanol conversion process are used as animal feed. Our MGT products are genetically modified and are considered to be processing aids in the production of animal feed. As a result, our MGT products are subject to regulation by the U.S. Food and Drug Administration’s Center for Veterinary Medicine, or CVM, and must
77
Table of Contents
subsequently be approved by the American Association of Feed Control Officers, or AAFCO. See the section entitled “—Regulatory Matters” for more information about this regulatory process.
We are also working with leading industry participants to develop and construct commercial scale facilities to convert abundant and low-cost hardwood pulpwood to cellulosic ethanol. Based on pilot production runs at our demonstration facility in Rome, New York, we have achieved hardwood to ethanol conversion yields of 67 gallons per bone dry short ton of hardwood. In a laboratory setting we have achieved ethanol conversion yields of 71 gallons per bone dry short ton of hardwood and we are working to continue to improve conversion yields. At our planned 20 million gallon per year commercial-scale hardwood CBP facility in Kinross, Michigan, we expect to achieve hardwood to ethanol conversion yields of 83 gallons per bone dry short ton of hardwood, with unsubsidized cash operating costs of approximately $1.77 per gallon. These estimates assume a hardwood feedstock cost of $66 per bone dry short ton of hardwood and are based on a 20 million gallon per year facility. Over the next several years we are targeting unsubsidized cash operating costs, net of revenue from the sale of co-products such as electricity, of less than $1.00 per gallon based on ethanol yields of 87 gallons per bone dry short ton of hardwood, increases in process efficiencies, economies of scale and ongoing improvements in enzyme expression and metabolic engineering in our microorganisms.
We expect that our first two hardwood CBP facilities will be built in Kinross, Michigan and Drayton Valley, Alberta. We anticipate construction of our hardwood CBP facility in Kinross, Michigan to start in the next 3 to 6 months and construction of our hardwood CBP facility in Drayton Valley, Alberta to start within 12 to 24 months. Our hardwood CBP commercialization strategy is “capital-light,” in that rather than build and operate the hardwood CBP facilities directly, we expect to collaborate with third parties to fund, build, develop and operate the facilities, while we contribute technology and receive fees and/or an equity interest in the facilities. For these two initial hardwood CBP facilities we expect to use government grants in addition to equity funding from strategic partners, but for future facilities we expect to rely primarily on financing from strategic and financial partners.
In the future, we plan to expand the application of our CBP technology to develop advanced biorefineries that produce multiple fuel and chemical end-products from a variety of feedstocks. Beyond corn and hardwood, we have already shown the flexibility of our CBP technology platform through the conversion into ethanol of a number of additional feedstocks in a laboratory setting, including corn stover, sugarcane bagasse, palm residue, softwood, miscanthus, switchgrass, paper sludge and sorghum, many of which are abundant and have limited end uses. We believe our feedstock flexibility will enable us to more effectively enter new geographic markets. In terms of end-products, we have demonstrated in a laboratory setting the production of propanol and fatty acids. These chemicals can in turn be used to create propylene and alkanes, which are the building blocks of many petrochemical replacements, and we plan to continue to expand the number of potential end-products.
Market Opportunity
As a result of our highly adaptable CBP technology platform, we intend to operate across the renewable fuels and chemicals industries, with a near-term focus on ethanol. We believe there is a significant market need for a low-cost, more sustainable alternative to petroleum-based products that is less volatile with respect to price and supply.
First Generation Ethanol
Virtually all the ethanol produced globally today is from edible sugar and starch sources, including corn in the United States and sugarcane in Brazil. These fuels are commonly referred to as first generation biofuels. The ethanol industry has grown significantly over the past several years. According to the RFA, U.S. corn ethanol production increased from 3.6 billion gallons in 2005 to over 13 billion gallons in 2010, which represented a compound annual growth rate of over 30% for that period, and ethanol exports in 2010 hit a record high of 350 million gallons. As of 2010, over 200 ethanol plants existed in the United States. We believe this large and
78
Table of Contents
established industry presents a compelling market for our drop-in MGT yeast product. In addition, current ethanol producers benefit from a volumetric ethanol excise tax credit from the Internal Revenue Service of $0.45 per gallon of ethanol produced or sold domestically. With the potential expiration of this credit in the near-term, we believe corn ethanol producers will be motivated to purchase products that reduce operating costs and improve ethanol yields to support their margins.
Second Generation Ethanol
As the demand for biofuels continues to grow, we believe production will shift increasingly from food-based to non-food based sources. Fuels produced from municipal solid waste and non-food plant materials such as hardwood, bagasse, corn stover and dedicated energy crops like switchgrass and miscanthus, are commonly referred to as second generation biofuels. While corn is expected to remain the primary feedstock for ethanol production in the United States in the near-term, there is an increasing push to produce ethanol and other biofuels from non-food plant materials. The U.S. Renewable Fuel Standard Program, or RFS, was established by the U.S. Environmental Protection Agency, or EPA, in 2005 under the Energy Policy Act of 2005. As required by the Energy Independence and Security Act of 2007, the standards were revised in February 2010. We refer to these modifications as RFS2, which, among other requirements, mandate that 36 billion gallons of renewable fuels (such as biofuels) from multiple sources be blended into transportation fuels by 2022. Of the 36 billion gallons of renewable fuels mandated by 2022, 20 billion gallons are mandated to be advanced biofuels (excluding 1 billion gallons of biomass-based diesel), with at least 16 billion gallons required to be cellulosic biofuels. Biofuels are primarily produced from corn, cereal grains, sugarcane and other organic materials. Advanced biofuels are renewable fuels that produce at least 50% less greenhouse gases, or GHG, on a life cycle basis compared to GHG emissions of petroleum products as measured in 2005. Cellulosic biofuels are renewable fuels produced from wood, grasses or non-edible parts of plants that produce at least 60% less GHG on a life cycle basis compared to GHG emissions of petroleum products as measured in 2005. The vast majority of ethanol consumed in the United States today is produced from corn and does not satisfy RFS2 advanced biofuels requirements. We expect the ethanol produced at our hardwood CBP facilities will be a cellulosic biofuel and we intend to capitalize on this mandated market.
Mandated Renewable Fuels Production under RFS2
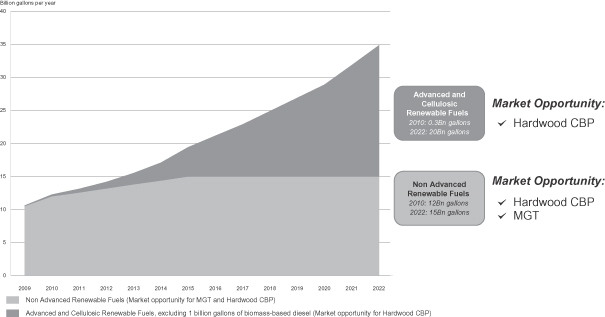
Source: EPA
79
Table of Contents
Advanced Chemicals
In the future we expect to apply our CBP technology platform to the production of advanced chemicals from renewable biomass sources. Petrochemicals, which have traditionally been derived from fossil fuels such as petroleum, natural gas or coal, represent a large and established market. To date, using our CBP technology platform, we have produced ethanol and propanol in laboratory settings, which can be converted into ethylene and propylene, respectively.
Market Challenges
The market for renewable fuels and chemicals has evolved significantly over the past several years, with many companies seeking to capitalize on the growing market potential and the environmental benefits offered by these products. However, many challenges exist and we believe that companies will need to satisfy the following criteria to succeed in this market:
| • | Demonstrated and Validated Technology. Numerous technologies have been offered as solutions for producing renewable fuels and chemicals. However, in order to become economically viable, many of these emerging technologies rely on anticipated technological improvements and future cost reductions. We believe there is a clear market demand for technologies that have been demonstrated and are expected to be cost-competitive at a commercial scale. We believe that the validation and adoption of a particular technology by independent third parties, whether as engineering, off-take or feedstock partners, are critical. |
| • | Comprehensive, Integrated Process. Many of the emerging technologies in the second generation biofuels markets are focused on just one of the steps in the biomass conversion process. These solutions rely on compatibility with, and often improvements in other stages of the process by third parties in order to achieve economic viability. As a result, we believe there is a strong need for a comprehensive and viable biochemical solution that facilitates biomass conversion without dependence on other pending emerging technologies. |
| • | Low Cost. We believe that market participants are focused on a technology’s all-in cost, which takes into account upfront capital spending as well as ongoing operating costs. Most of the non-feedstock operating costs in current processes are related to the need to purchase most of the expensive enzymes required to make the current technology work. For example, we believe enzymes may account for approximately $0.50 per gallon in operating costs for cellulosic ethanol facilities. As a result, we believe a process that eliminates or reduces enzyme and associated costs would have an advantage over other technologies. |
| • | Flexibility. Currently, the vast majority of biofuels are developed from food-based feedstocks such as corn, cereal grains and sugarcane. Given their dependence on a single feedstock, corn ethanol producers have been significantly impacted by volatility in the price of corn. It is expected that future growth in this industry will come from non-food feedstocks. The technologies utilized by producers of first generation ethanol are currently used to produce one primary end-product and are generally unable to process inputs other than their primary feedstock. We believe ethanol producers and other industry participants are looking for a flexible technology that can be applied to different feedstocks and can produce various end-products. |
Our Competitive Strengths
We believe that we benefit from the following competitive strengths:
| • | Proven CBP Technology. We have demonstrated the performance of our MGT yeast product and hardwood CBP technology as follows: |
| • | Validation of the performance of our initial MGT yeast product by ICM, Inc., the leading provider of engineering services to the ethanol industry; |
| • | Successful production runs using our hardwood CBP microorganisms, including more than 1,000 continuous hours of operating data on a fully-integrated basis at our demonstration facility in Rome, New York; |
80
Table of Contents
| • | Validation of our hardwood CBP technology by independent engineers at the U.S. Department of Energy and by independent third parties; and |
| • | Proven commercial use of the core equipment used in our biomass conversion process, with the front-end pretreatment equipment traditionally used in the pulp and paper industries, and the back-end distillation equipment used in the fuels and petrochemical industries. |
| • | Comprehensive and Efficient Biochemical Solution for Biomass Conversion. We know of no other company that provides a comprehensive biochemical solution for the production of renewable fuels and chemicals from multiple feedstocks that covers the full spectrum of the biomass conversion process, including pretreatment, hydrolysis and fermentation. By controlling key aspects of our manufacturing process, we are not reliant on technological improvements or cost reductions by third parties to be cost-competitive. We believe our CBP technology platform, which converts cellulosic biomass into high-value end-products in a single step, increases our ability to reduce costs for both corn ethanol producers and producers of second generation ethanol and provides us with a competitive advantage over other technologies and processes. |
| • | Low All-in Cost Solution. CBP is distinct from other, less integrated configurations, in that it alleviates the need to purchase most of the expensive enzymes associated with most other ethanol production methods while also improving yields. In doing so, the technology enables the cost-effective conversion of cellulosic biomass into renewable fuels and chemicals and lowers costs in first generation ethanol production. Our substantial experience with CBP technology has enabled us to develop an integrated biomass conversion solution that is differentiated by its cost-effectiveness today, without government subsidies or incentives or third-party improvements in technology or yield. In addition, we believe there will be significant future cost reduction opportunities using our CBP technology as we gain experience with commercial processing and benefit from economies of scale. |
| • | Capital-Light Path to Revenue Generation. The commercialization of our initial MGT yeast product is not dependent on any meaningful capital expenditures by us or any third parties. Our hardwood CBP commercialization strategy is “capital-light,” in that rather than build and operate the hardwood CBP facilities directly, we intend to collaborate with third parties to fund, build, develop and operate the facilities, while we contribute technology and receive fees from and/or an equity interest in each facility to provide us with a share of that facility’s profits and related cash flow. As a result, we believe our business model has the potential to generate significant financial returns while minimizing our operational and financial risk. |
| • | Feedstock Flexible and Adaptable Technology. CBP is a flexible technology that we believe can be adapted for a wide variety of potential feedstocks. As a result, we expect that we will be able to adjust our focus based on long-term changes in the market demand for particular feedstocks. Being feedstock flexible also allows us to provide a value-add product to the mature first-generation ethanol market in the near-term, while, over time, adapting our technology for use in different regions based on the feedstock that is the least expensive and most abundant in the region. To date, in addition to our proven ability to convert corn and hardwood, we have also successfully demonstrated in a laboratory setting the ability to convert a number of additional feedstocks including corn stover, bagasse, palm residue, softwood, miscanthus, switchgrass, paper sludge and sorghum. In the long-term, we believe our adaptable CBP technology will also enable us to produce a variety of end-products, including advanced fuels and chemicals. |
| • | Deep Domain Expertise. We believe that our business is differentiated by our ability to leverage the deep domain expertise of an exceptional and distinguished group of executives, scientists and partners. Our management team has a strong, demonstrated record of leadership and growth in the fuel, chemical and biotechnology industries. We were founded by pioneers in consolidated bioprocessing and cellulose conversion, Dr. Lee Lynd and Dr. Charles Wyman, who, together with Dr. Michael Ladisch, are our key science officers. They possess deep domain knowledge of cellulosic biomass, biomass conversion, pretreatment, fermentation and related processes and regularly provide us with insight into |
81
Table of Contents
| important technical and engineering aspects of the conversion of cellulosic biomass into renewable fuels and chemicals. We believe that our combination of management, intellectual property, know-how and technical expertise sets us apart in the industry. |
Our Strategy
We have a staged approach for the commercialization of our CBP technology. We intend to go to market first with our genetically-modified MGT yeast product while also working with leading industry participants to develop and construct commercial scale facilities to convert hardwood feedstocks into cellulosic ethanol. Our long-term goal is to provide the leading technology to advanced biorefineries for the conversion of biomass from non-food plants to fuels and chemicals.
| • | Deploy our Proprietary MGT Product to the Large and Established Corn Ethanol Market. Our first commercial application of CBP technology is our proprietary MGT product, which is a genetically-modified yeast product that can be used by corn ethanol producers as a drop-in substitute for conventional fermenting yeast. Following the completion of CVM review and approval, we intend to market this product to the more than 200 corn ethanol plants that, according to the RFA, produced over 13 billion gallons of ethanol in the United States in 2010. We believe our initial MGT yeast product is capable of significantly improving the economics for corn ethanol producers and will generate near-term revenue and gross margin for our company and requires negligible capital expenditures. Based on laboratory test runs, we believe future generations of our MGT product will be capable of ethanol yield improvements in commercial-scale ethanol production of up to 4 %. We believe this compelling value proposition will drive rapid adoption of our MGT products among first generation ethanol producers, solidify our technology leadership position and help establish our credibility in the larger fuel market. |
| • | Convert Hardwood Pulpwood into Cellulosic Ethanol on a Commercial Scale. We believe that converting hardwood to cellulosic ethanol is the best entry point into the advanced biofuels market given the abundant supply and the low cost of hardwood feedstock. Our hardwood CBP commercialization strategy is “capital-light,” in that rather than build and operate the hardwood CBP facilities directly, we expect to collaborate with third parties to fund, build, develop and operate the facilities, while we contribute technology and receive fees from and/or an equity interest in each facility to provide us with a share of that facility’s profits and related cash flow. We are working with leading industry participants to develop and construct our first two hardwood CBP facilities in Kinross, Michigan and Drayton Valley, Alberta. We expect construction of our hardwood CBP facility in Kinross, Michigan to start in the next 3 to 6 months and construction of our hardwood CBP facility in Drayton Valley, Alberta to start within 12 to 24 months. We expect to locate additional future hardwood CBP facilities in proximity to large sources of hardwood biomass, partner with local project developers and feedstock providers and expand our ability to capitalize on the co-products, such as electricity, produced at future facilities. For our initial hardwood CBP facilities we expect to use state and federal government grants in addition to equity funding from strategic partners, but for future facilities we expect to focus on financing from strategic and financial partners. We believe that our hardwood CBP facilities will serve as the foundation for our expansion into new feedstocks and end-products and that the success of our initial hardwood CBP facilities may facilitate the use of traditional project financing for future facilities. |
82
Table of Contents
As set forth in the chart below, over time, we have significantly increased ethanol conversion yields in pilot production runs at our demonstration facility in Rome, New York and we expect to generate additional yield increases as we further improve upon our technology. We also expect that future facilities will be larger than our planned 20 million gallon per year facility in Kinross, Michigan and, as a result, these future facilities will have lower operating costs due to improved economies of scale.
| Operating Costs(1)
Dollars per Gallon of Ethanol |
Ethanol Yields
Gallons/Tons of Biomass | |||
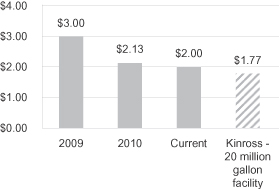
|
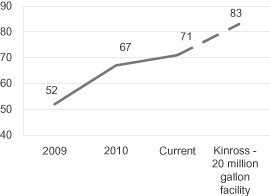
|
| (1) | The operating cost of $3.00 for 2009 is based on a hardwood to ethanol conversion yield of 52 gallons per bone dry short ton. The operating cost of $2.13 for 2010 is based on a hardwood to ethanol conversion yield of 67 gallons per bone dry short ton. The current operating cost of $2.00 is based on a hardwood to ethanol conversion yields of 71 gallons per bone dry short ton. The yields for 2009 and 2010 and our current yields have been demonstrated in pilot production runs at our 200,000 gallon demonstration facility in Rome, New York. The estimated operating cost of $1.77 for our planned hardwood CBP facility in Kinross, Michigan assumes that the facility is built to our specifications with a hardwood to ethanol conversion yield of 83 gallons per bone dry short ton, which is what we expect when the facility is fully operational. All of the operating cost estimates set forth in the table above assume a hardwood feedstock cost of $66 per bone dry short ton of hardwood and estimated operating expenses for a 20 million gallon per year facility. None of the operating costs includes depreciation or cost of financing the facility. |
| • | Expand into New Geographies and Different Feedstocks. Upon successful commercial application of our CBP technology platform to hardwood feedstocks in North America, we believe we will be able to apply this highly adaptable technology to different feedstocks and enter new geographic markets. For example, we believe there is significant market opportunity to adapt our CBP technology through the development of microorganisms to convert sugarcane bagasse and cane trash into ethanol, which are abundant and low-cost feedstocks in Brazil and other geographies. Sugarcane bagasse refers to the crushed stalks that remain after sugar is extracted from cane and cane trash refers to the leaves and plant tops that are disposed of during cane harvesting. We believe these feedstocks are an attractive next target for our commercialization plans because, much like hardwood, bagasse and cane trash are plentiful and inexpensive biomass feedstocks relative to corn. Similar to our hardwood strategy in North America, we expect to generate revenue through a combination of fees from and/or ongoing equity interests in new production facilities. According to Hart Energy Consulting, Brazil may need to double its supply capacity over the next 10 years in order to meet increasing demand. Given the constraints in the availability of sugarcane, we believe a significant portion of this incremental demand will need to be met through conversion methods such as ours used to create second generation ethanol. We are also exploring the application of our technology in other countries including Canada, China, India and South Africa. |
| • | Enable Advanced Biorefineries. Our long-term goal is to enable the development of advanced biorefineries that utilize multiple feedstocks to produce a wide variety of high-value fuels and |
83
Table of Contents
| chemicals. The National Renewable Energy Laboratory defines a “biorefinery” as a facility that integrates biomass conversion processes and equipment to produce fuels, power, and chemicals from biomass. The biorefinery concept is analogous to petroleum refineries that currently produce a wide spectrum of fuels and chemicals from petroleum. However, unlike petroleum refineries, a biorefinery utilizing our technology could be adapted for a different feedstock or end-product without significant changes to its installed infrastructure. A biorefinery can produce multiple end-products from the sugars, lignin and other components and intermediates that result from the conversion of different feedstocks. Through a biorefinery approach, we intend to expand into the industrial chemicals market through conversion of biomass feedstock into higher-value chemicals such as ethylene and propylene derivatives by adding on to existing hardwood CBP facilities and by developing dedicated biomass-to-chemical refineries. The markets for these chemicals are global, growing and significant, and we believe that in the future we will be able to access these markets with our technology platform. |
Our Commercialization Plan
We are pursuing multiple applications for our highly adaptable CBP technology platform, including a genetically-modified MGT yeast product and the licensing of technology enabling the production of cellulosic ethanol and, in the future, other advanced biofuels and chemicals.
Our MGT Yeast Products
Our first commercial application of CBP technology is our MGT yeast product. Our proprietary MGT product is a genetically-modified yeast product that can be used by corn ethanol producers as a drop-in substitute to conventional yeast. Our initial MGT product adds value by alleviating the need to purchase most of the expensive enzymes currently used in corn ethanol production, which lowers costs. Future versions of our MGT products are expected to improve ethanol yields, which further lowers costs and could also increase revenue for corn ethanol producers. We intend to market this product to the more than 200 corn ethanol plants that, according to the RFA, produced over 13 billion gallons of ethanol in the United States in 2010. We believe this compelling value proposition will drive rapid adoption of our MGT product among first generation ethanol producers.
We are currently working with ICM to support the launch of our MGT products. ICM is an industry leader in the design, building, and support of ethanol plants, having engineered and built over 100 ethanol facilities. We intend to leverage this relationship to gain access to potential corn ethanol producer customers. We expect ICM’s role will be to assist in the initial commercialization of our MGT products, which will include pilot testing in their research and pilot plant facility in St. Joseph, Missouri and direct technical support from ICM personnel in the initial rollout to commercial facilities. ICM has also provided independent validation of the performance of our initial MGT yeast product and is currently in the process of validating our next MGT product.
We plan to establish partnerships with the leading yeast producers, such that they will manufacture, distribute, market and sell our MGT product to corn ethanol producers. We plan to establish a small sales and marketing team to sell and promote our MGT product to corn ethanol producers, both directly and together with our yeast production partners, as well as providing technology support to customers. We intend to either enter into agreements directly with corn ethanol producers in which they agree to pay us a fee based on the incremental improvement in their margin or we recoup such a payment through agreements with our yeast production partners.
We have several products under development that we expect to launch over the next several years under our MGT brand:
| • | MGT 1.0: Our first commercial product, MGT 1.0, is planned for commercial demonstration and launch in the next eight months, subject to regulatory review and approval. MGT 1.0 will be a first of a kind product – an advanced yeast which will provide significant value to ethanol producers by |
84
Table of Contents
| alleviating the need to purchase most of the expensive enzymes currently used in corn ethanol production. Based on laboratory test runs and management estimates of ethanol production costs, we believe that MGT 1.0 will reduce the cost of producing corn ethanol by approximately $0.01 to $0.02 per gallon. MGT 1.0 can be used as a direct replacement and has production cost similar to yeasts currently used in ethanol production. |
| • | MGT 1.1: Our next MGT product, MGT 1.1, is planned for commercial demonstration and launch in the next two years. MGT 1.1 builds upon cost savings associated with our MGT 1.0 technology by significantly increasing the yield of ethanol per bushel of corn without any reduction in the robustness of the yeast. Our MGT 1.1 product increases yields by converting more recalcitrant sugars to ethanol, which are unable to be converted in the process typically used by ethanol producers today. Based on laboratory test runs, we believe MGT 1.1 will provide up to 4% yield improvements. We believe that MGT 1.1 will be a disruptive product in the market and provide significant incremental value over that provided by conventional yeast and enzymes. |
Certain by-products of the corn ethanol conversion process are used as animal feed. Our MGT products are genetically modified and are considered to be processing aids in the production of animal feed. As a result, our MGT products are subject to regulation by CVM and must subsequently be approved by AAFCO. See the section entitled “—Regulatory Matters” for more information about this regulatory process. Our MGT 1.0 product is currently under scientific review at CVM. We expect CVM to complete its review by the fourth quarter of 2011 or early 2012, and we expect to initiate regulatory review of MGT 1.1 following the completion of our validation tests.
Our Hardwood CBP Technology
We have also used our CBP technology to convert hardwood feedstock into cellulosic ethanol. By 2022, RFS2 mandates the use of 20 billion gallons of advanced biofuels (excluding 1 billion gallons of biomass-based diesel), which are renewable fuels that produce at least 50% less GHG on a life cycle basis compared to the GHG emissions of petroleum products as measured in 2005. By 2022, RFS2 mandates the use of 16 billion gallons of cellulosic biofuels, which are renewable fuels that produce at least 60% less GHG on a life cycle basis compared to the GHG emissions of petroleum products as measured in 2005. As a result, there has been increased market interest in producing cellulosic ethanol to, among other things, provide an alternative to fossil fuels and reduce carbon emissions.
Based on our laboratory and pilot-scale test runs, we believe we are able to convert hardwood feedstocks at costs that are competitive with costs to produce corn ethanol based on yields that ethanol producers currently realize and current corn prices. Our hardwood conversion process is cost competitive as a result of our streamlined biomass conversion process and the reduced need to purchase most of the expensive enzymes currently used in the process.
85
Table of Contents
The graphic below illustrates the difference between producing cellulosic ethanol using the conventional conversion approach and our approach, as well as the primary advantages offered by our CBP process:
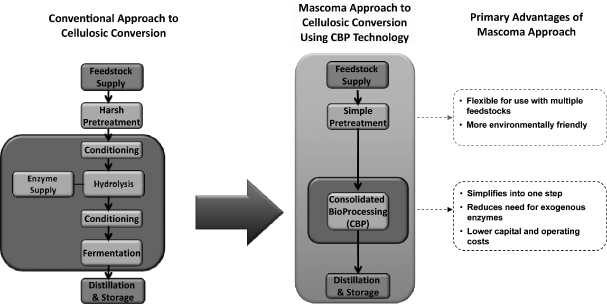
We expect that our first two hardwood CBP facilities will be built in Kinross, Michigan and Drayton Valley, Alberta. We expect to receive fees from and/or an equity interest in each of these facilities, which will provide us with an ongoing share in their returns.
| • | Kinross, Michigan: The hardwood CBP facility in Kinross, Michigan is expected to be a 20 million gallon per year facility. We intend to develop and construct this facility through a partnership with J.M. Longyear, L.L.C., a Michigan limited liability company, or Longyear. Longyear brings to this partnership large project development experience, local knowledge, and 120 years of timberland management experience. In December 2008, we and Longyear formed Frontier Renewable Resources, LLC, or Frontier, to develop and operate an integrated commercial-scale cellulosic fuel production facility in the state of Michigan. We expect that Frontier, in conjunction with a leading industry participant that will hold a majority ownership interest, will own and operate our hardwood CBP facility in Kinross, Michigan. At June 30, 2011, we had a 75% ownership interest in Frontier and Longyear owned the remaining 25%. We have contributed proceeds received under a grant agreement with the Michigan Economic Development Corporation toward construction of the Kinross facility through Frontier and Longyear has agreed to contribute land for the construction of the facility. At December 31, 2010, we had received grant proceeds of $12.1 million and contributed the entire amount to Frontier. We are also in the process of securing additional third party financing, as well as long-term enzyme supply, feedstock and off-take agreements from leading industry participants. |
| • | Drayton Valley, Alberta: The hardwood CBP facility in Drayton Valley, Alberta is expected to be a 20 million gallon per year facility that will produce ethanol, as well as coproducts such as renewable electricity and purified xylose. In March 2010, we entered into a Biorefining Commercialization and Market Development Program Grant Agreement with the Province of Alberta, Canada, or Alberta, in connection with receiving financial assistance for the development of our planned commercial cellulosic ethanol facility in Alberta, Canada. Under this arrangement, Alberta will provide up to $0.8 million in funding to be used exclusively for this project. We are in the process of securing third party and additional government financing, as well as long-term feedstock and off-take agreements from leading industry participants. |
86
Table of Contents
We intend to build on our experience at the facilities at Kinross, Michigan and Drayton Valley, Alberta and intend to replicate this model by partnering to build additional commercial facilities near other large sources of hardwood biomass. We also intend to sell our pretreatment equipment to these additional facilities. In addition to Kinross, Michigan and Drayton Valley, Alberta we have identified additional potential development sites in the Great Lakes region and Alberta. We intend to continue to expand this pipeline of production sites over the coming years. We believe the commercial success of these initial hardwood CBP facilities may also provide us with access to traditional project financing.
Other CBP Applications
In the future, we plan to expand the application of our CBP technology to develop biorefineries that produce multiple fuel and chemical end-products from a variety of feedstocks. We have already shown the flexibility of our CBP technology platform through the conversion into ethanol of corn and hardwood at pilot-scale production as well as a number of additional feedstocks in a laboratory setting, including corn stover, bagasse, palm residue, softwood, miscanthus, switchgrass, paper sludge and sorghum. In terms of end-products, in a laboratory setting, we have used our CBP technology to produce propanol and fatty acids, which can in turn be used to create propylene and alkanes, and we plan to continue to expand the number of potential end-products. We believe that with additional research and development work, we can use our CBP technology to create microorganisms and processes that can convert biomass into a variety of additional end-products such as biomass-based diesel, advanced fuels and petrochemicals.
We believe we will be able to apply this highly adaptable technology to different feedstocks and enter new geographic markets. For example, we believe there is significant market opportunity to adapt our CBP technology through the development of microorganisms to convert sugarcane bagasse and cane trash into ethanol, which are abundant and low-cost feedstocks in Brazil and other geographies. We believe our CBP technology platform can be readily adapted to convert both sugarcane bagasse and cane trash into ethanol. We believe these feedstocks are an attractive next target for our commercialization plans because, much like hardwood, bagasse and cane trash are plentiful and inexpensive biomass feedstocks relative to corn. According to Hart Energy Consulting, Brazil may need to double its ethanol capacity over the next 10 years in order to meet increasing demand. Given the constraints in the availability of sugarcane, we believe a significant portion of this incremental demand will need to be met through conversion methods such as ours that can be used to create second generation ethanol from feedstocks such as sugarcane bagasse and cane trash.
Pretreatment Equipment Applications
In addition to our CBP technology platform, we also design our own proprietary pretreatment systems that can be used in conjunction with or independently from our hardwood CBP technology. We acquired our pretreatment equipment business from SunOpta Inc. in 2010. Pretreatment of the biomass feedstock is the first step in the process of converting biomass into sugars and fuels, to break down the structure of the biomass and make it more conducive to extracting usable sugars. Pretreatment is typically done chemically, using harsh acids and chemicals to break down biomass. Our pretreatment technology uses steam and pressure to break down biomass, in a simpler, less expensive method. We know of no other technology provider in the marketplace that provides a comprehensive biochemical solution to biofuels producers, from upstream pretreatment equipment to downstream CBP conversion technologies. We intend to sell our pretreatment equipment to the third parties that are developing and constructing our hardwood CBP facilities. We believe these facilities could benefit from synergies from using our pretreatment equipment in conjunction with our hardwood CBP technology. We may also pursue independent sales of our pretreatment equipment to customers other than those using our hardwood CBP technology, particularly in international markets where we do not intend to have a hardwood CBP presence. We currently manufacture our pretreatment equipment through third-party contract manufacturers and expect to continue to do so.
87
Table of Contents
Our Key Relationships
Commercial Arrangements
JM Longyear
In December 2008, we and Longyear formed Frontier to develop and operate an integrated commercial-scale cellulosic fuel production facility in the state of Michigan. As of June 30, 2011, we had a 75% ownership interest in Frontier and Longyear owned the remaining 25%. We have the right to appoint four directors to Frontier’s board of directors and the other member may appoint one director to the board of directors. The members contribute capital based on their interest in Frontier and are reimbursed for their out-of-pocket expenses related to the formation of Frontier. The initial contribution by each member is set forth in an operating agreement, which also provides for the distribution of earnings and losses. The initial contribution that we made was from the proceeds received under a grant agreement with the Michigan Economic Development Corporation and Longyear has agreed to contribute the land for the construction of the facility. The operating agreement was amended in June 2010 to provide that Longyear will contribute the land at a date to be determined by the board of Frontier on or after January 1, 2012, upon commencement of development at the site. At any time between the second and third anniversary of this commencement date, we have the right to acquire the noncontrolling interest held by Longyear. During that same period, Longyear has the right to put its interest in Frontier to us. The amount to be paid under our call option and Longyear’s put option is equal to Longyear’s capital contribution plus a guaranteed 12% annual rate of return on Longyear’s capital contribution. Longyear’s put right has been accounted for as part of the carrying value of the noncontrolling interest. Because the put right is not within our control, the noncontrolling interest has been classified with temporary equity as noncontrolling interest.
In connection with the formation of Frontier by us and Longyear, we entered into a collaboration agreement with Frontier and Longyear in December 2008 to govern our partnership in developing our planned hardwood CBP facility in Kinross, Michigan. Unless earlier terminated, this collaboration agreement continues until Frontier dissolves or until either we or Longyear are no longer a member of Frontier, and may be terminated earlier by any party upon a material default or bankruptcy by another party. Under this collaboration agreement, we will own all inventions conceived of and reduced to practice in the course of the project. Longyear is prohibited from competing with us under this agreement so long as it is a member of Frontier and for 5 years thereafter. So long as Longyear is a member of Frontier and for 3 years thereafter, it is prohibited from selling timber products or other feedstock used by the planned facility to any third party within a 100-mile radius of the planned facility.
Government Grants
The U.S. Department of Energy
In October 2007, we entered into a grant agreement with the United States Department of Energy, or the DOE, for the development of an organism for the conversion of lignocellulose to ethanol. Under this grant, as amended, the DOE will provide us with up to approximately $4.3 million, payable in phases and dependent on the results of each phase. As of June 30, 2011, we have received $4.1 million in proceeds from the DOE under this grant.
In September 2008, we entered into a grant agreement with the DOE, for the construction of an industrial scale fermenter system and the design, construction and operation of an integrated cellulosic ethanol plant for transforming locally grown mixed hardwoods or switchgrass into ethanol. As of June 30, 2011, we have received approximately $16.5 million under this award. Under this grant, the DOE will provide us with up to approximately $20.0 million, payable in phases and dependent on the results of each phase. We are required to make periodic progress reports on the status of our project and notify the DOE of any significant favorable or adverse events during the course of the project.
88
Table of Contents
The BioEnergy Science Center
In June 2008, we entered into a subcontract with UT-Battelle, LLC governing funds for the research and development to achieve advances in sustainable production and economical conversion of lignocellulosic biomass to enable the production of biofuels. We are one of the more than a dozen participants in the BioEnergy Science Center, or BESC, supporting the multi-year effort to overcome recalcitrance of cellulosic biomass to conversion. BESC will provide up to approximately $6.3 million to fund our portion of the project. As of June 30, 2011, we have received $5.1 million from BESC. Our obligations include providing regular reports on the status of research and progress of the project, and ensuring that two of our employees and consultants remain on the project. Under the terms of the subcontract, we retain patent rights to inventions arising from the project, while the United States government receives a nonexclusive license to use such inventions. The term of the contract lasts through September 2012.
The Michigan Strategic Fund
In December 2008, we entered into a grant agreement with the Michigan Strategic Fund, or MSF, in connection with a grant of funds from the MSF to fund our planned hardwood CBP facility in Kinross, Michigan. In connection with this grant agreement, as amended in March 2009, we were awarded a grant of up to $20.0 million, to be paid in installments upon certain milestones such as filing required environmental permits and finalizing commercial agreements relating to supply, construction and operation of the planned facility. As of June 30, 2011, we have received $12.1 million from MSF. As of December 31, 2010, our consolidated balance sheet includes approximately $958,000 of cash and cash equivalents and $5.1 million of short-term investments that are held by Frontier related to the remaining grant proceeds, which are intended to be used for construction of the production facility. Our ongoing obligations under this grant agreement include providing regular progress reports on the status of the project and the milestones achieved. Unless earlier terminated for default under the terms identified in the grant agreement, the term of this grant agreement lasts until December 2013.
The New York State Energy Research and Development Authority
In October 2007, we entered into a grant agreement with the New York State Energy Research and Development Authority, or NYSERDA, to build and operate a biomass-to-ethanol demonstration plant in Rome, New York. In connection with this grant agreement, we were awarded a grant of up to $14.8 million, to be paid in installments upon certain milestones. As of June 30, 2011, we have received $13.8 million in proceeds from NYSERDA.
The Province of Alberta, Canada
In March 2010, we entered into a Biorefining Commercialization and Market Development Program Grant Agreement with the Province of Alberta, Canada in connection with receiving financial assistance for the development of our planned commercial cellulosic ethanol facility in Alberta, Canada. Under this arrangement, Alberta will provide up to $0.8 million in funding to be used exclusively for this project. Until the completion of the project, we are obligated to provide regular reports on the status of the project, and upon receipt of any study, analysis or report relating to the project, forward them to Alberta.
Our Technology
In a 2006 report on biomass conversion to biofuels, the DOE endorsed the view that CBP technology is widely considered the ultimate low-cost configuration for cellulose hydrolysis and fermentation. Our technology is focused on overcoming the key impediment to conversion of cellulose into fuels and chemicals: cost-effectively accessing the chemical building blocks locked in cellulosic materials. Our CBP platform utilizes genetically modified yeast and bacteria to convert cellulosic biomass into high-value end-products in a single step that combines hydrolysis and fermentation.
89
Table of Contents
Plant polysaccharides, such as starch, cellulose, and hemicellulose, are broken down naturally in the environment through the action of enzymes and microorganisms. Our CBP technology platform harnesses and accelerates these natural processes.
Typically, biomass conversion processes require a collection of saccharolytic enzymes (cellulases and hemicellulases), which hydrolyze the carbohydrates present in pretreated biomass to sugars, and microorganisms capable of fermenting the liberated sugars into ethanol or other end-products. When the microorganisms both produce the necessary saccharolytic enzymes and ferment the liberated sugars to end-products, the biomass conversion process is called consolidated bioprocessing, or CBP.
CBP is distinct from other, less integrated conversion technologies, in that it alleviates the need for third-party production of saccharolytic enzymes. Since the separate production of such enzymes is expensive, CBP offers a low-cost alternative to traditional biomass conversion processes. By alleviating the need for the high-cost enzymes associated with most other cellulosic-derived ethanol production methods, the technology enables the cost-effective conversion of cellulosic biomass, and lowers costs in first generation ethanol production.
CBP requires the development of engineered microorganisms, since naturally occurring microorganisms are not capable of simultaneously making the necessary saccharolytic enzymes and converting the sugars released by those enzymes into the desired end-products. In addition, CBP microorganisms need to be able to perform both of these tasks efficiently and rapidly under challenging, industrial processing conditions. Our scientists have developed robust, industrial microorganisms by combining the best qualities of naturally-occurring microorganisms into a single, industrial biocatalyst.
Our scientists have employed advanced biotechnology and bioengineering to develop a range of proprietary CBP microorganisms that in laboratory and pilot settings have demonstrated the capability to:
| • | produce a collection of saccharolytic enzymes; |
| • | utilize a wide variety of sugar released by the saccharolytic enzymes; |
| • | convert sugars into valuable fuels and chemicals; and |
| • | thrive under industrial conditions. |
Releasing the constituent sugars available in biomass requires the coordinated action of many enzymes. For example, amylase, glucoamylase and a number of other enzymes are utilized for the conversion of starch. Different collections of specialized enzymes are needed to break down the cellulose and hemicellulose in cellulosic biomass feedstock. In developing our CBP microorganisms, we have identified the naturally-occurring genes that are needed to produce these enzymes and that work best in our industrial biocatalysts. Using this collection of enzymes, we have developed microorganisms capable of producing many enzymes simultaneously and have developed more effective enzymes through well-established genetic engineering techniques.
The enzymatic hydrolysis described above releases a variety of simple and complex sugars, including glucose, xylose, mannose, galactose, and arabinose. In nature, all of these sugars serve as food and energy for a broad spectrum of microorganisms. However, many industrial microorganisms, including the yeasts used to produce fuel ethanol from corn starch and sugarcane, use only a few of these simple sugars effectively and are incapable of using more complex sugars. In 2007, we engineered the metabolism of robust, industrial yeasts to enable the production of ethanol from the most abundant sugars in hardwood. Using the same type of metabolic engineering, we believe we can develop other CBP microorganisms that utilize other sugars found in certain biomass materials.
We also employ metabolic engineering and directed evolution to create CBP microorganisms that efficiently produce ethanol and other products. Such tools have enabled the development of CBP microorganisms that produce more ethanol by reducing the production of certain by-products, such as glycerol, which are produced by
90
Table of Contents
conventional yeast during ethanol production from corn starch and sugarcane. In developing our CBP microorganisms for the production of propanol, fatty acids, and other products, we have employed these same tools. Our approach, which directly links product formation to fermentative growth of the microorganisms, creates strains of microorganisms that efficiently produce ethanol and other products at high yield.
Large-scale, low-cost production of ethanol and other commodity products rely on biocatalysts that can thrive under challenging industrial conditions. To address this need, we have screened diverse collections of microorganisms to find those that grow robustly under such conditions. The most robust strains have been utilized in engineering our CBP microorganisms. In addition, the performance of the microorganisms has been improved through a deliberate and long-term strain improvement program, which uses directed evolution and other techniques to create strains with greater capacity to tolerate conditions that would otherwise inhibit growth, such as the presence of ethanol, acetic acid, and inhibitors derived during the pretreatment of cellulosic biomass. Our current CBP microorganisms are more tolerant of inhibitors than their predecessors and with ongoing development, we expect the CBP microorganisms we develop in the future to be even more robust.
Our CBP microorganisms, which have the ability to produce saccharolytic enzymes, utilize the sugars present in biomass and have been demonstrated to efficiently produce ethanol and other products at high yields, while thriving under industrial conditions.
Competition
In the near-term, we expect to sell our MGT product to corn ethanol producers to lower their production costs. Although we do not believe that there is a product that functions in an identical manner to and competes directly with our MGT product, corn ethanol producers will use our product as a drop-in substitute for conventional yeast products. Therefore, our product will compete with conventional yeast products. While we expect to compete with some of the producers and marketers of conventional yeast products, we also plan to partner or collaborate with some of these companies to commercialize our MGT product. In addition to yeast producers, we will also compete with companies, such as Novozymes A/S and Genencor, that sell the enzyme that is replaced by our MGT yeast product. Many of these companies are substantially larger than us and may have substantially greater resources and a larger patent portfolio than we do, and these companies may reduce the prices of their enzymes in order to compete with our MGT product and retain market share. In addition, we can provide no assurance that these companies will not start developing products that compete with ours.
In addition, we intend to initially deploy our CBP technology to convert hardwood feedstocks into ethanol. As a result, we expect to compete with any company that produces cellulosic ethanol. While we utilize a biochemical process for the production of cellulosic ethanol, there are several competing technologies for the production of cellulosic ethanol, including a thermochemical process, and we can provide no assurance that these other technologies will not prove to be more effective or successful than ours. In the biochemical sphere, key competitors include Abengoa Bioenergy, BP, p.l.c., DuPont Danisco Cellulosic Ethanol L.L.C., which is a joint venture between Danisco A/S and E.I. Du Pont De Nemours and Company, and POET, LLC, all of which are developing biological approaches to break down biomass into end-products. More broadly, we expect that the cellulosic ethanol produced at our hardwood CBP facilities will compete with other cellulosic biofuels, advanced biofuels, and renewable fuels developed by established enterprises and new companies that seek to produce these renewable fuels to satisfy RFS2 mandates.
Research and Development
To date our research and development efforts have primarily focused on laboratory-scale development and pilot-scale demonstration of the biotechnology and process technology. Our research and development expenses were $24.3 million, $28.3 million and $26.5 million for the years ended December 31, 2008, 2009 and 2010, respectively, and $13.2 million for the six months ended June 30, 2011, and we anticipate that our research and
91
Table of Contents
development expense will increase for the foreseeable future as we adapt our CBP technology to convert new feedstocks, such as Brazilian bagasse, and produce new end-products, such as renewable chemicals.
Our Scientists and Engineers
Our research and development organization includes 52 scientists and engineers with extensive experience in microbial strain development, metabolic engineering, analytics, process development, process scale-up and process economic modeling. We also employ 16 operators and support staff skilled in the operation of our laboratories and pilot facility. Of the 68 members of the research and development organization, 31 hold advanced scientific or engineering degrees including 19 with PhD’s.
Our technical staff also includes the following key science officers, each of which play an active role in guiding the direction of our research and development program:
| • | Dr. Lee Lynd is our Chief Science Officer, a co-founder of Mascoma and a leading authority on CBP technology. Dr. Lynd is a recognized expert in biomass conversion, biotechnology and bioengineering and has extensive experience with our technology and the application of that technology in the renewable fuels and renewable chemicals sectors. Dr. Lynd is a Professor of Engineering at Dartmouth College’s Thayer School of Engineering, an Adjunct Professor of Biological Sciences at Dartmouth College, a Biomass Deconstruction Leader for DOE BioEnergy Science Center, a Professor Extraordinary of Microbiology at the University of Stellenbosch in South Africa and the Initiator and Steering Committee Coordinator of the Global Sustainable Bioenergy Project. |
| • | Dr. Charles Wyman is our Chief Process Development Officer, a co-founder of Mascoma and a recognized expert in biomass pretreatment. He is the Ford Motor Company Chair of Environmental Engineering and a Professor of Chemical and Environmental Engineering at the University of California, Riverside. |
| • | Dr. Michael Ladisch is our Chief Technology Officer and a recognized expert in the field of renewable fuels and cellulosic biofuels and a member of the National Academy of Engineering. Dr. Ladisch is project director of the DOE grant for the Kinross project and is providing his expertise in scale-up and process economics. He is also Distinguished Professor at Purdue University and Director of the Laboratory of Renewable Resources Engineering since 1999. |
Each of these key science officers have won the Charles D. Scott Award, which is presented to one distinguished individual each year at the Symposium on Biotechnology for Fuels and Chemicals for outstanding research contributions in biotechnology for the production of fuels and chemicals.
Our Research and Development Facilities
We currently have the following research and development facilities:
| • | Our approximately 33,000 square foot facility in Lebanon, New Hampshire includes laboratories and offices. At this facility, our team of scientists and engineers perform strain development, metabolic pathway engineering, small-scale fermentation and support analytical development and characterization needs. |
| • | Our approximately 54,700 square foot demonstration facility is located in Rome, New York. This facility has an approximately 200,000 gallon per year production capacity and is designed to evaluate new technologies and conduct large-scale process demonstration runs. We have conducted several complete process validation runs, taking raw materials from pretreatment through CBP and then producing ethanol in our demonstration scale distillation process. |
| • | Our facilities near Toronto, Canada include a 4,100 square foot pretreatment pilot plant that supports process development as well as pretreatment equipment sales activities, and 10,000 square feet of office space that we use to support our process engineering and project management activities. |
92
Table of Contents
Intellectual Property
Our success depends in large part upon our ability to obtain and maintain proprietary protection for our products and technologies, and to operate without infringing the proprietary rights of others. For more information, see the section entitled “Risk Factors–Risks Related to Our Intellectual Property.” Our policy is to protect our proprietary position by, among other methods, filing for patent applications on inventions that are important to the development and conduct of our business with the United States Patent and Trademark Office and foreign patent offices.
As of September 1, 2010, we owned or had licensed rights to approximately 75 distinct patent families in the United States, Canada and various other foreign jurisdictions. Our employees are named inventors on 55 of these patent families. More specifically, as of September 1, 2011, we owned approximately 42 pending United States patent applications (including 8 provisional applications), 5 issued foreign patents, 97 pending foreign applications, and 11 Patent Corporation Treaty, or PCT, applications eligible for nationalization. As of June 30, 2011, we had licensed rights to approximately 3 issued United States patents, 17 pending United States patent applications (including 3 provisional applications), 1 issued foreign patent, 34 pending foreign applications and 4 PCT applications eligible for nationalization. These patents and patent applications relate to equipment and processes for biomass conversion, as well as engineered organisms and methods of producing our products. We have exclusive licensing arrangements with Dartmouth College, Stellenbosch University in South Africa, and Purdue University which provide us rights to intellectual property in fields relating to ethanol production from biomass, yeast engineering and biomass conversion. Our owned and licensed intellectual property portfolio relates to cellulose conversion technologies, including in the fields of pretreatment, hydrolysis, genetic tools, metabolic pathway engineering, and processes for biomass conversion.
We intend to continue to file additional patent applications directed to our products and technologies with particular emphasis on protecting our core technologies. As is the case with all patent application filings, we do not know whether any of our pending patent applications will result in the issuance of patents or whether the examination process will require us to narrow our claims. Due to uncertainties inherent in prosecuting patent applications, sometimes patent applications are rejected and we may subsequently abandon them. We may also abandon applications when we determine that a product or method is no longer of interest. Although there can be no assurance that these pending patent applications, if pursued and granted, will provide us with protection, we are focused on maximizing the likelihood of acquiring strong patent protection. We also use other forms of protection (such as trademark and trade secret) to protect our intellectual property, particularly where we do not believe patent protection is appropriate or obtainable. We also protect our proprietary information by requiring our employees, consultants, contractors and other advisers to execute nondisclosure and assignment of invention agreements upon commencement of their respective employment or engagement. Agreements with our employees also prohibit them from disclosing to us or using the confidential information of third parties. In addition, we also require confidentiality or material transfer agreements from third parties that receive our confidential data or materials.
In July 2006, we entered into a license agreement with Dartmouth College that grants us a royalty-free, exclusive, worldwide license to Dartmouth’s patents, patent applications and know-how (including certain pre-existing patents and patent applications) in the field of production of ethanol and other commodity products from plant biomass and biologically-based waste streams. This agreement also provides us with a royalty-free, exclusive license to the results of sponsored research in the field. In connection with the license agreement, we agreed to reimburse Dartmouth for patent prosecution costs and pay certain annual license maintenance fees and granted Dartmouth College 400,000 shares of our common stock. Dartmouth College may put those shares to us at any time after July 10, 2011, unless we are a public company. Unless earlier terminated, the term of this agreement lasts until the expiration of the last to expire of the licensed patent rights.
In October 2006, we entered into a similar royalty bearing license agreement with Stellenbosch University that grants us an exclusive, worldwide license under certain patent rights and know-how related to the engineering of yeast to degrade and ferment cellulosic biomass. In connection with this agreement, we issued
93
Table of Contents
200,000 shares of our common stock to the university. Unless earlier terminated in accordance with the provisions of the agreement, it will remain in effect until the later of (i) ten years from the date of the agreement, or (ii) the expiration of the last to expire of the licensed patents.
Through our acquisition of Celsys Biofuels, Inc., or Celsys, we have a royalty-bearing license from Purdue Research Foundation, or PRF, to PRF’s rights in certain intellectual property, including two issued U.S. patents and several pending counterpart patent applications, relating to processes and systems for pretreatment of cellulosic biomass, and a non-exclusive, royalty-free license from PRF to use related technology. This license agreement was assigned from Celsys to us in July 2011. Unless otherwise terminated, the agreement will remain in force until (i) ten years from the date of first commercial sale of a licensed product, or (ii) the expiration date of the last to expire of the licensed patents, whichever is greater.
Facilities
We currently own or lease the following facilities:
| • | In Lebanon, New Hampshire we lease our corporate headquarters and primary executive offices, where we occupy approximately 33,000 square feet of office space. Our lease expires in August 2018. We have an option to extend this lease for five years. |
| • | In Rome, New York we own an approximately 200,000 gallon demonstration facility, where we occupy approximately 54,700 square feet of space on an 18.7 acre site. We acquired this property pursuant to a purchase of a leasehold interest from the Griffiss Local Development Corporation in April 30, 2008. The leasehold interest ends on July 30, 2028. |
| • | In Toronto, Ontario we lease two facilities including approximately 10,000 square feet of office space under a lease that expires in June 2013 and an approximately 4,100 square foot pilot plant under a lease that expires in November 2011. |
| • | In Woburn, Massachusetts we sub-lease approximately 15,000 square feet of office and laboratory space. This lease expires in July 2012 and we are not occupying any of this space at this time. |
| • | In Boston, Massachusetts we lease approximately 21,000 square feet under a lease that expires in December 2012. We currently have a subtenant who is subleasing the entire premises from us. |
We believe that these facilities are sufficient to meet our needs for the immediate future and that additional space can be leased to provide for any future growth.
Regulatory Matters
Regulatory Review of our MGT Products
Manufacture of ethanol from corn results in the production of both fuel ethanol and distillers products, such as dried distillers grains with solubles, or DDGS. Distillers grains are a high protein, high energy feedstuff that are used to meet the nutritional requirements of dairy and beef cattle, as well as swine and poultry. In 2010, U.S. ethanol producers generated more than 30 million tons of DDGS, which were distributed primarily in the United States. In the United States, the use of food products, including feed for animals, is under the authority of the U.S. Food and Drug Administration, or the FDA, and the FDA’s Center for Veterinary Medicine, or CVM, is responsible for the regulation of feed products.
The FDA carries out its responsibility for the regulation of animal feed in cooperation with state and local partners through a variety of mechanisms: cooperative agreements, contracts, grants, memoranda of understanding and partnerships. For instance, the FDA cooperates with the Association of American Feed Control Officials, or AAFCO, for the implementation of uniform policies for regulating the use of animal feed products. This includes the establishment of uniform feed ingredient definitions and proper labeling to assure the
94
Table of Contents
safe use of feeds. AAFCO is a voluntary organization comprised largely of regulatory officials who have responsibility for enforcing their state’s laws and regulations concerning the registration and safety of animal feeds and feed ingredients. Its membership is comprised of representatives from each state in the United States, as well as representatives from Puerto Rico, Costa Rica, Canada, the FDA and the U.S. Department of Agriculture. A basic goal of AAFCO is to provide the means for ensuring the development and implementation of equitable laws, regulations, standards, definitions, and enforcement policies for regulating animal feed. AAFCO has no enforcement authority.
Under a 2007 Memorandum of Understanding, the FDA formally recognized AAFCO’s list of approved feed ingredients and defined the FDA’s role in deciding on the suitability of feed ingredients offered for addition to the list. AAFCO uses a “New and Modified Feed Ingredient Definitions Process” to determine the suitability of feed ingredients and to establish standard ingredient names used on feed labels as required by state and federal law. The 2007 memorandum allows the FDA to recognize formally the AAFCO process and to have a clearly defined role in reviewing ingredients for the list. Under the memorandum, CVM assigns scientists to work with AAFCO in reviewing petitions for new feed ingredients or for modifications to existing ingredient definitions. In addition, before it adopts a new feed ingredient definition or amends an existing one, AAFCO will ask CVM for scientific review and a letter of concurrence. The memorandum also requires AAFCO to remove a definition from its published list of feed ingredients if the FDA provides convincing scientific evidence that the ingredient is no longer suitable for its intended purpose.
Certain by-products of the corn ethanol conversion process are used as animal feed. Our MGT products are genetically modified and are considered to be processing aids in the production of animal feed. As a result, our MGT products are subject to regulation by CVM and must subsequently be approved by AAFCO. We have submitted a request to AAFCO and CVM, requesting that our MGT 1.0 yeast product be added to AAFCO’s list of approved feed ingredients. The request, which addresses the safety, utility and labeling of the new ingredient, is under review at CVM at this time. Because the MGT yeast products are genetically modified organisms, or GMOs, the CVM review and approval process may require significant time and the outcome cannot be guaranteed. Approval by CVM does not guarantee approval by AAFCO.
Environmental and Other Regulatory Matters
We and our products and our collaborators’ planned commercial facilities are subject to various federal, state, local and foreign environmental laws and regulations. These laws and regulations govern, among other matters, emissions and discharges to the air, ground and water, the use, treatment, handling, manufacture, storage and disposal of hazardous and biological substances and genetically modified organisms, renewable fuel standards, and soil and groundwater contamination. Compliance with applicable environmental laws and regulations may be expensive and the failure to comply with past, present and future laws or regulations could result in, among other matters, the imposition of fines or other penalties, regulatory oversight costs, responsibility for third party property damage, product liability and personal injury claims, investigation and remediation costs, the suspension of production or a cessation of our operations. Environmental laws and regulations have become more stringent over time, and changes in these laws and regulations could require us and our partners to make significant additional expenditures. Additionally, we could be jointly and severally liable for environmental damage or contamination at our current or former facilities, including for historical contamination caused by former owners and operators of such facilities. We may also be held liable at third party sites where we have disposed, or arranged for disposal, of hazardous materials. Our demonstration facility in Rome, New York is located on a portion of the former Griffiss Air Force Base, which is listed on the National Priorities List under the federal Comprehensive Environmental Response, Compensation and Liability Act. Environmental investigations and remediation activities have been undertaken by the Air Force.
The other material laws, regulations and requirements applicable to our business and to our facilities in Rome, New York and Lebanon, New Hampshire and our planned hardwood CBP facilities include:
Clean Air Act Regulation. The operations of our facilities and our planned hardwood CBP facilities are subject to certain requirements of the U.S. Clean Air Act, or CAA, and similar state and local regulations and
95
Table of Contents
permitting requirements. These laws, regulations and permitting requirements may restrict emissions from these facilities or require controls or limitations on operations. In the United States, legislative and regulatory initiatives have been implemented or are underway to limit GHG emissions by certain facilities such as our planned hardwood CBP facilities. We believe that these planned hardwood CBP facilities will be major sources of GHGs under existing regulations, and will accordingly be required to meet permitting, reporting and other requirements after operations begin. Because regulation of GHG emissions is relatively new, further regulatory, legislative and judicial developments are likely to occur. Compliance with existing and new laws and regulations may result in increased capital expenditures, increased operating costs and additional operating restrictions for our business. In addition to the costs expected to be incurred to maintain compliance with these requirements, new or more stringent standards may limit our operating flexibility or require the installation of additional controls at the planned and future facilities.
Hazardous Substances and Wastes. Operations at our facilities in Rome, New York and Lebanon, New Hampshire generate, and our planned hardwood CBP facilities will generate, solid wastes, including hazardous wastes, that are subject to the requirements of the U.S. Resource Conservation and Recovery Act, or RCRA, and comparable state laws and regulations. These laws and regulations impose strict requirements on the generation, storage, treatment, transportation and disposal of hazardous wastes, and the facilities with which we are associated need to comply with approved methods for disposal of certain wastes.
Water Discharges. The U.S. Clean Water Act, or CWA, and analogous state laws impose restrictions regarding the discharge of pollutants into state and federal waters. Further, general permits issued under the federal National Pollutant Discharge Elimination System, or NPDES, program prohibit discharges into surface waters, ground waters, wells and publicly-owned treatment works, or POTWs, except in strict conformance with the permits. We anticipate that the process waste water from our planned hardwood CBP facilities will not be directly discharged into state or federal waters, but rather will be discharged to POTWs and will need to comply with the requirements of such POTWs. In addition, the CWA and analogous state laws require permits for discharge of stormwater runoff from certain types of facilities.
Construction Permits. Our planned hardwood CBP facilities are subject to sewer, electrical, storage and construction permitting requirements. As a condition to granting necessary permits, regulators could make demands that increase the costs of our construction and operations, in which case we and our partners could be forced to obtain additional debt or equity capital. Permit conditions could also limit the extent of operations at our planned facilities. We cannot assure you that we and our partners will be able to obtain and comply with all necessary permits to construct our planned hardwood CBP facilities. Failure to obtain and comply with all applicable permits could halt construction and could subject us to future claims and sanctions.
Safety. The hazards and risks associated with producing and transporting renewable fuels may result in personal injury claims or damage to property and third parties. While we and our collaborators will maintain insurance coverage against some, but not all, potential losses that may occur, losses could occur for uninsurable or uninsured risks or in amounts in excess of existing insurance coverage.
OSHA. We are subject to the requirements of the federal Occupational Safety and Health Act, or OSHA, and comparable state laws and regulations. These laws and regulations govern the protection of the health and safety of employees and require that we organize and disclose information about hazardous materials used or produced at our sites.
TSCA. We are subject to the requirements of the Toxic Substances Control Act, or TSCA, which regulates the use of chemicals and microorganisms. In particular, our fermentation process utilizes a GMO which, when used in an industrial process, is regulated as a new microorganism under TSCA. TSCA requires companies using microorganisms in industrial processes to comply with the EPA’s Microbial Commercial Activity Notice (MCAN) submission process. We believe our microorganisms qualify for an exemption from the MCAN process, and as such, we will need to follow certain standard notification, control and containment procedures at these facilities.
96
Table of Contents
Employees
As of June 30, 2011, we had 96 full-time employees. Of these, 80 were in the United States and 16 were in Canada. None of our employees is represented by a labor union or is covered by a collective bargaining agreement. We have never experienced any employment-related work stoppages and consider relations with our employees to be good.
Legal Proceedings
From time to time, we may be involved in litigation relating to claims arising out of operations. We are not currently involved in any material legal proceedings.
97
Table of Contents
Executive Officers, Key Science Officers and Directors
The following table sets forth certain information about our executive officers, key science officers and directors as of the date of this prospectus.
| Name |
Age | Position | ||||
| Executive Officers: |
||||||
| William J. Brady, Jr. |
50 | President, Chief Executive Officer and Director | ||||
| David A. Arkowitz |
49 | Chief Financial Officer, Treasurer and Secretary | ||||
| Stephen R. Kennedy |
54 | Executive Vice President, Research & Development | ||||
| Alan H. Belcher |
62 | Senior Vice President Operations | ||||
| Key Science Officers: |
||||||
| Michael R. Ladisch, Ph.D. |
61 | Chief Technology Officer | ||||
| Lee R. Lynd, Ph.D.(3) |
53 | Chief Science Officer and Director | ||||
| Charles E. Wyman, Ph.D. |
66 | Chief Development Officer | ||||
| Non-Employee Directors: |
||||||
| Bruce A. Jamerson(1)(2) |
60 | Director, Chairman of the Board | ||||
| James V. Matheson(1)(2)(3) |
46 | Director | ||||
| Hemant Taneja(1) |
36 | Director | ||||
| Jeremy N. Kendall(1)(3) |
71 | Director | ||||
| David L. Whikehart |
52 | Director | ||||
| (1) | Member of the compensation committee. |
| (2) | Member of the audit committee. |
| (3) | Member of the nominating and corporate governance committee. |
The following paragraphs provide information as of the date of this prospectus about our executive officers, key employees and directors. The information presented includes information about each of our director’s specific experience, qualifications, attributes and skills that led our board of directors to the conclusion that he should serve as a director.
Executive Officers
William J. Brady, Jr.
William J. Brady, Jr. has served as our President, Chief Executive Officer and a director since he joined our company in January 2010. Previously, Mr. Brady was Executive Vice President of Cabot Corporation, or Cabot, a specialty chemical company, from 2004 to 2009. Throughout his twenty-three year experience, Mr. Brady held numerous positions at Cabot in the United States and Japan, including General Manager of the Carbon Black business. Under his leadership, the business completed significant expansions in China and Brazil, and executed a major global initiative in energy efficiency. In addition, he led the commercialization of two start-up businesses at Cabot in ink jet colorants and elastomer composites. Mr. Brady currently serves on our board of directors and is Chairman of the Board of our affiliate, Frontier Renewable Resources, LLC. In addition, he is Chairman of the Washington D.C. based Advanced Ethanol Council, or AEC, which is working on the commercialization of advanced and cellulosic ethanol development by establishing public policies and expanding the market for ethanol. Mr. Brady is also a member of the Board of Trustees at the University of Scranton. Mr. Brady is a graduate of the University of Scranton with a B.S. in Chemistry and received his M.B.A. from Fairleigh Dickinson University. Mr. Brady’s senior management experience in leading significant business expansions and commercializing start-up businesses, involvement in the ethanol industry and understanding of our business and operations enable him to provide valuable insight and guidance to our board of directors.
98
Table of Contents
David A. Arkowitz
David A. Arkowitz has served as our Chief Financial Officer since joining our company in June 2011, and as our Treasurer and Secretary since July 2011. Prior to joining our company, Mr. Arkowitz served as Executive Vice President, Chief Financial Officer, Chief Business Officer and Treasurer at AMAG Pharmaceuticals, Inc., or AMAG, a public biopharmaceutical company, from 2007 to 2011. Prior to joining AMAG, Mr. Arkowitz served as Chief Financial Officer and Treasurer at Idenix Pharmaceuticals, Inc., or Idenix, a public biopharmaceutical company, from 2003 to 2007. Prior to his tenure at Idenix, Mr. Arkowitz was with Merck & Co. Inc., or Merck, a public pharmaceutical company, for over thirteen years, where he served as Vice President and Controller of the U.S. sales and marketing division from 2002 to 2003, as Controller of the global research and development division from 2000 to 2002, and as Vice President of Finance and Business Development of the Canadian subsidiary of Merck from 1997 to 2000. Mr. Arkowitz served on the board of directors and was the Chairman of the Audit Committee of Aegerion Pharmaceuticals, Inc., a pharmaceutical company, from 2007 to 2009, and served on the board of directors and was the Chairman of the Audit Committee of ImpactRx, Inc., a company that analyzes the impact of promotion on physicians’ prescribing behavior, from 2005 to 2009. Mr. Arkowitz holds a B.A. in Mathematics from Brandeis University and an M.B.A. from Columbia University.
Stephen R. Kennedy
Stephen R. Kennedy has served as our Executive Vice President, Research & Development since joining our company in May 2011. His most recent experience prior to joining our company was at the Massachusetts Institute of Technology in Cambridge, Massachusetts from October 2010 to May 2011, where he held appointments in the Department of Chemical Engineering as Interim Executive Director of the Novartis/MIT Center for Continuous Manufacturing and in the Department of Biology/Center for Biomedical Innovation, where his responsibilities included scale-up of fungible fuel technology. Mr. Kennedy spent 18 years in the biopharmaceutical industry at Genzyme Corporation, or Genzyme, where he held senior positions in process development from 1992 to 1998, led development of manufacturing operations in the United States, France and Belgium from 1998 to 2004, and served as Senior Vice-President, Biologics Technical Operations from 2004 until 2010. Prior to his tenure at Genzyme, Mr. Kennedy spent 12 years at Eastman Kodak’s BioProducts Division and Genencor International, or Genencor, in research, development and technology transfer. He played a key role in the successful start-up of Genencor, leading manufacturing process development activities in Finland from 1990 to 1992. Mr. Kennedy holds a B.S. in Chemical Engineering from the University of Michigan, an M.S. in Chemical Engineering from the University of Rochester and an M.B.A. from Boston University.
Alan H. Belcher
Alan H. Belcher has served as our Senior Vice President Operations since 2007. Prior to joining our company, from 2006 to 2007, Mr. Belcher served as Executive Vice President of Technology of Ethanex Energy Inc., a company developing manufacturing technology and operations in the ethanol industry. From 2001 to 2006, Mr. Belcher served as Vice President Project Development with Delta-T Corporation, an engineering and construction company servicing the ethanol alcohol markets. From 2000 to 2001, Mr. Belcher served as Vice President, Engineering of Iogen Corporation, a Canada-based firm specializing in cellulosic ethanol, and was responsible for leading the scale-up of Canada’s first biomass-to-ethanol process to a commercial scale. In addition, from 1987 to 1988, Mr. Belcher was responsible for business development activities at Iogen Corporation. Mr. Belcher began his career with the Corn Products Division of CPC International, a refiner and processor of corn-based food additives and sweeteners, and later joined Fluor Daniel, an engineering, procurement, construction and maintenance services company. Mr. Belcher received a B.S. in Chemical Engineering from the University of Waterloo in Waterloo, Ontario and an M.B.A. from the Tuck School of Business at Dartmouth College, and is a licensed professional engineer.
99
Table of Contents
Key Science Officers
Michael R. Ladisch, Ph.D.
Michael R. Ladisch, Ph.D. has served as our Chief Technology Officer, or CTO, since 2007. Dr. Ladisch is an internationally known leader in the field of renewable fuels and cellulosic biofuels. He has been active in biofuels research since 1976, including the scale-up and process economics of cellulose ethanol production. Dr. Ladisch is providing his expertise in scale-up and process economics. He is also Director of the Laboratory of Renewable Resources Engineering, which he has done since 1999, and holds the faculty status of Distinguished Professor at Purdue University. Dr. Ladisch earned his B.S. from Drexel University and M.S. and Ph.D. degrees from Purdue University, all in chemical engineering. He has extensive experience in bioscience and bioengineering, and has authored numerous journal papers, as well as the textbooks “Bioseparations Engineering: Principles, Practice and Economics” (Wiley, 2001), and “Modern Biotechnology” (Wiley, 2009). He previously chaired the National Research Council Committee on Bioprocess Engineering as well as the Committee on Opportunities in Biotechnology for Future Army Applications, and was a member of the Alternative Liquid Transportation Fuels Panel of the National Academies. He was named a Fellow of the American Chemical Society in 2011, and as one of the “One Hundred Chemical Engineers of the Modern Era” by the American Institute of Chemical Engineers (AIChE) in 2008. Dr. Ladisch was elected to the National Academy of Engineering in 1999.
Lee R. Lynd, Ph.D.
Lee R. Lynd, Ph.D. is a co-founder and a director and has served as our Chief Science Officer since 2005. Dr. Lynd leads an active academic group devoted to biomass conversion, encompassing biotechnology, process engineering and energy and environmental public policy issues at Dartmouth College. Dr. Lynd is a Professor of Engineering at Dartmouth College’s Thayer School of Engineering (2003 – present), an Adjunct Professor of Biological Sciences at Dartmouth College (2003 – present) and a Professor Extraordinary of Microbiology at the University of Stellenbosch in South Africa (2002 – present). He is a recipient of the National Science Foundation Presidential Young Investigator Award and a two-time recipient of the Charles A. Lindbergh Award for his efforts to promote balance between technological progress and preservation of the natural and human environments. He serves as an Associate Editor for Biotechnology and Bioengineering, a member of the Presidential Advisory Committee on Reducing Greenhouse Gas Emissions from Personal Vehicles, an Organizing Committee member for the Annual Symposium on Biotechnology for Fuels and Chemicals, a Manager of the Link Foundation Energy Fellowship Program and a Co-Leader of The Role of Biomass in America’s Energy Future project. Dr. Lynd received a B.S. in Biology from Bates College, an M.S. in Bacteriology from the University of Wisconsin, Madison, and M.S. and D.E. degrees in Engineering from Thayer School of Engineering at Dartmouth College. Dr. Lynd’s career in biomass conversion, biotechnology and bioengineering and understanding of and experience with the fundamental science behind our technology and the application of that technology in the renewable fuels and renewable chemicals sectors enable him to provide valuable insight and guidance to our board of directors.
Charles E. Wyman, Ph.D.
Charles E. Wyman, Ph.D. is a co-founder and has served as Chairman of our Scientific Advisory Board since 2006 and has been our Chief Development Officer since July 2011. Dr. Wyman has been a leading figure in the cellulosic ethanol field for over 25 years and is an expert in the area of biomass pretreatment. He is the Ford Motor Company Chair of Environmental Engineering and a Professor of Chemical and Environmental Engineering at the University of California, Riverside, where he has worked since 2005. Prior to that, from 1998 to 2005, he was the Paul E. and Joan H. Queneau Distinguished Professor in Environmental Engineering Design and acting Associate Dean at the Thayer School of Engineering at Dartmouth College, where he continues as an Adjunct Professor. He also has served as Director of Technology for BC International Corporation (now Celunol Corporation), Director of the Biotechnology Center for Fuels and Chemicals at the National Renewable Energy Laboratory in Golden, Colorado, Director of the NREL Biotechnology Research Branch, Manager of Process Development for Badger Engineers, Assistant Professor of Chemical Engineering at the University of New
100
Table of Contents
Hampshire and as a Senior Chemical Engineer with Monsanto Company. Dr. Wyman received a B.S. degree in Chemical Engineering from the University of Massachusetts, M.A. and Ph.D. degrees in Chemical Engineering from Princeton University, and an M.B.A. from the University of Denver.
Non-Employee Directors
Bruce A. Jamerson
Bruce A. Jamerson has served as Chairman of the Board since 2008 and as a director since 2007. He led our company as Chief Executive Officer from 2007 to 2009. Mr. Jamerson has served on the board of our affiliate Frontier Renewable Resources, LLC since its founding in 2008, including as its Chairman from 2008 to 2011. He is currently President of Conifer Investments, LLC, a strategic advisory firm which he founded in 1996. Since 2010, Mr. Jamerson was a board member of Osage Bio Energy in Richmond, Virginia, a producer of ethanol from winter barley, from 2010 to 2011. Mr. Jamerson was President and Director of VeraSun Energy Corporation, a renewable fuel producer, from 2003 to 2007. He also served as its Chief Financial Officer from 2003 until its initial public offering in 2006. From 1996 to 2003, Mr. Jamerson was President of Conifer Investments, LLC, then an investment banking firm and venture capital investor. He previously served as Vice President of U.S. Natural Resources, Inc., an affiliate of Kohlberg, Kravis, Roberts & Company. Prior to that, Mr. Jamerson worked in the investment banking department of The First Boston Corporation (now Credit Suisse) in New York primarily with natural resources companies, as well as in the ship financing department of Citibank in New York. Mr. Jamerson earned an M.S. degree from the Sloan School of Management at the Massachusetts Institute of Technology and a B.G.S. from the University of Michigan. Mr. Jamerson’s history of growing private renewable energy companies and extensive experience in, and relationships in the areas of, renewable fuels, energy, natural resources, investment banking, venture capital and private equity enable him to provide valuable insight and guidance to our board of directors.
James V. Matheson
James V. Matheson has served as a director since 2006. Mr. Matheson joined Flagship Ventures in 2000 and has been a General Partner since 2003, after previously serving for 15 years as an officer and fighter pilot in the United States Navy. His duties included being stationed on aircraft carriers flying combat missions in Iraq and Bosnia, as a TOPGUN Instructor, and as the Officer-in-Charge of the Navy’s West Coast adversary training and evaluation squadron. He retired in 2008 as a Commander in the U.S. Naval Reserves. Mr. Matheson serves on the boards of Flagship’s portfolio companies Advanced Electron Beams Inc., an electron beam technology company, Black Duck Software Inc., a software development company, Midori Renewables Inc., a cellulosic technology company, Novomer Inc., a sustainable chemistry company pioneering environmentally responsible polymers and chemical intermediaries, and Oasys Water Inc., a proprietary energy and resource recovery product company addressing water crisis, and is Chairman of the Board of Selventa (formerly Genstruct), a personalized healthcare service provider company, and Ze-gen, a renewable energy technology company. Since its inception in 2008, he has served as a member of the board of the directors of our affiliate, Frontier Renewable Resources, LLC. He was previously a director of e-Dialog (acquired by GSI Commerce), a marketing solutions company, Yantra Corporation (acquired by Sterling Commerce SBC), a supply chain applications company, and Flamenco Networks (acquired by SOA Software), a network infrastructure company. Mr. Matheson has also spearheaded Flagship Venture’s role as the U.S. Department of Energy’s Entrepreneur-in-Residence at the Lawrence Berkeley National Laboratory, and serves on the DOE/USDA Biomass technology Advisory Council. Mr. Matheson earned a B.S. with Honors in Computer Science and Systems Engineering from the United States Naval Academy and an M.B.A. from Harvard Business School. Mr. Matheson focuses on creating and funding new ventures in the sustainability, clean technology and special technologies (e.g. nano-technology, materials and technology systems) arenas. Mr. Matheson’s extensive experience as an outside director, in particular of energy companies, and involvement in the field of clean technology enable him to provide valuable insight and guidance to our board of directors.
101
Table of Contents
Hemant Taneja
Hemant Taneja has served as a director since 2006. Mr. Taneja invests in technology-intensive software, hardware and services in clean energy and internet communications as a Managing Director of General Catalyst Partners. In addition to serving on our board of directors, Mr. Taneja serves on the boards of ARC Energy, a lighting technology company, CLEAResult, an energy technology company, Humedica, a clinical information company, Hunch, a personalized recommendations company, Modular Wind, a wind turbine blade design company, Sand9, a nanoscale technology company, Stion, a solar photovoltaics company, and SynapDx, a blood-based diagnostic testing company for autism. Mr. Taneja is also the co-founder and Chairman of Sunborne Energy, a General Catalyst portfolio company that is focused on commercializing utility scale solar power in India. Previously, Mr. Taneja also served on the Board of SiteAdvisor, a General Catalyst investment that was acquired by McAfee (MFE) in 2006. Before joining General Catalyst in 2002, he was co-founder, Chairman and Chief Executive Officer of Isovia, a Boston-based mobile software and applications company that was acquired by JP Mobile (MOT) in 2001. Mr. Taneja is the co-founder & Chairman of the New England Clean Energy Council, a non-profit focused on advancing New England’s clean energy economy to global leadership. The U.S. Department of Energy presented the Energy Innovator Award to the Council in 2008 for its successful execution. Mr. Taneja is also on the board of directors of the Massachusetts Clean Energy Center, a quasi-public agency, The Indus Entrepreneurs (TiE), a non-profit organization focused on helping entrepreneurs, and the GreenLight Fund, which catalyzes the replication and growth of innovative non-profits. Mr. Taneja holds an M.S. in Operations Research, an M.Eng. in Electrical Engineering & Computer Science, a B.S. in Mathematics, a B.S. in Electrical Engineering & Computer Science, and a B.S. in Biology & Biomedical Engineering, all from the Massachusetts Institute of Technology. Mr. Taneja’s extensive senior management, directorship and financing experience with clean energy, alternative energy and technology companies enables him to provide valuable insight and guidance to our board of directors.
Jeremy N. Kendall
Jeremy N. Kendall has served as a director since September 2010. Mr. Kendall has served as a director of SunOpta Inc., a global company focused on natural, organic and specialty foods and natural health products, since September 1978. He became President, Chief Executive Officer and Chairman of the board of directors of SunOpta Inc., or SunOpta, in 1983 and retired as President and Chief Executive Officer in 2007. He remains as Chairman of the Board of SunOpta and its subsidiaries. Mr. Kendall is also the Chairman of Opta Minerals Inc., a custom process solutions and industrial minerals company listed on the Toronto Stock Exchange (1995 to present), which is approximately 66.4% owned by SunOpta, and Chairman of Easton Minerals, a mineral exploration company that is approximately 32% owned by SunOpta. Mr. Kendall was recently appointed to our board of directors following the sale of SunOpta BioProcess Inc. to our company in September 2010. SunOpta, Inc. has an 18% ownership position in our company. Mr. Kendall has served on the Board of Asia Bio-Chem Group Corp., a major starch manufacturer in China listed on the Toronto Stock Exchange, since 2008 and as Chairman of Jemtec Inc., a distributor of electronic home incarceration equipment listed on the TSX Venture Exchange, from 1991 to present. Mr. Kendall has served on the boards of directors of the following companies: BI Inc., a producer of electronic home incarceration equipment listed on Nasdaq (1981 to 2000); Brigdon Resources Inc., an oil and gas exploration company (1993 to 1999); Redaurum Ltd., a mineral exploration company listed on the Toronto Stock Exchange (1995 to 2002); and Wisper Inc., a provider of wireless electronic equipment and services listed on the TSX Venture Exchange (1995 to 2002). He is also a director of a number of private and charitable organizations. Mr. Kendall received a B.A. in Economics and an M.B.A., both from the University of Western Ontario. Mr. Kendall’s experience in the field of natural resources, as well as his outside board experience as director of several public natural resource and technology companies, enable him to provide valuable insight and guidance to our board of directors.
David L. Whikehart
David L. Whikehart has served as a director since January 2011. Mr. Whikehart was appointed Product Supply & Optimization Director of Marathon Petroleum Company LP, in March 2011. In this position, he is
102
Table of Contents
responsible for managing the light product supply chain as well as biofuels activity for Marathon Petroleum Company LP. Mr. Whikehart started his career with Marathon Oil Company in 1981 in the Refining organization, working in engineering, operations, and planning assignments. Mr. Whikehart moved from Refining to Supply, Distribution, and Planning in 2000, and was responsible for gasoline and distillate product supply scheduling as well as product distribution operations planning and optimization for Marathon Ashland Petroleum LLC. Mr. Whikehart was assigned to the position of Director of Downstream Business Development of Marathon Oil Company in 2008 where he was responsible for merger, acquisition and divestment activity for the Refining, Marketing and Transportation business. Prior to his current position, Mr. Whikehart was appointed Climate Change & Carbon Management Director for Marathon Petroleum Company LP in November 2009. In this position, he developed mitigation strategies to minimize the compliance costs of carbon emission constraint schemes. He was a delegate to the 2006 Oxford Energy Seminar at the Oxford Institute for Energy Studies. Mr. Whikehart graduated from Rose-Hulman Institute of Technology, Terre Haute, Indiana, in 1981 with a B.S. in Chemical Engineering. He later earned an M.B.A. from Bowling Green State University. Mr. Whikehart’s extensive experience in biofuel, energy and alternative energy operations enable him to provide valuable insight and guidance to our board of directors.
Composition of our Board of Directors
Our board of directors currently consists of seven members, all of whom were elected pursuant to the board composition provisions of our amended and restated voting agreement, as amended and currently in effect, which is filed as an exhibit to the registration statement of which this prospectus is a part. These board composition provisions will terminate immediately prior to the closing of this offering. Upon the termination of these provisions, there will be no further contractual obligations regarding the election of our directors. Our nominating committee and board of directors may therefore consider a broad range of factors relating to the qualifications and background of nominees, which may include diversity and is not limited to race, gender or national origin. We have no policy regarding board diversity. Our nominating committee’s and board of directors’ priority in selecting board members is identification of persons who will further the interests of our stockholders through his or her established record of professional accomplishment, the ability to contribute positively to the collaborative culture among board members, and professional and personal experiences and expertise relevant to our growth strategy.
Director Independence. We have not yet applied to have our shares listed on a stock exchange, but intend to do so promptly following the initial filing of this prospectus. Accordingly, our board of directors has not yet made a determination regarding the independence of our directors generally. Upon the closing of this offering, we expect that the composition and functioning of our board of directors and each of our committees will comply with all applicable requirements of the stock exchange upon which our shares are listed and the rules and regulations of the Securities and Exchange Commission. There are no family relationships among any of our directors or executive officers.
Staggered Board. Immediately prior to the closing of this offering, our board of directors will be divided into three staggered classes of directors of the same or nearly the same number and each will be assigned to one of the three classes. At each annual meeting of the stockholders, a class of directors will be elected for a three year term to succeed the directors of the same class whose terms are then expiring. The terms of the directors will expire upon the election and qualification of successor directors at the annual meeting of stockholders to be held during the years 2011 for Class I directors, 2012 for Class II directors and 2013 for Class III directors.
| • | Our Class I directors will be and ; |
| • | Our Class II directors will be , and ; and |
| • | Our Class III directors will be and . |
Our amended and restated certificate of incorporation and amended and restated by-laws, which will be effective upon the completion of this offering, provide that the number of our directors shall be fixed from time
103
Table of Contents
to time by a resolution of the majority of our board of directors. Any additional directorships resulting from an increase in the number of directors will be distributed among the three classes so that, as nearly as possible, each class shall consist of one third of the board of directors.
The division of our board of directors into three classes with staggered three-year terms may delay or prevent stockholder efforts to effect a change of our management or a change in control.
Board Leadership Structure and Board’s Role in Risk Oversight
The positions of chairman of the board and chief executive officer are separated. We believe that separating these positions allows our chief executive officer to focus on our day-to-day business, while allowing the chairman of the board to lead the board of directors in its fundamental role of providing advice to and independent oversight of management. Our board of directors recognizes the time, effort and energy that the chief executive officer is required to devote to his position in the current business environment, as well as the commitment required to serve as our chairman, particularly as the board of directors’ oversight responsibilities continue to grow. While our amended and restated by-laws, which will be effective upon the completion of this offering, and corporate governance guidelines do not require that our chairman and chief executive officer positions be separate, our board of directors believes that having separate positions is the appropriate leadership structure for us at this time and demonstrates our commitment to good corporate governance.
Risk is inherent with every business, and how well a business manages risk can ultimately determine its success. We face a number of risks, including risks relating to our operations, strategic direction and intellectual property as more fully discussed under “Risk Factors” in this prospectus. Management is responsible for the day-to-day management of risks we face, while our board of directors, as a whole and through its committees, has responsibility for the oversight of risk management. In its risk oversight role, our board of directors has the responsibility to satisfy itself that the risk management processes designed and implemented by management are adequate and functioning as designed.
The board of directors’ role in overseeing the management of our risks is conducted primarily through committees of the board of directors, as disclosed in the descriptions of each of the committees below and in the charters of each of the committees. The full board of directors (or the appropriate board committee in the case of risks that are under the purview of a particular committee) discusses with management our major risk exposures, their potential impact on our company, and the steps we take to manage them. When a board committee is responsible for evaluating and overseeing the management of a particular risk or risks, the chairman of the relevant committee reports on the discussion to the full board of directors during the committee reports portion of the next board meeting. This enables to the board of directors and its committees to coordinate the risk oversight role, particularly with respect to risk interrelationships.
Committees of Our Board of Directors
Our board of directors has established an audit committee, a compensation committee and a nominating and governance committee, each of which operates pursuant to a charter adopted by our board of directors. Upon the closing of this offering, the composition and functioning of all of our committees will comply with all applicable requirements of the Sarbanes-Oxley Act of 2002, the Securities and Exchange Commission rules and regulations and the Internal Revenue Service code and regulations.
Audit Committee. We have not yet applied to have our shares listed on a stock exchange, but intend to do so promptly following the initial filing of this prospectus. Accordingly, our board of directors has not yet made a determination regarding the independence of our directors generally. Upon the closing of this offering, we expect that the composition and functioning of our board of directors and each of our committees will comply with all applicable requirements of the stock exchange upon which our shares are listed and the rules and regulations of the Securities and Exchange Commission. Messrs. Jamerson, Taneja and Matheson currently serve on the audit
104
Table of Contents
committee, which is chaired by Mr. Jamerson. Our board of directors has designated Mr. Jamerson as an “audit committee financial expert,” as defined under the applicable rules of the Securities and Exchange Commission. The audit committee’s responsibilities include:
| • | overseeing our corporate accounting and financial reporting process, including the work of the independent auditors; |
| • | evaluating the independent auditor’s qualifications, performance and independence; |
| • | appointing, approving the compensation of, and assessing the independence of our independent registered public accounting firm; |
| • | approving auditing and permissible non-audit services, and the terms of such services, to be provided by our independent registered public accounting firm; |
| • | establishing or recommending policies to our board of directors with respect to the hiring of current or former employees of the independent auditors; |
| • | reviewing the internal audit plan with the independent registered public accounting firm and members of management responsible for preparing our financial statements; |
| • | reviewing and discussing with management and the independent registered public accounting firm our annual and quarterly financial statements and related disclosures as well as critical accounting policies and practices used by us; |
| • | reviewing the adequacy of our internal control over financial reporting; |
| • | establishing policies and procedures for the receipt and retention of accounting-related complaints and concerns; |
| • | recommending based upon the audit committee’s review and discussions with management and the independent registered public accounting firm whether our audited financial statements shall be included in our Annual Report on Form 10-K; |
| • | monitoring, reporting to and reviewing with the board of directors regarding the integrity of our financial statements and our compliance with legal and regulatory requirements as they relate to our financial statements and accounting matters; |
| • | preparing the audit committee report required by Securities and Exchange Commission rules to be included in our annual proxy statement; |
| • | reviewing all related person transactions for potential conflict of interest situations and approving all such transactions; |
| • | reviewing quarterly earnings releases; and |
| • | reviewing annually the audit committee charter and the audit committee’s performance. |
Compensation Committee. We have not yet applied to have our shares listed on a stock exchange, but intend to do so promptly following the initial filing of this prospectus. Accordingly, our board of directors has not yet made a determination regarding the independence of our directors generally. Upon the closing of this offering, we expect that the composition and functioning of our board of directors and each of our committees will comply with all applicable requirements of the stock exchange upon which our shares are listed, the rules and regulations of the Securities and Exchange Commission and the code and regulations of the Internal Revenue Service. Messrs. Taneja, Jamerson, Matheson and Kendall currently serve on the compensation committee, which is chaired by Mr. Taneja. The compensation committee’s responsibilities include:
| • | annually reviewing and approving corporate goals and objectives relevant to the compensation of our chief executive officer; |
| • | evaluating the performance of our chief executive officer in light of such corporate goals and objectives and determining the compensation of our chief executive officer; |
105
Table of Contents
| • | reviewing and approving the compensation of our other executive officers; |
| • | reviewing and establishing our overall management compensation, philosophy and policy; |
| • | overseeing and administering our compensation and similar plans; |
| • | reviewing and approving our policies and procedures for the grant of equity-based awards; |
| • | reviewing and making recommendations to the board of directors with respect to director compensation; |
| • | reviewing and discussing with management the compensation discussion and analysis to be included in our annual proxy statement or Annual Report on Form 10-K; |
| • | reviewing and discussing with the board of directors corporate succession plans for the chief executive officer and other key officers; |
| • | exercising sole authority to retain, terminate and approve terms of retention of any consulting firm or other outside advisor on compensation matters used by the compensation committee to assist in the evaluation of director or executive officer compensation; and |
| • | reviewing annually the compensation committee charter. |
Nominating and Corporate Governance Committee. We have not yet applied to have our shares listed on a stock exchange, but intend to do so promptly following the initial filing of this prospectus. Accordingly, our board of directors has not yet made a determination regarding the independence of our directors generally. Upon the closing of this offering, we expect that the composition and functioning of our board of directors and each of our committees will comply with all applicable requirements of the stock exchange upon which our shares are listed and the rules and regulations of the Securities and Exchange Commission. Dr. Lynd and Messrs. Matheson and Kendall currently serve on the nominating and corporate governance committee, which is chaired by Mr. Matheson. The nominating and corporate governance committee’s responsibilities include:
| • | developing and recommending to the board of directors criteria for board and committee membership; |
| • | establishing procedures for identifying and evaluating board of director candidates, including nominees recommended by stockholders; |
| • | identifying individuals qualified to become members of the board of directors; |
| • | recommending to the board of directors the persons to be nominated for election as directors and to each of the board’s committees; |
| • | developing and recommending to the board of directors a set of corporate governance guidelines; |
| • | overseeing the evaluation of the board of directors and management; and |
| • | reviewing annually the nominating and corporate governance committee charter and the nominating and corporate governance committee’s performance. |
Our board of directors may from time to time establish other committees.
Compensation Committee Interlocks and Insider Participation
None of the members of our compensation committee, with the exception of Mr. Jamerson, has at any time during the prior three years been one of our officers or employees. Mr. Jamerson was chief executive officer from 2007 to 2009, and currently serves on the compensation committee. None of our executive officers currently serves, or in the past fiscal year has served, as a member of the board of directors or compensation committee of any entity that has one or more executive officers serving on our board of directors or compensation committee.
106
Table of Contents
Corporate Governance
We have adopted a code of business conduct and ethics that applies to all of our employees, officers and directors, including those officers responsible for financial reporting. Upon the closing of this offering, our code of business conduct and ethics will be available on our website at www.mascoma.com. We intend to disclose any amendments to the code, or any waivers of its requirements, on our website.
107
Table of Contents
EXECUTIVE AND DIRECTOR COMPENSATION
Compensation Discussion and Analysis
This section discusses our executive compensation policies and arrangements as they relate to our named executive officers who are listed in the compensation tables set forth below. The following discussion should be read together with the compensation tables and related disclosure set forth below.
Named Executive Officers
This compensation discussion and analysis provides information as of December 31, 2010 about the material elements of compensation that were paid, awarded to or earned by our “named executive officers,” as determined in accordance with applicable SEC rules. Our named executive officers for the fiscal year ending December 31, 2010 were:
| • | William J. Brady, our Chief Executive Officer, or CEO; |
| • | Keith Pattison, our Vice President, Finance; |
| • | Alan Belcher, our Senior Vice President, Operations; |
| • | Murray J. Burke, the President of Mascoma Canada, one of our subsidiaries; |
| • | Arthur McEvily, Ph.D., our Vice President, Corporate Development; and |
| • | James H. Flatt, Ph.D., our former Executive Vice President, Research and Development and Acting President from September 8, 2009 to January 6, 2010. |
Compensation Philosophy and Objective
Our compensation philosophy is one that rewards performance and value creation, and is focused on both individual and company performance. Our compensation program for our named executive officers is designed to achieve the following objectives:
| • | attract, engage and retain individuals of superior ability, experience and managerial talent, enabling us to be an employer of choice in our highly competitive and dynamic industry; |
| • | motivate and reward executives whose knowledge, skills and performance ensure our continued success; |
| • | encourage and inspire our executives to achieve key corporate performance objectives by linking base salary increases and incentive award opportunities to the achievement of individual and company short- and long-term goals; and |
| • | align the interests of our executives and stockholders by motivating executives to increase stockholder value by providing a significant portion of total compensation opportunities for our executive officers in the form of direct ownership in our company through stock options. |
We believe that our executive compensation program provides the proper incentives for high performance by linking compensation to the success of the company. We periodically review what we believe are best practices with respect to compensation and benefits, and update executive compensation market data. We believe that market competitive compensation and internal pay equity are important factors in determining executive compensation. As we transition to a public company, we expect that the specific direction, emphasis and components of our executive compensation will continue to evolve.
Compensation Program
We target our executives’ total compensation levels to be competitive with the market. In addition, as the executive salary grade level and overall responsibility increases, the level of annual cash incentive and
108
Table of Contents
equity-based compensation as a percentage of total direct compensation increases. This approach allows us to attract, retain, and continue to motivate executives who have the appropriate experience and skill sets to achieve our short- and long-term company objectives. We intend to continue to evolve a performance driven compensation system that focuses on value creation.
Our approach to compensation is, in part, based on the company’s stage of development. Prior to this offering, we were a privately held company. In determining executive compensation, we informally considered a wide variety of factors, including the competitive market for corresponding positions within companies of similar size and stage of development operating in the biotechnology, clean technology and life science industries. These executive compensation decisions were based on the knowledge and experience of the members of our compensation committee and board of directors with other companies, and consultations with our CEO and human resources staff and their personal knowledge, such as from prior experience or contacts with other professionals in the industry. We also consider the results of the annual Radford Global Life Sciences Survey, or the Radford Survey, which provides total compensation and practices data for 480 multinational life sciences companies in determining executive compensation. In 2008, we engaged DolmatConnell & Partners, or DolmatConnell, an independent executive compensation consulting firm, to work with the compensation committee to complete a competitive analysis of our executive compensation program, including the long-term incentive plan. The salaries of our named executive officers were found to be competitively positioned at the 75th percentile for base salaries and actual total cash compensation for similarly-situated executives at comparable pre-IPO companies. The total equity ownership of our named executive officers at that time was below the 50th percentile of similarly-situated executives at comparable private companies. In December 2008, the compensation committee granted stock options to these executives to provide more competitive long-term incentives.
In January 2011, the compensation committee engaged DolmatConnell again to update the competitive analysis of our executive compensation program, identifying a peer group of 17 public companies. Because there were few companies that had similar products or services to those we provide, DolmatConnell expanded their analysis to look for firms in each of the renewable energy, biotechnology and pharmaceutical, agriculture, technical and scientific research services, basic and intermediate chemical and petrochemical manufacturing, and alternative energy industries. Firms in our peer group have annual revenues of up to $300 million and market capitalization ranging from $250 million to $1.6 billion. We considered the companies within this peer group to be representative of our competitors for executive talent. Geography was not taken into consideration because we viewed the market for our executive talent as being national.
| • Amyris, Inc. |
• Verenium Corp. | |
| • Biofuel Energy Corp. |
• Clinical Data, Inc. | |
| • Codexis, Inc. |
• Halozyme Therapeutics, Inc. | |
| • Martek Biosicences Corp. |
• Idenix Pharmaceuticals, Inc. | |
| • Metabolix, Inc. |
• ImmunoGen, Inc. | |
| • MGP Ingredients, Inc. |
• Micromet, Inc. | |
| • Pacific Ethanol, Inc. |
• SIGA Technologies, Inc. | |
| • Rentech, Inc. |
• VIVUS, Inc. | |
| • Syntroleum Corp. |
||
Based on a review of the peer group’s executive compensation programs for the year ended December 31, 2010, DolmatConnell determined that our executives’ target total cash compensation was generally positioned between the 25th percentile and the 50th percentile of similarly-situated executives in our peer group, and that our equity compensation awards were positioned on average between the 25th and 50th percentiles of comparable privately held companies and at the 50th percentile of similarly-situated executives in our peer group. We consulted with DolmatConnell when recommending compensation packages for David A. Arkowitz,
109
Table of Contents
our new Chief Financial Officer, and Stephen R. Kennedy, our new Executive Vice President, Research and Development, who were both hired in 2011, and will continue to consult with the firm or another independent compensation consultant to ensure our executive compensation is fair and competitive.
In making compensation decisions with respect to our executive officers, we take into account numerous factors to the extent deemed relevant by our compensation committee, including the following:
| • | our overall performance and financial conditions; |
| • | roles and responsibilities of the position; |
| • | demand for the particular skill sets we need within the marketplace; |
| • | individual’s background and relevant qualifications and level of expertise of the executive officer, including training and prior relevant work experience; |
| • | executive officer’s past performance; |
| • | performance goals and other expectations for the position and the individual; |
| • | executive officer’s anticipated future impact on our success; |
| • | comparison to our other executives having similar levels of expertise and experience; |
| • | compensation provided for similar positions by similar companies; and |
| • | compensation trends and competitive conditions in the marketplace. |
Elements of Compensation
The main elements of our compensation program are:
| • | base salary; |
| • | cash bonus; |
| • | long-term equity incentives; |
| • | benefits; and |
| • | severance agreements. |
We combine short-term compensation components (such as base salaries and annual cash bonuses) and long-term compensation components (such as equity incentive awards) to provide an overall compensation structure that is designed to both attract and retain key executives as well as provide incentive for the achievement of short- and long-term company objectives.
Each of the elements of our compensation program is discussed in more detail below. While we have identified particular objectives that each element of our compensation program addresses, our compensation program is designed to be flexible with each element and complementary to all of the elements, and so that each of the elements collectively addresses all of the objectives described above.
Base Salary
We want to provide our executives with a fixed level of cash compensation in the form of base salary that is consistent with the individual’s skill level, experience, knowledge, competencies, length of service with our company and the level of responsibility and complexity of their position. This base salary should reflect the overall sustained performance and contributions, while providing a secure base of compensation that is competitive with the marketplace. We believe that competitive base salaries can motivate and reward executives for their overall performance. Our base salaries are positioned, on average, at the market 50th percentile of
110
Table of Contents
compensation for similarly-situated executives at comparable public companies and above the 75th percentile of compensation for individuals holding comparable positions at comparable private companies. We use base salary to motivate and reward our key executives on a constant basis, in harmony with our general compensation philosophy focusing on recognizing and rewarding performance. For newly hired executives, the compensation committee considers the base salary of the individual and his or her prior employment and any unique personal circumstances that motivated the executive to leave the prior position and join us. Once base pay levels are initially determined, increases in base pay may be made as appropriate to recognize specific performance achievements or significant increases in responsibilities. Generally, we expect the base salaries of our named executive officers to increase in-line with any median salary increases to the competitive market rates or increases in responsibilities. Actual base salaries may differ from the competitive market median target as a result of various factors including the executives’ past individual performance, anticipated future impact on our success, performance goals and other expectations for the individual, our demand for a particular skill set, our performance, internal pay equity among our executives, the degree of difficulty in replacing the individual and our overall performance and financial conditions. The base salaries of our named executive officers are reviewed periodically by the compensation committee.
In 2010, in light of then current economic conditions, our board of directors determined to freeze our named executive officers’ salaries at their 2009 levels. The salary freeze was implemented in light of then-current economic conditions, similar salary freezes taking place at other similar companies and in order to preserve our cash reserves in the face of uncertainty in the financial and credit markets. We have no employment agreements in place with our named executive officers that provide for automatic or scheduled increases in base salaries. Base salaries for our named executive officers, as well as the other elements of compensation, are evaluated on a periodic basis.
The following table shows the annual base salaries for named executive officers for fiscal year 2010.
| 2010 Annual Base Salary | ||
| William J. Brady(1) |
$340,000 | |
| Keith Pattison |
$180,000 | |
| Alan Belcher |
$255,139 | |
| Murray J. Burke(2) |
$325,397 | |
| Arthur McEvily, Ph.D.(3) |
$265,000 | |
| James H. Flatt, Ph.D.(4) |
$276,410 |
| (1) | Mr. Brady became our CEO on January 6, 2010 and, as a result, only received a proportionate amount of his 2010 annual base salary. |
| (2) | Mr. Burke became the President of Mascoma Canada on September 1, 2010 and, as a result, only received a proportionate amount of his 2010 annual base salary. Mr. Burke’s actual base salary is 328,000 Canadian Dollars, which was converted into U.S. dollars using an exchange rate of 1.008 as of December 31, 2010. |
| (3) | Dr. McEvily became our Vice President, Corporate Development on September 1, 2010 and, as a result, only received a proportionate amount of his 2010 annual base salary. |
| (4) | Dr. Flatt left his position as our Executive Vice President, Research and Development on May 18, 2010 and, as a result, only received a proportionate amount of the identified annual base salary in 2010. |
Cash Bonus
We have an annual cash bonus plan under which cash bonuses may be paid to each of our employees, including our named executive officers, shortly after the end of each calendar year. The cash bonus is a mechanism for our board of directors to use to motivate our executives to achieve and reward them for achieving annual corporate and individual goals while also maintaining a competitive market position with regard to overall compensation. Our cash bonus awards are not formulaic. Instead, it is based on a subjective analysis that includes an assessment of our accomplishments, performance and achievements as measured by our compensation committee against our company and individual objectives.
111
Table of Contents
We believe that a meaningful portion of total compensation should be variable, either through annual cash bonuses or long-term incentives, which we believe helps to align our executives’ interests with the interests of stockholders and incentivizes our executives to drive profitable growth of our business. Historically, cash bonuses and equity grants were awarded solely at the discretion of our board of directors based on a combination of achievement of company objectives and level of individual performance as well as our overall financial condition. We expect to continue this practice with respect to our executives’ bonus opportunities to foster a culture of individual high performance with a focus on and awareness of the impact on overall company success. We have no employment agreements in place that provide for guaranteed cash bonuses. However, our employment offers and/or agreements do provide for discretionary cash bonuses expressed as a percentage of the executive’s base salary. The following named executive officers had the annual cash incentive payout targets set forth below in their employment offers and/or employment agreements. Such annual cash incentive targets were applicable with respect to the 2010 fiscal year and remain applicable with respect to 2011 as well:
| Annual Cash Incentive Target as | ||
| William J. Brady |
50% | |
| Keith Pattison |
25% | |
| Alan Belcher |
25% | |
| Murray J. Burke |
35% | |
| Arthur McEvily, Ph.D. |
30% |
Annual cash incentives are determined by the compensation committee based on their assessment of the performance of the executive and that of the company. The company performance is evaluated by our board of directors and the CEO at the completion of each year, when they review the company’s performance in achieving the goals established at the beginning of the year. The individual performance component of the bonus is measured by an assessment of the overall performance of each of our executives by our CEO, or in the case of our CEO’s performance, our board. The evaluation by the CEO takes into account the executive’s position within the company and the company objectives over which that executive has control. In setting the target bonus percentages for our named executive officers, our CEO, or in the case of our CEO’s target, our board also considered the target bonus percentages and individual performance factors of executives with similar levels of responsibility within the company to ensure parity between executives at similar position levels. Our compensation philosophy with respect to annual cash bonuses is consistent with our overall compensation program philosophy. The annual cash bonus ties individual compensation to both company and individual performance while maintaining market-competitive compensation. Performance, as measured against individual and corporate goals, directly affects the level of bonus payment. Should the compensation committee determine that the executive, or the company, has exceeded its goals, it will consider additional payments at its discretion. Given the economic environment, and our financial situation, our board of directors decided not to pay any cash bonuses in either 2009 or 2010. While we met a majority of our company objectives for 2010, our board of directors decided to forego cash bonus payments to all employees, including named executive officers, in order to preserve cash.
Long-Term Equity Incentives
We believe in an ownership culture that promotes and rewards long-term growth and performance. We use long-term equity grants in the form of stock options to align the interests of our executives with those of our stockholders and to promote a longer term performance perspective and progress toward achieving our long-term strategy. Total equity ownership for our named executive officers is reviewed at least annually and the data from this review is used by our compensation committee as part of the evaluation in determining the appropriate amount, if any, of additional grants of equity-based awards. Our executives’ total compensation may vary significantly year to year based on company and individual performance. Further, the value of equity awards made to our senior executives will vary based on our stock price performance.
112
Table of Contents
Initial Equity Award (New Hire Equity Award)
Typically, we make an initial equity award of stock options to employees in connection with their commencement of employment with us, and periodic grants at other times as approved by our compensation committee and board of directors. With respect to such equity awards, our practice has been to have our compensation committee recommend, and our board of directors approve, any equity grant that was made to employees including those made to our executive officers. These grants have had an exercise price that has been at least equal to the fair market value of our common stock on the date of grant, as determined by our board of directors. Grants of options in recent years have typically been subject to a five-year vesting schedule with 20% of the grant vesting upon the first anniversary of the vesting commencement date and the remainder of the shares vesting at a rate of 1/60th of the total shares underlying the option each month after the first anniversary of the vesting commencement date, subject to the continued employment of the executive. Periodically, grants of options are subject to a milestone-based vesting as determined and approved by our compensation committee and our board of directors. The milestones on which a milestone-based vesting would be based are determined by our board of directors and are related to our corporate goals or objectives for a particular year. Vesting commencement dates generally correlate to the date of hire, date of promotion or date of grant.
The size of the initial stock option award is determined based on the executive’s position with us and takes into account the executive’s base salary and other compensation as well as an analysis of the grant and compensation practices of the companies in the peer group identified by DolmatConnell and the Radford Survey. The initial stock option awards are intended to provide the executive with an incentive to build value in the organization over an extended period of time while remaining consistent with our overall compensation philosophy.
The equity grants that each of our named executive officers received at the time of hire is listed below with the exercise price and the vesting schedule. The exercise price has been the per share fair market value of our common stock as of the date of grant, as determined by our board of directors.
| Number of Shares of Common Stock Underlying Options Granted in New Hire Equity Award |
Exercise Price | Vesting Schedule | ||||
| William J. Brady |
2,010,019 | $2.95 | Five-year vesting; 20% vesting on January 26, 2011 and remainder vesting on a monthly basis over the next four years | |||
| Keith Pattison |
150,000 | $2.86 | Five-year vesting; 20% vested on October 12, 2010 and remainder vesting on a monthly basis over the next four years | |||
| Alan Belcher |
300,000 | $2.94 | Five-year vesting; 20% vested on December 3, 2009 and remainder vesting on a monthly basis over the next four years | |||
| Murray J. Burke |
670,000 | $1.97 | Accelerated vesting; 40% vested on grant date, October 15, 2010, and remainder vesting on a monthly basis over the next three years | |||
| Arthur McEvily, Ph.D. |
250,000 | $1.97 | Accelerated vesting; 40% vested on grant date, October 15, 2010, and remainder vesting on a monthly basis over the next three years | |||
| James H. Flatt, Ph.D. |
400,000 | $1.31 | Five-year vesting; 20% vested on June 15, 2008 and remainder vesting on a monthly basis over the next four years |
113
Table of Contents
Periodic Equity Incentive Awards
Our employees, including executive officers, may receive periodic equity incentive awards at the discretion of our compensation committee and the board of directors. Similar to the initial stock option grants, these grants are intended to continue to provide the executive with an incentive to build value in the organization over an extended period of time, which is consistent with our compensation philosophy. We have no employment agreements in place that provide for automatic or scheduled periodic option grants.
Our compensation committee considers a number of factors in determining the amount of periodic equity incentive awards, if any, granted to our executives including:
| • | competitive guidelines as determined by analysis of data provided by our compensation consultant of peer companies of percentage ownership for the different levels of executive officers within an organization; |
| • | internal equity among executives; |
| • | the number of shares subject to outstanding options, both vested and unvested, held by our executives; |
| • | the vesting schedules of the unvested stock options held by our executives; |
| • | whether each executive officer’s equity holdings provide adequate incentive and retention value; and |
| • | long-term value to the company, which is evaluated in discussion among senior leadership of the company, assessing the individual’s skills and talents and the company’s long term benefit from these. |
In January 2011, our board of directors approved the following executives receiving stock option grants to purchase the following number of shares of common stock as noted, each with an exercise price of $1.97: Mr. Brady (1,450,000), Mr. Pattison (70,000) and Mr. Belcher (80,000). As with the previous periodic equity grants, the compensation committee’s intention when awarding theses options was to continue to incentivize our executive officers over time. The size of the grant was determined through an analysis of the named executive officer’s role and responsibilities, the current total equity participation, and the competitive market intelligence derived from experience or contacts of the participants in the compensation decision making process gathered on what the appropriate level of ownership was at comparable late-stage pre-IPO companies. These option grants are one mechanism to acknowledge and reward performance during the years ending December 31, 2011 and 2012, respectively. The vesting schedule for 50% of these options is time based, with a five-year vesting schedule. The vesting schedule for the remaining 50% of these options is tied to achievement of company objectives for the years ending December 31, 2011 and 2012, respectively, as determined by our board of directors. The board of directors has the authority to decide whether or not these objectives will have been met.
As part of his employment offer, in the board’s discretion, Mr. Brady is also eligible to be awarded additional options to purchase up to 223,335 shares of common stock in each of 2010, 2011 and 2012, each at a purchase price equal to the fair market value as determined by our board of directors, as of the date of the award. These potential discretionary future option grants will be 100% vested on the date of grant. These awards shall be made in the sole discretion of the board.
Benefits
We provide the following benefits to our named executive officers who are active employees of the company on the same basis provided to all of our employees:
| • | Health, dental, and vision insurance; |
| • | Life insurance; |
| • | Short- and long-term disability insurance, accidental death and dismemberment insurance; |
| • | 401(k) plan; and |
| • | Medical and dependent care flexible spending accounts. |
114
Table of Contents
We maintain a 401(k) plan in which substantially all of our U.S. employees are entitled to participate. Employees contribute their own funds, as pre-tax salary deductions. Our Canadian employees have an opportunity to participate in a Registered Retirement Savings Plan, or RRSP. Contributions can be made up to plan limits subject to government limitations. The plan permits us to make matching contributions should we so choose; to date we have not made matching contributions although we may choose to do so in the future. We provide health care, dental, vision, life, and disability benefits to all full-time employees including our executive officers. We also have a flexible spending health care and flexible spending dependent care plans under which employees can set aside pre-tax funds to pay for qualified health care expenses and qualified dependent expenses not reimbursed by insurance. These benefits are available to all employees, subject to applicable laws and plan guidelines. As part of his employment agreement entered into on August 31, 2010, Mr. Burke is eligible to receive a company match on his RRSP for up to four years from the date of the employment agreement matching up to a maximum of 11,000 Canadian Dollars per year. Mr. Burke has not made any contributions to his RRSP and so we have not had to make any matching contributions.
We provided housing allowances for some named executive officers as described below in connection with the relocation of our corporate offices in 2009, pursuant to which certain employees were provided either a lump sum payment to assist with the relocation or a monthly housing allowance, the amount of which under either scenario varied depending on the individual’s responsibilities and position. Mr. Brady’s housing allowance was separately negotiated in connection with his employment agreement. These housing allowances were subject to continued employment with the company, and were treated as taxable income reportable on a Form W-2.
| 2010 Housing Allowance | ||
| William J. Brady |
$3,000 gross per month for each month in 2010 | |
| Alan Belcher |
$2,297 average gross per month for each month through September 2010 | |
| James H. Flatt, Ph.D. |
$2,000 gross per month for each month through May 2010 |
We believe these benefits are consistent with companies with which we compete for employees.
Impact of Tax and Accounting Considerations
In determining which elements of compensation are to be paid, and how they are weighted, we also take into account whether a particular form of compensation will be deductible under Section 162(m) of the Internal Revenue Code of 1986, as amended. Section 162(m) generally limits the deductibility of compensation paid to our named executive officers to $1 million during any fiscal year unless such compensation is “performance-based” under Section 162(m). However, under a Section 162(m) transition rule for compensation plans or agreements of corporations which are privately held and which become publicly held in an initial public offering, compensation paid under a plan or agreement that existed prior to the initial public offering will not be subject to Section 162(m) until the earlier of (i) the expiration of the plan or agreement; (ii) a material modification of the plan or agreement; (iii) the issuance of all employer stock and other compensation that has been allocated under the plan; or (iv) the first meeting of stockholders at which directors are to be elected that occurs after the close of the third calendar year following the year of the initial public offering.
Our compensation program is intended to maximize the deductibility of the compensation paid to our named executive officers to the extent that we determine it is in our best interests. Consequently, we may rely on the exemption from Section 162(m) afforded to us by the transition rule described above for compensation paid pursuant to our pre-existing plans.
We follow Financial Accounting Standard Board Accounting Standards Codification Topic 718, or ASC Topic 718, for our stock-based compensation awards. ASC Topic 718 requires companies to measure the compensation expense for all share-based payment awards made to employees and directors, including stock
115
Table of Contents
options, based on the grant date “fair value” of these awards. This calculation is performed for accounting purposes and reported in the compensation tables below, even though our executive officers may never realize any value from their awards. ASC Topic 718 also requires companies to recognize the compensation cost of their stock-based compensation awards in their income statements over the period that an executive officer is required to render service in exchange for the option or other award. After the completion of this offering, the compensation committee may consider the impact of ASC Topic 718 in connection with making equity-based awards.
Risk Management Practices
When determining our compensation policies and practices, our compensation committee considered various matters relative to the development of a reasonable and prudent compensation program, including whether the policies and practices were reasonably likely to have a material adverse effect on us. We believe that the mix and design of our executive compensation plans and policies do not encourage management to assume excessive risks and are not reasonably likely to have a material adverse effect on us for the following reasons: we offer an appropriate balance of short- and long-term incentives and fixed and variable amounts; our variable compensation is based on a balanced mix of criteria; and our compensation committee has the authority to adjust variable compensation as appropriate.
Summary Compensation Table
The following table sets forth all of the compensation awarded to, earned by, or paid to our named executive officers for the year ended December 31, 2010 as determined in accordance with applicable SEC rules. The officers listed in the table below are referred to in this prospectus as the “named executive officers.”
| Year | Salary($) | Option Awards($)(1) |
All Other Compensation($) |
Total($) | ||||||||||||||||
| William J. Brady CEO |
2010 | 337,361 | (2) | 4,671,697 | 36,498 | (3) | 5,045,556 | |||||||||||||
| Keith Pattison Vice President, Finance |
2010 | 180,000 | — | — | 180,000 | |||||||||||||||
| Alan Belcher Senior Vice President, Operations |
2010 | 255,139 | — | 22,498 | (4) | 277,637 | ||||||||||||||
| Murray J. Burke President, Mascoma Canada |
2010 | 108,466 | (5) | 980,512 | — | 1,088,978 | ||||||||||||||
| Arthur McEvily, Ph.D. Vice President |
2010 | 89,692 | (6) | 365,863 | — | 455,555 | ||||||||||||||
| James H. Flatt, Ph.D. Former Acting President and Former Executive Vice President, Research and Development |
2010 | 111,716 | (7) | 8,520 | (8) | 120,236 | ||||||||||||||
| (1) | The dollar amounts in this column represent the grant date fair value for stock awards and option awards granted in 2010. These amounts have been calculated in accordance with FASB ASC Topic 718, using the Black-Scholes option-pricing model for option awards. Pursuant to SEC rules, the amounts shown exclude the impact of estimated forfeitures related to service-based vesting conditions. For a discussion of valuation assumptions, see note 14 to our consolidated financial statements included elsewhere in this prospectus. |
| (2) | Mr. Brady joined us on January 6, 2010. The salary reflected for Mr. Brady represents the actual salary earned from employment with us in 2010, which is based on an annual base salary of $340,000. |
| (3) | Mr. Brady’s other compensation includes $36,000 for living expenses as described in his December 23, 2009 employment agreement and $498 for payments made by us for life insurance premiums. |
| (4) | Mr. Belcher’s other compensation includes $20,670 for housing through October 2010 pursuant to his April 7, 2009 offer to transfer employment to location as described above under “—Employment Offers and Employment Agreements” and $1,828 for payments made by us for life insurance premiums. |
116
Table of Contents
| (5) | Mr. Burke joined us on September 1, 2010. The salary reflected for Mr. Burke represents the actual salary earned from employment with us in 2010, which is based on an annual base salary of 328,000 Canadian Dollars. The exchange rate we used to convert the salary into US$ at the end of 2010 was 1.008. |
| (6) | Dr. McEvily joined us on September 1, 2010. The salary reflected for Dr. McEvily represents the actual salary earned from employment with us in 2010, which is based on an annual base salary of $265,000. |
| (7) | Dr. Flatt served as our Acting President from September 8, 2009 to January 6, 2010. He left his position as our Senior Vice President, Research and Development on May 18, 2010. The salary reflected for Dr. Flatt represents the actual salary earned from employment with us in 2010, which is based on an annual base salary of $299,444. |
| (8) | Dr. Flatt’s other compensation includes $8,308 for housing allowance as described above under “—Employment Offers and Employment Agreements,” and $212 for life insurance premiums. |
Grants of Plan-based Awards in Fiscal 2010
The following table sets forth certain information regarding grants of plan-based awards to the named executive officers during the year ended December 31, 2010.
| Grant Date | Estimated Future Payouts Under Non-Equity Incentive Plan Awards |
All Other Option Awards: Number of Securities Underlying Options (#) |
Exercise Price or Base Price of Option Awards ($/Share) |
Grant Date Fair Value of Stock and Option Awards ($) |
||||||||||||||||
| Target ($)(1) | ||||||||||||||||||||
| William J. Brady |
1/26/2010 | — | 2,010,019 | 2.95 | 4,671,697 | |||||||||||||||
| — | 170,000 | — | — | — | ||||||||||||||||
| Keith Pattison |
— | 45,000 | — | — | — | |||||||||||||||
| Alan Belcher |
— | 63,785 | — | — | — | |||||||||||||||
| Murray J. Burke |
10/15/2010 | — | 670,000 | 1.97 | 980,512 | |||||||||||||||
| — | 113,889 | — | — | — | ||||||||||||||||
| Arthur McEvily, Ph.D. |
10/15/2010 | — | 250,000 | 1.97 | 365,863 | |||||||||||||||
| — | 79,500 | — | — | — | ||||||||||||||||
| James H. Flatt, Ph.D. |
— | — | — | — | — | |||||||||||||||
| (1) | We do not generally provide for thresholds or maximums as part of our performance program. These numbers are described as targets in the executive offer letters unless otherwise noted. |
Outstanding Equity Awards at Fiscal Year-End
The following table shows, for the year ended December 31, 2010, certain information regarding outstanding equity awards at fiscal year end for our named executive officers.
| Grant Date | Vesting Commencement Date |
Number of Securities Underlying Unexercised Options (#) Exercisable(1) |
Number of Securities Underlying Unexercised Options (#) Unexercisable(1) |
Option Exercise Price ($) |
Option Expiration Date |
|||||||||||||||||||
| William J. Brady |
1/26/2010 | 1/26/2011 | — | 2,010,019 | 2.95 | 1/26/2020 | ||||||||||||||||||
| Keith Pattison |
10/21/2009 | 10/12/2010 | 35,000 | 115,000 | 2.86 | 10/21/2019 | ||||||||||||||||||
| Alan Belcher |
2/12/2008 | 12/3/2008 | 180,000 | 120,000 | 2.94 | 2/12/2018 | ||||||||||||||||||
| 12/17/2008 | 12/17/2009 | 25,000 | 37,500 | 2.86 | 12/17/2019 | |||||||||||||||||||
| 12/17/2008 | 12/17/2009 | — | 62,500 | (2) | 2.86 | 12/17/2019 | ||||||||||||||||||
| Murray J. Burke |
10/15/2010 | 10/15/2010 | 290,333 | (3) | 379,667 | 1.97 | 10/15/2020 | |||||||||||||||||
| Arthur McEvily, Ph.D. |
10/15/2010 | 10/15/2010 | 108,333 | (4) | 141,667 | 1.97 | 10/15/2020 | |||||||||||||||||
| James H. Flatt, Ph.D. |
— | — | — | — | — | — | ||||||||||||||||||
| (1) | Unless otherwise noted, each option vests as to 1/5th of the total number of shares subject to the option on the first anniversary of the vesting commencement date, and 1/60th of the total number of shares subject to the option shall vest monthly thereafter until all shares are vested. |
117
Table of Contents
| (2) | The referenced December 17, 2008 Option Grant has a milestone based vesting schedule. The board of directors will determine whether or not which, if any, of the corresponding objectives have been met. The satisfaction of these objectives is currently under evaluation by our CEO and board of directors. |
| (3) | Pursuant to a share purchase agreement between SunOpta Inc. and us dated August 31, 2010, Mr. Burke received a new hire option grant subject to the following vesting schedule: the option to purchase 40% of the shares shall vest immediately upon the grant date, and the option to purchase the remainder shall vest in equal monthly installments over the following 36 months. |
| (4) | Pursuant to a share purchase agreement between SunOpta Inc. and us dated August 31, 2010, Dr. McEvily received a new hire option grant subject to the following vesting schedule: the option to purchase 40% of the shares shall vest immediately upon the grant date, and the option to purchase the remainder shall vest in equal monthly installments over the following 36 months. |
Options Exercises and Stock Vested
There were no options exercised by, or shares of common stock vested for, any of our named executive officers for the year ended December 31, 2010.
Employment Offers and Employment Agreements
As of December 31, 2010, we were party to the following employment offers, employment agreements and other agreements with our named executive officers. Any terms included in these agreements about separation pay or severance pay is included in the section below entitled “—Potential Benefits Following Termination or Change of Control.”
William J. Brady. Mr. Brady received a letter offering employment from us on December 23, 2009. Pursuant to the employment offer, Mr. Brady was entitled to an initial annual base salary of $340,000 and consideration by our board of directors for an annual cash bonus. The employment offer provides for our board of directors to review and, in its discretion, increase Mr. Brady’s base salary. This offer also provides financial assistance of $3,000 per month gross for each month in 2010 to assist him with living expenses. These living expenses were treated as taxable income reportable on a Form W-2. Please see the discussion in the section below entitled “—Potential Benefits Following Termination or Change of Control” for a description of Mr. Brady’s benefits under his employment offer upon a termination or change of control.
Keith Pattison. Mr. Pattison received a letter offering employment from us on September 9, 2009. Pursuant to the employment offer, Mr. Pattison was entitled to an initial annual base salary of $180,000 and consideration by our board of directors for an annual cash bonus.
Alan Belcher. Mr. Belcher received a letter offering employment from us on August 17, 2007, which offer was amended on December 23, 2008. Mr. Belcher received an offer to transfer his employment to a new location on April 7, 2009, when we decided to restructure the business and consolidate operations at a new location in New Hampshire. Pursuant to the employment offer, Mr. Belcher was entitled to an initial annual base salary of $250,000 and consideration by our board of directors for an annual cash bonus, and he also received a $25,000 starting bonus. The amendment on December 23, 2008, included language to clarify the timing of payment of any cash bonus (to be paid between January 1 and March 15 of the calendar year immediately following the calendar year in which the bonus was earned) as well as a requirement for a release of claims to be effective within 30 days of termination of Mr. Belcher’s employment for him to be eligible to receive severance pay. The offer to transfer employment to new location includes language about our consolidation of operations at a New Hampshire location (the corporate offices had previously been in Cambridge, Massachusetts). Pursuant to this April 7, 2009 agreement, Mr. Belcher began to receive a housing allowance, which is described earlier in this discussion. Please see the discussion in the section below entitled “—Potential Benefits Following Termination or Change of Control” for a description of Mr. Belcher’s benefits under his employment offer upon a termination.
Murray J. Burke. We entered into an employment agreement with Mr. Burke on August 30, 2010, as part of a share purchase agreement dated August 31, 2010 between us and SunOpta Inc., pursuant to which we acquired SunOpta BioProcess Inc., or SBI. Mr. Burke had occupied the office of President and Chief Technology Officer
118
Table of Contents
of SBI. Pursuant to the employment agreement, Mr. Burke was entitled to an initial annual base salary of 328,000 Canadian Dollars and consideration by our board of directors for an annual cash bonus. Please see the discussion in the section below entitled “—Potential Benefits Following Termination or Change of Control” for a description of Mr. Burke’s benefits under his employment agreement upon a termination or change of control.
Arthur McEvily, Ph.D. Dr. McEvily received a letter offering employment from us dated August 9, 2010. Pursuant to the employment offer, Dr. McEvily was entitled to an initial annual base salary of $265,000 and consideration by our board of directors for a cash bonus. Please see the discussion in the section below entitled “—Potential Benefits Following Termination or Change of Control” for a description of Dr. McEvily’s benefits under his employment offer upon a termination.
James H. Flatt, Ph.D. Dr. Flatt received a letter offering employment from us on May 1, 2007. On May 30, 2008, Dr. Flatt received a letter from Mr. Jamerson, then our CEO, with new provisions describing Dr. Flatt’s eligibility for, and the circumstances under which he would receive severance pay. Dr. Flatt’s provisions for severance pay are described later in this discussion under “—Potential Benefits Following Termination or Change of Control.” Pursuant to the employment offer, Dr. Flatt was entitled to an initial annual base salary of $275,000 and consideration by our board of directors for an annual cash bonus. He also received a starting bonus in the amount of $40,000 following the commencement of his employment with us. The employment offer also provided housing assistance of $2,000 per month for each month of Dr. Flatt’s employment with us to assist him with living expenses. These living expenses were treated as taxable income reportable on a Form W-2. Please see the discussion in the section below entitled “—Potential Benefits Following Termination or Change of Control” for a description of Dr. Flatt’s benefits under his employment offer upon a termination.
Potential Benefits Following Termination or Change of Control
Our compensation committee provides our executive officers with financial protection in the event of certain terminations of employment when it determines that such protection is necessary to attract or retain that executive. Under the terms of their employment agreements or offer letters, unless indicated otherwise, the following executive officers are entitled to receive severance payments and benefits in the event that they are terminated without cause or constructively terminated, as defined in their employment agreements or offer letters.
William J. Brady. In the event that Mr. Brady is terminated without cause or constructively terminated, Mr. Brady is entitled to salary continuance for six months, and all shares subject to stock options and shares of restricted stock then held by him vest as of the termination date as if they were held for an additional 12 months following his termination. We are obligated to also pay the same amount towards premiums for health and dental benefits coverage as we pay towards premiums for coverage for him at the time of termination for 12 months following the date of termination. Our board of directors may enhance the salary continuance with a payment of a pro rata portion of Mr. Brady’s cash bonus that has a target of 50% of his then base salary. Under the terms of Mr. Brady’s offer letter, the non-employee members of our board of directors determine what constitutes “cause” for Mr. Brady’s termination, including but not limited to: fraud or embezzlement with respect to the company or any subsidiary; other material misconduct by Mr. Brady with the company including but not limited to misappropriation of funds or property, gross negligence or willful misconduct with respect to the company or any subsidiary, commission of a felony or misdemeanor involving moral turpitude, fraud or misrepresentation, breach of any material terms of his offer letter or any agreement to which he and the company are both parties, dishonesty to the board of directors or any board member regarding any matter related to the company or willful insubordination or disregard of the legal directives of the board of the directors that are not inconsistent with the scope and nature of his duties or his ethical obligations. “Constructively terminated” means a resignation by Mr. Brady from his employment with us because of any of the following reasons without his written consent: the need to relocate to a location that is both greater than 50 miles from our Lebanon, New Hampshire location and outside a 50 mile radius of Boston, Massachusetts; any material diminution in his authority, duties or responsibilities; a change in his reporting obligates such that he reports to a corporate officer or employee instead
119
Table of Contents
of directly to the board of directors; or any material diminution of his base salary unless the board of directors has decided that a decrease in salary generally across the company is in the best interests of the company if it is proportionate to the reduction imposed on other executives of similar seniority and does not reduce the salary by more than 10% below the level at that time.
Mr. Brady’s offer letter also includes change of control provisions for his initial equity grant. “Change of control” is defined in Mr. Brady’s offer letter as: the merger or acquisition by any person or entity of the beneficial ownership of more than 50% of the then outstanding shares that represent the voting power of the surviving entity or; the sale of all or substantially all of the assets of the company, provided that a venture capital or other equity financing or financings of the company shall not constitute a “change of control.” In the event of a change of control, 50% of the then unvested portion of the initial grant of 2,010,019 shares of common stock to Mr. Brady, or initial grant, vests immediately. In the event of a (a) termination without cause or constructive termination within 12 months of a change of control or if (b) Mr. Brady remains employed within 12 months of a change of control, 100% of the unvested portion of the initial grant vests immediately.
Alan Belcher. If we terminate Mr. Belcher’s employment for any reason other than cause, his death, or his incapacity to perform his job, we are obligated to pay him his base salary for up to six months following termination. For Mr. Belcher, “cause” means dishonesty to the board of directors or CEO; commission of a misdemeanor involving moral turpitude, deceit, dishonesty or fraud or commission of any felony; substantial failure to perform one or more of his material job responsibilities to the reasonable satisfaction of the CEO, if the failure continues after written notice to Mr. Belcher; gross negligence, willful misconduct or insubordination, or; breach of any of his obligations under any agreement he has with the company.
Murray J. Burke. If we terminate Mr. Burke’s employment without cause, we are obligated to pay him his base salary for 12 months and to pay for his health benefits for the severance period of 12 months. In the event that Mr. Burke resigns for good reason within six months of a change of control, we are obligated to pay him his base salary for 12 months and to pay for his health benefits for the severance period of 12 months. In either case, Mr. Burke can also receive a pro-rata portion of his targeted annual cash bonus at the discretion of the board of directors. Under the terms of Mr. Burke’s employment agreement, “cause” means any act, omission or conduct that would constitute just and sufficient cause for immediate termination under the laws of the province of Ontario. “Change of control” means: any change in the holding, direct or indirect, of the shares of the company as a results of which a person, or group of people acting together within the meaning of the Securities Act of Ontario, is in a position to exercise effective control of the company; or the sale or lease to a person, or group of people acting together within the meaning of the Securities Act of Ontario, of assets which aggregate more than 50% of the assets (measured by fair market value) of the company or assets that generated during the company’s last completed fiscal year or are expected to generate during the company’s current fiscal year more than 50% of the operating income or cash flow of the company. “Good reason” means any action by the company that constitutes constructive termination of Mr. Burke’s employment, including: any change in his place of employment (as described in his employment agreement); any material reduction in his offices, titles, reporting relationships, powers, authority, duties or responsibilities; or any material reduction in his base salary; any material reduction in the value of his benefits plans.
Arthur McEvily, Ph.D. If Dr. McEvily is terminated without cause, we are obligated to pay him an amount equal to six months of his then current base salary.
James H. Flatt, Ph.D. In the event that Dr. Flatt was terminated without cause or constructively terminated, Dr. Flatt would have been entitled to salary continuance for six months or until commencement of full-time employment or consulting work elsewhere, if earlier. Under Dr. Flatt’s June 1, 2008 employment letter, or letter agreement, a termination for “cause” shall mean a determination by the members of our board of directors that his employment was terminated for any of the following reasons: failure or refusal to comply in any material respect with our lawful policies, standards or regulations; a violation of a material federal or state law or regulation applicable to our business; commission of or plea of no contest to any misdemeanor involving the
120
Table of Contents
fraud, theft, dishonesty, or moral turpitude or to any felony under state or US. laws; fraud, or misappropriation of property belonging to us or our affiliates; non performance, non-compliance or interference with the other party’s performance of the terms of any confidentiality, invention assignment or proprietary information agreement with us or with a former employer; any of his representations in the letter agreement are not correct; material breach of any of his obligations under the letter agreement, his confidentiality and developments agreement or non-competition agreement; his failure to perform his duties satisfactorily after having received written notice of such failure and at least 30 days to cure such failure; his misconduct or gross negligence in connection with the performance of his duties; or his willful failure to cooperate with a bona fide internal investigation or an investigation by regulatory or law enforcement authorities, after being instructed by us to cooperate or the willful destruction or failure to preserve documents or other materials known to be relevant to such investigation or the willful inducement of others to fail to cooperate or the produce documents or other materials in connection with such investigation. Dr. Flatt was not entitled to any severance or separation pay when he left the company on May 18, 2010.
The following tables set forth estimates of the benefits that would have been payable to each of our named executive officers if their employment had been terminated on December 31, 2010 by us upon certain terminations or changes of control. Amounts below reflect potential payments pursuant to provisions in employment agreements or employment offer letters for such named executive officers.
William J. Brady
| Benefit |
Involuntary Termination Without Cause |
Constructive Termination |
Involuntary Termination or Constructive Termination Within 12 Months of Change of Control |
Continued Employment Within 12 Months of Change of Control |
||||||||||||
| Base Salary Continuation | $ | 170,000 | $ | 170,000 | $ | 170,000 | ||||||||||
| Bonus | — | (1) | — | (1) | — | (1) | — | |||||||||
| Accelerated Equity Awards(2) | $ | $ | $ | $ | ||||||||||||
| Continued Health Benefit Coverage | $ | 17,133 | $ | 17,133 | $ | 17,133 | — | |||||||||
| Total | $ | $ | $ | $ | ||||||||||||
| (1) | The board of directors also has the discretion to pay an additional amount equal to the pro-rata portion of Mr. Brady’s $170,000 annual cash incentive bonus target. |
| (2) | There was no public market for our common stock in 2010. This amount is based on our estimate of the market value of the shares underlying unvested options based on an assumed initial public offering price of $ per share, which is the midpoint of the estimated price range listed on the cover page of this prospectus. |
Alan Belcher
| Benefit |
Involuntary Termination Without Cause |
Involuntary Termination Upon Death or Incapacity |
Change of Control |
|||||||||
| Base Salary Continuation | $ | 127,500 | $ | 127,500 | — | |||||||
| Total | $ | 127,500 | $ | 127,500 | — | |||||||
121
Table of Contents
Murray J. Burke
| Benefit |
Involuntary Termination Without Cause |
Voluntary Termination for Good Reason Within Six Months of Change of Control |
||||||
| Base Salary Continuation | $ | 325,397 | $ | 325,397 | ||||
| Bonus | — | (1) | — | (1) | ||||
| Continued Health Benefit Coverage | $ | 2,447 | $ | 2,447 | ||||
| Total | $ | 327,844 | $ | 327,844 | ||||
| (1) | The board of directors also has the discretion to pay an additional amount equal to a pro-rata portion of Mr. Burke’s $113,889 annual cash incentive bonus target. |
Arthur McEvily, Ph.D.
| Benefit |
Involuntary Termination Without Cause |
Change of Control |
||||||
| Base Salary Continuation | $ | 132,500 | — | |||||
| Total | $ | 132,500 | — | |||||
2006 Stock Incentive Plan
We established the 2006 Stock Incentive Plan, or the 2006 Plan, which became effective on March 9, 2006. The purpose of the 2006 Plan is to secure for us and our stockholders the benefits arising from capital stock ownership by employees, officers and directors of, consultants or advisors to, us and our parent and subsidiary corporations who are expected to contribute to our future growth and success. The 2006 Plan provides for the award of incentive stock options, nonqualified stock options, and restricted stock.
Administration. The 2006 Plan is administered and interpreted by our board of directors, whose construction and interpretation of the terms and provisions of the 2006 Plan shall be final and conclusive. The board of directors may in its sole discretion authorize issuance of restricted stock and grant options to purchase shares of common stock, and issuance of shares upon exercise of such options. The board of directors has authority to construe the respective restricted stock agreements, option agreements and the plan, to prescribe, amend and rescind rules and regulations relating to the 2006 Plan, to determine the terms and provisions of the respective restricted stock agreements and option agreements, and to make all other determinations in the judgment of our board necessary or desirable for the administration of the 2006 Plan. The board of directors may correct any defect or supply any omission or reconcile any inconsistency in the 2006 Plan or in any restricted stock agreement or option agreement in the manner and to the extent it deems expedient to carry the 2006 Plan into effect and it shall be sole and final judge of such expediency. The board of directors may delegate any or all of its powers under the 2006 Plan to a committee appointed by the board of directors; if the committee is so appointed, all references to the board of directors in the 2006 Plan shall mean and relate to the committee. Awards under the 2006 Plan are evidenced by option agreements or restricted stock agreements.
Grant of Option Awards. Generally, option awards under the 2006 Plan may be granted to employees, consultants and directors of the company or any affiliate, other than incentive stock options, which may only be granted to employees. The number of shares issued or reserved pursuant to the 2006 Plan may be adjusted by our board of directors, as it deems appropriate. When the plan was originally approved by our board of directors, or
122
Table of Contents
the board, the maximum number of shares of common stock that could be issued under the 2006 Plan was 2,800,000 shares. This number has been adjusted by the board from time to time, most recently on August 31, 2010, it was adjusted to 14,250,000 shares.
Stock Options. Under the 2006 Plan, the board can grant participants incentive stock options, meeting the requirements of Section 422 of the Code or non-statutory options that are not intended to meet the requirements of Section 422 of the Code. All options when granted are intended to be non-statutory options unless the applicable option agreement explicitly states that the option is intended to be an incentive stock option. If an option is intended to be an incentive stock option, and if for any reason such option or any portion thereof shall not qualify as an incentive stock option, then, to the extent of such nonqualification, such option (or portion thereof) shall be regarded as a non-statutory option appropriately granted under the 2006 Plan provided that such option (or portion thereof) otherwise meet’s the 2006 Plan’s requirements relating to non-statutory options. Any incentive stock option can qualify for special tax treatment under U.S. tax law. Under the 2006 Plan, the board can also grant participants nonqualified stock options or restricted stock. The board establishes the duration of each option at the time of grant, with a maximum duration of ten years from the effective date of the grant. The board also establishes any performance criteria or passage of time requirements that must be satisfied prior to the exercise of options. The purchase price per share of restricted stock shall be determined by the board. The purchase price per share of stock deliverable upon exercise of an incentive stock option is determine by the board, and cannot be less than 100% of the fair market value of such stock at the time of grant, as determined by the board of directors, or less than 110% of the fair market value in the case of certain incentive stock options. Non-statutory options issued at less than fair market value will comply with the provisions of Section 409A of the Code. If any employee to whom an incentive stock option is to be granted is, at the time of the grant, the owner of stock possessing more than 10% of the total combined voting power of all classes of stock (after taking into account the attribution of stock ownership rules of Section 424(d) of the Code), then the following special provisions shall be applicable to the incentive stock option granted to that individual:
| • | purchase price per share of the common stock subject to the incentive stock option shall not be less than 110% of the fair market value of one share of common stock at the time of grant; and |
| • | the option exercise period shall not exceed five years from the date of grant. |
Options granted to any employee under the 2006 Plan (and any other incentive stock option plans of the company) which are intended to constitute incentive stock options shall constitute incentive stock options to the extent that such options, in the aggregate, become exercisable for the first time in any one calendar year for shares of common stock with an aggregate fair market value (determined as of the respective date or dates of grant) of less than $100,000.
Change in Control. If the outstanding shares of common stock are increased, decreased or exchanged for a different number or kind of shares or other securities or additional shares or new or different shares or other securities of the company or other non-cash assets are distributed with respect to these shares of common stock or other securities, an adjustment will be made in the maximum number and kind of shares reserved for issuance under the 2006 Plan, the number and kind of shares or other securities subject to any then outstanding options, and the price for each share or other security subject to any then outstanding options, so that, upon exercise of these options, in lieu of the shares of common stock for which these options are exercisable, the optionee will be entitled to receive, for the same aggregate consideration, the same total number and kind of shares or other securities, cash or party that they would have immediately prior to the event. If we are party to a merger or reorganization, whether or not we are the surviving or resulting entity, or if we consolidate with another corporation or if we liquidate, the board of directors may take any of the following action with regard to outstanding options: provide that the options shall remain outstanding and be exercisable for shares of common stock; accelerate the time for exercise of the options; cancel the options as of the effective date of the transaction; or provide a cash payment for each share subject to outstanding options equal to the difference between the per share cash consideration and the option exercise price.
123
Table of Contents
Amendment and Termination. The board of directors may at any time modify or amend the 2006 Plan in any respect or terminate the 2006 Plan. If stockholder approval is not obtained within 12 months after any amendment increasing the number of shares authorized under the 2006 Plan or changing the class of persons eligible to receive incentive stock options under the 2006 Plan, no options granted pursuant to such amendments shall be deemed to be incentive stock options and no incentive stock options shall be issued pursuant to such amendments thereafter. The termination or any modification or amendment of the 2006 Plan shall not, without the consent of an optionee, affect his or her rights under an option previously granted to him or her. With the consent of the recipient of restricted stock or optionee affected, the board of directors may amend outstanding restricted stock agreements or option agreements in a manner not in consistent with the 2006 Plan. The board of directors shall have the right to amend or modify the terms and provisions of the 2006 Plan and of any outstanding incentive stock options to the extent necessary to qualify any or all such options for such favorable federal income tax treatment (including deferral of taxation upon exercise) as may be afforded incentive stock options under Section 422 of the Code.
2011 Stock Option and Incentive Plan
On , 2011, the board of directors, upon the recommendation of our compensation committee, adopted the 2011 Stock Option and Incentive Plan, or the 2011 Plan, which was subsequently approved by our stockholders. The 2011 Plan will replace the 2006 Plan, as our board of directors has determined not to make additional awards under that plan. The 2011 Plan provides flexibility to our compensation committee to use various equity-based incentive awards as compensation tools to motivate the company’s workforce.
We have initially reserved shares of our common stock for the issuance of awards under the 2011 Plan. The 2011 Plan may also provide that the number of shares reserved and available for issuance under the plan will automatically increase each January 1, beginning in 2012, by % of the outstanding number of shares of common stock on the immediately preceding December 31. This number is subject to adjustment in the event of a stock split, stock dividend or other change in our capitalization.
The shares we issue under the 2011 Plan will be authorized but unissued shares or shares that we reacquire. The shares of common stock underlying any awards that are forfeited, canceled, held back upon exercise or settlement of an award to satisfy the exercise price or tax withholding, reacquired by us prior to vesting, satisfied without any issuance of stock, expire or are otherwise terminated (other than by exercise) under the 2011 Plan or 2006 Plan are added back to the shares of common stock available for issuance under the 2011 Plan.
The 2011 Plan will be administered by our board of directors or the compensation committee, or the Administrator. The Administrator has full power to select, from among the individuals eligible for awards, the individuals to whom awards will be granted, to make any combination of awards to participants, and to determine the specific terms and conditions of each award, subject to the provisions of the 2011 Plan. Persons eligible to participate in the 2011 Plan will be those full or part-time officers, employees, non-employee directors and other key persons (including consultants and prospective officers) of the company and its subsidiaries as selected from time to time by the Administrator in its discretion.
The 2011 Plan permits the granting of (1) options to purchase common stock intended to qualify as incentive stock options under Section 422 of the Code and (2) options that do not so qualify. The exercise price of each option will be determined by the Administrator but may not be less than 100% of the fair market value of the common stock on the date of grant. The term of each option will be fixed by the Administrator and may not exceed ten years from the date of grant. The Administrator will determine at what time or times each option may be exercised.
The Administrator may award stock appreciation rights subject to such conditions and restrictions as the Administrator may determine. Stock appreciation rights entitle the recipient to shares of common stock equal to the value of the appreciation in the stock price over the exercise price. The exercise price is the fair market value of the common stock on the date of grant.
124
Table of Contents
The Administrator may award restricted shares of common stock to participants subject to such conditions and restrictions as the Administrator may determine. These conditions and restrictions may include the achievement of certain performance goals and/or continued employment with us through a specified restricted period. The Administrator may award restricted stock units to any participants. Restricted stock units are ultimately payable in the form of shares of common stock and may be subject to such conditions and restrictions as the Administrator may determine. These conditions and restrictions may include the achievement of certain performance goals and/or continued employment with the company through a specified vesting period. The Administrator may also grant shares of common stock that are free from any restrictions under the 2011 Plan. Unrestricted stock may be granted to any participant in recognition of past services or other valid consideration and may be issued in lieu of cash compensation due to such participant.
The Administrator may grant performance share awards to any participant, which entitle the recipient to receive shares of common stock upon the achievement of certain performance goals and such other conditions as the Administrator shall determine.
The Administrator may grant dividend equivalent rights to participants which entitle the recipient to receive credits for dividends that would be paid if the recipient had held specified shares of common stock.
The Administrator may grant cash bonuses under the 2011 Plan to participants. The cash bonuses may be subject to the achievement of certain performance goals.
The 2011 Plan provides that upon the effectiveness of a “sale event” as defined in the 2011 Plan, except as otherwise provided by the Administrator in the award agreement, all stock options and stock appreciation rights will automatically become fully exercisable and the restrictions and conditions on all other awards with time-based conditions will automatically be deemed waived, unless the parties to the sale event agree that such awards will be assumed or continued by the successor entity. Awards with conditions and restrictions relating to the attainment of performance goals may become vested and non-forfeitable in connection with a sale event in the Administrator’s discretion. In addition, in the case of a sale event in which our stockholders will receive cash consideration, we may make or provide for a cash payment to participants holding options and stock appreciation rights equal to the difference between the per share cash consideration and the exercise price of the options or stock appreciation rights.
No other awards may be granted under the 2011 Plan after the date that is ten years from the date of stockholder approval. No awards under the 2011 Plan have been made prior to the date hereof.
401(k) Plan
Our U.S. employees are eligible to participate in our 401(k) plan. Our 401(k) plan is intended to qualify as a tax qualified plan under Section 401 of the Code. Our 401(k) plan provides that each participant may contribute a portion of his or her pretax compensation, up to a statutory limit, which for most employees is $16,500 in 2011, as was the case in 2010. Employee contributions are held and invested by the plan’s trustee. Our 401(k) plan also allows us to make discretionary contributions and matching contributions subject to established limits and a vesting schedule. To date, we have not made any contributions to the plan on behalf of participating employees.
125
Table of Contents
Director Compensation
Our directors currently do not receive any fees or other compensation for their services as members of our board of directors other than in connection with separate agreements we have with Mr. Bruce A. Jamerson and Dr. Lee R. Lynd. We also reimburse each member of our board of directors who is not a company employee for reasonable travel and other expenses in connection with attending meetings of the board of directors.
| Fees Earned or Paid in Cash ($) |
All
Other Compensation ($) |
Total ($) |
||||||||||
| Bruce A. Jamerson |
$ | 30,000 | (1) | $ | 5,000 | (1) | $ | 35,000 | (1) | |||
| Lee R. Lynd, Ph.D. |
$ | — | (2) | $ | 131,690 | (2) | $ | 131,690 | (2) | |||
| (1) | Pursuant to his Transition and Special Consulting Agreement of August 17, 2009 (the “Consulting Agreement”), which he entered into with the company when he was transitioning out of his role as CEO, Mr. Jamerson received separation pay over 12 months from August 17, 2009 to August 17, 2010, of which $202,500 was received in 2010. In accordance with the Consulting Agreement, Mr. Jamerson is entitled to a fee of $30,000 per year for serving as a member of our board of directors. He also received $5,000 in other compensation pursuant to the Consulting Agreement in payment of five extra travel days. For further information regarding Mr. Jamerson’s Consulting Agreement, please see the discussion under “Certain Relationships and Related Party Transactions” below. |
| (2) | Dr. Lynd receives payments as a consultant on a monthly basis; these payments include consideration for his membership and participation on our board of directors as well as his contribution as a member of our scientific advisory board, described elsewhere in this prospectus. Pursuant to Dr. Lynd’s Consulting Agreement, dated May 10, 2006, and the Amendments dated May 1, 2008, April 1, 2009 and May 1, 2010, Dr. Lynd was paid $123,654 in fees in 2010 and received $6,148 in payments in 2010 for reimbursement of travel expenses related to these agreements. For further information regarding Dr. Lynd’s Consulting Agreement, please see the discussion under “Certain Relationships and Related Party Transactions” below. |
Rule 10b5-1 Sales Plans
Our directors and executive officers may adopt written plans, known as Rule 10b5-1 plans, in which they will contract with a broker to buy or sell shares of our common stock on a periodic basis. Under a Rule 10b5-1 plan and subject to the lock-up agreements described in the “Underwriting” section, a broker executes trades pursuant to parameters established by the director or officer when entering into the plan, without further direction from them. The director or officer may amend or terminate the plan in some circumstances. Our directors and executive officers may also buy or sell additional shares outside of a Rule 10b5-1 plan when they are not in possession of material, nonpublic information.
Limitation of Liability and Indemnification Arrangements
As permitted by the Delaware General Corporation Law, or the DGCL, we intend to adopt provisions in our amended and restated certificate of incorporation and amended and restated by-laws, which will be effective upon the completion of this offering, that limit or eliminate the personal liability of our directors. Consequently, a director will not be personally liable to us or our stockholders for monetary damages for breach of fiduciary duty as a director, except for liability for:
| • | any breach of the director’s duty of loyalty to us or our stockholders; |
| • | any act or omission not in good faith or that involves intentional misconduct or a knowing violation of law; |
| • | any unlawful payments related to dividends or unlawful stock repurchases, redemptions or other distributions; or |
| • | any transaction from which the director derived an improper personal benefit. |
These limitations of liability do not alter director liability under the federal securities laws and do not affect the availability of equitable remedies such as an injunction or rescission.
126
Table of Contents
In addition, our amended and restated by-laws, which will be effective upon the completion of this offering, provide that:
| • | we will indemnify our directors, officers and, in the discretion of our board of directors, certain employees to the fullest extent permitted by the DGCL; and |
| • | advance expenses, including attorneys’ fees, to our directors and, in the discretion of our board of directors, to our officers and certain employees, in connection with legal proceedings, subject to limited exceptions. |
We have also entered into indemnification agreements with each of our executive officers and directors. These agreements provide that we will indemnify each of our directors to the fullest extent permitted by the DGCL and advance expenses to each indemnitee in connection with any proceeding in which indemnification is available.
We also maintain general liability insurance to provide insurance coverage to our directors and officers for losses arising out of claims based on acts or omissions in their capacities as directors or officers, including liabilities under the Securities Act of 1933, as amended, or the Securities Act. Insofar as indemnification for liabilities arising under the Securities Act may be permitted to directors, officers, or persons controlling the registrant pursuant to the foregoing provisions, we have been informed that in the opinion of the Securities and Exchange Commission such indemnification is against public policy as expressed in the Securities Act and is therefore unenforceable.
These provisions may discourage stockholders from bringing a lawsuit against our directors in the future for any breach of their fiduciary duty. These provisions may also have the effect of reducing the likelihood of derivative litigation against directors and officers, even though such an action, if successful, might otherwise benefit us and our stockholders. Furthermore, a stockholder’s investment may be adversely affected to the extent we pay the costs of settlement and damage awards against directors, officers and certain employees pursuant to these indemnification provisions. We believe that these provisions, the indemnification agreements and the insurance are necessary to attract and retain talented and experienced directors and officers.
At present, there is no pending litigation or proceeding involving any of our directors, officers or employees in which indemnification will be required or permitted. We are not aware of any threatened litigation or proceeding that might result in a claim for such indemnification.
127
Table of Contents
CERTAIN RELATIONSHIPS AND RELATED PARTY TRANSACTIONS
In addition to the compensation arrangements, including employment, termination of employment and change-in-control and indemnification arrangements, discussed, when required, above under “Management,” and the registration rights described below under “Description of Capital Stock—Registration Rights,” the following is a description of each transaction since January 1, 2008, and each currently proposed transaction in which:
| • | we have been or are to be a participant; |
| • | the amount involved exceeds $120,000 on an annual basis; and |
| • | any of our directors, executive officers or beneficial owners of more than five percent of any class of our voting capital stock at the time of the transactions in issue or any immediate family member of or person sharing the household with any of these individuals, had or will have a direct or indirect material interest. |
In connection with this offering, we have adopted a written policy that requires all future transactions between us and any director, executive officer, beneficial owners of more than five percent of any class of our voting capital stock or any member of the immediate family of, or entities affiliated with, any of them, or any other related persons (as defined in Item 404 of Regulation S-K) or their affiliates, in which the amount involved is equal to or greater than $120,000, be approved in advance by our audit committee. Any request for such a transaction must first be presented to our audit committee for review, consideration and approval. In approving or rejecting any such proposal, our audit committee is to consider the relevant facts and circumstances available and deemed relevant to the audit committee, including, but not limited to, the extent of the related party’s interest in the transaction, and whether the transaction is on terms no less favorable to us than terms we could have generally obtained from an unaffiliated third party under the same or similar circumstances.
All of the transactions described below were entered into prior to the adoption of this written policy, but each was approved or ratified by a majority of the disinterested members of our board of directors. We believe that we have executed all of the transactions set forth below on terms no less favorable to us than we could have obtained from unaffiliated third parties.
Preferred Stock Issuances
We issued shares of Series A, A-1, B, B-1, C and D preferred stock between March 2006 and August 2011 to various investors. Mr. Bruce Jamerson, a member of our board of directors and our former Chief Executive Officer from 2007 to 2009, purchased shares of our Series C and Series D preferred stock. Although none of our other executive officers or directors purchased Series A, A-1, B, C, or D preferred stock, pursuant to a voting agreement last amended and restated on August 31, 2010, and as amended on January 7, 2011, Flagship Ventures Fund 2004, L.P. and entities affiliated with General Catalyst Group had representatives serving on our board of directors at the time the Series B, C or D preferred stock were purchased, and these directors may have been considered to beneficially own any Series B, C or D preferred stock purchased by the entities with which they were affiliated. These directors disclaim beneficial ownership of these securities. The terms of these purchases were the same as those made available to unaffiliated purchasers.
The purchasers of these shares of our preferred stock are entitled to specified registration rights. See “Description of Capital Stock—Registration Rights.”
Series A Preferred Stock
In March 2006, we sold an aggregate of 5,000,000 shares of Series A preferred stock at a price of $0.80 per share for gross proceeds of approximately $4.0 million. In May 2006, KPS Partners, L.P., or KPS, transferred 1,250,000 shares of Series A preferred stock to Flagship Ventures Fund 2004, L.P. or Flagship. In September
128
Table of Contents
2006, KPS transferred the remaining 3,750,000 shares of Series A preferred stock to Khosla Ventures I, LP or Khosla. Upon these transfers of Series A preferred stock, Flagship and Khosla each became a beneficial owner of more than five percent of our Series A preferred stock. The table below sets forth the number of shares of Series A preferred stock sold to our directors, executive officers and beneficial owners of more than five percent of any class of our voting capital stock at the time of the transactions in issue and their affiliates.
| Shares of Series A Preferred Stock | Aggregate Purchase Price | |||||||
| Khosla Ventures I, LP |
3,750,000 | $ | 3,000,000 | |||||
| Flagship Ventures Fund 2004, L.P. |
1,250,000 | $ | 1,000,000 | |||||
Series A-1 Preferred Stock
In September 2006, we sold an aggregate of 5,000,000 shares of Series A-1 preferred stock at a price of $1.00 per share for gross proceeds of approximately $5.0 million. The table below sets forth the number of shares of Series A-1 preferred stock sold to our directors, executive officers and beneficial owners of more than five percent of any class of our voting capital stock at the time of the transactions in issue and their affiliates. Upon the Series A-1 financing, Flagship and Khosla, already beneficial owners of more than five percent of our Series A preferred stock, each became a beneficial owner of more than five percent of our Series A-1 preferred stock.
James Matheson is a member of our board of directors and is a partner of Flagship. Mr. Matheson disclaims beneficial ownership of these shares, except to the extent of his pecuniary interest therein.
| Shares of Series A-1 Preferred Stock | Aggregate Purchase Price | |||||||
| Khosla Ventures I, LP |
3,750,000 | $ | 3,750,000 | |||||
| Flagship Ventures Fund 2004, L.P. |
1,250,000 | $ | 1,250,000 | |||||
Series B Preferred Stock
In November 2006, we sold an aggregate of 11,241,573 shares of Series B preferred stock at a price of $2.67 per share for gross proceeds of approximately $30.0 million. 5,618 shares of Series B preferred stock were subsequently converted into common stock, leaving 11,235,955 shares of Series B preferred stock outstanding. The table below sets forth the number of shares of Series B preferred stock sold to our directors, executive officers and the beneficial owners of more than five percent of any class of our voting capital stock at the time of the transactions in issue and their affiliates. Upon the Series B preferred stock financing, entities affiliated with the General Catalyst Group, KPCB Holdings, Inc., as nominee, and entities affiliated with VantagePoint, each became a beneficial owner of more than five percent of our Series B preferred stock. Upon the Series B financing, Flagship and Khosla, already beneficial owners of more than five percent our Series A and A-1 preferred stock, each became a beneficial owner of more than five percent of our Series B preferred stock.
Hemant Taneja is a member of our board of directors and is a partner of General Catalyst. Mr. Taneja disclaims beneficial ownership of these shares, except to the extent of his pecuniary interest therein. James Matheson is a member of our board of directors and is a partner of Flagship. Mr. Matheson disclaims beneficial ownership of these shares, except to the extent of his pecuniary interest therein.
| Shares of Series B Preferred Stock | Aggregate Purchase Price | |||||||
| Entities affiliated with General Catalyst Group |
3,464,419 | $ | 9,249,999 | |||||
| KPCB Holdings, Inc., as Nominee |
2,996,255 | $ | 8,000,001 | |||||
| Entities affiliated with VantagePoint |
2,247,191 | $ | 6,000,000 | |||||
| Flagship Ventures Fund 2004, L.P. |
1,217,228 | $ | 3,249,999 | |||||
| Khosla Ventures I, LP |
561,798 | $ | 1,500,001 | |||||
129
Table of Contents
Series B-1 Preferred Stock
In October 2007, according to an Agreement and Plan of Merger, former shareholders of Celsys Biofuels, Inc., or Celsys, received shares of our Series B-1 preferred stock in exchange for their Celsys shares, with an aggregate fair value of the shares of $5,250,000 at the time of issue. In April 2008, the shares of Series B-1 preferred stock were converted into shares of our Series C preferred stock as described in further detail below.
Series C Preferred Stock
Between February and April 2008, we sold an aggregate of 9,531,250 shares of Series C preferred stock at a price of $6.40 per share for gross proceeds of $61.0 million. In addition, in connection with this financing, all former shareholders of our Series B-1 preferred stock received in the aggregate 820,307 shares of Series C preferred stock in cancellation of their Series B-1 preferred stock. Subsequently, 574,139 shares of Series C preferred stock were converted into common stock leaving 9,777,418 shares of Series C preferred stock outstanding. The table below sets forth the number of shares of Series C preferred stock sold to our directors, executive officers and the beneficial owners of more than five percent of any class of our voting capital stock at the time of the transactions in issue and their affiliates. At the time of the Series C preferred stock financing, R. Jeremy Grantham, MPC Investment LLC, entities affiliated with Pinnacle Ventures, and General Motors Ventures LLC each became a beneficial owner of more than five percent of our Series C preferred stock. Upon the Series C financing, entities affiliated with General Catalyst, already beneficial owners of more than five percent of our Series B preferred stock, became beneficial owners of more than five percent of our Series C preferred stock.
Hemant Taneja is a member of our board of directors and is a partner of General Catalyst. Mr. Taneja disclaims beneficial ownership of these shares, except to the extent of his pecuniary interest therein. James Matheson is a member of our board of directors and is a partner of Flagship. Mr. Matheson disclaims beneficial ownership of these shares, except to the extent of his pecuniary interest therein. Bruce Jamerson is a member of our board of directors and is our former Chief Executive Officer.
| Shares of Series C Preferred Stock | Aggregate Purchase Price | |||||||
| R. Jeremy Grantham |
2,343,750 | $ | 15,000,000 | |||||
| MPC Investment LLC |
1,562,500 | $ | 10,000,000 | |||||
| Entities Affiliated with Pinnacle Ventures |
781,250 | $ | 5,000,000 | |||||
| General Motors Ventures LLC |
781,250 | $ | 5,000,000 | |||||
| Entities affiliated with General Catalyst Group |
531,250 | $ | 3,400,000 | |||||
| Flagship Ventures Fund 2004, L.P. |
453,125 | $ | 2,900,000 | |||||
| KPCB Holdings, Inc., as Nominee |
453,125 | $ | 2,900,000 | |||||
| Funds managed by VantagePoint Capital Partners |
453,125 | $ | 2,900,000 | |||||
| Khosla Ventures I, LP |
375,000 | $ | 2,400,000 | |||||
| Bruce A. Jamerson |
173,438 | $ | 1,110,003 | |||||
Series D Preferred Stock
In August 2010, we issued 2,702,883 shares of our Series D preferred stock at a price of $3.75 per share in connection with the conversion of our 2010 Notes, as described below in “—2010 Bridge Financing.” In August 2010, we also issued 11,268,868 shares of our Series D preferred stock at a price of $3.75 per share to SunOpta Inc., or SunOpta, and certain stockholders of SunOpta BioProcess Inc., or SBI, as described and defined below in “Acquisition of SunOpta BioProcess Inc.” In January 2011, we sold 1,333,333 shares of our Series D preferred stock at a price of $3.75 per share for gross proceeds of approximately $5.0 million. In August 2011, Diamond Alternative Energy, LLC, or Valero, exercised a warrant for 1,333,333 shares of our Series D preferred stock at an exercise price of $3.75 per share for gross proceeds of approximately $5.0 million, which is not reflected in the table below. The table below sets forth the number of shares of Series D preferred stock sold to our directors, executive officers and the beneficial owners of more than five percent of any class of our voting capital stock at the time of the transactions in issue and their affiliates. At the time of the Series D preferred stock issuances, SunOpta, Hare & Co., as nominee for Blackrock Investment Management (UK) Limited, and Valero each became a beneficial owner of more than five percent of our Series D preferred stock.
130
Table of Contents
Jeremy Kendall is a member of our board of directors and is the chairman of the board of directors of SunOpta. Mr. Kendall also owns less than 1% of SunOpta’s capital stock. Mr. Kendall disclaims beneficial ownership of these shares of Series D preferred stock, except to the extent of his pecuniary interest therein. James Matheson is a member of our board of directors and is a partner of Flagship. Mr. Matheson disclaims beneficial ownership of these shares, except to the extent of his pecuniary interest therein. Hemant Taneja is a member of our board of directors and is a partner of General Catalyst. Mr. Taneja disclaims beneficial ownership of these shares, except to the extent of his pecuniary interest therein. Bruce Jamerson is a member of our board of directors and is our former Chief Executive Officer.
| Shares of Series D Preferred Stock | Aggregate Purchase Price | |||||||
| SunOpta Inc. |
6,580,866 | $ | 24,678,248 | |||||
| Hare & Co., as Nominee for Blackrock Investment Management (UK) Limited |
3,594,133 | $ | 13,477,999 | |||||
| Diamond Alternative Energy, LLC |
1,333,333 | $ | 4,999,999 | |||||
| Khosla Ventures I, LP |
721,820 | $ | 2,706,825 | |||||
| Flagship Ventures Fund 2004, L.P. |
356,800 | $ | 1,338,000 | |||||
| Entities affiliated with General Catalyst Group |
341,854 | $ | 1,281,953 | |||||
| KPCB Holdings, Inc., as Nominee |
295,116 | $ | 1,106,685 | |||||
| Funds managed by VantagePoint Capital Partners |
231,029 | $ | 866,359 | |||||
| R. Jeremy Grantham |
200,522 | $ | 751,958 | |||||
| MPC Investment LLC |
160,023 | $ | 600,086 | |||||
| Entities affiliated with Pinnacle Ventures |
86,097 | $ | 322,864 | |||||
| General Motors Ventures LLC |
66,864 | $ | 250,740 | |||||
| Bruce A. Jamerson |
14,844 | $ | 55,665 | |||||
Stockholder Agreements
In connection with the sale of our Series A, A-1, B, B-1, C, and D preferred stock, we entered into agreements that grant customary preferred stock rights to all of our major preferred stock investors, including holders of greater than five percent beneficial interest of each series of our preferred stock at the time of the transactions in issue. The rights include registration rights, rights of first refusal, co-sale rights with respect to stock transfers, a voting agreement providing for the election of investor designees to our board of directors, information rights and other similar rights. The Third Amended and Restated Registration Rights Agreement dated August 31, 2010, and the amendments thereto, which contains the registration rights and many of the other rights described above, are filed as exhibits to the registration statement of which this prospectus is a part. All of these rights, other than the registration rights, will terminate upon the completion of this offering.
For a detailed description of the registration rights provided under the stockholder agreements, see “Description of Capital Stock—Registration Rights.”
Warrants
In October 2006, we issued a warrant to purchase 162,500 shares of our Series A-1 preferred stock at an exercise price of $1.00 per share to Pinnacle Ventures II Equity Holdings, L.L.C., or Pinnacle.
In February 2008, we issued a warrant to Pinnacle, exercisable for a certain number of shares of our Series B preferred stock determined by the amount of loan advances made to our company periodically under a certain loan agreement, or the 2008 Loan Agreement. The warrant is currently exercisable for an aggregate of 262,173 shares of our Series B preferred stock, with an exercise price of $2.67 per share.
In February 2008, we issued a warrant to Pinnacle, exercisable for a certain number of shares of our Series C preferred stock determined by the amount of loan advances made to our company periodically under the
131
Table of Contents
2008 Loan Agreement. The warrant is currently exercisable for an aggregate of 109,375 shares of our Series C preferred stock, with an exercise price of $6.40 per share. In December 2008, we issued a warrant to Pinnacle in connection with an amendment to the 2008 Loan Agreement, or the Pinnacle Warrant, which was then exercisable for an aggregate of 70,312 shares of our Series C preferred stock, with an exercise price of $6.40 per share. The Pinnacle Warrant was amended and restated in July 2009, and it is currently exercisable for an aggregate of 101,563 shares of our Series C preferred stock, with an exercise price of $6.40 per share.
In August 2010, we issued warrants to purchase an aggregate of 1,357,806 shares of our Series D preferred stock at an exercise price of $3.75 per share to certain investors who had participated in the 2010 Notes as described below in “—2010 Bridge Financing.” In January 2011, we issued a warrant to purchase an aggregate of 1,333,333 shares of our Series D preferred stock at an exercise price of $3.75 per share to Valero. Valero exercised this warrant in August 2011 as described above under “— Series D Preferred Stock”.
Also in August 2010, we issued a warrant to purchase 1,000,000 shares of our common stock at an exercise price of $3.75 per share to SunOpta as described below under “— Acquisition of SunOpta BioProcess Inc.” In June 2011, we issued warrants to purchase 659,898 shares of our common stock with an exercise price of $1.97 per share to Pinnacle Ventures II Equity Holdings, L.L.C. and Pinnacle Ventures III Equity Holdings, L.L.C.
For a detailed description of these warrants, see “Description of Capital Stock—Warrants.”
2010 Bridge Financing
In April 2010, we entered into a Subordinated Convertible Note Purchase Agreement pursuant to which we issued subordinated convertible promissory notes, or the 2010 Notes, to certain of our existing investors in an aggregate principal amount of approximately $10,000,000. The 2010 Notes accrued interest at a rate of 5% per annum. In August 2010, in connection with our acquisition of SBI described below, the full principal amount of and accrued but unpaid interest on the 2010 Notes were automatically converted pursuant to the terms of the Subordinated Convertible Note Purchase Agreement into an aggregate of 2,702,883 shares of our Series D preferred stock at a conversion price equal to the issue price of our Series D preferred stock. The table below sets forth the principal amount of the 2010 Notes issued to our directors, executive officers and beneficial owners of more than five percent of our voting capital stock at the time of the transaction and their affiliates.
| Principal Amount of 2010 Notes | ||||
| Khosla Ventures I, LP |
$ | 2,670,320 | ||
| Flagship Ventures Fund 2004, L.P. |
$ | 1,319,953 | ||
| Entities affiliated with General Catalyst Group |
$ | 1,264,663 | ||
| KPCB Holdings, Inc., as Nominee |
$ | 1,091,759 | ||
| Funds managed by VantagePoint Capital Partners |
$ | 854,673 | ||
| R. Jeremy Grantham |
$ | 741,817 | ||
| MPC Investment LLC |
$ | 592,465 | ||
| Entities affiliated with Pinnacle Ventures |
$ | 318,510 | ||
| General Motors Ventures LLC |
$ | 247,360 | ||
| Bruce A. Jamerson |
$ | 54,914 | ||
2011 Bridge Financing
In August 2011, we entered into a Subordinated Convertible Note and Warrant Purchase Agreement. Pursuant to this agreement, as amended in September 2011, we issued subordinated convertible promissory notes, or the 2011 Notes, to certain of our existing investors in the aggregate principal amount of approximately $7.4 million. The 2011 Notes accrue interest at a rate of 8% per annum. Investors who participated at or above their pro rata participation amount are entitled to receive a warrant to purchase either preferred stock of the Company at the price at which the securities are sold upon a qualified financing or common stock of the
132
Table of Contents
Company at a 30% discount to the price paid by the public upon an initial public offering, whichever occurs first. The table below sets forth the principal amount of the 2011 Notes issued to our directors, executive officers and beneficial owners of more than five percent of our voting capital stock at the time of the transaction and their affiliates.
| Investor |
Principal Amount of 2011 Notes | |||
| Flagship Ventures Fund 2004, L.P. |
$ | 977,397 | ||
| Entities affiliated with General Catalyst Group |
$ | 936,457 | ||
| KPCB Holdings, Inc., as Nominee |
$ | 808,424 | ||
| MPC Investment LLC |
$ | 788,391 | ||
| Entities affiliated with Hare & Co., as Nominees of Blackrock Investment Management (UK) Ltd |
$ | 775,961 | ||
| Funds managed by VantagePoint Capital Partners |
$ | 632,868 | ||
| Khosla Ventures I, LP |
$ | 500,000 | ||
| SunOpta Inc. |
$ | 500,000 | ||
| Diamond Alternative Energy, LLC |
$ | 287,862 | ||
| Entities affiliated with Pinnacle Ventures |
$ | 235,773 | ||
| General Motors Ventures LLC |
$ | 183,105 | ||
| Bruce A. Jamerson |
$ | 40,649 | ||
Acquisition of SunOpta BioProcess Inc.
On August 31, 2010, we acquired 100% of the shares of SunOpta BioProcess Inc., or SBI, from SunOpta Inc., or SunOpta and certain SBI stockholders for 11,268,868 shares of our Series D preferred stock, 3,756,290 shares of our common stock, and warrants to purchase 1,000,000 shares of common stock with an exercise price of $3.75 per share. Upon the SBI acquisition, Mr. Jeremy Kendall became one of our directors and SunOpta became a beneficial owner of more than five percent of our common and Series D preferred stock. Mr. Kendall is currently chairman of the board of directors of SunOpta, and continues to receive consulting fees of over $200,000 per year from SunOpta.
On August 31, 2010, and in connection with the acquisition of SBI, we entered into the Transition Services Agreement with SunOpta and SBI. Pursuant to this agreement, SunOpta made available certain leased facilities and provided certain services to Mascoma Canada and to us, including the provision of access to and the full use of certain leased facilities as well as network and wireless computer support. Under this agreement, SunOpta received $53,912 in aggregate fees in 2010 and $76,800 in aggregate fees in 2011. The agreement specified a one-year term for most of the services to be provided. An addendum to the agreement was executed on June 21, 2011 to extend the provision of access to and the use of certain leased facilities until September 30, 2011.
Pinnacle Term Credit Facilities
In October 2006, we entered into a loan agreement and various security agreements for a secured term credit facility in an aggregate principal amount of up to $5,000,000 with Pinnacle Ventures, L.L.C., or the 2006 Loan. In October 2006, we entered into an amendment to the 2006 Loan, relating to certain of our reimbursement obligations arising under a grant from Grafton County, New Hampshire.
In February 2008, we, together with certain of our subsidiaries, entered into a loan agreement and various security agreements for a secured term credit facility in an aggregate principal amount of up to $20,000,000 with Pinnacle Ventures, L.L.C., or the 2008 Loan. In December 2008, the 2008 Loan was amended to provide for an advance in the aggregate principal amount of $10,000,000, or the 2008 Amended Loan. In June 2011, we, together with certain of our subsidiaries, entered into a loan agreement and various security agreements for a
secured term credit facility in an aggregate principal amount of up to $20,000,000 with Pinnacle Ventures, L.L.C., or the 2011 Amended and Restated Loan, which amended and restated the 2008 Amended Loan. As of
133
Table of Contents
June 30, 2011, there was an aggregate of $10,000,000 of principal outstanding under the 2011 Amended and Restated Loan. As of June 30, 2011, we have made payments of interest and fees of approximately $1,700,000 to Pinnacle Ventures, L.L.C. in connection with the 2011 Amended and Restated Loan. We issued warrants in connection with each of the 2006 Loan, the 2008 Loan, the 2008 Amended Loan and the 2011 Amended and Restated Loan, as described above under “— Warrants.”
For additional information regarding the material terms of the above identified loans, see “Management’s Discussion and Analysis of Financial Condition and Results of Operations.”
Lee R. Lynd Consulting Agreement
In March 2006, we entered into a consulting agreement with Dr. Lee R. Lynd, one of our directors, that is automatically renewable on a yearly basis unless terminated with 15 days notice to the other party. Dr. Lynd is also a common stockholder and option holder of our company. Under this agreement, as amended, Dr. Lynd provides (i) certain updates, advice and assistance related to certain technical matters and (ii) service to the company as a member of our board of directors. Dr. Lynd received aggregate compensation of approximately $81,413 in 2008, $70,000 in 2009, and $123,654 in 2010 in his capacity as a consultant. In addition, Dr. Lynd received a stock option grant for 24,000 shares of our common stock in 2009 and a stock option grant for 14,000 shares of our common stock in 2011.
Charles E. Wyman Consulting Agreement
In March 2006, we entered into a consulting agreement with Dr. Charles E. Wyman that is automatically renewable on a yearly basis unless terminated with 15 days notice to the other party. Dr. Wyman is a greater than five percent holder of our common stock and an option holder of our company. Under this agreement, as amended, Dr. Wyman provides certain consulting services related to our technology. Dr. Wyman received aggregate compensation of approximately $91,700 in 2008, $74,000 in 2009, and $97,750 in 2010, including a discretionary bonus, in his capacity as a consultant. Dr. Wyman additionally received a stock option grant for 24,000 shares of our common stock in 2009 and a stock option grant for 14,000 shares of our common stock in 2011.
Dartmouth License Agreement and Research Agreements
On April 1, 2006, we entered into a research agreement, with the Trustees of Dartmouth College. Dartmouth is a beneficial owner of more than five percent of our common stock and Dr. Lee R. Lynd, a professor at Dartmouth, is one of our directors and a common stockholder and option holder. Under this agreement, as amended, we agreed to provide an aggregate total of at least $2,500,000 for the period from April 1, 2008 to March 31, 2013 to sponsor Dartmouth’s research and development of biological and chemical processes for conversion of biomass into ethanol and other products capable of volume production. Under the agreement, we made aggregate payments to Dartmouth of $500,000 in 2009, and $112,500 in 2010.
On July 10, 2006, we entered into an exclusive license agreement, or the 2006 Dartmouth License, with Dartmouth. Under this agreement, as amended, Dartmouth granted to us and our subsidiaries an exclusive, worldwide license to use certain techniques and processes developed by Dartmouth, including those developed under the 2006 Dartmouth Agreement, and to use certain Dartmouth patent rights relating to the production of ethanol and other commodity products from plant biomass and biologically-based waste streams. Under this agreement, we made aggregate payments to Dartmouth of $74,157 in 2008, $106,980 in 2009, and $76,929 in 2010.
On July 11, 2008, we entered into a research agreement with Dartmouth, whereby entities affiliated with the BioEnergy Science Center, or BESC, agreed to provide $6,295,000 of funds to our company, which we subsequently used to reimburse Dartmouth for certain research activities conducted at Dartmouth under the
134
Table of Contents
direction of Dr. Lynd. The agreement relates to the field of biomass deconstruction and conversion, with an emphasis on microbial activities. The parties’ rights to certain inventions arising from the 2008 BESC Research Agreement are intended to conform with and be subject to the 2006 Dartmouth License and the 2006 Dartmouth Agreement. Under this agreement, we made aggregate payments to Dartmouth of $1,191,402 in 2008, $2,156,134 in 2009, and $1,408,810 in 2010.
Colin South Separation Agreement and Release
In November 2008, we entered into a separation agreement and release with Mr. Colin South, the president of our company from March 2006 to November 2008, and a beneficial owner of more than five percent of our common stock, in connection with the termination of Mr. South’s employment with our company. Under this agreement, Mr. South received aggregate compensation of approximately $343,246 in 2008, $157,106 in 2009, and $22,002 in 2010 from the continuation of his salary, payment of a discretionary bonus, and for certain consulting services provided to our company for a 12 month period in the nature of technical assistance and business direction. Under the agreement, the vesting schedule of 200,000 of Mr. South’s stock options was accelerated.
Bruce A. Jamerson Transition and Special Consulting Agreement and Common Stock Purchase Agreement
In August 2009, we entered into a transition and special consulting agreement with Mr. Bruce A. Jamerson, the chief executive officer and president of our company until August 2009, which terminated his employment with our company as of the date thereof and identified the terms of his continuing relationship with the company, including the terms of Mr. Jamerson’s role as a member of our board of directors. Mr. Jamerson is currently a director and the chairman of the board of directors of our company, and a common stockholder and an option holder of our company. Under its terms, Mr. Jamerson received aggregate separation pay of $122,500 in 2009 and $202,500 in 2010, and certain other compensation in connection with his services as a board member and consultant, as described more completely under the section entitled “Executive and Director Compensation.” This agreement expired in August 2011, and can be extended. In June 2007, Mr. Jamerson purchased 381,680 shares of our common stock for aggregate proceeds of $500,001 pursuant to a Stock Purchase Agreement.
Marathon Services Agreement
In June 2010, we entered into a Master Engineering and Design Services Agreement with Marathon Petroleum Company LLC (now known as Marathon Petroleum Company LP), or Marathon, that is automatically renewable unless terminated with 30 days notice prior to the expiration of the then current term. Mr. David Whikehart, a director of our company, is a Marathon employee. Pursuant to this agreement, we owed $416,504 to Marathon for certain engineering, project management and related services provided in 2010 relating to our planned hardwood CBP facility in Kinross, Michigan. Marathon is a subsidiary of MPC Investment LLC, or MPC, one of our preferred stockholders. Marathon and MPC’s parent company became a separate, publicly traded company in June 2011. This agreement was terminated in July 2011. Pursuant to an additional agreement, approved by our board of directors, we issued an additional 2011 Note to MPC to satisfy our obligation to pay Marathon the amounts owed under the Master Engineering and Design Services Agreement. The terms of the 2011 Note and the related warrants are described above in more detail under “—2011 Bridge Financing.”
135
Table of Contents
The following table presents information concerning the beneficial ownership of the shares of our common stock as of June 30, 2011 by:
| • | each person (including any group as defined in Section 13(d)(3) of the Exchange Act) we know to be the beneficial owner of more than five percent of our outstanding shares of our voting stock; |
| • | each of our named executive officers; |
| • | each of our directors; and |
| • | all of our executive officers and directors as a group. |
We have determined beneficial ownership in accordance with Securities and Exchange Commission rules. The information does not necessarily indicate beneficial ownership for any other purpose. Under these rules, a person or entity is deemed to be a beneficial owner of our common stock if that person or entity has a right to acquire ownership on or within 60 days of June 30, 2011 upon the exercise of vested options or warrants or the conversion of our convertible preferred stock. A person or group is also deemed to be a beneficial holder of our common stock if that person or group has or shares voting power, which includes the power to vote or direct the voting of our common stock, or investment power, which includes the power to dispose of or to direct the disposition of such capital stock. Except in cases where community property laws apply or as indicated in the footnotes to this table, we believe that each stockholder or group of stockholders identified in the table possesses sole voting and investment power over all shares of common stock shown as beneficially owned by the stockholder or group of stockholders.
Percentage of beneficial ownership in the table below is based on 54,043,199 shares of common stock deemed to be outstanding as of June 30, 2011, assuming the conversion of all outstanding shares of convertible preferred stock into 46,318,457 shares of common stock and our sale of the shares in this offering, and shares of common stock outstanding after the completion of this offering. The table below assumes that the underwriters do not exercise their option to purchase additional shares. Shares of common stock subject to options or warrants that are currently exercisable or exercisable within 60 days of June 30, 2011, are considered outstanding and beneficially owned by the person or group holding the options, or warrants for the purpose of computing the percentage ownership of that person or group but are not treated as outstanding for the purpose of computing the percentage ownership of any other person or group. Unless indicated below, the address of each beneficial owner listed below is c/o Mascoma Corporation, 67 Etna Road, Suite 300, Lebanon, New Hampshire 03766.
| Percentage of Shares Beneficially Owned | ||||||||||
| Name and Address of Beneficial Owner |
Number of Shares Beneficially Owned |
Prior to This Offering |
After This Offering | |||||||
| Stockholders owning more than 5% |
||||||||||
| SunOpta Inc.(1) |
11,337,156 | 20.6 | % | |||||||
| Khosla Ventures I, LP(2) |
9,514,661 | 17.5 | % | |||||||
| Flagship Ventures Fund 2004, L.P.(3) |
4,703,147 | 8.7 | % | |||||||
| Entities affiliated with General Catalyst Group(4) |
4,506,144 | 8.3 | % | |||||||
| KPCB Holdings, Inc., as Nominee(5) |
3,890,064 | 7.2 | % | |||||||
| Hare & Co., as Nominee of Blackrock Investment Management (UK) Ltd(6) |
3,594,133 | 6.7 | % | |||||||
| Funds managed by VantagePoint Capital Partners(7) |
3,045,301 | 5.6 | % | |||||||
136
Table of Contents
| Percentage of Shares Beneficially Owned | ||||||||||
| Name and Address of Beneficial Owner |
Number of Shares Beneficially Owned |
Prior to This Offering |
After This Offering | |||||||
| Named Executive Officers** and Directors |
||||||||||
| William J. Brady, Jr.(8) |
636,506 | 1.2 | % | |||||||
| Keith Pattison(9) |
55,000 | * | ||||||||
| David A. Arkowitz |
— | — | ||||||||
| Stephen Kennedy |
— | — | ||||||||
| Alan Belcher(10) |
253,333 | * | ||||||||
| Lee R. Lynd(11) |
971,333 | 1.8 | % | |||||||
| Bruce A. Jamerson(12) |
1,615,111 | 2.9 | % | |||||||
| James Matheson |
— | — | ||||||||
| Hemant Taneja |
— | — | ||||||||
| Jeremy Kendall |
— | — | ||||||||
| David L. Whikehart |
— | — | ||||||||
| All executive officers and directors as a group (11 persons)(13) |
3,476,283 | 6.2 | % | |||||||
| * | Indicates beneficial ownership of less than one percent. |
| ** | Includes David A. Arkowitz and Steven Kennedy as an executive officer even though not a named executive officer as of December 31, 2010. |
| (1) | Includes 1,000,000 shares issuable upon the exercise of warrants to purchase common stock exercisable within 60 days of June 30, 2011. The address for SunOpta Inc. is 2838 Bovaird Drive West, Brampton, Ontario, Canada L7A 0H2. |
| (2) | Includes 356,043 shares issuable upon the exercise of warrants to purchase Series D preferred stock exercisable within 60 days of June 30, 2011. Khosla Ventures Associates I, LLC (“KVA I”) is the general partner of Khosla Ventures I, L.P. (“Khosla I”). VK Services, LLC (“VK Services”) is the manager of KVA I. Vinod Khosla is the managing manager of VK Services. Each of KVA I, VK Services and Vinod Khosla may be deemed to possess sole voting and investment control over the shares owned by Khosla I and may be deemed to have indirect beneficial ownership of such shares. Neither KVA I, VK Services nor Vinod Khosla owns any of our securities directly. Each of KVA I, VK Services and Vinod Khosla disclaims beneficial ownership of such shares except to the extent of their pecuniary interest therein. The address of Khosla I is c/o Khosla Ventures, 3000 Sand Hill Road, Building 3, Suite 190, Menlo Park, CA 94025. |
| (3) | Includes 175,994 shares issuable upon the exercise of warrants to purchase Series D preferred stock exercisable within 60 days of June 30, 2011. Flagship Ventures General Partner LLC (“Flagship LLC”) is the general partner of Flagship Ventures Fund 2004 (“Flagship”). Noubar B. Afeyan, Ph.D. and Edwin M. Kania, Jr. are the managers of Flagship LLC. As a result, each of Flagship LLC, Mr. Afeyan and Mr. Kania may be deemed to possess voting and investment control over, and may be deemed to have indirect beneficial ownership with respect to, all shares held by Flagship. Neither Flagship LLC, Mr. Afeyan nor Mr. Kania owns directly any of our securities. Each of Flagship LLC, Mr. Afeyan and Mr. Kania disclaims beneficial ownership of these securities except to the extent of their pecuniary interest therein. The address of Flagship Ventures Fund 2004, L.P. is c/o Flagship Ventures, One Memorial Drive, 7th Floor, Cambridge, MA 02142. |
| (4) | Includes 164,263 and 4,358 shares issuable upon the exercise of warrants to purchase Series D preferred stock held by General Catalyst Group IV, L.P. and GC Entrepreneurs Fund IV, L.P., respectively. General Catalyst Partners IV, LP (“GC Partners”) is the General Partner of General Catalyst Group IV, L.P. (“GC Fund”) and GC Entrepreneurs Fund IV, L.P. (“GC Entrepreneurs Fund”). General Catalyst GP IV, LLC (“GC GP”) is the General Partner of GC Partners. Messrs. Joel E. Cutler, David P. Fialkow David J. Orfao and John G. Simon are founding managers of GC GP. Each of GC Partners, GC GP, Mr. Cutler, Mr. Fialkow Mr. Orfao and Mr. Simon may be deemed to possess voting and investment control over, and may be deemed to have indirect beneficial ownership with respect to, all shares held by General Catalyst Group IV, L.P. Neither GC Partners, GC GP, Mr. Cutler, Mr. Fialkow Mr. Orfao nor Mr. Simon owns directly any of our securities. Each of GC Entrepreneurs Fund IV, L.P. GC Partners, GC GP, Mr. Cutler, Mr. Fialkow Mr. Orfao and Mr. Simon disclaim beneficial ownership of these securities except to the extent of their pecuniary interest therein. The address of the entities affiliated with General Catalyst is c/o General Catalyst Group Management, LLC, 20 University Road, Suite 450, Cambridge MA 02138. |
| (5) | Includes 145,568 shares issuable upon the exercise of warrants to purchase Series D preferred stock exercisable within 60 days of June 30, 2011. John A. Denniston is the President and sole director of KPCB Holdings, Inc. As a result, Mr. Denniston may be deemed to possess voting and investment control over, and may be deemed to have beneficial ownership with respect to all shares held by KPCB Holdings, Inc. Mr. Denniston disclaims beneficial ownership of these securities except to the extent of his pecuniary interest therein. The address of KPCB Holdings, Inc. is 2750 Sand Hill Road, Menlo Park, CA 94025. |
| (6) | Hare & Co. holds the shares as nominee for BlackRock Investment Management (UK) Ltd. (“BlackRock”). BlackRock Group Limited is the holding company of BlackRock and is a subsidiary of BlackRock Inc. As a result, each of BlackRock, BlackRock Group Limited and BlackRock Inc. may be deemed to possess voting and investment control over, and may be deemed to have indirect beneficial ownership with respect to, all of the shares held by Hare & Co. Neither BlackRock, BlackRock Group Limited nor BlackRock Inc. owns directly any of our securities. Each of BlackRock, BlackRock Group Limited and BlackRock Inc. disclaims beneficial ownership of such shares except to the extent of their pecuniary interest therein. The address of BlackRock is 33 King William Street, London, England EC4R 9AS. |
137
Table of Contents
| (7) | Includes 91,165 and 22,791 shares issuable upon the exercise of warrants to purchase Series D preferred stock held by VantagePoint Venture Partners 2006 (Q), L.P. (“VantagePoint 2006”) and VantagePoint CleanTech Partners, L.P. (“VantagePoint CleanTech”), respectively, exercisable within 60 days of June 30, 2011. The General Partner of VantagePoint 2006 is VantagePoint Venture Associates 2006, L.L.C. (“VantagePoint Associates 2006”). Alan E. Salzman is the Managing Member of VantagePoint Associates 2006. Each of VantagePoint Associates 2006 and Mr. Salzman disclaims beneficial ownership of these securities except to the extent of their pecuniary interest therein. The General Partner of VantagePoint CleanTech is VantagePoint CleanTech Associates, L.L.C. (“VantagePoint Associates CT”). Alan E. Salzman is a Managing Member of VantagePoint Associates CT. Each of VantagePoint Associates CT and Mr. Salzman disclaims beneficial ownership of these securities except to the extent of their pecuniary interest therein. The address of these entities and Mr. Salzman is c/o VantagePoint Capital Partners, 1001 Bayhill Drive, Suite 300, San Bruno, CA 94066. |
| (8) | Includes 636,506 shares issuable pursuant to options exercisable within 60 days of June 30, 2011. |
| (9) | Includes 55,000 shares issuable pursuant to options exercisable within 60 days of June 30, 2011. |
| (10) | Includes 253,333 shares issuable pursuant to options exercisable within 60 days of June 30, 2011. |
| (11) | Includes 171,333 shares issuable pursuant to options exercisable within 60 days of June 30, 2011. |
| (12) | Includes 1,001,667 shares issuable pursuant to options exercisable within 60 days of June 30, 2011, and 7,322 shares issuable upon the exercise of warrants to purchase Series D preferred stock exercisable within 60 days of June 30, 2011. |
| (13) | Includes 2,062,839 shares issuable pursuant to options exercisable within 60 days of June 30, 2011, and 7,322 shares issuable upon the exercise of warrants to purchase Series D preferred stock exercisable within 60 days of June 30, 2011. |
138
Table of Contents
Upon the completion of this offering, our authorized capital stock will consist of shares of common stock, par value $0.001 per share, and shares of preferred stock, par value $0.001 per share, and there will be shares of common stock outstanding and no shares of preferred stock outstanding. As of 2011, we had approximately record holders of our capital stock. All of our outstanding shares of convertible preferred stock will either be redeemed or will convert into shares of our common stock upon the completion of this offering. In addition, upon completion of this offering, options to purchase shares of our common stock will be outstanding and shares of our common stock will be reserved for future grants under our option plans.
The following description of our capital stock and provisions of our amended and restated certificate of incorporation and amended and restated by-laws are summaries of material terms and provisions and are qualified by reference to our amended and restated certificate of incorporation and amended and restated by-laws, copies of which have been filed with the Securities and Exchange Commission as exhibits to the registration statement of which this prospectus is a part. The descriptions of our common stock and preferred stock reflect amendments to our amended and restated certificate of incorporation and amended and restated by-laws that will become effective immediately prior to the completion of this offering.
Common Stock
Upon the completion of this offering, we will be authorized to issue one class of common stock. Subject to the rights and preferences of any preferred stock outstanding at the time, holders of our common stock are entitled to one vote for each share of common stock held of record for the election of directors and on all matters submitted to a vote of stockholders. Holders of our common stock are entitled to receive dividends ratably, if any, as may be declared by our board of directors out of legally available funds, subject to any preferential dividend rights of any preferred stock then outstanding. Upon our dissolution, liquidation or winding up, holders of our common stock are entitled to share ratably in our net assets legally available after the payment of all our debts and other liabilities, subject to the preferential rights of any preferred stock then outstanding. Holders of our common stock have no preemptive, subscription, redemption or conversion rights. The rights, preferences and privileges of holders of common stock are subject to, and may be adversely affected by, the rights of the holders of shares of any series of preferred stock that we may designate and issue in the future. Except as described in the section entitled “—Antitakeover Effects of Delaware Law and Provisions of our Amended and Restated Certificate of Incorporation and Amended and Restated By-laws” below, a majority vote of the holders of common stock is generally required to take action under our amended and restated certificate of incorporation and amended and restated by-laws.
Preferred Stock
Upon the closing of this offering, our board of directors will be authorized, without action by the stockholders, to designate and issue up to an aggregate of shares of preferred stock in one or more series. Our board of directors can designate the rights, preferences and privileges of the shares of each series and any of its qualifications, limitations or restrictions. Our board of directors may authorize the issuance of preferred stock with voting or conversion rights that could adversely affect the voting power or other rights of the holders of common stock. The issuance of preferred stock, while providing flexibility in connection with possible future financings and acquisitions and other corporate purposes could, under certain circumstances, have the effect of restricting dividends on our common stock, diluting the voting power of our common stock, impairing the liquidation rights of our common stock, or delaying, deferring or preventing a change in control of our company, which might harm the market price of our common stock. See also the section entitled “—Antitakeover Effects of Delaware Law and Provisions of our Amended and Restated Certificate of Incorporation and Amended and Restated By-laws—Provisions of our Amended and Restated Certificate of Incorporation and Amended and Restated By-laws—Undesignated preferred stock” below.
139
Table of Contents
Our board of directors will make any determination to issue such shares based on its judgment as to our company’s best interests and the best interests of our stockholders. Upon the completion of this offering, we will have no shares of preferred stock outstanding and we have no current plans to issue any shares of preferred stock.
Options
As of June 30, 2011, we had options to purchase 9,535,916 shares of our common stock outstanding pursuant to our 2006 Stock Incentive Plan, as amended.
Warrants
As of June 30, 2011, we had thirty-three warrants to purchase 2,691,139 shares of our Series D preferred stock with an exercise price of $3.75 per share. The warrants have a net exercise provision under which the holders in lieu of payment of the exercise price in cash can surrender the warrants and receive a net number of shares of Series D preferred stock based on the fair market value of such stock at the time of exercise of the warrants after deduction of the aggregate exercise price. Unless earlier exercised, thirty-two of these warrants to purchase an aggregate of 1,357,806 of Series D preferred stock will expire on August 31, 2015 and one warrant to purchase 1,333,333 shares of Series D preferred stock will expire thirty days after the closing of a sale of equity or debt offering with aggregate proceeds of at least $20 million, or earlier under certain conditions. After the closing of this offering, these warrants will become exercisable for an aggregate number of shares of common stock determined by multiplying 2,691,139 by the conversion ratio of the Series D preferred stock in effect at the closing of this offering.
As of June 30, 2011, we had two warrants to purchase an aggregate of 210,938 shares of our Series C preferred stock with an exercise price of $6.40 per share. These warrants have a net exercise provision under which the holder in lieu of payment of the exercise price in cash can surrender the warrant and receive a net number of shares of Series C preferred stock based on the fair market value of such stock at the time of exercise of the warrant after deduction of the aggregate exercise price. Unless earlier exercised, these warrants expire on the third anniversary of the closing of this offering, on the completion of certain change of control transactions, or earlier under certain circumstances. After the closing of this offering, this warrant will become exercisable for an aggregate number of shares of common stock determined by multiplying 210,938 by the conversion ratio of the Series C preferred stock in effect at the closing of this offering.
As of June 30, 2011, we had one warrant to purchase an aggregate of 262,173 shares of our Series B preferred stock with an exercise price of $2.67 per share. This warrant has a net exercise provision under which the holder in lieu of payment of the exercise price in cash can surrender the warrant and receive a net number of shares of Series B preferred stock based on the fair market value of such stock at the time of exercise of the warrant after deduction of the aggregate exercise price. Unless earlier exercised, this warrant will expire on the third anniversary of the closing of this offering or earlier under certain circumstances. After the closing of this offering, this warrant will become exercisable for an aggregate number of shares of common stock determined by multiplying 262,173 by the conversion ratio of the Series B preferred stock in effect at the closing of this offering.
As of June 30, 2011, we had one warrant to purchase 162,500 shares of our Series A-1 preferred stock with an exercise price of $1.00 per share. This warrant has a net exercise provision under which the holder in lieu of payment of the exercise price in cash can surrender the warrant and receive a net number of shares of Series A-1 preferred stock based on the fair market value of such stock at the time of exercise of the warrant after deduction of the aggregate exercise price. Unless earlier exercised, this warrant will expire on the third anniversary of the closing of this offering or earlier under certain circumstances. After the closing of this offering, this warrant will become exercisable for an aggregate number of shares of common stock determined by multiplying 162,500 by the conversion ratio of the Series A-1 preferred stock in effect at the closing of this offering.
140
Table of Contents
As of June 30, 2011, we had one warrant to purchase 1,000,000 shares of our common stock with an exercise price of $3.75 per share and two warrants to purchase an aggregate of 659,898 shares of our common stock with an exercise price of $1.97 per share. Each of these warrants has a net exercise provision under which the holder in lieu of payment of the exercise price in cash can surrender the warrant and receive a net number of shares of common stock based on the fair market value of such stock at the time of exercise of the warrant after deduction of the aggregate exercise price. Unless earlier exercised, the warrant to purchase 1,000,000 shares of our common stock will expire on August 31, 2015 and the two warrants to purchase an aggregate of 659,898 shares will have been deemed to have been exercised immediately prior to the effectiveness of the registration statement of which this prospectus is a part. After the closing of this offering, these warrants will become exercisable for an aggregate of 1,659,898 shares of common stock.
Registration Rights
Demand Registration Rights
At any time beginning 180 days after the completion of this offering and ending on August 31, 2013, the holders of at least 30% of the shares having registration rights under our registration rights agreement may request that we file a registration statement under the Securities Act covering the shares of the requesting holders. We will be obligated to use our best efforts to register such shares if they represent at least 20% of the shares resulting from conversion of our preferred stock and if the anticipated aggregate price to the public is at least $5,000,000. We are required to effect no more than two registration statements upon exercise of these demand registration rights. We may postpone the filing of a registration statement for up to three months once in a 12-month period if we furnish to such requesting holders a certificate signed by the president of our company stating that, in the good faith judgment of our board of directors, the filing would be detrimental to us or our stockholders. We may also postpone the filing of a registration statement for up to three months to permit the use of regular audited year-end financial statements, unless the requesting holders agree to bear the costs of any special audit required by the underwriters.
Piggyback Registration Rights
If we register any of our securities for public sale, the stockholders with registration rights will have the right to include their shares in the registration statement. However, this right does not apply to a registration relating to any of our employee benefit plans, the offer and sale of debt securities, or a registration on any registration form that does not include the information required for registration of the shares having piggyback registration rights. The managing underwriter of any underwritten offering will have the right to limit, due to marketing reasons, the number of shares registered by these holders to 25% of the total shares covered by the registration statement, unless the offering is our initial public offering, in which case the selling holders may be further excluded in certain circumstances.
Form S-3 Registration Rights
The holders of shares having registration rights can request that we register all or a portion of their shares on a Form S-3 if we are eligible to file a registration statement on Form S-3 and the aggregate price to the public of the shares offered is at least $2,000,000. We are required to file no more than two registration statements on Form S-3 upon exercise of these rights in any 12-month period. We may postpone the filing of a registration statement on Form S-3 for up to three months once in a 12-month period if we furnish to such requesting holders a certificate signed by the president of our company stating that, in the good faith judgment of our board of directors, the filing would be detrimental to us or our stockholders.
Registration Expenses
We will pay all expenses incurred in connection with exercise of demand, piggyback and Form S-3 registration rights, except for underwriting discounts and commissions. We are also required to bear the
141
Table of Contents
reasonable fees and expenses, not to exceed $25,000 in the case of demand or Form S-3 registration, and $15,000 in the case of piggyback registration, of counsel for the selling stockholders in each such registration.
Expiration of Registration Rights
The registration rights described above will expire, (A) for holders of at least 1,500,000 shares of our preferred stock, who hold an aggregate of 39,140,929 shares of our preferred stock, the earlier of (i) seven (7) years after this offering is completed, and (ii) when such holder no longer holds at least one percent (1%) of our outstanding shares; (B) for other holders, the earlier of (x) five (5) years after this offering is completed and (y) when such holder no longer holds at least one percent (1%) of our outstanding shares; and (C) for certain key holders of our stock identified in our registration rights agreement, who hold an aggregate of 1,800,000 shares of our stock, five (5) years after this offering is completed.
Holders of substantially all of our shares with these registration rights have signed agreements with the underwriters prohibiting the exercise of their registration rights for 180 days, subject to a possible extension of up to 34 additional days beyond the end of such 180-day period, following the date of this prospectus. These agreements are described below under “Underwriting.”
Antitakeover Effects of Delaware Law and Provisions of our Amended and Restated Certificate of Incorporation and Amended and Restated By-laws
Certain provisions of the Delaware General Corporation Law and of our amended and restated certificate of incorporation and amended and restated by-laws that will become effective upon the completion of this offering could have the effect of delaying, deferring or discouraging another party from acquiring control of us. These provisions, which are summarized below, are expected to discourage certain types of coercive takeover practices and inadequate takeover bids and, as a consequence, they might also inhibit temporary fluctuations in the market price of our common stock that often result from actual or rumored hostile takeover attempts. These provisions are also designed in part to encourage anyone seeking to acquire control of us to first negotiate with our board of directors. These provisions might also have the effect of preventing changes in our management. It is possible that these provisions could make it more difficult to accomplish transactions that stockholders might otherwise deem to be in their best interests. However, we believe that the advantages gained by protecting our ability to negotiate with any unsolicited and potentially unfriendly acquirer outweigh the disadvantages of discouraging such proposals, including those priced above the then-current market value of our common stock, because, among other reasons, the negotiation of such proposals could improve their terms.
Delaware Takeover Statute
We are subject to the provisions of Section 203 of the Delaware General Corporation Law. In general, Section 203 prohibits a publicly held Delaware corporation from engaging in a “business combination” with an “interested stockholder” for a three-year period following the time that this stockholder becomes an interested stockholder, unless the business combination is approved in a prescribed manner. A “business combination” includes, among other things, a merger, asset or stock sale or other transaction resulting in a financial benefit to the interested stockholder. An “interested stockholder” is a person who, together with affiliates and associates, owns, or did own within three years prior to the time of determination of interested stockholder status, 15% or more of the corporation’s outstanding voting stock. Under Section 203, a business combination between a corporation and an interested stockholder is prohibited unless it satisfies one of the following conditions:
| • | before the time the stockholder became interested, the board of directors approved either the business combination or the transaction which resulted in the stockholder becoming an interested stockholder; |
| • | upon consummation of the transaction which resulted in the stockholder becoming an interested stockholder, the interested stockholder owned at least 85% of the voting stock of the corporation outstanding at the time the transaction commenced, excluding for purposes of determining the voting |
142
Table of Contents
| stock outstanding, shares owned by persons who are directors and also officers, and employee stock plans, in some instances; or |
| • | at or after the time the stockholder became interested, the business combination was approved by the board of directors of the corporation and authorized at an annual or special meeting of the stockholders by the affirmative vote of at least two-thirds of the outstanding voting stock which is not owned by the interested stockholder. |
Provisions of Our Amended and Restated Certificate of Incorporation and Amended and Restated By-laws
Our amended and restated certificate of incorporation and amended and restated by-laws to be in effect upon completion of this offering will include a number of provisions that may have the effect of delaying, deferring or discouraging another party from acquiring control of us and encouraging persons considering unsolicited tender offers or other unilateral takeover proposals to negotiate with our board of directors rather than pursue non-negotiated takeover attempts. These provisions include the items described below.
Board composition and filling vacancies. In accordance with our amended and restated certificate of incorporation, our board is divided into three classes serving staggered three-year terms, with one class being elected each year. Our amended and restated certificate of incorporation also provides that directors may be removed only for cause and then only by the affirmative vote of the holders of 75% or more of the shares then entitled to vote at an election of directors. Furthermore, any vacancy on our board of directors, however occurring, including a vacancy resulting from an increase in the size of our board, may only be filled by the affirmative vote of a majority of our directors then in office even if less than a quorum.
No written consent of stockholders. Our amended and restated certificate of incorporation provides that all stockholder actions are required to be taken by a vote of the stockholders at an annual or special meeting, and that stockholders may not take any action by written consent in lieu of a meeting. This limit may lengthen the amount of time required to take stockholder actions and would prevent the amendment of our by-laws or removal of directors by our stockholder without holding a meeting of stockholders.
Meetings of stockholders. Our amended and restated by-laws provide that only a majority of the members of our board of directors then in office may call special meetings of stockholders and only those matters set forth in the notice of the special meeting may be considered or acted upon at a special meeting of stockholders. Our amended and restated by-laws limit the business that may be conducted at an annual meeting of stockholders to those matters properly brought before the meeting.
Advance notice requirements. Our amended and restated by-laws establish advance notice procedures with regard to stockholder proposals relating to the nomination of candidates for election as directors or new business to be brought before meetings of our stockholders. These procedures provide that notice of stockholder proposals must be timely given in writing to our corporate secretary prior to the meeting at which the action is to be taken. Generally, to be timely, notice must be received at our principal executive offices not less than 90 days or more than 120 days prior to the first anniversary date of the annual meeting for the preceding year. The notice must contain certain information specified in our amended and restated by-laws.
Adjournment of stockholders’ meetings. Our amended and restated by-laws give the presiding officer at the stockholders’ meeting the authority to reschedule or adjourn such meeting if: (i) no quorum is present for the transaction of business; (ii) the board determines that an adjournment is necessary or appropriate to enable the stockholders to consider fully information which the board determines has not been made sufficiently or timely available to stockholders; or (iii) the board determines that adjournment is otherwise in the best interests of the company. This limit may lengthen the amount of time required to take stockholder actions.
143
Table of Contents
Amendment to certificate of incorporation and by-laws. As required by the Delaware General Corporation Law, any amendment of our amended and restated certificate of incorporation must first be approved by a majority of our board of directors, and if required by law or our amended and restated certificate of incorporation, must thereafter be approved by a majority of the outstanding shares entitled to vote on the amendment, and a majority of the outstanding shares of each class entitled to vote thereon as a class, except that the amendment of the provisions relating to stockholder action, directors, limitation of liability and the amendment of our amended and restated certificate of incorporation or our amended and restated by-laws must be approved by not less than 75% of the outstanding shares entitled to vote on the amendment, and not less than 75% of the outstanding shares of each class entitled to vote thereon as a class. Our amended and restated by-laws may be amended by the affirmative vote of a majority vote of the directors then in office, subject to any limitations set forth in the by-laws; and may also be amended by the affirmative vote of at least 75% of the outstanding shares entitled to vote on the amendment, or, if the board of directors recommends that the stockholders approve the amendment, by the affirmative vote of the majority of the outstanding shares entitled to vote on the amendment, in each case voting together as a single class.
Undesignated preferred stock. Our amended and restated certificate of incorporation provides for authorized shares of preferred stock. The existence of authorized but unissued shares of preferred stock may enable our board of directors to render more difficult or to discourage an attempt to obtain control of us by means of a merger, tender offer, proxy contest or otherwise. For example, if in the due exercise of its fiduciary obligations, our board of directors were to determine that a takeover proposal is not in the best interests of us or our stockholders, our board of directors could cause shares of preferred stock to be issued without stockholder approval in one or more private offerings or other transactions that might dilute the voting or other rights of the proposed acquirer or insurgent stockholder or stockholder group. In this regard, our amended and restated certificate of incorporation grants our board of directors broad power to establish the rights and preferences of authorized and unissued shares of preferred stock. The issuance of shares of preferred stock could decrease the amount of earnings and assets available for distribution to holders of shares of common stock. The issuance may also adversely affect the rights and powers, including voting rights, of these holders and may have the effect of delaying, deterring or preventing a change in control of us.
Transfer Agent and Registrar
We intend for the transfer agent and registrar for our common stock to be .
Listing
We have not yet applied to list our common stock on a stock exchange under any symbol.
144
Table of Contents
SHARES ELIGIBLE FOR FUTURE SALE
Prior to this offering, there has been no public market for our common stock. Future sales of our common stock in the public market, or the availability of such shares for sale in the public market, could adversely affect market prices prevailing from time to time. As described below, only a limited number of shares will be available for sale shortly after this offering due to contractual and legal restrictions on resale. Nevertheless, sales of our common stock in the public market after such restrictions lapse, or the perception that those sales may occur, could adversely affect the prevailing market price at such time and our ability to raise equity capital in the future.
Upon the completion of this offering, a total of shares of our common stock will be outstanding, based on the number of shares outstanding at 2011, assuming no exercise of options or warrants after 2011, and the issuance of shares of common stock in this offering at $ per share. All of the shares sold in this offering will be freely tradable. The remaining shares of common stock outstanding after this offering will be restricted as a result of securities laws or lock-up agreements as described below. Following the expiration of the lock-up period, all shares will be eligible for resale in compliance with Rule 144 or Rule 701 under the Securities Act of 1933, as amended, or the Securities Act. “Restricted securities” as defined under Rule 144 of the Securities Act were issued and sold by us in reliance on exemptions from the registration requirements of the Securities Act. These shares may be sold in the public market only if registered or pursuant to an exemption from registration, such as Rule 144 or Rule 701 under the Securities Act.
Rule 144
In general, under Rule 144 under the Securities Act, as in effect on the date of this prospectus, a person who is one of our affiliates and has beneficially owned shares of our common stock for at least six months would be entitled to sell within any three-month period a number of shares that does not exceed the greater of:
| • | one percent of the number of shares of common stock then outstanding, which will equal approximately shares immediately after the completion of this offering; or |
| • | the average weekly trading volume of our common stock on the during the four calendar weeks preceding the filing of a notice on Form 144 with respect to the sale. |
Sales under Rule 144 by our affiliates or persons selling shares on behalf of our affiliates are also subject to manner of sale provisions and notice requirements and to the availability of current public information about us.
In general, under Rule 144 under the Securities Act, as in effect on the date of this prospectus, a person who is not deemed to have been one of our affiliates at any time during the 90 days preceding a sale, and who has beneficially owned the shares proposed to be sold for at least six months, including the holding period of any prior owner other than an affiliate, is entitled to sell the shares without complying with the manner of sale, volume limitation or notice provisions of Rule 144, and will be subject only to the public information requirements of Rule 144. If such a person has beneficially owned the shares proposed to be sold for at least one year, including the holding period of any prior owner other than our affiliates, then such person is entitled to sell such shares without complying with any of the requirements of Rule 144. As of , 2011, shares of our common stock would qualify for resale under Rule 144 within 180 days of the date of this prospectus, subject to the lock-up agreements as described under “— Lock-up Agreements” below and under “Underwriting” in this prospectus, and to the extent such shares have been released from any repurchase option that we may hold.
Rule 701
Rule 701 under the Securities Act, or Rule 701, as in effect on the date of this prospectus, permits resales of shares in reliance upon Rule 144 but without compliance with certain restrictions of Rule 144, including the holding period requirement. Most of our employees, executive officers or directors who purchased shares under a written compensatory plan or contract may be entitled to rely on the resale provisions of Rule 701, but all holders
145
Table of Contents
of Rule 701 shares are required to wait until 90 days after the date of this prospectus before selling their shares. However, substantially all Rule 701 shares are subject to lock-up agreements as described below and under “Underwriting” in this prospectus and will become eligible for sale upon the expiration of the restrictions set forth in those agreements.
Lock-Up Agreements
In connection with this offering, we and each of our directors and officers and holders of substantially all of our outstanding stock have agreed that, subject to certain exceptions, without the prior written consent of Morgan Stanley & Co. LLC, UBS Securities LLC and Credit Suisse Securities (USA) LLC on behalf of the underwriters, we and they will not, during the period ending 180 days after the date of this prospectus (as such period may be extended under certain circumstances), offer, pledge, sell, contract to sell, sell any option or contract to purchase, purchase any option or contract to sell, grant any option, right or warrant to purchase, lend, or otherwise transfer or dispose of directly or indirectly, any shares of common stock or any securities convertible into, or exercisable or exchangeable for, common stock, or enter into any swap or other arrangement that transfers to another, in whole or in part, any of the economic consequences of ownership of the common stock, whether any such transaction is to be settled by delivery of our common stock or such other securities, in cash or otherwise. These restrictions are subject to certain exceptions, as described in more detail under the section entitled “Underwriting” in this prospectus.
Registration Rights
Upon the completion of this offering, the holders of an aggregate of shares of our common stock and the holders of warrants to purchase an aggregate of shares of our common stock, or their permitted transferees, will be entitled to rights with respect to the registration of these shares under the Securities Act. Registration of these shares under the Securities Act would result in these shares becoming fully tradable without restriction under the Securities Act immediately upon the effectiveness of the registration, except for shares purchased by affiliates. See the section entitled “Description of Capital Stock—Registration Rights” for additional information.
Stock Plans
As soon as practicable after the completion of this offering, we intend to file a Form S-8 registration statement under the Securities Act to register shares of our common stock subject to options outstanding or reserved for issuance under our stock plans. This registration statement will become effective immediately upon filing, and shares covered by this registration statement will thereupon be eligible for sale in the public markets, subject to Rule 144 limitations applicable to affiliates and any lock-up agreements. For a more complete discussion of our stock plans, see the section entitled “Compensation Discussion and Analysis—Benefits.”
146
Table of Contents
MATERIAL UNITED STATES FEDERAL TAX CONSIDERATIONS FOR NON-U.S. HOLDERS OF COMMON STOCK
This section summarizes certain material United States federal income and estate tax considerations relating to the ownership and disposition of common stock. This summary does not provide a complete analysis of all potential tax considerations. The information provided below is based upon provisions of the Internal Revenue Code of 1986, as amended, or the Code, and Treasury regulations promulgated thereunder, administrative rulings and judicial decisions currently in effect. These authorities may change at any time, possibly on a retroactive basis, or the Internal Revenue Service, or IRS, might interpret the existing authorities differently. In either case, the tax considerations of owning or disposing of common stock could differ from those described below. For purposes of this summary, a “non-U.S. holder” is any holder other than:
| • | an individual who is a citizen or resident of the United States; |
| • | a corporation, or other entity taxable as a corporation for United States federal income tax purposes, created or organized under the laws of the United States, any state thereof or the District of Columbia; |
| • | a trust that (1) is subject to the primary supervision of a United States court and one of more United States persons have authority to control all substantial decisions of the trust or (2) has a valid election in effect under applicable United States Treasury regulations to be treated as a United States person; or |
| • | an estate the income of which is subject to United States income tax regardless of source. |
If a partnership or other pass-through entity is a beneficial owner of common stock, the tax treatment of a partner in the partnership or an owner of the entity will depend upon the status of the partner or other owner and the activities of the partnership or other entity. Any partner in a partnership or member in a pass-through entity holding shares of our common stock should consult its own tax advisor.
This discussion assumes that a non-U.S. holder will hold our common stock as a capital asset (generally, property held for investment). This summary generally does not address tax considerations that may be relevant to particular investors because of their specific circumstances, or because they are subject to special rules, including if the investor is a United States expatriate, “controlled foreign corporation,” “passive foreign investment company,” corporation that accumulates earnings to avoid United States federal income tax, dealer in securities or currencies, financial institution, regulated investment company, real estate investment trust, tax-exempt entity, insurance company, person holding our common stock as part of a hedging, integrated, conversion or constructive sale transaction or a straddle, trader in securities that elects to use a mark-to-market method of accounting, person liable for the alternative minimum tax, and partnerships or other pass-through entities (and their owners). Finally, this summary does not describe the effects of any applicable foreign, state or local laws, or, except to the extent discussed below, the effects of any applicable gift or estate tax laws.
INVESTORS CONSIDERING THE PURCHASE OF COMMON STOCK SHOULD CONSULT THEIR OWN TAX ADVISORS REGARDING THE APPLICATION OF THE UNITED STATES FEDERAL INCOME AND ESTATE TAX LAWS TO THEIR PARTICULAR SITUATIONS AND THE CONSEQUENCES OF FOREIGN, STATE OR LOCAL LAWS, AND TAX TREATIES.
Dividends
We do not expect to declare or pay any distributions on our common stock in the foreseeable future. If we do make any distributions on shares of our common stock, however, such distributions will constitute dividends for United States federal income tax purposes to the extent paid from our current or accumulated earnings and profits, as determined under United States federal income tax principles. Distributions in excess of our current and accumulated earnings and profits will constitute a return of capital that is applied against and reduces, but not below zero, a non-U.S. holder’s adjusted tax basis in shares of our common stock. Any remaining excess will be treated as gain realized on the sale or other disposition of our common stock. See “—Sale of Common Stock.”
147
Table of Contents
Any dividend paid to a non-U.S. holder on our common stock will generally be subject to United States withholding tax at a 30% rate. The withholding tax might not apply, however, or might apply at a reduced rate, under the terms of an applicable income tax treaty between the United States and the non-U.S. holder’s country of residence. You should consult your tax advisors regarding your entitlement to benefits under a relevant income tax treaty. Generally, in order for us or our paying agent to withhold tax at a lower treaty rate, a non-U.S. holder must certify its entitlement to treaty benefits. A non-U.S. holder generally can meet this certification requirement by providing an IRS Form W-8BEN (or any successor form) or appropriate substitute form to us or our paying agent. If the holder holds the stock through a financial institution or other agent acting on the holder’s behalf, the holder will be required to provide appropriate documentation to the agent. The holder’s agent will then be required to provide certification to us or our paying agent, either directly or through other intermediaries. If you are eligible for a reduced rate of United States federal withholding tax under an income tax treaty, you may obtain a refund or credit of any excess amounts withheld by filing an appropriate claim for a refund with the IRS in a timely manner.
Dividends received by a non-U.S. holder that are effectively connected with a U.S. trade or business conducted by the non-U.S. holder, or, if an income tax treaty between the United States and the non-U.S. holder’s country of residence applies, are attributable to a permanent establishment or a fixed base, in the case of an individual, the non-U.S. holder maintains in the United States, are not subject to such withholding tax. To obtain this exemption, a non-U.S. holder must provide us with an IRS Form W-8ECI properly certifying such exemption. Such effectively connected dividends, although not subject to withholding tax, are taxed at the same graduated rates applicable to U.S. persons, net of certain deductions and credits, subject to any applicable tax treaty providing otherwise. In addition to the graduated tax described above, dividends received by corporate non-U.S. holders that are effectively connected with a U.S. trade or business of the corporate non-U.S. holder may also be subject to a branch profits tax at a rate of 30% or such lower rate as may be specified by an applicable tax treaty.
Sale of Common Stock
Non-U.S. holders will generally not be subject to United States federal income tax on any gains realized on the sale, exchange or other disposition of common stock unless:
| • | the gain (1) is effectively connected with the conduct by the non-U.S. holder of a United States trade or business and (2) if an income tax treaty between the United States and the non-U.S. holder’s country of residence applies, the gain is attributable to a permanent establishment (or, in the case of an individual, a fixed base) maintained by the non-U.S. holder in the United States (in which case the special rules described below apply); |
| • | the non-U.S. holder is an individual who is present in the United States for 183 days or more in the taxable year of the sale, exchange or other disposition of our common stock, and certain other requirements are met (in which case the gain would be subject to a flat 30% tax, or such reduced rate as may be specified by an applicable income tax treaty, which may be offset by United States source capital losses, even though the individual is not considered a resident of the United States); or |
| • | the rules of the Foreign Investment in Real Property Tax Act, or FIRPTA, treat the gain as effectively connected with a United States trade or business. |
The FIRPTA rules may apply to a sale, exchange or other disposition of common stock if we are, or were within the shorter of the five-year period preceding the disposition and the non-U.S. holder’s holding period, a “U.S. real property holding corporation,” or USRPHC. In general, we would be a USRPHC if interests in United States real estate comprised at least half of our assets. We do not believe that we are a USRPHC and we do not anticipate becoming one in the future. Even if we become a USRPHC, as long as our common stock is regularly traded on an established securities market, such common stock will be treated as United States real property interests only if a non-U.S. holder actually or constructively owns more than 5% of our outstanding common stock.
148
Table of Contents
If any gain from the sale, exchange or other disposition of common stock, (1) is effectively connected with a United States trade or business conducted by a non-U.S. holder and (2) if an income tax treaty between the United States and the non-U.S. holder’s country of residence so provides, is attributable to a permanent establishment (or, in the case of an individual, a fixed base) maintained by such non-U.S. holder in the United States, then the gain generally will be subject to United States federal income tax at the regular graduated rates. If the non-U.S. holder is a corporation, under certain circumstances, that portion of its earnings and profits that is effectively connected with its United States trade or business, subject to certain adjustments, generally would be subject to a “branch profits tax.” The branch profits tax rate is generally 30%, although an applicable income tax treaty between the United States and the non-U.S. holder’s country of residence might provide for a lower rate.
Legislation Affecting Certain Non-U.S. Holders
Legislation enacted in 2010 generally imposes withholding at a rate of 30% on payments to certain foreign entities of dividends on and the gross proceeds of dispositions of U.S. common stock, unless various U.S. information reporting and due diligence requirements (generally relating to ownership by U.S. persons of interests in or accounts with those entities) have been satisfied. Pursuant to published guidance from the IRS and the U.S. Treasury Department, this legislation generally applies to payments of dividends made after December 31, 2013 and payments of gross proceeds made after December 31, 2014. Non-U.S. holders should consult their tax advisors regarding the possible implications of this legislation on their investment in our common stock.
United States Federal Estate Tax
The estates of nonresident alien individuals generally are subject to United States federal estate tax on property with a United States situs. Because we are a United States corporation, our common stock will be United States situs property and therefore will be included in the taxable estate of a nonresident alien decedent, unless an applicable tax treaty between the United States and the decedent’s country of residence provides otherwise.
Backup Withholding and Information Reporting
We must report to a non-U.S. holder and the IRS the amount of dividends paid during each calendar year, if any, and the amount of any tax withheld. These information reporting requirements apply even if no withholding was required because the distributions were effectively connected with the non-U.S. holder’s conduct of a U.S. trade or business, or withholding was reduced or eliminated by an applicable income tax treaty. This information also may be made available under a specific treaty or agreement with the tax authorities in the country in which the non-U.S. holder resides or is established. Backup withholding, however, generally will not apply to distributions to a non-U.S. holder of shares of our common stock provided the non-U.S. holder furnishes to us or our paying agent the required certification as to its non-U.S. status, such as by providing a valid IRS Form W-8BEN or IRS Form W-8ECI, or certain other requirements are met. Notwithstanding the foregoing, backup withholding may apply if either we or our paying agent has actual knowledge, or reason to know, that the non-U.S. holder is a U.S. person as defined under the Code that is not an exempt recipient.
The payment of proceeds from the disposition of shares of our common stock by a non-U.S. holder made to or through a U.S. office of a broker generally will be subject to information reporting and backup withholding unless the non-U.S. holder furnishes to the broker the required certification as to its non-U.S. status, such as by providing the forms referenced above (and the broker does not have actual knowledge, or reason to know, that the holder is a U.S. person) and certain other conditions are met, or the non-U.S. holder otherwise establishes an exemption. Effective January 1, 2011, brokers required to file such information returns with respect to stock in a corporation acquired on or after January 1, 2011 must also report (1) each customer’s adjusted basis (computed in accordance with rules formulated for this reporting requirement) and (2) whether any gain or loss realized is long-term or short-term. The payment of proceeds from the disposition of shares of our common stock by a
149
Table of Contents
non-U.S. holder made to or through a non-U.S. office of a broker generally will not be subject to backup withholding or information reporting. Information reporting, but not backup withholding, will apply to a payment of proceeds, even if that payment is made outside of the United States, if a non-U.S. holder sells our common stock through a non-U.S. office of a broker with certain connections to the United States, unless the non-U.S. holder furnishes to the broker the required certification as to its non-U.S. status as described above and certain other conditions are satisfied, or the non-U.S. holder otherwise establishes an exemption (and the broker has no actual knowledge or reason to know to the contrary).
Backup withholding is not an additional tax and may be refunded to the extent it results in an overpayment of tax and appropriate information is timely supplied to the IRS.
THE PRECEDING DISCUSSION OF UNITED STATES FEDERAL TAX CONSIDERATIONS IS FOR GENERAL INFORMATION ONLY. IT IS NOT TAX ADVICE. EACH PROSPECTIVE INVESTOR SHOULD CONSULT ITS OWN TAX ADVISOR REGARDING THE PARTICULAR UNITED STATES FEDERAL, STATE, LOCAL AND FOREIGN TAX CONSEQUENCES OF PURCHASING, HOLDING AND DISPOSING OF OUR COMMON STOCK, INCLUDING THE CONSEQUENCES OF ANY PROPOSED CHANGE IN APPLICABLE LAWS.
150
Table of Contents
Under the terms and subject to the conditions in an underwriting agreement dated the date of this prospectus, the underwriters named below, for whom Morgan Stanley & Co. LLC, UBS Securities LLC and Credit Suisse Securities (USA) LLC are acting as representatives, have severally agreed to purchase, and we have agreed to sell to them, severally, the number of shares indicated below:
| Name |
Number of Shares | |
| Morgan Stanley & Co. LLC |
||
| UBS Securities LLC |
||
| Credit Suisse Securities (USA) LLC |
||
| Robert W. Baird & Co. Incorporated |
||
| Canaccord Genuity Inc. |
||
|
| ||
| Total |
||
|
|
The underwriters and the representatives are collectively referred to as the “underwriters” and the “representatives,” respectively. The underwriters are offering the shares of common stock subject to their acceptance of the shares from us and subject to prior sale. The underwriting agreement provides that the obligations of the several underwriters to pay for and accept delivery of the shares of common stock offered by this prospectus are subject to the approval of certain legal matters by their counsel and to certain other conditions. The underwriters are obligated to take and pay for all of the shares of common stock offered by this prospectus if any such shares are taken. However, the underwriters are not required to take or pay for the shares covered by the underwriters’ option to purchase additional shares described below.
The underwriters initially propose to offer part of the shares of common stock directly to the public at the offering price listed on the cover page of this prospectus and part to certain dealers at a price that represents a concession not in excess of $ per share. After the initial offering of the shares of common stock, the offering price and other selling terms may from time to time be varied by the representative.
We have granted to the underwriters an option, exercisable for 30 days from the date of this prospectus, to purchase up to additional shares of common stock at the public offering price listed on the cover page of this prospectus, less underwriting discounts and commissions. To the extent the option is exercised, each underwriter will become obligated, subject to certain conditions, to purchase about the same percentage of the additional shares of common stock as the number listed next to the underwriter’s name in the preceding table bears to the total number of shares of common stock listed next to the names of all underwriters in the preceding table.
The following table shows the per share and total public offering price, underwriting discounts and commissions, and proceeds before expenses to us. These amounts are shown assuming both no exercise and full exercise of the underwriters’ option to purchase up to additional shares of common stock.
|
|
Total | |||||
| Per Share | No Exercise | Full Exercise | ||||
| Public offering price |
$ | $ | $ | |||
| Underwriting discounts and commissions |
$ | $ | $ | |||
| Proceeds, before expenses |
$ | $ | $ | |||
The estimated offering expenses payable by us, exclusive of the underwriting discounts and commissions, are approximately $ .
The underwriters have informed us that they do not intend sales to discretionary accounts to exceed 5% of the total number of shares of common stock offered by them.
151
Table of Contents
We have applied to list our common stock on the under the symbol “ ”.
We and all directors and officers and the holders of all of our outstanding stock and stock options have agreed that, without the prior written consent of the representatives on behalf of the underwriters, we and they will not, during the period ending 180 days after the date of this prospectus (the “restricted period”):
| • | offer, pledge, sell, contract to sell, sell any option or contract to purchase, purchase any option or contract to sell, grant any option, right or warrant to purchase, lend, or otherwise transfer or dispose of, directly or indirectly, any shares of common stock or any securities convertible into or exercisable or exchangeable for shares of common stock; |
| • | enter into any swap or other arrangement that transfers to another, in whole or in part, any of the economic consequences of ownership of the common stock; or |
| • | file any registration statement with the Securities and Exchange Commission relating to the offering of any shares of common stock or any securities convertible into or exercisable or exchangeable for common stock, whether any such transaction described in the first two bullet points above is to be settled by delivery of common stock or such other securities, in cash or otherwise. In addition, we and each such person agrees that, without the prior written consent of the representatives on behalf of the underwriters, it will not, during the restricted period, make any demand for, or exercise any right with respect to, the registration of any shares of common stock or any security convertible into or exercisable or exchangeable for common stock. |
The restrictions described above (the “lock-up restrictions”) do not apply to the sale of shares in this offering and are subject to certain other exceptions.
The restricted period will be extended if:
| • | during the last 17 days of the restricted period we issue an earnings release or material news or a material event relating to us occurs, or |
| • | prior to the expiration of the restricted period, we announce that we will release earnings results during the 16-day period beginning on the last day of the restricted period or provide notification to the representatives of any earnings release or material news or material event that may give rise to an extension of the initial restricted period, in which case the restrictions described in the immediately preceding paragraph will continue to apply until the expiration of the 18-day period beginning on the issuance of the earnings release or the occurrence of the material news or material event. |
The representatives, in their sole discretion, may release the common stock and other securities subject to the lock-up agreements described above in whole or in part at any time with or without notice. When determining whether or not to release common stock and other securities from lock-up agreements, the representatives will consider, among other factors, the holder’s reasons for requesting the release, the number of shares of common stock and other securities for which the release is being requested and market conditions at the time. At least two business days before the effectiveness of any written consent of the representatives during the restricted period, (1) the representatives will notify the Company of the impending release or waiver of any restriction and (2) the Company has agreed to announce the impending release or waiver by press release through a major news service at least two business days before the effective date of the release or waiver, except where the release or waiver is effected solely to permit a transfer of common stock that is not for consideration and where the transferee has agreed in writing to be bound by the terms of this agreement.
In order to facilitate the offering of the common stock, the underwriters may engage in transactions that stabilize, maintain or otherwise affect the price of the common stock. Specifically, the underwriters may sell more shares than they are obligated to purchase under the underwriting agreement, creating a short position. A short sale is covered if the short position is no greater than the number of shares available for purchase by the underwriters under the option to purchase additional shares of common stock. The underwriters can close out a
152
Table of Contents
covered short sale by exercising the option to purchase additional shares of common stock or purchasing shares in the open market. In determining the source of shares to close out a covered short sale, the underwriters will consider, among other things, the open market price of shares compared to the price available under the option to purchase additional shares of common stock. The underwriters may also sell shares in excess of the option to purchase additional shares of common stock, creating a naked short position. The underwriters must close out any naked short position by purchasing shares in the open market. A naked short position is more likely to be created if the underwriters are concerned that there may be downward pressure on the price of the common stock in the open market after pricing that could adversely affect investors who purchase in this offering. As an additional means of facilitating the offering, the underwriters may bid for, and purchase, shares of common stock in the open market to stabilize the price of the common stock. These activities may raise or maintain the market price of the common stock above independent market levels or prevent or retard a decline in the market price of the common stock. The underwriters are not required to engage in these activities and may end any of these activities at any time.
In connection with this offering, the underwriters may engage in passive market making transactions in the common stock on the in accordance with Rule 103 of Regulation M under the Securities Exchange Act of 1934, as amended, during the period before the commencement of offers or sales of common stock and extending through the completion of distribution. A passive market maker must display its bids at a price not in excess of the highest independent bid of the common stock. However, if all independent bids are lowered below the passive market maker’s bid, that bid must be lowered when specified purchase limits are exceeded. From time to time, certain of the underwriters have provided, and continue to provide, investment banking services to the Company.
The estimated offering expenses payable by us, in addition to the underwriting discounts and commissions, are approximately $ million, which includes legal, accounting and printing costs and various other fees associated with registering and listing our common stock.
We and the underwriters have agreed to indemnify each other against certain liabilities, including liabilities under the Securities Act.
A prospectus in electronic format may be made available on websites maintained by one or more underwriters, or selling group members, if any, participating in this offering. The representative may agree to allocate a number of shares of common stock to underwriters for sale to their online brokerage account holders. Internet distributions will be allocated by the representative to underwriters that may make Internet distributions on the same basis as other allocations.
Pricing of the Offering
Prior to this offering, there has been no public market for our common stock. The initial public offering price was determined by negotiations between us and the representatives. Among the factors considered in determining the initial public offering price were our future prospects and those of our industry in general, our sales, earnings and certain other financial and operating information in recent periods, and the price-earnings ratios, price-sales ratios, market prices of securities, and certain financial and operating information of companies engaged in activities similar to ours.
153
Table of Contents
Selling Restrictions
European Economic Area
In relation to each Member State of the European Economic Area which has implemented the Prospectus Directive (each, a “Relevant Member State”) an offer to the public of any shares of our common stock may not be made in that Relevant Member State, except that an offer to the public in that Relevant Member State of any shares of our common stock may be made at any time under the following exemptions under the Prospectus Directive (as defined below), if they have been implemented in that Relevant Member State:
| (a) | to any legal entity which is a qualified investor as defined in the Prospectus Directive; |
| (b) | to fewer than 100 or, if the Relevant Member State has implemented the relevant provision of the 2010 PD Amending Directive, 150, natural or legal persons (other than qualified investors as defined in the Prospectus Directive), as permitted under the Prospectus Directive, subject to obtaining the prior consent of the representatives for any such offer; or |
| (c) | in any other circumstances falling within Article 3(2) of the Prospectus Directive, provided that no such offer of shares of our common stock shall result in a requirement for the publication by us or any underwriter of a prospectus pursuant to Article 3 of the Prospectus Directive. |
For the purposes of this provision, the expression an “offer to the public” in relation to any shares of our common stock in any Relevant Member State means the communication in any form and by any means of sufficient information on the terms of the offer and any shares of our common stock to be offered so as to enable an investor to decide to purchase any shares of our common stock, as the same may be varied in that Member State by any measure implementing the Prospectus Directive in that Member State, the expression “Prospectus Directive” means Directive 2003/71/EC (and amendments thereto, including the 2010 PD Amending Directive, to the extent implemented in the Relevant Member State), and includes any relevant implementing measure in the Relevant Member State, and the expression “2010 PD Amending Directive” means Directive 2010/73/EU.
United Kingdom
Each underwriter has represented and agreed that:
| (a) | it has only communicated or caused to be communicated and will only communicate or cause to be communicated an invitation or inducement to engage in investment activity (within the meaning of Section 21 of the FSMA) received by it in connection with the issue or sale of the shares of our common stock in circumstances in which Section 21(1) of the FSMA does not apply to us; and |
| (b) | it has complied and will comply with all applicable provisions of the FSMA with respect to anything done by it in relation to the shares of our common stock in, from or otherwise involving the United Kingdom. |
154
Table of Contents
The validity of the common stock offered hereby will be passed upon for us by Goodwin Procter LLP, Boston, Massachusetts. Davis Polk & Wardwell LLP, New York, New York, is acting as counsel to the underwriters in connection with certain legal matters relating to the common stock being offered by this prospectus.
The consolidated financial statements as of December 31, 2009 and 2010, and for each of the three years in the period ended December 31, 2010, included in this prospectus, have been audited by Deloitte & Touche LLP, an independent registered public accounting firm, as stated in their report appearing herein and elsewhere in the registration statement. Such consolidated financial statements have been so included in reliance upon the report of such firm given upon their authority as experts in accounting and auditing.
WHERE YOU CAN FIND MORE INFORMATION
We have filed with the Securities and Exchange Commission, or the SEC, a registration statement on Form S-1 under the Securities Act that registers the shares of our common stock to be sold in this offering. This prospectus does not contain all of the information set forth in the registration statement and the exhibits and schedules filed as part of the registration statement. For further information with respect to us and our common stock, we refer you to the registration statement and the exhibits and schedules filed as a part of the registration statement. Statements contained in this prospectus concerning the contents of any contract or any other document are not necessarily complete. If a contract or document has been filed as an exhibit to the registration statement, we refer you to the copy of the contract or document that has been filed. Each statement in this prospectus relating to a contract or document filed as an exhibit is qualified in all respects by the filed exhibit. The reports and other information we file with the SEC can be read and copied at the SEC’s Public Reference Room at 100 F Street, N.E., Washington D.C. 20549. Copies of these materials can be obtained at prescribed rates from the Public Reference Section of the SEC at the principal offices of the SEC, 100 F Street, NE, Washington D.C. 20549. You may obtain information regarding the operation of the public reference room by calling 1-800-SEC-0330. The SEC also maintains a web site (http://www.sec.gov) that contains reports, proxy and information statements and other information regarding issuers like us that file electronically with the SEC.
Upon completion of this offering, we will become subject to the reporting and information requirements of the Exchange Act and, as a result, will file periodic reports, proxy statements and other information with the SEC. These periodic reports, proxy statements and other information will be available for inspection and copying at the SEC’s public reference room and the web site of the SEC referred to above. Our website on the Internet is located at http://www.mascoma.com, and we expect to make our periodic reports and other information filed with or furnished to the SEC available, free of charge, through our website, as soon as reasonably practicable after those reports and other information are electronically filed with or furnished to the SEC. Information on or accessible through website is not incorporated by reference into this prospectus and does not constitute a part of this prospectus.
155
Table of Contents
MASCOMA CORPORATION
INDEX TO CONSOLIDATED FINANCIAL STATEMENTS
| Condensed Consolidated Financial Statements |
||||
| F-2 | ||||
| Consolidated Balance Sheets as of December 31, 2009 and 2010 |
F-3 | |||
| Consolidated Statements of Operations for the Years Ended December 2008, 2009 and 2010 |
F-4 | |||
| F-5 | ||||
| Consolidated Statements of Cash Flows for the Years Ended December 31, 2008, 2009 and 2010 |
F-6 | |||
| F-7 | ||||
| Unaudited Interim Condensed Consolidated Financial Statements |
||||
| F-33 | ||||
| F-34 | ||||
| F-35 | ||||
| F-36 | ||||
| F-37 | ||||
| Consolidated Financial Statements—SunOpta Bioprocess Inc. |
||||
| F-47 | ||||
| F-48 | ||||
| Consolidated Balance Sheets as of December 31, 2008 and 2009 |
F-49 | |||
| F-50 | ||||
| Consolidated Statements of Cash Flows for the years ended December 31, 2008 and 2009 |
F-51 | |||
| Unaudited Interim Condensed Consolidated Financial Statements—SunOpta Bioprocess, Inc. |
||||
| F-68 | ||||
| Condensed Consolidated Balance Sheets as of December 31, 2009 and June 30, 2010 |
F-69 | |||
| F-70 | ||||
| F-71 | ||||
| F-72 | ||||
| Unaudited Pro Forma Combined Statement of Operations for the year ended December 31, 2010 |
F-78 | |||
F-1
Table of Contents
REPORT OF INDEPENDENT REGISTERED PUBLIC ACCOUNTING FIRM
To the Board of Directors and Stockholders of
Mascoma Corporation
Boston, Massachusetts
We have audited the accompanying consolidated balance sheets of Mascoma Corporation and subsidiaries (the “Company”) as of December 31, 2009 and 2010, and the related consolidated statements of operations, stockholders’ deficit, and cash flows for each of the three years in the period ended December 31, 2010. These financial statements are the responsibility of the Company’s management. Our responsibility is to express an opinion on these financial statements based on our audits.
We conducted our audits in accordance with the standards of the Public Company Accounting Oversight Board (United States). Those standards require that we plan and perform the audit to obtain reasonable assurance about whether the financial statements are free of material misstatement. The Company is not required to have, nor were we engaged to perform, an audit of its internal control over financial reporting. Our audits included consideration of internal control over financial reporting as a basis for designing audit procedures that are appropriate in the circumstances, but not for the purpose of expressing an opinion on the effectiveness of the Company’s internal control over financial reporting. Accordingly, we express no such opinion. An audit also includes examining, on a test basis, evidence supporting the amounts and disclosures in the financial statements, assessing the accounting principles used and significant estimates made by management, as well as evaluating the overall financial statement presentation. We believe that our audits provide a reasonable basis for our opinion.
In our opinion, such consolidated financial statements present fairly, in all material respects, the financial position of the Company at December 31, 2009 and 2010, and the results of its operations, and its cash flows for each of the three years in the period ended December 31, 2010, in conformity with accounting principles generally accepted in the United States of America.
The accompanying consolidated financial statements have been prepared assuming that the Company will continue as a going concern. As discussed in Note 1 to the consolidated financial statements, the Company’s stockholders’ deficit, recurring net losses, and history of negative cash flows from operations raise substantial doubt about the Company’s ability to continue as a going concern. Management’s plans concerning these matters are also described in Note 1 to the consolidated financial statements. The consolidated financial statements do not include any adjustments that might result from the outcome of these uncertainties.
/S/ DELOITTE & TOUCHE LLP
Boston, Massachusetts
September 15, 2011
F-2
Table of Contents
MASCOMA CORPORATION
AS OF DECEMBER 31, 2009 AND 2010
(Amounts in thousands, except per share data)
| 2009 | 2010 | |||||||
| ASSETS |
||||||||
| CURRENT ASSETS: |
||||||||
| Cash and cash equivalents |
$ | 7,848 | $ | 6,741 | ||||
| Restricted cash |
884 | 1,799 | ||||||
| Short-term investments |
8,141 | 5,148 | ||||||
| Accounts receivable |
1,176 | 3,613 | ||||||
| Prepaid expenses and other current assets |
335 | 413 | ||||||
|
|
|
|
|
|||||
| Total current assets |
18,384 | 17,714 | ||||||
| PROPERTY AND EQUIPMENT—Net |
31,731 | 33,844 | ||||||
| EQUITY METHOD INVESTMENT |
— | 4,692 | ||||||
| INTANGIBLE ASSETS, NET OF AMORTIZATION |
— | 7,007 | ||||||
| GOODWILL |
— | 22,488 | ||||||
| DEPOSITS AND DEFERRED FINANCING COSTS |
1,475 | 1,380 | ||||||
|
|
|
|
|
|||||
| TOTAL |
$ | 51,590 | $ | 87,125 | ||||
|
|
|
|
|
|||||
| LIABILITIES, REDEEMABLE COMMON STOCK, REDEEMABLE CONVERTIBLE PREFERRED STOCK, AND STOCKHOLDERS’ DEFICIT |
||||||||
| CURRENT LIABILITIES: |
||||||||
| Accounts payable |
1,866 | 3,166 | ||||||
| Accrued expenses |
2,321 | 3,022 | ||||||
| Deferred grant revenue |
3,984 | 3,800 | ||||||
| Current portion of long-term debt and capital lease |
4,038 | 3,451 | ||||||
|
|
|
|
|
|||||
| Total current liabilities |
12,209 | 13,439 | ||||||
| LONG-TERM LEASE OBLIGATIONS AND DEFERRED RENT—Net of current portion |
1,300 | 794 | ||||||
| LONG-TERM DEFERRED GRANT REVENUE—Net of current portion |
18,156 | 15,898 | ||||||
| LONG-TERM DEBT AND CAPITAL LEASES—Net of discount and current portion |
3,377 | — | ||||||
| WARRANT LIABILITIES |
2,597 | 5,445 | ||||||
|
|
|
|
|
|||||
| Total liabilities |
37,639 | 35,576 | ||||||
|
|
|
|
|
|||||
| COMMITMENTS (Note 9) |
— | — | ||||||
| REDEEMABLE NONCONTROLLING INTEREST |
2,830 | 2,629 | ||||||
| REDEEMABLE CONVERTIBLE PREFERRED STOCK (Note 13) |
104,304 | 153,212 | ||||||
| REDEEMABLE COMMON STOCK—400 shares at redemption value |
1,180 | 788 | ||||||
| STOCKHOLDERS’ DEFICIT: |
||||||||
| Common stock, $0.001 par value—authorized, 43,633 and 75,000 shares; issued, 3,014 and 7,485 shares; outstanding, 2,854 and 7,325 shares; at December 31, 2009 and 2010, respectively |
2 | 7 | ||||||
| Additional paid-in capital |
3,835 | 18,841 | ||||||
| Accumulated deficit |
(97,730 | ) | (123,458 | ) | ||||
| Treasury stock—at cost (160 shares) |
(470 | ) | (470 | ) | ||||
|
|
|
|
|
|||||
| Total stockholders’ deficit |
(94,363 | ) | (105,080 | ) | ||||
|
|
|
|
|
|||||
| TOTAL |
$ | 51,590 | $ | 87,125 | ||||
|
|
|
|
|
|||||
The accompanying notes are an integral part of the consolidated financial statements.
F-3
Table of Contents
MASCOMA CORPORATION
CONSOLIDATED STATEMENTS OF OPERATIONS
FOR THE YEARS ENDED DECEMBER 31, 2008, 2009 AND 2010
(Amounts in thousands, except per share data)
| 2008 | 2009 | 2010 | ||||||||||
| REVENUES: |
||||||||||||
| Product sales |
$ | — | $ | — | $ | 1,466 | ||||||
| Government grants |
3,896 | 8,436 | 13,276 | |||||||||
| Other service arrangements |
— | — | 750 | |||||||||
|
|
|
|
|
|
|
|||||||
| Total revenues |
3,896 | 8,436 | 15,492 | |||||||||
|
|
|
|
|
|
|
|||||||
| COST OF PRODUCT SALES AND OPERATING EXPENSES: |
||||||||||||
| Cost of product sales |
— | — | 1,120 | |||||||||
| Research and development |
24,327 | 28,270 | 26,539 | |||||||||
| Selling, general and administrative |
9,344 | 5,059 | 10,212 | |||||||||
| Loss on asset disposals and lease abandonment |
799 | 9,213 | — | |||||||||
|
|
|
|
|
|
|
|||||||
| Total cost and operating expenses |
34,470 | 42,542 | 37,871 | |||||||||
|
|
|
|
|
|
|
|||||||
| LOSS FROM OPERATIONS |
(30,574 | ) | (34,106 | ) | (22,379 | ) | ||||||
|
|
|
|
|
|
|
|||||||
| OTHER INCOME (EXPENSE): |
||||||||||||
| Interest income |
975 | 152 | 62 | |||||||||
| Interest expense and other financing costs |
(862 | ) | (1,518 | ) | (3,469 | ) | ||||||
|
|
|
|
|
|
|
|||||||
| Other income (expense), net |
113 | (1,366 | ) | (3,407 | ) | |||||||
|
|
|
|
|
|
|
|||||||
| EQUITY IN LOSS OF EQUITY METHOD INVESTMENT |
— | — | (143 | ) | ||||||||
|
|
|
|
|
|
|
|||||||
| NET LOSS |
(30,461 | ) | (35,472 | ) | (25,929 | ) | ||||||
| AMOUNT ATTRIBUTABLE TO REDEEMABLE NONCONTROLLING INTEREST |
— | (2,830 | ) | 201 | ||||||||
|
|
|
|
|
|
|
|||||||
| NET LOSS ATTRIBUTABLE TO MASCOMA CORPORATION |
(30,461 | ) | (38,302 | ) | (25,728 | ) | ||||||
| ACCRETION OF REDEEMABLE CONVERTIBLE PREFERRED STOCK |
(216 | ) | (253 | ) | (205 | ) | ||||||
|
|
|
|
|
|
|
|||||||
| NET LOSS ATTRIBUTABLE TO COMMON STOCKHOLDERS OF MASCOMA CORPORATION |
$ | (30,677 | ) | $ | (38,555 | ) | $ | (25,933 | ) | |||
|
|
|
|
|
|
|
|||||||
| NET LOSS ATTRIBUTABLE TO MASCOMA COMMON STOCKHOLDERS PER SHARE—BASIC AND DILUTED |
$ | (12.25 | ) | $ | (12.61 | ) | $ | (5.39 | ) | |||
| Weighted-average common shares outstanding—basic and diluted |
2,505 | 3,058 | 4,813 | |||||||||
| Pro forma net loss attributable to Mascoma common stockholders per share (unaudited)—basic and diluted |
$ | (0.52 | ) | |||||||||
| Pro forma weighted-average common shares outstanding (unaudited)—basic and diluted |
49,798 | |||||||||||
The accompanying notes are an integral part of the consolidated financial statements.
F-4
Table of Contents
MASCOMA CORPORATION
CONSOLIDATED STATEMENTS OF STOCKHOLDERS’ DEFICIT
FOR THE YEARS ENDED DECEMBER 31, 2008, 2009 AND 2010
(Amounts in thousands)
| Common | Additional Paid-In Capital |
Accumulated Deficit |
Treasury | Total | ||||||||||||||||||||||||
| Shares | Amount | Shares | Amount | |||||||||||||||||||||||||
| BALANCE—January 1, 2008 |
1,805 | $ | 2 | $ | 464 | $ | (28,967 | ) | — | $ | — | $ | (28,501 | ) | ||||||||||||||
| Issuance of common stock |
273 | — | 315 | — | — | — | 315 | |||||||||||||||||||||
| Acquisition of treasury stock |
— | — | — | — | 160 | (470 | ) | (470 | ) | |||||||||||||||||||
| Vesting of restricted shares |
562 | — | 4 | — | — | — | 4 | |||||||||||||||||||||
| Stock-based compensation expense |
— | — | 1,645 | — | — | — | 1,645 | |||||||||||||||||||||
| Accretion of redeemable convertible preferred stock |
— | — | (216 | ) | — | — | — | (216 | ) | |||||||||||||||||||
| Adjustment to fair value of redeemable stock |
— | — | 32 | — | — | — | 32 | |||||||||||||||||||||
| Net loss and total comprehensive loss |
— | — | — | (30,461 | ) | — | — | (30,461 | ) | |||||||||||||||||||
|
|
|
|
|
|
|
|
|
|
|
|
|
|
|
|||||||||||||||
| BALANCE—December 31, 2008 |
2,640 | 2 | 2,244 | (59,428 | ) | 160 | (470 | ) | (57,652 | ) | ||||||||||||||||||
| Issuance of common stock upon exercise of options |
74 | — | 48 | — | — | — | 48 | |||||||||||||||||||||
| Vesting of restricted shares |
300 | — | — | — | — | — | — | |||||||||||||||||||||
| Stock-based compensation expense |
— | — | 1,832 | — | — | — | 1,832 | |||||||||||||||||||||
| Accretion of redeemable convertible preferred stock |
— | — | (253 | ) | — | — | — | (253 | ) | |||||||||||||||||||
| Adjustment to fair value of redeemable stock |
— | — | (36 | ) | — | — | — | (36 | ) | |||||||||||||||||||
| Net loss and total comprehensive loss |
— | — | — | (38,302 | ) | — | — | (38,302 | ) | |||||||||||||||||||
|
|
|
|
|
|
|
|
|
|
|
|
|
|
|
|||||||||||||||
| BALANCE—December 31, 2009 |
3,014 | 2 | 3,835 | (97,730 | ) | 160 | (470 | ) | (94,363 | ) | ||||||||||||||||||
| Issuance of common stock upon exercise of options |
60 | — | 22 | — | — | — | 22 | |||||||||||||||||||||
| Issuance of common stock upon acquisition of SunOpta |
3,756 | 4 | 7,396 | — | — | — | 7,400 | |||||||||||||||||||||
| Issuance of common warrants classified as equity |
— | — | 1,228 | — | — | — | 1,228 | |||||||||||||||||||||
| Preferred stock converted into common shares |
580 | 1 | 3,689 | — | — | — | 3,690 | |||||||||||||||||||||
| Vesting of restricted shares |
75 | — | — | — | — | |||||||||||||||||||||||
| Stock-based compensation expense |
— | — | 2,484 | — | — | — | 2,484 | |||||||||||||||||||||
| Accretion of redeemable convertible preferred stock |
— | — | (205 | ) | — | — | — | (205 | ) | |||||||||||||||||||
| Adjustment to fair value of redeemable stock |
— | — | 392 | — | — | — | 392 | |||||||||||||||||||||
| Net loss and total comprehensive loss |
— | — | — | (25,728 | ) | — | — | (25,728 | ) | |||||||||||||||||||
|
|
|
|
|
|
|
|
|
|
|
|
|
|
|
|||||||||||||||
| BALANCE—December 31, 2010 |
7,485 | $ | 7 | $ | 18,841 | $ | (123,458 | ) | 160 | $ | (470 | ) | $ | (105,080 | ) | |||||||||||||
|
|
|
|
|
|
|
|
|
|
|
|
|
|
|
|||||||||||||||
The accompanying notes are an integral part of the consolidated financial statements.
F-5
Table of Contents
MASCOMA CORPORATION
CONSOLIDATED STATEMENTS OF CASH FLOWS
FOR THE YEARS ENDED DECEMBER 31, 2008, 2009 AND 2010
(Amounts in thousands)
| 2008 | 2009 | 2010 | ||||||||||
| CASH FLOWS FROM OPERATING ACTIVITIES: |
||||||||||||
| Net loss |
$ | (30,461 | ) | $ | (35,472 | ) | $ | (25,929 | ) | |||
| Adjustments to reconcile net loss to net cash used in operating activities: |
||||||||||||
| Depreciation and amortization |
3,191 | 7,064 | 8,825 | |||||||||
| Loss on asset disposal and lease abandonment |
799 | 9,213 | 56 | |||||||||
| Stock-based compensation expense |
1,645 | 1,832 | 2,484 | |||||||||
| (Decrease) increase in fair value of warrant liabilities |
(50 | ) | 48 | (825 | ) | |||||||
| Warrants issued for financing, debt discount amortization and other non-cash interest charges |
927 | 784 | 4,086 | |||||||||
| Common stock issued for license and asset purchases |
162 | — | — | |||||||||
| Deferred grant revenues |
(1,430 | ) | (3,104 | ) | (2,616 | ) | ||||||
| Equity in loss of equity method investment |
— | — | 143 | |||||||||
| Changes in operating assets and liabilities, net of assets and liabilities acquired: |
||||||||||||
| Accounts receivable |
(2,173 | ) | 997 | (879 | ) | |||||||
| Prepaid expenses and other current assets |
60 | 198 | 159 | |||||||||
| Accounts payable |
(5,378 | ) | 1,047 | 1,069 | ||||||||
| Accrued expenses and other liabilities |
2,898 | (4,137 | ) | (1,091 | ) | |||||||
| Deferred revenues |
— | — | 174 | |||||||||
|
|
|
|
|
|
|
|||||||
| Net cash used in operating activities |
(29,810 | ) | (21,530 | ) | (14,344 | ) | ||||||
|
|
|
|
|
|
|
|||||||
| CASH FLOWS FROM INVESTING ACTIVITIES: |
||||||||||||
| Purchase of SunOpta BioProcess, including cash acquired |
— | — | 11,113 | |||||||||
| Purchases of property and equipment |
(24,732 | ) | (10,138 | ) | (8,385 | ) | ||||||
| Restricted cash |
1,776 | 14 | 1,532 | |||||||||
| Purchase of short-term investments |
— | (17,140 | ) | (14,427 | ) | |||||||
| Proceeds from sale of short-term investments |
— | 8,999 | 17,420 | |||||||||
|
|
|
|
|
|
|
|||||||
| Net cash (used in) provided by investing activities |
(22,956 | ) | (18,265 | ) | 7,253 | |||||||
|
|
|
|
|
|
|
|||||||
| CASH FLOWS FROM FINANCING ACTIVITIES: |
||||||||||||
| Repurchase of unvested restricted stock |
(185 | ) | (236 | ) | — | |||||||
| Proceeds from issuance of convertible debt |
— | — | 10,000 | |||||||||
| Deferred grant revenue proceeds |
9,380 | 14,714 | — | |||||||||
| Payments for capital leases |
(17 | ) | (112 | ) | (83 | ) | ||||||
| Proceeds from issuance of common stock and exercise of employee options |
47 | 48 | 22 | |||||||||
| Proceeds from issuance of preferred stock—net of issuance costs |
60,154 | — | — | |||||||||
| Purchase of treasury stock |
(118 | ) | — | — | ||||||||
| Proceeds from issuance of long-term debt |
10,000 | — | — | |||||||||
| Payment of long-term debt |
— | (2,555 | ) | (3,955 | ) | |||||||
|
|
|
|
|
|
|
|||||||
| Net cash provided by financing activities |
79,261 | 11,859 | 5,984 | |||||||||
|
|
|
|
|
|
|
|||||||
| NET INCREASE (DECREASE) IN CASH AND CASH EQUIVALENTS |
26,495 | (27,936 | ) | (1,107 | ) | |||||||
| CASH AND CASH EQUIVALENTS—Beginning of year |
9,289 | 35,784 | 7,848 | |||||||||
|
|
|
|
|
|
|
|||||||
| CASH AND CASH EQUIVALENTS—End of year |
$ | 35,784 | $ | 7,848 | $ | 6,741 | ||||||
|
|
|
|
|
|
|
|||||||
| SUPPLEMENTAL DISCLOSURES |
||||||||||||
| Interest paid, net of amounts capitalized |
$ | — | $ | 546 | $ | 200 | ||||||
| Non-cash financing and investing activities: |
||||||||||||
| Purchases of property and equipment and construction in progress in accounts payable and accrued expenses |
$ | 1,659 | $ | 550 | $ | 249 | ||||||
| Issuance of common stock for settlement of liabilities |
106 | — | — | |||||||||
| Equipment acquired via capital leases |
234 | — | — | |||||||||
| Conversion of Series B-1 Preferred Stock to Series C Preferred Stock |
5,250 | — | — | |||||||||
| Conversion of convertible debt and accrued interest to Series D Preferred Stock |
— | — | 10,135 | |||||||||
| Issuance of equity instruments in SunOpta acquisition |
— | — | 50,886 | |||||||||
| Conversion of preferred stock to common stock |
— | — | 3,690 | |||||||||
The accompanying notes are an integral part of the consolidated financial statements.
F-6
Table of Contents
MASCOMA CORPORATION
NOTES TO CONSOLIDATED FINANCIAL STATEMENTS
AS OF AND FOR THE YEARS ENDED DECEMBER 31, 2008, 2009 AND 2010
(Amounts in thousands, except per share data)
1. NATURE OF BUSINESS AND BASIS OF PRESENTATION
Nature of Business—Mascoma Corporation (the “Company”), was founded on October 14, 2005. The Company is incorporated under the laws of the state of Delaware and is a renewable fuels company that has developed technology for the conversion of abundant and low-cost biomass. On August 31, 2010, the Company acquired 100% of SunOpta Bioprocess Inc. (“SBI”), located outside of Toronto, Canada, and formed Mascoma Canada, Inc. (“Mascoma Canada”). Mascoma Canada designs and manufactures equipment that processes cellulosic biomass for further biological or chemical conversion such as those conversion technologies developed by the Company. The Company’s headquarters are in Lebanon, New Hampshire. The Company also has operations in Rome, New York and Toronto, Canada.
Basis of Presentation—At December 31, 2009, the Company was considered to be in the development stage as it had not yet commenced its planned principal operations. During 2010 and with the acquisition of SBI, discussed in Note 4, the Company exited the development stage.
The Company is subject to a number of risks including, but not limited to, raising additional capital, development of new technological innovations by its competitors, uncertainty of product development and commercialization, lack of marketing and sales history, dependence on key personnel, and protection of proprietary technology. If the Company does not successfully commercialize any of its technologies, it will be unable to generate significant revenue or achieve profitability.
Going Concern—The accompanying consolidated financial statements of the Company have been prepared on a basis which assumes that the Company will continue as a going concern, which contemplates the realization of assets and the satisfaction of liabilities and commitments in the normal course of business. As of December 31, 2010, the Company had an accumulated deficit of $123,458 and had generated recurring net losses and negative cash flows from operations. During the year ended December 31, 2010, the Company incurred a net loss totaling $25,728 and used cash in operating activities totaling $14,344. The Company expects to continue to incur losses and use cash in operating activities in 2011 and 2012 and may never be profitable. These conditions raise substantial doubt about the Company’s ability to continue as a going concern.
At December 31, 2010, the Company had cash and cash equivalents totaling $6,741 of which $958 is held by Frontier Renewable Resources, LLC (“Frontier”) and is designated for the construction of the production facility in Michigan. As described in Note 19, subsequent to December 31, 2010, the Company has raised additional capital totaling $26,937 in gross proceeds from the issuance of Series D preferred stock and new debt. In addition, the Company is actively engaged in identifying additional sources of debt and equity financing. The sale of additional convertible debt and equity securities may result in dilution of ownership for the Company’s current stockholders.
The Company’s projected uses of cash include funding operations, continued research and product development, capital expenditures, and debt service. Management believes that the existing cash along with the proceeds from the debt and equity raised in 2011 as discussed in Note 19 will be sufficient to meet the Company’s anticipated cash requirements through September 2012. However, the Company will need additional funds to continue operations beyond 2012. If the Company is unable to secure additional funds it will need to implement significant cost reduction strategies which could limit the Company’s development activities and impact its long-term business plan.
F-7
Table of Contents
MASCOMA CORPORATION
NOTES TO CONSOLIDATED FINANCIAL STATEMENTS (continued)
The accompanying consolidated financial statements do not include any adjustments that might result from the outcome of these uncertainties.
Unaudited Pro Forma Information
Unaudited pro forma net loss attributable to common stockholders per share is computed using the weighted-average number of common shares outstanding, including the pro forma effect of the conversion of all preferred stock into the shares of the Company’s common stock as if such conversion had occurred at the beginning of the year.
2. SUMMARY OF SIGNIFICANT ACCOUNTING POLICIES
Principles of Consolidation—The accompanying consolidated financial statements include the accounts of the Company and its majority-owned subsidiaries, including Mascoma Canada, a wholly owned subsidiary, and Frontier, in which the Company holds a 75% interest. All intercompany accounts and transactions have been eliminated. The noncontrolling interest in Frontier is contingently redeemable and is carried outside of permanent equity. The consolidated statements of operations reflect an adjustment for the portion of operations that are attributable to the noncontrolling interest in Frontier. Also included and presented as an affiliated company using the equity method of accounting for investments is a 31% interest in Xylitol Canada, Inc. (“Xylitol”). Accounting for Frontier is described in more detail in Note 5 and the accounting for Xylitol is described in Note 4.
Reclassifications and Restatements—Certain amounts in the 2008 and 2009 financial statements have been reclassified to conform to the 2010 presentation. Previously we reported: 1) research and development expenses from internal projects and 2) research and development expenses from revenue arrangements and engineering costs under separate captions within the consolidated statement of operations. Those expenses are now all classified and reported within research and development expenses. In the consolidated balance sheet, the Company combined other long-term assets and deferred financing costs into a single caption titled deposits and deferred financing costs and combined the carrying value of the different series of preferred stock into a single line. Finally, in the consolidated statement of cash flows, the changes in deferred rent are now combined with the changes in accrued expenses and other liabilities. In addition to the above reclassifications, the 2009 statement of operations has been restated to correctly classify within selling and general and administrative expenses $559 of financing-related costs that were inappropriately included within interest expense and other financing costs in the prior year. These reclassifications and restatements had no impact on previously reported accumulated deficit or net loss.
Use of Estimates—The preparation of consolidated financial statements in conformity with accounting principles generally accepted in the United States of America requires the Company’s management to make estimates and assumptions that affect the reported amounts and disclosure of assets and liabilities at the date of the consolidated financial statements and the reported amounts and disclosure of revenue and expenses during the reporting period. Actual results could differ from those estimates and assumptions.
Foreign Currency Translation—The functional currency of the Company’s subsidiaries in Canada is the U.S. dollar. Assets and liabilities denominated in foreign currencies are translated at the rate in effect at the balance sheet date and are accounted for as transaction gains and losses. Foreign exchange (losses) gains are de minimis in all of the periods presented.
Cash and Cash Equivalents—The Company considers all highly liquid investment instruments with a remaining maturity when purchased of three months or less to be cash equivalents. The Company maintains its cash and cash equivalents, which consist primarily of money market accounts.
F-8
Table of Contents
MASCOMA CORPORATION
NOTES TO CONSOLIDATED FINANCIAL STATEMENTS (continued)
Short-term investments—Investment securities include available-for-sale debt securities. All of the investments held at December 31, 2010 have remaining maturities of three months or less. Available-for-sale securities are those that might be sold due to changes in yield, availability of alternative investments, liquidity needs or other factors. Available-for-sale securities are reported at fair value and the related net unrealized holdings gains or losses are reported in accumulated other comprehensive income (loss), until realized. Interest income from these investment securities is recognized on the accrual basis. Gains and losses on sale of available- for-sale securities, if any, are recognized on the specific identification method and were de minimis in all periods presented. Unrealized gains and losses at December 31, 2009 and 2010 were de minimis.
Concentrations of Credit Risk—At December 31, 2009 and 2010, substantially, all of the Company’s cash and cash equivalents were held in accounts at four financial institutions that management believes to be of high credit-quality. Substantially all of the reported government grant and accounts receivables are generated from revenue arrangements with the U.S. Department of Energy (see Note 16) and all of the product sales in 2010 were to one customer.
Restricted Cash—The restricted cash balance includes cash held in restricted depository accounts as collateral for certain financing arrangements discussed in Note 10.
Property and Equipment—Property and equipment is recorded at cost and depreciated using the straight-line method over the estimated useful lives of the respective assets as follows:
| Estimated Useful Life | ||
| Computer equipment |
3 years | |
| Laboratory equipment |
5–10 years | |
| Furniture and fixtures |
7 years | |
| Leasehold improvements |
Shorter of life of lease or 10 years | |
| Building |
30 years |
Major additions and betterments to assets are capitalized; maintenance and repairs, which do not improve or extend the life of the respective assets, are charged to operations as incurred.
The Company has included in construction in progress capitalized expenditures for site design, engineering costs, and other costs related to construction projects.
Interest expense associated with significant capital projects is capitalized as a cost of the project. The Company capitalized $129, $0 and $161 in 2008, 2009 and 2010, respectively.
Impairment of Long-Lived Assets—The Company periodically evaluates its long-lived assets for potential impairment. Potential impairment is assessed when there is evidence that events or changes in circumstances indicate that the carrying amount of an asset may not be recovered. Recoverability of these assets is based on undiscounted expected future cash flows from the assets, considering a number of factors, including past operating results, budgets and economic projections, market trends, and product development cycles. An impairment of the carrying value of each asset is assessed when the undiscounted expected future cash flows derived from the asset are less than its carrying value. When impairment is indicated, the Company determines the fair value of the asset based on expected discounted cash flows and records an impairment charge for the difference in fair value and the carrying value of the asset.
As a result of the Company’s decision to discontinue efforts to form an agreement relating to research and development activities and the design of a demonstration facility in Tennessee, it was concluded that impairment
F-9
Table of Contents
MASCOMA CORPORATION
NOTES TO CONSOLIDATED FINANCIAL STATEMENTS (continued)
indicators existed in 2008 and 2009. In 2008, management had concluded that substantially all of the design costs that had been incurred related to the Tennessee demonstration facility could be utilized for the planned construction of a similar facility in Michigan. Certain costs, totaling $799, that were deemed to have no value to the Michigan facility were charged to operations in 2008. Due to delays in funding and changes in the proposed facility in Michigan, as well as ongoing uncertainty with respect to the Michigan facility in 2009, the remaining carrying value of the assets originally recognized for the Tennessee facility were deemed impaired and an impairment charge totaling $7,484 in 2009 was recognized as part of the loss on asset disposals and lease abandonment.
Goodwill and Intangible Assets—Goodwill represents the excess of the acquisition cost over the estimated fair value of tangible assets and other identifiable assets acquired less liabilities assumed. Goodwill is not amortized but instead is assessed for impairment at least annually and as triggering events occur. The Company has chosen December 31 as its annual measurement date. On each annual measurement date, the carrying value of the Canadian reporting unit with goodwill is compared to the estimated fair value of the reporting unit. Impairment charges, if any, are measured as the excess of the carrying value of the goodwill over its implied fair value. No goodwill or intangible asset impairment were identified in the periods presented.
Intangible assets are amortized over their estimated useful lives on a straight line basis, which approximates amounts recognized in proportion to the original estimates of the future cash flows underlying the valuation of the intangible assets.
Deferred Financing Costs—Deferred financing costs of $354, net of accumulated amortization of $737, were recorded at December 31, 2009. Deferred financing costs of $150, net of accumulated amortization of $941, were recorded at December 31, 2010, representing the unamortized costs incurred by the Company related to various debt financings. These costs are being amortized over the term of the underlying debt instruments.
Revenue Recognition—Revenue is derived from product sales, government grants, and other commercial agreements. Revenue is recognized when all of the following criteria are met: persuasive evidence of an arrangement exists, delivery has occurred or services have been provided, the price to the buyer is fixed or determinable, and collectability is reasonably assured.
Revenues from product sales are recognized using the percentage of completion method. The amount of revenue and estimated profits recognized in each period is based upon the actual cost of the work performed to date in proportion to the current estimated total cost at completion of the respective contract. When the estimate on a contract indicates a loss, the entire loss is recognized in the period in which the loss is estimable. The cumulative effect of any change in estimates of profitability is recognized in the period in which the change becomes known. There were no significant changes in estimates in the periods presented. There are no unapproved change orders or claims in the periods presented. Accounts receivable at December 31, 2010 include $2,306 related to unbilled revenue.
Revenues from government grants to construct and operate facilities are deferred and recognized over the useful life of those facilities. Revenues from government grants to conduct research and development are recognized in the period in which the underlying costs are incurred. The Company’s existing government grants are for specific research projects and require the Company to match the proceeds from the government with Company expenditures that equal or exceed the amounts funded by the government.
Income Taxes—Deferred tax assets and liabilities are recognized for the expected future tax consequences of events that have been included in the financial statements or tax returns. Under this method, deferred tax assets
F-10
Table of Contents
MASCOMA CORPORATION
NOTES TO CONSOLIDATED FINANCIAL STATEMENTS (continued)
and liabilities are determined based on the difference between the financial statement and tax basis of assets and liabilities using enacted tax rates in effect for the year in which the differences are expected to reverse. A valuation allowance is provided to reduce the deferred tax asset to a level which, more likely than not, will be realized.
The Company recognizes tax benefits when a position is more likely than not to be sustained upon examination by the applicable taxing authority. The tax benefits recognized in the financial statements from such positions are then measured based on the largest benefit that has a greater than 50% likelihood of being realized upon settlement. The Company recognizes interest and penalties related to uncertain tax positions within the provision for income taxes.
Stock-Based Compensation—Stock-based compensation for awards to employees is measured at the grant date based on the fair value of the award and is recognized as expense over the service period of the award which is generally the vesting period. All stock-based awards to nonemployees are accounted for at fair value, which is generally measured when the service is performed, which requires the Company to periodically remeasure the equity awards as the outstanding awards vest.
Net Loss Attributable To Common Shareholders Per Share—Basic net loss attributable to common stockholders per share is computed by dividing the net loss attributable to common stockholders by the weighted-average number of common shares outstanding for the period. Diluted net loss attributable to common stockholders per share is computed by dividing the net loss attributable to common stockholders by the weighted-average number of common shares and dilutive common share equivalents outstanding for the period, determined using the treasury-stock method and the as if-converted method, for convertible securities, if inclusion of these is not antidilutive. Because the Company has reported a net loss for all periods presented, diluted net loss per common share is the same as basic net loss per common share.
The following table summarizes the computation of basic and diluted net loss per share attributable to common stockholders of Mascoma Corporation for the years ended December 31:
| 2008 | 2009 | 2010 | ||||||||||
| (in thousands, except per share data) | ||||||||||||
| Net loss attributable to Mascoma Corporation |
$ | (30,461 | ) | $ | (38,302 | ) | $ | (25,728 | ) | |||
| Accretion of redeemable convertible preferred stock |
(216 | ) | (253 | ) | (205 | ) | ||||||
|
|
|
|
|
|
|
|||||||
| Net loss attributable to common stockholders of Mascoma Corporation |
$ | (30,677 | ) | $ | (38,555 | ) | $ | (25,933 | ) | |||
|
|
|
|
|
|
|
|||||||
| Weighted-average number of shares—basic and diluted |
2,505 | 3,058 | 4,813 | |||||||||
| Net loss attributable to Mascoma common stockholders per share—basic and diluted |
$ | (12.25 | ) | $ | (12.61 | ) | $ | (5.39 | ) | |||
The following potential common shares were excluded from the computation of diluted net loss attributable to common stockholders per share because such shares had an antidilutive impact due to the losses reported:
| 2008 | 2009 | 2010 | ||||||||||
| Options to purchase common stock |
7,275 | 5,160 | 6,823 | |||||||||
| Warrants to purchase common stock |
— | — | 1,000 | |||||||||
| Warrants to purchase redeemable convertible preferred stock |
604 | 792 | 1,962 | |||||||||
| Conversion of redeemable convertible preferred stock |
31,593 | 31,593 | 44,985 | |||||||||
| Restricted stock |
375 | 75 | — | |||||||||
F-11
Table of Contents
MASCOMA CORPORATION
NOTES TO CONSOLIDATED FINANCIAL STATEMENTS (continued)
Pro forma basic and diluted net loss per share was calculated assuming the conversion of redeemable convertible preferred stock as follows (unaudited):
| Year ended December 31, 2010 |
||||
| (in thousands, except per share data) |
||||
| Pro forma loss per share-basic and diluted |
||||
| Numerator: |
||||
| Net loss attributable to common stockholders of Mascoma Corporation |
$ | (25,933 | ) | |
| Add: Accretion of redeemable convertible preferred stock |
205 | |||
|
|
|
|||
| Pro forma net loss attributable to Mascoma Corporation |
$ | (25,728 | ) | |
|
|
|
|||
| Denominator: |
||||
| Weighted-average shares outstanding |
4,813 | |||
| Add: Adjustment to reflect assumed effect of conversion of redeemable convertible preferred stock |
44,985 | |||
|
|
|
|||
| Pro forma weighted-average shares outstanding |
49,798 | |||
|
|
|
|||
| Pro forma net loss per share-basic and diluted |
$ | (0.52 | ) | |
|
|
|
|||
Preferred Stock Warrants—Warrants to purchase shares that are redeemable are classified as a liability on the balance sheet and adjusted to fair value at each reporting date. Changes in fair value are recognized in interest expense and other financing costs in the consolidated statements of operations. The warrant liability has been classified as long-term because the shares underlying the warrants are not redeemable in the next twelve months and settlement of the warrants is not anticipated in the next twelve months.
Derivative Instruments—Derivative instruments are recognized as either assets or liabilities in the balance sheets and are measured at fair value with gains or losses recognized in earnings or other comprehensive income depending on the nature of the derivative. The Company has an established risk management policy. Derivative instruments are not held for speculative purposes, but are generally acquired to provide protection against adverse changes in the fair value of assets or liabilities or adverse changes in expected cash flows. During the year ended December 31, 2010, the Company utilized forward currency contracts to manage exposures to foreign currency. The realized gains and losses on the settlement of these contracts were not material. At December 31, 2009 and 2010, there were no derivative instruments outstanding.
Comprehensive Income (Loss)—There was no other comprehensive income or loss in the periods presented.
Research and Development Costs—Research and development costs are expensed as incurred. Research and development costs are comprised of costs incurred in performing research and development activities, including those costs incurred in support of government-sponsored research and development arrangements, including salaries, benefits, facilities, research-related overhead, contracted services, license fees, and other external costs. These costs also include the costs to operate the Company’s research and demonstration facility as well as the depreciation of leasehold improvements and equipment related to that facility. The Company uses internal personnel, external service providers, and vendors to conduct research and development and to provide various other research and development-related products and services.
Subsequent Events—The Company evaluated all subsequent events through September 15, 2011, the date that these financial statements were available to be issued, to determine if such events should be reflected in these financial statements as of December 31, 2010. See Note 19 for subsequent event details.
F-12
Table of Contents
MASCOMA CORPORATION
NOTES TO CONSOLIDATED FINANCIAL STATEMENTS (continued)
3. FAIR VALUE OF FINANCIAL INSTRUMENTS
The Company’s financial instruments consist of cash and cash equivalents, short-term investments, accounts receivable, accounts payable, long-term debt, certain warrant obligations and redeemable common stock. The fair value hierarchy classifies fair value measurements based on the inputs used in measuring fair value. These inputs are classified: Level 1, defined as observable inputs such as quoted prices for identical instruments in active markets; Level 2, defined as inputs other than quoted prices in active markets that are either directly or indirectly observable; and Level 3, defined as unobservable inputs for which little or no market data exists, therefore, requiring an entity to develop its own assumptions.
Assets and Liabilities Measured at Fair Value on a Recurring Basis
The following table presents information about the assets and liabilities measured at fair value on a recurring basis as of December 31, 2009 and December 31, 2010:
| December 31, 2009 |
Level 1 | Level 2 | Level 3 | Total | ||||||||||||
| Assets: |
||||||||||||||||
| Money market fund and cash equivalents |
$ | 7,600 | $ | — | $ | — | $ | 7,600 | ||||||||
| Short-term investments: |
||||||||||||||||
| Government bond debt securities |
5,359 | — | — | 5,359 | ||||||||||||
| Corporate bond debt securities |
2,782 | — | — | 2,782 | ||||||||||||
| Liabilities: |
||||||||||||||||
| Warrants to purchase shares subject to redemption |
— | — | 2,597 | 2,597 | ||||||||||||
| Redeemable common stock |
— | — | 1,180 | 1,180 | ||||||||||||
| December 31, 2010 |
Level 1 | Level 2 | Level 3 | Total | ||||||||||||
| Assets: |
||||||||||||||||
| Money market fund and cash equivalents(1) |
$ | 684 | $ | 200 | $ | — | $ | 884 | ||||||||
| Short-term investments(1) : |
||||||||||||||||
| Government bond debt securities |
— | 2,463 | — | 2,463 | ||||||||||||
| Corporate bond debt securities |
— | 2,685 | — | 2,685 | ||||||||||||
| Liabilities: |
||||||||||||||||
| Warrants to purchase shares subject to redemption |
— | — | 5,445 | 5,445 | ||||||||||||
| Redeemable common stock |
— | — | 788 | 788 | ||||||||||||
| (1) | The cash equivalents and short-term investments at December 31, 2010 are held by Frontier for the construction of the production facility in Michigan. |
F-13
Table of Contents
MASCOMA CORPORATION
NOTES TO CONSOLIDATED FINANCIAL STATEMENTS (continued)
The following table summarizes the changes in fair value of the warrant liability and redeemable common stock, which are measured using Level 3 inputs:
| Warrant Liability |
Redeemable Common Stock |
|||||||
| Balance—January 1, 2008 |
$ | 399 | $ | 1,176 | ||||
| Issuance of warrants |
2,046 | — | ||||||
| Decrease in fair value recognized in interest expense and other financing costs |
(50 | ) | — | |||||
| Decrease in fair value recognized in additional paid-in capital |
— | (32 | ) | |||||
|
|
|
|
|
|||||
| Balance—December 31, 2008 |
2,395 | 1,144 | ||||||
| Issuance of warrants |
154 | — | ||||||
| Increase in fair value recognized in interest expense and other financing costs |
48 | — | ||||||
| Increase in fair value recognized in additional paid-in capital |
— | 36 | ||||||
|
|
|
|
|
|||||
| Balance—December 31, 2009 |
2,597 | 1,180 | ||||||
| Issuance of warrants |
3,673 | — | ||||||
| Decrease in fair value recognized in interest expense and other financing costs |
(825 | ) | — | |||||
| Decrease in fair value recognized in additional paid-in capital |
— | (392 | ) | |||||
|
|
|
|
|
|||||
| Balance—December 31, 2010 |
$ | 5,445 | $ | 788 | ||||
|
|
|
|
|
|||||
The Company’s money market funds are classified within Level 1 of the fair value hierarchy because they are valued using quoted prices for identical assets. At December 31, 2009 certain of the Company’s debt securities were valued based on quoted prices for the specific securities in an active market and therefore classified as Level 1. At December 31, 2010, the Company’s investments in debt securities, some of which are classified as cash equivalents, are generally valued on the basis of valuations provided by third-party pricing services, as derived from such services’ pricing models. Inputs to the models may include, but are not limited to, reported trades, executable bid and asked prices, broker/dealer quotations, prices or yields of securities with similar characteristics, benchmark curves or information pertaining to the issuer, as well s industry and economic events. The pricing services may use a matrix approach, which considers information regarding securities with similar characteristics to determine the valuation for a security. The fair value of the warrant liability is discussed in Note 11. The fair value of the redeemable common stock is determined by management and the board of directors as discussed in Note 14.
Assets and Liabilities Measured at Fair Value on a Nonrecurring Basis—Certain assets are measured at fair value on a non-recurring basis. These assets are not measured at fair value on an ongoing basis but are subject to fair value adjustments only under certain circumstances. These include long-lived assets and goodwill that are written down to fair value when they are held for sale or determined to be impaired. The Company uses Level 3 inputs to measure the fair value of long-lived assets on the date any impairment is required to be measured. The Company recorded impairment charges in 2008 and 2009 related to the Company’s decision to discontinue its efforts to form an agreement relating to research and development activities and the design of a demonstration facility in Tennessee. This impairment was measured based upon the recorded costs of that project that were deemed to be unrecoverable.
Financial Instruments not Measured at Fair Value—Some of the Company’s financial instruments, including cash, restricted cash, accounts receivable, accounts payable and accrued expenses are carried at amortized cost. The carrying values of these financial instruments approximate fair value due to their liquid or short-term nature. Similarly, the Company’s long-term debt and capital leases are carried at amortized cost. Based on borrowing rates which management believes would be available to the Company for similar issues of debt, taking into account the credit risk of the Company and other market factors, the carrying value of the Company’s debt obligations approximate their fair value.
F-14
Table of Contents
MASCOMA CORPORATION
NOTES TO CONSOLIDATED FINANCIAL STATEMENTS (continued)
4. ACQUISITION OF SUNOPTA BIOPROCESS INC.
On August 31, 2010, the Company acquired 100% of the shares of SunOpta BioProcess Inc. (“SBI”), a company, with headquarters in Canada, that provides equipment and process solutions for biomass conversion. The company was renamed Mascoma Canada, Inc. (“Mascoma Canada”). By integrating Mascoma Canada’s fiber preparation and pretreatment technology with the Company’s consolidated bioprocessing technology, the Company brings together the two core technical components essential for the effective conversion of biomass feedstocks into ethanol.
In consideration for the equity of SBI, the Company issued 11,269 shares of Series D Redeemable Convertible Preferred Stock, 3,756 shares of common stock and warrants to purchase 1,000 shares of common stock with an exercise price of $3.75 per share, to the selling stockholders of SBI. Management has determined that the consideration paid to the selling shareholders had an aggregate fair value totaling $50,886. Transaction costs related to this transaction totaled $1,634, which has been reported within selling, general and administrative expenses in the consolidated statements of operations. Subsequent to closing, the Company received $1,523 in additional cash from the selling stockholders as a working capital adjustment. The excess of the purchase price over the fair value of the identifiable acquired net assets has been allocated to goodwill, none of which is tax deductible. The goodwill arising in this acquisition was attributed primarily to the expected synergies of the combined entities and the workforce in place of the acquired business. The operations of SBI are included in the Company’s operating results from the acquisition date, and include $1,466 of product sales and a net loss of $1,519.
The consideration was as follows:
| Series D convertible redeemable preferred stock at fair value |
$ | 42,258 | ||
| Common stock at fair value |
7,400 | |||
| Warrants to purchase common stock at fair value |
1,228 | |||
|
|
|
|||
| Total consideration |
$ | 50,886 | ||
|
|
|
The purchase price was allocated to the fair value of the assets acquired and liabilities assumed as follows:
| Cash and cash equivalents |
$ | 9,590 | ||
| Restricted cash |
2,556 | |||
| Receivable from selling stockholders for working capital adjustment |
1,523 | |||
| Accounts receivable |
1,558 | |||
| Prepaids and other current assets |
237 | |||
| Property and equipment |
2,397 | |||
| Equity interest in Xylitol Canada, Inc. (“Xylitol”) |
4,835 | |||
| Intangible assets |
||||
| Developed technologies (life of 5 years) |
7,400 | |||
| Customer relationships (life of 2 years) |
120 | |||
| Goodwill |
22,488 | |||
| Current liabilities |
(1,818 | ) | ||
|
|
|
|||
| Net assets acquired |
$ | 50,886 | ||
|
|
|
The equity interest in Xylitol includes 19,600 shares of common stock and a warrant to purchase an additional 500 shares of common stock. Xylitol is listed on the TSX Venture Exchange under the symbol XYL. Xylitol intends to become a North American-based, low-cost, high-quality manufacturer of food and pharmaceutical-grade xylitol from biomass.
F-15
Table of Contents
MASCOMA CORPORATION
NOTES TO CONSOLIDATED FINANCIAL STATEMENTS (continued)
Because the Company holds approximately 31% of the outstanding shares of Xylitol and holds one seat on the board of directors of Xylitol, the Company believes it has significant influence over Xylitol. As such, the interest in Xylitol has been accounted for using the equity method of accounting. The initial fair value was determined by reference to the publicly quoted price for the common stock of Xylitol. The value of $4,835 includes implied goodwill of $3,871. Mascoma recorded equity in Xylitol’s loss in 2010 of $143 which reduced the equity value of the affiliate investment in Xylitol to $4,692 at December 31, 2010. This value was compared to the value as determined from the public quoted price at year end, which totaled approximately $4,800, and it was determined that no impairment charge was required.
In connection with the acquisition, the Company and the selling shareholders entered into a transition services agreement. During the period ended December 31, 2010, the Company incurred $129 of operating expenses related to the transition services agreement and $129 that is payable to the selling shareholders is included in accounts payable at December 31, 2010.
The following unaudited pro forma financial information presents the combined results of operations of the Company and SBI as if the acquisition had occurred on January 1, 2009 after giving effect to a pro forma adjustment to include an increase in amortization expense for the $7,520 of acquired identifiable intangibles. The pro forma financial information for 2010 includes approximately $1,634 of acquisition-related costs, including transaction costs incurred by the Company. The pro forma financial information does not reflect any adjustments for anticipated synergies resulting from the acquisition and is not necessarily indicative of the operating results that would have actually occurred had the transaction been consummated as of January 1, 2009.
| 2009 | 2010 | |||||||
| Revenues |
$ | 8,955 | $ | 19,497 | ||||
| Net loss attributable to Mascoma common stockholders |
(42,933 | ) | (27,359 | ) | ||||
5. FRONTIER RENEWABLE RESOURCES
In December 2008, the Company and one other unrelated entity formed Frontier Renewable Resources, LLC (“Frontier”) to develop and operate an integrated commercial scale cellulosic fuel production facility in the state of Michigan. At December 31, 2010, the Company has a 75% ownership interest in Frontier and the other member owns the remaining 25% of Frontier. The Company has the right to appoint four directors to Frontier’s board of directors and the other member may appoint one director to the board of directors. The members contribute capital based on their interest in Frontier and are reimbursed for their out-of-pocket expenses related to the formation of Frontier. The initial contribution by each member is set forth in an operating agreement, which also provides for the distribution of earnings and losses as well. The initial contribution made by the Company is the proceeds received under a grant agreement from the Michigan Economic Development Corporation (MEDC) and the contribution from the other member is comprised of land for the construction of the facility. The operating agreement was amended in June 2010 to provide that the other member will contribute the land at a date to be determined by Frontier’s board of directors on or after January 1, 2012, upon commencement of actual development at the site.
At December 31, 2010, the Company has received grant proceeds of $12,100 and has contributed the entire amount to Frontier. At December 31, 2010, the other member has identified a suitable plot but has yet to contribute land to Frontier. The $12,100 of grant proceeds has been deferred and is expected to be amortized to revenue when the production facility is placed into service. At December 31, 2010, the consolidated balance sheet includes $958 of cash and cash equivalents and $5,148 of short-term investments that is held by Frontier related to the remaining proceeds from the MEDC grants proceeds and is intended to be used for construction of the production facility. The Company is currently evaluating financing options with respect to how to finance the significant capital that will be required to complete the production facility in the state of Michigan.
F-16
Table of Contents
MASCOMA CORPORATION
NOTES TO CONSOLIDATED FINANCIAL STATEMENTS (continued)
At any time between the second and third anniversary of the commencement date, the Company has the right to acquire the noncontrolling interest held by the other member. During that same period, the other member has the right to put its interest in Frontier to the Company. The amount to be paid under the Company’s call option and the other member’s put option is equal to the other member’s capital contribution plus a 12% annual rate of return on the member’s capital account balance. The other member’s put right has been accounted for as part of the carrying value of the noncontrolling interest. As the put right is not within the control of the Company, the noncontrolling interest has been classified outside of permanent equity.
The following table summarized the changes in the carrying value of the noncontrolling interest of the other member of Frontier for the years ended December 31:
| Balance—January 1, 2008 |
$ | — | ||
| Contributions and deemed contributions made by the other member of Frontier |
728 | |||
|
|
|
|||
| Balance—January 1, 2009 |
728 | |||
| Contributions and deemed contributions made by the other member of Frontier |
2,285 | |||
| Net loss of Frontier allocated to the other member of Frontier |
(183 | ) | ||
|
|
|
|||
| Balance—January 1, 2010 |
2,830 | |||
| Net loss of Frontier allocated to the other member of Frontier |
(201 | ) | ||
|
|
|
|||
| Balance—December 31, 2010 |
$ | 2,629 | ||
|
|
|
6. PROPERTY AND EQUIPMENT
Property and equipment consists of the following at December 31:
| 2009 | 2010 | |||||||
| Land |
$ | 362 | $ | 362 | ||||
| Building |
8,201 | 8,201 | ||||||
| Leasehold improvements |
3,056 | 3,135 | ||||||
| Furniture and fixtures |
743 | 643 | ||||||
| Laboratory equipment |
26,772 | 32,890 | ||||||
| Computer equipment |
706 | 764 | ||||||
| Construction in progress |
2,222 | 6,373 | ||||||
|
|
|
|
|
|||||
| Total property and equipment |
42,062 | 52,368 | ||||||
| Less accumulated depreciation |
(10,331 | ) | (18,524 | ) | ||||
|
|
|
|
|
|||||
| Total property and equipment—net |
$ | 31,731 | $ | 33,844 | ||||
|
|
|
|
|
|||||
Depreciation expense for the years ended December 31, 2008, 2009 and 2010 was $3,191, $7,064, and $8,312, respectively. Laboratory and computer equipment includes capital leases with a cost of $234 at both December 31, 2009 and 2010.
The construction in progress at December 31, 2009 and 2010 was primarily comprised of design and engineering costs incurred in connection the planned construction of the production facility in Michigan.
F-17
Table of Contents
MASCOMA CORPORATION
NOTES TO CONSOLIDATED FINANCIAL STATEMENTS (continued)
7. GOODWILL AND INTANGIBLE ASSETS
Goodwill and amortizable intangible assets as of December 31, 2009 and 2010 consisted of the following:
| Balance at December 31, 2009 |
Acquisition | Accumulated Amortization or Goodwill Impairments |
Balance at December 31, 2010 |
|||||||||||||
| Customer relationships |
$ | — | $ | 120 | $ | (20 | ) | $ | 100 | |||||||
| Developed technologies |
— | 7,400 | (493 | ) | 6,907 | |||||||||||
|
|
|
|
|
|
|
|
|
|||||||||
| Intangibles—total |
$ | — | $ | 7,520 | $ | (513 | ) | $ | 7,007 | |||||||
|
|
|
|
|
|
|
|
|
|||||||||
| Goodwill—total |
$ | — | $ | 22,488 | $ | — | $ | 22,488 | ||||||||
|
|
|
|
|
|
|
|
|
|||||||||
The weighted-average amortization periods for intangible assets acquired in 2010 are 5.0 years for developed technologies and 2.0 years for customer relationships. The weighted-average amortization period for all intangible assets in the above table is 4.95 years.
The estimated future amortization expense related to intangible assets as of December 31, 2010, is as follows:
| 2011 |
$ | 1,540 | ||
| 2012 |
1,520 | |||
| 2013 |
1,480 | |||
| 2014 |
1,480 | |||
| 2015 |
987 | |||
|
|
|
|||
| $ | 7,007 | |||
|
|
|
|||
8. ACCRUED EXPENSES
Accrued expenses consist of the following at December 31:
| 2009 | 2010 | |||||||
| Professional, consulting, and construction fees |
$ | 263 | $ | 426 | ||||
| Contracted research and development expenses |
782 | 1,064 | ||||||
| Payroll and payroll related expenses |
344 | 253 | ||||||
| Lease incentive obligation and deferred rent—current portion |
582 | 500 | ||||||
| Other |
350 | 779 | ||||||
|
|
|
|
|
|||||
| Total |
$ | 2,321 | $ | 3,022 | ||||
|
|
|
|
|
|||||
F-18
Table of Contents
MASCOMA CORPORATION
NOTES TO CONSOLIDATED FINANCIAL STATEMENTS (continued)
9. COMMITMENTS
Operating Leases—The Company entered into various facility lease agreements with terms through July 31, 2019. Rent expense for the years ended December 31, 2008, 2009 and 2010, which is recorded on a straight-line basis over the term of the lease was $1,385, $3,533 and $1,187, respectively.
As of December 31, 2010, future minimum commitments due under facility and equipment operating leases are as follows:
| 2011 |
$ | 1,881 | ||
| 2012 |
1,705 | |||
| 2013 |
891 | |||
| 2014 |
932 | |||
| 2015 |
989 | |||
| 2016 and thereafter |
3,545 | |||
|
|
|
|||
| Total |
$ | 9,943 | ||
|
|
|
In July 2009, the Company exited its corporate offices located in Boston, Massachusetts and entered into a sublease agreement with a subtenant. The sublease provides for the subtenant to pay the Company rent for the remainder of the lease term. The sublease agreement is with an entity that is affiliated with a member of the Company’s Board of Directors. The Company also has sublease agreements with nonrelated entities for office space in Woburn, Massachusetts. The sublease income will reduce the commitments above by $405 in 2011 and $523 in 2012. The excess lease obligations over the sublease income for the term of the leases in Boston and Woburn were recognized as a lease abandonment expense and a liability totaling $1,365 was recorded at December 31, 2009. Additionally, leasehold improvements associated with these leases totaling $364 were considered impaired and the carrying amount was reduced to zero.
The subtenant at the Boston facility is an early stage life sciences company with limited history of operations. Management believes that the subtenant has the ability and financial support to satisfy the obligations under the sublease agreement. Failure for the subtenant to make timely payments may result in future charges related to this facility.
Employment Agreements—The Company has entered into agreements with certain members of senior management. The terms of these agreements include noncompete and nondisclosure provisions as well as provide for defined severance payments and acceleration of vesting of share based awards.
Research and License Agreements
University—In April 2006, the Company entered into a research agreement with a university (the “University”) to fund research at the University for a total of $1,823 over two years, with additional annual extensions at the option of the Company. The Company entered into a license agreement with the University in July 2006. The Company also agreed to reimburse the University for patent costs related to the licensed technology. Certain inventions arising from the research program become subject to the license agreement. The University granted the Company an option to obtain a worldwide, royalty-bearing license on any other inventions arising from the research program. In March 2008, the Company amended the research agreement to provide at least $500 per year in research support for five consecutive years commencing April 1, 2008, contingent upon the Company receiving funding from the BioEnergy Science Center (BESC). The amounts incurred under the research agreement are recognized as research and development expense in the consolidated statements of operations.
F-19
Table of Contents
MASCOMA CORPORATION
NOTES TO CONSOLIDATED FINANCIAL STATEMENTS (continued)
The Company granted the University 400 shares of common stock in exchange for a license to intellectual property and patents held by the University in 2006. The shares were determined to have a value of $0.01 per share at the time of issuance; therefore, the Company initially recorded this component of the consideration as $4. The University has the right to put the shares back to the Company at then-current fair value after the five-year anniversary of the date of issuance. Accordingly, the shares held by the University have been classified as temporary equity and are being recorded at fair value. Increases or decreases in fair value are recorded through stockholders’ deficit.
Foreign University—In 2006, the Company entered into two research agreements and two license agreements with a foreign university (the “Foreign University”) to fund research projects at the Foreign University for a total of $1,550 over four years. As consideration for the license agreements, the Company issued 200 shares of the Company’s common stock, with an aggregate fair value of $162. Under the research agreements, the Company incurred $108, $410 and $293 to the Foreign University for years ended December 31, 2008, 2009 and 2010, respectively, which has been recorded as research and development expense in the consolidated statements of operations.
In connection with the Company’s license agreements, including the license agreements with the University and the Foreign University, the agreements provide for the Company to potentially make future royalty payments to the licensees if the Company’s commercial products utilize the technologies licensed by the Company. The amount of such royalties is dependent upon the amount and nature of the product sales or sublicensing income that incorporates the licensed technologies.
Related Party—In June 2010, the Company entered into an agreement with an entity that is affiliated with a member of the Company’s board of directors as well as one of the Company’s stockholders. Pursuant to this agreement, the Company incurred $417 for certain engineering, project management and related services provided in 2010 relating to the planned production facility in Michigan. The $417 was included in accounts payable at December 31, 2010 and was settled in September 2011 in exchange for convertible notes. This agreement was terminated in July 2011.
10. LONG-TERM DEBT
Long-term debt and capital leases consist of the following at December 31:
| 2009 | 2010 | |||||||
| Growth capital agreement |
$ | 7,445 | $ | 3,490 | ||||
| Capital lease obligations |
105 | 22 | ||||||
|
|
|
|
|
|||||
| Total debt |
7,550 | 3,512 | ||||||
| Less unamortized discount |
(135 | ) | (61 | ) | ||||
| Less current portion |
(4,038 | ) | (3,451 | ) | ||||
|
|
|
|
|
|||||
| Long-term debt, excluding current portion |
$ | 3,377 | $ | — | ||||
|
|
|
|
|
|||||
In February 2008, the Company received a loan commitment (“2008 Growth Capital Agreement”) from a lender for funding of up to $20,000, available to the Company in two draw-down periods with $10,000 of availability lapsing on April 30, 2008, and October 31, 2008, respectively. The Company did not draw on the April 30, 2008, tranche but did draw $10,000 from the October 31, 2008 tranche.
The borrowings under the 2008 Growth Capital Agreement are secured by a first lien on all assets of the Company, excluding the Company’s intellectual property. The borrowings bore interest at an annual interest rate
F-20
Table of Contents
MASCOMA CORPORATION
NOTES TO CONSOLIDATED FINANCIAL STATEMENTS (continued)
of 6.25% and required monthly interest-only payments from November 2008 to April 2009 and then equal monthly payments of interest and principal payable over 30 months. In addition, at the end of the loan (October 31, 2011), additional interest totaling $250 is payable in a lump sum. The annual principal maturities of the 2008 Growth Capital Agreement is $3,490 in the year ending December 31, 2011.
Letters of Credit—In August 2007, the Company obtained a $3,100 standby letter of credit in connection with an agreement with a vendor, which expired on December 31, 2010. The lender required that the letter of credit be collateralized with cash. In addition, the Company has been required to place cash in restricted accounts to secure other purchase arrangements. As of December 31, 2009 and 2010, $884 and $959, respectively, of cash was held in a restricted account and is classified as restricted cash.
In September 2010, Mascoma Canada received $840 in grant funding from the Canadian province of Alberta. As the Company performs its obligations under the grant the cash will become unrestricted. As of December 31, 2010, $840 is classified as restricted cash and deferred revenues.
Convertible Notes Payable—In April 2010 and June 2010, $10,000 of convertible notes (“Convertible Notes”) were issued to existing shareholders of the Company in two tranches. The Convertible Notes bore interest at an annual rate of 5%. The Convertible Notes and accrued interest totaling $135 were settled on August 31, 2010 in exchange for 2,703 shares of the Company’s Series D Redeemable Convertible Preferred Stock and the Company issued warrants to purchase 1,358 shares of Series D Redeemable Convertible Preferred stock with an exercise price of $3.75 per share to the holders of the Convertible Notes. The fair value of the warrants to purchase the Series D preferred stock was recognized as a cost of the settlement of the Convertible Notes and reported within interest expense and other financing costs in the year ended December 31, 2010. The fair value of the warrants was $3,673 at issuance and was estimated using the Black-Scholes option pricing model. See discussion of warrants in Note 11.
11. WARRANTS
Preferred Stock Warrants
In connection with a 2006 financing agreement, the Company issued warrants to purchase 163 shares of Series A-1 Redeemable Convertible Preferred Stock at a price per share of $1.00. The warrants are fully vested and exercisable for a period of ten years from the date of issuance.
In connection with the 2008 Growth Capital Agreement, the Company issued warrants to purchase 225 shares of Series B Redeemable Convertible Preferred Stock at a price per share of $2.67 and 94 shares of Series C Redeemable Convertible Preferred Stock at a price per share of $6.40. The warrants are fully vested and exercisable for a period of ten years from the date of issuance. The Company used the Black-Scholes option-pricing model to calculate the fair value of the warrants using the following assumptions: expected dividend yield of zero, risk-free interest rate of 3.61%, volatility of 90%, and contractual life of ten years. The resulting valuation of $1,464 at the date of issuance was recognized as debt discount. When the April 2008 draw-down period lapsed with no borrowings, one-half of the amount, or $732, was recognized as interest expense and other financing costs in the consolidated statements of operations. The remaining $732, attributable to the $10,000 that was drawn in October 2008, is being amortized to interest expense through the maturity date of the underlying debt.
In connection with the $10,000 draw of the 2008 Growth Capital Agreement, the Company issued warrants to purchase 37 shares of Series B Redeemable Convertible Preferred Stock at a price per share of $2.67 and 16 shares of Series C Redeemable Convertible Preferred Stock at a price per share of $6.40. The warrants are
F-21
Table of Contents
MASCOMA CORPORATION
NOTES TO CONSOLIDATED FINANCIAL STATEMENTS (continued)
fully vested and exercisable through October 31, 2018. The Company used the Black-Scholes option-pricing model to calculate the fair value of the warrant using the following assumptions: expected dividend yield of zero, risk-free interest rate of 4.01%, volatility of 90%, and contractual life of ten years. The resulting valuation of $221 at the date of issuance was recorded as a debt discount, and the Company is amortizing these amounts to interest expense over the term of the debt.
In connection with a financing agreement entered into in December 2008 and amended and restated in July 2009 under which no funds were drawn, the Company issued warrants to purchase 101 shares of Series C Redeemable Convertible Preferred Stock at a price per share of $6.40. The warrants are fully vested and exercisable through December 2018. The Company used the Black-Scholes option-pricing model to calculate the fair value of the warrant using the following assumptions: expected dividend yield of zero, risk-free interest rate of 2.25%, volatility of 90%, and contractual life of ten years. The resulting valuation of $361 at the date of issuance was capitalized as a deferred financing cost related to the loan commitment, and the Company amortized these amounts to interest expense over the draw-down period, which ended in 2009.
In August 2009, the Company entered into a two year feedstock processing and lignin supply agreement that obligated the Company to issue warrants to purchase 188 shares of Series C Redeemable Convertible Preferred Stock under certain conditions. The Company used the Black-Scholes option-pricing model to calculate the fair value of the warrants expected to be issued as of December 31, 2009 using the following assumptions: expected dividend yield of zero, risk-free interest rate of 2.69%, volatility of 95%, and contractual life of five years. As a result of the valuation, the aggregate fair value of the warrants totaled approximately $800 at December 31, 2009. The Company recorded the earned portion of the warrants of $154 as a liability at December 31, 2009. In 2010, the agreement was terminated along with the Company’s obligation to issue the warrants. The Company extinguished the liability for the warrants when the agreement was terminated.
In August 2010, the Company issued 1,358 warrants to the holders of the convertible notes to purchase Series D Redeemable Convertible Preferred Stock at an exercise price of $3.75 in connection with the SBI transaction. The warrants are exercisable through August 31, 2015. The Company used the Black-Scholes option-pricing model to calculate the fair value of the warrants as of August 31, 2010 and December 31, 2010 using the following assumptions: expected dividend yield of zero, risk-free interest rate of 1.33% and 2.01%, volatility of 95%, and contractual life of 5 years. As a result of the valuation, the aggregate fair value of the warrants liability totaled approximately $3,673 at August 31, 2010.
Because all of the preferred warrants are exercisable into preferred stock that is contingently redeemable, the preferred warrants are required to be accounted for as liabilities and are adjusted to fair value at each reporting date using an option pricing model with the following assumptions as of December 31:
| 2008 | 2009 | 2010 | ||||||||||
| Risk-free rate |
1.87%-2.25 | % | 2.69%-3.85 | % | 2.01%-2.71 | % | ||||||
| Contractual term |
7.73-10.0 years | 4.62-9.0 years | 4.67-8.0 years | |||||||||
| Expected volatility |
90 | % | 95 | % | 95 | % | ||||||
| Expected dividend |
0 | % | 0 | % | 0 | % | ||||||
F-22
Table of Contents
MASCOMA CORPORATION
NOTES TO CONSOLIDATED FINANCIAL STATEMENTS (continued)
The fair value of the outstanding warrants at December 31, 2009 and 2010 are as follows:
| Class of Preferred Stock |
Number
of Shares |
Exercise Price |
Expiration Date |
Fair value at December 31 | ||||||||||||||||
| 2009 | 2010 | |||||||||||||||||||
| Series A-1 |
163 | $ | 1.00 | September 16, 2016 | $ | 552 | $ | 368 | ||||||||||||
| Series B |
225 | $ | 2.67 | February 5, 2018 | 837 | 608 | ||||||||||||||
| Series B |
37 | $ | 2.67 | October 31, 2018 | 142 | 104 | ||||||||||||||
| Series C |
94 | $ | 6.40 | February 5, 2018 | 469 | 396 | ||||||||||||||
| Series C |
16 | $ | 6.40 | October 31, 2018 | 80 | 68 | ||||||||||||||
| Series C |
101 | $ | 6.40 | December 31, 2018 | 363 | 306 | ||||||||||||||
| Series C |
188 | $ | 6.40 | Terminated in 2010 | 154 | — | ||||||||||||||
| Series D |
1,358 | $ | 3.75 | August 31, 2015 | — | 3,595 | ||||||||||||||
|
|
|
|
|
|||||||||||||||||
| $ | 2,597 | $ | 5,445 | |||||||||||||||||
|
|
|
|
|
|||||||||||||||||
The increase (decrease) in fair value of the warrants is recognized in the consolidated statements of operations. The Company recorded ($50), $48 and ($825), as interest expense and other financing costs in the consolidated statements of operations related to the changes in fair value of the warrants in 2008, 2009 and 2010, respectively.
Common Stock Warrants
In August 2010, the Company issued warrants to purchase 1,000 shares of the Company’s common stock at an exercise price of $3.75 per share to the stockholders of SBI in connection with the acquisition of SBI. The common stock warrants are indexed to the Company’s own stock and do not have a redemption option, which allow the warrants to be accounted for as equity. The Company used the Black-Scholes option-pricing model to calculate the fair value of the warrants as of August 31, 2010 using the following assumptions: expected dividend yield of zero, risk-free interest rate of 1.33%, volatility of 95%, and contractual life of 5 years (August 31, 2015). As a result of the valuation, the aggregate fair value of the warrants totaled approximately $1,228 as of August 31, 2010.
12. INTEREST EXPENSE AND OTHER FINANCING COSTS
Interest expense and other financing costs consist of the following for the years ended December 31:
| 2008 | 2009 | 2010 | ||||||||||
| Interest expense |
$ | — | $ | 630 | $ | 418 | ||||||
| Amortization of debt issuance costs and debt discounts |
180 | 634 | 278 | |||||||||
| Warrants issued in connection with financing transactions |
732 | 154 | 3,673 | |||||||||
| Changes in the fair value of warrant liaiblities |
(50 | ) | 48 | (825 | ) | |||||||
| Other |
— | 52 | (75 | ) | ||||||||
|
|
|
|
|
|
|
|||||||
| Total |
$ | 862 | $ | 1,518 | $ | 3,469 | ||||||
|
|
|
|
|
|
|
|||||||
F-23
Table of Contents
MASCOMA CORPORATION
NOTES TO CONSOLIDATED FINANCIAL STATEMENTS (continued)
13. REDEEMABLE CONVERTIBLE PREFERRED STOCK
In March 2006, the Company completed a private placement of Series A Redeemable Convertible Preferred Stock (“Series A Preferred Stock”) by issuing 5,000 shares of Series A Preferred Stock at a price of $0.80 per share, which resulted in gross proceeds of approximately $4,000, including the conversion of a convertible promissory note with principal and accrued interest totaling $51.
In September 2006, the Company issued 5,000 shares of Series A-1 Redeemable Convertible Preferred Stock (“Series A-1 Preferred Stock”) at a price of $1.00 per share, which resulted in gross proceeds of $5,000. The Series A-1 Preferred Stock is senior to the Series A Preferred Stock.
In November 2006, the Company issued 11,242 shares of Series B Redeemable Convertible Preferred Stock (“Series B Preferred Stock”) at a price of $2.67 per share, which resulted in gross proceeds of approximately $30,000. The Series B Preferred Stock is senior to the Series A and Series A-1 Preferred Stock.
In October 2007, the Company issued 625 shares of Series B-1 Redeemable Convertible Preferred Stock (“Series B-1 Preferred Stock”) with a fair value of $5,250 or $8.40 per share, in connection with the acquisition of certain assets.
In February, March, and April 2008, the Company issued an aggregate of 9,531 shares of Series C Redeemable Convertible Preferred Stock (“Series C Preferred Stock”) at a price of $6.40 per share which resulted in gross proceeds of approximately $61,000. In addition, the 625 shares of Series B-1 Preferred Stock converted into 820 shares of Series C Preferred Stock. The Series C Preferred Stock is senior to the Series B, Series A, and Series A-1 Preferred Stock.
In April 2010 and June 2010, $10,000 of Convertible Notes were issued to certain existing stockholders of the Company. The convertible notes accrued interest for the period they were outstanding at a rate of 5% per annum. The Convertible Notes and accrued interest totaling $135 were settled on August 31, 2010 in exchange for 2,703 shares of the Company’s Series D Redeemable Convertible Preferred Stock.
In connection with the issuance of the Convertible Notes, the holders of the preferred stock who did not participate in the Convertible Notes financing agreed to convert the preferred stock held by the non-participating stockholders into common stock. As a result, 6 shares of Series B Preferred Stock and 574 shares of Series C Preferred Stock were converted to common stock.
In August 2010, the Company issued 11,269 shares of Series D Redeemable Convertible Preferred Stock (“Series D Preferred Stock”) at a price of $3.75 per share as part of the SBI transaction and 2,703 shares of Series D Redeemable Convertible Preferred Stock to extinguish the Convertible Notes. The Series D Preferred Stock is senior to the Series C, Series B, Series A, and Series A-1 Preferred Stock.
The holders of the Company’s Series A, A-1, B, C, and D Preferred Stock (collectively, the “Preferred Stock”) have the following rights and preferences:
Conversion—Each share of Series A, A-1, B, C and D Preferred Stock is initially convertible into one share of common stock. The conversion ratio is subject to adjustment for certain dilutive events, such as, but not limited to, stock splits and dividends. Conversion is at the option of the holder; however, it is automatic upon the closing of a public offering underwritten by an investment banking firm pursuant to an effective registration statement covering the offer and sale of common stock for the account of the Company to the public for a total offering of at least $20,000, or at a date agreed to in writing by the holders of at least 67% of the then-outstanding shares of Series A, A1, B, C and D Preferred Stock, voting as a single class.
F-24
Table of Contents
MASCOMA CORPORATION
NOTES TO CONSOLIDATED FINANCIAL STATEMENTS (continued)
Dividends—The holders of Series A, A-1, B, C, and D Preferred Stock are entitled to receive noncumulative dividends on a pari passu basis in proportion to the preferential amount each holder is entitled to receive, at the rate of $0.064, $0.08, $0.2136, $0.512, and $0.30 per share per annum, respectively, in preference to any dividends on common stock, if and when declared by the Board of Directors. Holders are entitled, on an as converted basis, to participate on a pro rata basis in any dividends paid to common stock holders. No dividends have been declared by the Board of Directors from inception through December 31, 2010.
Voting—The holders of Series A, A-1, B, C, and D Preferred Stock are entitled to the number of votes equal to the number of common shares into which they are convertible.
Liquidation—In the event of liquidation, dissolution, or winding-up of the Company, the holders of shares of Series A, A-1, B, C and D Preferred Stock will receive, in preference to the common stockholders, an amount equal to the greater of (i) $0.80, $1.00, $2.67, $6.40, and $3.75 per share, respectively, plus all dividends declared but unpaid on such shares or (ii) the amount the holders would receive if the Preferred Stock were converted to common stock prior to the liquidating event. After the payment of all preferential amounts, the remaining assets available for distribution shall be distributed among the holders of the shares of common stock ratably in proportion to the number of shares of common stock held by each, subject to any reorganization, reclassification, or other similar recapitalization affecting such shares.
Redemption—Upon receiving notice, at any time on or after September 1, 2017, from holders of at least 67% of the shares of Preferred Stock requesting that shares of Preferred Stock be redeemed, out of funds legally available, the Company will be required to redeem, subject to certain conditions, Series A, A-1, B, C, and D Preferred Stock in an amount equal to $0.80, $1.00, $2.67, $6.40, and $3.75 per share, respectively, plus all dividends accrued and declared but unpaid on such shares, payable in three annual installments of approximately $51,300.
Registration Rights—The holders of shares of preferred stock and certain warrants are entitled to certain registration rights, including demand rights and piggyback rights, with respect to these securities, as set forth in the registration rights agreement between the Company and the holders of these securities or the terms of the warrants. These registration rights would require the Company to use its best efforts to register the shares of the Company’s common stock underlying the preferred stock, warrants and convertible debt for sale under the Securities Act of 1933, subject to certain conditions and limitations. The cost of registration would be incurred by the Company.
Preferred Stock at December 31, 2009 and 2010 includes the following:
| Number of Shares | Carrying value at December 31 | |||||||||||||||||||
| Class of Preferred Stock |
Authorized and Designated |
Issued and outstanding |
Liquidation Preference at December 31, 2010 |
2009 | 2010 | |||||||||||||||
| Series A |
5,000 | 5,000 | $ | 4,000 | $ | 3,886 | $ | 3,910 | ||||||||||||
| Series A-1 |
5,163 | 5,000 | 5,000 | 4,985 | 4,987 | |||||||||||||||
| Series B |
11,498 | 11,236 | 30,000 | 29,945 | 29,945 | |||||||||||||||
| Series C |
10,238 | 9,777 | 62,575 | 65,488 | 61,976 | |||||||||||||||
| Series D |
15,330 | 13,972 | 52,395 | — | 52,394 | |||||||||||||||
|
|
|
|
|
|
|
|
|
|
|
|||||||||||
| Total |
47,229 | 44,985 | $ | 153,970 | $ | 104,304 | $ | 153,212 | ||||||||||||
|
|
|
|
|
|
|
|
|
|
|
|||||||||||
F-25
Table of Contents
MASCOMA CORPORATION
NOTES TO CONSOLIDATED FINANCIAL STATEMENTS (continued)
The following table summarizes the activity with respect to the redeemable convertible preferred stock for each of the three years in the period ended December 31, 2010:
| Redeemable Preferred Stock |
||||||||
| Shares | Amount | |||||||
| BALANCE—January 1, 2008 |
21,867 | $ | 43,961 | |||||
| Issuance of Series C redeemable convertible preferred stock—net of issuance costs of $1,126 |
9,531 | 59,874 | ||||||
| Conversion of Series B-1 convertible preferred stock into Series C redeemable convertible preferred stock |
195 | — | ||||||
| Accretion of issuance costs |
— | 216 | ||||||
|
|
|
|
|
|||||
| BALANCE—December 31, 2008 |
31,593 | 104,051 | ||||||
| Accretion of issuance costs |
— | 253 | ||||||
|
|
|
|
|
|||||
| BALANCE—December 31, 2009 |
31,593 | 104,304 | ||||||
| Issuance of Series D redeemable convertible preferred stock—net of issuance costs of $180 |
11,269 | 42,258 | ||||||
| Conversion of convertible notes and accrued interest into Series D redeemable convertible preferred stock |
2,703 | 10,135 | ||||||
| Preferred stock converted into common shares |
(580 | ) | (3,690 | ) | ||||
| Accretion of issuance costs |
— | 205 | ||||||
|
|
|
|
|
|||||
| BALANCE—December 31, 2010 |
44,985 | $ | 153,212 | |||||
|
|
|
|
|
|||||
14. STOCKHOLDERS’ DEFICIT AND STOCK OPTION PLAN
Authorized Capital Stock—As of December 31, 2010, the Company had authorized 75,000 shares of common stock and 47,229 shares of preferred stock.
2006 Stock Incentive Plan—During 2006, the Board of Directors approved the 2006 Stock Incentive Plan (the “Plan”). Under the terms of the Plan, incentive stock options (ISOs) may be granted to employees, and nonqualified stock options and restricted stock awards may be granted to directors, consultants, advisors, employees, and officers of the Company. The exercise price of ISOs cannot be less than the fair market value of the Company’s common stock on the date of grant. The options vest over a period determined by the Board of Directors, generally five years, and expire not more than ten years from the date of grant. As of December 31, 2010, the Company’s authorized common stock includes 14,050 common stock shares reserved for issuance under the Plan, of which options for 7,239 shares are available for future grants.
F-26
Table of Contents
MASCOMA CORPORATION
NOTES TO CONSOLIDATED FINANCIAL STATEMENTS (continued)
Stock option activity under the Plan during the year ended December 31, 2010, was as follows:
| Number of Shares |
Weighted- Average Exercise Price |
Weighted- Average Remaining Contractual Term (Years) |
||||||||||
| Outstanding—January 1, 2010 |
5,161 | $ | 1.97 | |||||||||
| Grants |
3,138 | 2.61 | ||||||||||
| Exercised |
(60 | ) | 0.38 | |||||||||
| Expired or cancelled |
(4 | ) | 2.86 | |||||||||
| Forfeited |
(1,412 | ) | 2.06 | |||||||||
|
|
|
|||||||||||
| Outstanding—December 31, 2010 |
6,823 | $ | 2.21 | 8.07 | ||||||||
|
|
|
|||||||||||
| Vested and expected to vest—December 31, 2010 |
6,415 | $ | 2.18 | 8.88 | ||||||||
| Exercisable—December 31, 2010 |
3,221 | $ | 1.65 | 7.19 | ||||||||
The weighted-average grant-date fair value of options granted during the years ended December 31, 2008, 2009 and 2010, was $2.20, $2.19 and $2.02, respectively. The intrinsic value of options exercised during the years ended December 31, 2008, 2009 and 2009, was $62, $164 and $96, respectively. As of December 31, 2010, there is approximately $6,098 of total unrecognized compensation expense related to unvested share-based compensation arrangements granted under the Plan. That cost is expected to be recognized over a weighted-average period of 3.45 years.
The Company uses the Black-Scholes option-pricing model to value option grants and to determine the related compensation expense. The following table provides the assumptions used in determining the fair value of the share-based awards for the years ended December 31:
| 2008 | 2009 | 2010 | ||||||||||
| Risk-free rate |
1.42%-3.59% | 2.09%-3.11% | 1.36%-2.86% | |||||||||
| Expected life |
5.39-9.28 years | 5.00-6.32 years | 5.00-6.32 years | |||||||||
| Expected volatility |
90% | 95% | 95% | |||||||||
| Expected dividend |
0% | 0% | 0% | |||||||||
The Company does not have a history of market prices of its common stock as the Company does not have publicly traded stock, and, as such, volatility is estimated using historical volatilities of similar publicly traded entities. The expected life of the awards is based on the contractual life of the option and vesting periods, historical exercise patterns, as well as the expected term of employee options. The Company has no history of paying dividends nor does management expect to pay dividends over the contractual terms of these options. The risk-free interest rates are based on the United States Treasury yield curve in effect at the time of grant.
In determining the exercise prices for options granted, the Company’s Board of Directors determined the fair value of the common stock as of the measurement date after considering a broad range of factors, including results obtained from an independent third-party valuation, the illiquid nature of an investment in the Company’s common stock, the Company’s historical financial performance and financial position, the Company’s future prospects and opportunity for liquidity events, and sale and offer prices of redeemable convertible preferred stock in private transactions negotiated at arm’s length.
F-27
Table of Contents
MASCOMA CORPORATION
NOTES TO CONSOLIDATED FINANCIAL STATEMENTS (continued)
No stock compensation expense has been capitalized by the Company. Total stock compensation expense has been recognized in the consolidated statements of operations as follows for the years ended December 31:
| 2008 | 2009 | 2010 | ||||||||||
| Research and development |
$ | 810 | $ | 1,328 | $ | 988 | ||||||
| Selling, general and administrative |
835 | 504 | 1,496 | |||||||||
|
|
|
|
|
|
|
|||||||
| Total stock-based compensation expense |
$ | 1,645 | $ | 1,832 | $ | 2,484 | ||||||
|
|
|
|
|
|
|
|||||||
Restricted Stock—Since inception, the Company has sold the founders and other officers restricted shares of common stock at the then fair value of the stock. The restrictions provided the Company with the ability to repurchase the unvested shares at the original purchase price through the vesting period, which was generally four years.
The Company has accounted for the restricted shares as equity awards based on the fact that the shares are not anticipated to be repurchased by the Company within six months of vesting. However, the exercise is not considered substantive, and as a result, the cash paid for the purchase price is considered a deposit or a prepayment of the exercise price that should be recognized by the employer as a liability until the repurchase right lapses. Furthermore, these shares are not considered issued and outstanding for accounting purposes until they vest. For each of the three years in the periods ended December 31, 2010, the activity with respect to the restricted stock has been de minimis. At December 31, 2010 there were no shares remaining that were unvested.
15. INCOME TAXES
The losses before the impact of income taxes for the years ended December 31, consisted of the following:
| 2008 | 2009 | 2010 | ||||||||||
| United States |
$ | (30,461 | ) | $ | (35,472 | ) | $ | (24,410 | ) | |||
| Canada |
— | — | (1,519 | ) | ||||||||
|
|
|
|
|
|
|
|||||||
| Total |
$ | (30,461 | ) | $ | (35,472 | ) | $ | (25,929 | ) | |||
|
|
|
|
|
|
|
|||||||
The Company has not recorded any tax provision in the years presented due to the losses incurred and a full valuation allowance. The difference between the income tax expense at the U.S. federal statutory rate and the recorded provision is primarily due to the valuation allowance provided on all deferred tax assets.
Components of the net deferred tax asset as of December 31, 2009 and 2010 are as follows:
| 2009 | 2010 | |||||||
| Deferred tax assets (liabilities) |
||||||||
| Operating loss carryforwards |
$ | 19,980 | $ | 25,932 | ||||
| Depreciation and amortization |
5,350 | 3,680 | ||||||
| Basis difference in equity method investment |
— | (555 | ) | |||||
| Capitalized start-up costs |
3,690 | 804 | ||||||
| Accrued expenses |
957 | 1,522 | ||||||
| Credits |
1,436 | 2,325 | ||||||
| Deferred revenue |
3,013 | 6,783 | ||||||
| Stock compensation |
647 | 877 | ||||||
|
|
|
|
|
|||||
| Total deferred tax assets |
35,073 | 41,368 | ||||||
| Valuation allowance for deferred tax assets |
(35,073 | ) | (41,368 | ) | ||||
|
|
|
|
|
|||||
| Net deferred tax assets |
$ | — | $ | — | ||||
|
|
|
|
|
|||||
F-28
Table of Contents
MASCOMA CORPORATION
NOTES TO CONSOLIDATED FINANCIAL STATEMENTS (continued)
At December 31, 2010, the Company had U.S. federal and state net operating loss carryforwards of approximately $65,000 and $20,700, respectively, available to reduce future taxable income, if any. At December 31, 2009 and 2010, the Company also had U.S. federal and state research and development tax credit carryforwards of $550 and $1,500, respectively, available to be used as a reduction of future federal income taxes and state income taxes. The net operating loss carryforwards and tax credits expire at various dates from 2025 through 2030.
On August 31, 2010, the Company acquired 100% of the shares of SBI, a company with headquarters in Canada. At December 31, 2010, the Company had Canadian loss carryforwards of $10,617 available to offset future taxable income, if any. At December 31, 2010, the Company had Canadian research and development and investment tax credit carryforwards of $1,007, available to be used as a reduction of future Canadian income taxes. The Canadian carryforwards and credits expire at various dates from 2027 through 2030.
The valuation allowance increased by $9,800, $13,400 and $6,295 in 2008, 2009 and 2010, respectively, due to the acquisition of SBI’s deferred tax assets and an increase in the U.S. deferred tax assets (primarily the operating loss carryforwards) and the full valuation allowance against these assets.
Utilization of the Company’s net operating losses and research and development credit carryforwards may be subject to a substantial annual limitation due to ownership change limitations that have occurred previously or that could occur in the future in accordance with Section 382 of the Internal Revenue Code, as well as similar state provisions. These ownership changes may limit the amount of net operating losses and credit carryforwards that can be utilized annually to offset future taxable income and taxes, respectively. In general, an ownership change results from transactions increasing the ownership of certain stockholders or public groups in the stock of a corporation by more than 50 percentage points over a three-year period. The Company has not conducted a study to assess whether a change of control has occurred or whether there have been multiple changes of control since inception due to the significant complexity and cost associated with such a study. If a change of control has occurred, the utilization of the net operating losses or credit carryforwards would be subject to an annual limitation. A limitation may result in expiration of a portion of the net operating losses or credit carryforwards before utilization.
The Company has not identified any material uncertain tax positions. As a result of the net operating loss and credit carryovers, the Company’s U.S. federal and state tax returns for the years 2005 and forward remain open to examination by taxing authorities. Similarly, the Canadian tax returns are subject to audit for all periods since inception.
16. GOVERNMENT GRANTS
In October 2007, the Company was awarded $14,800 from the New York State Energy Research and Development Authority (NYSERDA) to build and operate a biomass-to-ethanol demonstration plant in Rome, New York. Through December 31, 2010, the Company received $13,808 in proceeds from this government award. The proceeds of the government grant have been deferred and are being recognized over the weighted-average depreciable life of the demonstration plant and equipment. The Company recognized $1,430, $3,104 and $2,616 in revenue associated with the grant during 2008, 2009 and 2010, respectively.
In May 2008, the Company was awarded $2,980 from the U.S. Department of Energy (DOE) for the development of an organism for the conversion of lignocellulose to ethanol. In 2009, the Company received approval for additional funding bringing the total award to approximately $4,296. The total cost of this project is estimated at $7,156. Through December 31, 2010, the Company received proceeds totaling $3,547 from this contract. The Company recognized $1,383, $1,595 and $645 in revenue associated with the contract during 2008, 2009 and 2010, respectively.
F-29
Table of Contents
MASCOMA CORPORATION
NOTES TO CONSOLIDATED FINANCIAL STATEMENTS (continued)
In June 2008, the Company was awarded $6,295 from the BioEnergy Science Center (BESC) to perform research and development to achieve advances in sustainable production and economical conversion of lignocelulosic biomass enabling the production of biofuels. Through December 31, 2010, the Company received proceeds totaling $4,606 from this contract. The Company, in cooperation with BESC, has subcontracted this work to a university and the Company is acting as an agent for the university. The Company has evaluated the terms and conditions of this arrangement, as well as the rights and responsibilities of the Company and the university, and concluded that the proceeds should be reported net of the costs paid to the university.
In September 2008, the Company was awarded $10,066 from the DOE. In 2009, the Company received approval for additional funding bringing the total award to approximately $16,480. The project objectives are to prototype and build an industrial-scale fermenter system and concurrently design, construct, and operate an integrated cellulose ethanol plant for transforming locally grown mixed hardwoods or switchgrass into ethanol. The total cost of this project is estimated at $33,973. Through December 31, 2010, the Company received $14,293 in proceeds from this government award. The Company recognized $1,083, $3,764 and $10,015 in revenue associated with the grant during 2008, 2009 and 2010, respectively. In July 2011, the DOE and the Company agreed to expand the scope, and the DOE increased the approved funding under this arrangement to $20,010. The total projected costs were increased to $41,298.
In December 2008, the Company was awarded $20,000 from MEDC. The Company received this award to promote the development, acceleration, and sustainability of energy excellence sectors in Michigan. The Company received $12,100 in proceeds from this government award in 2009 which has been recorded as deferred revenue and is expected to be amortized to revenue when the ethanol production facility in Michigan is placed into service.
In March 2010, SBI was awarded $840 from the Canadian province of Alberta. SBI received this award to perform preliminary development work on a proposed ethanol production facility in Alberta. The Company received $840 in proceeds under this award and has provided a standby letter of credit in the same amount to the province of Alberta. As eligible expenses are incurred, the letter of credit will be reduced and the corresponding amount of revenue recognized. At December 31, 2010 no revenue has been recognized and the full amount is shown on the balance sheet as deferred revenue.
17. SEGMENT REPORTING
The Company’s chief operating decision maker, who is the Company’s Chief Executive Officer, is provided with and reviews the financial results of the Company’s two operating segments: the U.S. segment and the Canadian segment.
The U.S. segment includes the Company’s domestic operation and is responsible for all research and development efforts and commercialization efforts related to the Company’s consolidated bioprocessing technology as well as corporate and other general and administrative functions. This segment receives revenue from the administration of government grants and certain other service arrangements. In addition, the U.S. segment includes the results of Frontier, which is expected to own and operate cellulosic ethanol facilities, along with other strategic industry participants, that utilize the Company’s consolidated bioprocessing technology. The operations of Frontier have been de minimis through December 31, 2010.
The Canadian segment was formed upon the completion of the acquisition of SBI in August 2010 and includes an investment in Xylitol, which is accounted for using the equity method of accounting. The Canadian segment develops and sells capital equipment and technology for the conversion of biomass feedstocks to ethanol producers, conducts research and development to advance certain technology, and incurs other general and administrative expenses.
F-30
Table of Contents
MASCOMA CORPORATION
NOTES TO CONSOLIDATED FINANCIAL STATEMENTS (continued)
The accounting policies of our segments are consistent with those policies described in Note 2. Given the limited history of operations with SBI and limited integration of the acquired business, there are no intercompany transactions or corporate allocations reflected in the reported segment information for the period ended December 31, 2010.
Given the recent acquisition of SBI and the evolving management and reporting structure of the Company, the Company expects that it will re-assess its reporting segments as the SBI business is integrated and the Company pursues other business development activities.
The following table presents information about our operating segments for the year ended December 31, 2010. No information is presented for periods prior to the acquisition of SBI as the Company was managed as a single segment in those periods.
| U.S. | Canadian | Total | ||||||||||
| For the Year Ended December 31, 2010 |
||||||||||||
| Revenues |
$ | 14,026 | $ | 1,466 | $ | 15,492 | ||||||
| Net loss |
(24,410 | ) | (1,519 | ) | (25,929 | ) | ||||||
| Depreciation and amortization |
$ | 8,206 | $ | 619 | $ | 8,825 | ||||||
| Equity in loss of equity method investment |
— | 143 | 143 | |||||||||
| Capital expenditures |
8,129 | 256 | 8,385 | |||||||||
| As of December 31, 2010 |
||||||||||||
| Property and equipment |
$ | 31,297 | $ | 2,547 | $ | 33,844 | ||||||
| Equity method investment in Xylitol |
— | 4,692 | 4,692 | |||||||||
| Intangible assets, net |
— | 7,007 | 7,007 | |||||||||
| Goodwill |
— | 22,488 | 22,488 | |||||||||
18. 401(K) PLAN
In September 2006, the Company adopted a 401(k) retirement and savings plan (the “401(k) plan”) covering all employees. The 401(k) plan allows each participant to contribute up to an amount not to exceed an annual statutory maximum. The Company may elect to match employee contributions. The Company has not made any matching contributions through December 31, 2010.
19. SUBSEQUENT EVENTS
In January 2011, the Company sold 1,333 shares of Series D Redeemable Convertible Preferred Stock to a new investor at a price of $3.75 for gross proceeds of $5,000. These securities are identical to the Series D Redeemable Convertible Preferred Stock issued in 2010. In addition, the investor received warrants to purchase 1,333 shares of Series D Redeemable Convertible Preferred Stock at an exercise price of $3.75 per share. In August 2011, the warrants were exercised and the Company received $5,000.
In June 2011, the 2008 Growth Capital Agreement was amended, the outstanding principal totaling $1,418 was repaid and $10,000 was drawn on the amended facility, which bears interest at an annual rate of 11%. The Company issued warrants for the purchase of 660 shares of common stock at a price of $1.97 per share in connection with the amended agreement. The new warrants provide the holders with a settlement provision that guarantees a specified minimum return on their investment during the holding period. The amended agreement provides the Company with ability to borrow an additional $10,000 if the Company completes a qualified financing. The Company recognized $2,363 for the extinguishment of the existing debt. The incremental
F-31
Table of Contents
MASCOMA CORPORATION
NOTES TO CONSOLIDATED FINANCIAL STATEMENTS (continued)
borrowings bear interest at the rate that is the greater of 11% or prime rate plus 7.75%. The terms of the amended agreement restrict the Company’s ability to engage in certain actions, including disposing of certain assets, granting or otherwise allowing the imposition of a lien against certain assets, incurring certain kinds of additional indebtedness, acquiring or merging with another entity, or declaring dividends without prior approval of the creditor.
In August 2011, the Company entered into a Subordinated Convertible Note and Warrant Purchase Agreement, amended in September 2011, pursuant to which amended agreement the Company issued subordinated convertible promissory notes to certain existing investor’s in the aggregate principal amount of approximately $7,354. The notes accrue interest at a rate of 8% per annum. These investors are entitled to receive warrants to purchase $1,774 of either our preferred stock at the price at which the securities are sold upon a qualified financing or our common stock at a 30% discount to the price paid by the public upon an initial public offering, whichever occurs first.
F-32
Table of Contents
MASCOMA CORPORATION
UNAUDITED CONDENSED CONSOLIDATED BALANCE SHEETS
(Amounts in thousands, except per share data)
| December 31, 2010 |
June 30, 2011 |
Pro forma as of June 30, 2011 (Note 1) |
||||||||||
| ASSETS |
||||||||||||
| CURRENT ASSETS: |
||||||||||||
| Cash and cash equivalents |
$ | 6,741 | $ | 9,836 | $ | 9,836 | ||||||
| Restricted cash |
1,799 | 1,799 | 1,799 | |||||||||
| Short-term investments |
5,148 | 2,256 | 2,256 | |||||||||
| Accounts receivable |
3,613 | 3,774 | 3,774 | |||||||||
| Prepaid expenses and other current assets |
413 | 568 | 568 | |||||||||
|
|
|
|
|
|
|
|||||||
| Total current assets |
17,714 | 18,233 | 18,233 | |||||||||
| PROPERTY AND EQUIPMENT—Net |
33,844 | 32,745 | 32,745 | |||||||||
| EQUITY METHOD INVESTMENT |
4,692 | 4,519 | 4,519 | |||||||||
| INTANGIBLE ASSETS, NET OF AMORTIZATION |
7,007 | 6,237 | 6,237 | |||||||||
| GOODWILL |
22,488 | 22,488 | 22,488 | |||||||||
| DEPOSITS AND DEFERRED FINANCING COSTS |
1,380 | 1,604 | 1,604 | |||||||||
|
|
|
|
|
|
|
|||||||
| TOTAL |
$ | 87,125 | $ | 85,826 | $ | 85,826 | ||||||
|
|
|
|
|
|
|
|||||||
| LIABILITIES, REDEEMABLE COMMON STOCK, REDEEMABLE CONVERTIBLE PREFERRED STOCK, AND STOCKHOLDERS’ DEFICIT |
||||||||||||
| CURRENT LIABILITIES: |
||||||||||||
| Accounts payable |
3,166 | 2,019 | 2,019 | |||||||||
| Accrued expenses |
3,022 | 4,270 | 4,270 | |||||||||
| Deferred grant revenue |
3,800 | 3,700 | 3,700 | |||||||||
| Current portion of long term debt and capital lease |
3,451 | 1,862 | 1,862 | |||||||||
|
|
|
|
|
|
|
|||||||
| Total current liabilities |
13,439 | 11,851 | 11,851 | |||||||||
| LONG-TERM PORTION OF LEASE OBLIGATIONS AND DEFERRED RENT—Net of current portion |
794 | 610 | 610 | |||||||||
| LONG-TERM DEFERRED GRANT REVENUE—Net of current portion |
15,898 | 14,469 | 14,469 | |||||||||
| LONG-TERM DEBT—Net of discount and current portion |
— | 8,138 | 8,138 | |||||||||
| WARRANT LIABILITIES |
5,445 | 7,429 | — | |||||||||
|
|
|
|
|
|
|
|||||||
| Total liabilities |
35,576 | 42,497 | 35,068 | |||||||||
|
|
|
|
|
|
|
|||||||
| COMMITMENTS |
— | — | — | |||||||||
| REDEEMABLE NONCONTROLLING INTEREST |
2,629 | 2,610 | 2,610 | |||||||||
| REDEEMABLE CONVERTIBLE PREFERRED STOCK |
153,212 | 158,269 | ||||||||||
| REDEEMABLE COMMON STOCK—At redemption value |
788 | 1,172 | — | |||||||||
| STOCKHOLDERS’ DEFICIT: |
||||||||||||
| Common stock, $0.001 par value—75,000 shares authorized; 7,485 shares issued and 7,325 outstanding, at December 31, 2010 and at June 30, 2011, 54,043 shares issued and outstanding pro forma |
7 | 7 | 54 | |||||||||
| Additional paid-in capital |
18,841 | 19,716 | 186,539 | |||||||||
| Accumulated deficit |
(123,458 | ) | (137,975 | ) | (137,975 | ) | ||||||
| Treasury stock—at cost (160 shares) |
(470 | ) | (470 | ) | (470 | ) | ||||||
|
|
|
|
|
|
|
|||||||
| Total stockholders’ deficit |
(105,080 | ) | (118,722 | ) | 48,148 | |||||||
|
|
|
|
|
|
|
|||||||
| TOTAL |
$ | 87,125 | $ | 85,826 | $ | 85,826 | ||||||
|
|
|
|
|
|
|
|||||||
The accompanying notes are an integral part of these condensed unaudited condensed consolidated financial statements
F-33
Table of Contents
MASCOMA CORPORATION
UNAUDITED CONDENSED CONSOLIDATED STATEMENTS OF OPERATIONS
(Amounts in thousands, except per share data)
| Six months ended June 30, |
||||||||
| 2010 | 2011 | |||||||
| REVENUES: |
||||||||
| Product sales |
$ | — | $ | 615 | ||||
| Government grants |
5,645 | 5,953 | ||||||
| Other service arrangements |
66 | 100 | ||||||
|
|
|
|
|
|||||
| Total revenues |
5,711 | 6,668 | ||||||
|
|
|
|
|
|||||
| COST OF PRODUCT SALES AND OPERATING EXPENSES: |
||||||||
| Cost of product sales |
— | 455 | ||||||
| Research and development |
12,450 | 13,203 | ||||||
| Selling, general and administrative |
3,947 | 5,036 | ||||||
|
|
|
|
|
|||||
| Total cost and operating expenses |
16,397 | 18,694 | ||||||
|
|
|
|
|
|||||
| LOSS FROM OPERATIONS |
(10,686 | ) | (12,026 | ) | ||||
| OTHER INCOME (EXPENSE): |
||||||||
| Interest income |
83 | 15 | ||||||
| Interest expense and other financing costs |
205 | (2,352 | ) | |||||
|
|
|
|
|
|||||
| Other income (expense) net |
288 | (2,337 | ) | |||||
|
|
|
|
|
|||||
| EQUITY IN LOSS OF EQUITY METHOD INVESTMENT |
— | (173 | ) | |||||
|
|
|
|
|
|||||
| NET LOSS |
(10,398 | ) | (14,536 | ) | ||||
| AMOUNT ATTRIBUTABLE TO REDEEMABLE NONCONTROLLING INTEREST |
87 | 19 | ||||||
|
|
|
|
|
|||||
| NET LOSS ATTRIBUTABLE TO MASCOMA CORPORATION |
(10,311 | ) | (14,517 | ) | ||||
| ACCRETION OF REDEEMABLE CONVERTIBLE PREFERRED STOCK |
(124 | ) | (279 | ) | ||||
|
|
|
|
|
|||||
| NET LOSS ATTRIBUTABLE TO COMMON STOCKHOLDERS OF MASCOMA CORPORATION |
$ | (10,435 | ) | $ | (14,796 | ) | ||
|
|
|
|
|
|||||
| NET LOSS ATTRIBUTABLE TO MASCOMA COMMON STOCKHOLDERS PER SHARE—BASIC AND DILUTED |
$ | (3.15 | ) | $ | (1.92 | ) | ||
| Weighted-average common shares outstanding—basic and diluted |
3,316 | 7,725 | ||||||
| Pro forma net loss attributable to Mascoma common stockholders per share—basic and diluted (Note 1) |
$ | (0.27 | ) | |||||
| Pro forma weighted-average common shares outstanding—basic and diluted |
54,043 | |||||||
The accompanying notes are an integral part of these condensed unaudited condensed consolidated financial statements
F-34
Table of Contents
MASCOMA CORPORATION
UNAUDITED CONDENSED CONSOLIDATED STATEMENT OF STOCKHOLDERS’ DEFICIT
(Amounts in thousands)
| Common | Additional Paid-In Capital |
Accumulated Deficit |
Treasury | Total | ||||||||||||||||||||||||
| Shares | Amount | Shares | Amount | |||||||||||||||||||||||||
| At January 1, 2011 |
7,485 | $ | 7 | $ | 18,841 | $ | (123,458 | ) | 160 | $ | (470 | ) | $ | (105,080 | ) | |||||||||||||
| Stock-based compensation expense |
— | — | 1,538 | — | — | — | 1,538 | |||||||||||||||||||||
| Accretion of redeemable convertible preferred stock |
— | — | (279 | ) | — | — | — | (279 | ) | |||||||||||||||||||
| Adjustment to fair value of redeemable common stock |
— | — | (384 | ) | — | — | — | (384 | ) | |||||||||||||||||||
| Net loss |
(14,517 | ) | (14,517 | ) | ||||||||||||||||||||||||
|
|
|
|
|
|
|
|
|
|
|
|
|
|
|
|||||||||||||||
| At June 30, 2011 |
7,485 | $ | 7 | $ | 19,716 | $ | (137,975 | ) | 160 | $ | (470 | ) | $ | (118,722 | ) | |||||||||||||
|
|
|
|
|
|
|
|
|
|
|
|
|
|
|
|||||||||||||||
The accompanying notes are an integral part of these condensed unaudited condensed consolidated financial statements
F-35
Table of Contents
MASCOMA CORPORATION
UNAUDITED CONDENSED CONSOLIDATED STATEMENTS OF CASH FLOWS
(Amounts in thousands)
| Six Months Ended June 30, | ||||||||
| 2010 | 2011 | |||||||
| CASH FLOWS FROM OPERATING ACTIVITIES: |
||||||||
| Net loss |
$ | (10,398 | ) | $ | (14,536 | ) | ||
| Adjustments to reconcile net loss to net cash used in operating activities: |
||||||||
| Depreciation and amortization |
3,594 | 5,016 | ||||||
| Loss on asset disposal |
31 | — | ||||||
| Stock-based compensation expense |
1,022 | 1,538 | ||||||
| Decrease in fair value of warrant liabilities |
(407 | ) | (160 | ) | ||||
| Warrants issued for financing, debt discount amortization and other non-cash charges |
207 | 2,235 | ||||||
| Deferred grant revenues |
(1,308 | ) | (1,529 | ) | ||||
| Equity in loss of equity method investment |
— | 173 | ||||||
| Changes in operating assets and liabilities: |
||||||||
| Accounts receivable |
(280 | ) | (161 | ) | ||||
| Prepaid expenses and other current assets |
95 | (214 | ) | |||||
| Other long-term assets |
(121 | ) | 18 | |||||
| Accounts payable |
189 | (1,347 | ) | |||||
| Accrued expenses and other liabilities |
(409 | ) | 1,064 | |||||
|
|
|
|
|
|||||
| Net cash used in operating activities |
(7,785 | ) | (7,903 | ) | ||||
|
|
|
|
|
|||||
| CASH FLOWS FROM INVESTING ACTIVITIES: |
||||||||
| Purchases of property and equipment |
(2,041 | ) | (3,188 | ) | ||||
| Restricted cash |
(25 | ) | — | |||||
| Purchase of short-term investments |
(3,149 | ) | (7,617 | ) | ||||
| Proceeds from sale of short-term investments |
5,588 | 10,509 | ||||||
|
|
|
|
|
|||||
| Net cash provided by (used in) investing activities |
373 | (296 | ) | |||||
|
|
|
|
|
|||||
| CASH FLOWS FROM FINANCING ACTIVITIES: |
||||||||
| Proceeds from issuance of bridge note |
10,000 | — | ||||||
| Proceeds from issuance of long-term debt-net of issuance costs |
— | 9,903 | ||||||
| Proceeds from issuance of common stock and exercise of employee options |
20 | — | ||||||
| Proceeds from issuance of preferred stock—net of issuance costs |
— | 4,903 | ||||||
| Payments for capital leases |
(44 | ) | (22 | ) | ||||
| Payment of long-term debt |
(1,946 | ) | (3,490 | ) | ||||
|
|
|
|
|
|||||
| Net cash provided by financing activities |
8,030 | 11,294 | ||||||
|
|
|
|
|
|||||
| NET INCREASE IN CASH AND CASH EQUIVALENTS |
618 | 3,095 | ||||||
| CASH AND CASH EQUIVALENTS—Beginning of period |
7,848 | 6,741 | ||||||
|
|
|
|
|
|||||
| CASH AND CASH EQUIVALENTS—End of period |
$ | 8,466 | $ | 9,836 | ||||
|
|
|
|
|
|||||
| SUPPLEMENTAL DISCLOSURE OF NONCASH FINANCING ACTIVITIES: |
||||||||
| Purchases of property and equipment and construction in progress in accounts payable and accrued expenses |
$ | 814 | $ | 208 | ||||
| Deferred offering costs included in accounts payable and accrued expense |
— | 300 | ||||||
The accompanying notes are an integral part of these condensed unaudited condensed consolidated financial statements
F-36
Table of Contents
MASCOMA CORPORATION
NOTES TO UNAUDITED CONDENSED CONSOLIDATED FINANCIAL STATEMENTS
AS OF DECEMBER 30, 2010 AND FOR THE SIX MONTHS ENDED JUNE 30, 2010 AND 2011
(AMOUNTS IN THOUSANDS, EXCEPT PER SHARE DATA)
1. DESCRIPTION OF BUSINESS AND BASIS OF PRESENTATION
Description of business
Mascoma Corporation (the “Company”), was founded on October 14, 2005. The Company is incorporated under the laws of the state of Delaware and is a renewable fuels company that has developed technology for the conversion of abundant and low-cost biomass. On August 31, 2010, the Company acquired 100% of SunOpta Bioprocess Inc. (“SBI”), located outside of Toronto, Canada, and formed Mascoma Canada, Inc. (“Mascoma Canada”). Mascoma Canada designs and manufactures equipment that processes cellulosic biomass for further biological or chemical conversion such as those conversion technologies developed by the Company. The Company’s headquarters are in Lebanon, New Hampshire. The Company also has operations in Rome, New York and Toronto, Canada.
Basis of presentation
The accompanying unaudited condensed consolidated financial statements have been prepared in conformity with accounting principles generally accepted in the United States and include the accounts of the Company and its majority-owned subsidiaries, including Mascoma Canada, a wholly owned subsidiary, and Frontier Renewable Resources, LLC (“Frontier”), in which the Company holds a 75% interest. All intercompany accounts and transactions have been eliminated in consolidation. The noncontrolling interest in Frontier is contingently redeemable and is carried outside of permanent equity. The consolidated statements of operations reflect an adjustment for the portion of operations that are attributable to the noncontrolling interest in Frontier. Also included and presented as an affiliated company using the equity method of accounting for investments is a 31% interest in Xylitol Canada, Inc. (“Xylitol”). The unaudited condensed consolidated financial statements should be read in conjunction with the annual consolidated financial statements and the notes thereto as of and for the year ended December 31, 2010, included elsewhere in this prospectus.
The accompanying unaudited condensed consolidated financial statements have been prepared in accordance with the rules and regulations of the Securities Exchange Commission (“SEC”) for interim financial information. Accordingly, the financial statements do not include all of the information and notes required by generally accepted accounting principles for complete financial statements. The unaudited interim financial statements have been prepared on the same basis as the annual financial statements and, in the opinion of management, reflect all adjustments, which include only normal recurring adjustments, necessary to present fairly the Company’s financial position at June 30, 2011 and results of operations and cash flows for the six months ended June 30, 2010 and 2011. The Company considers events or transactions that occur after the balance sheet date but prior to issuance of the financial statements to provide additional evidence related to certain estimates or to identify matters that require additional disclosure. The results of the six months ended June 30, 2011 are not necessarily indicative of the results to be expected for the year ending December 31, 2011 or for any other interim period or for any other future year.
Going concern
The accompanying unaudited condensed consolidated financial statements of the Company have been prepared on a basis which assumes that the Company will continue as a going concern, which contemplates the realization of assets and the satisfaction of liabilities and commitments in the normal course of business. As of June 30, 2011, the Company had an accumulated deficit of $137,975 and had generated recurring net losses and
F-37
Table of Contents
MASCOMA CORPORATION
NOTES TO UNAUDITED CONDENSED CONSOLIDATED FINANCIAL STATEMENTS (continued)
negative cash flows from operations. During the six months ended June 30, 2011, the Company incurred a net loss totaling $14,517 and used cash in operating activities totaling $7,903. The Company expects to continue to incur losses and use cash in operating activities for the remainder of 2011 and in 2012 and may never be profitable. These conditions raise substantial doubt about the Company’s ability to continue as a going concern.
At June 30, 2011, the Company had cash and cash equivalents totaling $9,836, of which $1,283 is held by Frontier and is designated for the construction of the production facility in Michigan. As described in Note 6 and in Note 10, subsequent to June 30, 2011, the Company has raised additional capital totaling $11.9 million in gross proceeds from the exercise of warrants and the issuance of new debt. In addition, the Company is actively engaged in identifying additional sources of debt and equity financing. The sale of additional convertible debt and equity securities may result in dilution of ownership for the Company’s current stockholders.
The Company’s projected uses of cash include funding operations, continued research and product development, capital expenditures, and debt service. Management believes that the existing cash along with the proceeds from the debt and equity raised in 2011 will be sufficient to meet the Company’s anticipated cash requirements through September 2012. However, the Company will need additional funds to continue operations and the development of its technologies beyond 2012 as well as to fund the design and construction of production facilities. If the Company is unable to secure additional funds it will need to implement significant cost reduction strategies which could limit the Company’s development activities and impact its long-term business plan.
The accompanying condensed consolidated financial statements do not include any adjustments that might result from the outcome of these uncertainties.
Unaudited pro forma information
The unaudited pro forma balance sheet as of June 30, 2011 reflects the conversion of all outstanding shares of preferred stock into shares of common stock and the conversion of the outstanding preferred stock warrants into warrants to purchase common stock as of that date, an event which would occur in the event of the closing of the Company’s proposed public offering on terms that result in the automatic conversion of the preferred stock, or upon the consent of holders of at least two-thirds of the outstanding shares of preferred stock. Unaudited pro forma net loss attributable to Mascoma common stockholders per share is computed using the weighted-average number of common shares outstanding, including the pro forma effect of the conversion of all preferred stock into shares of the Company’s common stock as if such conversion had occurred at the beginning of the year.
2. SIGNIFICANT ACCOUNTING POLICIES
Use of estimates
The preparation of consolidated financial statements in conformity with accounting principles generally accepted in the United States of America requires the Company’s management to make estimates and assumptions that affect the reported amounts and disclosure of assets and liabilities at the date of the consolidated financial statements and the reported amounts and disclosure of revenue and expenses during the reported periods. Actual results could differ from those estimates and assumptions.
Intangible assets
Intangible assets at June 30, 2011 are comprised primarily of developed technologies acquired as part of the SBI acquisition in August 2010. The assets are being amortized on a straight line basis over the estimated useful life, which has been determined to be approximately 5 years. Accumulated amortization totaled $513 at
F-38
Table of Contents
MASCOMA CORPORATION
NOTES TO UNAUDITED CONDENSED CONSOLIDATED FINANCIAL STATEMENTS (continued)
December 31, 2010 and $1,283 at June 30, 2011. The amortization expense in the six months ended June 30, 2011 was $770 and is expected to approximate annually $1,540 for 2011, $1,520 for 2012, $1,480 for 2013 and 2014 and $987 for 2015.
Deferred offering costs
Costs directly associated with the Company’s proposed initial public offering of common stock have been deferred. Upon completion of the offering, such costs will be recorded as a reduction of the proceeds received in arriving at the amount to be recorded in stockholders’ deficit. If a successful offering no longer appears probable, such costs will be expensed. At June 30, 2011, a total of $300 was included in long-term assets and accrued expenses.
Net Loss attributable to common stockholders per share
Basic net loss attributable to common stockholders per share is computed by dividing the net loss attributable to common stockholders by the weighted-average number of common shares outstanding for the period. Diluted net loss attributable to common stockholders per share is computed by dividing the net loss attributable to common stockholders by the weighted-average number of common shares and dilutive common share equivalents outstanding for the period, determined using the treasury-stock method and the as if-converted method, for convertible securities, if inclusion of these is not antidilutive. Because the Company has reported a net loss for all periods presented, diluted net loss per common share is the same as basic net loss per common share.
The following table summarizes the computation of basic and diluted net loss per share attributable to common stockholders of Mascoma Corporation for the six months ended June 30:
| 2010 | 2011 | |||||||
| Net loss attributable to Mascoma Corporation |
$ | (10,311 | ) | $ | (14,517 | ) | ||
| Accretion of redeemable convertible preferred stock |
(124 | ) | (279 | ) | ||||
|
|
|
|
|
|||||
| Net loss attributable to common stockholders of Mascoma Corporation |
(10,435 | ) | (14,796 | ) | ||||
|
|
|
|
|
|||||
| Weighted-average number of shares-basic and diluted |
3,316 | 7,725 | ||||||
| Net loss per attributable to Mascoma common stockholders per share-basic and diluted |
$ | (3.15 | ) | $ | (1.92 | ) | ||
The following potential common shares were excluded from the computation of diluted net loss attributable to common stockholders per share because they had an antidilutive impact due to the losses reported for the six months ended June 30:
| 2010 | 2011 | |||||||
| Options to purchase common stock |
6,377 | 9,535 | ||||||
| Warrants to purchase common stock |
1,000 | 1,659 | ||||||
| Warrants to purchase redeemable convertible preferred stock |
793 | 3,295 | ||||||
| Conversion of redeemable preferred stock |
31,593 | 46,318 | ||||||
F-39
Table of Contents
MASCOMA CORPORATION
NOTES TO UNAUDITED CONDENSED CONSOLIDATED FINANCIAL STATEMENTS (continued)
Pro forma basic and diluted net loss per share was calculated assuming the conversion of redeemable convertible preferred stock as follows (unaudited):
| Six months ended June 30, 2011 |
||||
| (in thousands, except share and per share data) |
||||
| Pro forma loss per share-basic and diluted |
||||
| Numerator: |
||||
| Net loss attributable to common stockholders of Mascoma Corporation |
$ | (14,796 | ) | |
| Add: Accretion of redeemable convertible preferred stock |
279 | |||
|
|
|
|||
| Pro forma net loss attributable to Mascoma Corporation |
$ | (14,517 | ) | |
|
|
|
|||
| Denominator: |
||||
| Weighted-average shares outstanding |
7,725 | |||
| Add: Adjustment to reflect assumed effect of conversion of redeemable convertible preferred stock |
46,318 | |||
|
|
|
|||
| Pro forma weighted-average shares outstanding |
54,043 | |||
|
|
|
|||
| Pro forma net loss per share-basic and diluted |
$ | (0.27 | ) | |
|
|
|
|||
3. FAIR VALUE OF FINANCIAL INSTRUMENTS
The Company’s financial instruments consist of cash and cash equivalents, short-term investments, accounts receivable, accounts payable, long-term debt, certain warrant obligations and redeemable common stock. The fair value hierarchy classifies fair value measurements based on the inputs used in measuring fair value. These inputs are classified as follows: Level 1, defined as observable inputs such as quoted prices for identical instruments in active markets; Level 2, defined as inputs other than quoted prices in active markets that are either directly or indirectly observable; and Level 3, defined as unobservable inputs for which little or no market data exists, therefore, requiring an entity to develop its own assumptions.
Assets and Liabilities Measured at Fair Value on a Recurring Basis
The following table presents information about the assets and liabilities measured at fair value on a recurring basis as of December 31, 2010 and June 30, 2011:
| December 31, 2010 |
Level 1 | Level 2 | Level 3 | Total | ||||||||||||
| Assets: |
||||||||||||||||
| Money market fund and cash equivalents |
$ | 684 | $ | 200 | $ | — | $ | 884 | ||||||||
| Investment securities: |
||||||||||||||||
| Government bond debt securities |
— | 2,463 | — | 2,463 | ||||||||||||
| Corporate bond debt securities |
— | 2,685 | — | 2,685 | ||||||||||||
| Liabilities: |
||||||||||||||||
| Warrants to purchase shares subject to redemption |
— | — | 5,445 | 5,445 | ||||||||||||
| Redeemable common stock |
— | — | 788 | 788 | ||||||||||||
| June 30, 2011 |
Level 1 | Level 2 | Level 3 | Total | ||||||||||||
| Assets: |
||||||||||||||||
| Money market fund and cash equivalents |
$ | 1,318 | $ | — | $ | — | $ | 1,318 | ||||||||
| Investment securities: |
||||||||||||||||
| Government bond debt securities |
— | 2,256 | — | 2,256 | ||||||||||||
| Liabilities: |
||||||||||||||||
| Warrants to purchase shares subject to redemption |
— | — | 7,429 | 7,429 | ||||||||||||
| Redeemable common stock |
— | — | 1,172 | 1,172 | ||||||||||||
F-40
Table of Contents
MASCOMA CORPORATION
NOTES TO UNAUDITED CONDENSED CONSOLIDATED FINANCIAL STATEMENTS (continued)
The Company’s money market funds are classified within Level 1 of the fair value hierarchy because they are valued using quoted prices for identical assets. The Company’s investments in debt securities are generally valued on the basis of valuations provided by third-party pricing services, as derived from such services’ pricing models. Inputs to the models may include, but are not limited to, reported trades, executable bid and asked prices, broker/dealer quotations, prices or yields of securities with similar characteristics, benchmark curves or information pertaining to the issuer, as well as industry and economic events. The pricing services may use a matrix approach, which considers information regarding securities with similar characteristics to determine the valuation for a security. The fair value of the warrant liability is discussed in Note 7. The fair value of the redeemable common stock is determined by management and the board of directors.
The following table summarizes the changes in fair value of the warrant liability and redeemable common stock, which are measured using Level 3 inputs.
| Six Months Ending June 30, 2010 |
Six Months Ending June 30, 2011 |
|||||||||||||||
| Warrants | Redeemable Common Stock |
Warrants | Redeemable Common Stock |
|||||||||||||
| Balance—January 1 |
$ | 2,597 | $ | 1,180 | $ | 5,445 | $ | 788 | ||||||||
| Issuance of warrants |
— | — | 2,144 | — | ||||||||||||
| Decrease in fair value recognized in interest expense and other financing costs |
(407 | ) | — | (160 | ) | — | ||||||||||
| Increase in fair value recognized in additional paid-in capital |
— | — | — | 384 | ||||||||||||
|
|
|
|
|
|
|
|
|
|||||||||
| Balance—June 30 |
$ | 2,190 | $ | 1,180 | $ | 7,429 | $ | 1,172 | ||||||||
|
|
|
|
|
|
|
|
|
|||||||||
Financial Instruments Not Measured at Fair Value
Some of Company’s financial instruments, including cash, restricted cash, accounts receivable, accounts payable and accrued expenses are carried at amortized cost. The carrying values of these financial instruments approximate fair value due to their liquid or short-term nature. Similarly, the Company’s long-term debt and capital leases are carried at amortized cost. Based on borrowing rates which management believes would be available to the Company for similar issues of debt including the June 2011 issuance, taking into account the credit risk of the Company and other market factors, the carrying value of the Company’s debt obligations approximate their fair value.
4. ACCRUED EXPENSES
Accrued expenses consist of the following at December 31, 2010 and June 30, 2011:
| December 31, 2010 |
June 30, 2011 |
|||||||
| Professional, consulting, and construction fees |
$ | 426 | $ | 790 | ||||
| Contracted research and development expenses |
1,064 | 1,347 | ||||||
| Payroll and payroll related expenses |
253 | 601 | ||||||
| Lease incentive obligation and deferred rent-current portion |
500 | 500 | ||||||
| Other |
779 | 1,032 | ||||||
|
|
|
|
|
|||||
| Total |
$ | 3,022 | $ | 4,270 | ||||
|
|
|
|
|
|||||
F-41
Table of Contents
MASCOMA CORPORATION
NOTES TO UNAUDITED CONDENSED CONSOLIDATED FINANCIAL STATEMENTS (continued)
5. STOCK-BASED COMPENSATION
The Company accounts for stock-based awards by recognizing compensation expense based on the fair value of such awards over the vesting period of the award.
The Company uses the Black-Scholes option-pricing model to value option grants and to determine the related compensation expense. The weighted-average fair value of stock options granted during the six months ended June 30, 2011 was $1.71 per share. The following table provides the assumptions used in determining the fair value of the share-based awards for the period ended June 30, 2011:
| Six months
ending June 30, 2011 |
||||
| Risk-free rate |
2.03%-2.66% | |||
| Expected life |
5.00-6.76 years | |||
| Expected volatility |
95% | |||
| Expected dividend |
0% | |||
No stock compensation expense have been capitalized by the Company. Total stock compensation expense has been recognized in the consolidated statements of operations as follows:
| Six months ending June 30, 2011 |
||||||||
| 2010 | 2011 | |||||||
| Research and development |
$ | 667 | $ | 527 | ||||
| Selling, general and administrative |
355 | 1,011 | ||||||
|
|
|
|
|
|||||
| Total stock-based compensation expense |
$ | 1,022 | $ | 1,538 | ||||
|
|
|
|
|
|||||
Stock option activity during the six months ended June 30, 2011, was as follows:
| Number
of Shares |
Weighted-Average Exercise Price |
|||||||
| Outstanding—January 1, 2011 |
6,823 | 2.21 | ||||||
| Granted |
2,879 | 1.97 | ||||||
| Exercised |
— | — | ||||||
| Forfeited |
(167 | ) | 2.01 | |||||
|
|
|
|||||||
| Outstanding—June 30, 2011 |
9,535 | 2.14 | ||||||
|
|
|
|||||||
As of June 30, 2011, options for 8,844 shares of common stock at a weighted-average exercise price of $2.12 were vested and expected to vest. These options have a weighted-average remaining contractual term of 9.02 years. Stock compensation expense of approximately $7,418 was unrecognized for nonvested awards as of June 30, 2011. The weighted-average period over which such stock compensation expense is expected to be recognized is 2.68 years.
On January 26, 2011, the Company awarded its executives and other employees 1,298 performance based stock options. The options have been granted with an exercise price equal to the fair value of the Company’s common stock on the date of grant and expire ten years after the date of grant. The vesting of the first 649 performance based stock options is based on achievement of certain individual and corporate goals established with respect to 2011 (the “2011 Performance Vesting Options”) and the vesting of another 649 performance based stock options is based on achievement of certain individual and corporate goals established with respect to
F-42
Table of Contents
MASCOMA CORPORATION
NOTES TO UNAUDITED CONDENSED CONSOLIDATED FINANCIAL STATEMENTS (continued)
2012 (the “2012 Performance Vesting Options”). Depending on employee’s and the Company’s performance during the performance period, a recipient of the award is entitled to receive a number of options equal to a percentage, ranging from 0% to 100%, of the award granted.
The 2011 Performance Vesting Options shall vest only upon achievement of the applicable 2011 individual and corporate goals and will be forfeited to the extent that the 2011 performance goals have not been achieved. The individual and corporate goals for the 2011 calendar year were established at the time of grant and are deemed probable of achievement. The grant-date fair value for the 2011 Performance Vesting Options, adjusted for estimated forfeitures, is being recognized as expense through 2011.
The 2012 Performance Vesting Options shall vest only and to the extent that the Board of Directors has determined that the applicable 2012 individual and corporate goals have been achieved and will be forfeited to the extent that the 2012 Performance goals have not been achieved. As of June 30, 2011, the 2012 Performance Vesting Options do not meet the criteria for having achieved a grant date because the individual and corporate goals for the 2012 have not been established as of that date. As such, the key terms and conditions of the award are not mutually agreed upon between the employees and the Company. The Company has not recorded any stock compensation expense for the 2012 Performance Vesting Shares. Once the individual and corporate goals for 2012 are determined, the grant-date fair value for the 2012 Performance Vesting Options, adjusted for estimated forfeitures, will be recognized as expense from the grant date through the end 2012.
6. REDEEMABLE CONVERTIBLE PREFERRED STOCK
In January 2011, the Company sold 1,333 shares of Series D Redeemable Convertible Preferred Stock to a new investor at a price of $3.75 for gross proceeds of approximately $5,000. These securities are identical to the Series D Redeemable Convertible Preferred Stock issued in 2010. In addition, the investor received warrants to purchase 1,333 shares of Series D Redeemable Convertible Preferred Stock at an exercise price of $3.75 per share. In August 2011, the warrants were exercised and the Company received $5,000.
The following table summarizes the activity with respect to the redeemable convertible preferred stock for the six months ended June 30, 2011:
| Redeemable Preferred Stock |
||||||||
| Shares | Amount | |||||||
| BALANCE—January 1, 2011 |
44,985 | $ | 153,212 | |||||
| Issuance of Series D redeemable convertible preferred stock—net of issuance costs of $222 |
1,333 | 4,778 | ||||||
| Accretion of issuance costs |
— | 279 | ||||||
|
|
|
|
|
|||||
| BALANCE—June 30, 2011 |
46,318 | $ | 158,269 | |||||
|
|
|
|
|
|||||
F-43
Table of Contents
MASCOMA CORPORATION
NOTES TO UNAUDITED CONDENSED CONSOLIDATED FINANCIAL STATEMENTS (continued)
7. WARRANTS
The fair value of the outstanding warrants to purchase preferred stock and warrants to purchase common stock that are not considered indexed to the Company’s own stock at December 31, 2010 and June 30, 2011 are as follows:
| Class of Stock |
Number
of Shares |
Exercise Price |
Expiration Date | Fair Value
at 12/31/10 |
Fair Value
at 6/30/2011 |
|||||||||||||||
| Series A-1 Preferred Stock |
163 | $ | 1.00 | September 16, 2016 | $ | 368 | $ | 441 | ||||||||||||
| Series B Preferred Stock |
225 | $ | 2.67 | February 5, 2018 | 608 | 649 | ||||||||||||||
| Series B Preferred Stock |
37 | $ | 2.67 | October 31, 2018 | 104 | 112 | ||||||||||||||
| Series C Preferred Stock |
94 | $ | 6.40 | February 5, 2018 | 396 | 327 | ||||||||||||||
| Series C Preferred Stock |
16 | $ | 6.40 | October 31, 2018 | 68 | 56 | ||||||||||||||
| Series C Preferred Stock |
101 | $ | 6.40 | December 31, 2018 | 306 | 256 | ||||||||||||||
| Series D Preferred Stock |
1,358 | $ | 3.75 | August 31, 2015 | 3,595 | 3,444 | ||||||||||||||
| Series D Preferred Stock |
1,333 | $ | 3.75 | January 7, 2016 | — | 125 | ||||||||||||||
|
|
|
|
|
|||||||||||||||||
| Total Preferred Stock |
5,445 | 5,410 | ||||||||||||||||||
|
|
|
|
|
|||||||||||||||||
| Common Stock |
1,000 | $ | 3.75 | August 31, 2015 | — | — | ||||||||||||||
| Common Stock |
660 | 1.97 | June 1, 2021 | — | 2,019 | |||||||||||||||
|
|
|
|
|
|||||||||||||||||
| Total Warrant Liabilities |
$ | 5,445 | $ | 7,429 | ||||||||||||||||
|
|
|
|
|
|||||||||||||||||
Because all of the preferred warrants are exercisable into preferred stock that is contingently redeemable, the preferred warrants are required to be accounted for as liabilities and are adjusted to fair value at each reporting date using an option pricing model with the following assumptions:
| Six months ended June 30, 2011 |
||||
| Risk-free rate |
1.00%-3.18 | % | ||
| Contractual term |
4.17-10.0 years | |||
| Expected volatility |
95 | % | ||
| Expected dividend |
0 | % | ||
Common Stock Warrants
In August 2010, the Company issued warrants to purchase 1,000 shares of the Company’s common stock at an exercise price of $3.75 per share to the stockholders of SBI in connection with the acquisition of SBI. The common stock warrants are indexed to the Company’s own stock and do not have a redemption option, which allow the warrants to be accounted for as equity.
On June 1, 2011, the Company issued warrants for the purchase of shares of common stock in connection with the June 2011 financing (described below). The number of common shares for which the warrant is exercisable equals the warrant coverage divided by the exercise price. Warrant coverage is determined as $1,000 plus 3% of each advance on Tranche D and Tranche E of the June 2011 financing. At June 1, 2011, $10,000 was drawn on the amended facility resulting in the total warrant coverage of $1,300. If the Company draws on the Tranche E advance, the warrant coverage will increase up to $1,600. The exercise price is determined as the lesser of $1.97 per share and the common stock valuation determined in the next valuation of the Company’s common stock. The warrant is exercisable at any time from the warrant date until June 1, 2021, or an occurrence of change of control event (i.e., sale or merger of the Company), or the completion of a registered public offering of the Company’s stock. In the event of a change in control and if the net proceeds from the exercise of the warrants results in less than $1,500 in net proceeds to the warrant holder, the warrant will be cancelled and the Company will pay the warrant holder a cash settlement of up to $1,500. If the Tranche E borrowings are available to the Company, the cash settlement increases to up to $2,500.
F-44
Table of Contents
MASCOMA CORPORATION
NOTES TO UNAUDITED CONDENSED CONSOLIDATED FINANCIAL STATEMENTS (continued)
The Company determined the number of shares into which the warrant is exercisable at 659 based on the warrant coverage $1,300 and the last common stock valuation of $1.97 per share.
At June 30, 2011 the warrants are settleable in a variable number of shares and, therefore, is classified as a liability. The fair value of the warrant at issuance and June 30, 2011 was $2,019 and was measured using a lattice model using a term to maturity of .75 years and volatility of 70%. In addition, the probability of settlement equal to $1,500, $2,500 and $0 was 37.5%, 37.5% and 25%, respectively.
8. LONG TERM DEBT
On February 5, 2008, the Company received a loan commitment (“2008 Growth Capital Agreement”) from a lender for funding up to $20,000, available to the Company in two draw-down periods with $10,000 of availability lapsing on April 30, 2008, and October 31, 2008, respectively. The Company did not draw on the April 30, 2008 tranche, but did draw $10,000 from the October 2008, tranche.
The borrowings under the 2008 Growth Capital Agreement were secured by a first lien on all assets of the Company, excluding the Company’s intellectual property. The borrowings bore interest at an annual interest rate of 6.25%. In addition, at the end of the loan (October 31, 2011), additional interest totaling $250 was payable in a lump sum.
In June 2011 the 2008 Growth Capital Agreement was amended (“2008 Amended Growth Capital Agreement”), the outstanding principal of $1,418 was repaid and $10,000 was drawn on the amended facility, which bears interest at 11%. The Company paid a commitment fee of $200 to the lender. The Company issued warrants for the purchase of 659 shares of common stock at a price of $1.97 per share in connection with the amended agreement (see Note 7 for discussion). The amended agreement provides the Company with the ability to borrow an additional $10,000 if the Company completes a qualified financing. The incremental borrowings will bear interest at the greater of 11% or prime rate plus 7.75%. The amended agreement requires interest only payments from July 1, 2011 to December 31, 2011 and then 30 equal monthly payments of interest and principal starting on January 1, 2012. In addition, at the end of the loan (June 1, 2014) an additional final payment equal to 4% of the original principal amount or $400 is payable in a lump sum. Borrowings under the amended agreement are secured by a first lien on all assets of the Company. The terms of the amended agreement restrict the Company’s ability to engage in certain actions, including disposing of certain assets, granting or otherwise allowing the imposition of a lien against certain assets, incurring certain kinds of additional indebtedness, acquiring or merging with another entity, or declaring dividends without prior approval of the creditor.
At June 1, 2011, the warrants were recorded at its initial fair value totaling $2,019, and were recognized along with the commitment fee of $200 as a cost of the extinguishment of the existing borrowings. At June 30, 2011, the Company recognized a loss on extinguishment of debt of $2,363, comprised of the warrant liability of $2,019, commitment fee of $200 and unamortized discount and debt issuance costs of $144.
9. SEGMENT REPORTING
The Company’s chief operating decision maker, who is the Company’s Chief Executive Officer, is provided with and reviews the financial results of the Company’s two operating segments: the U.S. segment and the Canadian segment.
The U.S. segment includes the Company’s domestic operation and is responsible for all research and development efforts and commercialization efforts related to the Company’s consolidated bioprocessing technology as well as corporate and other general and administrative functions. This segment receives revenue
F-45
Table of Contents
MASCOMA CORPORATION
NOTES TO UNAUDITED CONDENSED CONSOLIDATED FINANCIAL STATEMENTS (continued)
from the administration of government grants and certain other service arrangements. In addition, the U.S. segment includes the results of Frontier, which is expected to own and operate cellulosic ethanol facilities, along with other strategic industry participants, that utilize the Company’s consolidated bioprocessing technology. The operations of Frontier have been de minimis through June 30, 2011.
The Canadian segment was formed upon the completion of the acquisition of SBI in August 2010 and includes an investment in Xylitol, which is accounted for using the equity method of accounting. The Canadian segment develops and sells capital equipment and technology for the conversion of biomass feedstocks to ethanol producers, conducts research and development to advance certain technology, and incurs other general and administrative expenses.
Given the limited history of operations with SBI and limited integration of the acquired business, there are no intercompany transactions or corporate allocations reflected in the reported segment information for the period ended June 30, 2011.
Given the recent acquisition of SBI and the evolving management and reporting structure of the Company, the Company expects that it will re-assess its reporting segments as the SBI business is integrated and the Company pursues other business development activities.
The following table presents information about our operating segments for the six months ended June 30, 2011. No information is presented for periods prior to the acquisition of SBI in August 2010 as the Company was managed as a single segment in those periods.
| U.S. | Canada | Total | ||||||||||
| For the six months ended June 30, 2011 |
||||||||||||
| Revenues |
$ | 6,053 | $ | 615 | $ | 6,668 | ||||||
| Net loss |
(11,686 | ) | (2,850 | ) | (14,536 | ) | ||||||
| Depreciation and amortization |
4,110 | 906 | 5,016 | |||||||||
| Equity in loss of equity method investment |
— | 173 | 173 | |||||||||
| Capital expenditures |
2,849 | 339 | 3,188 | |||||||||
| As of June 30, 2011 |
||||||||||||
| Property and equipment |
$ | 29,992 | $ | 2,753 | $ | 32,745 | ||||||
| Equity method investment in Xylitol |
— | 4,519 | 4,519 | |||||||||
| Intangible assets, net |
— | 6,237 | 6,237 | |||||||||
| Goodwill |
— | 22,488 | 22,488 | |||||||||
10. SUBSEQUENT EVENTS
In August 2011, the Company entered into a Subordinated Convertible Note and Warrant Purchase Agreement, amended in September 2011, pursuant to which amended agreement the Company issued subordinated convertible promissory notes to certain existing investors in the aggregate principal amount of approximately $7,354. The notes accrue interest at a rate of 8% per annum. Interest and principal are due in August 2016 if the notes are not previously converted. These investors are entitled to receive warrants to purchase $1,774 of either preferred stock at the price at which the securities are sold upon a qualified financing or common stock at a 30% discount to the price paid by the public upon an initial public offering, whichever occurs first.
In preparing the accompanying financial statements and related disclosures, the Company has evaluated subsequent events through the date of issuance of these financial statements, which is September 15, 2011.
F-46
Table of Contents

To the Shareholders of
SunOpta BioProcess Inc.
We have audited the accompanying consolidated balance sheets of SunOpta BioProcess Inc. (the “Company”) as of December 31, 2009 and 2008, and the related consolidated statements of operations and comprehensive loss, shareholders’ deficiency, and cash flows for the years then ended. These financial statements are the responsibility of the Company’s management. Our responsibility is to express an opinion on these financial statements based on our audits.
We conducted our audits in accordance with auditing standards generally accepted in the United States of America. Those standards require that we plan and perform the audit to obtain reasonable assurance about whether the financial statements are free of material misstatement. An audit includes consideration of internal control over financial reporting as a basis for designing audit procedures that are appropriate in the circumstances, but not for the purpose of expressing an opinion on the effectiveness of the Company’s internal control over financial reporting. Accordingly, we express no such opinion. An audit also includes examining, on a test basis, evidence supporting the amounts and disclosures in the financial statements, assessing the accounting principles used and significant estimates made by management, as well as evaluating the overall financial statement presentation. We believe that our audits provide a reasonable basis for our opinion.
In our opinion, such consolidated financial statements present fairly, in all material respects, the financial position of the Company at December 31, 2009 and 2008, and the results of its operations and its cash flows for the years then ended in conformity with accounting principles generally accepted in the United States of America.

Chartered Accountants
Licensed Public Accountants
March 25, 2010
F-47
Table of Contents
SunOpta BioProcess Inc.
Consolidated Statements of Operations and Comprehensive Loss
For the years ended December 31, 2009 and 2008
(Expressed in U.S. dollars)
| December 31, 2009 $ |
December 31, 2008 $ |
|||||||
| Revenues |
518,616 | 1,435,356 | ||||||
| Cost of revenues |
295,880 | 1,962,090 | ||||||
|
|
|
|
|
|||||
| Gross margin (loss) |
222,736 | (526,734 | ) | |||||
| Selling, general and administrative expenses |
2,711,026 | 2,376,362 | ||||||
| Research and development (note 10) |
796,786 | 415,925 | ||||||
|
|
|
|
|
|||||
| Loss before the following |
(3,285,076 | ) | (3,319,021 | ) | ||||
| Interest income |
201,562 | 722,647 | ||||||
| Other expense (notes 3(b) and 12) |
— | (954,335 | ) | |||||
| Foreign exchange (loss) gain |
(8,343 | ) | 56,041 | |||||
|
|
|
|
|
|||||
| 193,219 | (175,647 | ) | ||||||
|
|
|
|
|
|||||
| Loss before income taxes |
(3,091,857 | ) | (3,494,668 | ) | ||||
| Provision for income taxes (note 13) |
— | — | ||||||
|
|
|
|
|
|||||
| Net loss and comprehensive loss |
(3,091,857 | ) | (3,494,668 | ) | ||||
|
|
|
|
|
|||||
(See accompanying notes to consolidated financial statements)
F-48
Table of Contents
SunOpta BioProcess Inc.
As at December 31, 2009 and December 31, 2008
(Expressed in U.S. dollars)
| December
31, 2009 $ |
December
31, 2008 $ |
|||||||
| Assets |
||||||||
| Current assets |
||||||||
| Cash and cash equivalents |
18,954,217 | 22,076,502 | ||||||
| Accounts receivable (note 2) |
307,219 | 893,435 | ||||||
| Receivable from related parties (note 3) |
— | 195,821 | ||||||
| Inventories (note 4) |
6,129 | 367,187 | ||||||
| Prepaid expenses and other current assets |
99,407 | 106,457 | ||||||
|
|
|
|
|
|||||
| 19,366,972 | 23,639,402 | |||||||
| Property, plant and equipment (note 5) |
2,645,898 | 1,173,309 | ||||||
| Patents (note 6) |
312,015 | 207,994 | ||||||
|
|
|
|
|
|||||
| 22,324,885 | 25,020,705 | |||||||
|
|
|
|
|
|||||
| Liabilities |
||||||||
| Current liabilities |
||||||||
| Accounts payable and accrued liabilities (note 7) |
980,672 | 991,310 | ||||||
| Payable to related parties (note 3) |
14,249 | — | ||||||
| Deferred revenue |
252,017 | — | ||||||
|
|
|
|
|
|||||
| 1,246,938 | 991,310 | |||||||
| Deferred government credit (note 5) |
140,409 | — | ||||||
| Preferred shares (note 8) |
28,188,965 | 27,796,332 | ||||||
| Shareholders’ Deficiency |
||||||||
| Common shares |
||||||||
| Unlimited number of common shares and preference shares without par value |
||||||||
| Issued 9,200,000 common shares |
1 | 1 | ||||||
| Additional paid in capital |
— | 157,980 | ||||||
| Accumulated deficit |
(7,251,428 | ) | (3,924,918 | ) | ||||
|
|
|
|
|
|||||
| (7,251,427 | ) | (3,766,937 | ) | |||||
|
|
|
|
|
|||||
| 22,324,885 | 25,020,705 | |||||||
|
|
|
|
|
|||||
Commitments and contingencies (note 14)
(See accompanying notes to consolidated financial statements)
F-49
Table of Contents
SunOpta BioProcess Inc.
Consolidated Statements of Shareholders’ Equity (Deficiency)
As at December 31, 2009 and 2008
(Expressed in U.S. dollars)
| Common shares $ |
Additional paid in capital $ |
Accumulated Deficit $ |
Total $ |
|||||||||||||
| Balance at January 1, 2008 |
1 | 545,489 | (430,250 | ) | 115,240 | |||||||||||
| Net loss |
— | — | (3,494,668 | ) | (3,494,668 | ) | ||||||||||
| Accretion of preferred shares (note 8) |
— | (387,509 | ) | — | (387,509 | ) | ||||||||||
|
|
|
|
|
|
|
|
|
|||||||||
| Balance at December 31, 2008 |
1 | 157,980 | (3,924,918 | ) | (3,766,937 | ) | ||||||||||
| Net loss |
— | — | (3,091,857 | ) | (3,091,857 | ) | ||||||||||
| Accretion of preferred shares (note 8) |
— | (157,980 | ) | (234,653 | ) | (392,633 | ) | |||||||||
|
|
|
|
|
|
|
|
|
|||||||||
| Balance at December 31, 2009 |
1 | — | (7,251,428 | ) | (7,251,427 | ) | ||||||||||
|
|
|
|
|
|
|
|
|
|||||||||
(See accompanying notes to consolidated financial statements)
F-50
Table of Contents
SunOpta BioProcess Inc.
Consolidated Statements of Cash Flows
For the years ended December 31, 2009 and 2008
(Expressed in U.S. dollars)
| December 31, 2009 $ |
December
31, 2008 $ |
|||||||
| Cash provided by (used in) |
||||||||
| Operating activities |
||||||||
| Net loss |
(3,091,857 | ) | (3,494,668 | ) | ||||
| Items not affecting cash |
||||||||
| Amortization |
250,823 | 125,205 | ||||||
| Unrealized foreign exchange (gain) loss |
(2,379 | ) | 3,921 | |||||
| Changes in non-cash working capital (note 9) |
1,105,107 | (199,155 | ) | |||||
|
|
|
|
|
|||||
| (1,738,306 | ) | (3,564,697 | ) | |||||
|
|
|
|
|
|||||
| Investing activities |
||||||||
| Purchase of property, plant and equipment |
(1,441,851 | ) | (748,343 | ) | ||||
| Purchase of patents |
(115,953 | ) | (108,812 | ) | ||||
|
|
|
|
|
|||||
| (1,557,804 | ) | (857,155 | ) | |||||
|
|
|
|
|
|||||
| Financing activities |
||||||||
| Proceeds from government grant (note 5) |
140,409 | — | ||||||
|
|
|
|
|
|||||
| 140,409 | — | |||||||
|
|
|
|
|
|||||
| Foreign exchange gain (loss) on cash held in foreign currency |
33,416 | (57,565 | ) | |||||
|
|
|
|
|
|||||
| Decrease in cash and cash equivalents |
(3,122,285 | ) | (4,479,417 | ) | ||||
| Cash and cash equivalents—beginning of the year |
22,076,502 | 26,555,919 | ||||||
|
|
|
|
|
|||||
| Cash and cash equivalents—end of the year |
18,954,217 | 22,076,502 | ||||||
|
|
|
|
|
|||||
(See accompanying notes to consolidated financial statements)
F-51
Table of Contents
SunOpta BioProcess Inc.
Notes to Consolidated Financial Statements
For the years ended December 31, 2009 and 2008
(Expressed in U.S. dollars)
1. Description of business and significant accounting policies
SunOpta BioProcess Inc. (the “Company”) provides equipment and process solutions for the biomass conversion industry, from process development and design through the sale of proprietary biomass processing technology and the planned investment in cellulosic ethanol production. On December 1, 2006, SunOpta Inc. (“SunOpta”) incorporated the Company, under the laws of Canada. On June 7, 2007, the Company completed a private placement for the sale of 1,500,000 non-dividend bearing, convertible preferred shares of the Company for gross proceeds of $30,000,000. On June 7, 2007, SunOpta transferred certain net assets to the Company (including one contract in process) and the Company commenced operations as of that date. SunOpta remains the parent company of the Company.
Basis of presentation
The consolidated financial statements are prepared in accordance with accounting principles generally accepted in the United States of America (“GAAP”) and include the accounts of the Company and its wholly-owned subsidiaries.
Variable interest entities (“VIE”)
The Company consolidates investments that are variable in nature for which the Company is determined to be the primary beneficiary, under Financial Accounting Standards Board (“FASB”) Accounting Standards Codification (“ASC”) ASC Topic 810 (formerly FIN 46(R)). The Company consolidates as the primary beneficiary when it has been determined to create or absorb variability due to ownership and operational considerations regarding the investment in the variable interest entity.
Joint ventures
Investments in joint ventures that are not consolidated under ASC Topic 810 are accounted for on an equity basis.
Cash and cash equivalents
Cash and cash equivalents consist of cash and short-term deposits with an original maturity of less than 90 days and are carried at cost which approximates their fair value because of the short-term maturity of the instruments.
Inventories
Inventories consist of equipment that will be used by the Company on equipment supply contracts. Inventories are valued at the lower of cost or net realizable value.
Prepaid and other current assets
Prepaid and other current assets include amounts paid in cash and recorded as a current asset prior to consumption by the Company.
F-52
Table of Contents
SunOpta BioProcess Inc.
Notes to Consolidated Financial Statements (continued)
Property, plant and equipment
Property, plant and equipment are stated at cost, less accumulated amortization. Construction in progress is not amortized until it is placed in service or upon completion of commissioning the equipment. Amortization is provided on property, plant and equipment using the straight-line basis at rates reflecting the estimated useful lives of the assets.
| Buildings |
40 years | |||
| Lab facilities |
10 years | |||
| Machinery and lab equipment |
10 - 20 years | |||
| Office furniture |
7 years | |||
| Computer equipment and software |
1 - 3 years |
Patents
The Company’s finite life intangible assets consist of patents that are amortized on a straight line basis over their estimated useful lives to a maximum of 20 years.
Long-lived assets
The Company reviews its long-lived assets for impairment whenever events or changes in circumstances indicate that the carrying amounts of the assets may not be recoverable through undiscounted future cash flows. If impairment exists based on expected future undiscounted cash flows, a loss is recognized in income. The amount of the impairment loss is the excess of the carrying amount of the impaired asset over the fair value of the asset.
Deferred revenue
Deferred revenue reflects the excess of amounts billed over revenue earned on open contracts.
Warranty reserves
A warranty reserve, included in accrued liabilities, has been provided for the repair costs which may be required during the guarantee period on equipment supply contracts. The reserve is estimated based on experience and future estimates.
Revenue recognition
Equipment supply contracts
The percentage of completion method is used to account for significant long-term contracts. The amounts of revenue and profit recognized each year are based on either the ratio of hours incurred to the total expected hours or the ratio of costs incurred to the total expected costs. Costs incurred on long-term contracts include labour, material, other direct costs and overheads. Losses, if any, on long-term contracts are recognized during the period in which they are determined.
Collaborative Revenue
The Company recognizes revenues from research funding under collaborative agreements over the term of the agreements, as costs are incurred.
F-53
Table of Contents
SunOpta BioProcess Inc.
Notes to Consolidated Financial Statements (continued)
Research and Development Expenses
Costs related to internal research and development programs are expensed as incurred.
Grants
The Company records government grants when it is reasonably assured that compliance with the relevant conditions exists and that the grant will be received. Under these government grants the Company will be reimbursed for costs incurred for certain research activities. As a result, government grants are recognized as a deferred government credit or as a reduction to research and development expenses when such expenses are incurred.
Foreign currency translation
The functional currency of the Company is the United States dollar. The assets and liabilities of the Company’s operations are translated at exchange rates in effect at the dates of the consolidated balance sheets. Revenues and expenses are translated at average exchange rates prevailing during the period. Gains and losses from foreign currency transactions are included in the consolidated statements of operations and comprehensive loss of each period.
Income taxes
The Company follows the asset and liability method of accounting for income taxes whereby deferred income tax assets are recognized for deductible temporary differences and operating loss carry-forwards, and deferred income tax liabilities are recognized for taxable temporary differences. Temporary differences are the differences between the amounts of assets and liabilities recorded for income tax and financial reporting purposes.
Deferred income tax assets are recognized only to the extent that management determines that it is more likely than not that the deferred income tax assets will be realized. Deferred income tax assets and liabilities are adjusted for the effects of changes in tax laws and rates on the date of enactment. The income tax expense or benefit is the income tax payable or recoverable for the year plus or minus the change in deferred income tax assets and liabilities during the year.
The Company is subject to ongoing tax exposures, examinations and assessments in various jurisdictions. Accordingly, the Company may incur additional income tax expense based upon the outcomes of such matters. In addition, when applicable, the Company adjusts income tax expense to reflect the Company’s ongoing assessments of such matters, which requires judgment and can materially increase or decrease its effective rate as well as impact operating results. The Company provides for such exposures in accordance with ASC Topic 740 (formerly Interpretation No. 48, “Accounting for Uncertainty in Income Taxes” (an Interpretation of FASB Statement No. 109) (“FIN48”)). ASC 740 prescribes a recognition threshold and measurement attribute for the financial statement recognition and measurement of a tax position taken or expected to be taken in a tax return. ASC 740 also provides accounting guidance on de-recognition, classification, interest and penalties, accounting in interim periods, disclosure and transition. The evaluation of tax positions under ASC 740 is a two-step process, whereby (1) the Company determines whether it is more likely than not that the tax positions will be sustained based on the technical merits of the position, and (2) for those tax positions that meet the more-likely-than-not recognition threshold, the Company would recognize the largest amount of tax benefit that has a greater than 50% likelihood of being realized upon ultimate settlement with the related tax authority.
F-54
Table of Contents
SunOpta BioProcess Inc.
Notes to Consolidated Financial Statements (continued)
Stock-based compensation
The Company currently provides compensation to certain employees in the form of stock options and restricted stock units (“RSU’s”). The Company accounts for stock-based compensation in accordance with the fair value recognition provisions of ASC Topic 718 (formerly Statement of Financial Accounting Standard (“SFAS”) No. 123(R), “Share-Based Payment”).
Stock options and RSU’s
The Company uses the Black-Scholes option pricing model which requires the input of highly subjective assumptions. These assumptions, including estimating the length of time employees will retain their stock options before exercising them (“the expected term”), the expected volatility of the Company’s common stock price, or industry peers, over the expected term, and the number of options that will ultimately not complete their vesting requirements (“forfeitures”). Changes in subjective assumptions can materially affect the estimate of fair value of stock-based compensation and, consequently, the related amount recognized on the consolidated statements of operations and comprehensive loss.
Derivative instruments
The Company is exposed to fluctuations in foreign currency exchange. The Company utilizes certain derivative financial instruments to enhance its ability to manage these risks, including forward foreign exchange contracts. Derivative instruments are entered into for periods consistent with related underlying exposures and do not constitute positions independent of those exposures. The Company does not enter into contracts for speculative purposes.
All derivative instruments are recognized on the consolidated balance sheets at fair value. Changes in the fair value of derivative instruments are recorded in operations or other comprehensive earnings (loss), based on whether the instrument is designated as part of a hedge transaction. Gains or losses on derivative instruments that are designated as part of a hedge transaction, which are reported in accumulated other comprehensive income, are reclassified to earnings in the period in which earnings are affected by the underlying hedged item. The ineffective portion of all hedges is recognized in earnings in the current period. During the years ended December 31, 2009 and December 31, 2008, the Company had no derivative instruments outstanding (see note 15).
Forward foreign exchange contracts
The Company enters into forward foreign exchange contracts to minimize exchange rate fluctuations relating to Canadian-denominated contract costs. All forward exchange contracts are marked-to-market as of the balance sheet date. Gains and losses on these transactions are included in foreign exchange (gain) loss in the consolidated statements of operations and comprehensive loss.
Financial Instruments
The Company’s financial instruments recognized in the consolidated balance sheets and included in working capital consist of cash and cash equivalents, accounts receivable, receivable from related parties, accounts payable and accrued liabilities and payable to related parties. Cash and cash equivalents are designated as financial assets held for trading and are measured at fair value with any changes in fair value recorded in net loss and comprehensive loss at each period end. Accounts receivable and receivables from related parties are classified as loans and receivables, accounts payable and accrued liabilities and payable to related parties are
F-55
Table of Contents
SunOpta BioProcess Inc.
Notes to Consolidated Financial Statements (continued)
classified as other financial liabilities, and each are measured at fair value at inception and are subsequently measured at amortized cost using the effective interest method. The fair values of these instruments approximate their carrying values due to their short-term maturities.
The Company’s financial instruments exposed to credit risk include cash and cash equivalents and accounts receivable. The Company places its cash and cash equivalents with institutions of high creditworthiness. The Company’s accounts receivable are concentrated among a limited number of customers or government agencies. The Company routinely assesses the financial strength of these parties. The Company maintains an allowance for losses based on the expected collectibility of the accounts.
Use of estimates
The preparation of these consolidated financial statements in conformity with generally accepted accounting principles requires management to make estimates and assumptions that affect the reported amounts of assets and liabilities and disclosure of contingent liabilities at the dates of the consolidated financial statements and the reported amounts of revenues and expenses during the reporting periods. A certain amount of uncertainty is inherent in estimating the hours or costs required in completing the construction of equipment required under equipment supply contracts. Significant estimates included within these consolidated financial statements include the percentage completion of projects, related revenue recognition, the accrual for warranty and other obligations under the Company’s existing contracts and fair values of stock options and RSU’s. Actual results could differ from those estimates.
Recent Accounting Pronouncements
In February 2007, the FASB issued ASC Topic 825-10 (formerly SFAS Statement No. 159, “The Fair Value Option for Financial Assets and Liabilities” (“SFAS No. 159”). ASC Topic 825-10 allows companies to voluntarily choose, at specific election dates, to measure certain financial assets and liabilities, as well as certain non-financial instruments that are similar to financial instruments, at fair value (the “fair value option”). The election is made on an instrument-by-instrument basis and is irrevocable. If the fair value option is elected for an instrument, ASC Topic 825-10 specifies that all subsequent changes in fair value for that instrument be reported in income. The provisions of ASC Topic 825-10 are effective for fiscal years beginning after November 15, 2007. The adoption of ASC Topic 825-10 did not have a material impact on the Company’s consolidated financial statements.
On July 1, 2009, the Company adopted ASC Topic 105-10 (formerly SFAS No. 168, “The FASB Accounting Standards Codification and Hierarchy of Generally Accepted Accounting Principles, a replacement of FASB Statement No. 162”). ASC Topic 105-10 establishes the FASB ASC as the source of authoritative accounting principles recognized by the FASB to be applied in preparation of financial statements in conformity with GAAP. As a result of adopting this standard, all references to authoritative accounting literature have been updated based on the new GAAP codification.
On January 1, 2009, the Company adopted ASC Topic 805 (formerly SFAS No. 141R, “Business Combinations”). ASC Topic 805 applies to all transactions or other events in which an entity obtains control of one or more businesses and requires that all assets and liabilities of an acquired business as well as any non-controlling interest in the acquiree be recorded at their fair values at the acquisition date. Contingent consideration arrangements are recognized at their acquisition date fair values, with subsequent changes in fair value generally reflected in earnings. Pre-acquisition contingencies are also typically recognized at their acquisition date fair values. In subsequent periods, contingent liabilities are measured at the higher of their acquisition date fair values or the estimated amounts to be realized. The adoption of ASC Topic 805 did not have an impact on the Company’s consolidated financial statements.
F-56
Table of Contents
SunOpta BioProcess Inc.
Notes to Consolidated Financial Statements (continued)
In February 2008, FASB issued ASC Topic 820-10-55 (formerly FASB Staff Position (“FSP) 157-2/Statement No. 157, “Effective Date of FASB Statement No. 157”). ASC Topic 820-10-55 delayed the effective date for all non-financial assets and non-financial liabilities, except those that are recognized or disclosed at fair value in the financial statements on a recurring basis (at least annually). The adoption of the provisions of ASC 820-10-55 related to non-financial assets and non-financial liabilities disclosures effective January 1, 2009. The adoption of ASC Topic 820-10-55 did not have an impact on the Company’s consolidated financial statements.
In December 2007, the FASB issued ASC Topic 810-10-65, “Consolidation”, regarding non-controlling interests (formerly SFAS No. 160, “Non-controlling Interests in Consolidated Financial Statements”). ASC Topic 810-10-65 establishes accounting and reporting standards for ownership in subsidiaries held by parties other than the parent, the amount of consolidated earnings attributable to the parent and to the non-controlling interest, changes in a parent’s ownership interest, and the valuation of retained non-controlling equity investments when a subsidiary is deconsolidated. It clarifies that a non-controlling interest in a subsidiary is an ownership interest in the consolidated entity that should be reported as equity in the consolidated financial statements. The adoption of ASC Topic 810-10-65 did not have an impact on the Company’s consolidated financial statements.
In March 2008, the FASB issued the disclosure requirements within ASC Topic 815, “Derivatives and Hedging” (formerly SFAS No. 161, “Disclosures about Derivative Instruments and Hedging Activities, an Amendment of FASB No. 133”). ASC Topic 815 is intended to improve transparency in financial reporting by requiring enhanced disclosures of an entity’s derivative instruments and hedging activities and their effects on the entity’s financial position, financial performance, and cash flows. The disclosure requirements apply to all derivative instruments within the scope of ASC Topic 815. The standard also applies to non-derivative hedging instruments and all hedged items designated and qualifying under ASC Topic 815. This standard requires an entity with derivatives to disclose how and why it uses derivative instruments; how derivative instruments and related hedged items are accounted for under SFAS 133; and how derivative instruments and related hedged items affect the entity’s financial position, financial performance, and cash flows. Entities must provide tabular disclosures of the location, by line item, of amounts of gains and losses reported in the consolidated statements of operations. The adoption of ASC Topic 815 did not have an impact on the Company’s consolidated financial statements.
In May 2008, the FASB issued ASC Topic 350-30, “General Intangibles Other than Goodwill” (formerly FSP 142-3, “Determination of the Useful Life of Intangible Assets”). ASC Topic 350-30 provides guidance on the renewal or extension assumptions used in the determination of useful life of a recognized intangible asset. The intent of ASC Topic 350-30 is to better match the useful life of the recognized intangible asset to the period of expected cash flow used to measure its fair value. ASC Topic 350-30 is effective for fiscal years beginning after December 15, 2008. The adoption of this standard did not have a significant impact on the Company’s consolidated financial statements.
In May 2009, the FASB issued ASC Topic 855-10-25 (formerly FASB Statement 165, “Subsequent Events”). ASC Topic 855-10-25 provides guidance on management’s assessment of subsequent events and incorporates this guidance into accounting literature. ASC Topic 855-10-25 is effective prospectively for interim and annual periods ending after June 15, 2009. The implementation of this standard did not have a material impact on the Company’s financial position and results of operations. The Company has adopted this standard, evaluating for subsequent events to the date these financial statements were issued.
In June 2009, the FASB issued ASC Topic 860-10-05 (formerly SFAS No. 166, “Accounting for Transfers of Financial Assets”). This standard prescribes the information that a reporting entity must provide in its financial reports about a transfer of financial assets; the effects of a transfer on its financial position, financial performance
F-57
Table of Contents
SunOpta BioProcess Inc.
Notes to Consolidated Financial Statements (continued)
and cash flows; and a transferor’s continuing involvement in transferred financial assets. ASC Topic 860-10-05 is effective for transfers of financial assets occurring on or after January 1, 2010. The Company will consider this standard when evaluating future transactions to which it would apply. Historically, the Company has not had any material transfers of financial assets.
In June 2009, the FASB issued ASC Topic 810 (formerly SFAS No. 167, “Amendments to FASB Interpretation No. 46(R)”). This accounting standard is a revision to a previous FASB Interpretation and changes how a reporting entity evaluates whether an entity is a VIE and which entity is considered the primary beneficiary of a VIE and is therefore required to consolidate the VIE. This accounting standard will also require continuous reassessments of which party within the VIE is considered the primary beneficiary and will require a number of new disclosures related to the VIE’s. ASC Topic 810 becomes effective January 1, 2010. The Company does not expect any material financial statement implications, other than disclosure items, related to the adoption of this ASC.
2. Accounts receivable
| December 31, 2009 $ |
December 31, 2008 $ |
|||||||
| Accounts receivable |
307,219 | 893,435 | ||||||
| Less: allowance for doubtful accounts |
— | — | ||||||
|
|
|
|
|
|||||
| 307,219 | 893,435 | |||||||
|
|
|
|
|
|||||
Accounts receivable related to revenue recognized under the percentage of completion method totaling $10,071 (2008—$481,873) is included in the accounts receivable balance.
3. Related party balances and transactions
Related party balances and transactions entered into in the years ending December 31, 2009 and 2008 are as follows:
| Balance receivable at January 1, 2008 |
(455,446 | ) | ||
| Purchases and services performed by SunOpta on behalf of the Company(a) |
(644,921 | ) | ||
| Abener Energia S.A. arbitration(b) |
(1,337,828 | ) | ||
| Inventory purchase(c) |
(367,187 | ) | ||
| Repayments |
3,001,203 | |||
|
|
|
|||
| Balance receivable at December 31, 2008 |
195,821 | |||
| Purchases and services performed by SunOpta on behalf of the Company(a) |
(708,732 | ) | ||
| Repayments |
498,662 | |||
|
|
|
|||
| Balance payable at December 31, 2009 |
(14,249 | ) | ||
|
|
|
(a) Purchases and services performed by SunOpta on behalf of the Company
In 2009, the Company recorded management fees of $123,840 (2008 - $249,880). The management fees include direct and indirect costs incurred by SunOpta for the benefit of the Company relating to corporate functions such as executive management, risk management, information technology, accounting, legal, investor relations, human resources, tax and other services. The amount charged by SunOpta is based on an agreement for
F-58
Table of Contents
SunOpta BioProcess Inc.
Notes to Consolidated Financial Statements (continued)
the calendar year and is allocated to the Company based on the relative percentage of the Company’s revenues and headcount to the respective total of SunOpta’s costs. The management fee shall automatically extend until the end of each calendar year unless either party gives notice of termination to the other party at least 90 days prior to the end of the initial term or any subsequent term.
In 2009, the Company recorded $584,892 (2008 - $395,041) reflecting the costs of salaries, benefits and routine purchases made through SunOpta’s shared service centre on behalf of the Company.
Ongoing purchases and services incurred amongst the related parties are subject to normal trade terms.
At the end of 2009, the Company has a payable balance to SunOpta of $14,249 (2008 - receivable of $195,821 from SunOpta).
(b) Abener Energia S.A. arbitration
As part of the management service agreement with SunOpta, the Company agreed to continue its performance of the equipment supply contract with Abener Energia S.A. (‘Abener’) on the basis that the Company, in its former capacity as a division of SunOpta, was charged with the responsibility of executing and performing such obligations.
In December 2008, as a result of an unfavourable ruling in the Abener arbitration case against SunOpta in the amount of €1,329,898 ($1,908,670), the Company’s Board of Directors agreed that the Company would bear 50% or $954,335 of the judgement against SunOpta, and 50% or $383,493 of the legal costs incurred throughout the arbitration proceedings. The assumption of this liability was attributed to the Company’s requirement to continue to perform its obligations of the aforementioned contract and that any arbitration ruling would have an immediate impact on the Company’s ability to secure additional equipment supply contracts in the future. The transaction has been valued at an amount agreed to amongst the related parties and was settled thereafter in 2008.
SunOpta stayed the ruling pending the outcome of the Company’s arbitration with Abener’s sister company, Abengoa New Technologies Inc., as disclosed in note 14. Subsequent to year-end, the ruling on the arbitration was received and SunOpta made the corresponding payment owing to Abener.
(c) Inventory purchase
In December 2008, the Company purchased fibre pretreatment equipment from SunOpta for net proceeds of $367,187, representing SunOpta’s net carrying value of the equipment.
(d) Warehouse lease
In 2008, the Company entered into a warehouse lease agreement with a majority-owned subsidiary of SunOpta, Opta Minerals Inc. The lease is at market rates and is for a two-year period ending November 15, 2010. During 2009, the Company paid $21,708 (2008—$4,130) to Opta Minerals Inc.
4. Inventories
| December 31, 2009 $ |
December 31 2008 $ |
|||||||
| Finished goods |
6,129 | 367,187 | ||||||
|
|
|
|
|
|||||
F-59
Table of Contents
SunOpta BioProcess Inc.
Notes to Consolidated Financial Statements (continued)
5. Property, plant and equipment
| December 31, 2009 |
||||||||||||
| Cost $ |
Accumulated Amortization $ |
Net Book Value $ |
||||||||||
| Buildings |
421,291 | (106,105 | ) | 315,186 | ||||||||
| Lab facilities |
851,496 | (46,737 | ) | 804,759 | ||||||||
| Machinery and lab equipment |
479,394 | (94,272 | ) | 385,122 | ||||||||
| Office furniture, computer equipment and software |
230,135 | (181,149 | ) | 48,986 | ||||||||
| Construction in progress |
1,091,845 | — | 1,091,845 | |||||||||
|
|
|
|
|
|
|
|||||||
| 3,074,161 | (428,263 | ) | 2,645,898 | |||||||||
|
|
|
|
|
|
|
|||||||
| December 31, 2008 |
||||||||||||
| Cost $ |
Accumulated Amortization $ |
Net Book Value $ |
||||||||||
| Buildings |
171,300 | (8,119 | ) | 163,181 | ||||||||
| Machinery and lab equipment |
319,269 | (51,131 | ) | 268,138 | ||||||||
| Office furniture, computer equipment and software |
209,325 | (130,122 | ) | 79,203 | ||||||||
| Construction in progress |
662,787 | — | 662,787 | |||||||||
|
|
|
|
|
|
|
|||||||
| 1,362,681 | (189,372 | ) | 1,173,309 | |||||||||
|
|
|
|
|
|
|
|||||||
Included in construction in progress at December 31, 2009 is $64,123 (2008 - $582,989) of costs relating to the construction and optimization of the lab facilities, $790,218 (2008 - $nil) of costs relating to the MicroSystem lab facilities, $237,504 (2008 - $nil) of costs relating to the design of a commercial demonstration plant and $nil (2008 - $79,798) of laboratory equipment being commissioned for use.
In 2009, the Company recorded a $140,409 (2008 - $nil) deferred government credit to reflect the recovery of labour costs that have been capitalized to the MicroSystem lab facilities and have been reimbursed through a research grant provided by the National Research Council of Canada as per note 10. The benefit of the research grant will be realized as a reduction to amortization over the estimated useful life of the asset.
6. Patents
The following is a summary of changes in the Company’s patents:
| December 31, 2009 $ |
December 31, 2008 $ |
|||||||
| Balance, beginning of year |
207,994 | 71,548 | ||||||
| Additions |
115,953 | 151,062 | ||||||
| Amortization |
(11,932 | ) | (14,616 | ) | ||||
|
|
|
|
|
|||||
| Balance, end of year |
312,015 | 207,994 | ||||||
|
|
|
|
|
|||||
F-60
Table of Contents
SunOpta BioProcess Inc.
Notes to Consolidated Financial Statements (continued)
The Company estimates that the aggregate future amortization expense associated with finite life intangible assets for the years ending December 31 will be as follows:
| $ | ||||
| 2010 |
— | |||
| 2011 |
5,777 | |||
| 2012 |
13,500 | |||
| 2013 |
18,354 | |||
| 2014 |
18,354 | |||
| Thereafter |
256,030 | |||
|
|
|
|||
| 312,015 | ||||
|
|
|
|||
The Company does not believe that it will incur any amortization expense in 2010 based on the expected date of pending patents being granted.
7. Accounts payable and accrued liabilities
| December 31, 2009 $ |
December 31, 2008 $ |
|||||||
| Accounts payable |
305,519 | 348,103 | ||||||
| Accrued liabilities |
675,153 | 643,207 | ||||||
|
|
|
|
|
|||||
| 980,672 | 991,310 | |||||||
|
|
|
|
|
|||||
8. Preferred shares
| December 31, 2009 $ |
December 31 2008 $ |
|||||||
| Preferred shares |
28,188,965 | 27,796,332 | ||||||
|
|
|
|
|
|||||
On June 7, 2007, the Company’s subsidiary, SunOpta BioProcess, completed a private placement for the sale of 1,500,000 non-dividend bearing, convertible preferred shares of SunOpta BioProcess for gross proceeds of $30,000,000. SunOpta BioProcess incurred issuance costs of approximately $2,808,000 in relation to this preferred share offering, including the fair value (non-cash) of $762,271 assigned to warrants of SunOpta granted to investors as part of the financing. These issuance costs have been offset against the carrying value of the preferred shares. The preferred shares do not bear any dividend and contain a conversion feature that allows the holders to convert the preferred shares to common shares of SunOpta BioProcess at any time on a one-for-one basis. At any time following the seventh anniversary of the closing date (June 7, 2014) or upon the occurrence of a change in control, holders of the majority of preferred shares will have the right to require SunOpta BioProcess to redeem all of the preferred shares for a cash payment equal to the original issue price ($20 per share, in aggregate $30,000,000). Should SunOpta BioProcess complete a qualified initial public offering (defined in the preferred share agreement as greater than $50,000,000), the preferred shares would automatically be converted into common shares of SunOpta BioProcess upon closing of the transaction, resulting in a dilution of SunOpta’s interest from 100% to approximately 86%. Should the restricted stock units (“RSU”) and stock options, described below, be converted along with the preferred shares upon completion of a qualified initial public offering, the Company’s ownership in SunOpta BioProcess would be diluted to 75%. In the event that a qualified
F-61
Table of Contents
SunOpta BioProcess Inc.
Notes to Consolidated Financial Statements (continued)
initial public offering does not occur by June 7, 2014, the preferred shareholders would have the option to redeem their shares for a cash payment equal to the original issue price of $20 per share. The preferred shares are classified on the consolidated balance sheet as mezzanine equity as they have a mandatory redemption feature after seven years if a qualified initial public offering does not take place.
Included in the issuance costs discussed above is the fair value of $762,271 attributed to warrants to purchase 648,300 common shares of SunOpta Inc. at a price of $11.57 (exercisable within six months of the date of closing) that were granted to the SunOpta BioProcess preferred share investors upon the closing of the transaction.
The fair value of these warrants was determined using the Black-Scholes option pricing model (using an expected volatility of 40.2%, a risk-free interest rate of 4.99% and an estimated useful life of six months). During the fourth quarter of 2007, the warrant holders exercised their warrants, resulting in cash proceeds to SunOpta of $7,500,831, which had no impact on the operations of the Company.
The preferred shares are presented net of issuance costs (with no associated tax benefit) and the value of the preferred shares is being accreted to the $30,000,000 redemption value over a seven-year period using the effective interest method. During the year ended December 31, 2009 the Company recorded interest accretion of $392,633 (2008 - $387,509). The annual interest accretion is charged to additional paid in capital and then to accumulated deficit.
In conjunction with the private placement, the Company granted 800,000 restricted stock units and 800,000 stock options (with an exercise price of $20 per share) in the Company’s common shares to certain employees of the Company. The RSU’s allow for a cash payment or the grant of shares to certain employees equal to the issuance price in a future initial public offering (to a maximum of $20 per share). The RSU’s and the stock options granted only vest if a change of control of the Company occurs, or the Company completes an initial public offering and, as such, these units are considered performance-based awards under ASC Topic 718. Accordingly, no expense is recorded in the consolidated financial statements until the contingent element of the award has been resolved. The RSU’s expire 10 days after vesting whereas, unless terminated earlier in accordance with the Company’s stock option plan, the stock options expire on the seventh anniversary of the closing date (i.e. June 7, 2014). Should the Company complete an initial public offering the RSU’s and stock options could be converted into common shares of the Company upon closing of the transaction, resulting in a dilution of SunOpta’s wholly owned interests in the Company to 85%.
At the date of the grant, the Company estimated that the fair value associated with the stock option grant was $11,024,568 and RSU’s was $14,400,000. The fair value of the options was calculated using the Black-Scholes option pricing model with the assumptions of a dividend yield of 0%, an expected volatility based on industry peers of 81.25%, a risk-free interest rate of 5.11% and an estimated useful life of up to 7 years. The fair value was based on estimates of the number of options that management expects to vest, estimated to be 90%. The fair value of the RSU’s was calculated using the maximum $20 per share that could be paid. Given that no market exists for the Company’s common shares, there exists significant measurement uncertainty in assessing the fair values of the RSU’s and stock options.
F-62
Table of Contents
SunOpta BioProcess Inc.
Notes to Consolidated Financial Statements (continued)
9. Supplemental cash flow information
| December 31, 2009 $ |
December 31, 2008 $ |
|||||||
| Changes in non-cash working capital: |
||||||||
| Trade and accrued receivable |
598,696 | 27,689 | ||||||
| Inventories |
361,058 | (367,187 | ) | |||||
| Prepaid expenses and other current assets |
15,200 | 116,572 | ||||||
| Receivable from related parties |
194,653 | (210,940 | ) | |||||
| Accounts payable and accrued liabilities |
(330,766 | ) | 626,651 | |||||
| Payable to related parties |
14,249 | (391,940 | ) | |||||
| Deferred revenue |
252,017 | — | ||||||
|
|
|
|
|
|||||
| 1,105,107 | (199,155 | ) | ||||||
|
|
|
|
|
|||||
Non-cash investing activities include $269,629 (2008—$nil) related to the cost of property, plant and equipment costs and $nil (2008—$42,250) of patent costs which were unpaid at the end the year. At December 31, 2009 and 2008 the Company does not have any cash equivalents.
10. Grants
In June 2008, the Company was party to a matching grant of $100,000 from the State of Minnesota’s Agricultural Utilization Research Institute (“AURI”) in support of a project encompassing first phase feasibility and research for a 10 million gallon per year cellulosic ethanol plant. Under the terms of the award, AURI would contribute up to $100,000 of funding to the project after $200,000 of research costs were incurred. In 2009, the Company recorded its share of grant proceeds totalling $nil (2008 - $33,333) as a reduction to research and development costs.
In November 2008, the Company was party to a matching grant for up to $910,000 from the State of Minnesota’s Next Generation Energy (“NextGen”) program in support of a project encompassing second phase feasibility, research and detailed engineering for a 10 million gallon per year cellulosic ethanol plant. This award is a matching grant whereby 50% of the costs, up to a maximum of $910,000, incurred to complete the project will be reimbursed under the NextGen program. During the year ended December 31, 2009, the Company recorded $594,805 (2008 — $17,034) of grant proceeds under this program as a reduction to research and development costs.
At December 31, 2009, the Company has approximately $298,161 (2008 — $892,966) in funding committed from the State of Minnesota through May 1, 2010 for research projects.
In July 2009, the Company was awarded a Cdn $810,506 (US$ — $771,176) research grant from the National Research Council of Canada to cover labour costs incurred in conjunction with the Company’s R&D activities through to January 2011. Under the terms of the research grant, 100% of internal and 75% of external labour costs are recovered by the Company for costs that are incurred during the design and validation its lab facilities or for costs that are incurred as part of the optimization of the Company’s enzymatic hydrolysis research work. Labour costs recovered from the design and validation of the pilot plant have been recorded as a deferred government credit whereas the costs recovered for the enzymatic hydrolysis work is recorded as a reduction to research and development. Correspondingly, the Company has recorded $140,409 as a deferred government credit and has recorded $200,318 as a reduction to research and development costs in the current year.
F-63
Table of Contents
SunOpta BioProcess Inc.
Notes to Consolidated Financial Statements (continued)
At December 31, 2009 the Company has approximately $430,449 in funding committed from the National Research Council of Canada through to January 31, 2011.
11. Joint ventures
In March 2008, the Company entered into a Joint Venture agreement with Xylitol Canada. Under the terms of the agreement the Company performed $720,349 of research and development work in 2008. Based on the positive outcome of the research and development work, the parties agreed to proceed to the next phase of the project whereby the Company would be responsible for the design, construction and operation of a pilot plant in order to validate the research and development work performed in the initial phase. The capital costs incurred on the pilot plant would be borne by Xylitol Canada. Following the operation of the pilot plant, the parties will decide whether to proceed to the design, construction and operation of a commercial scale xylitol production plant. The obligations and rights for commercial scale operations will be defined following the completion of the initial phase activities described above. In the current year the Company recognized revenue of $nil (2008 —$720,349) relating to the research and development phase of the project.
In April 2008, the Company entered into a Joint Venture agreement with two other partners jointly called Central Minnesota Cellulosic Ethanol Partners (“CMCEP”). Under the terms of the agreement, CMCEP will perform an initial phase of feasibility and research. Based on the findings from the initial phase of feasibility work, CMCEP may elect to perform more extensive feasibility, research and detailed engineering in the second phase of feasibility work that would be followed by the design, construction and operation of commercial scale cellulosic ethanol production plant. Each of the partners share an equal 33.3% ownership interest in CMCEP. The Company originally recorded a $162,133 investment in CMCEP reflecting the Company’s proportionate interest in CMCEP. Subsequently, this investment was written-off as a charge to research and development in 2008 reflecting the scope of the work performed by CMCEP was research-based and as such the future recoverability of the initial investment may not be recovered. The Company’s investment and subsequent write-off in fiscal 2008 in CMCEP is a non-cash item.
Following completion of the initial phase of feasibility in November 2008 and in recognition of being awarded a matching grant for up to $910,000 from the State of Minnesota’s Next Generation Energy (“NextGen”) program, the partners elected to proceed to the second phase of feasibility. Shortly thereafter amended terms of the Joint Venture agreement were finalized to reflect each of the party’s responsibilities, contributions and sharing of grant proceeds under the second phase of feasibility. Under the amended terms of the Joint Venture agreement the Company would be the responsible for managing and funding the work required to complete the second phase of feasibility and would also be the sole beneficiary of the matching grant from the State of Minnesota. The amended terms to the Joint Venture agreement reflected a reconsideration event under ASC Topic 810 whereby the Company has determined that it is the primary beneficiary of the joint venture and therefore have consolidated the results of CMCEP operations. At December 31, 2009, CMCEP has total assets of $611,859 (2008 -$218,601) and liabilities of $nil (2008 — $235,636). In 2009, the Company recognized revenue of $nil (2008 — $221,700) reflecting feasibility work performed on behalf of CMCEP by the Company.
12. Other expense
In 2008, as a result of an unfavourable ruling in the Abener Energia S.A. arbitration case against SunOpta in the amount of €1,329,898 (US$ — $1,908,670), the Company agreed to bear 50% or $954,335 of the judgement against SunOpta, see note 3(b).
F-64
Table of Contents
SunOpta BioProcess Inc.
Notes to Consolidated Financial Statements (continued)
13. Income taxes
The provision for income taxes from continuing operations differs from the amount that would have resulted by applying the combined Canadian federal and provincial statutory income tax rate to loss before income taxes due to the following:
| December 31, 2009 $ |
December 31, 2008 $ |
|||||||
| Income tax recovery at combined statutory rates |
(1,018,366 | ) | (1,170,714 | ) | ||||
| Adjustments resulting from: |
||||||||
| Permanent differences |
2,446 | 323,707 | ||||||
| Changes to deferred tax assets and liabilities resulting from audit and other tax return adjustments |
185,750 | 33,132 | ||||||
| Carryforward (utilization) of investment and other tax credits (non-refundable) |
(455,807 | ) | (139,473 | ) | ||||
| Change in valuation allowance |
1,025,549 | 770,086 | ||||||
| Impact of changes in enacted tax rates of reversal on current year losses |
246,284 | 114,056 | ||||||
| Changes to deferred tax assets resulting from acquisition |
— | 69,206 | ||||||
| Other |
14,144 | — | ||||||
|
|
|
|
|
|||||
| Provision for income taxes, as reported |
— | — | ||||||
|
|
|
|
|
|||||
Deferred income taxes of the Company are comprised of the following:
| December 31, 2009 $ |
December 31, 2008 $ |
|||||||
| Differences in property, plant and equipment and intangible assets |
(331,234 | ) | (32,578 | ) | ||||
| Capital and non-capital losses |
1,259,654 | 659,438 | ||||||
| Scientific Research and Experimental Development |
851,989 | 357,117 | ||||||
| Investment tax credit net of deferred tax liability |
661,235 | 292,750 | ||||||
| Tax benefit of costs incurred during share issuance |
223,345 | 362,713 | ||||||
|
|
|
|
|
|||||
| 2,664,989 | 1,639,440 | |||||||
| Valuation allowance |
(2,664,989 | ) | (1,639,440 | ) | ||||
|
|
|
|
|
|||||
| Net deferred tax asset |
— | — | ||||||
|
|
|
|
|
|||||
The Company has Canadian non-capital loss carry-forwards of approximately $5,038,615 (2008 — $2,273,923) as at December 31, 2009. The amounts are available to reduce future federal and provincial income taxes. Non-capital loss carry-forwards attributable to Canada expire in varying amounts over the next 20 years.
In addition, at December 31, 2009, the Company had Scientific Research and Experimental Development (“SR&ED”) amounting to approximately $3,407,955 (2008 — $1,231,438) available to offset against future years’ taxable income from its Canadian operations, which may be carried forward indefinitely. The Company also has approximately $881,646 (2008 — $344,412) in Canadian scientific research investment tax credits, which will expire in varying amounts up to 2029.
A valuation allowance of $2,664,989 (2008 — $1,639,440) has been recorded to reduce the net benefit recorded in the consolidated financial statements as it is uncertain that the Company will be able to realize the benefit of the deferred tax asset.
F-65
Table of Contents
SunOpta BioProcess Inc.
Notes to Consolidated Financial Statements (continued)
No reconciling differences exist between the beginning and ending amount of unrecognized benefits. At December 31, 2009, the Company had no uncertain tax positions that it is aware of.
The Company’s major taxing jurisdictions include Canada and the Province of Ontario. The Company’s 2007 through 2009 tax years (and any tax year for which available non-capital loss carry-forwards were generated up to the amount of non-capital loss carry-forward) remain subject to examination by the appropriate governmental agencies for Canadian federal tax purposes. The Company does not have any other ongoing audits in various other jurisdictions.
14. Commitments and contingencies
The Company commenced a suit on January 17, 2008, against Abengoa New Technologies Inc. (“Abengoa”) and a former employee of the Company alleging theft of trade secrets, breach of contract, tortious interference with contract and civil conspiracy, and filed motions for expedited discovery and a preliminary injunction. Abengoa filed a counterclaim alleging breach of contract, misappropriation of trade secrets and other contractual violations. The United States District Court, Eastern District of Missouri, referred the core claims to arbitration and stayed the other claims pending the outcome of the arbitration. The arbitration was held during the period of July 20 to July 24 and October 19 to October 23 inclusive, in St. Louis before a single arbitrator. The arbitrator issued a ruling on February 1, 2010 denying all monetary damage claims, but also holding that the Company could independently commercialize, without payment of royalty or other obligation to Abengoa, the dilute acid hydrolysis technology the Company developed with Abengoa and implemented at Abengoa’s cellulosic ethanol facility in Salamanca, Spain. Prior to the arbitrator’s ruling, Abengoa had exclusive use, and rights to exploit, the jointly developed technology in the field of fermentable sugars and cellulosic ethanol production.
At December 31, 2009, the Company has outstanding facility lease commitments of $19,648 (2008—$37,299) with a related party. The lease term is for two years commencing November 15, 2008 and will automatically renew one year on each anniversary date unless either party gives notice of intent to not renew at least 180 days prior to the anniversary date.
Minimum commitments under the terms of the facility lease are as follows:
| $ | ||||
| 2010 |
19,648 | |||
| 2011 |
— | |||
| 2012 |
— | |||
| 2013 |
— | |||
| 2014 |
— | |||
| Thereafter |
— | |||
|
|
|
|||
| 19,648 | ||||
|
|
|
|||
F-66
Table of Contents
SunOpta BioProcess Inc.
Notes to Consolidated Financial Statements (continued)
In conjunction with the terms of an equipment supply contract, the Company has recorded a product warranty reserve for the repair costs which may be required during the guarantee period. Changes to the product warranty reserve for the years ended December 31, 2009 and 2008 are as follows:
| December 31, 2009 $ |
December 31, 2008 $ |
|||||||
| Beginning balance |
37,000 | 37,000 | ||||||
| Provisions during the year |
— | — | ||||||
| Reversal of warranty reserves |
27,000 | — | ||||||
| Actual payments |
— | — | ||||||
|
|
|
|
|
|||||
| Ending balance |
10,000 | 37,000 | ||||||
|
|
|
|
|
|||||
The Company has guaranteed the operating performance of equipment sold under an equipment supply contract. A performance test to measure the actual performance of the equipment against the contracted performance standard did not take place as the operating conditions required in order to perform the performance test was not achieved by the purchaser. As a result the equipment was deemed to have been accepted by the purchaser at the expiry of the warranty period in the current year.
15. Subsequent events
In January 2010, the Company was awarded Cdn $5,500,000 (US$ — $5,233,11) in funding from Canada Foundation for Sustainable Development Technology (“SDTC”) to assist the Company and its partners to design, build and operate an integrated cellulosic ethanol plant and co-located xylitol production facility to be located in the Greater Toronto Area. The project involves the construction of a demonstration facility at a total cost of approximately Cdn. $16,600,000 (US$ — $15,794,481), to be funded approximately 67% by the Company and Xylitol Canada and 33% by the SDTC. The facility is anticipated to produce up to a rated capacity of 620 tons of xylitol and two million liters of cellulosic ethanol per year. Operation of the facility is expected to commence in early 2011 with process validation expected to be complete by December 2011. Contracting between the Company and SDTC is expected to be completed in early 2010.
In January 2010, the Company established a $2,700,000 credit facility to facilitate the issuance and receipt of payments on equipment supply contracts entered into by the Company. Under the terms of the credit facility, the outstanding balance drawn on the credit facility is to be collateralized by the Company’s cash balance. Interest on letters of credit are charged at 1.5% per annum, payable quarterly in advance and direct drawings are charged at U.S. prime rate + 50 basis points. In January 2010, the Company issued letters of credit on the credit facility aggregating to $2,556,000. The letters of credit expire on October 20, 2010.
In January 2010, the Company entered into forward contracts to purchase $3,800,000 of Canadian dollars, at varying amounts, between March 15, 2010 and October 15, 2010 at exchange rates between $1.0616 and $1.0667 per U.S. dollar. The forward contracts, which have not been designated as hedges for accounting purposes, will economically mitigate the Company’s exposure on foreign exchange movements on Canadian-denominated purchases required on open equipment supply contracts.
In January 2010, the Company received its second milestone payment on an open equipment supply contract in the amount of $1,917,000.
F-67
Table of Contents
SunOpta BioProcess Inc.
Condensed Consolidated Statements of Operations and Comprehensive Earnings (Loss)
For the six months ended July 3, 2010 and June 30, 2009
Unaudited
(Expressed in U.S. dollars)
| July 3, 2010 $ |
June 30, 2009 $ |
|||||||
| Revenues |
2,676,154 | 131,633 | ||||||
| Cost of revenues |
1,929,566 | (18,063 | ) | |||||
|
|
|
|
|
|||||
| Gross margin |
746,588 | 149,696 | ||||||
| Selling, general and administrative expenses |
684,553 | 1,383,509 | ||||||
| Research and development |
947,740 | 347,316 | ||||||
|
|
|
|
|
|||||
| Loss before the following |
(885,705 | ) | (1,581,129 | ) | ||||
| Interest income |
49,858 | 127,537 | ||||||
| Other income (note 7) |
1,109,008 | — | ||||||
| Foreign exchange gain (loss) |
62,942 | (18,215 | ) | |||||
|
|
|
|
|
|||||
| 1,221,808 | 109,322 | |||||||
|
|
|
|
|
|||||
| Earnings (loss) before income taxes |
336,103 | (1,471,807 | ) | |||||
| Provision for income taxes |
12,212 | — | ||||||
|
|
|
|
|
|||||
| Net earnings and comprehensive earnings (loss) |
323,891 | (1,471,807 | ) | |||||
|
|
|
|
|
|||||
(See accompanying notes to condensed consolidated financial statements)
F-68
Table of Contents
SunOpta BioProcess Inc.
Condensed Consolidated Balance Sheets
As at July 3, 2010 and December 31, 2009
Unaudited
(Expressed in U.S. dollars)
| July 3, 2010 $ |
December
31, 2009 $ |
|||||||
| Assets |
||||||||
| Current assets |
||||||||
| Cash and cash equivalents |
17,974,352 | 18,954,217 | ||||||
| Accounts receivable |
531,513 | 307,219 | ||||||
| Inventories |
806 | 6,129 | ||||||
| Prepaid expenses and other current assets |
110,024 | 99,407 | ||||||
|
|
|
|
|
|||||
| 18,616,695 | 19,366,972 | |||||||
| Investments (note 7) |
1,356,925 | — | ||||||
| Property, plant and equipment (note 2) |
3,088,950 | 2,645,898 | ||||||
| Patents |
576,130 | 312,015 | ||||||
|
|
|
|
|
|||||
| 23,638,700 | 22,324,885 | |||||||
|
|
|
|
|
|||||
| Liabilities |
||||||||
| Current liabilities |
||||||||
| Accounts payable and accrued liabilities |
1,885,735 | 980,672 | ||||||
| Payable to related parties (note 3) |
315,849 | 14,249 | ||||||
| Deferred revenue |
— | 252,017 | ||||||
|
|
|
|
|
|||||
| 2,201,584 | 1,246,938 | |||||||
| Deferred government credit |
175,687 | 140,409 | ||||||
| Preferred shares |
28,386,659 | 28,188,965 | ||||||
| Shareholders’ Equity (Deficiency) |
||||||||
| Common shares |
||||||||
| Unlimited number of common shares and preference shares without par value |
||||||||
| Issued 9,200,000 common shares |
1 | 1 | ||||||
| Accumulated deficit |
(7,125,231 | ) | (7,251,428 | ) | ||||
|
|
|
|
|
|||||
| (7,125,230 | ) | (7,251,427 | ) | |||||
|
|
|
|
|
|||||
| 23,638,700 | 22,324,885 | |||||||
|
|
|
|
|
|||||
(See accompanying notes to condensed consolidated financial statements)
F-69
Table of Contents
SunOpta BioProcess Inc.
Condensed Consolidated Statements of Shareholders’ Deficiency
As at July 3, 2010 and June 30, 2009
Unaudited
(Expressed in U.S. dollars)
| Common shares |
Additional paid in capital |
Accumulated Deficit |
Total | |||||||||||||
| $ | $ | $ | $ | |||||||||||||
| Balance at December 31, 2009 |
1 | — | (7,251,428 | ) | (7,251,427 | ) | ||||||||||
| Net earnings |
— | — | 323,891 | 323,891 | ||||||||||||
| Accretion of preferred shares |
— | — | (197,694 | ) | (197,694 | ) | ||||||||||
|
|
|
|
|
|
|
|
|
|||||||||
| Balance at July 3, 2010 |
1 | — | (7,125,231 | ) | (7,125,230 | ) | ||||||||||
|
|
|
|
|
|
|
|
|
|||||||||
| Common shares |
Additional paid in capital |
Accumulated Deficit |
Total | |||||||||||||
| $ | $ | $ | $ | |||||||||||||
| Balance at December 31, 2008 |
1 | 157,980 | (3,924,918 | ) | (3,766,937 | ) | ||||||||||
| Net loss |
— | — | (1,471,807 | ) | (1,471,807 | ) | ||||||||||
| Accretion of preferred shares |
— | (157,980 | ) | (36,960 | ) | (194,940 | ) | |||||||||
|
|
|
|
|
|
|
|
|
|||||||||
| Balance at June 30, 2009 |
1 | — | (5,433,685 | ) | (5,433,684 | ) | ||||||||||
|
|
|
|
|
|
|
|
|
|||||||||
(See accompanying notes to condensed consolidated financial statements)
F-70
Table of Contents
SunOpta BioProcess Inc.
Condensed Consolidated Statements of Cash Flows
For the six months ended July 3, 2010 and June 30, 2009
Unaudited
(Expressed in U.S. dollars)
| July 3, 2010 $ |
June 30, 2009 $ |
|||||||
| Cash provided by (used in) |
||||||||
| Operating activities |
||||||||
| Net earnings (loss) |
323,891 | (1,471,807 | ) | |||||
| Items not affecting cash |
||||||||
| Amortization |
178,338 | 70,361 | ||||||
| Unrealized foreign exchange losses (gains) |
43,195 | (658 | ) | |||||
| Non-cash dilution gain from Investment |
(1,242,008 | ) | — | |||||
| Equity losses from Investment |
133,000 | — | ||||||
| Changes in non-cash working capital (note 5) |
712,791 | 780,855 | ||||||
|
|
|
|
|
|||||
| 149,207 | (621,249 | ) | ||||||
|
|
|
|
|
|||||
| Investing activities |
||||||||
| Increase in short-term investments |
— | (1,500,000 | ) | |||||
| Purchase of long-term investment |
(247,917 | ) | — | |||||
| Purchase of property, plant and equipment |
(621,390 | ) | (998,745 | ) | ||||
| Purchase of patents |
(264,115 | ) | (23,302 | ) | ||||
|
|
|
|
|
|||||
| (1,133,422 | ) | (2,522,047 | ) | |||||
|
|
|
|
|
|||||
| Financing activities |
||||||||
| Proceeds from government subsidy |
35,278 | — | ||||||
| Foreign exchange (loss) gain on cash held in foreign currency |
(30,928 | ) | 6,077 | |||||
|
|
|
|
|
|||||
| Decrease in cash and cash equivalents during the period |
(979,865 | ) | (3,137,219 | ) | ||||
| Cash and cash equivalents—Beginning of the period |
18,954,217 | 22,076,502 | ||||||
|
|
|
|
|
|||||
| Cash and cash equivalents—End of the period |
17,974,352 | 18,939,283 | ||||||
|
|
|
|
|
|||||
| Cash and cash equivalents at the end of the period are comprised of the following: |
||||||||
| Cash |
17,974,352 | 439,283 | ||||||
| Cash equivalents |
— | 18,500,000 | ||||||
|
|
|
|
|
|||||
| 17,974,352 | 18,939,283 | |||||||
(See accompanying notes to condensed consolidated financial statements)
F-71
Table of Contents
SunOpta BioProcess Inc.
Notes to Condensed Consolidated Financial Statements
For the three and six months ended July 3, 2010 and June 30, 2009
Unaudited
(Expressed in U.S. dollars)
1. Basis of presentation
The interim condensed consolidated financial statements of SunOpta BioProcess Inc. (the “Company”) have been prepared in accordance with accounting principles generally accepted in the United States of America (“GAAP”). These financial statements do not include all of the disclosures required by GAAP for annual financial statements. In the opinion of management, all adjustments considered necessary for fair presentation have been included and all such adjustments are of a normal, recurring nature. Operating results for the six months ended July 3, 2010 are not necessarily indicative of the results that may be expected for the full year ending January 1, 2011. These interim condensed financial statements of the Company have been prepared on a basis consistent with the financial statements for the year ended December 31, 2009. For further information, see the Company’s consolidated financial statements, and notes thereto, prepared as at and for the period ending December 31, 2009.
Fiscal year-end
On March 9, 2010, the directors approved a change to the Company’s fiscal year period from a fiscal year ending on December 31 to a floating year-end on the Saturday closest to December 31, based on a 52 week calendar, wherein every fiscal quarter (except for the first quarter of Fiscal 2010 which included two additional days) is comprised of 13 weeks or 91 days. This change is effective for fiscal 2010, resulting in a year-end of January 1, 2011 and the quarterly periods for fiscal 2010 ending on April 3, July 3 and October 2.
New accounting pronouncements
In June 2009, the Financial Accounting Standards Board (“FASB”) issued Accounting Standards Codification (“ASC”) Topic 810 (formerly Statement of Financial Accounting Standard (“SFAS”) No. 167, “Amendments to FASB Interpretation No. 46(R)”). This accounting standard is a revision to a previous FASB Interpretation and changes how a reporting entity evaluates whether an entity is a variable interest entity (“VIE”) and which entity is considered the primary beneficiary of a VIE and is therefore required to consolidate the VIE. This accounting standard will also require continuous reassessments of which party within the VIE is considered the primary beneficiary. ASC 810 became effective January 1, 2010. As a result of adopting this standard, the Company reassessed its investments and did not change its accounting treatment for its interests in its joint ventures.
In January 2010, the FASB issued Accounting Standards Update (“ASU”) No. 2010-06, “Improving Disclosures about Fair Value Measurements,” which amends ASC Topic 820, “Fair Value Measures and Disclosures.” ASU No. 2010-06 amends the ASC to require disclosure of transfers into and out of Level 1 and Level 2 fair value measurements, and also requires more detailed disclosure about the activity within Level 3 fair value measurements. The adoption of ASU No. 2010-06 did not have a material impact on the Company’s condensed consolidated financial statements.
F-72
Table of Contents
SunOpta BioProcess Inc.
Notes to Condensed Consolidated Financial Statements (continued)
2. Property, plant and equipment
| July 3, 2010 | ||||||||||||
| Cost $ |
Accumulated Amortization $ |
Net Book Value $ |
||||||||||
| Buildings |
438,644 | (201,181 | ) | 237,463 | ||||||||
| Lab facilities |
868,849 | (91,109 | ) | 777,740 | ||||||||
| Machinery and lab equipment |
506,625 | (119,229 | ) | 387,396 | ||||||||
| Office furniture, computer equipment and software |
251,905 | (195,082 | ) | 56,823 | ||||||||
| Construction in progress |
1,629,528 | — | 1,629,528 | |||||||||
|
|
|
|
|
|
|
|||||||
| 3,695,551 | (606,601 | ) | 3,088,950 | |||||||||
|
|
|
|
|
|
|
|||||||
| December 31, 2009 | ||||||||||||
| Cost $ |
Accumulated Amortization $ |
Net Book Value $ |
||||||||||
| Buildings |
421,291 | (106,105 | ) | 315,186 | ||||||||
| Lab facilities |
851,496 | (46,737 | ) | 804,759 | ||||||||
| Machinery and lab equipment |
479,394 | (94,272 | ) | 385,122 | ||||||||
| Office furniture, computer equipment and software |
230,135 | (181,149 | ) | 48,986 | ||||||||
| Construction in progress |
1,091,845 | — | 1,091,845 | |||||||||
|
|
|
|
|
|
|
|||||||
| 3,074,161 | (428,263 | ) | 2,645,898 | |||||||||
|
|
|
|
|
|
|
|||||||
3. Related party balances and transactions
Related party balances and transactions entered into with SunOpta Inc., the Company’s Parent, during the six months ended July 3, 2010 are as follows:
| Balance payable at December 31, 2009 |
(14,249 | ) | ||
| Purchases and services performed by SunOpta Inc. on behalf of the Company |
(397,600 | ) | ||
| Payments to SunOpta Inc. |
96,000 | |||
|
|
|
|||
| Balance payable at July 3, 2010 |
(315,849 | ) | ||
|
|
|
For the six months ended July 3, 2010 the Company paid management fees of $96,000 (2009 - $61,000) to SunOpta Inc.
4. Preferred shares
| June 30, 2010 $ |
December 31 2009 $ |
|||||||
| Preferred shares |
28,386,659 | 28,188,965 | ||||||
|
|
|
|
|
|||||
On June 7, 2007, the Company completed a private placement for the sale of 1,500,000 non-dividend bearing, convertible preferred shares in the Company for gross proceeds of $30,000,000. The Company incurred issuance costs of approximately $2,808,000 in relation to this preferred share offering, including the fair value (non-cash) of $762,271 assigned to warrants of SunOpta Inc., the parent company, granted to investors as part of
F-73
Table of Contents
SunOpta BioProcess Inc.
Notes to Condensed Consolidated Financial Statements (continued)
the financing. These issuance costs have been offset against the carrying value of the preferred shares. The preferred shares do not bear any dividend and contain a conversion feature that allows the holders to convert the preferred shares to common shares in the Company at any time on a one-for-one basis. At any time following the seventh anniversary of the closing date (June 7, 2014) or upon the occurrence of a change in control, holders of the majority of preferred shares will have the right to require the Company to redeem all of the preferred shares for a cash payment equal to the original issue price ($20 per share, in aggregate $30,000,000). Should the Company complete a qualified initial public offering (defined in the preferred share agreement as greater than $50,000,000), the preferred shares would automatically be converted into common shares of the Company upon closing of the transaction. In the event that a qualified initial public offering does not occur by June 7, 2014, the preferred shareholders would have the option to redeem their shares for a cash payment equal to the original issue price of $20 per share. The preferred shares are classified on the consolidated balance sheet as mezzanine equity as they have a mandatory redemption feature after seven years if a qualified initial public offering does not take place.
Included in the issuance costs discussed above is the fair value of $762,271 attributed to warrants to purchase 648,300 common shares of SunOpta at a price of $11.57 (exercisable within six months of the date of closing) that were granted to the Company’s preferred share investors upon the closing of the transaction.
The fair value of these warrants was determined using the Black-Scholes option pricing model (using an expected volatility of 40.2%, a risk-free interest rate of 4.99% and an estimated useful life of six months). During the fourth quarter of 2007, the warrant holders exercised their warrants, resulting in cash proceeds to SunOpta of $7,500,831.
The preferred shares are presented net of issuance costs (with no associated tax benefit) and the value of the preferred shares is being accreted to the $30,000,000 redemption value over a seven-year period using the effective interest method. During the six month period ended July 3, 2010 the Company recorded interest accretion of $194,940 (2009 - $197,694). The annual interest accretion is charged to additional paid in capital and then to accumulated deficit.
In conjunction with the private placement, the Company granted 800,000 restricted stock units and 800,000 stock options (with an exercise price of $20 per share) in the Company’s common shares to certain employees of the Company. The RSU’s allow for a cash payment or the grant of shares to certain employees equal to the issuance price in a future initial public offering (to a maximum of $20 per share). The RSU’s and the stock options granted only vest if a change of control of the Company occurs, or the Company completes an initial public offering and, as such, these units are considered performance-based awards under ASC Topic 718. Accordingly, no expense is recorded in the consolidated financial statements until the contingent element of the award has been resolved. The RSU’s expire 10 days after vesting whereas, unless terminated earlier in accordance with the Company’s stock option plan, the stock options expire on the seventh anniversary of the closing date (i.e. June 7, 2014). Should the Company complete an initial public offering the RSU’s and stock options could be converted into common shares of the Company upon closing of the transaction.
At the date of the grant, the Company estimated that the fair value associated with the stock option grant was $11,024,568 and RSU’s was $14,400,000. The fair value of the options was calculated using the Black-Scholes option pricing model with the assumptions of a dividend yield of 0%, an expected volatility based on industry peers of 81.25%, a risk-free interest rate of 5.11% and an estimated useful life of up to 7 years. The fair value was based on estimates of the number of options that management expects to vest, estimated to be 90%. The fair value of the RSU’s was calculated using the maximum $20 per share that could be paid. Given that no market exists for the Company’s common shares, there exists significant measurement uncertainty in assessing the fair values of the RSU’s and stock options.
F-74
Table of Contents
SunOpta BioProcess Inc.
Notes to Condensed Consolidated Financial Statements (continued)
On August 31, 2010, the Company completed a qualifying transaction. See note 8 for further details.
5. Supplemental cash flow information
| Six months ended | ||||||||
| July 3, 2010 $ |
June 30, 2009 $ |
|||||||
| Changes in non-cash working capital: |
||||||||
| Trade and accrued receivable |
(224,294 | ) | 408,470 | |||||
| Inventories |
5,323 | 23,499 | ||||||
| Prepaid expenses and other current assets |
(10,617 | ) | (56,956 | ) | ||||
| Accounts payable and accrued liabilities |
892,796 | 220,438 | ||||||
| Payable to related parties |
301,600 | 185,404 | ||||||
| Deferred revenue |
(252,017 | ) | — | |||||
|
|
|
|
|
|||||
| 712,791 | 780,855 | |||||||
|
|
|
|
|
|||||
6. Derivative financial instruments and fair value measurement
Effective January 1, 2009, the Company applied the provisions of ASC 820-10-55 (formerly FASB FSP 157-2/SFAS 157, “Effective Date of FASB Statement No. 157”) applicable to financial assets and liabilities and to certain non-financial assets and liabilities that are measured at fair value on a recurring basis. Additionally, the Company applies the provisions of this standard to financial and non-financial assets and liabilities. This standard defines fair value, establishes a consistent framework for measuring fair value and expands disclosure requirements about fair value measurements. In addition, this standard requires the Company to maximize the use of observable inputs and minimize the use of unobservable inputs when measuring fair value.
This standard also provides a hierarchy of valuation techniques based on whether the inputs to those valuation techniques are observable or unobservable. Observable inputs reflect market data obtained from independent sources, while unobservable inputs reflect the Company’s assumptions with respect to how market participants would price an asset or liability. These two inputs used to measure fair value fall into the following three different levels of the fair value hierarchy:
| • | Level 1: Quoted prices (unadjusted) for identical assets or liabilities in active markets that are observable |
| • | Level 2: Quoted prices for similar assets or liabilities in active markets; quoted prices for identical or similar assets or liabilities that are non-active; inputs other than quoted prices that are observable and derived from or are corroborated by observable market data |
| • | Level 3: Valuations derived from valuation techniques in which one or more significant inputs are unobservable due to little or no market activity |
This hierarchy requires the use of observable market data when available.
F-75
Table of Contents
SunOpta BioProcess Inc.
Notes to Condensed Consolidated Financial Statements (continued)
The following table presents for each of the fair value hierarchies, the assets and liabilities that are measured at fair value on a recurring basis as of July 3, 2010:
| Fair Value
Liability $ |
Level 1 $ |
Level 2 $ |
||||||||||
| Forward foreign currency contracts a) |
2,649 | — | 2,649 | |||||||||
|
|
|
|
|
|
|
|||||||
| 2,649 | — | 2,649 | ||||||||||
|
|
|
|
|
|
|
|||||||
The forward foreign currency contracts are included in accounts payable and accrued liabilities on the consolidated balance sheet.
a) Foreign forward currency contracts
As part of its risk management strategy, the Company enters into forward foreign exchange contracts to reduce its exposure to fluctuations in foreign currency exchange rates. For any open forward foreign exchange contracts at period end, the contract rate is compared to the forward rate, and a gain or loss is recorded. These contracts are placed in level 2 of the fair value hierarchy, as there are quoted prices in active markets to observe the fair value determination. These forward foreign exchange contracts represent economic hedges and are not designated as hedging instruments. At July 3, 2010, the Company had open forward foreign exchange contracts with a notional value of Cdn $1,400,000 that resulted in an unrealized gain of $2,649 which is included in foreign exchange gain (loss) on the consolidated statements of operations.
7. Other Income
During the second quarter of 2010, the Company’s interest in the integrated xylitol production technology that was developed with its partner, Sweet Diabetic Delight Foods, Inc., doing business as Xylitol Canada (“XC”), was exchanged with XC in return for 50% of the entity. Concurrent with this transaction, the shares of XC were sold to Chudleigh Ventures Inc (“CVI”), a capital pool company listed on TSX Venture Exchange, and additional capital was raised in CVI through a private placement. Following these transactions, the Company retained common shares in CVI representing approximately 31.4% of the outstanding capital. As a result of the dilution in ownership in CVI, the Company recorded a non-taxable dilution gain of $1,242,008. The Company accounts for its investment in CVI under the equity method.
Offsetting this gain is the Company’s share of losses on its investment in CVI of $133,000 during the six months ended July 3, 2010.
8. Subsequent events
On August 31, 2010, the Company was acquired by Mascoma Canada Inc., a wholly-owned subsidiary of Mascoma Corporation (“Mascoma”). In consideration of the acquisition the shareholders in the Company received non-cash consideration through a combination of preferred and common shares, as well as warrants, valued at $50,886,000. The non-cash consideration includes 11,268,868 series D preferred shares, 3,756,290 common shares and 1,000,000 warrants to purchase common shares of Mascoma. In conjunction with the sale, the preferred share liability of the Company was settled with the former preferred shareholders, through the transfer of 4,688,000 of the series D preferred shares received. In addition, as a result of the change in control of the Company, the vesting of previously issued stock options was accelerated, and the 800,000 restricted stock units (“RSU”) were settled in cash at a value of $4.49 per RSU.
In preparing the accompanying financial statements and related disclosures, we have evaluated subsequent events through the date the financial statements are available to be issues, which is September 8, 2011.
F-76
Table of Contents
UNAUDITED PRO FORMA COMBINED CONDENSED CONSOLIDATED
FINANCIAL STATEMENTS
(AMOUNTS IN THOUSANDS)
On August 31, 2010, Mascoma Corporation acquired 100% of the shares of SunOpta BioProcess Inc. (“SBI”), a company, with headquarters in Canada, that provides equipment and process solutions for biomass conversion.
The consideration issued by Mascoma Corporation for the SBI acquisition was as follows:
| Series D convertible redeemable preferred stock at fair value |
$ | 42,258 | ||
| Common stock at fair value |
7,400 | |||
| Warrants to purchase common stock at fair value |
1,228 | |||
|
|
|
|||
| Total consideration |
$ | 50,886 | ||
|
|
|
Transaction costs related to this transaction totaled $1,634, which has been reported within selling, general and administrative expenses in the consolidated statement of operations for the year ended December 31, 2010. The excess of the purchase price over the fair value of the identifiable acquired net assets has been allocated to goodwill, none of which is tax deductible. The operations of SBI are included in the Company’s operating results from the acquisition date.
The following unaudited pro forma combined condensed consolidated statement of operations for the year ended December 31, 2010 gives effect to the acquisition described above accounted for under the purchase method of accounting. The unaudited pro forma combined condensed consolidated statement of operations are based on the historical consolidated statements of operations of Mascoma Corporation and SBI under the assumptions and adjustments set forth in the accompanying notes to the unaudited pro forma combined condensed consolidated financial statements.
The unaudited pro forma combined condensed consolidated statement of operations for the year ended December 31, 2010 assumes the acquisition was consummated on January 1, 2010 and combine Mascoma Corporation’s historical consolidated statements of operations, which includes the operations of SBI from September 1, 2010 to December 31, 2010, with SBI’s historical unaudited statements of operations for the eight months ended August 31, 2010.
The unaudited pro forma combined condensed consolidated statement of operations may not be indicative of the results that actually would have occurred if the acquisition had been consummated on the dates indicated or which may be obtained in the future. The unaudited pro forma combined condensed consolidated statement of operations should be read in conjunction with the historical consolidated financial statements of Mascoma Corporation and SBI.
F-77
Table of Contents
UNAUDITED PRO FORMA COMBINED STATEMENT OF OPERATIONS
For the Year Ended December 31, 2010
(Amounts in thousands, except per share data)
| Mascoma Corporation Historical |
SBI Historical |
Pro Forma Adjustments |
Combined Total |
|||||||||||||
| REVENUES: |
||||||||||||||||
| Product sales |
$ | 1,466 | $ | 4,005 | — | $ | 5,471 | |||||||||
| Government grants |
13,276 | — | — | 13,276 | ||||||||||||
| Other service arrangements |
750 | — | — | 750 | ||||||||||||
|
|
|
|
|
|
|
|
|
|||||||||
| Total revenues |
15,492 | 4,005 | — | 19,497 | ||||||||||||
|
|
|
|
|
|
|
|
|
|||||||||
| COST OF PRODUCT SALES AND OPERATING EXPENSES: |
||||||||||||||||
| Cost of product sales |
1,120 | 2,701 | — | 3,821 | ||||||||||||
| Research and development |
26,539 | 947 | — | 27,486 | ||||||||||||
| Selling, general and administrative |
10,212 | 1,893 | 1,027 | (A) | 13,132 | |||||||||||
|
|
|
|
|
|
|
|
|
|||||||||
| Total costs and operating expenses |
37,871 | 5,541 | 1,027 | 44,439 | ||||||||||||
|
|
|
|
|
|
|
|
|
|||||||||
| LOSS FROM OPERATIONS |
(22,379 | ) | (1,536 | ) | (1,027 | ) | (24,942 | ) | ||||||||
|
|
|
|
|
|
|
|
|
|||||||||
| OTHER INCOME (EXPENSE): |
||||||||||||||||
| Interest income |
62 | 26 | — | 88 | ||||||||||||
| Interest expense and other financing costs |
(3,469 | ) | 1,244 | — | (2,225 | ) | ||||||||||
|
|
|
|
|
|
|
|
|
|||||||||
| Other income (expense), net |
(3,407 | ) | 1,270 | — | (2,137 | ) | ||||||||||
|
|
|
|
|
|
|
|
|
|||||||||
| EQUITY IN LOSS OF EQUITY METHOD INVESTMENT |
(143 | ) | (133 | ) | — | (276 | ) | |||||||||
|
|
|
|
|
|
|
|
|
|||||||||
| NET LOSS |
(25,929 | ) | (399 | ) | (1,027 | ) | (27,355 | ) | ||||||||
| AMOUNT ATTRIBUTABLE TO REDEEMABLE NONCONTROLLING INTEREST |
201 | — | — | 201 | ||||||||||||
|
|
|
|
|
|
|
|
|
|||||||||
| NET LOSS ATTRIBUTABLE TO MASCOMA CORPORATION |
(25,728 | ) | (399 | ) | (1,027 | ) | (27,154 | ) | ||||||||
| ACCRETION OF REDEEMABLE CONVERTIBLE PREFERRED STOCK |
(205 | ) | — | — | (205 | ) | ||||||||||
|
|
|
|
|
|
|
|
|
|||||||||
| NET LOSS ATTRIBUTABLE TO COMMON STOCKHOLDERS OF MASCOMA CORPORATION |
$ | (25,933 | ) | $ | (399 | ) | $ | (1,027 | ) | $ | (27,359 | ) | ||||
|
|
|
|
|
|
|
|
|
|||||||||
| NET LOSS ATTRIBUTABLE TO MASCOMA COMMON STOCKHOLDERS PER SHARE—BASIC AND DILUTED |
$ | (5.39 | ) | — | — | $ | (3.74 | ) | ||||||||
| Weighted-average common shares outstanding—basic and diluted |
4,813 | — | 2,501 | (B) | 7,314 | |||||||||||
F-78
Table of Contents
NOTES TO UNAUDITED PRO FORMA COMBINED CONDENSED CONSOLIDATED
STATEMENT OF OPERATIONS
(AMOUNTS IN THOUSANDS)
1. Basis of Presentation
The historical results of Mascoma Corporation include the results of operations of SBI since August 31, 2010, the date of acquisition, to December 31, 2010. The historical results of SBI include the results of operations of SBI for the period January 1, 2010 through August 30, 2010, the date immediately prior to the acquisition date. The unaudited pro forma combined condensed consolidated statement of operations has been prepared to reflect the acquisition as if it occurred on January 1, 2010.
The pro forma data included herein is presented for illustrative purposes only and is not necessarily indicative of the operating results that would have occurred had the transaction been consummated as of January 1, 2010. The pro forma adjustments included herein reflect only those adjustments that are directly attributable to the SBI acquisition and factually determinable, and with respect to the following unaudited pro forma condensed combined statements of operations, expected to have a continuing impact on Mascoma Corporation.
2. Purchase Price Allocation
The purchase price was allocated to the fair value of the assets acquired and liabilities assumed as follows:
| Cash and cash equivalents |
$ | 9,590 | ||
| Restricted cash |
2,556 | |||
| Receivable from selling stockholders for working capital adjustment |
1,523 | |||
| Accounts receivable |
1,558 | |||
| Prepaids and other current assets |
237 | |||
| Property and equipment |
2,397 | |||
| Equity interest in Xylitol Canada, Inc. (“Xylitol”) |
4,835 | |||
| Intangible assets |
||||
| Developed technologies (life of 5 years) |
7,400 | |||
| Customer relationships (life of 2 years) |
120 | |||
| Goodwill |
22,488 | |||
| Current liabilities |
(1,818 | ) | ||
|
|
|
|||
| Net assets acquired |
$ | 50,886 | ||
|
|
|
3. Pro Forma adjustments
The following is a summary of pro forma adjustments reflected in the unaudited pro forma combined condensed consolidated financial statements based on preliminary estimates, which may change as additional information is obtained:
| (A) | Adjustment to record an additional 8 months of amortization expense for the $7,520 of acquired identifiable intangibles assets on a straight-line basis. For purposes of the pro forma adjustments presented, the Company has used an estimated weighted-average useful life of the acquired identifiable intangible assets of approximately 5 years. |
| (B) | Mascoma Corporation issued 3,756 shares of common stock as part of the purchase price consideration. The adjustment here reflects the impact on the basic and diluted shares outstanding as if the common shares had been outstanding since January 1, 2010. |
F-79
Table of Contents

Table of Contents
PART II
INFORMATION NOT REQUIRED IN PROSPECTUS
Item 13. Other Expenses of Issuance and Distribution
The following table sets forth all expenses, other than the underwriting discounts and commissions, payable by the Registrant in connection with the sale of the common stock being registered. All the amounts shown are estimates except the SEC registration fee and the FINRA filing fee.
| Total | ||||
| SEC registration fee |
$ | 11,610 | ||
| FINRA filing fee |
$ | 10,500 | ||
| Stock exchange initial listing fee |
$ | * | ||
| Blue sky qualification fees and expenses |
$ | * | ||
| Printing and engraving expenses |
$ | * | ||
| Legal fees and expenses |
$ | * | ||
| Accounting fees and expenses |
$ | * | ||
| Transfer agent and registrar fees |
$ | * | ||
| Miscellaneous |
$ | * | ||
|
|
|
|||
| Total |
$ | * | ||
|
|
|
|||
| * | To be filed by amendment. |
Item 14. Indemnification of Directors and Officers
Section 145 of the General Corporation Law of the State of Delaware, or the DGCL, authorizes a corporation, under certain circumstances, to indemnify any person who was or is a party or is threatened to be made a party to any threatened, pending or completed action, suit or proceeding, whether civil, criminal, administrative or investigative (other than an action by or in the right of the corporation), by reason of the fact that the person is or was an officer or director of such corporation, against expenses (including attorneys’ fees), judgments, fines and amounts paid in settlement actually and reasonably incurred by such person in connection with such action, suit or proceeding, if he or she acted in good faith and in a manner he reasonably believed to be in or not opposed to the best interests of the corporation. With respect to any criminal action or proceeding, such indemnification is available if he or she had no reasonable cause to believe his or her conduct was unlawful.
Section 145 of the DGCL permits a corporation to include in its charter documents, and in agreements between the corporation and its directors and officers, provisions expanding the scope of indemnification beyond that specifically provided by the current law.
The Registrant’s amended and restated certificate of incorporation and amended and restated by-laws provide for the indemnification of directors to the fullest extent permissible under Delaware law.
The Registrant’s amended and restated by-laws, which will be effective upon the completion of this offering, provide for the indemnification of officers, directors and third parties acting on the Registrant’s behalf if such persons act in good faith and in a manner reasonably believed to be in and not opposed to the Registrant’s best interest, and, with respect to any criminal action or proceeding, such indemnified party had no reason to believe his or her conduct was unlawful.
The Registrant is entering into indemnification agreements with each of its directors and executive officers, in addition to the indemnification provisions provided for in its charter documents, and the Registrant intends to enter into indemnification agreements with any new directors and executive officers in the future.
II-1
Table of Contents
The underwriting agreement (to be filed as Exhibit 1.1 hereto) will provide for indemnification by the underwriters, severally and not jointly, of the Registrant, its directors and its officers who sign this Registration Statement with respect to losses arising from misstatements or omissions in the Registration Statement or prospectus with reference to information relating to such underwriters furnished to the Registrant in writing by such underwriters expressly for use herein.
The Registrant intends to purchase and maintain insurance on behalf of any person who is or was a director or officer against any loss arising from any claim asserted against him or her and incurred by him or her in that capacity, subject to certain exclusions and limits of the amount of coverage.
Item 15. Recent Sales of Unregistered Securities
In the three years preceding the filing of this registration statement, the Registrant has issued the following securities that were not registered under the Securities Act:
1. In February 2008, the Registrant issued a warrant to purchase an aggregate of 262,173 shares of the Registrant’s Series B preferred stock at an exercise price of $2.67 per share to Pinnacle Ventures II Equity Holdings, L.L.C., an accredited investor.
2. In February 2008, the Registrant issued a warrant to purchase an aggregate of 109,375 of the Registrant’s Series C preferred stock at an exercise price of $6.40 per share to Pinnacle Ventures II Equity Holdings, L.L.C., an accredited investor.
3. In December 2008, the Registrant issued a warrant to purchase an aggregate of 70,312 of the Registrant’s Series C preferred stock at an exercise price of $6.40 per share to Pinnacle Ventures II Equity Holdings, L.L.C., an accredited investor. In July 2009, the Registrant amended and restated this warrant to purchase an aggregate of 101,563 shares of the Registrant’s Series C preferred stock at an exercise price of $6.40 per share.
4. In April 2010, the Registrant issued subordinated convertible promissory notes, or the 2010 Notes in the aggregate principal amount of approximately $10,000,000 to 32 investors, who were either (a) U.S. residents and accredited or (b) foreign residents. The 32 investors included entities affiliated with General Catalyst Group, VantagePoint, Pinnacle Ventures, and Bluestem.
5. In August 2010, the Registrant issued 4,688,002 shares of the Registrant’s Series D preferred stock to 14 investors who were either (a) U.S. residents and accredited or (b) foreign residents, all of whom were former stockholders of SunOpta BioProcess Inc., or SBI, (not including SunOpta Inc.), in connection with the Registrant’s acquisition of SBI.
6. In August 2010, the Registrant issued 6,580,866 shares of the Registrant’s Series D preferred stock, 3,756,290 shares of the Registrant’s common stock and warrants to purchase 1,000,000 shares of the Registrant’s common stock at an exercise price of $3.75 per share to SunOpta Inc. in connection with the Registrant’s acquisition of SBI.
7. In August 2010, in connection with the Registrant’s acquisition of SBI described above, the 2010 Notes were converted into an aggregate of 2,702,883 shares of the Registrant’s Series D preferred stock and the Registrant issued to 32 investors who were either (a) U.S. residents and accredited or (b) foreign residents. Also in connection with the conversion of the 2010 Notes, we issued warrants to purchase an aggregate of 1,357,806 shares of the Registrant’s Series D preferred stock at an exercise price of $3.75 per share to the 32 investors who were either (a) U.S. residents and accredited or (b) foreign residents.
8. In January 2011, the Registrant issued 1,333,333 shares of the Registrant’s Series D preferred stock at $3.75 per share and warrants to purchase an aggregate of 1,333,333 additional shares of the Registrant’s Series D preferred stock at an exercise price of $3.75 per share to Diamond Alternative Energy, LLC for an aggregate purchase price of approximately $5.0 million.
II-2
Table of Contents
9. In June 2011, the Registrant issued warrants to purchase 659,898 shares of the Registrant’s common stock at an exercise price of $1.97 to each of Pinnacle Ventures II Equity Holdings, L.L.C. and Pinnacle Ventures III Equity Holdings, L.L.C., each of which is an accredited investor.
10. In August through September 2011, the Registrant issued subordinated convertible promissory notes, or the 2011 Notes in the aggregate principal amount of approximately $7,353,998 to 30 investors who were U.S. residents and accredited.
11. In August 2011, the Registrant issued 1,333,333 shares of the Registrant’s Series D preferred stock at $3.75 per share upon the exercise by Diamond Alternative Energy, LLC of its Series D preferred stock warrants for an aggregate purchase price of approximately $5.0 million.
12. As of June 30, 2011, the Registrant has granted options to purchase 16,413,289 shares of the Registrant’s common stock at exercise prices ranging from $0.001 to $2.95 per share to employees, directors, consultants and other service providers under the Registrant’s 2006 Stock Incentive Plan.
13. As of June 30, 2011, the Registrant has issued 200,342 shares of the Registrant’s common stock to employees, directors, consultants and other service providers upon the exercise of options and stock purchase rights granted by the Registrant under the Registrant’s 2006 Stock Incentive Plan, at exercise prices ranging from $0.001 to $2.95 per share.
The issuance of securities described above in paragraphs (1) through (10) were exempt from registration under the Securities Act of 1933, as amended, or the Securities Act, in reliance on Section 4(2) of the Securities Act, Regulation D promulgated thereunder, and/or Regulation S promulgated thereunder, and as transactions by an issuer not involving any public offering. The purchasers of the securities in these transactions represented that they were acquiring the securities for investment only and not with a view toward the public sale or distribution thereof. Such purchasers received written disclosures that the securities had not been registered under the Securities Act and that any resale must be made pursuant to a registration statement or an available exemption from registration. All purchasers either received adequate financial statement or non-financial statement information about the Registrant or had adequate access, through their relationship with the Registrant, to financial statement or non-financial statement information about the Registrant. The sale of these securities was made without general solicitation or advertising.
The issuance of securities described above in paragraphs (11) and (12) were exempt from registration under the Securities Act, in reliance on Rule 701, Section 4(2) and/or Regulation S of the Securities Act, pursuant to compensatory benefit plans or agreements approved by the Registrant’s board of directors.
All certificates representing the securities issued in these transactions described in this Item 15 included appropriate legends setting forth that the securities had not been offered or sold pursuant to a registration statement and describing the applicable restrictions on transfer of the securities. There were no underwriters employed in connection with any of the transactions set forth in this Item 15.
Item 16. Exhibits and Financial Statement Schedules
(a) Exhibits.
The exhibits to the registration statement are listed in the Exhibit Index to this registration statement and are incorporated herein by reference.
(b) Financial Statement Schedule.
All schedules have been omitted because they are not applicable.
II-3
Table of Contents
Item 17. Undertakings
Insofar as indemnification for liabilities arising under the Securities Act of 1933, as amended, may be permitted to directors, officers and controlling persons of the Registrant pursuant to the foregoing provisions, or otherwise, the Registrant has been advised that in the opinion of the Securities and Exchange Commission such indemnification is against public policy as expressed in the Securities Act and is, therefore, unenforceable. In the event that a claim for indemnification against such liabilities (other than the payment by the Registrant of expenses incurred or paid by a director, officer or controlling person of the Registrant in the successful defense of any action, suit or proceeding) is asserted by such director, officer or controlling person in connection with the securities being registered, the Registrant will, unless in the opinion of its counsel the matter has been settled by controlling precedent, submit to a court of appropriate jurisdiction the question whether such indemnification by it is against public policy as expressed in the Securities Act of 1933 and will be governed by the final adjudication of such issue.
The Registrant hereby undertakes that:
(a) The Registrant will provide to the underwriters at the closing as specified in the underwriting agreement, certificates in such denominations and registered in such names as required by the underwriters to permit prompt delivery to each purchaser.
(b) For purposes of determining any liability under the Securities Act, the information omitted from the form of prospectus filed as part of this registration statement in reliance upon Rule 430A and contained in a form of prospectus filed by the Registrant pursuant to Rule 424(b)(1) or (4) or 497(h) under the Securities Act shall be deemed to be part of this registration statement as of the time it was declared effective.
(c) For the purpose of determining any liability under the Securities Act each post-effective amendment that contains a form of prospectus shall be deemed to be a new registration statement relating to the securities offered therein, and the offering of such securities at that time shall be deemed to be the initial bona fide offering thereof.
II-4
Table of Contents
SIGNATURES
Pursuant to the requirements of the Securities Act of 1933, as amended, the Registrant has duly caused this Registration Statement on Form S-1 to be signed on its behalf by the undersigned, thereunto duly authorized, in the City of Boston, the Commonwealth of Massachusetts, on the 16th day of September, 2011.
| MASCOMA CORPORATION | ||
| By: |
/s/ William J. Brady | |
| William J. Brady | ||
| President, Chief Executive Officer and Director | ||
II-5
Table of Contents
POWER OF ATTORNEY
Each person whose individual signature appears below hereby authorizes and appoints William J. Brady and David A. Arkowitz, and each of them, with full power of substitution and resubstitution and full power to act without the other, as his or her true and lawful attorney in fact and agent to act in his or her name, place and stead and to execute in the name and on behalf of each person, individually and in each capacity stated below, and to file any and all amendments to this Registration Statement, including any and all post effective amendments and amendments thereto, and any registration statement relating to the same offering as this Registration Statement that is to be effective upon filing pursuant to Rule 462(b) under the Securities Act of 1933, as amended, and to file the same, with all exhibits thereto, and other documents in connection therewith, with the Securities and Exchange Commission, granting unto said attorneys in fact and agents, and each of them, full power and authority to do and perform each and every act and thing, ratifying and confirming all that said attorneys in fact and agents or any of them or their or his substitute or substitutes may lawfully do or cause to be done by virtue thereof.
Pursuant to the requirements of the Securities Act of 1933, as amended, this Registration Statement has been signed by the following persons in the capacities indicated below on the 16th day of September, 2011.
| Signature |
Title | |
| /s/ William J. Brady William J. Brady |
President, Chief Executive Officer and Director (Principal Executive Officer) | |
| /s/ David A. Arkowitz David A. Arkowitz |
Chief Financial Officer, Treasurer and Secretary (Principal Financial Officer and Principal Accounting Officer) | |
| /s/ Bruce a. Jamerson Bruce A. Jamerson |
Chairman of the Board of Directors | |
| /s/ Lee R. Lynd Lee R. Lynd |
Chief Science Officer and Director | |
| /s/ James V. Matheson James V. Matheson |
Director | |
| /s/ Hemant Taneja Hemant Taneja |
Director | |
| /s/ Jeremy N. Kendall Jeremy N. Kendall |
Director | |
| /s/ David L. Whikehart David L. Whikehart |
Director | |
II-6
Table of Contents
EXHIBIT INDEX
| Exhibit |
Description | |
| 1.1* | Form of Underwriting Agreement. | |
| 2.1* | Share Purchase Agreement by and among the Registrant, Mascoma Canada Inc., SunOpta Inc. and the other parties thereto, dated as of August 31, 2010. | |
| 2.2* | Agreement and Plan of Merger among the Registrant, Mascoma Sub I, Inc. and Celsys Biofuels, Inc., dated October 26, 2007. | |
| 3.1* | Eighth Amended and Restated Certificate of Incorporation of the Registrant, as currently in effect. | |
| 3.2* | Certificate of Amendment to Eighth Amended and Restated Certificate of Incorporation of the Registrant, as currently in effect. | |
| 3.3* | Form of Amended and Restated Certificate of Incorporation of the Registrant, to be in effect upon completion of the offering. | |
| 3.4* | Amended and Restated By-laws of the Registrant, as currently in effect. | |
| 3.5* | Form of Amended and Restated By-laws of the Registrant, to be in effect upon completion of the offering. | |
| 4.1* | Form of Registrant’s Specimen Common Stock Certificate. | |
| 4.2* | Third Amended and Restated Registration Rights Agreement by and among the parties listed therein and the Registrant, dated as of August 31, 2010. | |
| 4.3* | Amendment No. 1 to the Third Amended and Restated Registration Rights Agreement by and among the parties listed therein and the Registrant, dated as of January 7, 2011. | |
| 4.4* | Amendment No. 2 to the Third Amended and Restated Registration Rights Agreement by and among the parties listed therein and the Registrant, dated as of June 1, 2011. | |
| 4.5* | Warrant to purchase shares of Series A-1 preferred stock dated October 6, 2006 issued by the Registrant to Pinnacle Ventures II Equity Holdings, L.L.C. | |
| 4.6* | Warrant to purchase shares of Series B preferred stock issued by the Registrant to Pinnacle Ventures II Equity Holdings, L.L.C. dated February 5, 2008. | |
| 4.7* | Warrant to purchase shares of Series C preferred stock issued by the Registrant to Pinnacle Ventures II Equity Holdings, L.L.C. dated February 5, 2008. | |
| 4.8* | Warrant to purchase shares of Series C preferred stock issued by the Registrant to Pinnacle Ventures II Equity Holdings, L.L.C. dated December 30, 2008. | |
| 4.9* | Amended and Restated Warrant to purchase shares of Series C preferred stock issued by the Registrant to Pinnacle Ventures II Equity Holdings, L.L.C. dated July 1, 2009. | |
| 4.10* | Form of Warrant to purchase shares of Series D preferred stock issued by the Registrant in connection with its acquisition of SunOpta BioProcess Inc. | |
| 4.11* | Warrant to purchase shares of Common Stock dated August 31, 2010 issued by the Registrant in connection with its acquisition of SunOpta BioProcess Inc. | |
| 4.12* | Warrant to purchase shares of Series D preferred stock dated January 7, 2011 issued by the Registrant to Diamond Alternative Energy, LLC. | |
| 4.13* | Form of Warrant to purchase shares of Common Stock issued by the Registrant to each of Pinnacle Ventures II Equity Holdings, L.L.C. and Pinnacle Ventures III Equity Holdings, L.L.C. | |
| 5.1* | Opinion of Goodwin Procter LLP. | |
| 10.1* | Grant Agreement between the Michigan Strategic Fund and the Registrant, dated December 2, 2008. | |
II-7
Table of Contents
| Exhibit |
Description | |
| 10.2* | Grant Amendment One between the Michigan Strategic Fund and the Registrant, dated March 13, 2009. | |
| 10.3* | Cooperative Agreement between the U.S. Department of Energy and the Registrant (No. DE-FC36-08GO18103), dated September 30, 2008. | |
| 10.4* | Amendment to the Cooperative Agreement between the U.S. Department of Energy and the Registrant (No. DE-FC36-08GO18103), dated March 24, 2009. | |
| 10.5* | Biorefining Commercialization and Market Development Program Grant Agreement between the Province of Alberta and the Registrant, dated March 19, 2010. | |
| 10.6* | Research Subcontract (BESC) between the Registrant and Dartmouth College dated July 11, 2008. | |
| 10.7* | Subcontract Modification to the Research Subcontract (BESC) between the Registrant and Dartmouth College, dated December 12, 2010. | |
| 10.8* | Sponsored Research Agreement between the Registrant and Dartmouth College, dated April 1, 2006. | |
| 10.9* | License Agreement between the Registrant and Dartmouth College, dated July 10, 2006. | |
| 10.10* | Collaboration Agreement between Frontier Renewable Resources, LLC, J.M. Longyear Company and the Registrant, dated December 15, 2008. | |
| 10.11* | Limited Liability Company Operating Agreement between Frontier Renewable Resources, LLC, J.M. Longyear Company and the Registrant, dated December 15, 2008. | |
| 10.12* | Amendment to the Limited Liability Company Operating Agreement of Frontier Renewable Resources, LLC, dated June 24, 2010. | |
| 10.13* | Limited Liability Company Agreement of Frontier Kinross, LLC. | |
| 10.14* | Mutual Termination Agreement among Marathon Petroleum Company LP (f/k/a Marathon Petroleum Company LLC), MPC Investment LLC and the Registrant, dated July 28, 2011. | |
| 10.15*+ | The Registrant’s 2006 Stock Incentive Plan. | |
| 10.16*+ | Amendment No. 1 to the Registrant’s 2006 Stock Incentive Plan. | |
| 10.17*+ | Amendment No. 2 to the Registrant’s 2006 Stock Incentive Plan. | |
| 10.18*+ | Form of Stock Option Agreement under the Registrant’s 2006 Stock Incentive Plan. | |
| 10.19*+ | The Registrant’s 2011 Stock Option and Incentive Plan and form of agreements thereunder. | |
| 10.20*+ | Offer Letter dated December 23, 2009 between the Registrant and William J. Brady. | |
| 10.21*+ | Offer Letter dated September 9, 2009 between the Registrant and Keith Pattison. | |
| 10.22*+ | Offer Letter dated August 15, 2007 between the Registrant and Alan Belcher. | |
| 10.23*+ | Amendment to the Offer Letter between the Registrant and Alan Belcher, dated April 7, 2009. | |
| 10.24*+ | Employment Agreement between the Mascoma Canada and Murray J. Burke, dated August 30, 2010. | |
| 10.25*+ | Offer Letter dated August 9, 2010 between the Registrant and Arthur McEvily. | |
| 10.26*+ | Offer Letter dated May 3, 2011 between the Registrant and David Arkowitz. | |
| 10.27*+ | Offer Letter dated May 1, 2007 between the Registrant and James H. Flatt. | |
| 10.28*+ | Form of Indemnification Agreement. | |
| 10.29*+ | Lee R. Lynd Consulting Agreement, dated March 10, 2006. | |
| 10.30* | Charles E. Wyman Consulting Agreement, dated March 10, 2006. | |
| 10.31* | Amendment to the Charles E. Wyman Consulting Agreement, dated April 1, 2009. | |
II-8
Table of Contents
| Exhibit |
Description | |
| 10.32*+ | Transition and Special Consulting Agreement between the Registrant and Bruce A. Jamerson, dated August 17, 2009. | |
| 10.33* | Subordinated Convertible Note Purchase Agreement among the Registrant and the purchasers identified therein, dated April 7, 2010. | |
| 10.34* | Amendment No. 1 to the Subordinated Convertible Note Purchase Agreement, dated June 1, 2010. | |
| 10.35* | Subordinated Convertible Note and Warrant Purchase Agreement among the Registrant and the purchasers identified therein, dated August 5, 2011. | |
| 10.36* | Amendment No. 1 to the Subordinated Convertible Note and Warrant Purchase Agreement, dated September 1, 2011. | |
| 10.37* | Loan and Security Agreement among the Registrant, Pinnacle Ventures, L.L.C. and the other investors identified therein, dated October 6, 2006. | |
| 10.38* | Warrant Purchase Agreement between the Registrant and Pinnacle Ventures II Equity Holdings, L.L.C., dated October 6, 2006. | |
| 10.39* | Loan and Security Agreement among the Registrant, Pinnacle Ventures, L.L.C. and the other investors identified therein, dated February 5, 2008. | |
| 10.40* | Warrant Purchase Agreement between the Registrant and Pinnacle Ventures II Equity Holdings, L.L.C., dated February 5, 2008. | |
| 10.41* | Amendment No. 1 to the Loan and Security Agreement among the Registrant, Pinnacle Ventures, L.L.C. and other investors identified therein, dated December 30, 2008. | |
| 10.42* | Amended and Restated Warrant Purchase Agreement between the Registrant and Pinnacle Ventures II Equity Holdings, L.L.C., dated July 1, 2009. | |
| 10.43* | Amended and Restated Loan and Security Agreement among the Registrant, Pinnacle Ventures, L.L.C. and the other investors identified therein, dated June 1, 2011. | |
| 10.44* | Warrant Purchase Agreement between the Registrant and Pinnacle Ventures II Equity Holdings, L.L.C., dated June 1, 2011. | |
| 10.45* | Warrant Purchase Agreement between the Registrant and Pinnacle Ventures III Equity Holdings, L.L.C., dated June 1, 2011. | |
| 21.1* | List of Subsidiaries of the Registrant. | |
| 23.1 | Consent of Deloitte & Touche LLP, Independent Registered Public Accounting Firm. | |
| 23.2 | Consent of Deloitte & Touche LLP, Independent Auditors. | |
| 23.3* | Consent of Goodwin Procter LLP (included in Exhibit 5.1). | |
| 24.1 | Power of Attorney (included on signature page). | |
| * | To be filed by amendment. |
| + | This is a management contract or a compensatory plan. |
II-9