Attached files
| file | filename |
|---|---|
| 8-K - PLUG POWER INC | esplugpower8k.htm |
| EX-99 - PLUG POWER INC | exhibit99-2.htm |
NASDAQ: PLUG
September 2011
The content of this presentation is PLUG POWER INC. PROPRIETARY AND CONFIDENTIAL. No part of this publication may be reproduced, stored in a retrieval
system, or transmitted in any form or by any means - electronic, mechanical, photocopying, recording or otherwise - without the permission of Plug Power Inc.
Copyright 2011 by Plug Power Inc.

Plug Power Inc. Safe Harbor Statement
This communication contains forward-looking statements within the meaning of the Private Securities Litigation
Reform Act of 1995, including but not limited to expectations regarding revenues and product orders and shipments
for 2011. These statements are based on current expectations that are subject to certain assumptions, risks and
uncertainties, any of which are difficult to predict, are beyond our control and that may cause our actual results to
differ materially from the expectations in our forward-looking statements including, but not limited to: the risk that we
continue to incur losses and might never achieve or maintain profitability, the risk that the additional capital we
expect we will need to raise to fund our operations beyond the first quarter of 2012 may not be available; our lack of
extensive experience in manufacturing and marketing products may impact our ability to manufacture and market
products on a profitable and large-scale commercial basis; the risk that unit orders will not ship, be installed and/or
converted to revenue, in whole or in part; the risk that pending orders may not convert to purchase orders, in whole
or in part; the risk that our continued failure to comply with NASDAQ’s listing standards may severely limit our ability
to raise additional capital; the cost and timing of developing, marketing and selling our products and our ability to
raise the necessary capital to fund such costs; the ability to achieve the forecasted gross margin on the sale of our
products; the actual net cash used for operating expenses may exceed the projected net cash for operating
expenses; the cost and availability of fuel and fueling infrastructures for our products; market acceptance of our
GenDrive systems; our ability to establish and maintain relationships with third parties with respect to product
development, manufacturing, distribution and servicing and the supply of key product components; the cost and
availability of components and parts for our products; our ability to develop commercially viable products; our ability
to reduce product and manufacturing costs; our ability to successfully expand our product lines; our ability to
improve system reliability for our GenDrive systems; competitive factors, such as price competition and competition
from other traditional and alternative energy companies; our ability to protect our intellectual property; the cost of
complying with current and future federal, state and international governmental regulations; and other risks and
uncertainties discussed under "Item IA-Risk Factors" in our annual report on Form 10-K for the fiscal year ended
December 31, 2010, filed with the Securities and Exchange Commission ("SEC") on March 31, 2011, and the
reports we file from time to time with the SEC. Plug Power does not intend to, and undertakes no duty to update
any forward-looking statements as a result of new information or future events.
2
Executive Summary
Plug Power is the marketshare leader in
alternative energy solutions for the Material
Handling market
First mover advantage - 85% market share
for fuel cell powered lift trucks
Proven value proposition with compelling
financial return
Customers include leading Fortune 500
Revenue guidance growth of 80-100% for
both 2011 and 2012
3
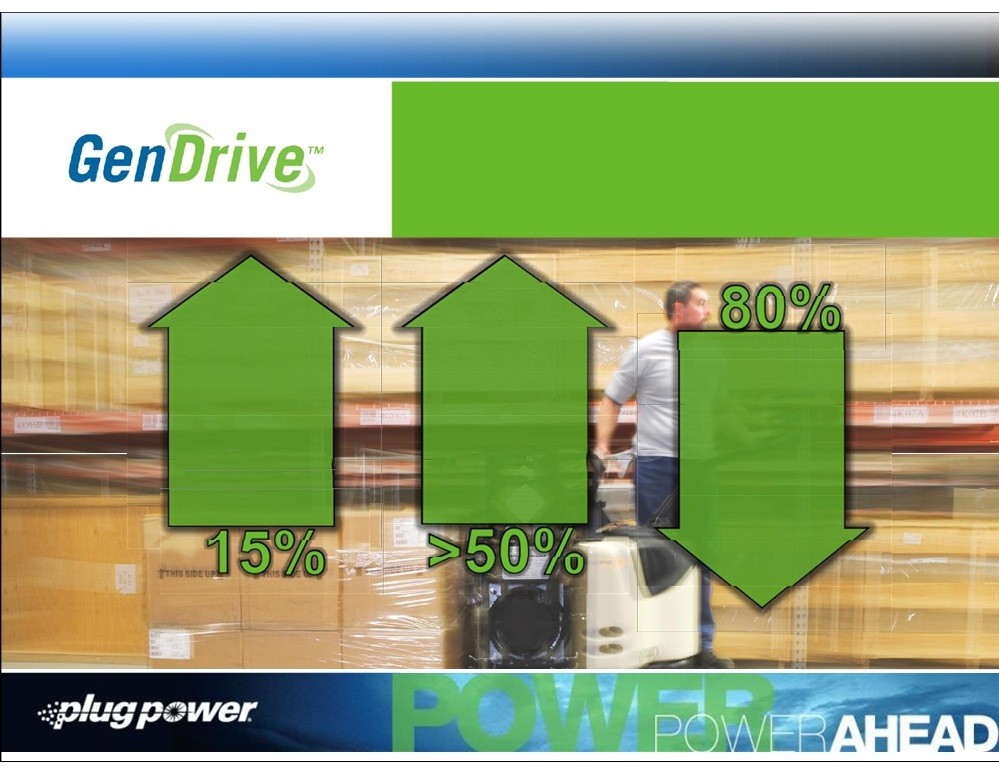
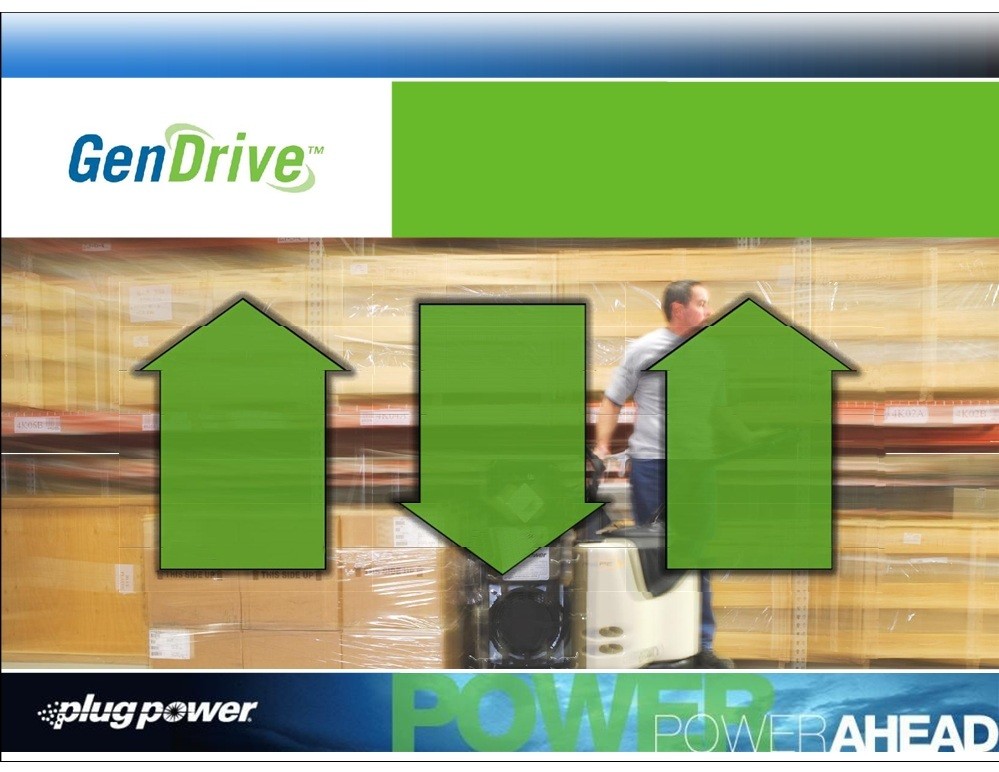
GenDrive
®
Value
Proposition
More Power.
More Productivity.
More of the Time.
Greenfield
IRR Payback
Reduce
Increase
< 1 yr
carbon
productivity
~$3M in
footprint up
up to 15%
savings*
to 80%
*Brownfield IRR >15% with payback <2 years; >$1M in savings typically
4

Global TAM for Class 1 – 5 Fuel Cell Powered Forklift Trucks
$19.9 Billion Market
Class 1
Class 2
Class 3
Sit-down Lift Trucks
Stand-up Reach Trucks
Rider Pallet Trucks
5
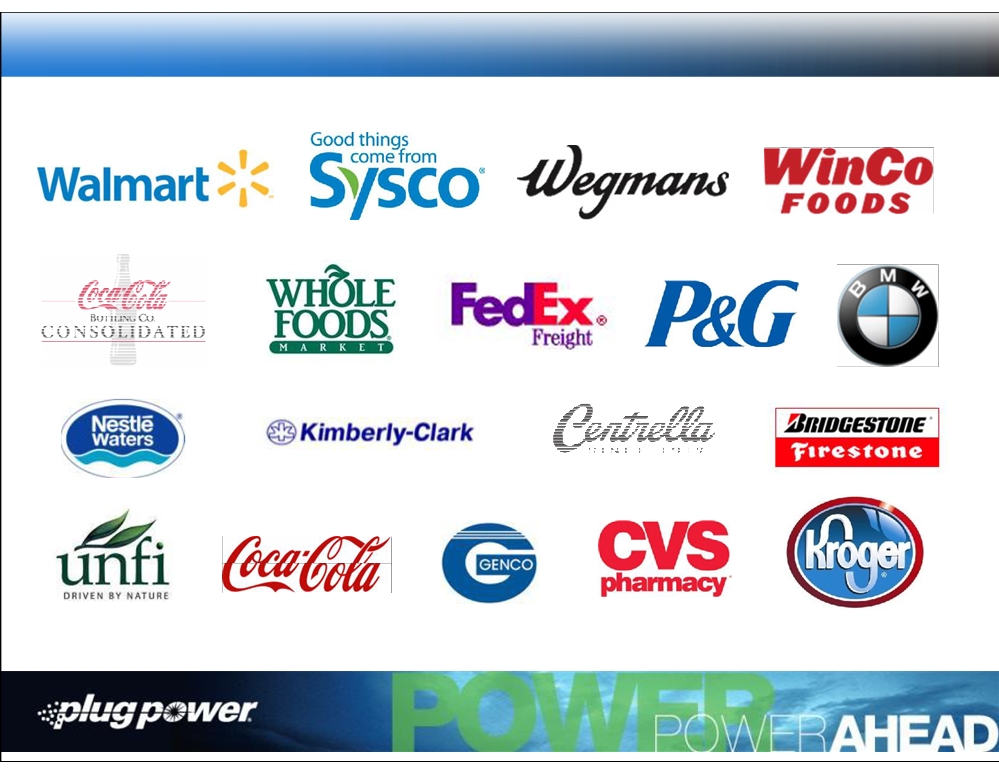
Customer Base is Building
6
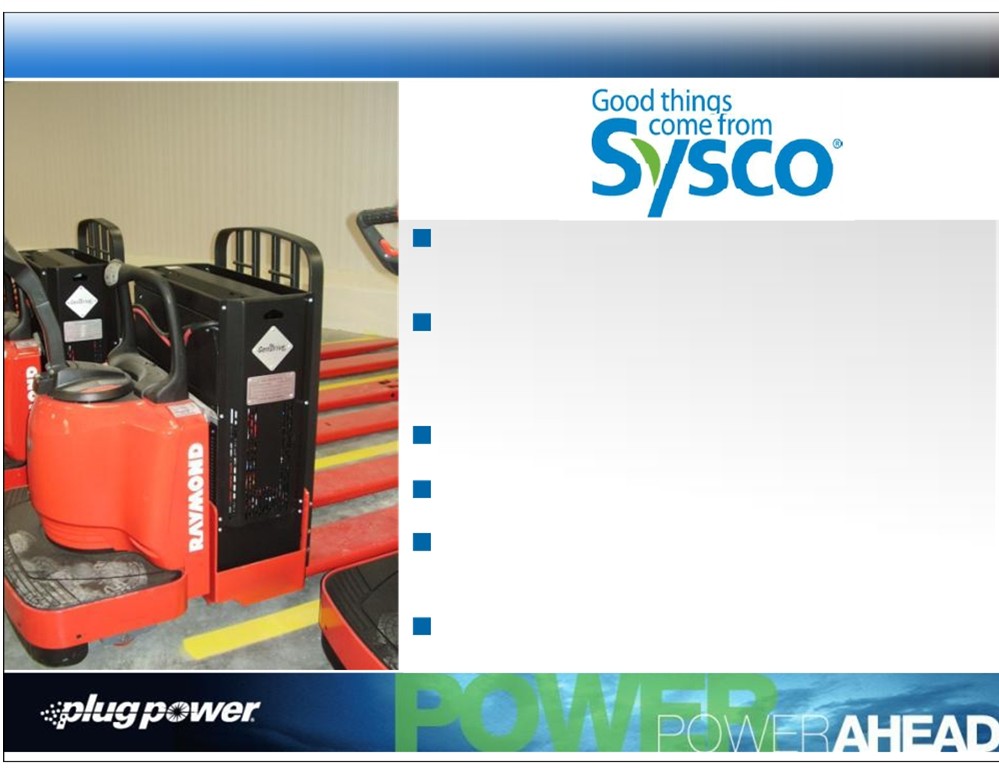
Customer Success
3 sites on 100% hydrogen by end of Q3 2011 -
Houston, Front Royal and Philadelphia
Commitment for 5 additional sites - Boston,
Long Island, San Antonio, Los Angeles, and
Riverside
No battery infrastructure
Multi-distribution center commitment
Investigating opportunities for using fuel cells
with refrigerated trucks
Operates 100+ DCs with over 11,000 forklift
trucks
7
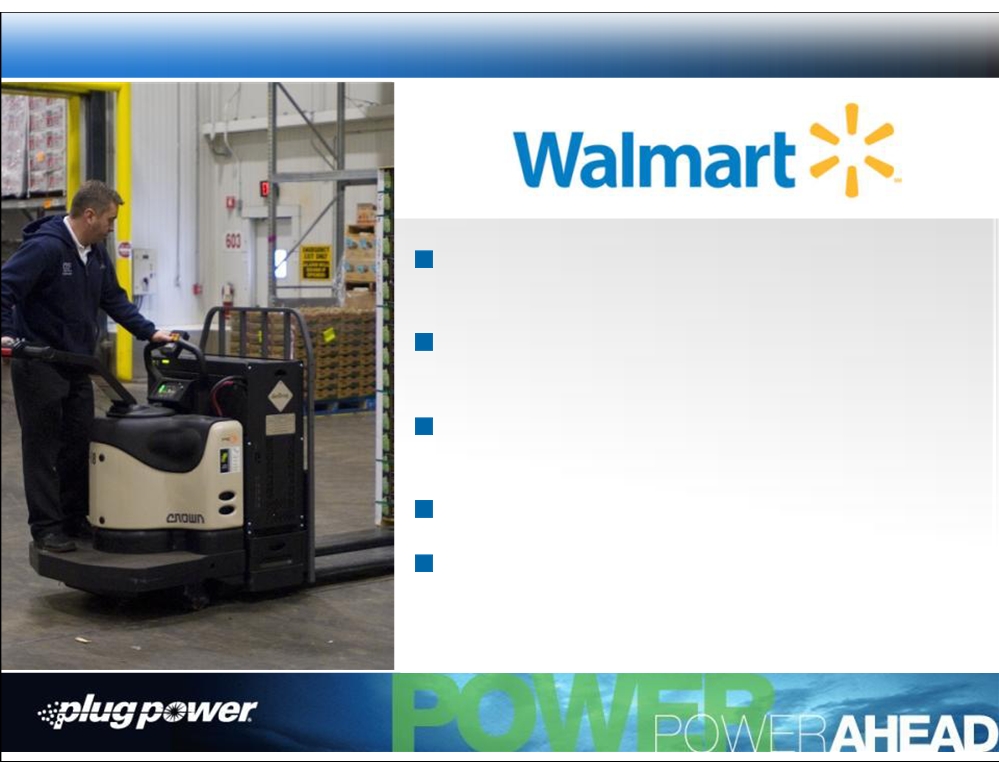
Customer Success
Three sites with over 300 forklift trucks powered
by Plug Power
Eliminated need to change out lead acid
batteries
Expected GHG reduction up to 72%, compared
to batteries charged from the grid
Negotiating future deals in North America
Operates 100+ DCs with close to 20,000 forklift
trucks; Future site expansion planned
8
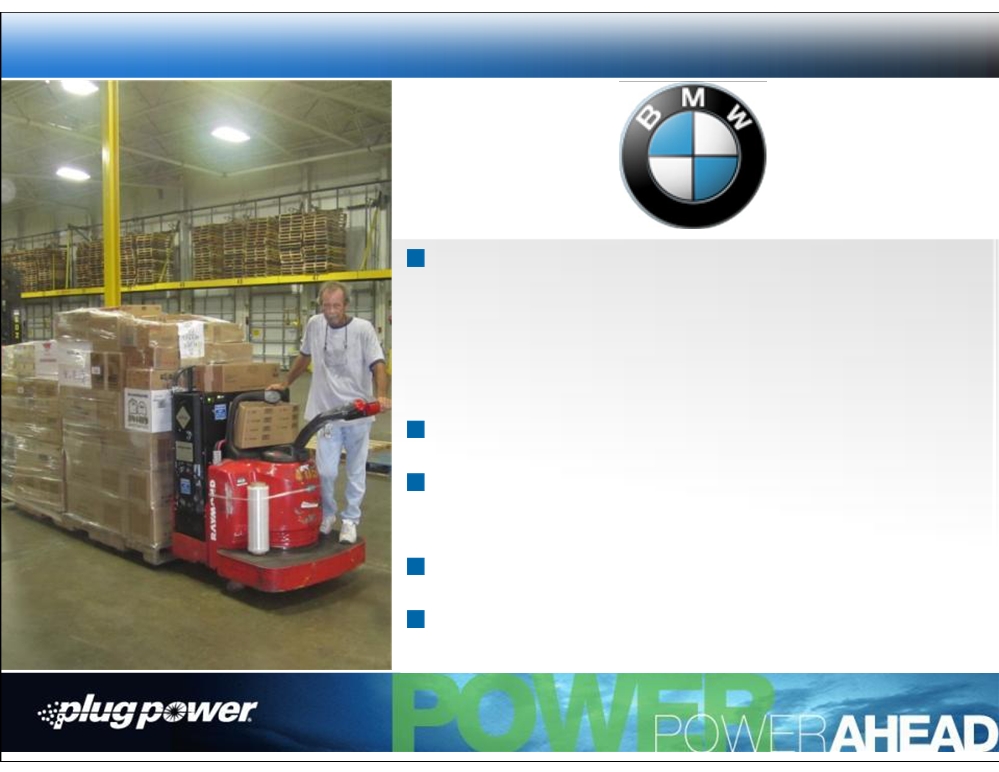
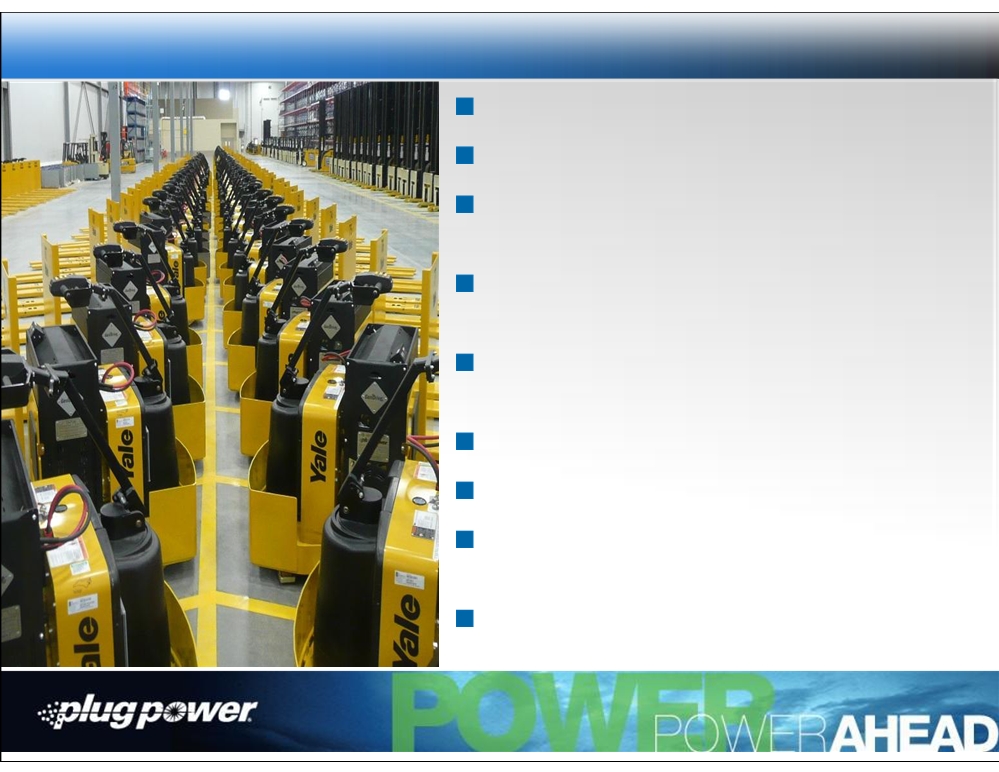
Customer Success
Site Success
•
Greer, South Carolina: 86 units
•
Mix of Class-1, -2 and -3
•
First BMW plant to use fuel cell-powered forklift
trucks
New facility built without battery infrastructure
Entire fleet deployed with GenDrive
®
fuel cell
power units
Affirming global commitment to sustainability
Adjacent 1.2M sq. ft. facility with 300+ trucks with
opportunity for conversion to fuel cells
9
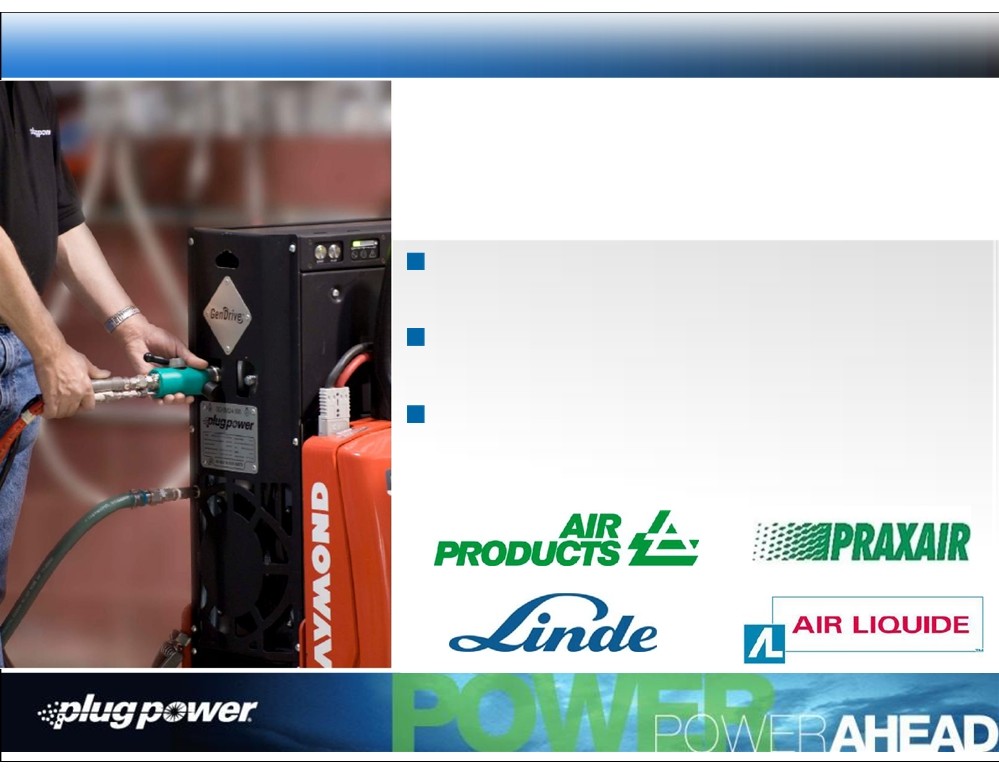
Commercial Progress: Hydrogen Refueling and GenDrive
By End of 2011 (Projected):
~3,000 GenDrive units deployed
20,000-30,000 kg of Hydrogen dispensed weekly
1,200 GenDrive products deployed
6,000-10,000 refuelings each week
Over 95% of all NA refuelings are being done with
Plug Power products
10
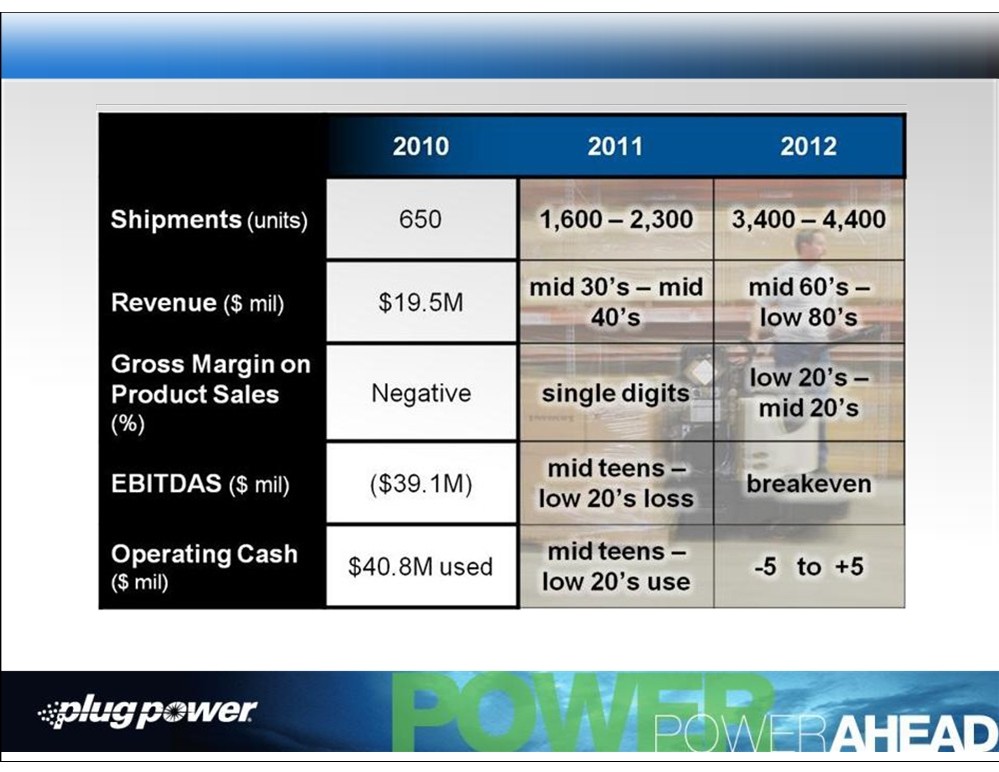
Financial Milestones
11
Gross Margin Improvement
2011 - Gross margin positive
2012 - Gross margin - 20% plus
Standardized
Improved
Reduction
componentry
leverage with
in materials
across
suppliers
product lines
12
Conclusion
First mover advantage - 85% marketshare
Global market of $19.9B
Revenue growth guidance 80-100% in 2011
and 2012
Tripled Product/Service revenue year over
year
Record 2010 and Q1 2011 orders with Q2
having largest backlog in company history
Expected profitability in 2012
30%+ gross margin potential
Significant decrease in operating expenses
from $58M to $16M
Compelling customer experience with
Fortune 500 client list
13