Attached files
| file | filename |
|---|---|
| 8-K - FORM 8-K - SmartStop Self Storage, Inc. | d231944d8k.htm |
 September 14,
2011 Hosted By
H. MICHAEL SCHWARTZ
Chairman and CEO
2011 Third Quarter Report
Exhibit 99.1
1 |
 Disclaimer
CAUTIONARY NOTE REGARDING FORWARD-LOOKING STATEMENTS
Certain statements contained in this material, other than historical facts, may be considered
forward-looking statements within the meaning of Section 27A of the Securities Act
of 1933, as amended (the “Securities Act”) and Section 21E of the Securities
Exchange Act of 1934, as amended (the “Exchange Act”). We intend for all such
forward looking statements to be covered by the applicable safe harbor provisions for
forward-looking statements contained in Section 27A of the Securities Act and
Section 21E of the Exchange Act, as applicable. Such statements include, in
particular, statements about our plans, strategies, and prospects and are subject to
certain risks and uncertainties, including known and unknown risks, which could cause actual
results to differ materially from those projected or anticipated. Therefore, such
statements are not intended to be a guarantee of our performance in future periods.
Such forward-looking statements can generally be identified by our use of
forward-looking
terminology
such
as
“may,”
“will,”
“expect,”
“intend,”
“anticipate,”
“estimate,”
“believe,”
“continue,”
or other similar words. Readers are cautioned not to place undue reliance on these
forward-looking statements,
which
speak
only
as
of
the
date
this
report
is
filed
with
the
Securities
and
Exchange
Commission.
We cannot guarantee the accuracy of any such forward looking statements contained in this
material, and we do not intend to publicly update or revise any forward-looking
statements, whether as a result of new information, future events, or otherwise.
Any such forward-looking statements are subject to risks, uncertainties, and other
factors and are based on a number of assumptions involving judgments with respect to,
among other things, future economic, competitive, and market conditions, all of which
are difficult or impossible to predict accurately. To the extent that our assumptions
differ from actual results, our ability to meet such forward-looking statements,
including our ability to generate positive cash flow from operations and provide
distributions to stockholders, and our ability to find suitable investment properties,
may be significantly hindered. All forward-looking statements should be read in
light of the risks identified in our prospectus and supplements. 2
|
 Agenda
Second Quarter Financials
and Economies of Scale
Portfolio Growth
Adding Value
Strategic Vision
3 |
 Quarterly
Financials Portfolio
Summary
(as
of
06/30/2011)
Total Properties: 72
Total Units: 47,040
Net Rentable Sq. Ft.: 5,893,200
States: 17 and 2 in Ontario, Canada
Total Assets: $423.3 Million
Leverage: 50.4%
Cash on Hand: $14.6 Million
4 |
 Same Store
Results Q2 (29 properties) 2011
2010
Increase
Revenue
$5,300,379
$5,224,428
1.4%
Operating Income
$3,078,815
$3,013,907
2.1%
Properties Owned at
72
34
112%
End of Q2
Economies of Scale
5
Bringing it to the Bottom Line |
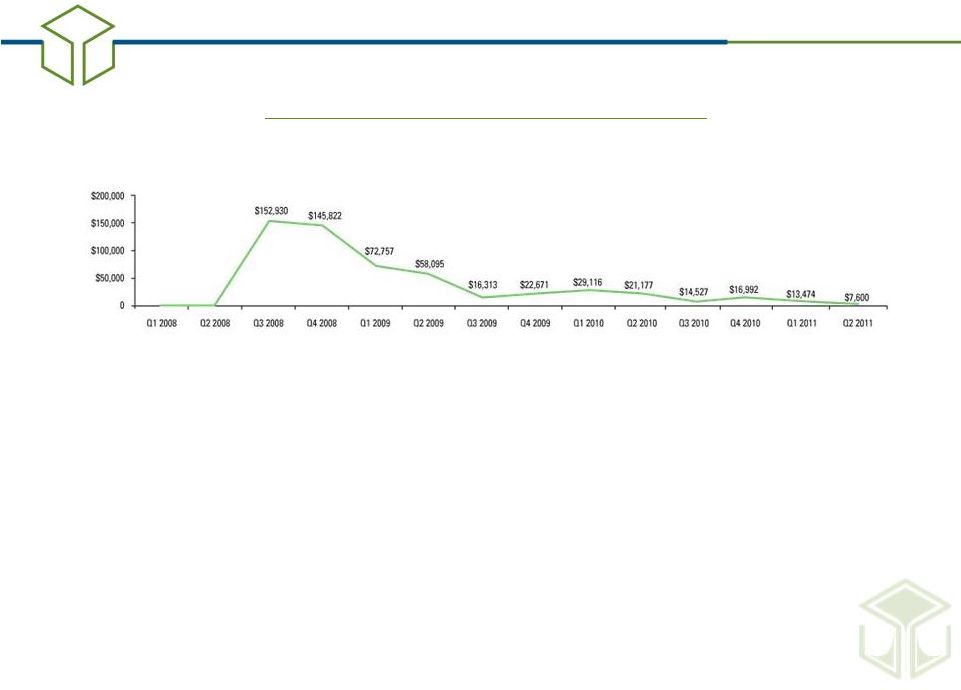 G&A Per
Property by Quarter Economies of Scale
G&A Per Property
Q2
2009
$58,095
Q2
2010
$21,177
(63.5% decrease)
Q2
2011
$7,600
(64.1% decrease)
Total G&A
Q2
2010
$720,010
Q2
2011
$547,187
(1)
(24% decrease)
(1)
For the three months ended June 30, 2011, the Advisor permanently waived certain
reimbursable indirect costs. 6 |
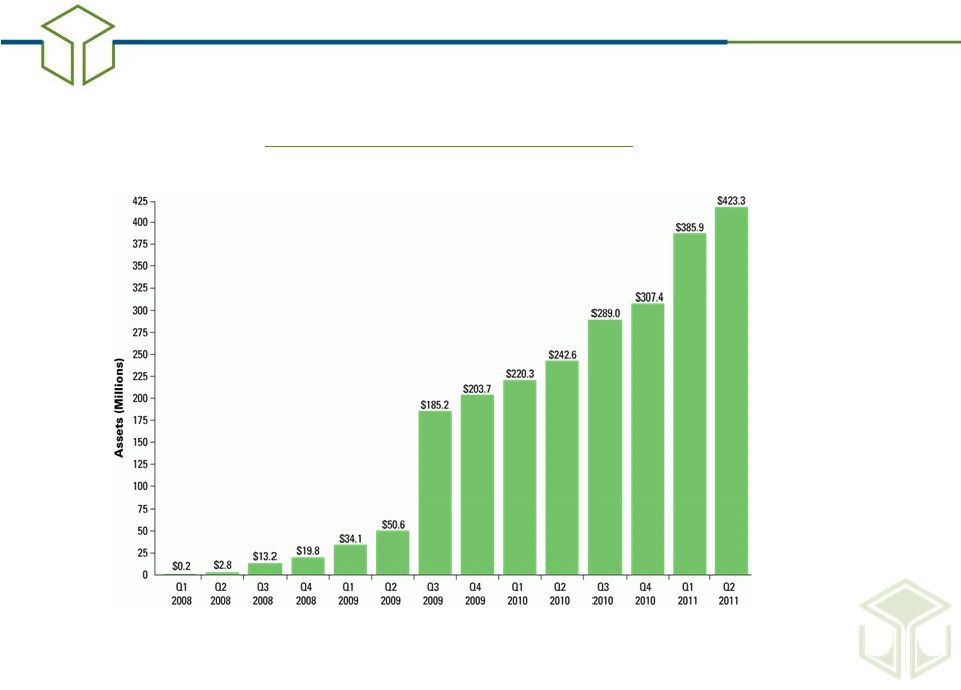 Total Assets
by Quarter Quarterly Financials
7 |
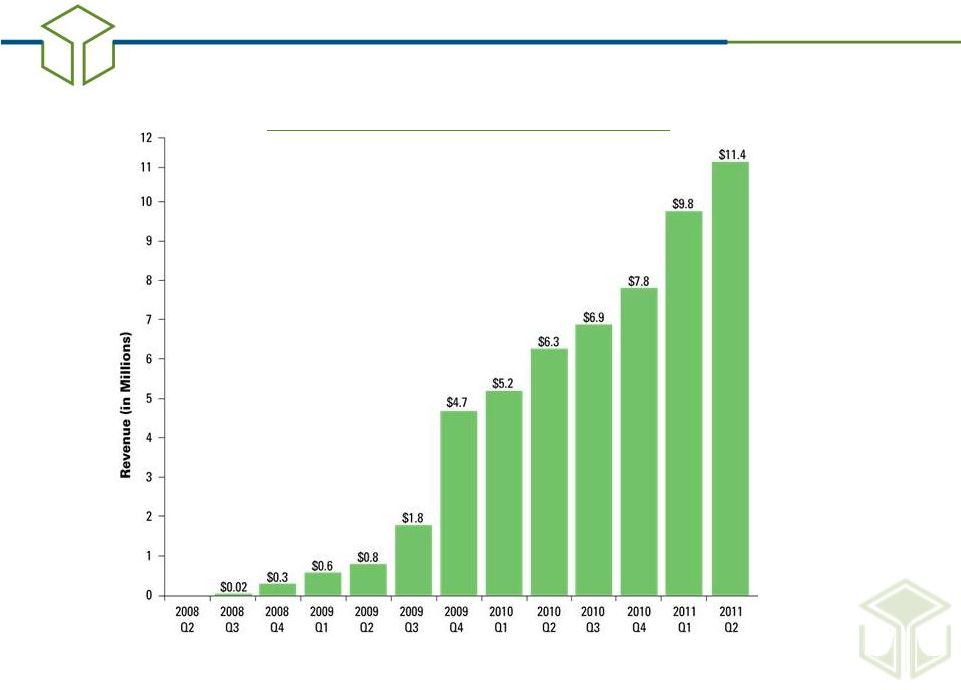 Total
Revenues by Quarter Quarterly Financials
8 |
 Understanding
MFFO Net Income
+
depreciation
+
amortization
Funds From Operations (FFO)
+
acquisition fees and expenses
+
impairments
+
marketable securities losses
+
hedging strategy losses
=
Modified FFO
Not all MFFO is created equal
{
non cash
items
9 |
 Modified Funds
From Operations and The Real Story Relative Risk
Smoothing of Results
Mezzanine Loans
Sponsor Contribution
Deferred Fees
Point in Time vs. Trending
Cash Drag
Other Intangibles
10 |
 Increasing
MFFO Higher Cap Rates / Higher Risk
Mezzanine Loans / Higher Risk
Deferred Maintenance and Other Expenses
11 |
 Agenda
Second Quarter Financials
and Economies of Scale
Portfolio Growth
Adding Value
Strategic Vision
12 |
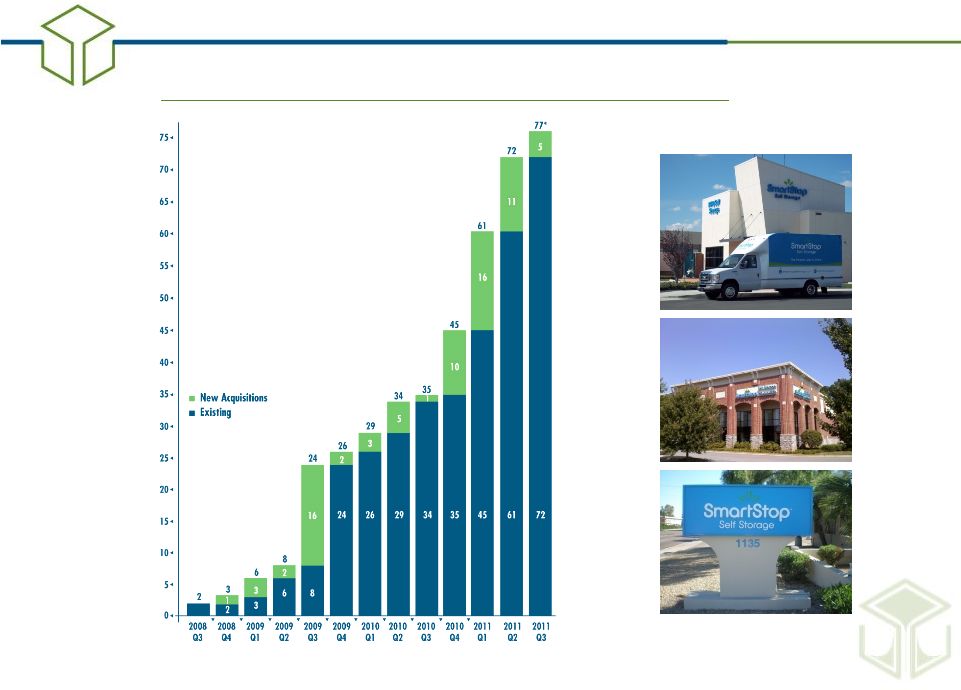 Wholly Owned
Properties by Quarter Portfolio Growth
* Through August 31, 2011
13 |
 Portfolio
Growth Square
Footage
by
State
(as
of
06/30/2011)
14 |
 2011 Second
Quarter Acquisitions Property
Approx. Units
Approx. Rentable Sq. Ft. (net)
1
Peachtree City -
GA
670
123,400
2
Buford -
GA
520
68,900
3
Jonesboro -
GA
730
106,400
4
Ellenwood -
GA
300
40,700
5
Marietta II -
GA
480
61,200
6
Collegeville -
PA
540
58,400
7
Skippack -
PA
390
56,300
8
Ballston Spa -
NY
690
82,800
9
Trenton -
NJ
660
85,100
10
Fredericksburg -
VA
630
59,600
11
Sandston -
VA
680
78,100
Total $44,030,000
6,290
820,900
Portfolio Growth
15 |
 Subsequent
Acquisitions Property
Approx. Units
Approx. Rentable Sq. Ft. (net)
1
Ladera Ranch -
CA
980
114,000
2
SF Bay Area –
San Lorenzo -
CA
640
62,000
3
Hampton -
VA
640
70,200
4
Las Vegas V -
NV
790
88,000
5
SF Bay Area –
Gilroy -
CA
610
94,000
Total $39,680,000
3,660
428,200
(1)
Includes an adjoining parcel of vacant land, which had an acquisition price of
approximately $3.9 million. Portfolio Growth
16 |
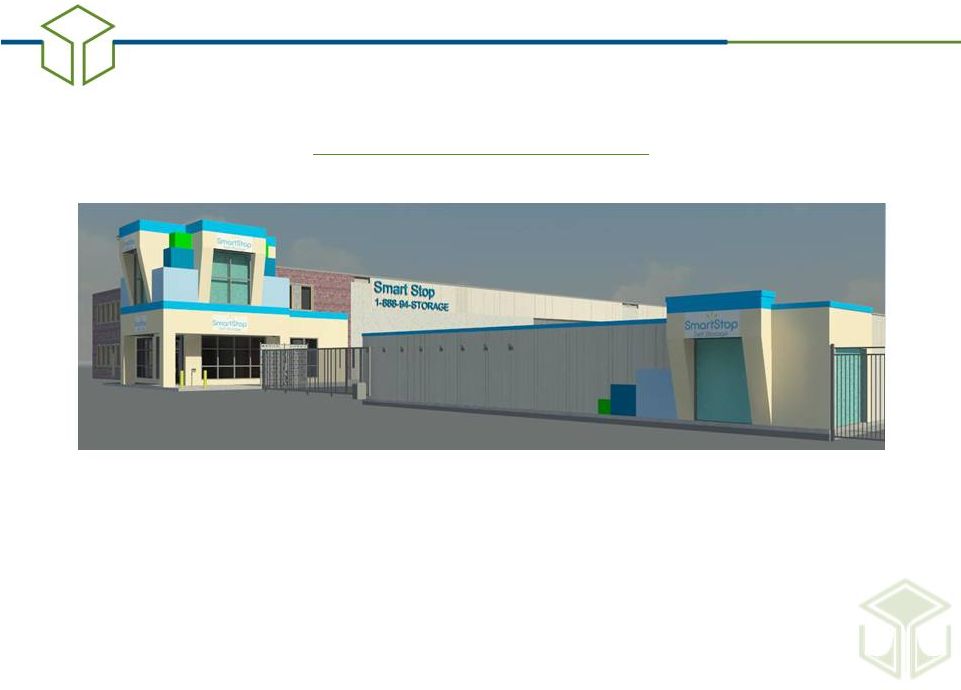 New Store
Opening SmartStop Mississauga, Ontario Canada
Portfolio Growth
17 |
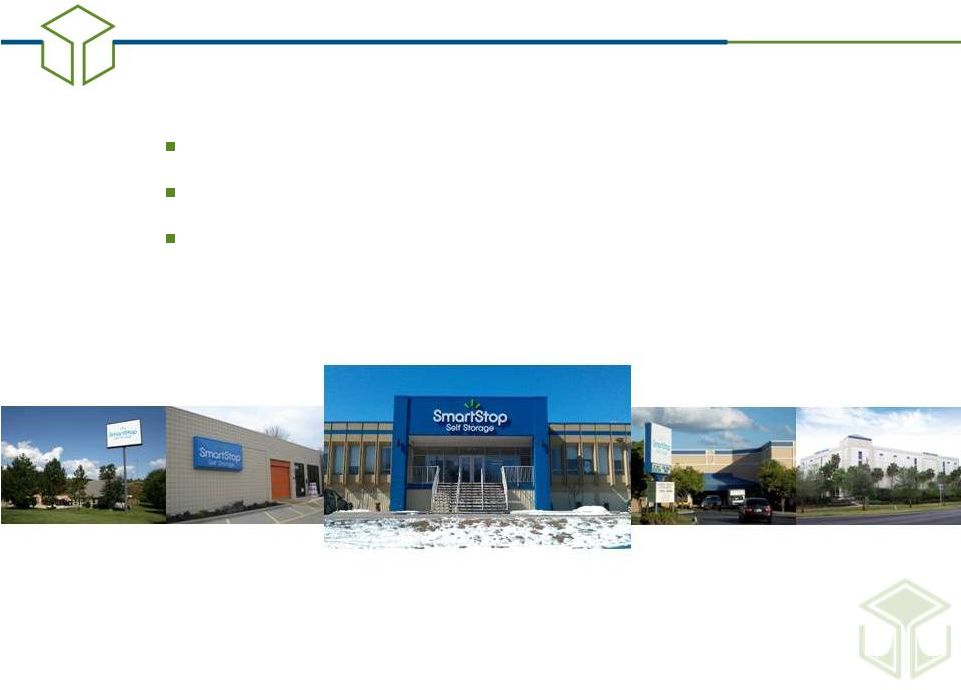
 Portfolio
Growth 18 |
 Potential
Acquisitions* Property
Approx. Units
Approx. Rentable Sq. Ft. (net)
1
Kennesaw -
GA
660
78,200
2
Sharpsburg -
GA
700
92,000
3
Duluth -
GA
640
81,600
4
Duluth II -
GA
700
83,300
5
Duluth III -
GA
630
82,600
6
Marietta III -
GA
640
73,400
7
Austell -
GA
590
77,700
8
Sandy Springs -
GA
890
93,800
9
Smyrna -
GA
530
65,700
10
Lawrenceville III -
GA
680
89,700
11
Jacksonville -
FL
690
82,800
12
Jacksonville II -
FL
530
71,400
Total $84,000,000
7,880
972,200
*There can be no assurance that we will complete the acquisition
of any of these properties. In some circumstances, if we fail to complete the
acquisitions, we may
forfeit
our
earnest
money.
Other
properties
may
be
identified
in
the
future
that
we
may
acquire
prior
to
or
instead
of
these
properties.
Due
to
the
considerable conditions to the consummation of these acquisitions, we cannot make
any assurances that the closings are probable. Portfolio Growth
19 |
 Agenda
Second Quarter Financials
and Economies of Scale
Portfolio Growth
Adding Value
Strategic Vision
20 |
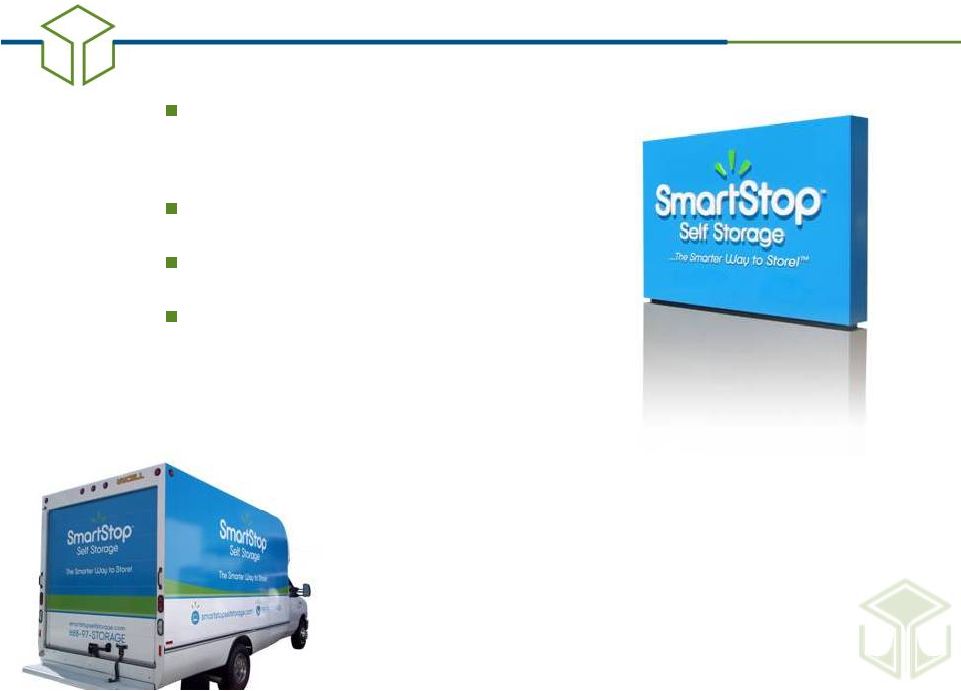
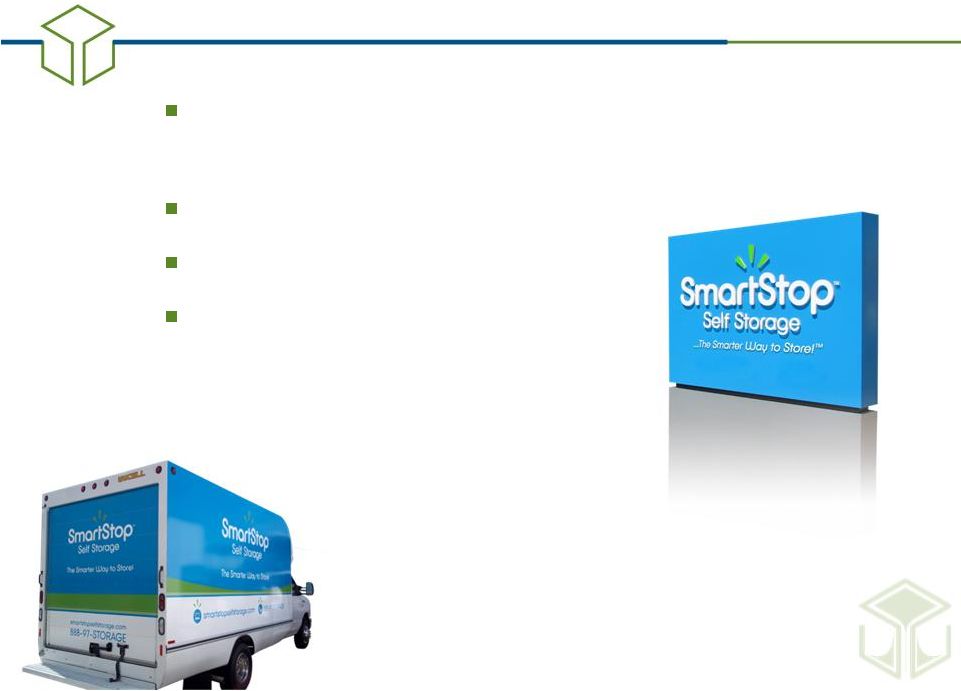
 Adding
Value Increasing Revenues
Tenant Insurance
Rental Increases
Truck Rentals
Ancillary Revenues
Web Based Sales
21 |
 Economies of
Scale Decreasing Expenses
Reaching Critical Mass
Property Insurance
Utility Management and Energy Conservation
Fixed vs. Variable Expenses
National Contracts
Property Management
22 |
 Leveraging
Technology 156 “print”
Yellow Page campaigns and migrating into
“internet”
Yellow Page campaigns
National call center for rentals with expanded hours and
high quality agents
Salesforce.com –
Lead generation dash board management
23 |
 Online
New website launched March 2011 improves customer service
Months 1-3 vs. 4-6
Visits Up +40%
Page Views +45%
Conversions +122%
First Time Visitors 61%
smartstopselfstorage.com
Leveraging Technology
24 |
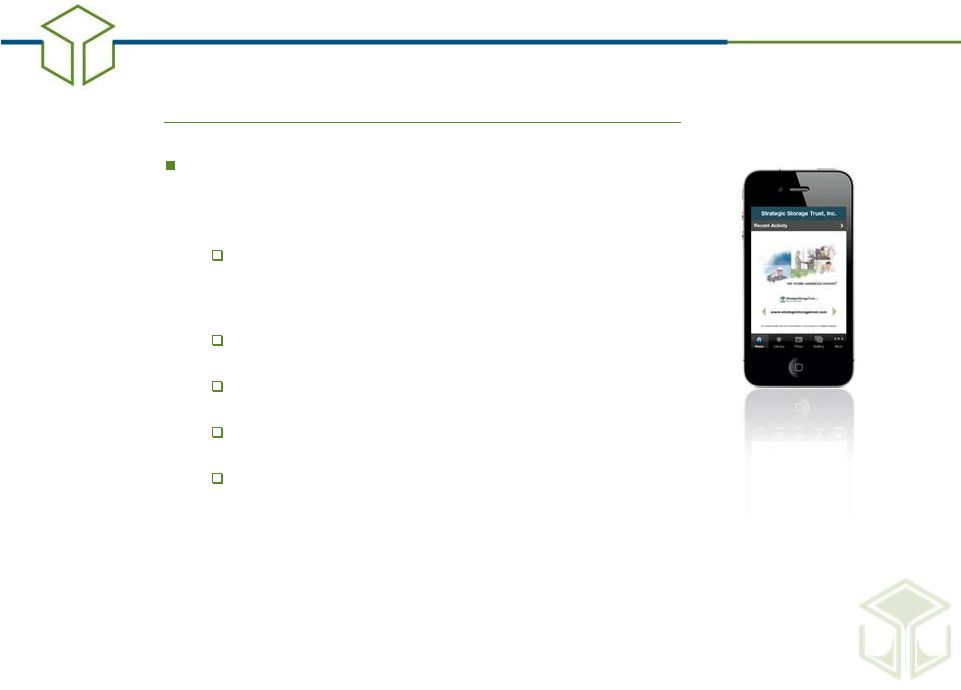 New
Technology to View Updates SSTI Mobile Friendly App For
Smartphones
Available on iPad, Android and
Blackberry
Free download (search “SSTI”)
User-friendly and content-rich
Receive the latest updates
1
st
non-traded
REIT
app
on
the
iPhone, Android and Blackberry
Leveraging Technology
25 |
 Strategic
Vision 26 |
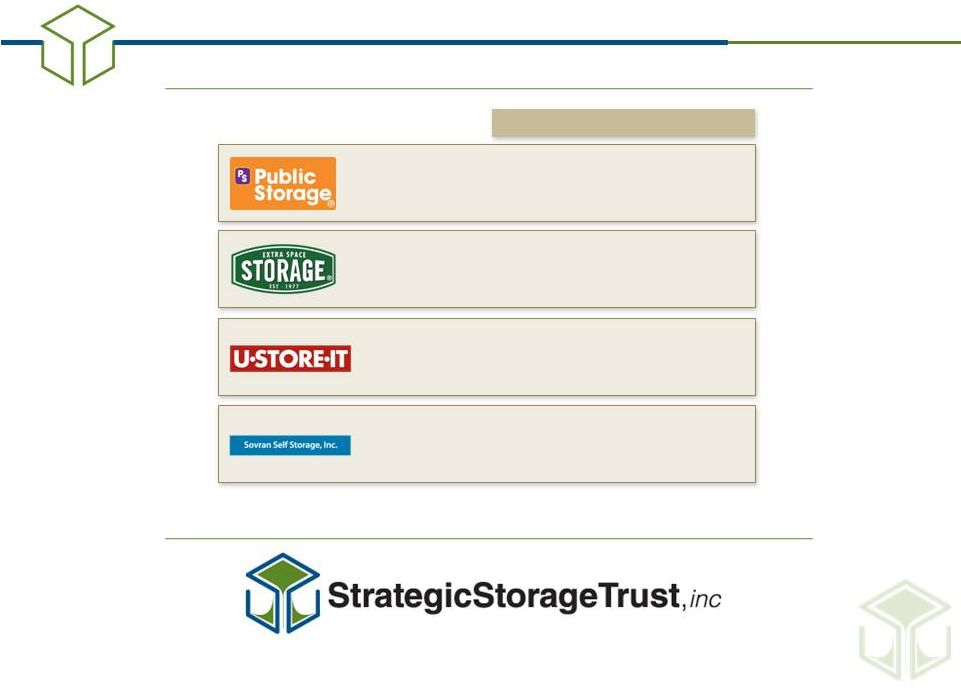 Strategic
Vision $1.12
(Billion)
$631.58
(Million)
$1.89
(Billion)
$881.40
(Million)
$1.06
(Billion)
$724.22
(Million)
$20.37
(Billion)
$5,280.57
(Million)
PUBLICLY TRADED SELF STORAGE REITS
PUBLIC NON-TRADED SELF STORAGE REIT
(1) Wall Street Journal 7/28/11
(2) Wall Street Journal 12/31/10
Market
Cap
(1)
Book
Value
(2)
27 |
 H. MICHAEL
SCHWARTZ Chairman and CEO
Strategic Storage Trust, Inc.
Questions and Answers
28 |
 September 14,
2011 Hosted By
H. MICHAEL SCHWARTZ
Chairman and CEO
2011 Third Quarter Report
29 |