Attached files
| file | filename |
|---|---|
| 8-K - AMERICAN PUBLIC EDUCATION, INC. 8-K - AMERICAN PUBLIC EDUCATION INC | a6860881.htm |
EXHIBIT 99.1
1September 2011, Russell 2000 Small Cap Strategies Conference When is a Fad a Trend? Growth Through Innovation
2 Statements made in this presentation regarding American Public Education, or its subsidiaries, that are not historical facts are forward-looking statements based on current expectations, assumptions, estimates and projections about American Public Education and the industry. These forward-looking statements are subject to risks and uncertainties that could cause actual future events or results to differ materially from such statements.
Forward-looking statements can be identified by words such as "anticipate", "believe", "could", "estimate", "expect“, "intend", "may", "should“, "will" and "would". These forward-looking statements include, without limitation, statements on the slides and statements regarding expected growth. Actual results could differ materially from those expressed or implied by these forward-looking statements as a result of various factors, including the various risks described in the "Risk Factors" section and elsewhere in the Company’s Annual Report on Form 10-K for the year ended December 31, 2010 and Form 10-Q for the quarter ended June 31, 2011 as filed with the SEC. The Company undertakes no obligation to update publicly any forward-looking statements for any reason, even if new information becomes available or other events occur in the
future. Safe Harbor Statement
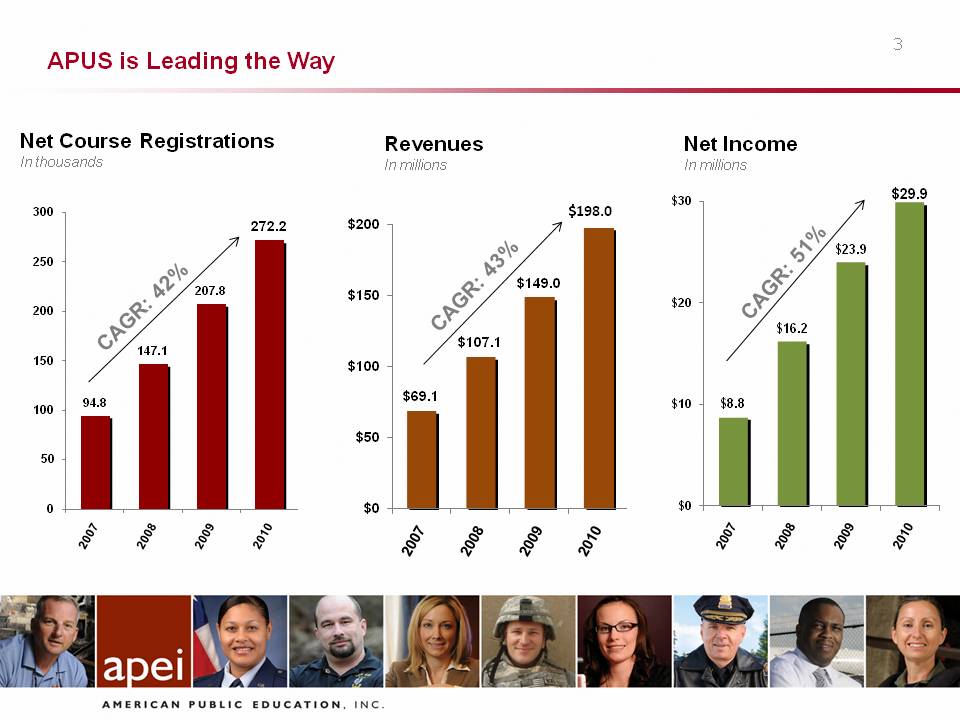
3 Revenues In millions Net Course Registrations In
thousands CAGR: 42% CAGR: 43% CAGR: 51% APUS is
Leading the Way Net IncomeIn millions $198.0
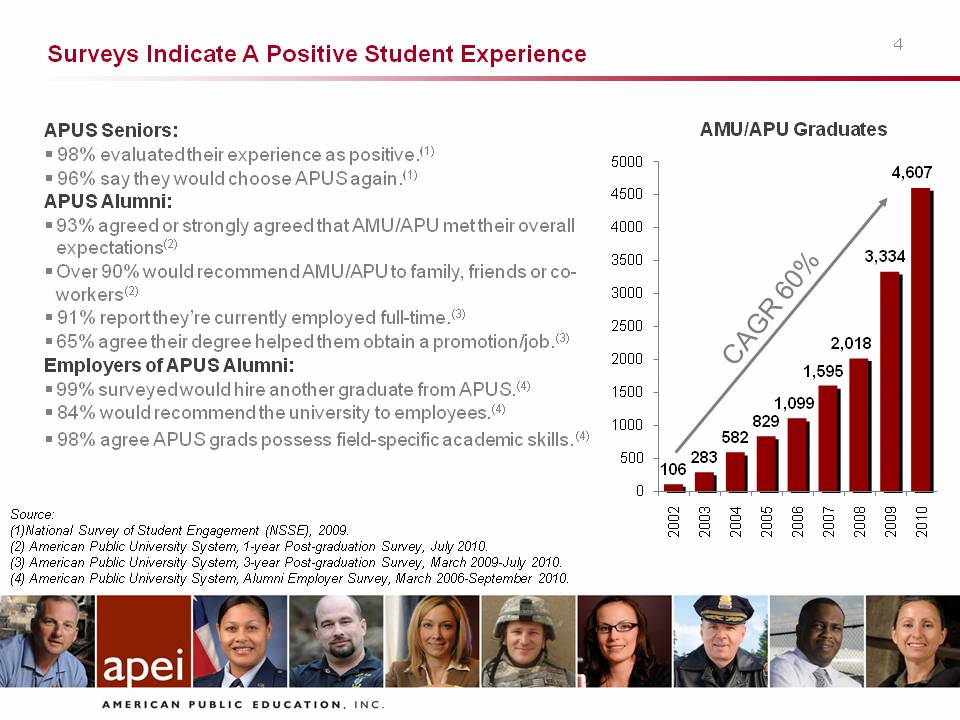
4 AMU/APU Graduates Source: (1)National Survey of Student Engagement (NSSE), 2009.(2) American Public University System, 1-year Post-graduation Survey, July 2010.(3) American Public University System, 3-year Post-graduation Survey, March 2009-July 2010.(4) American Public University System, Alumni Employer Survey, March 2006-September 2010. Surveys Indicate A Positive Student Experience APUS
Seniors: 98% evaluated their experience as positive.(1) 96% say they would choose APUS again.(1)APUS Alumni:93% agreed or strongly agreed that AMU/APU met their overall expectations(2)Over 90% would recommend AMU/APU to family, friends or co-workers(2) 91% report they’re currently employed full-time.(3)65% agree their degree helped them obtain a promotion/job.(3)Employers of APUS Alumni:99% surveyed would hire another graduate from APUS.(4) 84% would recommend the university to employees.(4) 98% agree APUS grads possess field-specific academic skills.(4) CAGR 60%

5Organic growth in students Other Placeholder:5Active Student CountsIn thousands
Slide: 6 Student growth in “old” degrees vs. “new” degrees
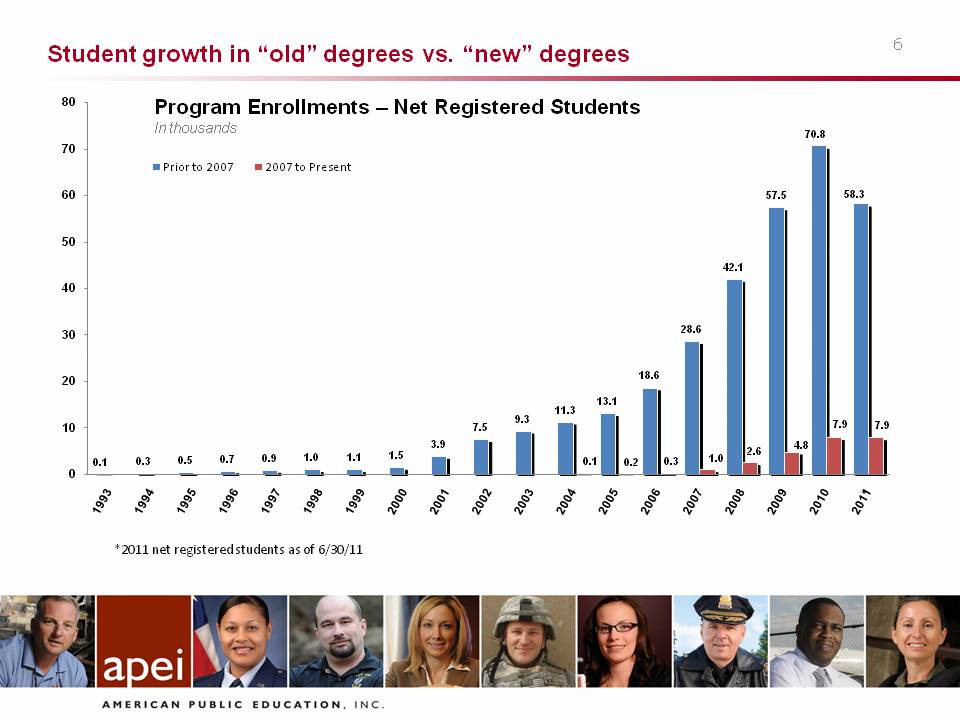
6 Program Enrollments – Net Registered StudentsIn thousands*2011 net registered students as of 6/30/11Registration growth – “old” vs. “new” degrees
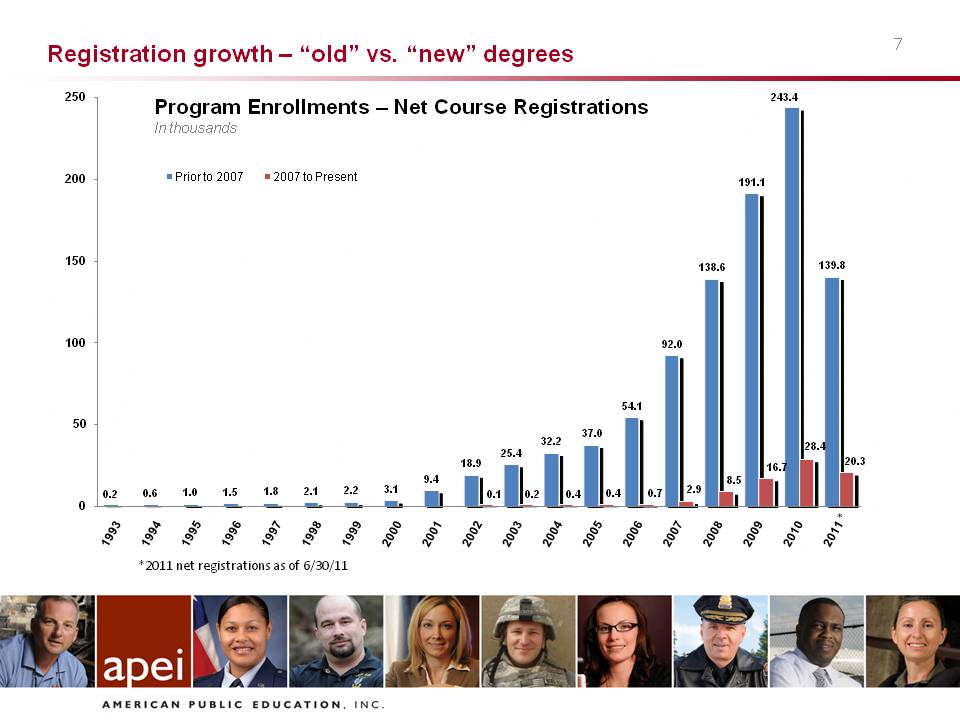
7 Program Enrollments – Net Course RegistrationsIn thousands*2011 net registrations as of 6/30/11 Registration growth - “old” vs.
“new” degrees
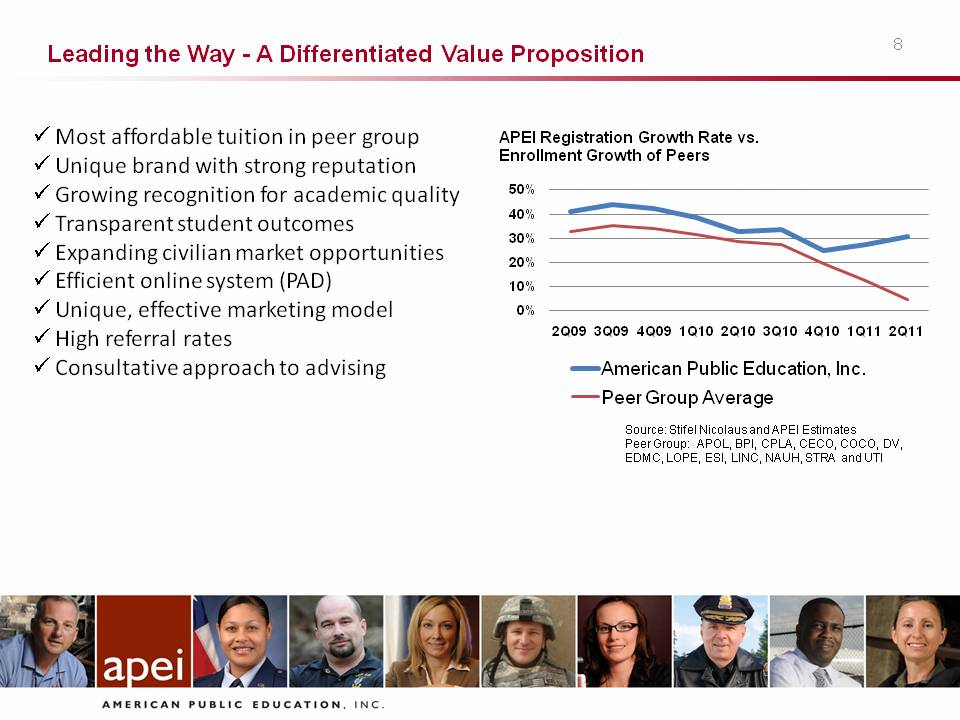
8 Leading the Way - A Differentiated Value Proposition Source: Stifel Nicolaus and APEI EstimatesPeer Group:APOL, BPI, CPLA, CECO, COCO, DV, EDMC, LOPE, ESI, LINC, NAUH, STRA and UTI Most affordable tuition in peer group Unique brand with strong reputation Growing recognition for academic quality Transparent student outcomes Expanding civilian market opportunities Efficient online system (PAD) Unique, effective marketing model High referral rates Consultative approach to advising