Attached files
| file | filename |
|---|---|
| 8-K - CURRENT REPORT ON FORM 8-K - WEB.COM GROUP, INC. | v234725_8k.htm |

Lender Overview Package September 2011
Safe Harbor Statement This presentation includes certain "forward-looking statements" including, without limitation, statements regarding Web.com’s expectations about its future financial to risks, uncertainties and other factors that could cause actual results or outcomes to differ materially from those contemplated by the forward-looking statements. These forward-looking statements include, but are not limited to, plans, objectives, expectations and intentions and other statements contained in this presentation that are not historical facts. These statements are sometimes identified by words such as “believe”, “growing”, “emerge” or words of similar meaning. These expectations, and there are a number of important factors that could cause the actual results or outcomes to differ materially from those indicated by these forward-looking statements, including, without limitation, our ability to integrate acquired businesses, our ability to maintain our sales efficiency, our ability to maintain our existing, and develop new, strategic relationships, the number of our net subscriber additions and our monthly customer turnover. These and other risk factors are set forth under the caption "Risk Factors" in Web.com’s Form -Q for the quarter ended June 30, 2011, as filed with the Securities and Exchange10 Commission, which is available on a website maintained by the Securities and Exchange Commission at www.sec.gov. Web.com expressly disclaims any obligation or undertaking to release publicly any updates or revisions to any forward-looking statements contained herein as a result of new information, future events or otherwise. Non-GAAP Measures Some of the measures in this presentation are non-GAAP financial measures within the meaning of the SEC Regulation G. Web.com believes presenting non-GAAP financial measures is useful to investors, because it describes the operating performance of the company, excluding some recurring charges that are included in the most directly comparable measures calculated and presented in accordance with GAAP. Company management uses these non-GAAP measures as important indicators of the Company's past performance and in planning and forecasting performance in future periods. The non-GAAP financial information Web.com presents may not be comparable to similarly-titled financial measures used by other companies, and investors should not consider non-GAAP financial measures in isolation from, or in substitution for, financial information presented in compliance with GAAP. You are encouraged to review the reconciliation of non-GAAP financial measures to GAAP financial measures included in Web.com’s Commission, which are available at www.sec.gov as well as in this presentation. 2
Notice to Recipients The information and documents following this Notice and Undertaking (such information and documents, the "Confidential Materials“ and this Notice, the “Notice and Undertaking”) from information supplied by or on behalf of Web.com Group, Inc. (the "Company"), and is being furnished by J.P. Morgan Securities LLC, Deutsche Bank Securities Inc., Goldman Sachs Lending Partners LLC and SunTrust Robinson Humphrey, Inc. (the "Lead Arrangers") to you as a potential lender ("Recipient") considering the proposed credit facilities described herein (the "Facilities"). By accepting the Confidential Materials for review, Recipient agrees to be bound by the terms of this notice and the undertakings set forth herein. If Recipient is unwilling to accept such undertakings, return the Confidential Materials to the Lead Arrangers immediately without reviewing them or making any copies, extracts or use of them and, if applicable, immediately terminate access to the related IntraLinks site. I. Confidentiality As used herein: (a) "Evaluation Material" means the Confidential Materials and any other information regarding the Company, the Transaction (as defined herein), or the Facilities furnished or communicated to Recipient by or on behalf of the Company in connection with the Facilities (whether prepared or communicated by the Lead Arrangers, the Company, their respective advisors or otherwise) and (b) "Internal Evaluation Material" means all memoranda, notes, and other documents and analyses developed by Recipient embodying any Evaluation Material. Recipient acknowledges that the Company considers the Evaluation Material to include confidential, sensitive or proprietary information and agrees to use reasonable precautions in accordance with its established procedures to keep the Evaluation Material confidential; provided that (i) it may disclose such information to which the Company gives its prior written consent and (ii) such information may be disclosed to it, its affiliates and their respective partners, directors, officers, employees, agents, advisors and other representatives who need to know such information in consideration of the Facilities (collectively, "Representatives") (such Representatives shall be informed by Recipient of the confidential nature of such information and shall be directed to treat such information in accordance with the terms hereof). Recipient agrees to be responsible for any breach of this Notice and Undertaking by its Representatives. The foregoing confidentiality requirements do not apply to (i) any information that is or becomes generally available to the rmation available public toother than Recipient from a source other than the Company, provided that such source is not known to Recipient to be subject to any confidentiality obligations to the Company or its respective agents, (iii) any disclosure required by law, regulation or administrative or other legal process or requested by regulatory or governmental authorities or the Company, or (iv) any information independently developed by Recipient without use of the Evaluation Material. The Recipient agrees that it will notify the Company and the Lead Arrangers as soon as practicable in the event of any disclosure pursuant to the foregoing clause (iii) unless such notification shall be prohibited by applicable law or legal process. The Evaluation Materials are submitted for Recipient’s use in connection reproduced or used for any other purposes, and must be returned with its consideration to the Leadof the Facilities, Arrangers upon request. If Recipient decides not to participate in the Facilities, then upon request of the Lead Arrangers or the Company, Recipient shall as soon as practicable return all Evaluation Material (other than Internal Evaluation Material) to the Lead Arrangers or represent in writing to the Lead Arrangers and the Company that Recipient has destroyed all copies of the Evaluation Material (other than Internal Evaluation Material), unless prohibited from doing so by law, regulation or Recipient's internal policies and procedures. Recipient agrees that money damages would not be a sufficient remedy for breach of this Notice and Undertaking, and that in addition to all other remedies available at law or in equity, the Company and the Lead Arrangers shall be entitled to equitable relief, including injunction and specific performance, without proof of actual damages. The terms and conditions of Part I of this Notice and Undertaking shall apply until you become a party to the definitive agreements evidencing the Facilities and thereafter the provisions relating to confidentiality contained in such agreements shall govern. If you do not enter into the Facilities, this Notice and Undertaking shall terminate on the date falling one year after the date hereof. II. Information Recipient acknowledges and agrees that (i) the Lead Arrangers received the Evaluation Material from third party sources (including the Company) and it is provided to Recipient for informational purposes, (ii) the Lead Arrangers and their affiliates have no responsibility, and shall not be liable, for the accuracy or completeness or lack thereof of the Evaluation Material or any information contained therein, (iii) no representation regarding the Evaluation Material is made by the Lead Arrangers or their affiliates, (iv) neither the Lead Arrangers nor their affiliates have made any independent verification as to the accuracy or completeness of the Evaluation Material, (v) the Lead Arrangers and their affiliates shall have no obligation to update or supplement any Evaluation Material or otherwise provide additional information and (vi) none of the Company, the Lead Arrangers or any of their respective affiliates shall have any liability related to the unauthorized misuse of the Evaluation Materials by any Recipient or any of their Representatives The Evaluation Material has been prepared to assist potential lenders in making their own evaluation of the Facilities and the borrower under the Facilities and does not purport to be all-inclusive or to contain all of the information that a potential lender may consider material or desirable in making its decision to become a lender. Each Recipient of the information contained herein should take such steps as it deems necessary to assure that it has the information it considers material or desirable in making its decision to become a lender and should perform its own independent investigation and analysis of the Facilities or the transactions contemplated thereby and the creditworthiness of the borrower under the Facilities. Recipient represents that it is sophisticated and experienced in extending credit to entities similar to the borrower under the Facilities. The information contained herein are not a substitute for Recipient's independent evaluation and analysis and should not be considered as a recommendation by the Lead Arrangers or any of their affiliates that any Recipient enter into the Facilities. Neither the Company nor any of its affiliates shall have any liability related to the use of this Lender Presentation or any related marketing materials by Recipient. The Evaluation Material may include certain forward looking statements and projections provided by the Company. Any such statements and projections reflect various estimates and assumptions by the Company concerning anticipated results. No representations or warranties are made by the Company or any of its affiliates as to the accuracy of any such statements or projections. Whether or not any such forward looking statements or projections are in fact achieved will depend upon future events some of which are not within the control of the Company. Accordingly, actual results may vary from the projected results and such variations may be material. Statements contained herein describing documents and agreements are summaries only and such summaries are qualified in their entirety by reference to such documents and agreements. This Notice and Undertaking shall be governed by and construed in accordance with the law of the State of New York, without regard to principles of conflicts of law (except Section 5-1401 of the New York General Obligation Law to the extent that it provides that the law of the State of New York shall govern). 3

Transaction Overview 4
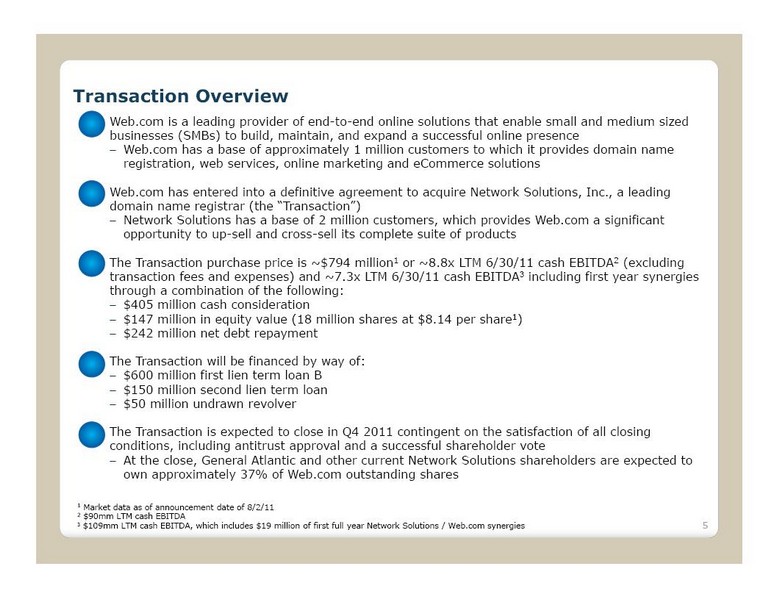
Transaction Overview § Web.com is a leading provider of end-to-end online solutions that enable small and medium sized businesses (SMBs) to build, maintain, and expand a successful online presence Web.com has a base of approximately 1 million customers to which it provides domain name registration, web services, online marketing and eCommerce solutions § Web.com has entered into a definitive agreement to acquire Network Solutions, Inc., a leading domain name registrar (the “Transaction”) Network Solutions has a base of 2 million customers, which provides Web.com a significant opportunity to up-sell and cross-sell its complete suite of products § The Transaction purchase price is ~$794 million1 or ~8.8x LTM 6/30/11 cash EBITDA2 (excluding transaction fees and expenses) and ~7.3x LTM 6/30/11 cash EBITDA3 including first year synergies through a combination of the following: $405 million cash consideration $147 million in equity value (18 million shares at $8.14 per share1)$242 million net debt repayment § The Transaction will be financed by way of: $600 million first lien term loan B $150 million second lien term loan $50 million undrawn revolver § The Transaction is expected to close in Q4 2011 contingent on the satisfaction of all closing conditions, including antitrust approval and a successful shareholder vote At the close, General Atlantic and other current Network Solutions shareholders are expected to own approximately 37% of Web.com outstanding shares 1 Market data as of announcement date of 8/2/11 2 $90mm LTM cash EBITDA 3 $109mm LTM cash EBITDA, which includes $19 million of first full year Network Solutions / Web.com synergies 5

Sources and Uses and Pro Forma Capitalization Sources & Uses ($ in Millions) Sources Uses Web.com cash $16 Cash to Sponsor $405 Network Solutions cash 18 Web.com stock to Sponsor1 147 First Lien Term Loan 600 Network Solutions debt repayment 242 Second Lien Term Loan 150 Web.com debt repayment 90 Web.com stock to Sponsor1 147 Operating/restricted cash 15 Amount of Q3 cash flow used to service debt 27 Estimated fees and expenses2 49 Severance and bonus 10 Total sources $958 Total uses $958 Pro Forma Capitalization, as of June 30, 2011 ($ in Millions) Pro forma capitalization Cumulative multiple of LTM Cash $ % EBITDA3 Cash $15.0 New $50mm revolving credit facility -First lien term loan 600.0 Total first lien debt 600.0 51.7% 4.1x Second lien term loan 150.0 Total debt $750.0 64.6% 5.1x Web.com market capitalization1 264.4 New shares issued1 147.0 Pro forma combined equity $411.4 35.4% 2.8x Total capitalization $1,161.41 100.0% 7.9x Note: Cash and debt are pro forma for 6/30/2011 1 Based on transaction announcement date of 8/2/2011 2 Fees include M&A advisory and legal fees and expenses, OID, debt and equity issuance fees and expenses 3 Based on 6/30/11 LTM Cash EBITDA of $147 mm (includes year 1 synergies of $19 mm and $5 mm in Register.com / Web.com achieved but unrealized cost synergies) 6
Key Credit Highlights Leading provider of Internet solutions to large, growing SMB market Broad, diversified customer base Comprehensive product suite & strong customer loyalty/low churn Subscription-based model with high visibility/predictability Strong financial profile growth, free cash flow & deleveraging Proven management team & execution track record, including M&A 7

Overview of Web.com and Network Solutions 8

Combined Company Scale and Leadership Leader in SMB online services Customer Base 926K 2.0MM 2.9MM Domain Registrations 2+MM 7+MM 9+MM Employees 1,150 750 1,900 LTM 6/30/11 Bookings $179MM $279MM $458MM LTM 6/30/11 Cash EBITDA $33MM $90MM $123MM Pro forma Cash EBITDA $147MM1 Cash EBITDA Margin 18% 32% 32% 1 + Web.com and Network Solutions once had the highest producing relationship until Network Solutions brought in-house in 2005 + Significant opportunity to cross-sell / up-sell products and services to each respective customer base + $30 million run rate synergies that expect to be achieved by the end of 2013 + Company expects to generate substantial free cash flow to pay down debt as well as invest in sales and marketing to accelerate growth ¹ Pro forma for $19 million of first full year Network Solutions / Web.com synergies and $5 million in Register.com / Web.com achieved but unrealized cost synergies 9
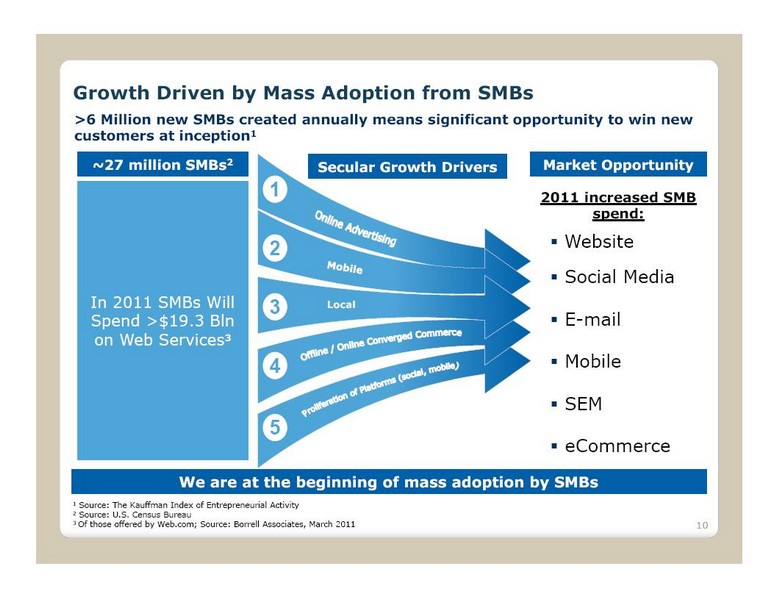
Growth Driven by Mass Adoption from SMBs >6 Million new SMBs created annually means significant opportunity to win new customers at inception1 ~27 million SMBs2 Secular Growth Drivers Market Opportunity 1 2011 increased SMB spend: 2 § Website § Social Media In 2011 SMBs Will Local 3 Spend >$19.3 Bln § E-mail on Web Services3 4 § Mobile § SEM 5 §eCommerce We are at the beginning of mass adoption by SMBs 1 Source: The Kauffman Index of Entrepreneurial Activity 2 Source: U.S. Census Bureau 3 Of those offered by Web.com; Source: Borrell Associates, March 2011 10
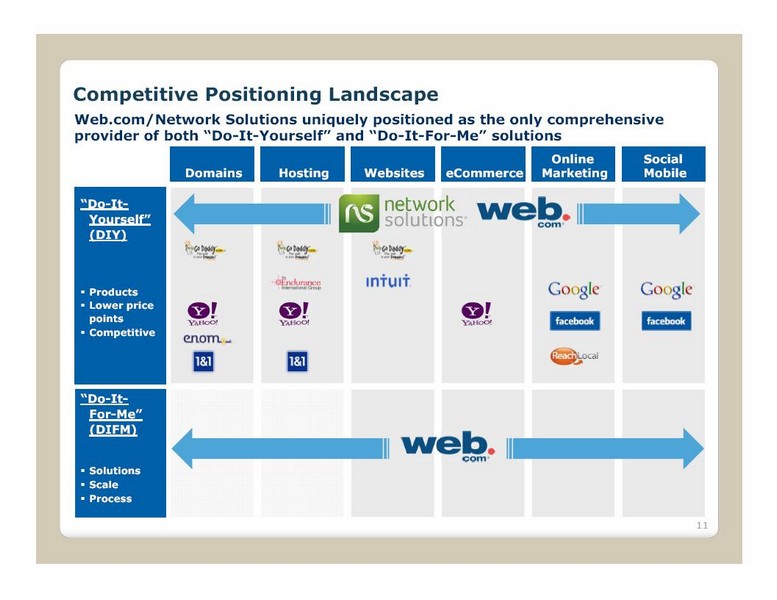
Competitive Positioning Landscape Web.com/Network Solutions uniquely positioned as the only comprehensive provider of -It- both Yourself” and “Do -It-For- “Do Me” solutions Online Social Domains Hosting Websites eCommerce Marketing Mobile “Do -It- Yourself” (DIY) §Products §Lower price points §Competitive “Do -It- For-Me” (DIFM) §Solutions §Scale §Process 11
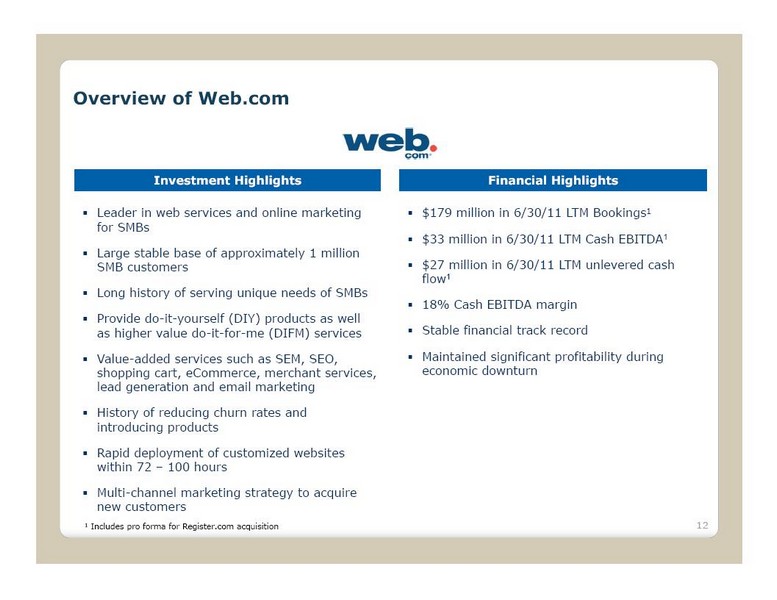
Overview of Web.com Investment Highlights Financial Highlights § Leader in web services and online marketing § $179 million in 6/30/11 LTM Bookings1 for SMBs § $33 million in 6/30/11 LTM Cash EBITDA1 § Large stable base of approximately 1 million SMB customers § $27 million in 6/30/11 LTM unlevered cash flow1 § Long history of serving unique needs of SMBs § 18% Cash EBITDA margin§ Provide do-it-yourself (DIY) products as well as higher value do-it-for-me (DIFM) services § Stable financial track record § Value-added services such as SEM, SEO, § Maintained significant profitability during shopping cart, eCommerce, merchant services, economic downturn lead generation and email marketing § History of reducing churn rates and introducing products § Rapid deployment of customized websites within 72 100 hours§ Multi-channel marketing strategy to acquire new customers 1 Includes pro forma for Register.com acquisition 12

Web.com s Value Proposition Broad suite of products catered Value SMBs need help Solutions provider to SMBs at all measurement stages § Lack of time § DIY & DIFM solutions § Domain to start § Higher ROI vs. print online presence media § Lack of resources § Consultative approach to § Online marketing § Tools to track § Lack of technical customers and eCommerce to campaigns expertise acquire customers § Act as -house” “in§ Analytics to track team § Social/mobile to traffic and leads extend presence 13
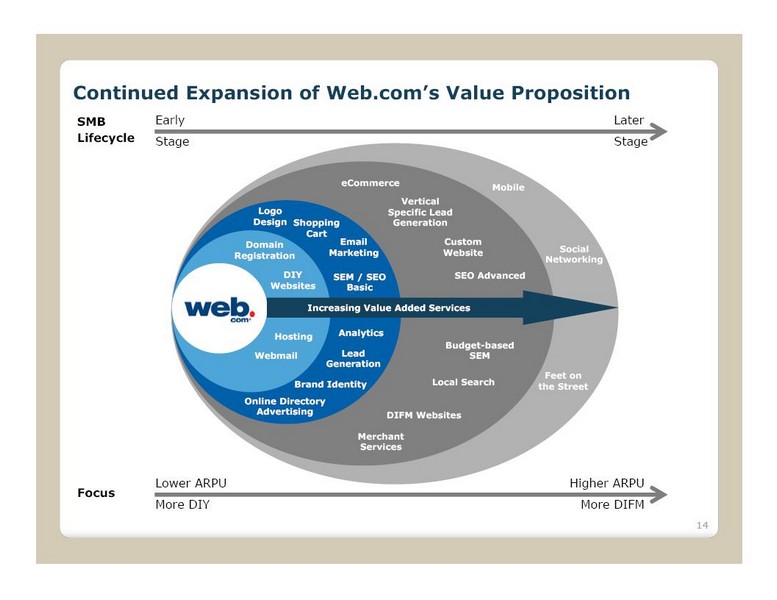
Continued Expansion of Web.com s Value SMB Early Later Lifecycle Stage Stage eCommerce Mobile Vertical Logo Specific Lead Design Shopping Generation Cart Domain Email Custom Marketing Website Social Registration Networking DIY SEM / SEO SEO Advanced Websites Basic Increasing Value Added Servicesra Hosting Analytics Budget-based Webmail Lead SEM Generation Feet on Brand Identity Local Search the Street Online Directory Advertising DIFM Websites Merchant Services Lower ARPU Higher ARPU Focus More DIY More DIFM 14
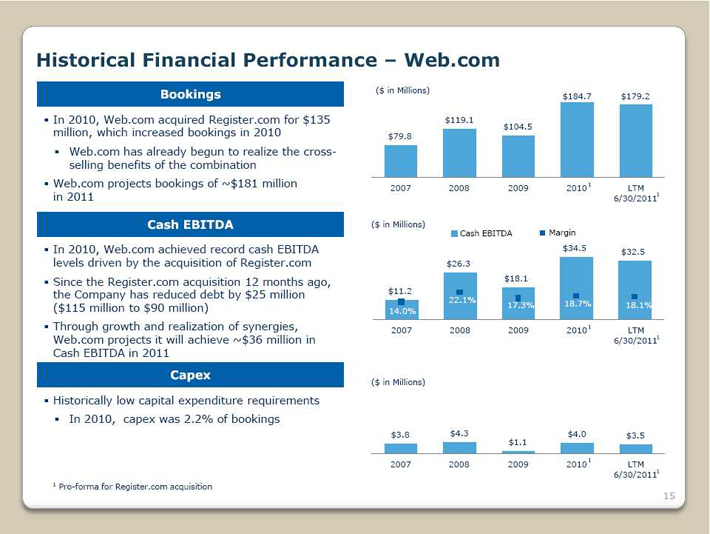
Historical Financial Performance Web.com Bookings ($ in Millions) $184.7 $179.2 §In 2010, Web.com acquired Register.com for $135 $119.1 million, which increased bookings in 2010 $104.5 $79.8 § Web.com has already begun to realize the cross-selling benefits of the combination §Web.com projects bookings of ~$181 million 2007 2008 2009 20101 LTM in 2011 6/30/20111 Cash EBITDA ($ in Millions) Cash EBITDA Margin §In 2010, Web.com achieved record cash EBITDA $34.5 $32.5 levels driven by the acquisition of Register.com $26.3§Since the Register.com acquisition 12 months ago, $18.1 the Company has reduced debt by $25 million $11.2 22.1% 18.7% ($115 million to $90 million) 17.3% 18.1% 14.0% §Through growth and realization of synergies, 2007 2008 2009 20101 LTM Web.com projects it will achieve ~$36 million in 6/30/20111 Cash EBITDA in 2011 Capex ($ in Millions) §Historically low capital expenditure requirements § In 2010, capex was 2.2% of bookings $3.8 $4.3 $4.0 $3.5 $1.1 2007 2008 2009 20101 LTM 6/30/201111 Pro-forma for Register.com acquisition 15

Stable Subscriber Base & Growing ARPU trends Subscribers1 ( 000s) Web.com Monthly Average Revenue Per User $16.24 954 $15.64 939 926 $15.39 4Q'10 1Q'11 2Q'11 4Q'10 1Q'11 2Q'11 1 Ending period customer base 16

Churn Rates § Churn has been reduced by approximately 65% since 2007 § Client save rate is over 65% § Proactive calling, stickiness of domain customers and mass adoption has contributed to a reduction in churn § Increasing average customer life Average monthly churn rate1 4.8% 4.0% 3.6% 2.8% 2.4% 2.0% 1.7% 2007 2008 2009 LTM 3Q'10 LTM 4Q'10 LTM 1Q'11 LTM 2Q'11 Implied average customer life (months): 20.8 25.0 27.9 35.8 41.7 50.0 58.8 1 Average monthly churn rates = (lost customers ÷ (beginning customers + gross customer adds)) 17
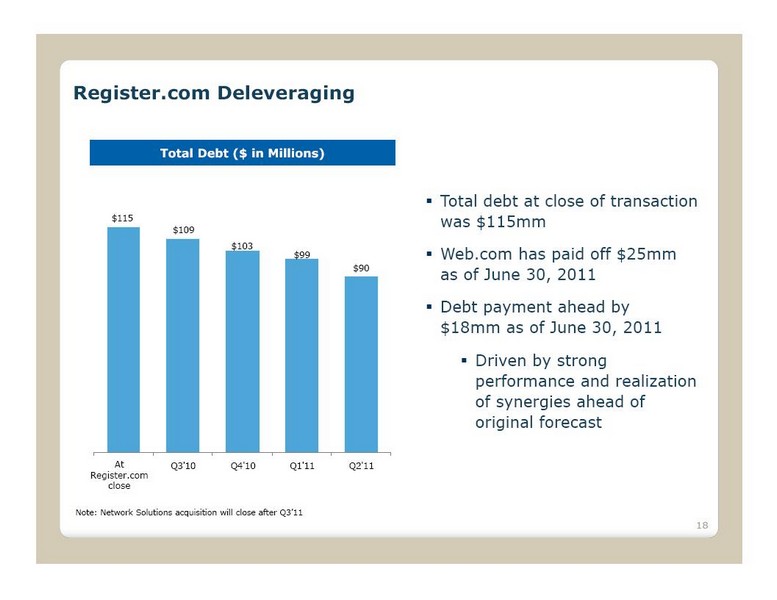
Register.com Deleveraging Total Debt ($ in Millions) §Total debt at close of transaction $115 was $115mm $109 $103 $99§Web.com has paid off $25mm $90 as of June 30, 2011 §Debt payment ahead by $18mm as of June 30, 2011 §Driven by strong performance and realization of synergies ahead of original forecast At Q3'10 Q4'10 Q1'11 Q2'11 Register.com close Note: Network Solutions acquisition will close after Q3’11 18
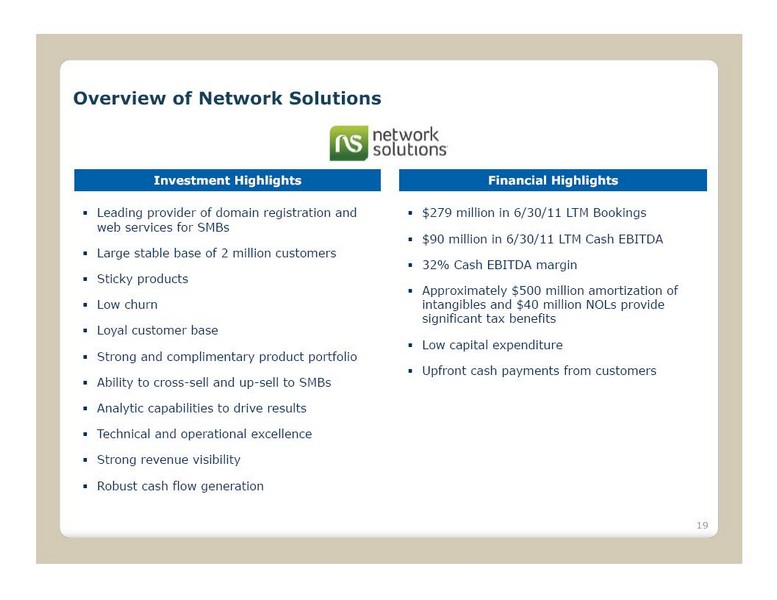
Overview of Network Solutions Investment Highlights Financial Highlights § Leading provider of domain registration and § $279 million in 6/30/11 LTM Bookings web services for SMBs § $90 million in 6/30/11 LTM Cash EBITDA § Large stable base of 2 million customers § 32% Cash EBITDA margin § Sticky products § Approximately $500 million amortization of § Low churn intangibles and $40 million NOLs provide significant tax benefits § Loyal customer base § Low capital expenditure § Strong and complimentary product portfolio § Upfront cash payments from customers § Ability to cross-sell and up-sell to SMBs § Analytic capabilities to drive results § Technical and operational excellence § Strong revenue visibility § Robust cash flow generation 19
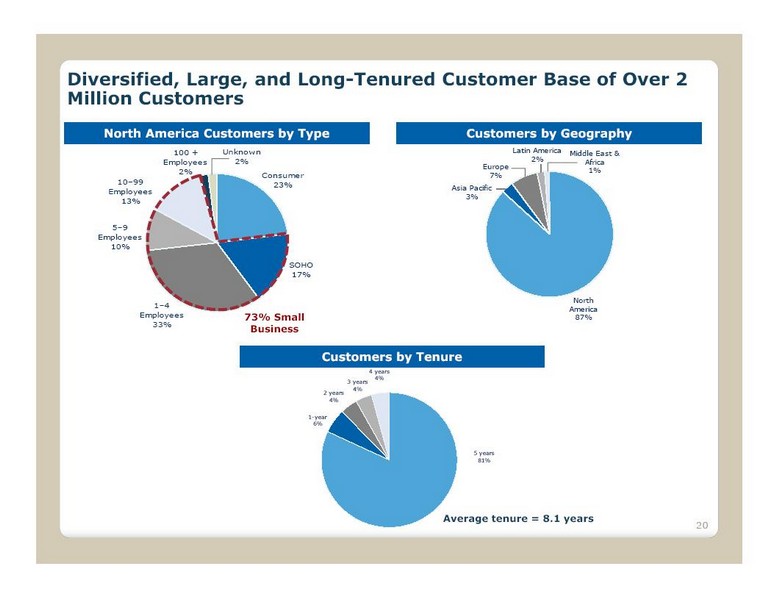
Diversified, Large, and Long-Tenured Customer Base of Over 2 Million Customers North America Customers by Type Customers by Geography 100 + Unknown Latin America Middle East & Employees 2% 2% Africa Europe 2% 1% Consumer 7% 10 99 23% Employees Asia Pacific 3% 13% 5 9 Employees 10% SOHO 17% North 1 4 America Employees 73% Small 87% 33% Business Customers by Tenure 3 years 4 years 4% 4% 2 years 4% 1-year 6% 5 years 81% Average tenure = 8.1 years 20

Historical Financial Performance Network Solutions Bookings ($ in Millions) $298.5 $314.7 §Network Solutions’ showed modest growth in business $274.2 $276.2 $279.3 2011 YTD §Successful up-selling and high renewal rates drove sustainable and predictable bookings §Significant opportunity for incremental growth through increased marketing 2007 2008 2009 2010 LTM 6/30/2011 Cash EBITDA ($ in Millions) Cash EBITDA Margin §Network Solutions has focused on profitability and paying $84.1 $88.1 $90.6 $81.9 $78.7 down debt since its recapitalization in 2007 31.9% 32.4% § Since the buyout, the company has reduced gross 28.2% 26.0% 28.7% debt from $425 million to $242 million in 4 years (as of 6/30/2011) §Cash EBITDA margins remained stable through the 2009 downturn 2007 2008 2009 2010 LTM 6/30/2011 §Cash EBITDA increased 12% in 2010 Capex ($ in Millions) §Relatively low historical capital expenditures $16.2 $18.0 $16.8 § In 2010, capex was 6.5% of bookings $12.5 $8.8 2007 2008 2009 2010 LTM 6/30/2011 Source: Network Solutions financials 21
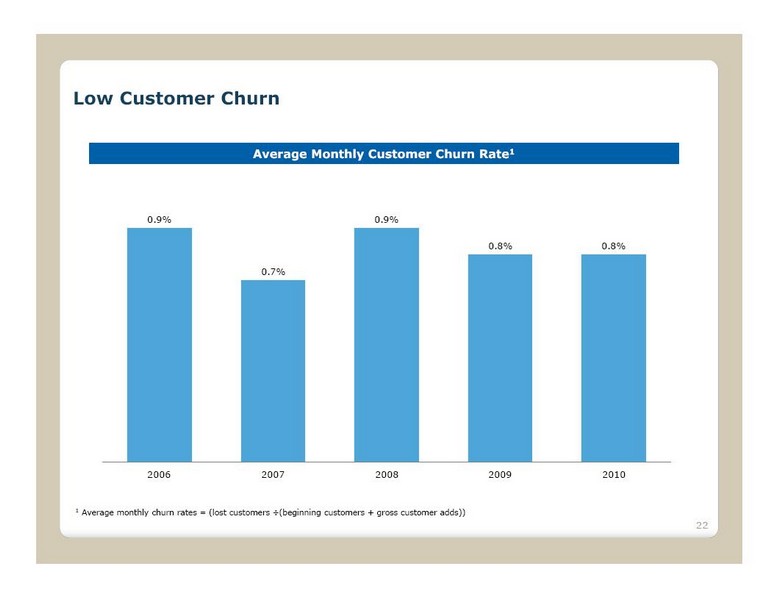
Low Customer Churn Average Monthly Customer Churn Rate1 0.9% 0.9% 0.8% 0.8% 0.7% 2006 2007 2008 2009 2010 1 Average monthly churn rates = (lost customers ÷(beginning customers + gross customer adds)) 22

Acquisition Overview 23
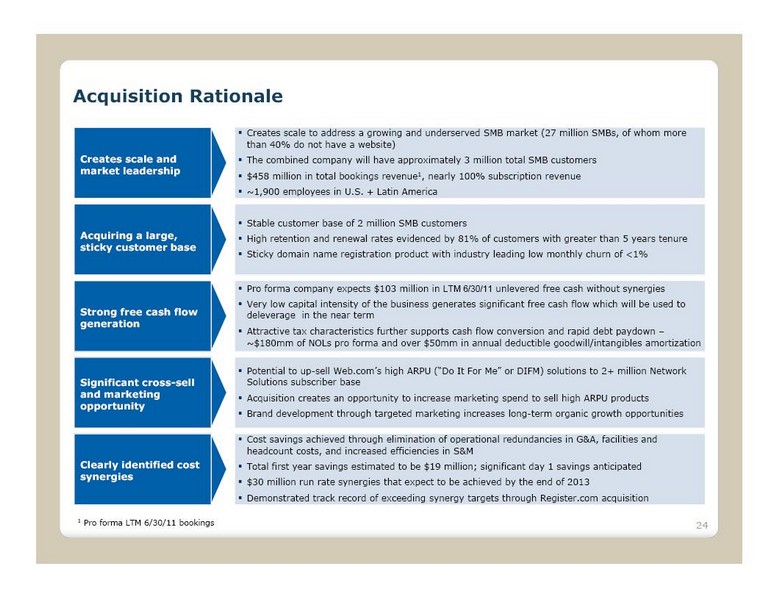
Acquisition Rationale §Creates scale to address a growing and underserved SMB market (27 million SMBs, of whom more than 40% do not have a website) Creates scale and §The combined company will have approximately 3 million total SMB customers market leadership §$458 million in total bookings revenue1, nearly 100% subscription revenue §~1,900 employees in U.S. + Latin America §Stable customer base of 2 million SMB customers Acquiring a large, §High retention and renewal rates evidenced by 81% of customers with greater than 5 years tenure sticky customer base §Sticky domain name registration product with industry leading low monthly churn of <1% §Pro forma company expects $103 million in LTM 6/30/11 unlevered free cash without synergies §Very low capital intensity of the business generates significant free cash flow which will be used to Strong free cash flow deleverage in the near term generation §Attractive tax characteristics further supports cash flow conversion and rapid debt paydown ~$180mm of NOLs pro forma and over $50mm in annual deductible goodwill/intangibles amortization §Potential to up-sell Web.com’s high ARPU (“Do It For Me” or DIFM) Significant cross-sell Solutions subscriber base and marketing §Acquisition creates an opportunity to increase marketing spend to sell high ARPU products opportunity §Brand development through targeted marketing increases long-term organic growth opportunities §Cost savings achieved through elimination of operational redundancies in G&A, facilities and headcount costs, and increased efficiencies in S&M Clearly identified cost §Total first year savings estimated to be $19 million; significant day 1 savings anticipated synergies §$30 million run rate synergies that expect to be achieved by the end of 2013 §Demonstrated track record of exceeding synergy targets through Register.com acquisition 1 Pro forma LTM 6/30/11 bookings 24
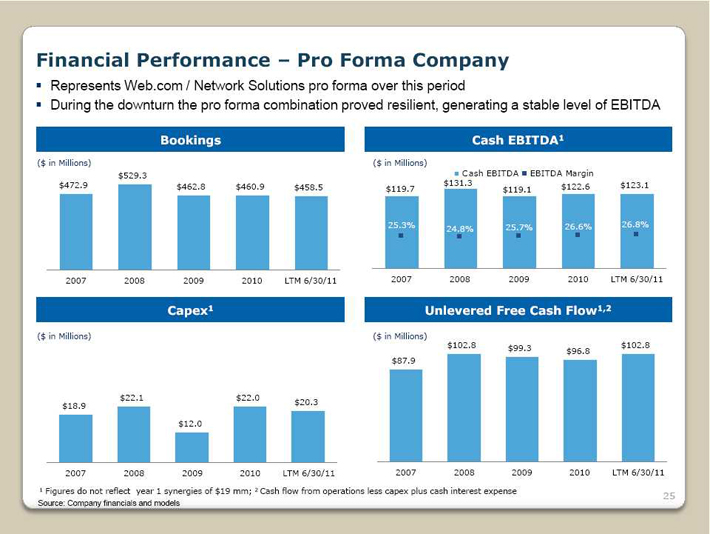
Financial Performance Pro Forma Company §Represents Web.com / Network Solutions pro forma over this period §During the downturn the pro forma combination proved resilient, generating a stable level of EBITDA Bookings Cash EBITDA1 ($ in Millions) ($ in Millions) $529.3 Cash EBITDA EBITDA Margin $472.9 $462.8 $460.9 $131.3 $122.6 $123.1 $458.5 $119.7 $119.1 25.3% 25.7% 26.6% 26.8% 24.8% 2007 2008 2009 2010 LTM 6/30/11 2007 2008 2009 2010 LTM 6/30/11 Capex1 Unlevered Free Cash Flow1,2 ($ in Millions) ($ in Millions) $102.8 $99.3 $102.8 $96.8 $87.9 $22.1 $22.0 $18.9 $20.3 $12.0 2007 2008 2009 2010 LTM 6/30/11 2007 2008 2009 2010 LTM 6/30/11 1 Figures do not reflect year 1 synergies of $19 mm; 2 Cash flow from operations less capex plus cash interest expense 25 Source: Company financials and models
Appendix 26
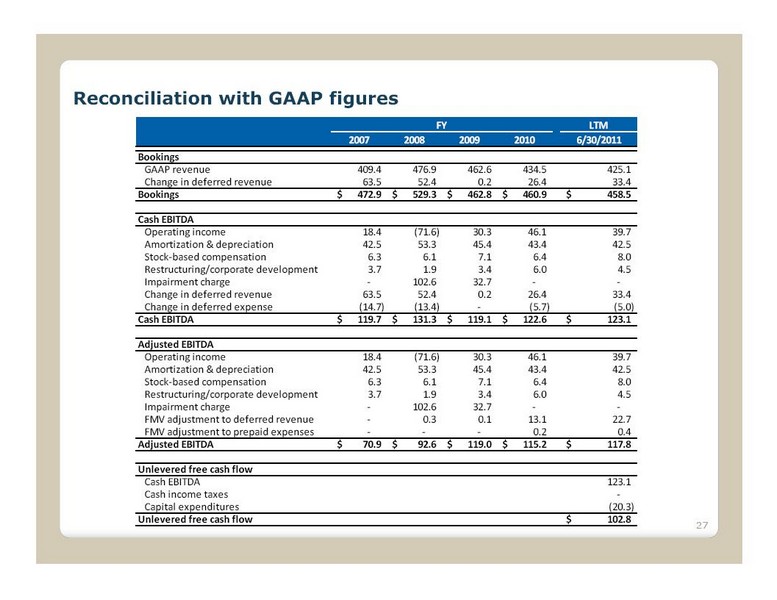
Reconciliation with GAAP figures FY LTM 2007 2008 2009 2010 6/30/2011 Bookings GAAP revenue 409.4 476.9 462.6 434.5 425.1 Change in deferred revenue 63.5 52.4 0.2 26.4 33.4 Bookings $ 472.9 $ 529.3 $ 462.8 $ 460.9 $ 458.5 Cash EBITDA Operating income 18.4 (71.6) 30.3 46.1 39.7 Amortization & depreciation 42.5 53.3 45.4 43.4 42.5 Stock-based compensation 6.3 6.1 7.1 6.4 8.0 Restructuring/corporate development 3.7 1.9 3.4 6.0 4.5 Impairment charge - 102.6 32.7 - -Change in deferred revenue 63.5 52.4 0.2 26.4 33.4 Change in deferred expense (14.7) (13.4) - (5.7) (5.0) Cash EBITDA $ 119.7 $ 131.3 $ 119.1 $ 122.6 $ 123.1 Adjusted EBITDA Operating income 18.4 (71.6) 30.3 46.1 39.7 Amortization & depreciation 42.5 53.3 45.4 43.4 42.5 Stock-based compensation 6.3 6.1 7.1 6.4 8.0 Restructuring/corporate development 3.7 1.9 3.4 6.0 4.5 Impairment charge - 102.6 32.7 - - FMV adjustment to deferred revenue - 0.3 0.1 13.1 22.7 FMV adjustment to prepaid expenses - - - 0.2 0.4 Adjusted EBITDA $ 70.9 $ 92.6 $ 119.0 $ 115.2 $ 117.8 Unlevered free cash flow Cash EBITDA 123.1 Cash income taxes - Capital expenditures (20.3) Unlevered free cash flow $ 102.8 27