Attached files
| file | filename |
|---|---|
| 8-K - FORM 8-K - SunCoke Energy, Inc. | d230863d8k.htm |
 KeyBanc Capital
Markets 2011 Basic Materials & Packaging Conference
September 13, 2011
Exhibit 99.1 |
 1
Safe Harbor Statement
Some
of
the
information
included
in
this
presentation
contains
“forward-looking
statements”
(as
defined
in
Section
27A
of
the
Securities
Act of
1933, as amended and Section 21E of the Securities Exchange Act of 1934, as
amended). Such forward-looking statements are based on management’s
beliefs and assumptions and on information currently available. Forward-looking statements include the information concerning
Suncoke’s possible or assumed future results of operations, business
strategies, financing plans, competitive position, potential growth
opportunities, potential operating performance improvements, effects resulting from
our separation from Sunoco, the effects of competition and the effects of
future legislation or regulations. Forward-looking statements include all statements that are not historical facts and may be
identified
by
the
use
of
forward-looking
terminology
such
as
the
words
“believe,”
“expect,”
“plan,”
“intend,”
“anticipate,”
“estimate,”
“predict,”
“potential,”
“continue,”
“may,”
“will,”
“should”
or the negative of these terms or similar expressions. Forward-looking
statements involve risks, uncertainties and assumptions. Actual results may
differ materially from those expressed in these forward-looking statements. You should not
put undue reliance on any forward-looking statements.
In accordance with the safe harbor provisions of the Private Securities Litigation
Reform Act of 1995, SunCoke has included in its filings with the Securities
and Exchange Commission cautionary language identifying important factors (but not necessarily all the important factors) that
could cause actual results to differ materially from those expressed in any
forward-looking statement made by SunCoke. For more information
concerning
these
factors,
see
SunCoke's
Securities
and
Exchange
Commission
filings.
All
forward-looking
statements
included
in
this
presentation
are
expressly
qualified
in
their
entirety
by
such
cautionary
statements.
SunCoke
undertakes
no
obligation
to
update
publicly any
forward-looking statement (or its associated cautionary language) whether as a
result of new information or future events or otherwise. This presentation
includes certain non-GAAP financial measures intended to supplement, not substitute for, comparable GAAP measures.
Reconciliations of non-GAAP financial measures to GAAP financial measures are
provided in the Appendix at the end of the presentation. Investors
are
urged
to
consider
carefully
the
comparable
GAAP
measures
and
the
reconciliations
to
those
measures
provided
in
the
Appendix,
or on our website at www.suncoke.com. |
 2
SunCoke at a Glance
Business Mix
Cokemaking Capacity
Pro Forma Adjusted EBITDA
(2010)*
Sales and Other Operating Revenue
(2010)
$197 million*
$1.3 billion
Largest independent producer of high-quality
metallurgical coke in the Americas
-
Over 45 years of production experience
2010 total revenue and adjusted EBITDA of
$1.3 billion and $227 million, respectively
Five cokemaking facilities (four in U.S. and one in
Brazil) with a sixth facility expected to start-up in Q4
2011
-
Approximately 5.9 million tons per year
cokemaking capacity including new facility
-
Grown capacity from 2.5 million tons in 2005 to
5.4 million tons in 2010
Secure, long-term contracts with leading steelmakers
who have been increasingly outsourcing coke
production to SunCoke
Metallurgical coal mining operations in Virginia and
West Virginia
-
1.2 million tons of metallurgical coal production
annually
-
Expect production to double to 2.4–2.5 million tons
per annum by mid-2013
Approximately 1,180 employees (980 U.S. / 200 Brazil)
Expect Sunoco to complete spin-off within 12 months
of IPO
International
Coke
8%
*Excludes Corporate Segment
Other
Domestic
Coke
74%
Jewell Coke
23%
International
Coke
3%
Coal Mining
0%
Coal
Mining
12%
Other
Domestic
Coke
55%
Jewell
Coke
25%
0
1
2
3
4
5
6
7
2004
2005
2006
2007
2008
2009
2010
2011E
2012E
Jewell
Indiana Harbor
Haverhill I
Vitória
Haverhill II
Granite City
Middletown |
 3
Strategically-Located Cokemaking Facilities and Mines
International Operations
(1) Expected start-up in Q4 2011.
(2) SunCoke holds a preferred interest of $41 million in Vitória and is the
operator. Our U.S. facilities are located in close proximity to all U.S. integrated
steelmaking facilities Vitória
(2)
(ArcelorMittal)
Capacity: 1,700kt
Brazil
Indiana Harbor
(ArcelorMittal)
Capacity: 1,220kt
Haverhill
(ArcelorMittal /
AK Steel)
Capacity: 1,100kt
Granite City
(US Steel)
Capacity: 650kt
Domestic Operations
Cokemaking facility under construction
Existing cokemaking facilities
Coal mining
Jewell
(ArcelorMittal)
Capacity: 720kt
Middletown
(1)
(AK Steel)
Capacity: 550kt
(Expect production to double to
2.4–2.5mtpy by mid-2013)
Jewell Coal
1.2mtpy
Premium mid-vol
Reserves: 85mt
Harold Keene
0.3mtpy
High-vol A/B
Reserves: 21mt |
 4
Delivering Coke and Energy to Customers
Coke
Energy
Blast Furnace Coke
Electric Power
Steam
Breeze
or
Nut Coke
and/or
and
Key raw material in
blast furnace iron-
making process
Acts as a reductant
and burden in the
blast furnace
Small-sized coke
fines screened from
the blast furnace-
sized coke
production
Heat recovery steam
generators (“HRSG”)
capture waste heat
from the coking
process to make
low-pressure,
saturated steam
HRSGs produce high-
pressure, superheated
steam for power
generation
Facilities generate
~9 MW electric power
each hour per 110,000
tons of annual coke
production |
 5
Our Industry-Leading Heat Recovery
Coke Oven Technology |
 6
SunCoke’s Oven vs. By-Product Ovens
SunCoke’s technology is the industry’s environmental standard and provides many
advantages over the traditional cokemaking process
SunCoke Heat Recovery
Traditional By-Product
Pressurization
Negative pressure
Positive pressure
Air Emissions
MACT standard for new batteries
Potential for emission of hazardous
compounds
Power Generation
Cogenerates power
Power consuming process
Hazardous Inputs
None
Yes – sulfuric acid
Volatile Organic Compounds
Complete combustion
No combustion
Solid Wastes
No toxic solid wastes
Process produces toxic waste streams
Water Usage
No wastewater discharges
Requires wastewater treatment facility
|
 7
Strong Industry Fundamentals
World Crude Steel Production
Source:
CRU, The Annual Outlook for Metallurgical Coke 2011.
We expect significant infrastructure investment in
emerging markets to drive steel demand growth
Coke/blast furnace iron production is expected to
remain the dominant process
-
China: ~90%
-
World: ~70%
-
U.S.: ~40%
(Tons in millions)
World Coke Consumption
Source: CRU, The Annual Outlook for Metallurgical Coke 2011.
(Tons in millions)
We expect demand to increase with growing
integrated steel production
Aging coke infrastructure
-
44% of existing global coke capacity (excluding
China and CIS) is over 30 years old
-
53% of North American coke capacity is over 30
years old
-
SunCoke’s U.S. growth has been driven by
coke battery replacement
641
497
906
1,248
1,562
2,319
2005
2010
2021E
China
Asia (ex China)
Europe
N. America
CIS
Rest of World
2005
2010
2021E
China
Asia (ex China)
Europe
N. America
CIS
Rest of World |
 8
$200
$325
$450
$575
$700
Jan-08
Jan-09
Jan-10
Jan-11
Chinese Metallurgical Coke (FOB China port - adds $45-$60/ton)
SunCoke –
Other Domestic Coke
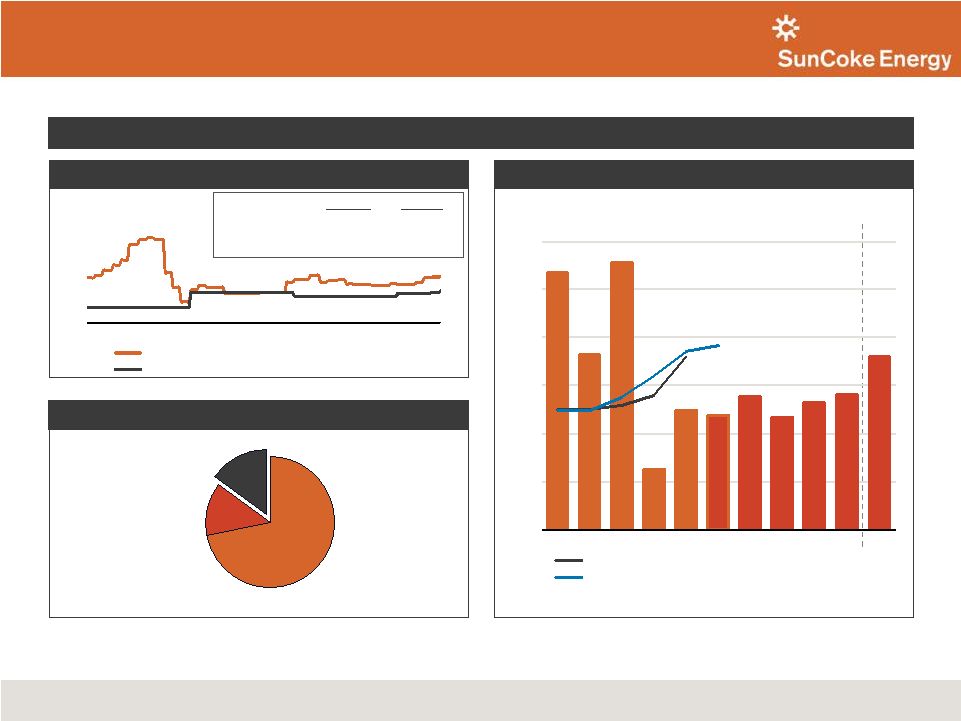
SunCoke's North American Industry Position
Chinese Coke Price vs. Representative SunCoke Price
North American Coke Capacity
North American Coke Imports
SunCoke has the opportunity to displace higher cost coke imports
Source: CRU, The Annual Outlook for Metallurgical Coke 2011.
SunCoke
Chinese
Q2 2011 Average:
$359
$440
2010 Average:
$336
$414
2008-2010 Average:
$326
$430
(Tons in millions)
Source:
CRU, The Annual Outlook for Metallurgical Coke 2011.
(1)
Represents SunCoke’s domestic cokemaking capacity weighted by the number of months each
facility operated during that year.
(1)
(1)
Other Domestic Coke sales and other operating revenues divided by tons sold.
2010 Total Capacity: 24.5 million tons
Integrated coke
72%
Merchant coke
13%
SunCoke
15%
(US$ / ton)
5.4
3.6
5.6
1.3
2.5
2.4
2.8
2.3
2.6
2.8
3.6
–
1.0
2.0
3.0
4.0
5.0
6.0
2006
2007
2008
2009
2010
2011E
2012E
2013E
2014E
2015E
2021E
SunCoke domestic coke sales volumes
SunCoke weighted-average domestic cokemaking capacity
(1) |
 9
SunCoke’s Value Proposition
Permits and Approvals
Engineering, Procurement &
Construction
Capital Funding and Ownership
A competitive turnkey coke solution which produces a consistent stream of earnings
Operating Cost Component
(Pass-Through)
Fixed Fee
(Profit and Return on Capital)
Coal Cost Component
(Pass-Through)
Take-Or-Pay
Taxes, Transportation and Future
Environmental Costs (Pass-Through)
Coke fee
Energy fee
SunCoke
Energy
Customer
Typical Key Coke Sales Agreement Provisions
What SunCoke Offers
Plant Production and Environmental
Compliance
Reliability and Quality of Coke Supply |
 10
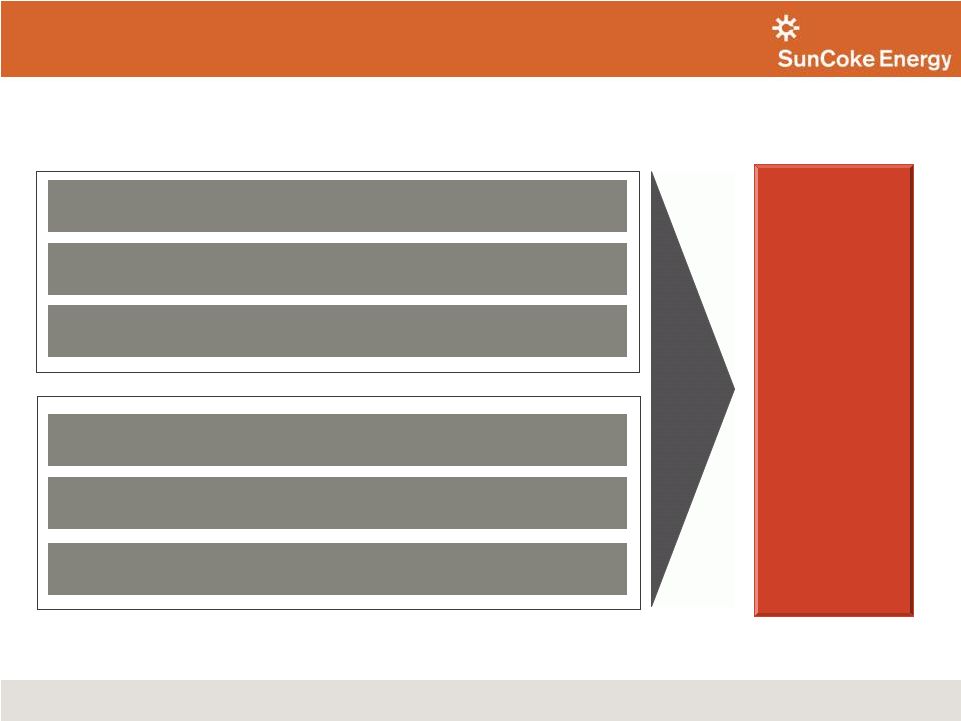
Focused Growth Strategy
Maintain our technological advantage through the development or
acquisition of new technologies
Expand our domestic coal production from current reserves and pursue
selective reserve additions
Maintain liquidity and financial flexibility to facilitate growth
We believe
SunCoke
Energy is
uniquely
positioned for
continued
investment and
earnings
growth
Maintain our consistent focus on operational excellence, safety and
environmental stewardship
Continue to grow our North American cokemaking businesses; with
portion of future coke capacity reserved for market sales
Grow our international footprint with a focus on key growth markets
Growth Initiatives
Foundations for Growth |
 11
Coke Development
North
America
Brazil
Ongoing discussions with multiple customers for new coke capacity
Our Focus / Activities
Market Drivers
China
Exploring partner opportunities to enter market
Import displacement
Battery replacements
New blast furnace
construction
Largest blast furnace
steel market
India
New blast furnace
construction
Import displacement
Coke Expansion Focused on 4 Key Markets
Early stages of permitting an anticipated 1.1 million tons of coke
per year potential new cokemaking facility in Kentucky
MOU for minority investment in Global Coke Limited |
 12
0.4-0.5 million tons expected
surface mining
1.2 million tons
current production capacity
0.3 million tons HKCC acquisition
0.5 million tons expected Jewell
expansion
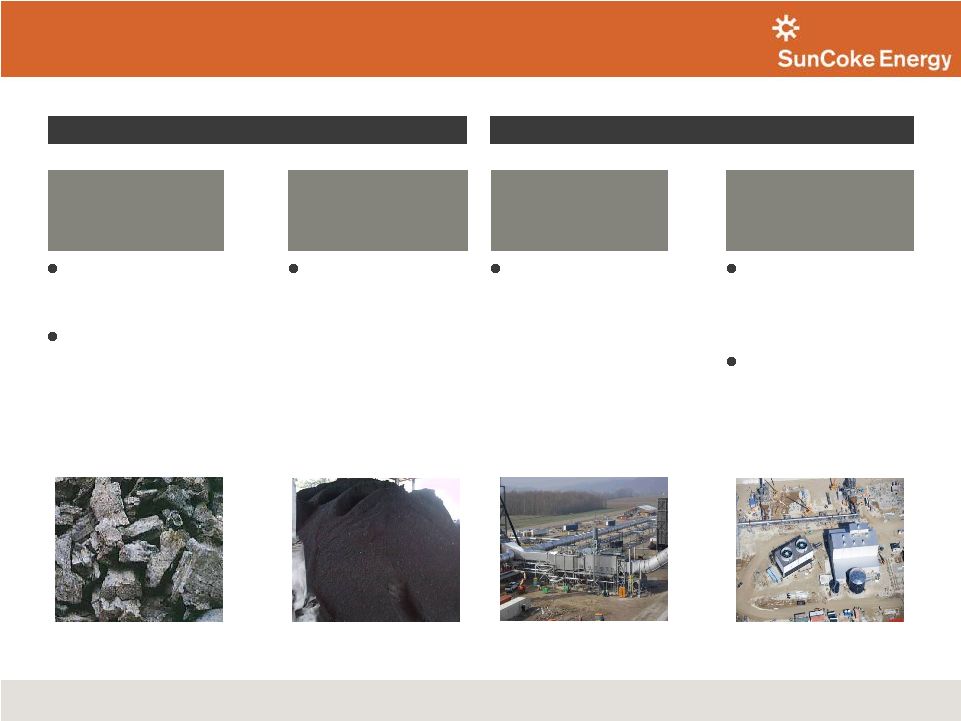
Coal Development
Doubling Our Production
Planned Growth
Current Operations
Underground
Mining
Surface
Mining
Selective
Reserve
Additions
2.4-2.5 million tons per annum
(Expect to double current production
by mid-2013)
+
+
+
=
106 million tons of proven
and probable reserves
Reserve life of 50+ years
Expected 500,000 tons per
year expansion of Jewell Coal
-
Mid-2013 completion
expected
-
Expect total cost of $25
million
Evaluating HKCC expansion
Limited highwall mining at
HKCC
Signed agreement to extract
additional surface tons
-
Expect 1.3 million tons
over 3 years beginning in
2012
Acquired Harold Keene Coal
Companies in January 2011
Evaluating selective,
opportunistic additions of
coal reserves |
 13
$171
$187
$297
2008
2009
2010
$117
$159
$184
$157
$230
$227
2008
2009
2010
$840
$1,145
$1,327
2008
2009
2010
Historical Financial Summary
Total Revenues
Adjusted EBITDA
Note:
See Appendix for reconciliation.
Grey colored bars represent Pro Forma Adjusted EBITDA for ArcelorMittal settlement.
Net Cash Provided by Operating Activities
($ in millions)
Strong growth in earnings and cash flow driven by coke expansion
($ in millions)
($ in millions) |
 14
722
714
715
1,214
1,164
1,140
690
928
1,103
62
635
2008
2009
2010
Q2 '11*
Jewell
Indiana Harbor
Haverhill
Granite City
2,626
2,868
3,593
Domestic Coke Financial Summary
(Jewell Coke & Other Domestic Coke)
Domestic Coke Production
Domestic Coke Pro Forma Adjusted EBITDA
(1)
for ArcelorMittal
Settlement and Coal Transfer Price Impacts
(Tons in thousands)
($ in millions, except per ton amounts)
Other
Domestic
Coke:
1,904
Other
Domestic
Coke:
2,154
Other
Domestic
Coke:
2,878
Jewell Coke
Other Domestic Coke
Pro Forma Adjusted EBITDA/ton
Other
Domestic
Coke:
745
922
$36
(1) For a reconciliation of Pro Forma Adjusted EBITDA to operating income, please
see the appendix.
168
276
301
177
*Q2 ‘11 scale is annualized
*Q2 ‘11 scale is annualized
$46
$41
$49
$11
$48
$36
$109
$25
$36/ton
$27/ton
$44/ton
$39/ton
2008
2009
2010
Q2 '11*
$94
$76
$159 |
 15
1,233
1,214
1,277
334
1,179
1,134
1,104
340
54
73
149
24
2008
2009
2010
Q2 '11
Coal sales
Coal production
Coal purchases
Coal Mining Financial Summary
Coal Sales, Production and Purchases
Avg. Sales Price/Ton
(1)
and Cost/Ton
Coal Mining Pro Forma Adjusted EBITDA
(5)
for Coal Transfer Price
Impact
(Tons in thousands)
($ in millions, except per ton amounts)
Pro Forma Adjusted EBITDA
Pro Forma Adjusted EBITDA / ton
Coal cash cost
Purchased coal cost
($ per ton)
(5) For a reconciliation of Pro Forma Adjusted EBITDA to operating income, please see
the appendix. $11
(2)
(1)
Average Sales Price is the weighted average sales price for all coal sales volumes, includes
sales to affiliates and sales to Jewell Coke established via a transfer pricing
agreement. The transfer price per ton to Jewell Coke was $89.96, $100.19, $103.74 and
$156.12 for 2008, 2009, 2010 and Q2 ‘11, respectively.
(2)
Pro Forma Sales Price is the Average Sales Price adjusted to set the internal transfer price on
Jewell Coke coal purchase volumes equal to the Jewell Coke coal component contract
price. The per ton coal cost component included in the Jewell Coke contract was
approximately $106, $155, $130 and $165 for 2008, 2009, 2010, and Q2 ‘11 respectively.
(3)
Mining and preparation costs, excluding depreciation, depletion and amortization, divided by
coal production volume.
(4)
Costs of purchased raw coal divided by purchased coal volume.
$25/ton
$56/ton
$19/ton
$34/ton
2008
2009
2010
Q2 '11
$31
$69
$24
$80
$92
$106
$126
$41
$43
$88
$85
$147
$125
$162
$92
$100
$104
2008
2009
2010
Q2 '11
Average Sales Price
Pro Forma Sales Price
$155
$106
(3)
(4) |
 16
Second Quarter Overview
(1) For a reconciliation of Adjusted EBITDA to net income and operating income,
please see the appendix. Q2
‘11
vs.
Q2
’10
•
Year-over-year quarterly results reflect unfavorable impact of
ArcelorMittal settlement, and relocation and public company readiness
costs •
Net Income Attributable to Net Parent Investment of $22.4 million in Q2 ‘11
vs. $44.3 million in Q2 ’10
•
Adjusted EBITDA
(1)
of $37.6 million in Q2 ‘11 vs. $68.7 million in Q2 ’10
Q2
‘11
vs.
Q1
’11
•
Improvement over Q1 ‘11 driven by stronger Indiana Harbor performance
and better utilization rates across all Coke Operations
•
Adjusted EBITDA
(1)
of $37.6 million in Q2 ‘11 vs. $26.6 million in Q1 ’11
|
 17
Capital Expenditures
•
Expect 2011 Capital Expenditures of $231 million, up $15 million vs. 2010
•
Middletown and coal expansion represents expansion capital
•
First Half 2011 capital expenditures totaled $128 million
Capital Expenditures
$187
$170
$181
$28
$46
$50
$304
$215
$216
$231
2008
2009
2010
2011E
Ongoing
Expansion
In Millions
$289
$16 |
 18
Cash Flows and Financial Position
Capital Structure
Liquidity
Growth Funding
Dividend Policy
•
Issued $700M in debt in the form of $300M Term
Loan and $400M Senior Notes
•
Repaid intercompany payable to Sunoco of $575 million with
balance of the net proceeds retained for general corporate purposes
•
Sufficient liquidity (cash and undrawn revolver) to
support growth strategy and allow opportunistic
acquisitions
•
Will continue to invest operating cash flows into
expansion projects
•
Dividends or share buybacks not considered at this
time |
 19
Near-term Growth Drivers (2012/2013)
Middletown
•
On track for start-up in Q4
Indiana Harbor
•
No anticipated contractual production shortfall in 2012/2013
•
$50M –
$100M estimated spending to support contract extension
•
Contract renewal negotiations in process
Coal Expansion
•
Addressing tight labor market challenges
•
Expect to reach 350K tons annualized rate in 2012 and 500K annualized
rate by mid-2013
•
Executed contract mining agreement with Revelation Energy, LLC to
mine approximately 1.3 million tons of surface reserves over 3 years
|
 20
Long-term Growth Drivers (2013 and Beyond)
International
–
Brazil, China and India
•
Steel is growing in emerging economies, led by China and India
•
India is attractive for us given expected growth in primary coke
demand and coke supply/demand balance
•
Memorandum of Understanding with Global Coke
Next U.S. Coke Plant
•
Permitting process in Kentucky underway
•
Also assessing alternative sites in other states
•
Expect plant to be 1.1 million tons in capacity with portion reserved for
market coke sales
•
Engineering design targeting CAPEX/ton reductions over Middletown
|
 21
Appendix |
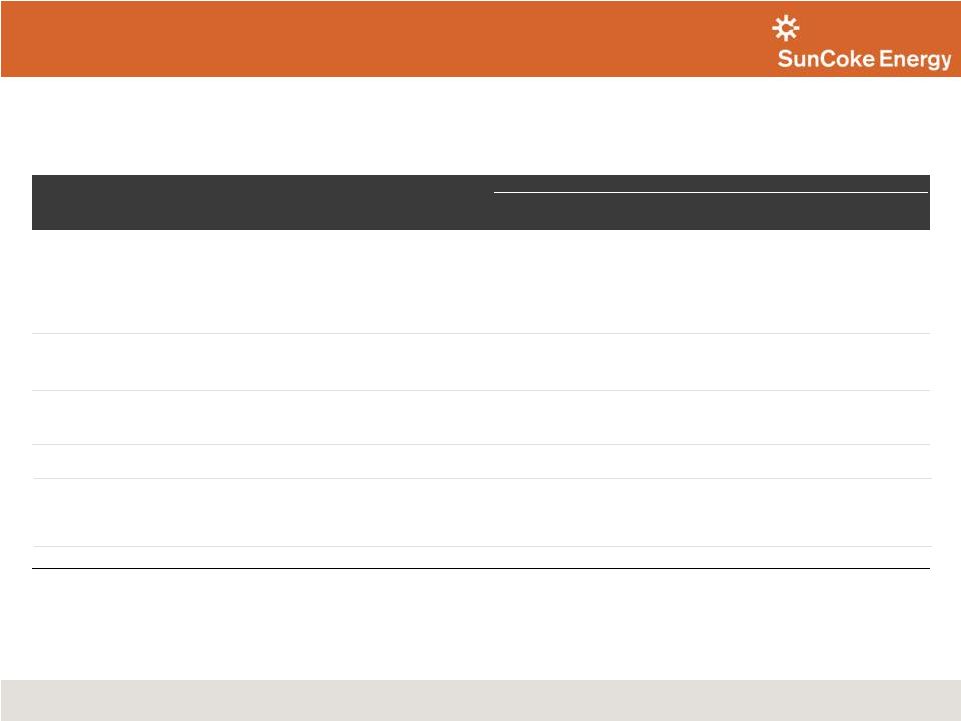
 22
Management Team
Name
Position
Years of
experience
Previous experience
Fritz Henderson
Chief Executive Officer
26
General Motors
Michael Thomson
President and Chief Operating Officer
28
Public Service Enterprise Group, Corning
Mark Newman
Senior Vice President and Chief Financial
Officer
25
Ally Financial, General Motors
Denise Cade
Senior Vice President, General Counsel
and Corporate Secretary
21
PPG Industries, Shaw Pittman LLP
Matthew McGrath
Senior Vice President, Corporate Strategy
and Business Development
21
Public Service Enterprise Group
Michael White
Senior Vice President, Operations
30
Sunoco, Lyondell-Equistar, Exxon
Jim Mullins
Vice President, Coal Operations
35
Arch Coal, Island Creek Coal
Fay West
Vice President and Controller
19
United Continental, PepsiAmericas
Ryan Osterholm
Director, Finance and Investor Relations
13
Public Service Enterprise Group
SunCoke’s management team represents a combination of deep industry knowledge,
international experience and broad management/technical skills
|
 23
Board of Directors
Name
Affiliation
Employment History
Board affiliations
Fritz Henderson
SunCoke Energy
SunCoke Energy, Inc; General Motors
Compuware Corp.
Alvin Bledsoe
Independent
PricewaterhouseCoopers LLP
Crestwood Midstream Partners
Robert Darnall
Independent
Inland Steel Industries; Ispat North America, Inc.
Stacy Fox
Sunoco
Sunoco, Inc.; Roxbury Group; Collins & Aikman
Corporation
Peter Hamilton
Independent
Brunswick Corporation
Spectra Energy Corp.
Michael Hennigan
Sunoco
Sunoco Logistics Partners L.P.; Sunoco, Inc.
Brian MacDonald
Sunoco
Sunoco, Inc.; Dell, Inc.
Sunoco Logistics and American
Red Cross (Southeastern, PA
chapter)
Charmian Uy
Sunoco
Sunoco, Inc.; American Express; General Motors
Dennis Zeleny
Sunoco
Sunoco, Inc.; Sunoco Logistics Partners L.P.;
Caremark RX, LLC
|
 24
Definitions
•
Adjusted
EBITDA
represents
earnings
before
interest,
taxes,
depreciation,
depletion
and
amortization
(“EBITDA”)
adjusted for sales discounts and the deduction of income attributable to
non-controlling interests in our Indiana Harbor cokemaking
operations.
EBITDA
reflects
sales
discounts
included
as
a
reduction
in
sales
and
other
operating
revenue.
The sales discounts represent the sharing with our customers of a portion of
nonconventional fuels tax credits, which reduce our income tax expense.
However, we believe that our Adjusted EBITDA would be inappropriately penalized if
these
discounts
were
treated
as
a
reduction
of
EBITDA
since
they
represent
sharing
of
a
tax
benefit
which
is
not
included
in EBITDA. Accordingly, in computing Adjusted EBITDA, we have added back these
sales discounts. Our Adjusted EBITDA also reflects the deduction of income
attributable to noncontrolling interest in our Indiana Harbor cokemaking
operations. EBITDA and Adjusted EBITDA do not represent and should not be
considered alternatives to net income or operating income under GAAP and may
not be comparable to other similarly titled measures of other businesses.
Management believes Adjusted EBITDA is an important measure of the operating
performance of the company’s assets and is indicative of the
Company’s ability to generate cash from operations. •
Pro
Forma
Adjusted
EBITDA
represents
Adjusted
EBITDA
adjusted
for
the
ArcelorMittal
settlement
impact
and
coal
transfer price impacts. The Jewell Coke and Coal Mining results have been adjusted
to set the internal transfer price to equal the coal component contract
price in Jewell Coke’s coke sales price for coal sales volumes sold to Jewell Coke
under the transfer pricing agreement. Management believes Pro Forma Adjusted
EBITDA provides transparency into the underlying profitability of
these respective segments for the periods presented. |
 25
Reconciliations
($ in million, except where indicated)
(1)
Pro forma impact from equalizing coal transfer price to Jewell Coke with Jewell Coke coal cost
component. Assumes coal-to-coke yield of 68%. Jewell
Coke
Other
Domestic Coke
International
Coke
Coal
Mining
Corporate
and Other
Total
Net Income
$146
Add: Depreciation, Depletion and Amortization
48
Subtract: Interest Income (Primarily from Affiliates)
(24)
5
Subtract: Capitalized Interest
(1)
Add (Subtract): Income Tax Expense (Benefit)
47
EBITDA
$151
$74
$15
($4)
($14)
$222
–
12
–
–
–
12
–
(7)
–
–
–
(7)
Adjusted EBITDA
$151
$79
$15
($4)
($14)
$227
Add (Subtract): Pro Forma Impact of ArcelorMittal Settlement
(78)
18
–
–
–
(60)
4
13
–
–
–
16
(1)
(28)
–
–
28
–
–
Pro Forma Adjusted EBITDA
$49
$109
$15
$24
($14)
$184
Sales Volumes (thousands of tons)
721
2,917
–
1,277
–
Pro Forma Adjusted EBITDA per Ton ($ per ton)
$69
$37
$19
Operating Income (Loss)
$147
$39
$15
($11)
($15)
$174
Add: Depreciation, Depletion and Amortization
4
35
0
8
1
48
EBITDA
$151
$74
$15
($4)
($14)
$222
Fiscal year ended December 31, 2010
Add: Sales Discounts Provided to Customers Due to Sharing of Nonconventional Fuels Tax Credits
Add (Subtract): Net (Income) Loss Attributable to Noncontrolling Interests
Add: Interest Cost – Affiliate
Add: Legal and Settlement Charges Related to ArcelorMittal Settlement and Indiana Harbor
Arbitration Add (Subtract): Pro Forma Coal Transfer Price Impact |
 26
Reconciliations (Cont’d)
($ in million, except where indicated)
(1)
Pro forma impact from equalizing coal transfer price to Jewell Coke with Jewell Coke coal cost
component. Assumes coal-to-coke yield of 68%. Jewell
Coke
Other
Domestic Coke
International
Coke
Coal
Mining
Corporate
and Other
Total
Net Income
$211
Add: Depreciation, Depletion and Amortization
32
Subtract: Interest Income (Primarily from Affiliates)
(25)
6
Subtract: Capitalized Interest
(1)
Add (Subtract): Income Tax Expense (Benefit)
21
EBITDA
$182
$36
$23
$11
($9)
$244
–
8
–
–
–
8
–
(22)
–
–
–
(22)
Adjusted EBITDA
$182
$23
$23
$11
($9)
$230
Add (Subtract): Pro Forma Impact of ArcelorMittal Settlement
(84)
13
–
–
–
(71)
(1)
(58)
–
–
58
–
–
Pro Forma Adjusted EBITDA
$41
$36
$23
$69
($9)
$159
Sales Volumes (thousands of tons)
694
2,119
1,214
Pro Forma EBITDA per Ton ($ per ton)
$59
$17
$56
Operating Income (Loss)
$178
$15
$23
$5
($9)
$212
Add: Depreciation, Depletion and Amortization
5
22
0
6
0
32
EBITDA
$182
$36
$23
$11
($9)
$244
Fiscal year ended December 31, 2009
Add: Sales Discounts Provided to Customers Due to Sharing of Nonconventional Fuels Tax Credits
Add (Subtract): Net (Income) Loss Attributable to Noncontrolling Interests
Add: Interest Cost – Affiliate
Add (Subtract): Pro Forma Coal Transfer Price Impact |
 27
Reconciliations (Cont’d)
($ in million, except where indicated)
(1)
Pro forma impact from equalizing coal transfer price to Jewell Coke with Jewell Coke coal cost
component. Assumes coal-to-coke yield of 68%. Fiscal year ended December 31,
2008 Jewell
Coke
Other
Domestic Coke
International
Coke
Coal
Mining
Corporate
and Other
Total
Net Income
$133
Add: Depreciation, Depletion and Amortization
25
Subtract: Interest Income (Primarily from Affiliates)
(28)
11
Subtract: Capitalized Interest
(4)
Add (Subtract): Income Tax Expense (Benefit)
38
EBITDA
$119
$50
$5
$14
($13)
$175
–
1
–
–
–
1
–
(19)
–
–
–
(19)
Adjusted EBITDA
$119
$32
$5
$14
($13)
$157
Add (Subtract): Pro Forma Impact of ArcelorMittal Settlement
(56)
16
–
–
–
(40)
Add (Subtract): Pro Forma Coal Transfer Price Impact
(1)
(17)
–
–
17
–
–
Pro Forma Adjusted EBITDA
$46
$48
$5
$31
($13)
$117
Sales Volumes (thousands of tons)
727
1,901
1,233
Pro Forma Adjusted EBITDA per Ton ($ per ton)
$63
$25
$25
Operating Income (Loss)
$114
$35
$5
$10
($13)
$151
Add: Depreciation, Depletion and Amortization
5
15
0
4
0
25
EBITDA
$119
$50
$5
$14
($13)
$175
Add: Sales Discounts Provided to Customers Due to Sharing of Nonconventional Fuels Tax Credits
Add (Subtract): Net (Income) Loss Attributable to Noncontrolling Interests
Add: Interest Cost – Affiliate |
 28
Reconciliations (Cont’d)
Jewell Coke
Other
Domestic Coke
International
Coke
Coal Mining
Corporate
and Other
Total
Net Income
$23,993
Add: depreciation, depletion and amortization
14,605
Subtract: interest income (primarily from affiliates)
(5,763)
1,723
Subtract: capitalized interest
(399)
Add (Subtract): income tax expense (benefit)
1,881
EBITDA
$12,892
$23,695
$843
$9,144
($10,534)
$36,040
Add: sales discounts provided to customers due to sharing of nonconventional fuels tax
credits 3,174
3,174
(1,573)
(1,573)
Adjusted EBITDA
$12,892
$25,296
$843
$9,144
($10,534)
$37,641
Add (Subtract): coal transfer price impact
(2,334)
2,334
-
Pro Forma Adjusted EBITDA without coal transfer impact
$10,558
$25,296
$843
$11,478
($10,534)
$37,641
Sales Volumes (thousands of tons)
170
757
412
334
Pro Forma Adjusted EBITDA per Ton
$62
$33
$34
Operating Income (Loss)
$11,559
$14,059
$788
$5,964
($10,935)
$21,435
Add: Depreciation, Depletion and Amortization
1,333
9,636
55
3,180
401
14,605
EBITDA
$12,892
$23,695
$843
$9,144
($10,534)
$36,040
For the Three Months Ended June 30, 2011 (Unaudited)
($ in million, except where indicated)
Add (Subtract): net (income) loss attributable to noncontrolling interests
Add:
interest
cost -
affiliate |
 29
Reconciliations (Cont’d)
Jewell Coke
Other
Domestic Coke
International
Coke
Coal Mining
Corporate
and Other
Total
Net Income
$47,550
Add: depreciation, depletion and amortization
11,107
Subtract: interest income (primarily from affiliates)
(6,039)
Add:
interest
1,701
Subtract: capitalized interest
(127)
Add (Subtract): income tax expense (benefit)
14,774
EBITDA
$53,044
$18,716
$7
$107
($2,908)
$68,966
2,980
2,980
(3,256)
(3,256)
Adjusted EBITDA
$53,044
$18,440
$7
$107
($2,908)
$68,690
Add (Subtract): pro forma impact of ArcelorMittal settlement
(23,600)
4,300
(19,300)
Add (Subtract): coal transfer price impact
(15,219)
15,219
-
Pro Forma Adjusted EBITDA without ArcelorMittal settlement and coal transfer price impact
$22,740
$7
$15,326
($2,908)
$49,390
Sales Volumes (thousands of tons)
191
718
422
314
Pro Forma Adjusted EBITDA per Ton
$74
$32
$49
Operating Income (Loss)
$51,945
$10,793
($18)
($1,818)
($3,043)
$57,859
Add: Depreciation, Depletion and Amortization
1,099
7,923
25
1,925
135
11,107
EBITDA
$53,044
$18,716
$7
$107
($2,908)
$68,966
For the Three Months Ended June 30, 2010 (Unaudited)
$14,225
($ in million, except where indicated)
Add (subtract): net (income ) loss attributable to noncontrolling interests
Add: sales discounts provided to customers due to sharing of nonconventional fuels tax
credits cost -
affiliate |
 30
($ in million, except where indicated)
Reconciliations (Cont’d)
Jewell Coke
Other
Domestic Coke
International
Coke
Coal Mining
Corporate
and Other
Total
Net Income
$5,655
Add: depreciation, depletion and amortization
13,020
Subtract: interest income (primarily from affiliates)
(5,717)
1,500
Subtract: capitalized interest
(312)
Add (Subtract): income tax expense (benefit)
3,139
EBITDA
$19,054
($857)
$988
$4,296
($6,196)
$17,285
Add: sales discounts provided to customers due to sharing of nonconventional fuels tax
credits 3,125
3,125
6,171
6,171
Adjusted EBITDA
$19,054
$8,439
$988
$4,296
($6,196)
$26,581
Add (Subtract): coal transfer price impact
(8,042)
8,042
-
Pro Forma Adjusted EBITDA without coal transfer price impact
$11,012
$8,439
$988
$12,338
($6,196)
$26,581
Sales Volumes (thousands of tons)
175
697
362
386
Pro Forma Adjusted EBITDA per Ton
$63
$12
$32
Operating Income (Loss)
$17,953
($9,472)
$935
$1,577
($6,728)
$4,265
Add: Depreciation, Depletion and Amortization
1,101
8,615
53
2,719
532
13,020
EBITDA
$19,054
($857)
$988
$4,296
($6,196)
$17,285
For the Three Months Ended March 31, 2011 (Unaudited)
Add:
interest
cost -
affiliate
Add (Subtract): net (income) loss attributable to noncontrolling interests
|