Attached files
Table of Contents
UNITED STATES
SECURITIES AND EXCHANGE COMMISSION
Washington, DC 20549
FORM 10-K
| þ | ANNUAL REPORT UNDER SECTION 13 OR 15(d) OF THE SECURITIES EXCHANGE ACT OF 1934 |
For the fiscal year ended June 30, 2011
OR
| ¨ | TRANSITION REPORT UNDER SECTION 13 OR 15(d) OF THE SECURITIES EXCHANGE ACT OF 1934 |
For the transition period from to
Commission File No. 0-51838
Global Traffic Network, Inc.
(Exact Name of Registrant as Specified in Its Charter)
| Nevada | 33-1117834 | |
| (State or other jurisdiction of incorporation or organization) |
(I.R.S. Employer Identification No.) |
880 Third Avenue, 6th Floor
New York, New York 10022
(Address of principal executive offices)(Zip Code)
(212) 896-1255
(Registrant’s telephone number, including area code)
Securities registered pursuant to Section 12(b) of the Act:
| Title of Each Class: |
Name of Each Exchange on which Registered: | |
| Common Stock, $.001 par value | The Nasdaq Stock Market |
Indicate by check mark if the registrant is a well-known seasoned issuer, as defined in Rule 405 of the Securities Act. Yes ¨ No þ
Indicate by check mark if the registrant is not required to file reports pursuant to Section 13 or Section 15(d) of the Act. Yes ¨ No þ
Indicate by check mark whether the registrant (1) has filed all reports required to be filed by Section 13 or 15(d) of the Securities Exchange Act of 1934 during the preceding 12 months (or for such shorter period that the registrant was required to file such reports), and (2) has been subject to such filing requirements for the past 90 days. Yes þ No ¨
Indicate by check mark whether the registrant has submitted electronically and posted on its corporate Web site, if any, every Interactive Data File required to be submitted and posted pursuant to Rule 405 of Regulation S-T during the preceding 12 months (or for such shorter period that the registrant was required to submit and post such files). Yes þ No ¨
Indicate by check mark if disclosure of delinquent filers pursuant to Item 405 of Regulation S-K is not contained herein, and will not be contained, to the best of registrant’s knowledge, in definitive proxy or information statements incorporated by reference in Part III of this Form 10-K or any amendment to this Form 10-K. ¨
Indicate by check mark whether the registrant is a large accelerated filer, an accelerated filer, a non-accelerated filer, or a smaller reporting company. See the definitions of “large accelerated filer,” “accelerated filer” and “smaller reporting company” in Rule 12b-2 of the Exchange Act. (Check one):
| Large accelerated filer | ¨ | Accelerated filer | þ | |||
| Non-accelerated filer | ¨ (Do not check if a smaller reporting company) | Smaller reporting company | ¨ | |||
Indicate by check mark whether the registrant is a shell company (as defined in Rule 12b-2 of the Exchange Act). Yes ¨ No þ
The aggregate market value of common stock held by non-affiliates of the registrant was approximately $103.2 million as of December 31, 2010 (the last business day of the registrant’s most recently completed second quarter), assuming solely for the purpose of this calculation that all directors, officers and more than 10% stockholders of the registrant are affiliates. The determination of affiliate status for this purpose is not necessarily conclusive for any other purpose.
As of September 12, 2011, the registrant had 19,060,350 shares of common stock outstanding.
Table of Contents
| 1 | ||||
| 1 | ||||
| 10 | ||||
| 21 | ||||
| 21 | ||||
| 22 | ||||
| 22 | ||||
| 22 | ||||
| 22 | ||||
| 24 | ||||
| Item 7. Management’s Discussion and Analysis of Financial Condition and Results of Operations |
25 | |||
| Item 7A. Qualitative and Quantitative Disclosures about Market Risk |
36 | |||
| 37 | ||||
| Item 9. Changes In and Disagreements with Accountants on Accounting and Financial Disclosure |
37 | |||
| 37 | ||||
| 38 | ||||
| 38 | ||||
| Item 10. Directors, Executive Officers and Corporate Governance |
38 | |||
| 41 | ||||
| 56 | ||||
| Item 13. Certain Relationships and Related Transactions, and Director Independence |
58 | |||
| 59 | ||||
| 60 | ||||
| 60 | ||||
| 62 | ||||
| Subsidiaries |
||||
| Consent of BDO Audit (NSW-VIC) Pty Ltd |
||||
| 302 Certification of Chief Executive Officer |
||||
| 302 Certification of Chief Financial Officer |
||||
| Section 906 Certifications of CEO and CFO |
||||
| Press Release |
||||
| EX-21.1 |
||||
| EX-23.1 |
||||
| EX-31.1 |
||||
| EX-31.2 |
||||
| EX-32.1 |
||||
| EX-99.1 |
||||
Table of Contents
Our Company and Its Subsidiaries
Global Traffic Network, Inc. (“Global Delaware”) was a Delaware corporation formed on May 16, 2005 to be a holding company. On December 12, 2007, Global Delaware formed a wholly owned subsidiary, Global Traffic Network, Inc., a Nevada corporation (“Global Nevada”), for the purpose of changing Global Delaware’s state of incorporation from Delaware to Nevada. The re-incorporation was completed on February 26, 2008 when Global Delaware merged with and into Global Nevada, with Global Nevada remaining as the surviving corporation. All references in this report to “we”, “us”, “our”, “our company” and “the Company” pertain to Global Delaware for time periods from its formation until the merger and to Global Nevada for time periods following the merger. Our direct and indirect wholly-owned subsidiaries include The Australia Traffic Network Pty Limited, an Australian proprietary company organized on June 20, 1997 and registered under the Corporations Act of Australia, Global Traffic Canada, Inc., a Delaware corporation incorporated on May 20, 2005, Canadian Traffic Network ULC, an Alberta business corporation formed on July 5, 2005, Global Traffic Network (UK) Limited, a private company limited by shares incorporated in England and Wales on October 19, 2006, Global Traffic Network (UK) Commercial Limited, a private company limited by shares incorporated in England and Wales which we acquired effective March 1, 2009 (formerly The Unique Broadcasting Company Limited) and Global Alert Network, Inc., a Nevada corporation incorporated on March 7, 2008. Prior to October 12, 2010, Global Alert Network, Inc. was named Mobile Traffic Network, Inc. We refer to these entities throughout this report as “Australia Traffic Network”, “Global Canada”, “Canadian Traffic Network”, “UK Traffic Network”, “UK Commercial Traffic Network” and “Global Alert Network”, respectively.
Prior to our initial public offering, Australia Traffic Network, our wholly-owned Australian operating subsidiary, was a separate entity controlled by the same shareholder base that controlled us immediately prior to such initial public offering. On March 23, 2006, the effective date of our initial public offering, and pursuant to a Securities Exchange Agreement (the “Securities Exchange Agreement”) dated December 13, 2005 among us, Australia Traffic Network and the holders of all of the outstanding ordinary shares of Australia Traffic Network, we exchanged 4,000,000 shares of our common stock and issued an aggregate of $1.4 million in promissory notes to the shareholders of Australia Traffic Network for all of the outstanding ordinary shares of Australia Traffic Network. We refer to this transaction throughout this report as the “Share Exchange.” As a result of the Share Exchange, Australia Traffic Network became our wholly-owned subsidiary. The promissory notes issued in the Share Exchange (the “Share Exchange Notes”), which were intended to cover the estimated tax consequences to the Australia Traffic Network shareholders of the Share Exchange, were paid in their entirety on March 29, 2006, the closing date of our initial public offering, out of the net proceeds from the initial public offering.
References in this report to time periods prior to the May 16, 2005 establishment of Global Traffic Network, Inc. pertain solely to operations of Australia Traffic Network.
On August 2, 2011, we entered into a definitive agreement (the “Merger Agreement”) to be acquired by an affiliate of GTCR, LLC (“GTCR”). Under the terms of the Merger Agreement, GTCR Gridlock Holdings, Inc., a newly formed entity affiliated with GTCR, commenced a tender offer on August 9, 2011 to acquire all of our outstanding common stock for $14.00 per share in cash (the “Offer”), to be followed by a merger (the “Merger”) to acquire all remaining outstanding shares at the same price paid in the Offer. Under the Merger Agreement, in general, the Company is permitted, under a “go-shop” provision, to solicit, provide information to, and engage in discussions with, third parties with respect to alternative acquisition proposals until September 13, 2011. Subject to certain requirements of the Merger Agreement, the Company may negotiate with parties that submit qualifying competing proposals during the initial solicitation period for a period expiring on October 1, 2011. The Offer is required to remain open until the completion of the solicitation period, and if applicable, the subsequent negotiation period. The completion of the Offer and Merger are subject to certain conditions (including, with respect to the Offer, a “minimum condition” that requires there to be tendered and not withdrawn a number of shares that represents at least a majority of the shares of Company common stock then issued and outstanding, excluding from such calculation shares held by the Company’s executive officers) and termination rights set forth in the Merger Agreement. The transactions contemplated by the Merger Agreement are expected to be completed by the fourth quarter of 2011. See “Item 1A —Risk Factors.” The statements in this Annual Report on Form 10-K are not a solicitation or recommendation of the Company to its shareholders in connection with the proposed Offer, and shareholders should carefully review the Solicitation/Recommendation Statement on Schedule 14D-9 filed by the Company on August 9, 2011 and any amendments thereto before making any decision as to the Offer because such documents contain important information about the Offer, the Merger and other transactions contemplated by the Merger Agreement. The Solicitation/Recommendation Statement on Schedule 14D-9 and the amendments thereto are available, without charge, at the SEC’s internet site (http://www.sec.gov) or by directing a request to Global Traffic Network, Inc., Attention: Investor Relations, Phil Carlson, KCSA Strategic Communications, 880 Third Avenue 6th Floor, New York, NY 10022, pcarlson@kcsa.com, or on the Company’s website at (www.globaltrafficnetwork.com).
Overview of Our Business
We provide traffic and news information reports to radio and television stations in international markets. We are the largest provider of traffic information reports to radio stations in Australia, Canada and the United Kingdom. We also provide television traffic reports in Australia and Canada, radio entertainment news reports in the United Kingdom and we believe that we maintain the largest inventory of commercial advertising embedded in radio news reports in Australia. We derive the substantial majority of our revenues from the sale to advertisers of commercial advertising inventory embedded within these information reports. We obtain our advertising inventory from radio and television stations in exchange for providing them with information reports and/or cash compensation. We provide broadcasters in international markets a cost-effective alternative to gathering and delivering their own traffic and news information reports and offer advertisers an efficient, broad-reaching alternative to that offered by traditional radio and television stations. In the United Kingdom, in addition to the sale of commercial advertising inventory, we also generated revenue by providing services to the United Kingdom’s Highways Agency under a Traffic Radio Services Contract that is discussed below under “UK Traffic Network.” This agreement terminated August 31, 2011.
1
Table of Contents
| • | Australia Traffic Network. We began providing traffic reports to radio stations in Australia in 1997 and currently deliver traffic reports to radio stations and traffic reports, video and other services to television stations in Australia. In July 2005, we began leveraging our radio traffic reporting services as a platform to launch advertising embedded in news reports on radio stations in Australia. |
According to AC Nielsen, our Australian information reports have a weekly reach of approximately 10 million radio listeners (ages ten and over), which represents almost 100% of the commercial radio listeners throughout the five major Australian markets. According to OzTAM, our TV reports reach approximately 5.3 million television viewers (ages 13 and over), also throughout the five major Australian markets.
The number of Australian network affiliate stations from which we receive advertising inventory and the number of Australian markets in which we operate are set forth below:
| Australia | Number of Affiliate Stations |
Number of Markets |
||||||
| Radio traffic reports |
85 | 19 | ||||||
| Radio news reports |
32 | 7 | ||||||
| TV reports |
14 | 7 | ||||||
We also provide traffic reports to approximately 79 stations on the ABC radio network, which is the public, non-commercial radio network in Australia. Although we are acknowledged as the source of the traffic reports we provide to the ABC stations, the stations are not included in the table above or any other analysis contained in this report because we receive no advertising inventory from the ABC stations due to the non-commercial nature of their broadcast operations.
We conduct our Australian business operations through Australia Traffic Network, which became our wholly-owned subsidiary as a result of the Share Exchange.
| • | Canadian Traffic Network. We began delivering traffic reports to radio stations in Canada in December 2005 and we currently deliver traffic reports to approximately 81 radio stations and four television stations. We are currently in the process of eliminating our news, weather, sports and business service since the stations that we provided the reports to are not significant to our network. According to BBM Canada, the Canadian industry consortium for audience ratings, our Canadian information reports have a weekly reach of approximately 20.3 million radio listeners (ages 18 and over), which represents approximately 75% of the commercial radio listeners in the markets we serve. BBM has recently replaced the traditional diary method of audience measurement with the portable people meter, an electronic measurement in five of our largest markets. This has caused significant changes in the estimate of audience and thus the current audience estimates for our Canadian operations may not be comparable to previously published estimates. Our TV Network in Canada has a weekly reach of more than 2.6 million television viewers (ages 18 and over), which represents approximately 9% of commercial television viewers in Canada. |
The number of Canadian network affiliate stations from which we receive advertising inventory and the number of Canadian markets in which we operate are set forth below:
| Canada | Number of Affiliate Stations |
Number of Markets |
||||||
| Radio traffic reports |
81 | 8 | ||||||
| TV reports |
4 | 4 | ||||||
We intend to add TV reports in our remaining Canadian markets should opportunities present themselves.
We conduct our Canadian business operations through Canadian Traffic Network, our indirect wholly-owned subsidiary.
| • | UK Traffic Network. On March 1, 2009, our wholly owned subsidiary, UK Traffic Network, acquired all the outstanding share capital of The Unique Broadcasting Company Limited (“Unique”) from UBC Media Group plc (“UBC”), for a total purchase price of approximately £11.2 million (approximately $16.5 million), including amounts paid to satisfy a closing date working capital adjustment and in settlement of contingent cash “earn-out” compensation that UBC would have been entitled based upon the financial performance of the acquired business during the 2009, 2010 and 2011 calendar years. Unique owned UBC’s Commercial Division operations that supplied traffic and travel information and entertainment news information to radio stations in the United Kingdom in exchange for commercial airtime inventory that is then sold to advertisers. The acquisition was accomplished through the purchase of the entire share capital of Unique, which we have subsequently renamed Global Traffic Network (UK) Commercial Limited (“UK Commercial Traffic Network”). |
2
Table of Contents
We currently provide radio traffic reporting services and/or radio entertainment news reports to approximately 239 radio stations in the United Kingdom. According to RAJAR, our information reports have a weekly reach of approximately 26 million commercial radio listeners aged 15 and over, representing approximately 77% of all commercial radio listenership. Currently, we only sell advertising embedded in our traffic and entertainment news reports on a national basis.
The number of United Kingdom network affiliate stations from which we receive advertising inventory is set forth below:
| United Kingdom | Number Of Stations |
|||
| Radio traffic reports |
239 | |||
| Radio entertainment news reports |
126 | |||
The number of our traffic network affiliates in the UK has decreased from the prior period primarily due to a decision by Global Radio Services to consolidate a number of their Heart and Gold branded radio stations by simulcasting their programming over multiple stations that had previously been programmed on a standalone basis. This had the effect of us having fewer network affiliates each with a larger audience. The overall audience delivery was not significantly impacted therefore the consolidation of radio stations had no impact on our revenue potential in the United Kingdom market.
Prior to the Unique acquisition, substantially all of our United Kingdom revenue was produced under a Traffic Radio service contract with the United Kingdom’s Highways Agency, which is an executive agency of the United Kingdom Department for Transport responsible for operating, maintaining and improving the strategic trunk road network in England on behalf of the Secretary of State for Transport. Under the terms of the agreement, which became effective July 1, 2008, UK Traffic Network provided traffic radio reports via digital audio broadcasting stations throughout England. The initial term of the contract expired on August 31, 2011 and was not renewed due to budgetary constraints of the Highways Agency. The annual revenue associated with the contract at June 30, 2011 was approximately £2.5 million (or approximately $4.0 million) and the annual profit attributable to the contract was approximately £0.5 million (or approximately $0.8 million). Although similar to our core business in that it involved broadcasting traffic reports over radio stations, our contract with the Highways Agency differed in that it was not advertising supported. Rather we were paid a fee by the Highways Agency to provide our Traffic Radio service.
Our commercial advertising inventory, which is primarily comprised of ten second advertising spots embedded in information reports that are broadcast on radio or television, is generally sold as advertising packages on a local, regional or national network basis. Our commercial advertising inventory in the United Kingdom currently differs in that it is generally 20 to 60 seconds in length (with 30 seconds and 40 seconds being the most prevalent length) and is only sold on a national basis. We market our advertising packages on a percentage-based rotation. Each advertiser receives its pro rata share of our aggregate advertising inventory, which airs primarily during prime morning and afternoon drive periods. Because we sell our commercial advertising inventory exclusively on a network basis, rather than station by station, we are able to offer advertisers a cost-effective, broad-based advertising vehicle that reaches mass audiences. Since July 1, 2010, our advertising customers have included nine of the top ten Australian advertisers and 18 of the top 20 global advertisers, each as published by AdvertisingAge.
We formed Global Alert Network to pursue business opportunities related to a mobile phone passive alerting technology. The technology is designed to provide location aware information, for instance traffic reports, that can be disseminated to users based on their proximity to the content of the report (for example, a report may be sent as a subscriber approaches a traffic incident). Information is disseminated to users in the form of audio files, which are automatically played, obviating the need for users to interact with their mobile phones in any manner. To date, Global Alert Network’s operations have generated insignificant revenue.
Industry Background and Trends
Radio and television stations generally attempt to attract listeners and viewers by selecting a style of programming that appeal to a target listening or viewing audience. Although there are many programming formats, broadcasters across a variety of formats recognize that traffic and news reports appeal to a wide range of audiences. Because there can be substantial expenses involved in preparing and delivering traffic and news reports, many broadcasters have elected to outsource the preparation and delivery of these reports to third parties that specialize in packaging such information. Outsourcing companies are often able to provide better information in a more cost-effective manner, which allows broadcasters to focus on improving service to its listeners or viewers, reduce costs, and improve profitability.
The media advertising market has experienced many changes and innovations in recent years, particularly the introduction and rising popularity of non-traditional media outlets such as internet, broadband wireless, cable television, satellite television and radio, as well as consumer products, such as portable digital audio players, personal digital video recorders and mobile telephones. Although advertisers continue to seek out radio and television audiences, audiences are more fragmented and traditional broadcasters increasingly compete with these additional media platforms. This trend has resulted in more mature advertising markets with limited or no growth, which increases the pressure on traditional broadcasters to manage their operations and expenses in a cost-effective manner.
3
Table of Contents
The fragmentation of media markets also poses a challenge to advertisers. Although innovations in non-traditional media provide advertisers with additional platforms with which they can reach consumers, the rising number of media platforms creates increasingly segmented audiences that make it difficult for advertisers, especially large companies that rely on national or global brand recognition, to reach the broad-based audiences that they desire. Advertisers are increasingly looking for a return on investment for each advertising dollar spent that is generally measured by the audience reach of their chosen advertising media and the advertisers’ target demographics within those media.
We believe that the advertising markets in the countries in which we operate are up slightly from the previous fiscal year when taken in aggregate. Nonetheless, our advertising revenue for the fiscal year ended June 30, 2011 (when measured in local currencies) exceeded revenue from the fiscal year ended June 30, 2010 in all the markets in which we operate and we believe that our revenue growth rate significantly exceeded that of each of the markets in which we operate.
Our Business Model, Products and Services
We are well positioned to capitalize on the desire of radio and television broadcasters to deliver traffic information to audiences in a cost-effective manner and the desire of advertisers to reach a broad, demographically diverse audience using the traditional media of radio and television.
We believe that our business model addresses the needs of multiple constituencies. We are the largest provider of traffic information reports to radio stations in Australia, Canada and the United Kingdom and we believe that we maintain the largest inventory of commercial advertising embedded in radio news reports in Australia. Our large inventory of network-based advertising allows advertisers to reach a broad, demographically diverse audience using the traditional media of radio and television. For broadcasters, we facilitate the delivery of traffic and news information to audiences in a cost-effective manner.
We embed our advertisements within information reports such that advertisers’ messages are broadcast along with regularly scheduled programming primarily during peak morning and afternoon drive times when a majority of the radio audience is listening. Because the advertisements within the information reports are generally read live by on-air broadcasters (except in the United Kingdom, where they are pre-produced) and the reports are actively sought out by listeners, we believe the advertisements embedded in the information reports are less likely to be avoided by a listener or viewer changing stations or “tuning out” than traditional advertising messages.
The radio stations that receive radio traffic reports and radio news reports become members of our Radio Network. Likewise, the television stations that receive TV reports become members of our TV Network. Collectively, we refer to members of these networks as our network affiliates.
Preparation of Information Reports
We gather traffic data utilizing our information-gathering infrastructure which includes helicopters, airplanes, scanners, station listener lines and cellular phones. Traffic information is also gathered through various government-based traffic tracking systems and other services, including remote camera systems positioned at strategically located ground positions. The information is processed, written into broadcast copy and entered into computer systems by local writers and producers. Professional broadcasters then read the customized reports on the air. Our TV reports are compiled using a similar infrastructure, which is supplemented in certain markets by video footage obtained from remote omni-directional camera systems that are positioned on our aircraft. In the United Kingdom, our radio station traffic network affiliates receive their information from a third party that we compensate. With the exception of the use of aviation, this third party uses information gathering techniques that are similar to the techniques used by us.
We currently obtain our Australian radio news advertising inventory from our news network affiliates in exchange for cash compensation. References to the provision of news reports in Australia throughout this report refers to our purchase from radio stations of news advertising inventory embedded in news reports that we then make available to our advertisers. We purchase our radio entertainment news information in the United Kingdom from a third party that provides the information reports directly to radio stations for broadcast in which our advertising commercials are embedded.
Our information-gathering infrastructure and the flexibility created by our ability to collect traffic information and thereby provide our services 24 hours per day, seven days per week in certain markets to our network affiliates enables us to respond to changing conditions and enables our network affiliates to provide their listeners with accurate and up-to-the-minute news and traffic information. For example, we responded to numerous radio and television station requests by providing to radio and television stations throughout our markets and the world video coverage and reports on the May 2010 M5 tunnel collapse in Sydney, the March 2010 Queensland floods, the landslide in Oliver, British Columbia in June 2010 and the royal visit to Canada in the summer of 2011.
As a result of our extensive network of operations and broadcasters, we often report important news stories and provide our network affiliates with live coverage of these stories. We are able to customize and personalize our reports of breaking stories using our network affiliates’ call letters from the scene of news events.
We believe that our aircraft and other information-gathering technology and broadcast equipment enable us to provide high quality programming, which allows us to retain and expand our base of network affiliates. The table below outlines our fleet of owned and leased aircraft.
4
Table of Contents
| United Kingdom | Australia | Canada | ||||||||||||||||||||||
| Leased | Owned | Leased | Owned | Leased | Owned | |||||||||||||||||||
| Fixed Wing Aircraft |
0 | 1 | (1) | 1 | 1 | 1 | 1 | |||||||||||||||||
| Helicopters |
0 | 0 | 0 | 4 | 0 | 6 | ||||||||||||||||||
| (1) | Includes fixed wing aircraft owned by UK Traffic Network that is no longer in service and is being held for sale. |
We currently utilize 13 broadcast studios in Australia and seven broadcast studios throughout Canada. In addition, our out-source traffic provider in the United Kingdom operates approximately six broadcast studios throughout the United Kingdom.
Delivery of Our Information Reports
We provide daily scheduled customized information reports to network affiliates. Our information reports in Australia and Canada generally utilize our own on-air broadcasters. In the United Kingdom, however, we generally either utilize pre-produced traffic reports voiced by our out-source provider’s broadcasters or our out-source provider furnishes traffic information to our radio network affiliates that use such information to produce their own traffic reports. We customize our information reports to meet each network affiliate’s requirements as to the number of reports broadcast per day, the time of the broadcast, the length and content of the report, including the geographic area covered by the report. We typically work closely with our network affiliates’ program directors, news directors, and general managers to ensure that our information reports meet their specifications and quality standards. Our network affiliates participate in the selection of the on-air broadcasters for their stations to ensure that each broadcaster’s style is appropriate for their stations’ formats. Our broadcasters often become integral “on-air personalities” on our network affiliates’ stations as a result of their on-air presence and interaction with the stations’ on-air personnel. In order to realize operating efficiencies, we endeavor to utilize our professional broadcasters on multiple stations within a particular market. Generally, each of our broadcasters delivers information reports to between two and four of our network affiliates, although we do provide exclusive talent for certain network affiliates or commonly owned network affiliates.
Due to the customized nature of our information reports and the fact that we do not require network affiliates to identify us as the supplier of the information reports, each network affiliate may present the information reports we provide as if the network affiliate had generated such information report with its own resources. As a result, multiple network affiliates in a single market may intimate that the helicopters, fixed-wing aircraft and on-air broadcasters are those of the network affiliate.
Significant Network Affiliates
Austereo Pty Limited (“Austereo”). Austereo, one of our Australian network affiliates, is the largest radio broadcaster in Australia and, as of June 30, 2011, provided us with approximately 18% of our Australian radio commercial advertising inventory. When sold to advertisers, this commercial advertising inventory accounts for a material amount of our Australian revenues. This radio commercial advertising inventory is supplied pursuant to a four year agreement effective July 1, 2008 under which we provide regularly-scheduled radio traffic reports to, and receive radio traffic report and radio news report inventory from, ten Australian radio stations operated by Austereo in Sydney, Melbourne, Brisbane, Adelaide and Perth. In April 2011, Southern Cross Media Group (“Southern Cross”) completed its purchase of Austereo. In addition to the Austereo stations previously discussed, Southern Cross owns eight of our radio network affiliates in Hobart, Sunshine Coast, Gold Coast and Central Coast. These stations comprise approximately 6% of our Australian radio commercial inventory as of June 30, 2011.
Australian Radio Network Pty Limited (“ARN”). ARN, another large radio broadcaster in Australia, provided us approximately 16% of our Australian radio commercial advertising inventory as of June 30, 2011. When sold to advertisers, this commercial advertising inventory accounts for a material amount of our Australian revenues. This inventory is provided pursuant to a four year agreement effective July 1, 2008 to provide traffic reporting services to eleven ARN stations in Sydney, Canberra, Melbourne, Brisbane and Adelaide and an agreement through May 31, 2012 to acquire news radio commercial advertising inventory from eight ARN stations in Sydney, Melbourne, Brisbane and Adelaide.
In addition, ARN and Austereo operate various joint ventures in Canberra (included above) and Newcastle. Stations under these joint ventures not included above account for approximately an additional 1% of our commercial advertising inventory in Australia.
Corus Entertainment Inc. (“Corus”). Effective January 1, 2009, we entered into a four year agreement with Corus, one of the largest radio broadcasters in Canada, to provide radio traffic reports on 24 radio stations throughout seven Canadian markets. Currently we service 18 radio stations under this agreement as Corus ceased broadcasting on two of the contracted stations and sold four additional stations, all in the Montreal radio market. Corus’ stations accounted for approximately 39% of our Canadian advertising inventory (excluding regional suburban stations) as of June 30, 2011. We currently provide traffic reporting services to 19 Corus radio stations.
Global Radio Services Limited (“Global”). We provide traffic reporting services and receive radio commercial advertising inventory on approximately 53 Global radio stations throughout the United Kingdom pursuant to a three year agreement effective November 1, 2010. The agreement may be cancelled prior to the end date by either party upon 90 days prior notice during the period commencing August 31, 2012 and ending October 1, 2012. These Global radio stations accounted for approximately 13% of our United Kingdom radio traffic advertising inventory as of June 30, 2011 and approximately 28% of the traffic network’s advertising delivery (“impacts”). The number of our Global traffic network affiliates in the UK has decreased from the prior period primarily due to a decision by Global to consolidate a number of their Heart and Gold branded radio stations by simulcasting their programming over multiple stations that had previously been programmed on a standalone basis. This had the effect of us having fewer network affiliates each with a larger audience. The overall audience delivery was not significantly impacted therefore the consolidation of the radio stations had no impact on our revenue potential in the United Kingdom market.
Bauer Radio Limited (“Bauer”). We provide traffic reporting services to, and receive radio commercial advertising inventory on, approximately 42 Bauer radio stations throughout the United Kingdom pursuant to a 28 month agreement effective September 1, 2010. The Bauer radio stations accounted for approximately 19% of our United Kingdom radio traffic advertising inventory as of June 30, 2011 and
5
Table of Contents
approximately 24% of the traffic network’s impacts. We also provide entertainment news reporting services to, and receive radio commercial advertising inventory on, approximately 42 Bauer radio stations throughout the United Kingdom pursuant to a 28 month agreement effective September 1, 2010. The Bauer radio stations accounted for approximately 34% of our United Kingdom radio entertainment news advertising inventory as of June 20, 2011 and approximately 42% of our entertainment news network’s impacts. Bauer is paid variable compensation based on the sale of impacts corresponding to the Bauer stations.
Generating Revenue Through Advertising Sales
In exchange for our information reports and/or, for certain broadcasters, cash compensation, our network affiliates provide us with commercial advertising inventory that we sell to advertisers. Although we also sell our commercial advertising inventory directly to advertisers, a majority of our advertising revenue is placed through advertising agencies engaged by the advertisers. Although certain agencies leverage the fact they represent multiple clients to negotiate favorable rates, in general, with the exception of standard agency commissions, we do not believe there is a material effect on our business when receiving orders for advertising placed through agencies versus those placed directly by advertisers.
The typical radio advertisement on our Radio Network consists of a ten second commercial message presented as the final segment of a regularly scheduled information report. We package our commercial advertising inventory on a network basis, covering all of our network affiliates in relevant markets, and sell this inventory as advertising packages on a local, regional or national network basis, except in the United Kingdom where advertising packages are sold only on a national basis. In addition, our commercial advertising inventory in the United Kingdom currently differs from our typical radio advertisement in that it is pre-recorded and generally 20 to 60 seconds in length, with 30 seconds and 40 seconds being the most prevalent length (although some spots are ten seconds in length). We run our advertising packages on a percentage-based rotation such that each advertiser receives its pro rata share of advertisements sold by us for broadcast on all of our network affiliates’ stations throughout the relevant market or markets, primarily during prime morning and afternoon drive periods.
Similar to our typical radio advertisements, advertisements on our TV Network generally consist of ten second commercial messages immediately following regularly scheduled information reports. Typically, our TV reports and the commercial messages that follow them are broadcast live by an on-camera announcer wearing a shirt bearing the advertiser’s logo. The advertisers’ logo and/or a pre-submitted visual advertising message also generally appear at the bottom of the television screen throughout the report.
Advertising on a Network Basis. Because we have numerous network affiliates in each of our markets, we believe that our sponsorship package advertisements enable advertisers to reach more listeners, more often, with a higher impact than can be achieved through other advertising media. Due to our large base of network affiliate stations and the audience reach it provides, we offer advertisers the opportunity to reach a broad-based local, regional or national audience through a single purchase of commercial advertising inventory from us. However currently in the United Kingdom our traffic and entertainment news service is sold on a national basis only. Our plan is to sell advertising associated with our United Kingdom operations on a regional basis in the future. However, certain of our contracts with United Kingdom network affiliates prohibit the sale of their advertising inventory on anything other than a national basis and, as a result, we may be unable to do so. Because we sell our radio commercial advertising inventory exclusively on a network basis, rather than station by station, we do not believe our advertising products compete directly with those offered by our local radio station network affiliates.
Our Customer Base of Advertising Clients. Due to the number of our markets, our reach within each of these markets and the range of services that we provide, we have garnered a broad base of advertising clients in a diverse group of industries, which since July 1, 2010 have included nine of the top ten Australian advertisers and 18 of the top 20 global advertisers, each as published by AdvertisingAge. Examples of our larger and higher profile advertising customers in Australia, Canada and United Kingdom include the following companies:
| Australia | Canada | United Kingdom | ||
| • Hyundai |
• Canadian Direct Insurance |
• Compare the Market | ||
| • McDonalds |
• Expedia.ca |
• Kwik Fit | ||
| • RTA |
• General Motors |
• Mercedes | ||
| • Target Australia |
• RBC Financial Group |
• Moneysupermarket.com | ||
| • Virgin Australia Airways |
• Volkswagen Dealers |
• Seat | ||
| • Woolworths |
• Western Canada Lottery |
• Shell | ||
Although many large advertisers utilize our advertising platform, we maintain a broad and diverse customer base. No one advertiser comprises more than 4% of our revenue base and our top ten advertising customers represent only approximately 17% of our overall advertising sales. However, three unrelated groups of advertising agencies that each represent a number of our clients in Australia, United Kingdom and Canada constituted approximately 28%, 15% and 9%, respectively, of our revenues for the year ended June 30, 2011 and approximately 23%, 16% and 11%, respectively, of our net accounts receivable as of June 30, 2011. Another advertising agency that represents a number of our clients in Australia constituted approximately 11% of our revenues for the year ended June 30, 2011 and approximately 11% of our net accounts receivable as of June 30, 2011. In addition to the aforementioned agencies, it is likely other advertising agencies may exceed 10% of our net revenues and/or 10% of our net receivables in the future based on the current billing levels of certain agencies. In the United Kingdom, substantially all our advertising related net revenues are generated from sales placed by five agency groups (including one agency group placing in excess of 50% of our United Kingdom advertising net revenues for the year ended June 30, 2011); therefore our concentration of revenue by agency is greater in the United Kingdom market than for our Company as a whole.
6
Table of Contents
Many of our larger advertising clients market their products by leveraging regional, national or global brands. Because our network-based advertising can reach broad-based, regional or national audiences, our advertising sponsorship packages appeal to these large, recognizable companies that seek a broader demographic reach than the narrow, specific demographic audience that individual radio stations generally deliver. Part of our operating strategy involves replicating our business model in additional international markets that will allow advertisers to reach major population centers around the world. We believe the appeal of our network-based advertising to customers with global brands will continue to increase as we expand the reach of our radio and television networks.
Our Sales Force. We maintain an advertising sales force throughout Australia, Canada and the United Kingdom, located in markets where we have operation centers. Our advertising sales force sells available commercial advertising inventory throughout their national markets in addition to selling such inventory in their local market, which we believe affords our sales representatives an advantage over certain of their competitors. For example, an advertiser can purchase commercial advertising inventory in multiple markets from the sales representative in the locale in which the advertiser is headquartered. Our advertising sales force in Australia is comprised of approximately 27 sales representatives and managers. The number of sales representatives in an individual market ranges up to 10 depending on the size of the market and the number of potential national and regional advertising clients headquartered in the market. Specialized programs and marketing campaigns, which support nationwide sales and other special forms of advertising, are managed from our Australian headquarters in Sydney. In Canada, we currently have a corporate and sales office in Toronto and marketing offices in Montreal, Vancouver, Ottawa, Edmonton and Calgary, as well as U.S. based sales representatives. Our Canadian sales force, including sales management, currently consists of approximately 20 people. We intend to continue to expand our Canadian sales force as our operations expand. Our United Kingdom sales staff, including sales management, currently consists of approximately six employees located in London.
Although the majority of our advertising customers execute their purchase of commercial advertising inventory from our sales force through advertising agencies as a matter of course, we have historically focused on maintaining direct relationships with our advertising customers. We believe that maintaining direct relationships with our advertisers helps ensure that our relationships remain intact when advertising agency changes occur.
Our Strategy
Our objective is to become the leading aggregator of premium radio and television advertising inventory in the markets we serve. Key elements of our strategy include:
| • | Expand the geographic markets we serve. We began our operations in Australia in 1997, commenced operations in Canada in December 2005, began broadcasting in the United Kingdom in October 2007 and completed the Unique acquisition in the United Kingdom in March 2009. We intend to continue to expand the geographic scope of the markets in which we operate, targeting markets that have: (i) large population clusters in tight geographic areas; (ii) a free market advertising culture similar to the United States; and (iii) established information centers for traffic data. We intend to sell our advertising inventory in the new markets that we enter by leveraging our existing customer base of global marketers, enabling advertisers to efficiently, effectively and economically reach major population centers. |
| • | Increase the number of network affiliates using our radio traffic reports within existing markets. Although we currently operate in eight of the largest population centers in Canada, we believe that there are substantial opportunities for continued growth in our Canadian radio network. Because our operations in Canada are still at a relatively early stage, there is significant opportunity for growth by adding network affiliates in our existing markets. While we continue to seek opportunities for growth in our other existing markets, our radio network penetration in Australia and United Kingdom make it unlikely that we will add significant additional stations utilizing our traffic reports in those markets. |
| • | Accumulate additional advertising inventory by continuing to expand the scope of our information reports. We intend to leverage our established relationships with broadcasters in the Australian, Canadian and United Kingdom markets by continuing to expand the scope of our information reports. |
Radio News Reports. We believe that consolidation in the radio industry may increase the demand for our radio news reports as radio station owners are likely to increase their outsourcing of various programming elements in order to lower costs. We plan to focus on increasing the number of radio stations broadcasting our advertising in radio news reports within our current markets, either by providing the service ourselves or purchasing the radio stations’ embedded news advertising availabilities. We believe this will in turn increase our commercial advertising inventory, expand our audience reach and result in increased revenue from the sale of such inventory.
TV Reports. We have developed an infrastructure of airborne video surveillance and broadcast equipment. In addition, through agreements with various governmental agencies, we have access to over 1,500 static mounted traffic surveillance cameras in Australia and approximately 450 static mounted surveillance cameras in Canada. We use this infrastructure to offer traffic and
7
Table of Contents
breaking news reports to our television broadcasters and currently provide service to 14 television stations in seven Australian markets and four television stations in four Canadian markets. In many of our television markets, we provide TV reports that include proprietary video coverage from our helicopters that can cover news stories and traffic conditions at any time, subject to weather conditions and air traffic control restrictions. In addition, our access to strategically located fixed-position ground-based camera systems allow us to provide our network affiliates coverage of crucial traffic arteries. We intend to expand our TV reports to additional network affiliates in our Australian and Canadian markets, which would provide us with additional advertising inventory. We may also provide a similar television product to television stations in the United Kingdom although we have not yet explored the feasibility of doing so.
| • | Continue to strengthen marketing, sales and inventory management operations. We continue to implement new operating strategies to increase revenue growth and drive profitability. In order to increase the percentage of our commercial advertising inventory sold in Australia and Canada, we have: (i) expanded our sales force and acquired extensive research and sales and marketing materials; (ii) hired additional sales managers to better manage the activities of our sales representatives; and (iii) automated our commercial advertising inventory management system to improve inventory control and pricing. We are continuing the process of implementing the “best practices” of our Australian and Canadian operations with those of our United Kingdom operations we acquired in March 2009. |
| • | Grow our business through strategic acquisitions. Historically, our expansion strategy has focused on organic growth. Although we expect that organic growth will continue to be a significant source of expansion, we also intend to explore growth through the acquisition of businesses that have strong relationships with broadcasters which we can leverage. For example, in April 2007, our Canadian operations acquired substantially all the assets of Wise Broadcasting Network Inc. In March 2009, we completed our acquisition of Unique, which provided radio traffic services to approximately 230 radio stations and entertainment news services to approximately 125 radio stations in the United Kingdom. |
Corporate Structure
Sales and Marketing. Our sales operations in Australia and Canada have been organized into marketing regions. A region generally has a Regional Sales Manager who oversees a sales staff charged with reaching sales goals. The Regional Sales Manager is also responsible for the direct selling of commercial advertising inventory to advertisers. A National Director of Sales has oversight responsibility for the Regional Sales Managers and maintains a selective listing of significant advertisers. By requiring the Regional Sales Managers and the National Director of Sales to maintain advertising clients in addition to their management responsibilities, we believe that our managers remain better apprised of advertising conditions. The National Director of Sales reports to the President of Australia Traffic Network, who also serves as our International Director of Sales and Training. In Canada, our Regional Sales Managers report to our Senior Vice President of Sales, who in turn reports to our International Director of Sales and Training. Our sales operations in the United Kingdom are located in London, with the sales staff reporting to the Sales Director who, in turn, reports to the Chief Operating Officer of UK Commercial Traffic Network.
Operations. Each of our Australian and Canadian markets is overseen by a Director of Operations who is responsible for all aspects of the day-to-day operations in a defined market or markets. Each Director of Operations is responsible for supervising all of the broadcasters, airborne reporters, producers, editors, and writers in such Director’s operation center. Moreover, the Director of Operations is responsible for maintaining day-to-day relations with network affiliates. In addition, we employ National Directors of Operations in Australia and Canada who supervise the Directors of Operations in their country and who reports to the President of Australia Traffic Network and the President of the Canadian Traffic Network, respectively. The President of Australia Traffic Network and the President of the Canadian Traffic Network report to our Chief Executive Officer and President. In the United Kingdom, our entertainment news and traffic reporting are outsourced to third parties. These third parties report to the Chief Operating Officer of UK Commercial Traffic Network. Our Highways Agency operations are managed in a manner similar to our operations in Australia and Canada, with the manager of the contract reporting to senior management of UK Traffic Network. The Chief Operating Officer of UK Commercial Traffic Network and the managing director of UK Traffic Network report to our Chief Executive Officer and President.
Competition
We market our information reports to radio and television stations in Australia, Canada and the United Kingdom, where we face various sources of competition in providing our information reporting services. We believe that single market operators and groups of stations (whether or not under common ownership) that prepare and deliver their own traffic and news reports comprise our primary competition. We also face competition in Canada from Skywords, Inc., a company that provides traffic reporting services in exchange for network-based advertising spots using a business model similar to ours. Consolidation in the radio and television markets may create additional opportunities and economies of scale for large radio and/or television groups to provide their own services, which would pose greater competition for us. In addition to providers of broadcast reports, there are also alternative means of compiling traffic information and delivering such information to the public. Several companies throughout the world generate speed and travel time data through various technologies, including the tracking of cell phones and tracking truck fleet data. In addition, certain governmental agencies, including some state, provincial and local departments of transportation, generate selected traffic flow data through strategically positioned cameras and/or sensors that monitor traffic flow, which could be used by our competitors or accessed by consumers. Most of these traffic systems and cameras, however, were built for purposes such as
8
Table of Contents
infrastructure planning, road operation and road safety, and were not designed to provide real-time traffic flow information to consumers and do not provide information reporting services in a manner that engages radio listeners and television viewers. As such, we do not believe such services are directly competitive with the information reporting services we provide. However, others may view these alternative sources of traffic data as competitors, and as demand for traffic information services and technologies increase, we expect that additional new competitors may enter the market in the future.
Competitive factors in international markets will vary from market-to-market and may change over time. We believe that most European markets lack competitors that aggregate traffic information for radio and television broadcasters, and we do not believe that any companies currently provide traffic reports in exchange for advertising inventory outside of the United Kingdom. As such, we believe this is an optimal time to explore expansion into certain European markets.
We also face competition in the sale of our commercial advertising inventory. While we compete for advertising dollars with radio and television stations, including our network affiliates, we do not believe we compete directly with such radio stations because we position our advertisements within the framework of our information reports and sell our radio commercial advertising inventory to our advertisers on a network basis. In the United Kingdom, Independent Radio News Limited operates a model similar to ours, with the primary difference being the advertising messages are attached to newscasts rather than traffic reports. In addition to radio and television stations and networks, we compete for advertising dollars with other media, including local print and other forms of communications media such as newspapers, magazines, outdoor advertising, transit advertising, internet advertising, direct response advertising, yellow page directories, mobile advertising and point-of-sale advertising, among others.
Environmental Regulation
We are not subject to environmental regulations that have a material effect upon our capital expenditures or otherwise.
Intellectual Property
We do not have any material registered trademarks, nor do we believe that intellectual property is important to the success of our existing business. We allow our network affiliates to take credit for all of the information reports that we provide.
Global Alert Network has filed for patent protection for certain location aware passive alerting applications for mobile devices. We are uncertain as to whether we will be successful in our pursuit for patent protection for these applications. To date, Global Alert Network has operated at a loss.
Employees
As a holding company, Global Traffic Network, Inc. currently employs seven individuals. Australia Traffic Network currently employs approximately 81 full-time employees, 27 part-time employees and 2 independent contractors. Of these employees and independent contractors, approximately 67 were engaged in broadcasting and operations, 28 in sales and marketing and 15 in general and administrative activities. Canadian Traffic Network currently employs approximately 67 individuals on a full-time basis, 21 on a part-time basis and five independent contractors. Of these employees, approximately 70 were engaged in broadcasting and operations, 20 in sales and marketing and three in general and administrative activities. UK Traffic Network, including its wholly owned subsidiary UK Commercial Traffic Network currently employs approximately 16 full-time employees. Of these employees, 3 are employed in broadcasting operations, seven are employed in sales and six are employed in general and administrative activities. Global Alert Network currently employs three individuals on a full time basis and approximately five independent contractors. None of our employees or independent contractors are covered by a collective bargaining arrangement. We consider our relationship, and our subsidiaries’ relationships, with our employees to be satisfactory. We have never had a strike or work stoppage.
In addition, we contract with outside sales agents for the sale of some of our advertising inventory.
Available Information
We are subject to the reporting and information requirements of the Securities Exchange Act of 1934, as amended, and, as a result, we file periodic and current reports, proxy statements, and other information with the SEC. You may read and copy this information at the Public Reference Room of the SEC located at 100 F Street, N.E., Washington, D.C. 20549. Please call the SEC at 1-800-SEC-0330 for further information on the operation of the Public Reference Room. The SEC maintains an internet site that contains periodic and current reports, proxy and information statements, and other information regarding issuers that file electronically with the SEC. The address of the SEC’s website is http://www.sec.gov.
The periodic and current reports, proxy statements, and other information that we file with the SEC, and any amendments thereto, filed or furnished pursuant to Section 13(a) or 15(d) of the Exchange Act are available free of charge at www.globaltrafficnetwork.com (click on “Investor Relations”, then “Financial Information” and then “SEC Filings”) as soon as reasonably practicable after we file such material with, or furnish it to, the SEC.
9
Table of Contents
Some of the statements made in this report are forward-looking statements. These forward-looking statements are based upon our current expectations and projections about future events. When used in this report, the words “believe,” “anticipate,” “intend,” “estimate,” “expect” and similar expressions, or the negative of such words and expressions, are intended to identify forward-looking statements, although not all forward-looking statements contain such words or expressions. The forward-looking statements in this report are primarily located in the material set forth under the headings “Business,” “Risk Factors” and “Management’s Discussion and Analysis of Financial Condition and Results of Operations,” but are found in other locations as well. These forward-looking statements generally relate to our plans, objectives and expectations for future operations and are based upon management’s current estimates and projections of future results or trends. Although we believe that our plans and objectives reflected in or suggested by these forward-looking statements are reasonable, we may not achieve these plans or objectives. You should read this report completely and with the understanding that actual future results may be materially different from what we expect. We will not update forward-looking statements even though our situation may change in the future.
Specific factors that might cause actual results to differ from our expectations or may affect the value of the common stock, include, but are not limited to:
| • | our inability to compete successfully with current or future competitors within our industry; |
| • | our inability to retain members of our executive management or other key employees; |
| • | the termination or impairment of our relationships with key network affiliates; |
| • | the termination or impairment of our advertiser relationships; |
| • | our inability to manage our growth effectively; |
| • | our inability to successfully expand into additional international markets; |
| • | fluctuations in foreign currency exchange rates and the results of hedging transactions, if any; |
| • | our inability to obtain additional debt or equity financing, if required; and |
| • | unforeseen litigation. |
Industry data and other statistical information used in this report are based on independent publications, government publications, reports by market research firms or other published independent sources. Some data is also based on our good faith estimates, derived from our review of internal surveys and the independent sources listed above. Although we believe these sources are reliable, we have not independently verified the information.
Other factors that could cause actual results to differ from those implied by the forward-looking statements in this report are more fully described herein.
Our past operating results may not be indicative of our future performance and we may be unable to continue operating successfully in our existing markets or to establish successful operations in additional markets.
Our wholly-owned subsidiary, Australia Traffic Network, introduced its services in Australia in 1997. Through our indirect wholly-owned subsidiary, Canadian Traffic Network, we began delivering radio traffic reports to radio stations in Canada in December 2005 and generating revenue from our Canadian operations in January 2006. We formed UK Traffic Network in October 2006 and purchased Unique in March 2009. Although certain members of management have experience with providing traffic information in certain international markets, we have a limited history of providing our services in Canada and the United Kingdom and no experience providing our services in other international markets. See “We intend to expand into additional international markets and our inexperience in those markets increases the risk that our international expansion efforts will not be successful.” The success of any previous operations in Australia may not be indicative of the results of our efforts to provide continued or additional services in Australia, or to provide our services in Canada, the United Kingdom and other markets. The successful operation of our business in Australia, Canada, United Kingdom or other international markets, will require a certain level of continued capital expenditures and operating expenditures which we are committed to undertaking. There can be no assurance that we will be able to operate and expand our business as contemplated.
We have incurred operating losses in connection with our expansion of operations into Canada and the United Kingdom and may be unable to operate profitably in those markets.
In connection with our expansion in to Canada, we have incurred net losses of approximately $160,000 for the period from May 16, 2005 (inception) through June 30, 2005, $2.6 million for the year ended June 30, 2006, $3.8 million for the year ended June 30, 2007, $3.1 million
10
Table of Contents
for the year ended June 30, 2008, $3.1 million for the year ended June 30, 2009, $4.4 million for the year ended June 30, 2010 and $1.8 million for the year ended June 30, 2011. While we expect our Canadian operations to become profitable, we will continue to incur significant expenses and capital expenditures in connection with providing our service offerings, building our infrastructure and developing our base of advertisers. There is no guarantee that we will be able to generate revenue in excess of these expenditures. As of June 30, 2011, we have invested approximately $28.6 million in our Canadian subsidiary in the form of an intercompany advance. If our Canadian revenue grows more slowly than we anticipate, or if our Canadian operating expenses are higher than we expect, we may not be able to achieve, sustain or increase profitability from our Canadian operations.
On October 19, 2006, we formed a wholly-owned subsidiary, UK Traffic Network, in anticipation of launching business operations in the United Kingdom. For the fiscal years ended June 30, 2007, 2008 and 2009, UK Traffic Network incurred net losses of approximately $0.8 million, $1.8 million and $1.8 million, respectively. Our acquisition of Unique closed effective March 1, 2009 and our consolidated United Kingdom operations continued to generate losses for the period from closing to June 30, 2009. For the year ended June 30, 2010, our consolidated United Kingdom operations generated a loss of approximately $1.3 million. Although we managed approximately $0.4 million in net income for the year ended June 30, 2011, we may not be able to sustain or increase profitability from our United Kingdom operations. As of June 30, 2011, we have invested approximately $25.8 million in our United Kingdom subsidiary in both the form of equity and an intercompany advance. In addition, business operations in the United Kingdom (and especially the Unique acquisition) require significant management attention and financial resources that could otherwise be devoted to our making our Canadian operations profitable and/or expanding operations in our other existing or new markets.
Although our delivery of radio traffic reports in Australia has historically been profitable, we may be unable to replicate such profitable operations in Canada and the United Kingdom due to cultural differences, regulatory restrictions, economic conditions, or otherwise. If we continue to operate at a loss in Canada, or we are unable to operate profitably in the United Kingdom, we may be forced to abandon our operations in those countries without recovering the costs incurred in our expansion efforts (including the approximately $16.1 million paid to UBC in connection with our purchase of Unique), which may have a material adverse effect on our consolidated company’s financial condition and results of operations and negatively impact our business prospects. The price of our common stock could decline as a result.
There is significant risk and uncertainty surrounding our acquisition of The Unique Broadcasting Company Limited from UBC Media Group plc.
There are numerous risks associated with our March 2009 acquisition of Unique, for which we paid total cash consideration of approximately $16.1 million. Among these risks is our lack of experience with acquisitions in general and large acquisitions in particular. Although certain members of management have experience with acquisitions of existing businesses (including traffic reporting services), our company’s only previous acquisition was that of Wise Broadcasting Network Inc., which was not material to our operations. Additional risks associated with the Unique acquisition include issues overlooked or improperly assessed during our due diligence process, loss of key employees, radio stations and/or advertisers following completion of the transaction and additional competition arising after the acquisition. In addition, despite similarities between the radio networks that we purchased in the United Kingdom and our networks in Australia and Canada, the business models are not identical and may require significant transition, which may not prove successful. Some of those differences in the existing business model of the acquired business include the variable nature of station compensation payments, the outsourcing of operations to third parties, the pre-produced and lengthier structure of commercial advertisements, the provision of traffic information to many stations in lieu of anchored reports, the sale of commercial inventory on a national network basis only, the more restrictive nature of sales limitations from the radio stations and the group approach to advertising sales. An inability to transition successfully this business model to a model that is more consistent with our Australian and Canadian operations may result in a retrospective determination that we misjudged the true value of the target company’s business. Further, it is likely that we will not be able to completely transition the acquired business to our existing model, resulting in a hybrid approach of our practices in Australia and Canada and the existing practices in the United Kingdom. In addition, the United Kingdom radio market continues to be in a recession. These risks are increased by our relative inexperience in the United Kingdom market. Because we paid a high multiple of operating income for Unique, if we do not continue the improved performance of the acquired business, the amount of capital that we expended may be greater than the ultimate value of the acquired business. All of these potential risks may have a material adverse effect on our company’s consolidated financial condition and results of operations and negatively impact our business prospects. The price of our common stock could decline as a result.
We have incurred operating losses in connection with our formation of Global Alert Network and our expansion of its operations and may be unable to operate Global Alert Network profitably in the United States or elsewhere.
On March 7, 2008, we formed Mobile Traffic Network (subsequently renamed Global Alert Network) as a wholly owned subsidiary to take advantage of the opportunities surrounding passive alerting technology to deliver information and advertising to mobile devices. As an unproven technology and business model, there are significant risks and uncertainties involving this business plan.
Our core business revolves around the provision of radio and television information reports, which is not generally technology oriented. Our initial efforts to build a product utilizing our passive alerting technology were not successful. We have since licensed a third party’s application for a one-time upfront payment and a royalty on future revenues. While we have recently brought our alerting product to market and have obtained subscribers to our service, there is no assurance that the technology will work as planned. In addition, technology dependent industries are often characterized by uncertain and conflicting intellectual property claims and frequent intellectual property litigation, especially
11
Table of Contents
regarding patent rights. We could be subject to claims of infringement of third party intellectual property rights, which could result in significant expense and could ultimately result in the loss of intellectual property rights. Any litigation to determine the validity of these claims, including claims arising through any contractual obligations that we may have to indemnify business partners, regardless of their merit or resolution, would likely be costly and time consuming and divert the efforts and attention of our management and technical personnel. If any such litigation resulted in an adverse ruling, we could be required, among other things, to pay substantial damages, cease offering our application, or obtain a license under the intellectual property rights of the third party claiming infringement, and such a license may not be available on reasonable terms or at all.
Because we do not produce traffic or weather information in the United States, we currently offer traffic and weather alerts in the United States via arrangements with third parties to provide the content for our reports, however there is no assurance that we will be able to continue or renew the agreements with such third parties on terms satisfactory to us. We may incur significant costs that we will not be able to recoup should we be unable to reach satisfactory agreements with such third parties. Because our product offering is advertising supported, there is no assurance that sufficient mobile phone users will “opt in” to make our application an attractive advertising platform. Even if a critical mass of mobile phone users “opt in” to our application, we may not be successful in selling advertising opportunities on the platform to advertisers. In addition, we currently have limited operations in the United States and our experience in selling advertising is limited to commercials broadcast on radio and television, for which there is an established advertising market. Our lack of presence in the United States (including the lack of an established sales staff) will likely increase our costs, as we are unlikely to be able to take advantage of existing infrastructure.
The market for mobile device applications and related software is competitive and reliant on technology developments and adapting to changing market demands and consumer preferences. Even if we are able to develop and commercialize our application, we may face competition from one or more companies that introduce related technologies and applications. These companies may have significantly greater financial, technical and marketing resources than we do and may be able to respond more rapidly than we can to new or emerging technologies or changes in customer demands. They may also devote greater resources to the development, promotion and sale of their products than we do. If we are able to commercialize our application but unable to compete successfully with such companies, results of operations from Global Alert Network, and consequently our company as a whole, would suffer.
Our level of expenditure on the technology and our product offering may be significant prior to our knowing whether the product has a likelihood of success. For the year ended June 30, 2011 our losses related to Global Alert Network were approximately $1.2 million on $1 thousand of revenue. For the year ended June 30, 2010 our losses related to Global Alert Network were approximately $0.8 million on $31 thousand of revenue. For the year ended June 30, 2009, we incurred approximately $1.4 million in losses without generating any revenue. If we are unable to operate Global Alert Network profitably, we may be forced to abandon our operations without recovering the up-front costs incurred, which may have a material adverse effect on our company’s consolidated financial condition and results of operations and negatively impact our business prospects. The price of our common stock could decline as a result.
Our financial success depends on our ability to compete successfully in obtaining and maintaining contracts with radio and television stations and we may be unable to acquire or renew such contracts.
The success of our business is largely dependent on our ability to maintain and acquire contracts with radio and television stations (“Affiliate Contracts”) in Australia, Canada, the United Kingdom and any other market into which we may expand our operations in the future. We face various sources of competition in providing our information reporting services. We believe that single market operators and groups of radio or television stations (whether or not under common ownership) that prepare and deliver their own traffic reports comprise our primary competition. Consolidation in the radio and television markets may create additional opportunities and economies of scale for large radio and/or television groups to provide their own traffic reporting services, which would pose greater competition to us. In addition to providers of broadcast reports, there are also alternative means of compiling traffic information and delivering such information to the public. Certain governmental agencies, including some state and local departments of transportation, generate selected traffic flow data through strategically positioned cameras or sensors that monitor traffic flow, which can be used by our competitors and directly accessed by consumers. Certain private entities generate selected traffic flow data and provide such information directly to consumers. We may also face future competition from providers of information reporting services that utilize new technologies to which we may not have access, both for the gathering and delivery of information. Such new technologies may reduce the demand for our services or render our services obsolete. Our current and potential competitors may offer alternative types of information services and may have substantially greater financial, technical, marketing or other resources than we do. There can be no assurance that our business will not be adversely affected by current or increased competition for acquiring Affiliate Contracts and providing information services in the markets in which we operate.
We obtain our advertising inventory from radio and television stations in exchange for information reports and/or, for certain broadcasters, cash compensation. We may be required to increase the cash compensation that we pay for our commercial advertising inventory in certain cases, including in response to competition from third party information providers or groups of radio and television stations that prepare and deliver their own information reports. If we are required to increase the amount of cash compensation that we pay to certain network affiliates in exchange for our commercial advertising inventory, or to pay cash compensation to additional network affiliates, our financial condition may suffer and our stock price may decline.
Due to the relatively short-term nature of our Affiliate Contracts, which generally range from one to four years, and because we deliver information reports to several of our network affiliates pursuant to unwritten arrangements or expired Affiliate Contracts that may be construed as cancelable at will, we are vulnerable at all times to competition from other providers of information reporting services and from stations or
12
Table of Contents
groups of stations that may elect to prepare and deliver their own information reports. For example, our contracts with our two largest station group network affiliates in Australia expire by the end of the current fiscal year. Combined, these two network affiliates represented approximately 35% of our Australian radio advertising inventory as of June 30, 2011. If we are unable to maintain a significant number of our network affiliates, either due to non-renewal of our Affiliate Contracts upon expiration or termination of unwritten arrangements with network affiliates, our commercial advertising inventory would decrease significantly, which would likely lead to significant declines in revenues.
Our financial success depends on our ability to compete successfully in selling commercial advertising inventory to advertisers and we may be unable to sell such inventory.
Our business success is dependent on our ability to sell the commercial advertising inventory that we receive from our network affiliates in exchange for providing our information reporting services and/or, for certain broadcasters, cash compensation. Selling advertising is highly competitive. We compete for advertising sales with radio and television stations, including our network affiliates, as well as with other media, including other forms of communications media such as newspapers, magazines, outdoor advertising, transit advertising, internet advertising, mobile advertising, direct response advertising, yellow page directories and point-of-sale advertising, among others. As a result of the advertising competition we face, we experience and expect to continue to experience increased price competition, which could lower our rates for radio and television advertising and could result in a decline in our revenues for radio and television advertising, which may have a material adverse effect on our financial condition and results of operations and negatively impact our business prospects. The price of our common stock could decline as a result.
In addition, our overall business is subject to competition from existing or future entities that provide information reporting services in exchange for network-based advertising spots using a business model that is similar to ours. We currently compete with such an entity in Canada, Skywords Inc., which primarily operates in the Toronto market, but which also operates in certain other Canadian markets in which we provide our services. In addition, Independent Radio News Limited operates a model similar to ours in the United Kingdom, with the primary difference being the advertising messages are attached to newscasts rather than traffic reports. In the face of such competition, whether in Australia, Canada, the United Kingdom or any other market in which we introduce our services, we may not be able to provide information reporting services that are superior to our competitors’ or competitively priced against the services of our competitors. Even if we provide superior services, the presence of a competing service provider may lead to confusion and increased pricing competition, which may provide advertisers with additional leverage in negotiating the sale terms of our commercial advertising inventory. Such effects of competition may have a material adverse effect on our financial condition and results of operations and negatively impact our business prospects. The price of our stock could decline as a result.
Consolidation among advertising agencies may negatively impact the price and other terms on which we sell our commercial advertising inventory.
A substantial majority of our advertising revenues in Australia, Canada and the United Kingdom are placed through advertising agencies that represent the ultimate client advertiser. As with many industries, the advertising agency business has seen a consolidation in recent years. The impact of this consolidation is that fewer agencies groups represent a greater number of advertisers. For example, substantially all of our advertising in the United Kingdom comes from five agency groups, including one group that represented over 50% of our United Kingdom revenues for the year ended June 30, 2011. As certain agencies gain more clout, they may be able to extract more favorable pricing and other concessions. In addition, many of these agencies are now international in scope. Given our significant international presence, it is possible that in the future these international agencies will coordinate their purchasing efforts and leverage their worldwide buying power to negotiate sales concessions from us. Should this occur, it is possible our revenues will drop and the price of our stock could decline as a result.
Our ability to sell commercial advertising and generate revenues may be subject to economic and industry fluctuations that are beyond our control.
Because we generate substantially all of our revenues through the sale of commercial advertising, the success of our business is closely linked to the performance of the advertising industry. The advertising industry overall, in turn, tends to be affected by general economic conditions and is sensitive to the overall level of consumers’ disposable income within a given market. If people migrate to markets where we have a smaller or no presence, or if the general population shifts into a less desirable age or geographical demographic from an advertising perspective, advertisers may only be willing to pay lower fees for our commercial advertising inventory. A decline in general economic conditions within a market in which we operate could adversely affect advertising revenues generated from that market and, in turn, have an adverse effect on our profitability, operating results, financial conditions and the price of our common stock.
In addition, our business is dependent upon the performance of the highly competitive radio and television industries. We generate revenue by selling commercial advertising inventory of our network affiliate radio and television stations. Radio and television stations compete for audiences and advertising revenues with other radio and television stations, as well as with other media, such as newspapers, magazines, direct mail, satellite radio, mobile and internet based media, within their respective markets. As a result, radio and television audience ratings and market shares are subject to change, which, if adverse, may result in a reduction of our advertising revenues. Our network affiliates’ competitors may develop services or media that are equal or superior to those our network affiliates provide or that achieve greater market acceptance and brand recognition than our network affiliates achieve. It is possible that new competitors may emerge and rapidly acquire significant market share from our network affiliates. Other variables that could adversely affect our network affiliates’ operations, and therefore potentially adversely affect our operations, include, without limitation:
| • | unfavorable economic conditions, both general and relative to radio and television broadcasting and all related media industries, which may cause companies to reduce their expenditures on advertising; |
13
Table of Contents
| • | unfavorable shifts in population and other demographics which may cause our network affiliates to lose customers, viewers and listeners and possibly terminate operations; |
| • | an increased level of competition for advertising dollars, which may lead to lower advertising rates as our network affiliates attempt to retain customers or which may cause our network affiliates to lose customers to their competitors who offer lower rates than our network affiliates are able or willing to match; |
| • | technological changes and innovations that our network affiliates are unable to adopt or are late in adopting that offer more attractive advertising, listening or viewing alternatives than what our network affiliates currently offer, which may lead to a loss of advertising customers or to lower advertising rates; and |
| • | changes in governmental regulations and policies and actions of federal regulatory bodies which could restrict the advertising media which our network affiliates employ or restrict some or all of our customers that operate in regulated businesses from using certain advertising media, or from advertising at all. |
Radio and television stations face increasing competition from new broadcast technologies, such as internet, broadband wireless, cable television and satellite television and radio and mobile phones, and new consumer products, such as portable digital audio players and personal digital video recorders. These new technologies and alternative media platforms increasingly compete with radio and television stations for audience share and advertising revenue, and in the case of some products, allow listeners and viewers to avoid traditional commercial advertisements. We are unable to predict the effect such technologies and related services and products will have on the radio and television broadcasting industry, but the capital expenditures required for us to implement such technologies could be substantial and other companies employing such technologies could compete with our radio and television affiliates.
Potential consolidation of radio and television stations in the markets in which we operate and will operate in the future may result in reduction of our negotiating leverage for Affiliate Contracts and, subsequently, may increase costs and risk of loss with respect to our Affiliate Contracts.
The continued financial success of our business is largely dependent upon our ability to maintain Affiliate Contracts with radio and television stations in Australia, Canada, the United Kingdom and any other market into which we may expand our operations in the future. If radio and television stations in the markets in which we operate consolidate, a broadcaster may determine that it is in its best interest to produce a product similar to ours internally and terminate our Affiliate Contract, subsequently eliminating the supply of commercial advertising inventory that we receive from such broadcaster. In addition, consolidation in the industry will result in fewer station owners who may then be able to negotiate with increased leverage for Affiliate Contracts. Further, consolidation may result in our entering into fewer Affiliate Contracts, each comprising a larger number of stations and constituting a greater percentage of our base of contracts. Subsequent to any consolidation, the loss of any one Affiliate Contract may have a much greater impact on the results of our operations. Consolidation in the industry and its potential effects could result in a significant decline in our revenues or increase in our expenses, which may have a material adverse effect on our financial condition and results of operations and negatively impact our business prospects. The price of our common stock could decline as a result.
The loss of Austereo Pty Limited or Australian Radio Network Pty Limited as one of our network affiliates in Australia would significantly decrease the amount of our commercial advertising inventory, which could have an adverse effect on our results of operations and our stock price.
Austereo Pty Limited (“Austereo”), one of our network affiliates, is the largest radio broadcaster in Australia and, as of June 30, 2011, provided us with approximately 18% of the Australian radio commercial advertising inventory (approximately 23% of such inventory from stations in our five largest Australian markets). When sold to advertisers, this radio commercial advertising inventory accounts for a material amount of our Australian revenues. Effective July 1, 2008, we entered into a four year agreement under which we provide regularly-scheduled radio traffic reports to and receive radio traffic report and radio news report inventory from ten Australian radio stations operated by Austereo in Sydney, Melbourne, Brisbane, Adelaide and Perth. In April 2011, Southern Cross Media Group (“Southern Cross”) completed its purchase of Austereo. In addition to the Austereo stations previously discussed, Southern Cross owns eight of our radio network affiliates in Hobart, Sunshine Coast, Gold Coast and Central Coast. These stations comprise approximately 6% of our Australian radio commercial inventory as of June 30, 2011. Australian Radio Network Pty Limited (“ARN”), a large radio broadcaster in Australia, provided us approximately 16% of our Australian radio commercial advertising inventory (approximately 19% of the inventory in our five largest Australian markets) as of June 30, 2011. When sold to advertisers, this radio commercial advertising inventory accounts for a material amount of our Australian revenues. This inventory is provided under a four year agreement effective July 1, 2008 to provide traffic reporting services to eleven ARN stations in Sydney, Canberra, Melbourne, Brisbane and Adelaide and an agreement through May 31, 2012 to acquire news radio commercial advertising inventory from eight ARN stations in Sydney, Melbourne, Brisbane and Adelaide. In addition, via various joint ventures, Austereo and ARN operate four radio stations in Canberra (included above) and Newcastle that account for approximately an additional 1% of our commercial advertising inventory in Australia. If we are unable to retain Austereo and/or ARN as a network affiliate, the
14
Table of Contents
amount of our radio commercial advertising inventory would decrease significantly. As a result, we would likely experience a corresponding or greater decrease in revenues from sales of our radio commercial advertising inventory, which may be compounded by the decrease in value of our Australian advertising network as a whole due to the reduction in our Australian audience reach. This would be particularly damaging because Australia is by far our most profitable subsidiary. Should this occur, it would likely have a material adverse effect on our financial condition and results of operations and negatively impact our business prospects and the price of our common stock could decline as a result.
The loss of Corus Entertainment, Inc. as one of our network affiliates in Canada would significantly decrease the amount of our commercial advertising inventory in Canada, which could have an adverse effect on our results of operations and our stock price.
Corus Entertainment, Inc. (“Corus”), one of our Canadian network affiliates, is one of the largest radio broadcasters in Canada and its radio stations comprise approximately 26% of our affiliate network stations (excluding suburban regional stations) in Canada. Corus currently provides us with approximately 39% of the Canadian radio commercial advertising inventory we receive (excluding suburban regional stations) pursuant to a four year contract effective January 1, 2009 pursuant to which we provide traffic reporting services and receive radio traffic inventory from 18 Corus stations in Vancouver, Edmonton, Calgary, Winnipeg, Toronto and Hamilton and an additional contract we have separately with one additional Corus station. If Corus were to not renew our agreement, and we were unable to replace their stations as network affiliates with comparable stations, we would have a significantly reduced presence in terms of amount of commercial advertising inventory and audience delivery in six of our eight markets. If this were to occur, it would be difficult for us to become profitable in Canada which would likely have a material adverse effect on our financial condition and results of operations and negatively impact our business prospects and the price of our common stock could decline as a result.
The loss of Global Radio Services Limited or Bauer Radio Limited as one of our network affiliates in the United Kingdom would significantly decrease the amount of our commercial advertising inventory, which could have an adverse effect on our results of operations and our stock price.
We provide traffic reporting services and receive radio commercial advertising inventory on approximately 53 radio stations throughout the United Kingdom pursuant to a three year agreement effective November 1, 2010 with Global Radio Services Limited (“Global”). The agreement may be cancelled prior to the end date by either party upon 90 days prior notice during the period commencing August 31, 2012 and ending October 1, 2012. The Global radio stations accounted for approximately 13% of our United Kingdom radio traffic advertising inventory as of June 30, 2011 and approximately 28% of the traffic network’s impacts. We provide traffic reporting services to, and receive radio commercial advertising inventory on, approximately 42 radio stations throughout the United Kingdom pursuant to the terms of a 28 month agreement with Bauer Radio Limited (“Bauer”) that commenced effective September 1, 2010. The Bauer radio stations accounted for approximately 19% of our United Kingdom radio traffic advertising inventory as of June 30, 2011 and approximately 24% of the traffic network’s impacts. We also provide entertainment news reporting services to, and receive radio commercial advertising inventory on, approximately 42 Bauer radio stations throughout the United Kingdom pursuant to the terms of a 28 month agreement with Bauer Radio Limited (“Bauer”) that commenced effective September 1, 2010. The Bauer radio stations accounted for approximately 34% of our United Kingdom radio entertainment news advertising inventory as of June 30, 2011 and approximately 42% of the entertainment news network’s impacts. If we are unable to retain Global and/or Bauer as a network affiliate, the amount of our radio commercial advertising inventory in the United Kingdom would decrease significantly. As a result, we would likely experience a corresponding or greater decrease in revenues from sales of our radio commercial advertising inventory, which may be compounded by the decrease in value of our United Kingdom advertising network as a whole due to the reduction in our U.K. audience reach. This would also likely lead to an impairment of at least a portion of the intangible assets (including radio station contracts and goodwill) related to our acquisition of Unique, which had a carrying value of $15.7 million as of June 30, 2011. Should this occur, it would likely have a material adverse effect on our financial condition and results of operations and negatively impact our business prospects and the price of our common stock could decline as a result.
Our business is subject to risks based on our compliance with multiple legal and regulatory regimes due to our international operations.
We conduct business in multiple international markets and, as a result, face added expenses related to the engagement of legal, accounting and other experts in each country in which we currently operate or may operate in the future. In addition, our future results could be materially adversely affected by a variety of uncontrollable and changing factors including, among others, regulatory, social, political, or economic conditions in a specific country or region, trade protection measures and other regulatory requirements, government spending patterns and natural disasters. We are also exposed to risks associated with changes in the laws and policies that govern foreign investments in countries where we have operations as well as, to a lesser extent, changes in United States laws and regulations relating to foreign trade and investment. Such changes in laws, regulations and conditions could result in a significant increase in our expenses for regulatory compliance or require us to alter our operations, which may have a material adverse effect on our financial condition and results of operations and negatively impact our business prospects. The price of our common stock could decline as a result.
Our revenues may be adversely affected by fluctuations in currency exchange rates.
Nearly all of our revenues are generated outside of the United States. However, we report our financial condition and results of operations in U.S. dollars. As a result, any fluctuation between the U.S. dollar and the currencies of the countries in which we operate will impact the amount of revenues and expenses that we report. If foreign currencies depreciate relative to the U.S. dollar, there will be a negative impact on the
15
Table of Contents
revenues we report due to such fluctuation. It is possible that the impact of currency fluctuations will result in a decrease in reported sales even though we have experienced an increase in sales when reported in the applicable foreign currency. Such a decrease in reported U.S. sales occurred in Australia for the year ended June 30, 2009 as our Australian revenues decreased 4% when measured in U.S. dollars but increased 16% when measured in Australian dollars. Foreign currency exchange rates in the markets in which we operate have been subject to substantial fluctuation. For example, the approximate exchange rates to U.S. dollars from Australian dollars applicable to our income statement data for fiscal years 2011, 2010, 2009, 2008, 2007, 2006, 2005, 2004 and 2003 are as follows:
| Fiscal Year |
Exchange Rate | |||||||||
| 2011 |
0.9907 | |||||||||
| 2010 |
0.8825 | |||||||||
| 2009 |
0.7446 | |||||||||
| 2008 |
0.8969 | |||||||||
| 2007 |
0.7859 | |||||||||
| 2006 |
0.7473 | |||||||||
| 2005 |
0.7539 | |||||||||
| 2004 |
0.7140 | |||||||||
| 2003 |
0.5850 | |||||||||
Although we have not hedged our exposure to foreign currency exchange rate changes in the past, we may choose to do so in the future. There is no guarantee such hedging, if undertaken, will be successful.
If we fail to expand into new markets, we may be unable to increase our revenue and expand our profits in the future.
Although our current business operations are conducted in Australia, Canada and the United Kingdom, we intend to explore future opportunities to expand our operations into additional international markets as opportunities present themselves and as our financial resources permit. Our continued growth and expansion as a company is dependent, in part, on our ability to establish relationships with radio and television stations in new international markets by developing new operations or acquiring existing operations. We have begun to explore opportunities for expansion into several markets. To date, however, we have not contracted to provide services to any radio or television stations in any market other than Australia, Canada and the United Kingdom and we have no commitments or agreements with respect to any stations in these additional markets. Despite our interest and recent activities in exploring expansion into additional international markets, there can be no assurance that we will be able to establish operations in new markets or that we will be able to finance such expansions in the future. Further, if we do expand into additional markets, we may encounter unforeseen operating challenges and expenses that may require a significant amount of management time that otherwise would be devoted to running our operations, which may harm the quality of our services and products.
Inexperience in additional international markets increases the risk that international expansion efforts will not be successful.
Expansion into international markets requires significant management attention and financial resources, and our ability to provide radio traffic reports profitably in Australia may not be indicative of our future results in Canada, the United Kingdom or in any other country in which we may attempt to expand. Certain members of our management and board of directors have experience in operating a business similar to ours in Japan. In 1999, William L. Yde III, our Chairman, President and Chief Executive Officer, and Dale C. Arfman, a member of our board of directors, among others, founded Nihon (Japan) Traffic Network, a Japanese entity unrelated to us, which operated a traffic reporting service in the Japanese market (“Japan Traffic Network”). Japan Traffic Network invested significant funds in starting its Japanese operations and experienced a net loss of approximately $8 million from its inception in 1999 until January 2002, after which Japan Traffic Network ceased its operations. Gary O. Benson, another one of our directors, was a director of Japan Traffic Network. The risks and obstacles Japan Traffic Network faced in introducing operations in Japan are indicative of the types of risks and obstacles we may face generally if and when we expand into additional international markets, including:
| • | challenges caused by distance, language and cultural differences; |
| • | increased labor costs as a result of the existence or prevalence of collective bargaining arrangements, prevailing compensation structures and other employment-related matters; |
16
Table of Contents
| • | legal, legislative and regulatory restrictions; |
| • | foreign exchange controls that might prevent us from repatriating cash earned in countries outside the United States; |
| • | longer payment cycles in some countries; |
| • | potentially adverse tax consequences in the United States and in the foreign countries in which we operate; |
| • | nationalization or seizure of private assets; and |
| • | higher costs associated with doing business internationally. |
These risks and obstacles may prevent us from operating profitably in any international market into which we attempt to expand our operations. If we attempt to expand into additional international markets but are unable to do so successfully, such a failed attempt could have a material adverse effect on our financial condition and results of operations, negatively impacting our business prospects and the price of our common stock.
If we fail to secure adequate financing in the future, our continued growth and financial performance may suffer.
Our expansion into new Australian, Canadian, United Kingdom and other international markets and continued growth of our services in these markets may require significant additional capital resources. These future capital needs are difficult to predict. We may require additional capital in order to implement an expanded business model, to take advantage of certain opportunities, including strategic alliances and potential acquisitions, or to respond to changing business conditions and unanticipated competitive pressures. Moreover, our day-to-day operations require the use of sophisticated equipment and technology. The maintenance and replacement of such equipment requires significant expenditures. In addition, the development of Global Alert Networks’ mobile phone applications could require significant amounts of capital in order to pursue the opportunity, with no guarantee of future profitability. We used $16.1 million to fund our purchase of Unique in March 2009, including our settlement of the related contingent payment obligations. These payments constituted a significant portion of our cash on hand at the time of the closing. Although we believe that our current cash and cash equivalents and the availability of financing under our line of credit will be sufficient to fund our operations for the next 12 months, we may need to seek additional funds either by borrowing money or issuing additional equity in order to handle unforeseen contingencies or take advantage of new opportunities. As the terms and availability of financing depend to a large degree upon general economic conditions and third parties over which we have no control, we can give no assurance that we will obtain the needed financing or that we will obtain such financing on attractive terms. In addition, our ability to obtain financing depends on a number of other factors, many of which are also beyond our control, such as interest rates and national and local business conditions. If the cost of obtaining needed equity or debt financing is too high or the terms of such equity or debt financing are otherwise unacceptable in relation to the strategic opportunity we are presented with, we may be unable to take advantage of new opportunities or take other actions that otherwise might be important to our business or prospects. Additional indebtedness could increase our leverage and make us more vulnerable to economic downturns and may limit our ability to withstand competitive pressures. Additional equity financing could result in dilution to our stockholders and the price of our common stock could decline as a result.
If we fail to manage our growth effectively by investing in the necessary infrastructure, the quality of our products and services may suffer, negatively impacting our Affiliate Contracts.
Pursuant to our business plan, we have experienced, and continue to experience, rapid expansion of our business and operations which has placed, and will continue to place, significant demands on our management, operational, technical and financial infrastructure. Since March 2005, we have introduced advertising in radio news reports and expanded our provision of TV reports in Australia, commenced traffic operations in eight Canadian markets and acquired a competitor in Canada. In the United Kingdom, we have commenced operations of a traffic reporting service, initiated providing service to the Highways Agency and acquired Unique, the largest traffic and entertainment news network in the market. Continued growth will require continued investment in personnel, facilities, technology infrastructure, and financial and management systems and controls, especially if we expand our Canadian and Global Alert Network operations as currently contemplated. If we do not effectively manage our growth, the quality of our products and services could suffer, which could negatively affect our Affiliate Contracts and our relationships with network affiliates, potentially resulting in the termination of such Affiliate Contracts and a decrease in our commercial advertising inventory. Furthermore, expansion could result in our expenses increasing faster than our revenue, causing our operating margins to be adversely affected in the short-term and the long-term.
Aircraft operations involve risks that may not be covered by our insurance or may increase our operating costs.
In February 2007, a helicopter owned by Canadian Traffic Network, but operated by a third-party vendor, crashed during a maintenance flight. Although none of our employees and no personnel of our network affiliates were in the helicopter at the time of the accident, and the majority of the replacement cost was covered by the third-party vendor’s insurance, the crash is an example of how the operation of aircraft inherently involves a degree of risk. Hazards such as harsh weather, mechanical failures, pilot error, acts of terrorism, crashes, collisions and
17
Table of Contents
emergency safety landings may impact our business and can result in personal injury, loss of life, damage to property and equipment and suspension or reduction of operations, temporarily or indefinitely. In addition, if one of our aircraft were to crash or be involved in an accident, we could be exposed to significant tort liability and substantial unforeseen expenses. Even when such hazards do not lead to injury, loss of life or damage to property and equipment, their occurrence can result in negative publicity regarding us and our industry in the markets in which we operate. Harm to our public image may, in turn, adversely affect our ability to enter into new Affiliate Contracts or renew existing Affiliate Contracts, or to arrange for the sale of our commercial advertising inventory, any of which could negatively affect our results of operations.
We attempt to protect ourselves against these losses and damage by carrying insurance, including general liability, aviation, workers’ compensation and property and casualty insurance. Our insurance coverage is subject to deductibles and maximum coverage amounts, and we do not carry insurance for all types of losses, including business interruption and terrorism. We cannot assure you that our existing coverage will be sufficient or that in the future we will be able to maintain our existing coverage or that the premiums will not increase substantially. In addition, future events, including, without limitation, terrorist activity, accidents or other events could increase our insurance rates. The loss of our liability insurance coverage or inadequate coverage from our liability insurance could result in our exposure to substantial unforeseen expenses and subsequent reductions in our earnings.
In addition, we are subject to regulations and restrictions with regard to our operation of our aircraft in Australia. Violations of these regulations and restrictions could result in monetary penalties or the revocation of our air operating certificates. Although monetary penalties would have an impact on our results of operations if material in amount, the loss of our air operating certificates could result in temporary or permanent grounding of our aircraft, which would have a material adverse effect on our business operations and could result in a substantial loss of revenues or increase in expenses.
A substantial majority of our expenses are fixed and cannot be reduced in the short term.
With the exception of commissions and bonuses paid to our sales staff and management and variable compensation to certain radio station affiliates in the United Kingdom, the vast majority of our costs are fixed regardless of the level of our revenue. Station compensation, which is our largest cost, is generally contractually obligated for a number of years at any point in time and cannot generally be modified even if our revenues decline. As a result, a decrease in revenues will likely have a material adverse impact on profitability which could in turn lead to a reduction in the price of our common stock.
The loss of the services of William L. Yde III, our Chairman, Chief Executive Officer and President, or Scott E. Cody, our Chief Operating Officer, Chief Financial Officer and Treasurer, or other key employees, or the failure to attract additional key individuals, could materially adversely affect our business.
Our financial success is dependent to a significant degree upon the efforts of our current executive officers and other key employees. We have entered into employment agreements with William L. Yde III and Scott E. Cody. However, there can be no assurance that these individuals will continue to provide services to us. A voluntary or involuntary termination of employment by Messrs. Yde or Cody could have a material adverse effect on our business operations and negatively impact the price of our common stock. At present, we do not maintain key man life insurance policies for any of these individuals.
Our success and viability is also dependent to a significant extent upon our ability to attract and retain qualified personnel in all areas of our business, especially our management, sales professionals and on-air broadcasters who become recognizable personalities for the radio and television stations for whom they deliver information reports. Although our Affiliate Contracts and/or non-competition agreements with our employees generally prevent stations from hiring our employees, there is no assurance that we will be able to retain our most recognizable on-air broadcasters or that such contractual restrictions will be enforceable. Our employee relations and related labor costs may be impacted by collective bargaining arrangements, prevailing compensation structures or other employment-related matters. If we are unable to retain broadcasters or attract replacements for them, our network affiliates may become dissatisfied with our delivery of information reports potentially resulting in the cancellation of Affiliate Contracts, a subsequent reduction in commercial advertising inventory and the loss of advertising revenue.
Our operations are out-sourced to third parties in the United Kingdom.
In the United Kingdom, our traffic reporting services for radio stations and our entertainment news reporting services are out-sourced to third parties pursuant to contracts that were in place when we purchased Unique. While we spend considerable time and effort monitoring the performance of these vendors, ultimately their actions are not under our control. Among other things, it is conceivable that one or more of our vendors could cease servicing their contracts with us or go out of business altogether with little or no notice to us. In addition, the agreement governing our receipt of traffic information has a term ending December 31, 2012 and has substantial restrictions on our ability to service our traffic network affiliates directly as well as significant hurdles should we attempt to cancel the agreement, even in the case of a breach. Should important affiliates become dissatisfied with the service provided and cancel their affiliation agreements, our radio commercial advertising inventory may decrease significantly. As a result, we would likely experience a corresponding decrease in revenues from sales of our radio commercial advertising inventory, which may be compounded by the decrease in value of our United Kingdom advertising network as a whole due to the reduction in our U.K. audience reach. It is also possible that we would be forced to spend more money than we currently do to satisfy our network affiliates and prevent them from cancelling their contracts with us. Should this occur, it would likely have a material adverse effect on our financial condition and results of operations and negatively impact our business prospects and the price of our common stock could decline as a result.
18
Table of Contents
Our broadcasts are subject to regulatory bodies whose rules and regulations may adversely affect our business.
The ownership, operation and sale of radio and television stations in Australia, Canada and the United Kingdom, and therefore our network affiliates in those markets, are subject to the jurisdiction, regulations and policies of the of the Australian Communications and Media Authority (the “ACMA”), the Canadian Radio-television and Telecommunications Commission (the “CRTC”) and the United Kingdom’s Office of Communications (“Ofcom”), respectively. Such regulation also extends to the content of the information reports and advertising spots we provide to our network affiliates. Among other things, the ACMA, the CRTC and Ofcom adopt and implement regulations and policies that directly or indirectly affect the ownership, operations and sale of radio and television stations, and have the power to impose penalties for violations of their rules. In addition, our violations of the regulations or policies of the ACMA, the CRTC or Ofcom may be a breach of certain of our network affiliates’ contracts. Such regulations may adversely affect our business. We expect to be subject to similar regulations in other geographic markets we enter.
Because our operating subsidiaries are organized under the laws of foreign jurisdictions and substantially all of our assets are located outside of the United States, you may have difficulties collecting on judgments rendered against us in United States courts.
We are a Nevada corporation with executive officers and directors that reside in the United States. However, Australia Traffic Network, Canadian Traffic Network and UK Traffic Network, our subsidiaries that conduct our current operations, are organized as an Australian proprietary company, an Alberta business corporation, and a private company limited by shares incorporated in England and Wales, respectively. Because substantially all of our assets are owned by these subsidiaries and are located outside of the United States, if stockholders or other third parties obtain judgments against us in United States courts (including judgments based upon the civil liability provisions of the United States federal securities laws), they may be required to seize the equity interests of our foreign subsidiaries in satisfaction of such judgments. Because these subsidiaries are foreign entities, an attempt to seize our equity interests could be frustrated by objections raised in the applicable foreign jurisdiction to the transfer of such interests. Therefore, our stockholders and others may have difficulties in enforcing and collecting upon any potential judgments rendered against us in United States courts.
We have been, and will continue to be, required to implement and maintain additional finance and accounting systems, procedures and controls in order to satisfy requirements under the Sarbanes-Oxley Act of 2002 and the listing requirements of the NASDAQ Global Market, which increase our costs and divert management’s time and attention.
Laws and regulations affecting public companies, including the provisions of the Sarbanes-Oxley Act of 2002 and the listing requirements for the NASDAQ Global Market, have imposed duties on us and on our executives, directors, attorneys and independent registered public accounting firms. In order to comply with these rules, we have engaged additional outside legal, accounting and advisory services, all of which may continue to increase our operating expenses in the future. In particular, we have incurred additional administrative expenses relating to compliance with provisions of the Sarbanes-Oxley Act of 2002 which require that we implement and maintain an effective system of internal controls over financial reporting and assess the effectiveness of such internal controls in the periodic reports that we file with the Securities and Exchange Commission. Those costs were approximately $0.2 million, $0.3 million and $0.3 million for the years ended June 30, 2011, 2010 and 2009, respectively. In addition, as an “accelerated filer” under the Securities Exchange Act of 1934 as of the last day of our fiscal year, our independent registered public accounting firm will be required to attest to our internal controls over financial reporting in our Annual Report on Form 10-K for such fiscal year. As a company with limited accounting resources, a significant amount of management’s time and attention has been diverted from our business to ensure compliance with these regulatory requirements. This diversion of management’s time and attention may have a material adverse effect on our business, financial condition and results of operations.
In the event we identify significant deficiencies or material weaknesses in our internal controls over financial reporting that we cannot remediate in a timely manner, or if we are unable to receive a positive attestation from our independent registered public accounting firm with respect to our internal controls over financial reporting, investors and others may lose confidence in the reliability of our financial statements. If this occurs, the trading price of our common stock and ability to obtain any necessary equity or debt financing could suffer. In addition, in the event that our independent registered public accounting firm is unable to rely on our internal controls over financial reporting in connection with its audit of our financial statements, and in the further event that it is unable to devise alternative procedures in order to satisfy itself as to the material accuracy of our financial statements and related disclosures, we may be unable to file our periodic reports with the Securities and Exchange Commission. This would likely have an adverse affect on the trading price of our common stock and our ability to secure any necessary additional equity or debt financing, and could result in the delisting of our common stock from the NASDAQ Global Market, which would severely limit the liquidity of our common stock.
In the absence of an active trading market for shares of our common stock, the price of our common stock may be subject to wide fluctuations and you may find it difficult to resell shares of our common stock.
Since the effective date of our initial public offering, there have been times of limited trading activity in shares of our common stock. If such limited trading volume recurs in the future, you may find it difficult to resell shares of our common stock publicly when you choose. Furthermore, small trading volumes generally depress market prices. As a result, you may not always be able to resell shares of our common stock publicly at the time and prices that you feel are fair or appropriate. You may not receive a positive return on your investment when you sell your shares and you may lose the entire amount of your investment.
19
Table of Contents
The market price of our common stock has been and is likely to continue to be volatile and subject to fluctuations in response to various factors, many of which are beyond our control. These factors may include, without limitation:
| • | variations in our operating results; |
| • | addition or loss of significant network affiliates or advertisers; |
| • | changes in the economies in which we provide our information services; |
| • | the departure of the Chairman of our board of directors or other key executive officers; |
| • | the level and quality of securities analysts’ coverage of our common stock; |
| • | announcements by us or our competitors of significant contracts, acquisitions, strategic partnerships, joint ventures or capital commitments; |
| • | entry into new international markets and the costs associated therewith; |
| • | changes in the governmental regulations to which we will be subject in various countries; |
| • | announcements by third parties of significant claims or proceedings against us; |
| • | the availability of new media for delivery of traffic and news reporting services; and |
| • | future sales of our common stock or other debt or equity securities, including sales by existing holders. |
In the past, following periods of volatility in the market price of a public company’s securities, securities class action litigation has been instituted against the public company. Regardless of its outcome, should this type of litigation be instituted against us, it could result in substantial costs to us and a likely diversion of our management’s attention from our business operations.
The concentration of our common stock ownership by our current management will limit your ability to influence corporate matters.
As of August 31, 2011, directors and executive officers own or are able to vote in the aggregate approximately 19.4% of our issued and outstanding common stock. As such, our directors and executive officers, as stockholders, have significant influence to elect any or all of our directors, as well as influence in connection with all corporate activities, including mergers, proxy contests, tender offers or other purchases of our common stock that could give our stockholders the opportunity to realize a premium over the then prevailing market price for their shares of our common stock. This concentrated control will limit your ability to influence corporate matters and, as a result, we may take actions that you do not view as beneficial. In addition, such concentrated control could discourage others from initiating changes of control of us. In such cases, the perception of our prospects in the market may be adversely affected and the market price of our common stock may decline.
Our Board of Directors’ ability to issue “blank check” preferred stock and any anti-takeover provisions we adopt may depress the value of our common stock.
Our certificate of incorporation authorizes 10,000,000 shares of “blank check” preferred stock. Our Board has the power to issue any or all of the shares of such preferred stock, including the authority to establish one or more series and to fix the powers, preferences, rights and limitations of such class or series, without seeking the approval of our common stockholders, subject to certain limitations on this power under the listing requirements of the NASDAQ Global Market and the laws of the state of Nevada. The authority of our Board to issue “blank check” preferred stock, along with any future anti-takeover measures we may adopt, may, in certain circumstances, delay, deter or prevent takeover attempts and other changes in control of us not approved by our Board. As a result, our stockholders may lose opportunities to dispose of their shares of our common stock at favorable prices generally available in takeover attempts or that may be available under a merger proposal and the market price of our common stock and the voting and other rights of our stockholders may also be affected.
Our common stock could be delisted from the NASDAQ Global Market, which delisting could hinder your ability to obtain accurate quotations on the price of our common stock, or dispose of our common stock in the secondary market.
In order to maintain our listing on the NASDAQ Global Market, our common stock must sustain a minimum bid price of at least $1.00 per share and we must satisfy the other requirements for continued listing on the NASDAQ Global Market. In the event our common stock is delisted from the NASDAQ Global Market and we are also unable to maintain a listing on another alternate exchange, trading in our common stock could thereafter be conducted in FINRA’s OTC Bulletin Board or in the over-the-counter markets in the so-called “pink sheets”. In such event, the liquidity of our common stock would likely be impaired, not only in the number of shares which could be bought and sold, but also through delays in the timing of the transactions, and there would likely be a reduction in our coverage by security analysts and the news media, thereby resulting in lower prices for our common stock than might otherwise prevail.
20
Table of Contents
Because we do not intend to pay dividends on our common stock, you must rely on stock appreciation for any return on your investment.
We intend to retain any future earnings and do not expect to pay any dividends in the foreseeable future. As a result, you must rely on stock appreciation and a liquid trading market for any return on your investment in our common stock.
Failure to complete the Merger could negatively impact the Company and its future operations.
If the Offer and Merger are not completed for any reason, the Company may be subjected to a number of material risks, including but not limited to:
| • | The current market price of our common stock may reflect, among other things, the commencement and anticipated completion of the Offer and Merger. The current market price is higher than the price before the proposed Offer was announced on August 3, 2011. The completion of the Offer and Merger are subject to conditions and termination rights contained in the Merger Agreement. Accordingly, there can be no assurance that the proposed Offer and Merger will be completed. In the event that the Offer and Merger are not completed, our stock price may be materially and adversely affected. |
| • | The uncertainty associated with a potential change in control of our Company could negatively affect our ability to retain and attract key management, sales, marketing and other personnel which we rely on to operate our business. |
| • | Our customers, suppliers and marketing partners may delay or defer decisions relating to their ongoing and future relationships with us or terminate their relationships with us, which could negatively affect our revenues, earnings and cash flows. |
| • | We will incur significant costs, including financial and legal advisory fees, relating to the proposed Offer and Merger even if the proposed transactions are not completed. |
| • | Under the Merger Agreement, we may be required to pay to GTCR Gridlock Acquisition Sub, Inc. a termination fee of approximately $8.3 million if the Merger Agreement is terminated under certain circumstances. |
Litigation and uncertainties associated with the transactions contemplated by the Merger Agreement may have a material adverse effect on our ability to complete the transaction.
A purported shareholder of the Company, on behalf of itself and as putative class action on behalf of the Company’s public shareholders, filed a complaint on August 31, 2011. The complaint names as defendants the Company and members of the Company’s board of directors, among others involved. See Item 3. “Litigation” and Note 16 to our Consolidated Financial Statements for additional information. Litigation relating to the proposed transactions contemplated by the Merger Agreement may require us to expend significant amounts of money, may require significant time from our management, and may result in an adverse settlement, injunction barring or delaying the proposed transactions, or judgments against us or our directors which could have a material adverse effect on our ability to complete such transactions which could be detrimental to our shareholders.
The Merger Agreement contains restrictive covenants that may limit our ability to respond to changes in market conditions or pursue business opportunities.
The Merger Agreement contains restrictive covenants that limit our ability to take certain actions during the period prior to the completion of the proposed Offer and Merger. Although the Merger Agreement provides that an affiliate of GTCR will not unreasonably withhold its consent to us taking otherwise prohibited actions, there can be no assurances that the affiliate will grant such consent. These restrictions include limitations on our ability to, among other things, make certain acquisitions, incur additional indebtedness, terminate, amend or enter into any material contract, make capital expenditures or enter into new lines of business, each of which may materially adversely affect our ability to react to changes in market conditions or take advantage of business opportunities, which could be detrimental to our shareholders in the event the Offer and Merger are not completed.
Item 1B. Unresolved Staff Comments
None.
We lease operation centers, broadcast studios and marketing and administrative offices in Australia, Canada and the United Kingdom. We lease approximately 11,000 square feet in the aggregate in Australia, approximately 19,000 square feet in the aggregate in Canada, approximately 4,000 square feet in the aggregate in the United Kingdom pursuant to the terms of various lease agreements. For the year ended June 30, 2011, we incurred approximately $1.3 million in facilities rental expense.
21
Table of Contents
From time-to-time, we are involved in various legal actions arising in the ordinary course of business. Currently, there are no legal matters pending the ultimate dispositions of which will, in the opinion of our management, have a material effect on our consolidated financial position and results of operations. In addition, a purported shareholder of the Company, on behalf of itself and as putative class action on behalf of the Company’s public shareholders, filed a complaint on August 31, 2011. The complaint names as defendants the Company and members of the Company’s board of directors, among others involved. See Note 16 to our Consolidated Financial Statements for additional information.
Item 5. Market for Registrant’s Common Equity and Related Stockholder Matters.
As of August 8, 2011, we had approximately 20 shareholders of record and an estimated 2,000 beneficial shareholders.
The Company’s common stock is traded on NASDAQ Global Market under the stock symbol “GNET”. The following table sets forth the range of high and low sales prices of the Company’s the common stock on NASDAQ for the calendar quarters indicated.
| High | Low | |||||||
| Fiscal 2011 |
||||||||
| Quarter Ended September 30, 2010 |
$ | 5.97 | $ | 4.79 | ||||
| Quarter Ended December 31, 2010 |
$ | 9.74 | $ | 4.95 | ||||
| Quarter Ended March 31, 2011 |
$ | 13.21 | $ | 9.29 | ||||
| Quarter Ended June 30, 2011 |
$ | 13.85 | $ | 9.97 | ||||
| Fiscal 2010 |
||||||||
| Quarter Ended September 30, 2009 |
$ | 5.10 | $ | 3.59 | ||||
| Quarter Ended December 31, 2009 |
$ | 5.60 | $ | 3.85 | ||||
| Quarter Ended March 31, 2010 |
$ | 5.72 | $ | 4.23 | ||||
| Quarter Ended June 30, 2010 |
$ | 6.39 | $ | 4.75 | ||||
The closing sales price for the Company’s common stock on August 31, 2011 was $14.00.
22
Table of Contents
STOCK PERFORMANCE GRAPH
The Securities and Exchange Commission, requires that we include in this report a line-graph presentation comparing cumulative return to our stockholders (based on appreciation of the market price of our common stock) on an indexed basis with (i) a broad equity market index and (ii) an appropriate published industry or line-of-business index, or peer group index constructed by us. The following presentation compares our common stock price for the period from June 30, 2006 through June 30, 2011, to the Nasdaq Composite Index and to the Dow Jones Wilshire Microcap Index.
We have elected to use the Dow Jones Wilshire Microcap Index in compiling our stock performance graph because we believe the Dow Jones Wilshire Microcap Index represents a comparison to companies with similar market capitalization as ours.
The presentation assumes that the value of an investment in each of our common stock, the Nasdaq Composite Index and the Dow Jones Wilshire Microcap Index was $100 on June 30, 2006, and that any dividends paid were reinvested in the same security.
Comparison of Five Year Cumulative Total Returns
Performance Graph for
Global Traffic Network, Inc.
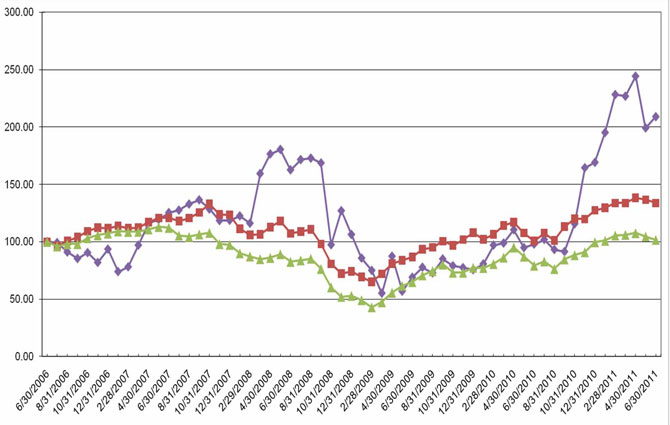
Legend
| Symbol |
Total Returns Index For: |
6/30/2006 | 6/30/2007 | 6/30/2008 | 6/30/2009 | 6/30/2010 | 6/30/2011 | |||||||||||||||||||
| ¿ | Global Traffic Network Inc. | 100.00 | 125.27 | 162.55 | 68.91 | 97.82 | 208.91 | |||||||||||||||||||
| n | NASDAQ Composite – Total Return | 100.00 | 120.71 | 107.21 | 86.70 | 100.61 | 133.67 | |||||||||||||||||||
| p | Dow Jones US Wilshire MicroCap | 100.00 | 112.15 | 82.60 | 64.98 | 79.25 | 101.77 | |||||||||||||||||||
Notes:
| A. | The lines represent monthly index levels derived from compounded daily returns that include all dividends. |
| B. | The indexes are reweighted daily, using the market capitalization on the previous trading day. |
| C. | If the monthly interval, based on the fiscal year-end, is not a trading day, the preceding trading day is used. |
| D. | The index level for all series was set to $100.00 on 6/30/2006. |
Prepared by Zacks Investment Research,Inc. Used with Permission. All rights reserved.
23
Table of Contents
Dividends
We have not paid any dividends during the fiscal years ended June 30, 2011 and 2010 or during the interim period through the date of this report, and we do not expect to pay additional cash dividends or make any other distributions in the foreseeable future. We expect to retain our future earnings, if any, for use in the operation and expansion of our business. The payment of cash dividends in the future, if any, will be at the discretion of our Board and will depend upon such factors as earnings levels, capital requirements, our overall financial condition and any other factors deemed relevant by our Board.
Item 6. Selected Financial Data
The selected financial data presented below should be read in conjunction with the consolidated financial statements and notes included elsewhere in this Form 10-K, and in conjunction with “Management’s Discussion and Analysis of Financial Condition and Results of Operations” included elsewhere in this Form 10-K.
The selected financial data as of June 30, 2011, 2010, 2009, 2008 and 2007 and for the fiscal years then ended have been derived from the audited consolidated financial statements of the Company.
In thousands except per share data
| 2011 | 2010 | 2009 | 2008 | 2007 | ||||||||||||||||
| Income statement data for the year ended June 30: |
||||||||||||||||||||
| Revenues |
$ | 117,401 | $ | 93,335 | $ | 60,337 | $ | 50,953 | $ | 31,699 | ||||||||||
| Operating expenses (exclusive of depreciation and amortization expense shown separately below) |
73,693 | 63,266 | 40,937 | 30,456 | 21,835 | |||||||||||||||
| Selling, general and administrative expenses |
25,414 | 21,038 | 15,615 | 15,214 | 10,120 | |||||||||||||||
| Depreciation and amortization |
5,975 | 5,326 | 2,547 | 1,500 | 907 | |||||||||||||||
| Net operating income (loss) |
12,319 | 3,705 | 1,238 | 3,783 | (1,163 | ) | ||||||||||||||
| Interest expense |
— | 15 | 39 | 90 | 170 | |||||||||||||||
| Other (income) (net) |
(1,189 | ) | (935 | ) | (973 | ) | (1,604 | ) | (546 | ) | ||||||||||
| Net income (loss) before taxes |
13,508 | 4,625 | 2,172 | 5,297 | (787 | ) | ||||||||||||||
| Income tax expense |
4,565 | 3,998 | 3,257 | 3,565 | 1,230 | |||||||||||||||
| Net income (loss) |
8,943 | 627 | (1,085 | ) | 1,732 | (2,017 | ) | |||||||||||||
| Income (loss) per common share: |
||||||||||||||||||||
| Basic |
$ | 0.49 | $ | 0.03 | $ | (0.06 | ) | $ | 0.10 | $ | (0.16 | ) | ||||||||
| Diluted |
$ | 0.48 | $ | 0.03 | $ | (0.06 | ) | $ | 0.10 | $ | (0.16 | ) | ||||||||
In thousands
Balance sheet data at June 30:
| 2011 | 2010 | 2009 | 2008 | 2007 | ||||||||||||||||
| Cash and cash equivalents |
$ | 41,655 | $ | 19,564 | $ | 21,419 | $ | 37,541 | $ | 7,278 | ||||||||||
| Total assets |
93,275 | 65,088 | 69,170 | 62,602 | 23,840 | |||||||||||||||
| Long-term obligations |
3,877 | 3,096 | 3,785 | 871 | 1,161 | |||||||||||||||
| Total liabilities |
25,793 | 16,921 | 21,866 | 13,876 | 9,007 | |||||||||||||||
| Stockholders’ equity |
67,482 | 48,167 | 47,304 | 48,726 | 14,833 | |||||||||||||||
24
Table of Contents
Item 7. Management’s Discussion and Analysis of Financial Condition and Results of Operations
EXECUTIVE OVERVIEW
We provide traffic and news information reports to radio and television stations in international markets. We are the largest provider of traffic information reports to radio stations in Australia, Canada and the United Kingdom and we provide traffic information reports to television stations in Australia and Canada. We also provide entertainment news reports to radio stations in the United Kingdom and we believe that we maintain the largest inventory of commercial advertising embedded in radio news reports in Australia. We derive a substantial majority of our revenues from the sale to advertisers of commercial advertising inventory associated with these information reports. We obtain this advertising inventory from radio and television stations in exchange for information reports and/or, for certain broadcasters, cash compensation. Although we are a Nevada corporation with principal executive offices located in New York, New York, we do not provide, nor do we intend to provide traffic or news reports to radio or television stations in the United States. However, we do offer our mobile traffic products to radio and television stations in the United States.
Our operations are conducted through the following wholly owned direct and indirect subsidiaries:
| • | Australia Traffic Network; |
| • | Canadian Traffic Network; |
| • | UK Traffic Network & UK Commercial Traffic Network; and |
| • | Global Alert Network |
Global Traffic Network, Inc. is a holding company and conducts no operations. Unless we indicate otherwise, the discussions below regarding our financial condition and results of operations present information on a consolidated basis and all material inter-company transactions and balances have been eliminated.
The Services We Provide — Radio Traffic Reports, Radio News Reports and TV Reports.
The information reports we provide to radio and television stations are divided into three categories, radio traffic reports, radio news reports and TV reports, based on the content of the report and the medium in which it is delivered. Collectively, we refer to these reports as our “information reports.”
The radio stations that contract to provide us with traffic and news report advertising inventory become members of our “Radio Network.” Likewise, the television stations that contract to receive our TV reports become members of our “TV Network.” Collectively, we refer to the members of these networks as our “network affiliates.” We currently offer radio traffic and television traffic reports and video footage to our network affiliates in Australia, while obtaining radio news report advertising inventory by paying cash compensation to our news network affiliates. We currently provide radio traffic reports and TV reports to our network affiliates in Canada. In the United Kingdom, we provide radio stations with traffic and entertainment news information and reports that are provided through third party out-source providers that we compensate.
Our Sources of Revenue — Sale of Commercial Airtime Inventory
In exchange for providing our information reports and/or, for certain broadcasters, cash compensation, our network affiliates provide us with commercial advertising inventory. We generate revenues by packaging and selling this commercial advertising inventory for cash to advertisers on a local, regional or national network basis, except in the United Kingdom where it is sold on a national basis only. To date, we have recognized no revenue related to the bartering of goods and services and do not anticipate entering into barter transactions for the sale of our commercial advertising inventory in the future.
The majority of our revenues have been generated from our Australian operations, including approximately $69.7 million, or 59%, of our revenues for year ended June 30, 2011. Approximately $49.6 million, or 42% of our total revenue for fiscal 2011, has been generated from the sale of commercial advertising inventory related to our Australian radio traffic reports. For the year ended June 30, 2010, approximately $56.5 million, or 60% of our revenues, was generated by our Australian operations and approximately $41.7 million, or 45%, was generated from the sale of commercial advertising inventory related to our Australian radio traffic reports. For the year ended June 30, 2009, approximately $42.7 million, or 71% of our revenues, was generated by our Australian operations and approximately $32.1 million, or 53%, was generated from the sale of commercial advertising inventory related to our Australian radio traffic reports. We expect to accumulate increasing amounts of commercial advertising inventory from our Australian operations as we continue to obtain more news report inventory in Australia. We began generating revenue in Canada in 2006 and currently have operations in eight Canadian cities: Calgary, Toronto, Hamilton, Vancouver, Montreal, Ottawa, Edmonton and Winnipeg. We anticipate expanding our radio and television advertising inventory primarily by adding new network affiliates in our existing markets, as we have not penetrated the Canadian markets to the extent that we have done so in Australia or United Kingdom. However, we will continue to explore the expansion of our advertising inventory by both the introduction of new products as well as entering new Canadian markets. We obtained the majority of our United Kingdom radio advertising inventory as a result of our acquisition of The Unique Broadcasting Company Limited (“Unique”) on March 1, 2009, which we subsequently renamed UK Commercial Traffic Network. We are actively seeking to expand the amount of our traffic and entertainment news inventory from both new and existing radio affiliates in the United Kingdom. As commercial advertising inventory generated from our Australian, Canadian and United Kingdom operations increase, we expect to sell the increased commercial advertising inventory in the same manner as we have sold commercial advertising inventory generated from our provision of radio traffic reports in Australia. Our experience indicates, however, that there is generally a delay between acquiring commercial advertising inventory from new or expanded operations and the realization of increasing revenues from the sale of such inventory. We expect to experience such delays in realizing revenues from the sale of commercial advertising inventory associated with additional radio news reports in Australia, our provision of radio traffic reports in Canada and increases in radio advertising inventory in the United Kingdom.
Our Expenses
Our expenses are primarily comprised of three categories: operating expenses, selling expenses and general and administrative expenses. Operating expenses consist of station compensation and all expenses related to the gathering, producing, and broadcasting of our information reports, including aviation costs and expenses, salaries and benefits for our on-air personalities who deliver the information reports and payments to third parties that provide information and reporting services. Station compensation consists of the reimbursement of expenses incurred by stations which we would otherwise incur in providing services to the station, as well as any additional cash consideration paid to a network affiliate in exchange for commercial advertising inventory. We may incur increased expenses in the form of station compensation in connection with adding certain broadcasters to our base of network affiliates. As mentioned above, our experience indicates that in such instances there is generally a delay between acquiring commercial advertising inventory from new network affiliates and the realization of increased revenue from the sale of such inventory. Aviation costs relate to the costs of our airborne surveillance, an integral part of our information gathering in Australia and Canada, and consist both of payments to outside vendors to lease aircraft and the operating costs (including fuel, maintenance, and insurance costs) associated with the operation of our fleet of owned aircraft. A table outlining our fleet of
25
Table of Contents
owned and leased aircraft is set forth under Item 1- Business – Our Business Model, Products and Services – Preparation of Information Reports. Selling expenses include salaries and benefits for our sales personnel and commissions paid on sales of our commercial advertising inventory. General and administrative expenses consist of corporate overhead, including administrative salaries, real property lease payments, insurance, salaries and benefits for our corporate executive officers, compensation expense related to stock options and restricted stock and legal and accounting fees. Expenses other than selling expenses are generally incurred evenly over the applicable fiscal year.
Basis of Presentation
We derive substantially all of our revenue and incur a substantial majority of our expenses from our Australian, Canadian and United Kingdom operations. However, the financial information contained in this Form 10-K, including the financial statements, report our financial condition and results of operation in United States dollars and unless stated otherwise, all references to monetary amounts refer to United States dollars. Income statement amounts are converted from Australian dollars, Canadian dollars or British pounds to United States dollars based on the average exchange rate for each quarterly period covered. Assets and liabilities are converted based on the exchange rate as of the applicable balance sheet date. Equity is converted based on the exchange rate in place at the time of the applicable investment. Foreign currency translation adjustments occur when the income statement and balance sheet are converted at different exchange rates and are recognized as other comprehensive income or loss in the financial statements. For reference, the exchange rates from Australian dollars, Canadian dollars and British pounds to United States dollars applicable to our income statement data for each of the three month periods ended June 30, 2011, 2010, and 2009, March 31, 2011, 2010 and 2009, December 31, 2010, 2009 and 2008 and September 30, 2010, 2009 and 2008 and applicable to our balance sheet data as of June 30, 2011 and 2010 are set forth below:
Australia
| Income Statement Period |
Exchange Rate |
Balance Sheet Date |
Exchange Rate | |||||||
| Three month period ended June 30, 2011 |
1.0629 | June 30, 2011 | 1.0722 | |||||||
| Three month period ended March 31, 2011 |
1.0056 | |||||||||
| Three month period ended December 31, 2010 |
0.9887 | |||||||||
| Three month period ended September 30, 2010 |
0.9057 | |||||||||
| Three month period ended June 30, 2010 |
0.8827 | June 30, 2010 | 0.8408 | |||||||
| Three month period ended March 31, 2010 |
0.9039 | |||||||||
| Three month period ended December 31, 2009 |
0.9094 | |||||||||
| Three month period ended September 30, 2009 |
0.8340 | |||||||||
| Three month period ended June 30, 2009 |
0.7611 | |||||||||
| Three month period ended March 31, 2009 |
0.6645 | |||||||||
| Three month period ended December 31, 2008 |
0.6654 | |||||||||
| Three month period ended September 30, 2008 |
0.8875 | |||||||||
Canada
| Income Statement Period |
Exchange Rate |
Balance Sheet Date |
Exchange Rate | |||||||
| Three month period ended June 30, 2011 |
1.0336 | June 30, 2011 | 1.0380 | |||||||
| Three month period ended March 31, 2011 |
1.0141 | |||||||||
| Three month period ended December 31, 2010 |
0.9873 | |||||||||
| Three month period ended September 30, 2010 |
0.9623 | |||||||||
| Three month period ended June 30, 2010 |
0.9719 | June 30, 2010 | 0.9399 | |||||||
| Three month period ended March 31, 2010 |
0.9606 | |||||||||
| Three month period ended December 31, 2009 |
0.9469 | |||||||||
| Three month period ended September 30, 2009 |
0.9115 | |||||||||
| Three month period ended June 30, 2009 |
0.8567 | |||||||||
| Three month period ended March 31, 2009 |
0.8037 | |||||||||
| Three month period ended December 31, 2008 |
0.8259 | |||||||||
| Three month period ended September 30, 2008 |
0.9598 | |||||||||
26
Table of Contents
United Kingdom
| Income Statement Period |
Exchange Rate |
Balance Sheet Date |
Exchange Rate | |||||||
| Three month period ended June 30, 2011 |
1.6315 | June 30, 2011 | 1.6053 | |||||||
| Three month period ended March 31, 2011 |
1.6028 | |||||||||
| Three month period ended December 31, 2010 |
1.5803 | |||||||||
| Three month period ended September 30, 2010 |
1.5510 | |||||||||
| Three month period ended June 30, 2010 |
1.4917 | June 30, 2010 | 1.4945 | |||||||
| Three month period ended March 31, 2010 |
1.5614 | |||||||||
| Three month period ended December 31, 2009 |
1.6344 | |||||||||
| Three month period ended September 30, 2009 |
1.6411 | |||||||||
| Three month period ended June 30, 2009 |
1.5522 | |||||||||
| Three month period ended March 31, 2009 |
1.4369 | |||||||||
| Three month period ended December 31, 2008 |
1.5681 | |||||||||
| Three month period ended September 30, 2008 |
1.8921 | |||||||||
As reflected above, the U.S. dollar was generally weaker compared to the currencies of the markets in which we operate during the year ended June 30, 2011, especially in Australia, our largest and most profitable market. This weakening of the U.S. dollar caused our Australian and Canadian revenues and expenses to be higher than they otherwise would be if the exchange rates were consistent for both periods. The United States dollar was stronger in the first two quarters of fiscal 2011 and weaker in the last two quarters compared to the fiscal year ended June 30, 2010 in relation to the British pound, which resulted in our revenues and expenses being both lower and higher than they otherwise would have been had exchange rates remained constant. We estimate that the impact from the currency changes in Australia, Canada and United Kingdom on our operating results for the fiscal years ended June 30, 2011, 2010 and 2009 compared to the fiscal years ended June 30, 2010, 2009 and 2008, respectively, has been to increase or (decrease) income statement data as follows:
| Year ended June 30, 2011 (in thousands) |
Year ended June 30, 2010 (in thousands) |
Year ended June 30, 2009 (in thousands) |
||||||||||
| Australia |
||||||||||||
| Revenues |
$ | 7,683 | $ | 9,221 | $ | (8,690 | ) | |||||
| Operating expenses (exclusive of depreciation and amortization expense) |
4,037 | 4,789 | (4,711 | ) | ||||||||
| Sales, general & administrative expenses |
1,548 | 1,849 | (1,752 | ) | ||||||||
| Canada |
||||||||||||
| Revenues |
769 | 1,040 | (1,042 | ) | ||||||||
| Operating expenses (exclusive of depreciation and amortization expense) |
445 | 893 | (1,113 | ) | ||||||||
| Sales, general & administrative expenses |
172 | 314 | (307 | ) | ||||||||
| United Kingdom |
||||||||||||
| Revenues |
302 | (436 | ) | (2,969 | ) | |||||||
| Operating expenses (exclusive of depreciation and amortization expense) |
226 | (401 | ) | (2,857 | ) | |||||||
| Sales, general & administrative expenses |
68 | (56 | ) | (322 | ) | |||||||
| Australia, Canada and United Kingdom combined |
||||||||||||
| Revenues |
8,754 | 9,825 | (12,701 | ) | ||||||||
| Operating expenses (exclusive of depreciation and amortization expense) |
4,708 | 5,281 | (8,681 | ) | ||||||||
| Sales, general & administrative expenses |
1,788 | 2,107 | (2,381 | ) | ||||||||
When discussing changes in income statement accounts from the year ended June 30, 2010 to the year ended June 30, 2011 and from the year ended June 30, 2009 to the year ended June 30, 2010, the analysis under “Results of Operations” below includes both the impact of currency changes and changes in revenues and expenditures in the local currency.
Seasonality of Business
We believe that advertising revenues in general vary moderately over the calendar year, with the three month period ending December 31 generally resulting in the highest revenues and the three month period ending March 31 generally resulting in the lowest revenues. This industry trend is mainly attributable to increases in the level of advertiser demand, and resulting increases in average advertising spot rates and/or number of spots sold, during the months leading up to the Christmas holiday season and lower advertiser demand following the end of the holiday season which leads to lower average advertising spot rates and/or number of spots sold during that time. We believe that this general trend in advertising revenues is applicable to our business. Over the past five fiscal years however, the financial impact of seasonality has been offset by the rapid revenue growth, and in certain cases, favorable exchange rate movements, as revenues for the quarter ending March 31 have exceeded revenues for the quarter ended September 30 during four of these five fiscal years, with the lone exception being the year ended June 30, 2009. Our revenues during the third fiscal quarter of 2009 were significantly impacted by a stronger U.S. dollar, which lowered our reported revenues in U.S. dollars. For similar reasons as outlined above, our fiscal fourth quarter has generated more revenue than fiscal second quarter for four of the past five fiscal years, with the year ended June 30, 2010 being the lone exception as revenues for the
27
Table of Contents
quarter ended December 31, 2009 exceeded revenues for the quarter ended June 30, 2010. Our expenses other than sales costs are generally spread evenly over the fiscal year. As a result, we generally experience seasonality in the amount of our net income absent growth due to the addition of new network affiliates.
Acquisition of The Unique Broadcasting Company Limited
On February 1, 2009, UK Traffic Network entered into a definitive share purchase agreement to acquire The Unique Broadcasting Company Limited (“Unique”) and the acquisition was completed effective March 1, 2009, at which point Unique was renamed Global Traffic Network (UK) Commercial Limited (“UK Commercial Traffic Network”). Consequently, our results for the years ended June 30, 2011 and 2010 include UK Commercial Traffic Network’s operations for the entire year whereas the corresponding year ended June 30, 2009 only includes four months of results for UK Commercial Traffic Network. For the year ended June 30, 2011, our net revenues and net income attributable to UK Commercial Traffic Network were approximately $28.1 million and $0.4 million, respectively. For the year ended June 30, 2010, our net revenues and net loss attributable to UK Commercial Traffic Network were approximately $23.2 million and $(0.7) million, respectively. For the year ended June 30, 2009, our net revenues and net loss attributable to UK Commercial Traffic Network were approximately $6.6 million and $(0.4) million, respectively.
Results of Operations
Year Ended June 30, 2011 Compared With Year Ended June 30, 2010
Revenues. Revenues increased from approximately $93.3 million for the year ended June 30, 2010 to approximately $117.4 million for the year ended June 30, 2011, an increase of approximately 25.8%. The largest portion of the increase in revenues was an increase of approximately $13.2 million (approximately 23.4%) from our Australia operations compared to the year ended June 30, 2010. The increase pertained solely to our radio network. Approximately $8.6 million of the increase in radio network revenue related to our radio traffic network while our radio news network revenues increased approximately $4.6 million. Approximately $7.7 million of the $13.2 million overall increase in Australian revenues pertained to currency fluctuations as the Australian dollar strengthened considerably (approximately 12%) against the U.S. dollar for the fiscal year). As reflected in Changes in Key Operating Statistics in Local Currencies, Australian revenues increased approximately 10.1% when measured in local currency compared to the year ended June 30, 2010. The Australian revenue increase in local currency was driven by an increase in the number of spots sold compared to the previous year. The increase in spots sold was mainly due to having more advertising inventory available for sale compared to the previous year. For the year ended June 30, 2011, we had approximately 608 thousand spots available for sale compared to approximately 552 thousand the previous year. Revenues from the sale of inventory related to our Canadian operations increased approximately $5.5 million (approximately 57.9%) from the previous year period. Canadian sales in fiscal 2011 continued the momentum from the third and fourth quarters of fiscal 2010 (in which revenues increased approximately $2.7 million compared to the year ago six month period). Approximately $0.8 million of the $5.5 million overall increase in Canadian revenues pertained to currency fluctuations. As reflected in Changes in Key Operating Statistics in Local Currencies, Canadian revenues increased approximately 51.1% when measured in Canadian dollars. The Canadian revenue increase in local currency was driven by a significant increase in spot rates. In Canadian dollars, the average spot rate increased from approximately $26 for the year ended June 30, 2010 to approximately $44 for the year end June 30, 2011. Revenues from our UK operations increased approximately $5.3 million, or approximately 19.3%. The substantial majority (approximately $4.9 million) of the increase related to higher sales from UK Commercial Traffic Network. Only approximately $0.3 million of the $5.3 million overall increase in United Kingdom revenues pertained to currency fluctuations. As reflected in Changes in Key Operating Statistics in Local Currencies, UK revenues increased approximately 18.4% when measured in British pounds. Approximately $8.8 million of the consolidated revenue increase for the year ended June 30, 2011 was due to currency fluctuations related to the weaker U.S. dollar during the period compared with the previous year.
Operating expenses. Operating expenses increased from approximately $63.3 million for the year ended June 30, 2010 to approximately $73.7 million for the year ended June 30, 2011, an increase of approximately 16.4%. Operating expenses related to our Australian, Canadian and United Kingdom operations increased approximately $6.6 million (approximately 22.0%), $0.9 million (approximately 9.3%) and $2.4 million (approximately 10.4%), respectively, each primarily due to an increase in station compensation. Approximately $4.0 million, $0.4 million and $0.2 million of the overall increase in Australian, Canadian and United Kingdom operating expenses, respectively was due to currency movements as the United States dollar was weaker against the local currencies of all our foreign subsidiaries for the fiscal year ended June 30, 2011. As reflected in Changes in Key Operating Statistics in Local Currencies, Australian, Canadian and United Kingdom operating expenses increased approximately 8.4%, 4.2% and 9.8% respectively when measured in local currencies, in each case mainly due to increases in station compensation. In addition, operating expenses for Global Alert Network doubled (an increase of approximately $0.5 million) during the year ended June 30, 2011 as we introduced our mobile phone alerting product during the period and have commenced adding subscribers, both of which have led to an increase in operating expenses. We anticipate that Global Alert Network operating expenses will continue to increase in the future as we continue to attempt to create a profitable business out of our alerting product for mobile phones.
Selling, general and administrative expenses. Selling, general and administrative expenses increased from approximately $21.0 million for the year ended June 30, 2010 to approximately $25.4 million for the year ended June 30, 2011, an increase of approximately 21.0%. Australian selling, general and administrative costs increased approximately $2.4 million (approximately 20.5%) for the year ended June 30, 2011. The main areas of increase included approximately $1.4 million in sales employee remuneration related mainly to the higher revenue for the period, $0.4 million in administrative wages and $0.3 million in other administrative and sales expenses, along with a $0.2 million increase in management fees attributable to currency changes that was offset on by the corresponding increase in management fee revenue on the income statement of Global Traffic Network (unconsolidated parent). Approximately $1.5 million of the overall $2.4 million increase in Australian
28
Table of Contents
selling, general and administrative expenses related to currency fluctuations. Sales expense as a percentage of revenue in Australia decreased from approximately 14.0% for the year ended June 30, 2010 to approximately 13.4% for the year ended June 30, 2011. As revenue increases, generally fixed costs become a smaller portion of selling expenses and result in sales expenses becoming a smaller percentage of revenue. Selling, general and administrative expenses in Canada increased approximately $1.4 million primarily due to increased sales employee costs attributable to both increased staffing and higher commission costs resulting from the increased billing for the year. Approximately $0.2 million of the overall $1.4 million increase in Canadian selling, general and administrative expenses related to currency fluctuations. United Kingdom selling, general administrative expenses for the year ended June 30, 2011 increased approximately $0.7 million compared to the year ended June 30, 2010. Approximately $0.6 million of the increase in costs related to additional employee compensation primarily related to incentive compensation for exceeding sales and profitability goals for the year. In addition, Global Traffic Network (unconsolidated parent) commenced charging a management fee to the United Kingdom subsidiaries effective January 1, 2011. The cost of this management fee from such date through the end of fiscal 2011 was approximately $0.2 million. This additional cost was offset by the corresponding increase in management fee revenue on the income statement on Global Traffic Network (unconsolidated parent). Non-cash compensation expense resulting from grants of employee and director stock options and restricted stock was approximately $1.4 million for the year ended June 30, 2011 compared to approximately $1.2 million for the year ended June 30, 2010.
Depreciation and amortization expense. Depreciation and amortization expense increased from approximately $5.3 million for the year ended June 30, 2010 to approximately $6.0 million for the year ended June 30, 2011. The majority (approximately $0.6 million) of the increase related to shortening the useful lives of the Canadian Traffic Network helicopters from eight years to six years and reducing the Canadian Traffic Network helicopter engine rebuild useful lives from three years to two years. This change in estimate was made in March 2010 due to our flying more hours per year in Canada than originally anticipated.
Interest expense. Interest expense decreased from approximately $15,000 for the year ended June 30, 2010 to $0 for the year ended June 30, 2011. All of our outstanding debt balances were repaid during the year ended June 30, 2010 and we had no outstanding long term debt as of June 30, 2011.
Other expense(income). Other income (net) increased from approximately $0.9 million for the year ended June 30, 2010 to approximately $1.2 million for the year ended June 30, 2011. Other income (net) consists primarily of approximately $1.3 million of interest income on our cash balances and the increase in interest income is attributable mainly to higher interest rates in Australia during the current period and significantly increased cash balances primarily due to our strong operating performance during the year ended June 30, 2011.
Income tax expense. Income tax expense increased from approximately $4.0 million for the year ended June 30, 2010 to approximately $4.6 million for the year ended June 30, 2011. The increase was primarily due to higher net profit in Australia which led to an approximately $1.4 million increase in income tax expense for the year ended June 30, 2011 compared to the year ended June 30, 2010. The effective tax rate in Australia was 30.1% for the years ended June 30, 2011 and 2010 compared to the statutory federal rate of 30.0%. Net tax benefit for the United States was approximately $1.1 million, which consisted of approximately $2.0 million tax benefit from the currency fluctuations impact on GTN’s deferred tax liability related to the Australia income recognized in the United States, which was partially offset by approximately $0.4 million of deferred tax expense and approximately $0.5 million tax accrual related to an uncertain tax position. With the exception of some immaterial state income taxes, all of the United States tax expense and benefit were non-cash. There was no income tax benefit for Canada as a valuation allowance has been created for 100% of the Company’s net deferred tax assets in that country. In addition, tax expense related to our United Kingdom operations increased approximately $0.3 million due to increased profits from UK Commercial Traffic Network. The UK Traffic Network realized approximately $0.7 million tax benefit due primarily to the unwinding of the deferred tax liability created by the Unique acquisition. The UK Traffic Network tax benefit was offset by approximately $0.8 million of tax expense related to the utilization of UK Commercial Traffic Network’s net operating loss carry-forwards. The UK Traffic Network also recognized an additional approximately $0.2 million in tax benefit due to the impact of the reduction in tax rates in the United Kingdom from 28% to 26%. UK Commercial Traffic Network’s tax benefit and tax expense are both non-cash items due to the deferred tax liability created as part of the acquisition and the net operating losses of Unique that we acquired.
Net income. Net income increased from approximately $0.6 million for the year ended June 30, 2010 to approximately $8.9 million for the year ended June 30, 2011. Our increase in net income is primarily attributable to an increase of approximately $3.4 million in Australia Traffic Network net income, a decrease of approximately $2.6 million in Canadian Traffic Network net loss due to significantly increased revenues, approximately $1.7 million increase in our consolidated UK operations that grew from a net loss of approximately $1.3 million to net income of approximately $0.4 million and an approximate $1.0 million decrease in the net loss of GTN (unconsolidated parent) that was primarily due to the increase in income tax benefit in the period. These increases in net income were partially offset by an increase in the net loss of Global Alert Network of approximately $0.4 million resulting from increased expenditures as we attempt to create a profitable business from our alerting product for mobile phones.
The table below sets forth changes in certain of our key operating statistics for our Australian operations for the comparable periods presented without taking into account foreign currency exchange rates. Amounts are expressed in Australian dollars. The exchange rates from Australian dollars to United States dollars for each of the applicable periods is set forth in the Executive Overview section of Management Discussion and Analysis of Financial Condition and Results of Operations under the heading “Basis of Presentation”.
29
Table of Contents
Changes in Key Operating Statistics in Local Currencies
Australian Operations:
| Key operating statistic |
Year Ended June 30, 2011 |
Year Ended June 30, 2010 |
Percentage Increase (Decrease) |
|||||||||
| (In thousands) | (In thousands) | |||||||||||
| Revenues |
$ | 70,278 | $ | 63,841 | 10.1 | % | ||||||
| Operating expenses (exclusive of depreciation and amortization expense shown separately below) |
36,851 | 33,986 | 8.4 | % | ||||||||
| Selling, general and administrative expenses |
14,212 | 13,231 | 7.4 | % | ||||||||
| Depreciation and amortization expense |
1,083 | 1,113 | (2.7 | )% | ||||||||
| Interest expense |
— | 17 | (100.0 | )% | ||||||||
| Other (income) (net) |
(1,311 | ) | (825 | ) | 58.9 | % | ||||||
| Income tax expense |
5,852 | 4,914 | 19.1 | % | ||||||||
| Net income |
13,591 | 11,405 | 19.2 | % | ||||||||
The table below sets forth changes in certain of our key operating statistics for our Canadian operations for the comparable periods presented without taking into account foreign currency exchange rates. Amounts are expressed in Canadian dollars. The exchange rates from Canadian dollars to United States dollars for each of the applicable periods is set forth in the Executive Overview section of Management Discussion and Analysis of Financial Condition and Results of Operations under the heading “Basis of Presentation”.
Canadian Operations:
| Key operating statistic |
Year Ended June 30, 2011 |
Year Ended June 30, 2010 |
Percentage Increase (Decrease) |
|||||||||
| (In thousands) | (In thousands) | |||||||||||
| Revenues |
$ | 14,999 | $ | 9,927 | 51.1 | % | ||||||
| Operating expenses (exclusive of depreciation and amortization expense shown separately below) |
10,637 | 10,205 | 4.2 | % | ||||||||
| Selling, general and administrative expenses |
4,178 | 2,977 | 40.3 | % | ||||||||
| Depreciation and amortization expense |
1,965 | 1,455 | 35.1 | % | ||||||||
| Interest expense |
— | — | — | |||||||||
| Other expense (income) (net) |
34 | (4 | ) | NM | ||||||||
| Income tax expense |
— | — | — | |||||||||
| Net loss |
(1,815 | ) | (4,706 | ) | (61.4 | )% | ||||||
The table below sets forth changes in certain of our key operating statistics for our United Kingdom operations for the comparable periods presented without taking into account foreign currency exchange rates. Amounts are expressed in British pounds. The exchange rates from British pounds to United States dollars for each of the applicable periods is set forth in the Executive Overview section of Management Discussion and Analysis of Financial Condition and Results of Operations under the heading “Basis of Presentation”.
United Kingdom Operations:
| Key operating statistic |
Year Ended June 30, 2011 |
Year Ended June 30, 2010 |
Percentage Increase (Decrease) |
|||||||||
| (In thousands) | (In thousands) | |||||||||||
| Revenues |
£ | 20,493 | £ | 17,301 | 18.4 | % | ||||||
| Operating expenses (exclusive of depreciation and amortization expense shown separately below) |
15,965 | 14,544 | 9.8 | % | ||||||||
| Selling, general and administrative expenses |
2,493 | 2,067 | 20.6 | % | ||||||||
| Depreciation and amortization expense |
1,846 | 1,804 | 2.3 | % | ||||||||
| Interest expense |
— | — | — | |||||||||
| Other (income) (net) |
(9 | ) | (80 | ) | (88.8 | )% | ||||||
| Income tax (benefit) |
(70 | ) | (247 | ) | (71.7 | )% | ||||||
| Net income (loss) |
268 | (787 | ) | NM | ||||||||
30
Table of Contents
Year Ended June 30, 2010 Compared With Year Ended June 30, 2009
Revenues. Revenues increased from approximately $60.3 million for the year ended June 30, 2009 to approximately $93.3 million for the year ended June 30, 2010, an increase of approximately 54.7%. The largest portion of the increase in revenues was an increase of approximately $16.7 million from our United Kingdom operations, which was attributable to an increase of approximately $16.6 million in revenues associated with the UK Commercial Traffic Network (formerly Unique) business operations. Because we consummated our acquisition of Unique on March 1, 2009, only four months of results from the UK Commercial Traffic Network’s operations were included in our results for the comparable 2009 period. Revenues from the sale of inventory related to our Canadian operations increased approximately $2.6 million from the previous year period. The higher revenues were attributable to performance during the third and fourth quarters of fiscal 2010, in which revenues increased approximately $2.7 million compared to the year ago six month period. As reflected in Changes in Key Operating Statistics in Local Currencies, Canadian revenues increased approximately 23.7% when measured in Canadian dollars. The revenue increase in local currency was driven by an increase in the number of spots sold (attributable to more spots available for sale and higher utilization) and higher spot rates. Australian revenues increased approximately $13.8 million compared to the year ended June 30, 2009. The increase pertained solely to our radio network, as revenues on our TV network decreased approximately $0.3 million for the year. Approximately $9.1 million of the increase in radio network revenue related to our radio traffic network while our radio news network revenues increased approximately $5.0 million. As reflected in Changes in Key Operating Statistics in Local Currencies, Australian revenues increased approximately 11.2% when measured in local currency compared to the year ended June 30, 2009. The Australian revenue increase in local currency was driven by an increase in the number of spots sold and higher spot rates compared to the previous year. The increase in spots sold was due both to having more advertising inventory available for sale as well as a higher percentage of available spots being sold compared to the previous year. Approximately $9.8 million (or approximately 30%) of the consolidated revenue increase for the year ended June 30, 2010 was due to currency fluctuations related to the weaker U.S. dollar during the period compared with the previous year. Approximately $9.2 million of the increase pertaining to currency fluctuation was attributable to our Australian operations.
Operating expenses. Operating expenses increased from approximately $40.9 million for the year ended June 30, 2009 to approximately $63.3 million for the year ended June 30, 2010, an increase of approximately 54.8%. Approximately $12.5 million of the increase pertained to our United Kingdom operations, of which approximately $13.1 million pertained to the UK Commercial Traffic Network (formerly Unique) business operations that we acquired on March 1, 2009. Expenses from our other United Kingdom operations decreased approximately $0.6 million compared to the previous year period. The main components of the reduction in operating expenses from our pre-existing UK operations were approximately $0.3 million reduction in communications expenses related to our Highways Agency contract, which was also reflected as a reduction of revenue under the contract as well as approximately $0.3 million reduction in operating expenses from our original traffic operations. Operating expenses related to our Australian and Canadian operations increased approximately $7.4 million and $2.5 million, respectively, each primarily due to an increase in station compensation. Approximately $4.8 million and $0.9 million of the overall increase in Australian and Canadian operating expenses, respectively was due to currency movements as both the Australia and Canada dollar significantly strengthened against the U.S. dollar during the year ended June 30, 2010. As reflected in Changes in Key Operating Statistics in Local Currencies, Australian and Canadian operating expenses increased approximately 11.8% and 21.1% respectively when measured in local currencies, mainly due to increases in station compensation.
Selling, general and administrative expenses. Selling, general and administrative expenses increased from approximately $15.6 million for the year ended June 30, 2009 to approximately $21.0 million for the year ended June 30, 2010, an increase of approximately 34.6%. Selling, general and administrative expenses increased approximately $2.1 million in the United Kingdom due to a $2.2 million increase from the acquired UK Commercial Traffic Network (formerly Unique) business operations. Australian selling, general and administrative costs increased approximately $3.0 million for the year ended June 30, 2010. The main increases included approximately $2.0 million in sales employee remuneration, $0.3 million in administrative wages, $0.5 million in other administrative and sales expenses and $0.2 million increase in management fees which was due to currency changes and was offset on Global Traffic Network (unconsolidated parent). Approximately $1.8 million of the overall $3.0 million increase in Australian selling, general and administrative expenses related to currency fluctuations. Sales expense as a percentage of revenue in Australia increased from approximately 13.4% for the year ended June 30, 2009 to approximately 14.0% for the year ended June 30, 2010. Selling, general and administrative expenses in Canada increased approximately $0.8 million primarily due to increased sales employee costs due both to increased staffing and higher commission costs related to the increased billing for the year. Selling, general and administrative expenses of Global Alert Network were reduced approximately $0.5 million compared to the year ago period as we actively reduced our staffing of this subsidiary. Non-cash compensation expense resulting from grants of employee and director stock options and restricted stock was approximately $1.2 million for both the year ended June 30, 2010 and 2009.
Depreciation and amortization expense. Depreciation and amortization expense increased from approximately $2.5 million for the year ended June 30, 2009 to approximately $5.3 million for the year ended June 30, 2010. The majority of the increase pertains to amortization of the intangibles associated with the acquisition of UK Commercial Traffic Network (formerly Unique). Approximately $0.2 million of the increase related to shortening the useful lives of the Canadian Traffic Network helicopters from eight years to six years and reducing the Canadian Traffic Network helicopter engine rebuild useful lives from three years to two years. This change in estimate was made due to our flying more hours per year in Canada than originally anticipated.
Interest expense. Interest expense decreased from approximately $39,000 for the year ended June 30, 2009 to approximately $15,000 for the year ended June 30, 2010. All of the outstanding debt balances were repaid during the period and we had no outstanding long term debt as of June 30, 2010.
31
Table of Contents
Other income (net). Other income (net) decreased from approximately $1.0 million for the year ended June 30, 2009 to approximately $0.9 million for the year ended June 30, 2010. Other income consists primarily of interest income on our cash balances and the reduction is attributable mainly to lower interest rates during the fiscal 2010 period and our reduced cash balances due to the purchase of UK Commercial Traffic Network (formerly Unique). The reduction in other income was partially mitigated by foreign currency translation income of approximately $0.1 million for the year ended June 30, 2010 compared to no foreign currency translation income or loss during the 2009 period. The foreign currency translation income resulted from the repayment of balances due to the Company by Australia Traffic Network. Intercompany balances between the Company and its subsidiaries are translated from the local currencies to U.S. dollars at each balance sheet date. To the extent these balances are intended to be ongoing, that is, settlement is neither planned nor anticipated, the translation adjustments to balance intercompany are reflected as a component of other comprehensive income. The repayment of the Australia Traffic Network intercompany balance triggered a realized foreign exchange income during the period.
Income tax expense. Income tax expense increased from approximately $3.3 million for the year ended June 30, 2009 to approximately $4.0 million for the year ended June 30, 2010. The increase was primarily due to an increase of $1.0 million in Australia from the higher net income in the current period partially offset by approximately $0.3 million increase in the deferred tax benefit in the United Kingdom. The effective tax rate in Australia was 30.1% and 30.0% for the year ended June 30, 2010 and 2009, respectively, compared to the statutory federal rate of 30.0%. There was no income tax benefit for the United States or Canada as a valuation allowance has been created for 100% of the Company’s net deferred tax assets in those countries. The UK Traffic Network realized approximately $0.7 million tax benefit due to the reduction of the deferred tax liability created by the acquisition of UK Commercial Traffic Network (formerly Unique), which was partially offset by the taxable income generated by UK Commercial Traffic Network during the period. UK Commercial Traffic Network’s tax expense and benefit are non-cash items due to the deferred tax liability created as part of the acquisition and the significant net operating losses of Unique that we acquired.
Net income (loss). Net income (loss) increased from approximately $1.1 million of net loss for the year ended June 30, 2009 to net income of approximately $0.6 million for the year ended June 30, 2010. Our increase in net income is primarily attributable to an increase of approximately $2.2 million in Australia Traffic Network net income, a decrease of approximately $0.6 million in Global Alert Network net loss due to expense reductions and approximately $0.5 reduction of the net loss of our consolidated UK operations. These increases in net income were partially offset by an increase in the net loss of the parent holding company that was primarily due to lower interest income in the current year and an increase in Canadian Traffic Network net loss of approximately $1.3 million. The increase in Canadian Traffic Network net loss pertained to business operations in the first half of fiscal 2010, as Canadian Traffic Network’s operations during the second half of fiscal 2010 showed a reduction in net loss of approximately $0.4 million compared to the prior year period.
The table below sets forth changes in certain of our key operating statistics for our Australian operations for the comparable periods presented without taking into account foreign currency exchange rates. Amounts are expressed in Australian dollars. The exchange rates from Australian dollars to United States dollars for each of the applicable periods is set forth in the Executive Overview section of Management Discussion and Analysis of Financial Condition and Results of Operations under the heading “Basis of Presentation”.
Changes in Key Operating Statistics in Local Currencies
Australian Operations:
| Key operating statistic |
Year Ended June 30, 2010 |
Year Ended June 30, 2009 |
Percentage Increase (Decrease) |
|||||||||
| (In thousands) | (In thousands) | |||||||||||
| Revenues |
$ | 63,841 | $ | 57,396 | 11.2 | % | ||||||
| Operating expenses (exclusive of depreciation and amortization expense shown separately below) |
33,986 | 30,390 | 11.8 | % | ||||||||
| Selling, general and administrative expenses |
13,231 | 11,706 | 13.0 | % | ||||||||
| Depreciation and amortization expense |
1,113 | 994 | 12.0 | % | ||||||||
| Interest expense |
17 | 52 | (67.3 | )% | ||||||||
| Other (income) (net) |
(825 | ) | (878 | ) | (6.0 | )% | ||||||
| Income tax expense |
4,914 | 4,542 | 8.2 | % | ||||||||
| Net income |
11,405 | 10,590 | 7.7 | % | ||||||||
The table below sets forth changes in certain of our key operating statistics for our Canadian operations for the comparable periods presented without taking into account foreign currency exchange rates. Amounts are expressed in Canadian dollars. The exchange rates from Canadian dollars to United States dollars for each of the applicable periods is set forth in the Executive Overview section of Management Discussion and Analysis of Financial Condition and Results of Operations under the heading “Basis of Presentation”.
32
Table of Contents
Canadian Operations:
| Key operating statistic |
Year Ended June 30, 2010 |
Year Ended June 30, 2009 |
Percentage Increase (Decrease) |
|||||||||
| (In thousands) | (In thousands) | |||||||||||
| Revenues |
$ | 9,927 | $ | 8,023 | 23.7 | % | ||||||
| Operating expenses (exclusive of depreciation and amortization expense shown separately below) |
10,205 | 8,425 | 21.1 | % | ||||||||
| Selling, general and administrative expenses |
2,977 | 2,348 | 26.8 | % | ||||||||
| Depreciation and amortization expense |
1,455 | 881 | 65.2 | % | ||||||||
| Interest expense |
— | — | — | |||||||||
| Other (income) (net) |
(4 | ) | (30 | ) | (86.7 | )% | ||||||
| Income tax expense |
— | — | — | |||||||||
| Net loss |
(4,706 | ) | (3,601 | ) | 30.7 | % | ||||||
The table below sets forth changes in certain of our key operating statistics for our United Kingdom operations for the comparable periods presented without taking into account foreign currency exchange rates. Amounts are expressed in British pounds. The exchange rates from British pounds to United States dollars for each of the applicable periods is set forth in the Executive Overview section of Management Discussion and Analysis of Financial Condition and Results of Operations under the heading “Basis of Presentation”.
United Kingdom Operations:
| Key operating statistic |
Year Ended June 30, 2010 |
Year Ended June 30, 2009 |
Percentage Increase (Decrease) |
|||||||||
| (In thousands) | (In thousands) | |||||||||||
| Revenues |
£ | 17,301 | £ | 6,892 | 151.0 | % | ||||||
| Operating expenses (exclusive of depreciation and amortization expense shown separately below) |
14,544 | 6,706 | 116.9 | % | ||||||||
| Selling, general and administrative expenses |
2,067 | 751 | 175.2 | % | ||||||||
| Depreciation and amortization expense |
1,804 | 661 | 172.9 | % | ||||||||
| Interest expense |
— | — | — | |||||||||
| Other (income) (net) |
(80 | ) | (7 | ) | 1,042.9 | % | ||||||
| Income tax (benefit) |
(247 | ) | (87 | ) | 183.9 | % | ||||||
| Net loss |
(787 | ) | (1,132 | ) | (30.5 | )% | ||||||
Liquidity and Capital Resources
At June 30, 2011, our primary source of liquidity was cash and cash equivalents of approximately $41.7 million. In addition, we also had approximately $2.1 million available under our unused overdraft credit line at June 30, 2011. The overdraft credit line is denominated in Australian dollars and has been translated into U.S. dollars for purposes of this report. Our excess cash has been mainly invested in short term bonds, short term agencies, short term commercial paper and money market accounts, all of which have maturities of 90 days or less.
Operating activities. Cash provided by operating activities was approximately $18.2 million for the year ended June 30, 2011, due mainly to positive cash generation from operations (after net income was adjusted for non-cash expenses) that was further increased by approximately $1.5 million increase in working capital.
Investing activities. Cash used in investing activities was approximately $1.6 million for the year ended June 30, 2011. The cash used for investing activities consisted of capital expenditures, the majority of which was for the regularly recurring rebuilding of helicopter engines in Canada and Australia.
Financing activities. Cash provided by financing activities was approximately $1.8 million for the year ended June 30, 2011, substantially all of which consisted of proceeds from the exercise of warrants issued to the underwriter of our March 2006 initial public offering.
Effect of exchange rate changes. Cash increased approximately $3.7 million for the year ended June 30, 2011 due to changes in exchange rates. This increase was primarily due to the strengthening of the Australia dollar compared against the U.S. dollar as a significant majority of our cash is denominated in Australia dollars.
33
Table of Contents
Through Australia Traffic Network, we have in place a $2.1 million bank overdraft line of credit facility. Interest on amounts outstanding under the facility is variable at the ANZ Mortgage Index rate plus 0.83% (9.95% at June 30, 2011) and is secured by all assets of Australia Traffic Network. The facility contains covenants relating to dividends, liens, indebtedness, capital expenditures and interest coverage and leverage ratios. At June 30, 2011, the balance of the bank overdraft was $0 and the entire $2.1 million was available to us. The facility is denominated in Australian dollars ($2.0 million Australian dollars) and the dollar amounts above have been translated into United States dollars.
The Company believes its cash and cash equivalents on hand and its overdraft line of credit provide adequate resources to fund ongoing operations, including any net losses generated by Canadian Traffic Network, Global Alert Network and corporate overhead for at least the next twelve months.
Income Taxes. We operate as a United States corporation with wholly-owned direct and indirect operating subsidiaries in Australia, Canada and the United Kingdom. We will pay income taxes in those countries as well as in the United States. The current federal statutory tax rate is 30% in Australia while the estimated effective combined federal and provincial tax rate was approximately 28.5% in Canada (which has dropped to approximately 26.75% for the current fiscal year), the estimated effective corporate tax rate in the United Kingdom was approximately 28% (which has dropped to 26% for the current fiscal year) and the estimated federal and state tax rate in the United States is approximately 37%.
Purchase of the Company by GTCR Gridlock Holdings, Inc.
On August 2, 2011, we entered into the Merger Agreement pursuant to which we have agreed to be acquired by an affiliate of GTCR. Under the terms of the Merger Agreement, GTCR Gridlock Holdings, Inc., a newly formed entity affiliated with GTCR, commenced the Offer on August 9, 2011 to acquire all of our outstanding common stock for $14.00 per share in cash, to be followed by the Merger to acquire all remaining outstanding shares at the same price paid in the Offer. The Offer is required to remain open until the completion of a “go-shop” solicitation period until September 13, 2011, and if applicable, a subsequent negotiation period until October 1, 2011. The Merger Agreement contains certain termination rights by us and GTCR’s affiliate including, with respect to us, in the event that we receive a Superior Proposal (as defined in the Merger Agreement). In connection with the termination of the Merger Agreement under specified circumstances, including with respect to the acceptance of a Superior Proposal by us, we may be required to pay a termination fee of $8,286,910, which fee would be reduced to $4,143,455 with respect to the termination of the Merger Agreement prior to October 1, 2011 if a transaction is entered into with a party that makes a qualifying proposal during the “go-shop” period. The completion of the Offer and Merger are subject to certain conditions and termination rights set forth in the Merger Agreement. See “Item 1A —Risk Factors.” The statements in this Annual Report on Form 10-K are not a solicitation or recommendation of the Company to its shareholders in connection with the proposed Offer, and shareholders should carefully review the Solicitation/Recommendation Statement on Schedule 14D-9 filed by the Company on August 9, 2011 and any amendments thereto before making any decision as to the Offer because such documents contain important information about the Offer, the Merger and other transactions contemplated by the Merger Agreement. The Solicitation/Recommendation Statement on Schedule 14D-9 and the amendments thereto are available, without charge, at the SEC’s internet site (http://www.sec.gov) or by directing a request to Global Traffic Network, Inc., Attention: Investor Relations, Phil Carlson, KCSA Strategic Communications, 880 Third Avenue 6th Floor, New York, NY 10022, pcarlson@kcsa.com, or on the Company’s website at (www.globaltrafficnetwork.com).
34
Table of Contents
Contractual Commitments
The table below sets forth our contractual obligations as of June 30, 2011:
| Payments due by period | ||||||||||||||||||||
| Contractual Obligations |
Total | Less Than 1 Year |
1-3 Years |
4-5 Years |
More Than 5 Years |
|||||||||||||||
| (in thousands) | ||||||||||||||||||||
| Operating Lease Obligations |
$ | 2,330 | $ | 892 | $ | 1,040 | $ | 278 | $ | 120 | ||||||||||
| Outsource Provider Obligations |
4,786 | 3,221 | 1,565 | — | — | |||||||||||||||
| Station Obligations |
68,900 | 44,282 | 24,279 | 339 | — | |||||||||||||||
|
|
|
|
|
|
|
|
|
|
|
|||||||||||
| Total |
$ | 76,016 | $ | 48,395 | $ | 26,884 | $ | 617 | $ | 120 | ||||||||||
Critical Accounting Policies
The discussion and analysis of our financial condition and results of operations are based upon our financial statements, which have been prepared in accordance with accounting principles generally accepted in the United States. The preparation of these financial statements requires us to make estimates and judgments that affect the reported amounts of assets, liabilities, revenues and expenses, and related disclosures. We evaluate these estimates on an on-going basis. We base our estimates on historical experience and on various other assumptions that are believed to be reasonable under the circumstances, the results of which form the basis for making judgments about the carrying values of assets and liabilities that are not readily apparent from other sources. Actual results may differ from these estimates under different assumptions or conditions.
We consider the following accounting policies to be those most important to the portrayal of our results of operations and financial condition:
Revenue recognition. Revenues are earned and recognized at the time commercial advertisements are broadcast. Payments received in advance or amounts invoiced in advance are deferred until earned and such payments and amounts are included as a component of deferred revenue in the accompanying balance sheets. All revenues pertain to cash sales. We determine that commercial advertisements are broadcast based on the announcers’ written or electronic verification on the broadcast log or written or electronic verification from our network affiliates for advertisements they broadcast. The broadcast log is a schedule of station, time and advertiser for each report that an announcer broadcasts. The broadcast logs are generated by our scheduling department through our automated scheduling system, based on advertising sales orders and our network affiliate stations’ scheduled report times. Revenues are reported net of commissions given to third party advertising agencies that represent a majority of our advertisers. Sales taxes, goods and services taxes, value added taxes and similar charges collected by our operating subsidiaries on behalf of government authorities are not included as a component of revenue.
Accounts receivable. Accounts receivable are recorded at the invoice amount and are not interest bearing. We perform credit evaluations of new customers and generally require no collateral. Whether an accounts receivable is past due is determined in a subjective manner based primarily on how long it has been outstanding, but taking into consideration factors such as client size, payment history and country to which the receivable relates. Goods and services tax, sales tax and value added tax, which is invoiced and collected by operating subsidiaries in Australia, Canada and United Kingdom, are included in accounts receivable. Fees related to credit card payments are expensed when payment for the receivable is received and have historically not been material. The Company provides for losses from uncollectible accounts based on analyzing historical data and current trends and such losses have historically been insignificant in relation to revenue. Past due amounts are written off against the allowance for doubtful accounts when collection is deemed unlikely and all collection efforts have ceased. An allowance for doubtful accounts of $191,000, $69,000, and $150,000 has been established for the years ended June 30, 2011, 2010 and 2009, respectively.
Income taxes. We have adopted the Statement of Financial Accounting Standards No. 109, “Accounting for Income Taxes” (“SFAS 109”). Effective July 1, 2009, SFAS 109 was incorporated in the Codification under FASB ASC 740. Under the asset and liability method of FASB ASC 740, deferred tax assets and liabilities are recognized for the future tax consequences attributable to net operating loss carry-forwards and to differences between the financial statement carrying amounts of existing assets and liabilities and their respective tax bases. Deferred tax assets and liabilities are measured using enacted tax rates expected to apply to taxable income in the years in which those temporary differences are expected to be recovered or settled. Under FASB ASC 740, the effect of a change in tax rates on deferred tax assets or liabilities is recognized in the statement of income in the period that included the enactment. A valuation allowance is established for deferred tax assets unless their realization is considered more likely than not. Currently, 100% of the Canadian tax loss carry-forwards generated by us are allowed for since it is not yet reasonably certain that our operations in Canada will be profitable in the future to utilize these tax loss carry-forwards. In addition, we have made a 100% allowance for the losses of UK Traffic Network (but not UK-Commercial Traffic Network) since we are currently unable to offset these losses against the expected future profits of UK-Commercial Traffic Network, which is the subsidiary that was formerly Unique.
In June 2006, FASB issued FASB Interpretation No. 48 (“FIN 48”), “Accounting for Uncertainty in Income Taxes”, which is an interpretation of SFAS 109. Effective July 1, 2009, FIN 48 was incorporated in the Codification under FASB ASC 740. FASB ASC 740 clarifies the accounting for uncertainty in income taxes recognized in a company’s financial statements and prescribes a recognition threshold and measurement attribute for the financial statement recognition and measurement of a tax position taken or expected to be taken in a tax return. The evaluation of a tax position is a two step process. First step is recognition, in which the company determines whether it is more likely than not that a tax position will be sustained upon examination based on the merits of the position. The second step is measurement in which a tax position which meets the more likely than not threshold of the first step is measured to determine the amount of benefit to recognize in its financial statements.
35
Table of Contents
Prior to July 1, 2009, the Company considered all earnings of ATN to be indefinitely reinvested abroad and therefore did not recognize a deferred tax liability with regards to the undistributed earnings of ATN. As a result of the change in permanent investment status, GTN has recognized deferred tax liabilities for undistributed earnings and profits of ATN to date which are offset by foreign tax credit deferred tax assets.
Off-Balance Sheet Arrangements
We have no off-balance sheet arrangements.
Recent Accounting Pronouncements
In December 2010, the Financial Accounting Standards Board (“FASB”) issued Accounting Standards Update No. 2010-28, “When to Perform Step 2 of the Goodwill Impairment Test for Reporting Units with Zero or Negative Carrying Amounts” (“ASU 2010-28”) which amends FASB ASC Topic 350 (Intangibles — Goodwill and Other) to modify Step 1 of the goodwill impairment test for reporting units with zero or negative carrying amounts to require performing Step 2 of the goodwill impairment test if it is more likely than not that a goodwill impairment exists. ASU 2010-28 is effective for fiscal years and the interim periods within those years beginning after December 15, 2010. Early adoption is not permitted. The Company intends to adopt the provisions of ASU 2010-28 effective July 1, 2011 and does not expect the adoption to have a material impact on its consolidated financial position or results of operations.
In June 2011, FASB issued Accounting Standards update No. 2011-05, “Presentation of Comprehensive Income” (“ASU 2011-05”) which amends FASB ASC Topic 220 (Comprehensive Income) to eliminate the option to present the components of comprehensive income as part of the statement of changes in stockholders’ equity. The Company currently presents the components of comprehensive income as part of the statement of changes in stockholders’ equity. The amendment requires all non-owner changes in stockholders equity be presented either a single continuous statement of comprehensive income or in two separate but consecutive statements. In the two statement approach, the first statement presents total net income and its components followed consecutively by a second statement that presents the total other comprehensive income, the components of other comprehensive income and the total of comprehensive income. ASU 2011-05 does not change the items that must be reported in other comprehensive income or when an item of other comprehensive income must be reclassified to net income. ASU 2011-05 is effective for fiscal years and the interim periods within those years beginning after December 15, 2011. Early adoption is permitted as the provisions of ASU 2011-05 are already permitted. The Company intends to adopt the provisions of ASU 2011-05 effective July 1, 2012 and does not expect the adoption to have a material impact on its consolidated financial position or results of operations.
Item 7A. Qualitative and Quantitative Disclosures about Market Risk
We are exposed to market risks. Market risk is the potential loss arising from adverse changes in interest rates and foreign currency exchange rates. We do not enter into derivative or other financial instruments for speculative purposes.
Interest Rate Risk
We are subject to market risk exposure related to changes in interest rates. Our financial instruments include cash and cash equivalents. We consider all highly liquid instruments purchased with a maturity of less than three months to be cash equivalents. Our cash and cash equivalents are not subject to significant interest rate risk due to the short maturities of these instruments. However, due to the large cash and cash equivalents balances, a one percent decrease in the interest rates we earn on these balances would reduce interest income approximately $0.4 million on an annual basis based on the balances at June 30, 2011. We have no derivative financial instruments or auction rate securities in our cash and cash equivalents. We had no outstanding long-term debt at June 30, 2011. We had an unutilized bank overdraft line of credit of approximately $2.1 million that bears interest at a variable rate. We do not consider the variable interest rate long-term debt as a significant interest rate risk because we have no current plans to borrow money, including under the bank overdraft line of credit.
Foreign Currency Exchange Risk
We have significant foreign subsidiaries located in Australia, Canada and the United Kingdom. The assets and liabilities of these subsidiaries are denominated in Australian dollars, Canadian dollars and British pounds, respectively, and as such are translated into United States dollars. Income statement amounts are translated from Australian dollars, Canadian dollars, or British pounds to United States dollars based on the average exchange rate for each quarterly period. Assets and liabilities are translated based on the exchange rate as of the applicable balance sheet date. Equity contributions are translated based on the exchange rate at the time of the applicable investment. Foreign currency translation adjustments occur when the income statement and balance sheet are converted at different exchange rates and are recognized as other comprehensive income or loss in the financial statements. We do not currently hedge for currency fluctuations with our foreign subsidiaries.
Accounts Receivable
The Company’s accounts receivable do not represent a significant concentration of credit risk due to the large number of customers and the fact that no one customer represents more than 4% of our annual revenue. However, one group of advertising agencies that represents a number of our advertising customers in Australia, United Kingdom and Canada constituted approximately 28% of our revenues for the year ended June 30, 2011 and approximately 23% of the Company’s net accounts receivable as of June 30, 2011. Another group of advertising agencies
36
Table of Contents
that represents a number of our advertising customers in Australia, United Kingdom and Canada constituted approximately 15% of our revenues for the year ended June 30, 2011 and approximately 16% of the Company’s net accounts receivable as of June 30, 2011. An advertising agency that represents a number of our clients in Australia constituted approximately 11% of our revenues for the year ended June 30, 2011 and approximately 11% of our net accounts receivable as of June 30, 2011. Another group of advertising agencies that represents a number of our clients in Australia, United Kingdom and Canada constituted approximately 9% of our revenues for the year ended June 30, 2011 and approximately 11% of the Company’s net accounts receivable as of June 30, 2011. In addition to the aforementioned agencies, it is likely other advertising agencies may exceed 10% of our net revenues and/or 10% of our net receivables in the future based on the current billing levels of certain agencies. In the United Kingdom, substantially all our advertising related net revenues come from five agency groups (including one agency group placing approximately 52% of our United Kingdom advertising revenues for the year ending June 30, 2011); therefore our concentration of revenue by agency is greater in the UK market than for our Company as a whole.
Item 8. Financial Statements and Supplementary Data
The consolidated financial statements and the related notes were prepared by and are the responsibility of management. The financial statements and related notes were prepared in conformity with generally accepted accounting principles and include amounts based on management’s best estimates and judgments. All financial information in this annual report is consistent with the consolidated financial statements.
The Company maintains internal accounting control systems and related policies and procedures designed to provide reasonable assurance that assets are safeguarded, that transactions are executed in accordance with management’s authorization and properly recorded, and that the accounting records may be relied on for the preparation of the consolidated financial statements and other financial information. The design, monitoring, and revision of internal accounting control systems involve, among other things, management’s judgment with regard to the relative cost and expected benefit of specific control measures.
The consolidated financial statements and the related notes thereto of the Company are indexed on page F-1 through F-25 herein.
Item 9. Changes In and Disagreements with Accountants on Accounting and Financial Disclosure
None.
Item 9A. Controls and Procedures
Under the supervision and with the participation of our management, including our Chief Executive Officer and Chief Financial Officer, we conducted an evaluation of our disclosure controls and procedures, as such term is defined under Rule 13a-15(e) or 15d-15(e) promulgated under the Securities Exchange Act of 1934, as amended (the “Exchange Act”), as of June 30, 2011. Based on this evaluation, our Chief Executive Officer and Chief Financial Officer concluded that our disclosure controls and procedures are effective.
Management’s Annual Report on Internal Control Over Financial Reporting
Management is responsible for establishing and maintaining adequate internal control over financial reporting for our Company. This system is designed to provide reasonable assurance regarding the reliability of financial reporting and the preparation of financial statements for external purposes in accordance with accounting principles generally accepted in the United States of America.
Our internal control over financial reporting includes those policies and procedures that (1) pertain to the maintenance of records that, in reasonable detail, accurately and fairly reflect the transactions and dispositions of our assets; (2) provide reasonable assurance that transactions are recorded as necessary to permit preparation of financial statements in accordance with accounting principles generally accepted in the United States of America, and that receipts and expenditures are being made only in accordance with authorizations of management and the Board of Directors; and (3) provide reasonable assurance regarding prevention or timely detection of unauthorized acquisition, use, or disposition of our assets that could have a material effect on the financial statements.
Because of its inherent limitations, a system of internal control over financial reporting can provide only reasonable assurance and may not prevent or detect all misstatements. Further, because of changes in conditions, effectiveness of internal control over financial reporting may vary over time.
Management assessed the effectiveness, as of June 30, 2011, of the system of internal control over financial reporting based on the framework in Internal Control-Integrated Framework issued by the Committee of Sponsoring Organizations of the Treadway Commission. Based on this assessment, management determined that our system of internal control over financial reporting was effective as of June 30, 2011.
BDO Audit (NSW-VIC) Pty Ltd, the independent registered certified public accounting firm that audited our financial statements included in this annual report on Form 10-K, also audited the effectiveness of our internal control over financial reporting and has issued an attestation report on our internal control over financial reporting, which is included herein.
37
Table of Contents
Changes in Internal Control Over Financial Reporting
There have been no changes in our internal control over financial reporting identified in connection with the evaluation required by paragraph (d) of Rule 13a-15 or 15d-15 promulgated under the Exchange Act that occurred during the fourth fiscal quarter ended June 30, 2011 that has materially affected, or is reasonably likely to materially affect, our internal control over financial reporting.
Results of Operations and Financial Condition.
The information in this Item 9B is furnished to, but not filed with, the Securities and Exchange Commission in lieu of furnishing such information pursuant to a separate Form 8-K, Item 2.02 “Results of Operations and Financial Condition.”
On September 13, 2011, Global Traffic Network, Inc. issued a press release reporting the financial results for the three and twelve month periods ended June 30, 2011. A copy of the press release is furnished as Exhibit 99.1 to this report and is incorporated herein by reference.
Item 10. Directors, Executive Officers and Corporate Governance
The following table sets forth the name, age and positions of each of our directors, executive officers and other significant employees as of August 31, 2011:
| Name |
Age | Position |
Independent Director | |||
| Directors and Executive Officers |
||||||
| William L. Yde III |
58 | Chairman, Chief Executive Officer and President | No | |||
| Scott E. Cody |
45 | Chief Operating Officer, Chief Financial Officer and Treasurer | — | |||
| B. William Pezzimenti |
61 | President and Director of Australia Traffic Network, International Director of Sales and Training | — | |||
| Gary L. Worobow |
46 | Executive Vice President, Business and Legal Affairs and Secretary | — | |||
| Dale C. Arfman |
58 | Director | No | |||
| Gary O. Benson |
67 | Director | Yes | |||
| Shane E. Coppola |
45 | Director | Yes | |||
| William M. Mower |
53 | Director | Yes | |||
| Stuart R. Romenesko |
48 | Director | Yes | |||
| Other Significant Employees |
||||||
| John Quinn |
54 | Chief Operating Officer and Director of Global Traffic Network (UK) Commercial Limited | — | |||
| Ivan N. Shulman |
49 | Senior Vice President Sales, President and Director of Canadian Traffic Network ULC | — |
Information with respect to the business experience and affiliations of our directors, executive officers and other significant employees as of August 31, 2011 is set forth below.
Directors and Executive Officers
William L. Yde III was one of our co-founders and has served as our Chairman, Chief Executive Officer and President since our inception in May 2005. Mr. Yde founded The Australia Traffic Network Pty Limited in June 1997 and has served as its Chairman and Chief Executive Officer since its inception. Prior to forming The Australia Traffic Network Pty Limited, Mr. Yde founded Wisconsin Information Systems, Inc. dba Milwaukee Traffic Network in 1994, and expanded its operations to create traffic networks in Milwaukee, Oklahoma City, Omaha and Albuquerque before selling all of its assets in 1996 to Metro Networks, Inc., now a wholly-owned subsidiary of Clear Channel Communications, Inc. In 1999, Mr. Yde co-founded (Nihon) Japan Traffic Network, and served as its Chief Executive Officer and as a director from 1999 to January 2002, at which time the company suspended operations. Mr. Yde, as founder of the Company and its Chief Executive Officer and President, is invaluable to the Company’s strategic development and growth, as well as its everyday operations, and the Board of Directors believes that he is uniquely qualified to serve as Chairman of the Board given his position as the Company’s principal executive officer since he founded the Company. In addition, Mr. Yde’s significant ownership position in the Company provides the Board with a strategic focus on maximizing shareholder value in addition to his representing management’s interests on the Board of Directors.
38
Table of Contents
Scott E. Cody joined the Company in June 2005 and was appointed Chief Financial Officer and Chief Operating Officer by the Board in September 2005. Prior to joining the Company, Mr. Cody held various positions with Metro Networks, Inc., serving as Vice President of Finance from 1997 to June 2002 and Senior Vice President of Business Development from July 2002 to June 2005. Prior to joining Metro Networks, Inc., Mr. Cody was Vice President of Finance for Tele-Media Broadcasting Company.
B. William Pezzimenti currently serves as the President and a member of the board of directors of The Australia Traffic Network Pty Limited, having served as a sales representative since February 1998 and as sales director since March 2000. Prior to joining Australia Traffic Network, Mr. Pezzimenti was the manager of retail development for the CBS television affiliate in Buffalo, New York.
Gary L. Worobow has served as the Company’s Executive Vice President, Business and Legal Affairs since March 2009, and served as a member of the Board from December 2006 through February 2009. Mr. Worobow served as Executive Vice President and General Counsel of Five S Capital Management, Inc. from January 2006 to February 2009. Previously, Mr. Worobow was with Westwood One, Inc. where he served as Executive Vice President, Business Affairs and Business Development from 2003 through 2006, and as Senior Vice President and General Counsel from 1999 through 2002. Mr. Worobow was a founder and General Counsel of Columbus Capital Partners, LLC from 2002 through 2003. In addition, Mr. Worobow held the positions of Senior Vice President, General Counsel and Board Member for Metro Networks, Inc. from 1995 to 1999.
Dale C. Arfman, a director of our Company since May 2005, was one of our co-founders and served as our Treasurer and Secretary from September 2005 to July 2009. Mr. Arfman had been a director of The Australia Traffic Network Pty Limited since 1999. In 1999, Mr. Arfman was a co-founder of (Nihon) Japan Traffic Network and served as its Chief Financial Officer and as a member of its Board of Directors from 1999 to January 2002, at which time the company suspended operations. Previously, Mr. Arfman contributed to the development of traffic networks in Oklahoma City, Albuquerque and Omaha as an officer of Wisconsin Information Systems, Inc. dba Milwaukee Traffic Network before that company sold all of its assets in 1996 to Metro Networks, Inc., now a wholly-owned subsidiary of Clear Channel Communications, Inc. Prior to his involvement in the traffic business, Mr. Arfman was a loan officer with Bank One Indianapolis. Our Board of Directors believes that Mr. Arfman, as a co-founder and former executive officer of the Company, is qualified to serve as a director based on his knowledge of the Company’s business operations, his involvement in the development and growth of the Company’s business in Australia, as well as his finance experience. In addition, Mr. Arfman’s percentage ownership in the Company provides him with a vested interest in its success and, consequently, a focus on maximizing shareholder value.
Gary O. Benson has been a member of our Board of Directors since September 2005. Mr. Benson currently serves as President, Treasurer and Broker of Twin Town Realty, Inc., a real estate brokerage firm, where he has been employed since 1964. He has also served as the General Partner of Goben Enterprises LP, a general investment firm, since 1995, and as Chief Executive Officer and President of Transcontinental Acceptance Corporation, which currently engages in exercise equipment leasing, since 1995. Mr. Benson is qualified to serve as a director of the Company based on the business acumen garnered by him through his real estate development and general investment experience. Mr. Benson also acquired knowledge and experience in the Company’s business serving as a director of (Nihon) Japan Traffic Network from 1999 to 2002.
Shane E. Coppola has been a member of our Board of Directors since June 2006. Mr. Coppola is the Chairman and Chief Executive Officer of American Skating Entertainment Centers, LLC, a company that owns and operates ice skating facilities. Mr. Coppola served as President and Chief Executive Officer of Westwood One, Inc. from May 2003 until December 2005, and served as a director of Westwood One, Inc. from October 2003 until December 2005. From May 2002 to May 2003, Mr. Coppola was the Managing Partner of Columbus Capital Partners, LLC, of which he was a founder. From September 1999 to May 2002, Mr. Coppola served as Executive Vice President of Westwood One’s Metro and Shadow Broadcasting operations. From 1992 to September 1999, Mr. Coppola was a director and Executive Vice President of Metro Networks, Inc. Mr. Coppola’s previous tenure as President, Chief Executive Officer and a director of Westwood One, Inc. and as a director and an executive officer of Metro Networks, Inc. make him uniquely qualified to serve on our Board of Directors, particularly in light of the similarities between the business operations of those companies and our own.
William M. Mower has been a member of our Board of Directors since March 2009. Mr. Mower has been engaged in the private practice of law since 1982, practicing primarily in the areas of corporate, securities and real estate law, with the Minneapolis, Minnesota law firm of Maslon Edelman Borman & Brand, LLP, which has rendered and is continuing to render legal services to the Company. Mr. Mower’s experience as a public company business and securities lawyer, including his expertise in corporate governance matters, and prior tenures serving on boards of public reporting companies, make Mr. Mower qualified to serve as a director of the Company.
Stuart R. Romenesko has been a member of our Board of Directors since February 2007. Mr. Romenesko is currently Chief Financial Officer and Treasurer of KGP Telecommunications, Inc., a leading diversity provider of supply chain services, equipment and integrated solutions to the telecommunications industry. From October 2006 until October 2010, Mr. Romenesko owned his own financial and management consulting firm focused in the areas of finance, operations and strategy. Mr. Romenesko served as an executive of Petters Group Worldwide, LLC from October 2002 until October 2006. From January 2000 to October 2002, Mr. Romenesko was Executive Vice President, Chief Financial Officer, co-Founder and Director of Magnum Technologies Inc. From January 1994 to June 1999, he served as Senior Vice President Finance, Chief Financial Officer, Treasurer and Assistant Secretary for ValueVision International, Inc., also known as ShopNBC. Mr. Romenesko, a Certified Public Accountant, has held various positions at both regional and international accounting firms. Mr. Romenesko was a director of Enable Holdings, Inc. (ENAB.PK) from January 2006 to March 2007. In addition, Mr. Romenesko has completed the Director Training & Certification Program offered by the UCLA Anderson School of Management. Being a Certified Public Accountant and his previous experience serving as the principal financial and accounting officer for ValueVision International, Inc., a public reporting company, qualifies Mr. Romenesko to serve on the Company’s Board of Directors and its Audit Committee as an “audit committee financial expert.” In light of his education, background and experience, he is qualified to assist the Board of Directors in overseeing the Company’s financial and accounting functions and evaluating the Company’s internal controls over financial reporting.
39
Table of Contents
Other Significant Employees
John Quinn has served as Chief Operating Officer and a member of the board of directors of Global Traffic Network (UK) Commercial Limited since March 1, 2009. From 2008 to February 2009, Mr. Quinn served as Chief Operating Officer of UBC Media plc, the prior owner of Global Traffic Network (UK) Commercial Limited. From 1997 to 2008, Mr. Quinn served as Commercial Director and as a board member of UBC Media plc. From 1996 to 1997, Mr. Quinn was the sales director of UBC Media plc.
Ivan N. Shulman commenced his employment with the Company and was appointed Senior Vice President of Sales in May 2006 after serving as a member of the Board from September 2005 through May 2006. Mr. Shulman serves as president of Canadian Traffic Network ULC, the Company’s Canadian subsidiary and is also responsible for sales of our Global Alert Network subsidiary. Mr. Shulman was the owner of The Sports House from March 2003 to August 2007, prior to which time he held various positions with Metro Networks, Inc., serving most recently as the Senior Vice President of Marketing from 1997 to January 2003, Vice President of Marketing from 1995 to 1997 and Vice President of Merchandising from 1994 to 1995.
Compliance with Section 16(a) of the Exchange Act
Section 16(a) of the Exchange Act, as amended, requires the Company’s officers and directors, and persons who own more than ten percent of a registered class of the Company’s equity securities, to file reports of ownership and changes in ownership of such securities with the SEC and NASDAQ. Officers, directors and greater than ten percent shareholders are required by SEC regulations to furnish the Company with copies of all Section 16(a) forms they file. Based solely on review of the copies of the Forms 3, 4 and 5 (and amendments thereto) that we received with respect to transactions during the fiscal year ended June 30, 2011, we believe that the Company’s officers, directors and greater-than-ten-percent beneficial owners complied with all applicable Section 16(a) filing requirements, except as listed in the table below.
| Name of Filer |
Description of Transaction |
Transaction Date(s) |
Filing Date | |||
| Gary O. Benson |
• Transfer of 52,000 shares held by Goben Enterprises, LP, a family limited partnership of which Mr. Benson is a general partner, to DM Benson Irrevocable Trust, a trust for the benefit of Mr. Benson’s spouse |
August 3, 2009 | September 13, 2010 | |||
| • Series of gifting transactions |
October 6, 2009 | September 13, 2010 | ||||
| William L. Yde III |
• Sales by Mr. Yde’s former spouse of an aggregate of 22,600 shares of stock over which Mr. Yde had retained voting rights |
March 2 and 3, 2011 | March 9, 2011 | |||
| B. William Pezzimenti |
• Sales of an aggregate of 40,200 shares |
May 17, 18 and 19, 2011 | May 27, 2011 | |||
Corporate Governance, Ethics and Business Conduct
The Company’s Board of Directors firmly believes that the commitment to sound corporate governance practices is essential to obtaining and retaining the trust of investors, employees and suppliers. The Company’s corporate governance practices reflect the requirements of applicable securities laws, including the Sarbanes-Oxley Act of 2002, the Nasdaq Stock Market listing requirements and the Company’s own vision of good governance practices.
The Company is committed to conducting business lawfully and ethically. All of its employees, including its Chief Executive Officer and senior financial officers, are required to act at all times with honesty and integrity. The Company’s Code of Business Conduct and Ethics covers areas of professional conduct, including workplace behavior, conflicts of interest, fair dealing with competitors and vendors, the protection of Company assets, trading in Company securities and confidentiality, among others. The Code of Business Conduct and Ethics requires strict adherence to all laws and regulations applicable to our business and also describes the means by which any employee can provide an anonymous report of an actual or apparent violation of our Code of Business Conduct and Ethics. In addition to the Code of Business Conduct and Ethics, the Company has adopted a separate Code of Ethics specifically applicable to the Company’s Chief Executive Officer and senior financial officer(s), including the Chief Financial Officer and principal accounting officer (if different from the Chief Financial Officer).
The full text of the Code of Business Conduct and Ethics and the Code of Ethics specifically applicable to the Company’s Chief Executive Officer and senior financial officers are each available online at www.globaltrafficnetwork.com (click on “Investor Relations,” “Corporate Governance” and “Code of Business Conduct and Ethics”).
40
Table of Contents
Audit Committee of the Board of Directors
The Company has established a three member audit committee within its Board that currently consists of Chairman Stuart R. Romenesko and Messrs. Shane E. Coppola and Gary O. Benson. The audit committee held five meetings during fiscal 2011. The audit committee operates under a written charter adopted by the Board, a current copy of which is available on the Company’s Internet website at www.globaltrafficnetwork.com (click on “Investor Relations,” then “Corporate Governance” and “Audit Committee Charter”). As set forth in the charter, the primary responsibilities of the audit committee include: (i) serving as an independent and objective party to oversee the Company’s financial reporting process and internal control system; (ii) reviewing and appraising the audit performed by the Company’s independent accountants; and (iii) providing an open avenue of communication among the independent accountants, financial and senior management and the Board. The charter also requires that the audit committee, among other things, review and pre-approve the performance of all audit and non-audit accounting services to be performed by the Company’s independent accountants, other than certain de minimus exceptions permitted by Section 202 of the Sarbanes-Oxley Act of 2002. The Board has determined that at least one member of the audit committee, Stuart R. Romenesko, is an “audit committee financial expert” as that term is defined in Item 407(d)(5)(ii) of Regulation S-K promulgated under the Exchange Act, as amended. In addition, each member of the audit committee (including Mr. Romenesko) is an “independent director,” as such term is defined in Rule 5605(a)(2) of NASDAQ Marketplace Rules, and meets the criteria for independence set forth in Rule 10A-3(b)(1) under the Exchange Act, as amended. The Board has also determined that each of the audit committee members is able to read and understand fundamental financial statements and that at least one member of the audit committee has past employment experience in finance or accounting.
Item 11. Executive Compensation
Compensation Discussion and Analysis
This section contains a discussion of the material elements of compensation awarded to, earned by or paid to our principal executive officer, our principal financial officer and the two other individuals who were serving as executive officers of our Company as of June 30, 2011. These individuals are referred to in this report as the “named executive officers.”
Overview of Compensation Program
The primary goals of our executive compensation structure are to provide competitive levels of compensation that integrate pay with our annual company objectives and long-term goals, reward above-average company performance, recognize individual initiative and achievements, and assist us in attracting and retaining qualified executives. Executive compensation is set at levels that the compensation committee believes to be consistent with companies of similar size and performance. To meet these goals, our compensation committee has determined that the total compensation program for executive officers should generally consist of some or all of the following three components, the amount of each component to be based upon a combination of individual and company performance:
| • | Base salary; |
| • | Non-equity incentive plan compensation (cash bonuses); and |
| • | Stock options and/or restricted stock. |
Each individual component of compensation meets some or all of our compensation goals. Base salary is designed to provide the competitive annual cash compensation required to attract and retain qualified executives. Non-equity incentive plan compensation in the form of cash bonuses are performance based awards designed to reward employees for achieving objectives on an individual and/or company wide basis. Stock options and restricted stock are intended to reward employees for long-term company performance and to align employees’ interests with the interests of our stockholders. Our compensation committee establishes objective criteria for the awarding of non-equity incentive plan compensation (cash bonuses), while reserving the right to grant additional discretionary bonuses in situations it deems appropriate. The award of stock options and/or restricted stock is subjective and qualitative by nature and entirely within the discretion of our compensation committee.
Although our Company pays Mr. B. William Pezzimenti, who serves as President and Director of Australia Traffic Network, in Australian dollars, Mr. Pezzimenti’s compensation in this Annual Report on Form 10-K is reported in U. S. dollars. When making compensation determinations regarding Mr. Pezzimenti, our compensation committee performs its analysis in the local currency only and does not take into account portions of compensation increases (or decreases) that, when reported in U.S. dollars, are the result of currency fluctuations. From the year ended June 30, 2008 to the year ended June 30, 2009, the Australian dollar weakened significantly against the U.S. dollar, leading to a decrease in Mr. Pezzimenti’s base salary from $430,520 in fiscal 2008 to $390,954 in fiscal 2009. Although this represented a decrease of 9% in U.S. dollars, Mr. Pezzimenti’s base salary actually increased by 9% when measured in Australian dollars. Conversely, the Australia dollar strengthened considerably against the U.S. dollar during fiscal 2010 and fiscal 2011. Although this contributed to a 27% increase in Mr. Pezzimenti’s base compensation for fiscal 2010, the increase represented only a 7% increase in base compensation when measured in Australian dollars. For fiscal 2011, Mr. Pezzimenti’s base compensation increased 13% when measured in U.S. dollars but only increased by 1% when measured in Australian dollars.
41
Table of Contents
Role of our Compensation Committee
The primary objectives of our compensation committee with respect to executive compensation are to attract, retain and motivate the best possible executive talent by providing appropriate levels of risk and reward for executive employees in proportion to individual contribution and performance. To achieve these objectives, the compensation committee establishes appropriate incentives for the executive officers to further our long term strategic plan and avoid undue emphasis on short-term market value.
The charter of our compensation committee authorizes the committee to approve compensation for our Chief Executive Officer, to develop policies and programs governing the compensation of all company executives that support corporate objectives and the long-term interests of stockholders, and to administer our equity compensation plans. Because our compensation committee is expected to evaluate the performance of our executives in achieving our Company’s long-term goals and stated objectives, the compensation committee charter establishes an expectation that our compensation committee meet at least once annually and more frequently if circumstances dictate. Although our compensation committee has typically met with our Chief Executive Officer, when appropriate, such as when the compensation committee is discussing or evaluating compensation for our Chief Executive Officer, the compensation committee meets in executive session without management. Although our compensation committee is solely responsible for establishing compensation for our Chief Executive Officer, our Chief Executive Officer plays a significant role in establishing compensation received by the other named executive officers by providing periodic reports and recommendations to our compensation committee concerning the performance and compensation of these other named executive officers. With the exception of our Chief Executive Officer, the named executive officers do not currently have any role in determining or recommending the form or amount of compensation that they receive.
The compensation committee generally receives and reviews materials in advance of each meeting. These materials include information that the chair of our compensation committee believes will be helpful to the compensation committee as a whole, such as benchmark information, historical compensation data, performance metrics and criteria and, if applicable, the Board of Director’s assessment of our Company’s performance against its goals. When establishing non-equity incentive plan compensation plans, the committee also reviews sales budgets for applicable markets that are internally prepared by management. Upon request by our compensation committee, our Chief Financial Officer and other named executive officers may provide financial and other information to assist the compensation committee in determining appropriate compensation levels.
Our compensation committee has the authority to retain (with funding provided by us) experts in the field of executive compensation. The compensation committee has the sole authority to retain and terminate these experts, and to approve their fees and other retention terms. In addition, our compensation committee has the authority to obtain advice and assistance from internal or external legal, accounting, human resource or other advisors. To date, our compensation committee has not retained a compensation consultant to conduct a comprehensive review of our policies and procedures with respect to executive compensation. However, the compensation committee does conduct an annual review of the total compensation of each of our executive officers.
Elements of 2011 Executive Compensation
Base Salary. The base salaries for the named executive officers were initially established pursuant to employment agreements or arrangements entered into at the commencement of the executives’ employment with our Company, which agreements have been amended to reflect extensions of the executives’ terms of employment and changes in base compensation. The base salaries for our executives are established based on the scope of their responsibilities, the level of their experience and the urgency of our need for the executive’s particular skill set, taking into account competitive market data on compensation for similar positions within public companies having a similar market capitalization and performance as ours. Where applicable, our compensation committee also takes into account the geographic scope of an executive’s responsibilities in light of the global nature of our consolidated operations. Our compensation committee reviews the base salaries of our executives on an annual basis. Subject to existing contractual obligations, salaries may be adjusted as appropriate to realign salaries with market levels after taking into account individual responsibilities, performance and experience. Increases are considered in the context of the general trends in compensation practices, our overall annual budget and in the context of the overall compensation payable to an individual. If our compensation committee believes that increased compensation is warranted based on responsibilities and performance levels that recur from year to year (rather than individual or Company performance over the past year), the increase will generally take the form of an increase in base salary rather than a one-time bonus award. We have entered into written employment agreements with each of Messrs. William L. Yde III, our Chief Executive Officer and President, Scott E. Cody, our Chief Operating Officer, Chief Financial Officer and Treasurer and Gary L. Worobow, our Executive Vice President, Business and Legal Affairs and Secretary. Compensation for Mr. Pezzimenti is governed by unwritten employment arrangements. These agreements and arrangements are described in this report under “Description of Employment Agreements and Arrangements, Salary, and Bonus Amounts.”
Mr. Yde’s base salary during fiscal 2009 was $450,000. Mr. Yde’s agreement provided for a $50,000 annual increase in his base salary upon reaching certain Company objectives for the preceding fiscal year that is determined annually by the compensation committee or the Board at or near the beginning of that fiscal year. Although Mr. Yde did not meet the applicable performance objectives for fiscal 2009, the compensation committee elected to increase Mr. Yde’s base salary effective July 1, 2009 by $25,000, from $450,000 to $475,000, primarily due to the increased operational and oversight responsibilities that resulted from the Company’s March 1, 2009 acquisition of London-based The Unique Broadcasting Company Limited (now named Global Traffic Network (UK) Commercial Limited)(“Unique”) and the corresponding expansion of our United Kingdom business operations. Effective July 1, 2010, we increased the base salary of Mr. Yde from $475,000 to $525,000 upon reaching the objectives for the 2010 fiscal year. The objectives for Mr. Yde during fiscal 2009 and fiscal 2010 were consistent with his annual bonus objectives for those years, which are discussed below. Effective February 9, 2011, we entered into a new
42
Table of Contents
employment agreement with Mr. Yde which increased Mr. Yde’s base salary to $595,000 and provides that he is eligible for $25,000 annual discretionary increases in his base salary upon the Company achieving the pre-determined Company objectives determined by our compensation committee.
Pursuant to his employment agreement, Mr. Cody’s base salary during fiscal 2009 was $315,000. Mr. Cody’s employment agreement provided for an automatic 5% increase in his base salary annually. In accordance with his agreement, Mr. Cody’s base salary was increased to $330,750 effective July 1, 2009 and $347,288 effective July 1, 2010. Effective February 9, 2011, Mr. Cody entered into a new employment contract with us which did not change his base compensation for the year ended June 30, 2011 but provides that his base salary will be increased to $395,000 effective July 1, 2011. This new agreement does not provide for further automatic increases in base salary.
Effective March 1, 2009, Mr. Worobow commenced employment at a base compensation level of $250,000. Due to Mr. Worobow’s previous position as a member of our Board and our compensation committee, a special committee of disinterested directors approved the terms of Mr. Worobow’s employment agreement, including the level of his base compensation. Mr. Worobow’s base compensation increased from to $262,500 effective February 1, 2010 and $275,625 effective February 1, 2011 in accordance with the terms of his employment agreement which provided for annual automatic 5% increases in his base salary. Effective July 1, 2011, Mr. Worobow entered into a new employment contract that provides for an initial annual base salary of $290,000 that will be increased automatically by 5% on July 1 of each year commencing July 1, 2012.
Mr. Pezzimenti’s base compensation increased from $480,000 AUD to $525,000 AUD for fiscal 2009. As previously discussed, Mr. Pezzimenti is compensated in Australian dollars and all compensation decisions are based in his local currency without taking into account fluctuations in exchange rates. For fiscal 2010, Mr. Pezzimenti’s base compensation was increased to $561,000 AUD. Effective July 1, 2010, Mr. Pezzimenti’s base compensation was increased to $566,400 AUD. In each of these years, the increase in Mr. Pezzimenti’s base compensation was in recognition of his continued and consistent success in increasing Australia Traffic Networks sales from period to period.
Non-Equity Incentive Plan Compensation (Cash Bonuses).
Our compensation committee establishes objective criteria for the awarding of non-equity incentive plan compensation in the form of cash bonuses. For Messrs. William L. Yde III, our President and Chief Executive Officer, Scott E Cody our Chief Financial Officer, Chief Operating Officer and Treasurer, and Gary L. Worobow, our Executive Vice President, Business and Legal Affairs, the bonus payments are contingent on the Company satisfying certain consolidated operating profit goals for each fiscal year that are determined by the compensation committee at or near the beginning of the applicable fiscal year. Pursuant to their employment agreements, Mr. Yde is eligible to receive an annual cash bonus of up to 50% of his base salary, Mr. Cody is eligible to receive an annual cash bonus of up to $100,000 and Mr. Worobow is eligible to receive an annual cash bonus of up to one-third of his base salary. In February 2011, we entered into a new employment agreement, the terms of which provide Mr. Cody an annual cash bonus potential equal to 40% of his base salary commencing for fiscal 2012. Because Mr. Worobow’s employment commenced in March 2009, he was first eligible to earn a bonus under the plan during fiscal 2010. However, pursuant to his employment agreement, we paid Mr. Worobow a signing bonus of $20,833. We have chosen operating profits (EBITDA) as the metric on which to base cash bonus plans for eligible executives because we believe it is a key metric on which our performance is measured by investors and other third parties. Further, we have elected to tie cash bonuses under these plans to operating profits (EBITDA) on a consolidated basis, rather than market by market, because we believe it will incentivize eligible executives to focus on the results of our operations as a whole.
The compensation committee set the target EBITDA objective for fiscal 2009 at $10.3 million. As a point of reference, the Company’s fiscal 2008 EBITDA was approximately $5.3 million. For purposes of the bonus calculation, EBITDA is defined as operating income plus depreciation and amortization, excluding the impact of other income and expense. Because it was unclear as to when or if our acquisition of Unique would occur, the target was adopted based on a budget that did not take Unique’s operations into account. Consequently, the actual EBITDA for purposes of the bonus determination was to be calculated net of any impact on EBITDA resulting from Unique operations. Excluding the Unique operations, actual fiscal 2009 EBITDA was approximately $3.5 million and, based on these results, Messrs. Yde and Cody did not receive performance-based bonuses for fiscal 2009. However, the compensation committee elected to award Messrs. Yde and Cody discretionary bonuses of $112,500 and $50,000, respectively, based primarily upon the substantial efforts expended by each of them in negotiating and consummating our acquisition of Unique. To a lesser extent, the compensation committee awarded such bonuses in recognition of revenue growth in our local markets despite economic conditions that resulted in declines in revenue in such markets over the broader advertising industry.
During fiscal 2010, our compensation committee awarded cash bonuses to Messrs. Yde, Cody and Worobow of $237,500, $100,000 and $85,417, respectively based on the Company exceeding the fiscal 2010 EBITDA goal of $5.1 million, which was set by the Board of Directors at the beginning of the fiscal year when approving the Company’s fiscal 2010 budget.
During fiscal 2011, our compensation committee awarded cash bonuses to Messrs. Yde, Cody and Worobow of $297,500, $100,000 and $89,324, respectively based on the Company exceeding the fiscal 2011 EBITDA goal of $12.0 million, which was set by the Board of Directors at the beginning of the fiscal year when approving the Company’s fiscal 2011 budget. In order to negate the impact of currency fluctuations over the course of fiscal 2011, over which the Company’s executive officers have no control, the fiscal 2011 EBITDA achieved was calculated assuming that the exchange rates of Australian, Canadian and United Kingdom currency remained constant throughout the fiscal year.
43
Table of Contents
A table summarizing the Company performance against historical EBITDA targets is set forth below:
| Fiscal Year |
EBITDA Target |
Actual EBITDA | ||
| 2009 |
$10.3 million | $3.5 million* | ||
| 2010 |
$5.1 million | $9.1 million** | ||
| 2011 |
$12.0 million | $16.7 million*** |
| * | Excludes the impact of the Company’s acquisition of Unique |
| ** | Excludes impairment charge to fixed assets of $66 thousand |
| *** | Target and “actual” EBITDA based on fixed exchange rates of Australia dollar @ .8750 USD, Canadian dollar @ .95 USD & British pound @ 1.50 USD. Excludes impact of loss on disposal of assets of $94 thousand. Unadjusted actual EBITDA for fiscal year 2011 was approximately $18.4 million. |
For fiscal 2012, Messrs. Yde, Cody and Worobow have potential bonuses of $297,500, $158,000 and $96,667, respectively. The bonuses are based on attaining the following percentages of the Company’s EBITDA target as established by the Board. Messrs. Yde, Cody and Worobow will be entitled to receive 10% of their target bonus if the Company achieves 85% of the Company’s EBITDA target, and if actual EBITDA is greater than 85% of the target amount, each of Messrs. Yde, Cody and Worobow will be entitled to receive such 10%, plus an additional percentage equal to six times the amount by which actual EBITDA as a percentage of the target amount exceeds 85%, up to 100% of their respective potential bonus amounts. Furthermore, for purposes of the bonus calculation, EBITDA will be calculated based on actual results in local currencies translated at the exchange rates utilized for the target EBITDA approved by the Board, irrespective of the actual currency rates utilized in preparation of the Company’s financial statements.
Due to the relatively mature nature of our Australian operations, the financial results of these operations were, and continue to be, highly dependent on continued sales of our commercial advertising inventory. Therefore, our compensation committee has determined that annual incentive compensation for B. William Pezzimenti, who serves as President and Director of Australia Traffic Network, should take the form of commission-based bonuses and bonuses related to his respective areas of authority, rather than based on the results of our consolidated operations. Ivan Shulman and John Quinn, whom our Board has identified as key employees, also have components of incentive compensation tied directly to the sales of advertising inventory.
For fiscal 2009, Mr. Pezzimenti received monthly sales-based bonuses of approximately $9,000 or $13,000 (based on the average exchange rate for fiscal 2009) for achieving sales targets set by our Chief Executive Officer and approved by our compensation committee. The targets for 2009 approximated 100% and 104% of Australia Traffic Network fiscal 2009 monthly sales budgets. Australia Traffic Network’s annual sales budget was approximately $58.9 million AUD. For fiscal 2009, Mr. Pezzimenti achieved the higher target level four times, the lower target four times and no sales bonus four times, and achieved approximately 98% of his annual sales target over the course of the entire fiscal year. For fiscal 2009, Mr. Pezzimenti received monthly sales-based bonuses totaling $92,175.
For fiscal 2010, our compensation committee approved three “tiers” of annual Australian revenue targets for fiscal 2010, each of which corresponds with a specified percentage increase in annual revenue from the Australian operations over the fiscal 2009 period. Mr. Pezzimenti was entitled to receive monthly cash bonuses upon the Company’s Australian operations achieving monthly portions of the targeted revenue amounts. Depending on the monthly revenue target tier achieved, Mr. Pezzimenti was entitled to monthly cash bonuses of approximately $7,000, $15,000 or $20,000 (based on the average exchange rate for fiscal 2010). Mr. Pezzimenti was not entitled to receive bonus amounts for any month in which the Company’s Australian operations failed to achieve revenues corresponding to the lowest revenue target tier. However, Mr. Pezzimenti had the opportunity to “recapture” any missed monthly cash bonuses by achieving the cumulative revenue target for the quarter in which the monthly sales bonus was not achieved. Australia Traffic Network’s annual sales budget was approximately $61.1 million AUD. Mr. Pezzimenti achieved the highest of the three targets six times and the middle target the remaining six months, and achieved approximately 104% of his annual sales budget over the course of the entire fiscal year. For fiscal 2010, Mr. Pezzimenti received monthly sales-based bonuses totaling $212,436.
For fiscal 2011, our compensation committee approved three “tiers” of annual Australian revenue targets for fiscal 2011, each of which corresponds with a specified percentage of budgeted annual revenue from the Australian operations. Mr. Pezzimenti was entitled to receive monthly cash bonuses upon the Company’s Australian operations achieving monthly portions of the targeted revenue amounts. Depending on the monthly revenue target tier achieved, Mr. Pezzimenti was entitled to monthly cash bonuses of approximately $7,400, $17,300 or $29,700 (based on the average exchange rate for fiscal 2011). Mr. Pezzimenti was not entitled to receive bonus amounts for any month in which the Company’s Australian operations fail to achieve revenues corresponding to the lowest revenue target tier. However, Mr. Pezzimenti had the opportunity to “recapture” any missed monthly cash bonuses by achieving the cumulative revenue target for the quarter in which the monthly sales bonus was not achieved. Australia Traffic Network’s annual sales budget was approximately $68.5 million AUD. Mr. Pezzimenti achieved the highest of the three targets five times, the middle target four times, the lowest target one time, missed two targets and achieved approximately 102% of his annual sales budget over the course of the entire fiscal year. For fiscal 2011, Mr. Pezzimenti received monthly sales-based bonuses totaling $224,481. In addition, for fiscal 2011, the compensation committee approved an additional bonus for Mr. Pezzimenti based on achieving the quarterly EBITDA goals of Australia Traffic Network. Mr. Pezzimenti was eligible for $25,000 AUD for each quarter in which Australia reached its EBITDA goal. Mr. Pezzimenti reached his EBITDA goal for two quarters and received EBITDA based bonuses of $50,000. The annual EBITDA budget for Australia (excluding management fees paid to Global Traffic Network) was approximately $21.2 million AUD. The EBITDA based bonus was instituted in order to focus and reward Mr. Pezzimenti on the overall
44
Table of Contents
performance of our Australian operations, rather than just sales performance. Finally, in recognition of his efforts in turning around our Canadian sales efforts, the compensation committee authorized an additional bonus to be equal to 15% of the amount by which our Canadian sales exceeded $15,000,000 CAD. Canadian sales for fiscal 2011 were approximately $14.9 million and, as such, Mr. Pezzimenti received no bonus with regards to Canadian sales.
For fiscal 2012, our compensation committee approved two “tiers” of annual Australian revenue targets for fiscal 2012, each of which corresponds with a specified percentage of the annual revenue budget. On an annual basis, the tiers correspond to budget and 104% of budget. Mr. Pezzimenti will be entitled to receive monthly cash bonuses upon the Company’s Australian operations achieving monthly portions of the targeted revenue amounts. Depending on the monthly revenue target tier achieved, Mr. Pezzimenti will be entitled to monthly cash bonuses of approximately $16,100 or $32,200 (based on the exchange rate at June 30, 2011). Mr. Pezzimenti is not entitled to receive bonus amounts for any month in which the Company’s Australian operations fail to achieve revenues corresponding to the lowest revenue target tier. However, Mr. Pezzimenti has the opportunity to “recapture” any missed monthly cash bonuses by achieving the cumulative revenue target for the quarter in which the monthly sales bonus was not achieved. In addition, Mr. Pezzimenti is entitled to receive approximately $16,100 (based on the exchange rate at June 30, 2011) for each quarter our Canadian operations reach their revenue budget. Mr. Pezzimenti is paid in Australian dollars and the dollar amounts reflected above have been converted to United States dollars utilizing the exchange rate as of June 30, 2011. Due to the fixed cost nature of our business, it is anticipated that an increase in revenues will yield significant additional operating income and earnings. The compensation committee evaluates the terms of the non-equity incentive plan applicable to Mr. Pezzimenti on an annual basis and revises the terms of this plan based on their review. In addition, the compensation committee has approved an additional bonus plan for Mr. Pezzimenti based on Australian operating profits. Mr. Pezzimenti is entitled to receive approximately $26,800 (based on the exchange rate at June 30, 2011) for each quarter during which Australia Traffic Network achieves its EBITDA target and an additional approximately $107,200 (based on the exchange rate at June 30, 2011) if Australia Traffic Network achieves its annual EBITDA target.
For Mr. Pezzimenti, the sales targets established for a particular fiscal year have been determined using the sales budgets prepared by Company management as a baseline. The compensation committee reviews these budgets with management prior to their adoption and believes that they represent levels that, if achieved, will translate into operating success and increased shareholder value. To provide for meaningful incentives, the compensation committee strives to put in place sales goals that are both challenging yet achievable, and it believes that the Company’s budgets provide a baseline consistent with this approach
Long Term Incentive Program. We believe that long term performance is achieved through an ownership culture that encourages long-term performance by our executive officers through the use of stock-based awards and, to date, our long-term compensation has consisted of stock options and restricted stock. Our stock compensation plans have been established to provide key employees, including our executive officers, with incentives to help align the employees’ interests with those of our stockholders, enabling our executive officers to participate in the long-term appreciation of our stockholder value, while personally experiencing the impact of any business setbacks, whether Company specific or industry based. Additionally, we include stock options and restricted stock in our compensation program as a means of promoting retention of key executives, which is achieved by subjecting such options and restricted stock grants to service-based vesting schedules. Options and restricted stock vest in annual installments over periods that range from three to five years, with vesting dates generally matching the anniversaries of the grant dates. Our initial grants of long-term equity-based incentive compensation following our initial public offering in March 2006, took the form of stock options. Commencing in fiscal 2008, we began also granting shares of restricted stock in part to mitigate the level of dilution resulting from equity based incentives, as the equivalent level of intrinsic value may be realized through granting fewer restricted shares than the amount of shares underlying stock options. Our compensation committee determines the form that an equity-based compensation award will take on an individual basis at the time of grant.
The initial stock option grant made to an executive officer upon joining us is primarily based on competitive conditions applicable to the named executive officer’s specific position. In addition, our compensation committee considers the number of options owned by other executive officers in comparable positions within our Company, as well as at public companies with comparable market capitalizations. Subsequent grants to executive officers are generally considered and awarded in connection with the annual company-wide compensation review or at other times deemed appropriate. Such subsequent grants serve to maintain a competitive position for our Company relative to new opportunities that may become available to our executive officers.
Awards to an executive officer are based upon his or her sustained performance over time, ability to impact results that drive our stockholder value, level of responsibility within the Company, potential to take on roles of increasing responsibility in our Company and competitive equity award levels for similar positions and responsibilities in public companies with comparable market capitalizations and performance. As mentioned above, the award of stock-based compensation has remained subjective and qualitative by nature, and equity awards are not granted automatically to our executive officers on an annual basis.
During the fiscal year ended June 30, 2009, we granted no equity based awards to our executive officers, although Mr. Worobow received 20,000 shares of restricted stock related to his service on our Board prior to the commencement of his employment with the Company.
In July 2009, we granted Messrs. Worobow and Cody options to purchase 20,000 shares and 100,000 shares of our common stock, respectively. As with previous grants, these grants were intended to more closely align our executives’ interests with those of our shareholders and they were deemed appropriate in light of each executive’s potential to impact our company’s operations over the life of the awards. In
45
Table of Contents
November 2009, we granted Mr. Pezzimenti 25,000 shares of restricted stock and an option to purchase 25,000 shares of our common stock. Mr. Pezzimenti’s grants were delayed so that we could fully understand the impact of newly enacted Australian legislation that changed the manner in which stock options and restricted stock recipients are taxed and diminished the attractiveness of stock options or restricted stock as a form of long term incentive compensation. As with prior grants to Mr. Pezzimenti, these grants were designed to reward Mr. Pezzimenti for the outstanding performance of the Australia Traffic Network in light of the importance of the Company’s Australian operations to the Company’s overall performance, as well as to acknowledge his increased involvement in our Canadian operations.
In August 2010, we granted Mr. Cody options to purchase 100,000 shares of our common stock, Mr. Pezzimenti 35,000 shares of restricted stock and Mr. Worobow options to purchase 20,000 shares of our common stock and 20,000 shares of restricted stock. These grants were intended to more closely align our executives’ interests with those of our shareholders and they were deemed appropriate in light of each executive’s potential to impact our company’s operations over the life of the awards. In February 2011, in conjunction with their entering new employment agreements with the Company, we granted Messrs. Yde and Cody 50,000 and 22,725 shares of restricted stock, respectively.
In July 2011, we granted Mr. Worobow 10,000 stock options and 10,000 shares of restricted stock and granted Mr. Pezzimenti 30,000 stock options.
Our compensation committee will continue to analyze the facts and circumstances surrounding these and other executives when making equity based compensation grant determinations.
We have not established any stock ownership guidelines for our executives but we believe that a meaningful equity stake in our Company by our executive officers fosters alignment between the interests of our executive officers and those of our stockholders.
Severance and Other Benefits Upon Termination of Employment
In order to achieve our compensation objective of attracting, retaining and motivating qualified executives, we believe that we need to provide our executive officers with severance protections that are consistent with the severance protections offered by public companies with similar market capitalizations. Thus, the current employment agreements with Messrs. Yde, Cody, and Worobow provide for severance benefits in the event of a termination of employment by the Company without cause or by the executive in the event of a material breach by the Company of the executive’s employment agreement. Our compensation committee has determined that it is appropriate to provide these executives with severance benefits under these circumstances in light of their positions with our Company and as part of their overall compensation package. The severance benefits for these executives consist of continued salary (including contractual increases where applicable) for a period of 18 months for Mr. Yde, and 12 months for Messrs. Cody and Worobow.
In addition, in the event of an acquisition of the Company through the sale of substantially all of the Company’s assets or through a merger, exchange, reorganization or liquidation of the Company or a similar event as determined by our Board or compensation committee, all unvested equity-based incentives awarded to Messrs. Yde, Cody and Worobow will immediately vest upon the closing of such transaction.
We believe these severance benefits are consistent with severance arrangements of public companies with similar market capitalizations and provide these executive officers with financial and personal security during a period of time when they are likely to be unemployed. See “Potential Payments Upon Termination or Change in Control” below for a description of the potential payments that may be made to the named executive officers in connection with their termination of employment or upon a change in control.
Tax Deductibility of Compensation
Section 162(m) of the Internal Revenue Code of 1986, as amended, places a limit of $1,000,000 on the amount of compensation that we may deduct in any one year with respect to each of our five most highly paid executive officers. There is an exception to the $1,000,000 limit, however, for performance-based compensation meeting certain requirements. Stock option awards generally are performance-based compensation meeting those requirements and, as such, are fully deductible.
Compensation Committee Report
The compensation committee of the Company has reviewed and discussed the Compensation Discussion and Analysis required by Item 402(b) of Regulation S-K of the Exchange Act with management and, based on such review and discussions, the compensation committee recommended to the Board that the Compensation Discussion and Analysis be included in this Annual Report Form 10-K.
| The Compensation Committee: |
| Shane E. Coppola |
| William M. Mower |
46
Table of Contents
Summary Compensation Table
The following summary compensation table reflects cash and non-cash compensation for the fiscal years ended June 30, 2011, 2010 and 2009 awarded to or earned by the named executive officers.
| Name and Principal Position |
Fiscal Year Ended June 30 |
Salary ($) | Bonus ($) | Stock Awards ($)(1) |
Option Awards ($)(1) |
Non- Equity Incentive Plan Compensation ($) |
All Other Compensation ($) |
Total ($) | ||||||||||||||||||||||||
| William L. Yde III |
2011 | $ | 552,596 | $ | — | $ | 551,500 | $ | — | $ | 297,500 | (2) | $ | 12,000 | (4) | $ | 1,413,596 | |||||||||||||||
| Chairman, President and Chief |
2010 | $ | 475,000 | $ | — | $ | — | $ | — | $ | 237,500 | (3) | $ | 12,000 | (4) | $ | 724,500 | |||||||||||||||
| Executive Officer |
2009 | $ | 450,000 | $ | 112,500 | $ | — | $ | — | $ | — | $ | 12,000 | (4) | $ | 574,500 | ||||||||||||||||
| Scott E. Cody |
2011 | $ | 347,288 | $ | — | $ | 250,657 | $ | 350,700 | $ | 100,000 | (2) | $ | 12,000 | (4) | $ | 1,060,645 | |||||||||||||||
| Chief Financial Officer, Chief Operating |
2010 | $ | 330,750 | $ | — | $ | — | $ | 253,000 | $ | 100,000 | (3) | $ | 12,000 | (4) | $ | 695,750 | |||||||||||||||
| Officer and Treasurer |
2009 | $ | 315,000 | $ | 50,000 | $ | — | $ | — | $ | — | $ | 12,000 | (4) | $ | 377,000 | ||||||||||||||||
| B. William Pezzimenti (5) |
2011 | $ | 561,156 | $ | — | $ | 192,850 | $ | — | $ | 274,481 | (6) | $ | — | $ | 1,028,487 | ||||||||||||||||
| President and Director of Australia Traffic |
2010 | $ | 495,111 | $ | — | $ | 103,250 | $ | 68,175 | $ | 212,436 | (7) | $ | — | $ | 878,972 | ||||||||||||||||
| Network, International Director of Sales and Training |
2009 | $ | 390,954 | $ | — | $ | — | $ | — | $ | 92,175 | (8) | $ | 52,786 | (9) | $ | 535,915 | |||||||||||||||
| Gary Worobow (10) |
2011 | $ | 267,969 | $ | — | $ | 110,200 | $ | 70,140 | $ | 89,324 | (2) | $ | 12,000 | (4) | $ | 549,633 | |||||||||||||||
| Executive Vice President, |
2010 | $ | 255,208 | $ | — | $ | — | $ | 50,600 | $ | 85,417 | (3) | $ | 12,000 | (4) | $ | 403,225 | |||||||||||||||
| Business and Legal Affairs |
2009 | $ | 83,333 | $ | 20,833 | $ | 92,000 | (11) | $ | — | $ | — | $ | 4,000 | (4) | $ | 200,166 | |||||||||||||||
| (1) | Amounts shown reflect the fair value dollar amount of grants received during period as calculated in accordance with FASB ASC 718. Such amounts are recognized for financial statement reporting purposes on a pro rated basis over the vesting period. The amounts previously reported for grants received in fiscal 2009 reflected the expense for financial statement purposes and have been restated for purposes of this report to reflect the full fair value dollar amount of such grants. Assumptions used in calculating the fair value dollar amount of grants is included in Note 9 to our audited financial statements for the fiscal year ended June 30, 2011, which are included elsewhere in this report. |
| (2) | Represents cash bonus amounts paid upon the Company exceeding a fiscal 2011 EBITDA goal of $12.0 million. For purposes of the bonus calculation, EBITDA is defined as operating income plus depreciation and amortization, excluding the impact of other income and expense. The recipient was entitled to receive 10% of his target bonus amount if the Company achieved 85% of the EBITDA target, and if actual EBITDA was greater than 85% of the target amount, the recipient was entitled to receive such 10%, plus an additional percentage equal to six times the amount by which actual EBITDA as a percentage of the target amount exceeded 85%, up to 100% of the potential bonus amount. In addition, for purposes of the bonus, EBITDA was calculated assuming that currency exchange rates remained constant throughout the performance period as follows: Australia 0.8750, Canada 0.9500 and UK 1.500 regardless of the actual exchange rates for the period. EBITDA calculated consistent with these criteria was approximately $16.7 million and actual 2011 EBITDA was approximately $18.4 million. |
| (3) | Represents cash bonus amounts paid upon the Company exceeding a fiscal 2010 EBITDA goal of $5.1 million. For purposes of the bonus calculation, EBITDA is defined as operating income plus depreciation and amortization, excluding the impact of other income and expense. Actual 2010 EBITDA was approximately $9.1 million. |
| (4) | Consists of an additional $1,000 per month paid to executive in lieu of the Company providing medical insurance. |
47
Table of Contents
| (5) | Mr. Pezzimenti is paid in Australian dollars. For the purposes of this table, his salary, bonus, non-equity incentive plan compensation and all other compensation have been converted to United States dollars utilizing the average monthly exchange rate for the fiscal years ended June 30, 2011, 2010 and 2009, as applicable. |
| (6) | Represents non-equity incentive plan compensation in the form of monthly sales-based commissions and quarterly EBITDA bonuses. Our compensation committee approved three “tiers” of annual Australian revenue targets for fiscal 2011, corresponding to 98% of budget, budget and 104% of budget. Mr. Pezzimenti was entitled to receive monthly cash bonuses upon the Company’s Australian operations achieving monthly portions of the targeted revenue amounts. Depending on the monthly revenue target tier achieved, Mr. Pezzimenti was entitled to monthly cash bonuses of approximately $7,400, $17,300 or $29,700 (based on the average exchange rate for fiscal 2011). Mr. Pezzimenti was not entitled to receive bonus amounts for any month in which the Company’s Australian operations fail to achieve revenues corresponding to the lowest revenue target tier. However, we agreed to “true-up” bonus payments on a quarterly basis such that Mr. Pezzimenti was entitled to receive the monthly bonus payments for any month within the quarter which he missed the monthly tier but achieved the quarterly tier on a cumulative basis. Mr. Pezzimenti received $224,481 in non-equity incentive plan compensation in the form of monthly sales-based commissions for fiscal 2011. In addition, Mr. Pezzimenti was entitled to bonuses of approximately $25,000 for each quarter the Australian operations reached their EBITDA goal. Mr. Pezzimenti received $50,000 in non-equity incentive plan compensation in the form of quarterly EBITDA bonuses for fiscal 2011. |
| (7) | Represents non-equity incentive plan compensation in the form of monthly sales-based commissions. Our compensation committee approved three “tiers” of annual Australian revenue targets for fiscal 2010, each of which corresponds with a specified percentage increase in annual revenue from the Australian operations over the fiscal 2009 period. Mr. Pezzimenti was entitled to receive monthly cash bonuses upon the Company’s Australian operations achieving monthly portions of the targeted revenue amounts. Depending on the monthly revenue target tier achieved, Mr. Pezzimenti was entitled to monthly cash bonuses of approximately $7,000, $15,000 or $20,000 (based on the average exchange rate for fiscal 2010). Mr. Pezzimenti was not entitled to receive bonus amounts for any month in which the Company’s Australian operations fail to achieve revenues corresponding to the lowest revenue target tier. However, we agreed to “true-up” bonus payments on a quarterly basis such that Mr. Pezzimenti was entitled to receive the monthly bonus payments for any month within the quarter which he missed the monthly tier but achieved the quarterly tier on a cumulative basis. Mr. Pezzimenti received $212,436 in non-equity incentive plan compensation in the form of monthly sales-based commissions for fiscal 2010. |
| (8) | Represents non-equity incentive plan compensation in the form of monthly sales bonuses. Mr. Pezzimenti received monthly sales-based bonuses of approximately $9,000 or $13,000 (based on the average exchange rate for fiscal 2009) in fiscal year 2009 for achieving sales targets set by our Chief Executive Officer. The targets for 2009 approximated 100% and 104% of Australia Traffic Network’s fiscal 2009 monthly sales budgets. Mr. Pezzimenti received $92,175 in non-equity incentive plan compensation in the form of monthly sales-based commissions for fiscal 2009. |
| (9) | Consists of automobile related costs incurred for the benefit of the employee. At the beginning of fiscal 2009 we transferred ownership to Mr. Pezzimenti of the Company’s owned automobile used by him in lieu of providing him with a company paid automobile. The compensation for fiscal 2009 represents the book value of the automobile at the time of transfer, which we believe approximated the fair value of the automobile. |
| (10) | Mr. Worobow served on our Board of Directors from December 8, 2006 until March 1, 2009. Effective March 1, 2009, Mr. Worobow resigned as a director and commenced employment with the Company as its Executive Vice President, Business and Legal Affairs. Compensation for periods prior to March 1, 2009 pertains to his service on our Board of Directors. |
| (11) | Reflects the fair value dollar amount of grants of restricted stock in accordance to FASB ASC 718 associated with Mr. Worobow’s service as a director of the Company. |
Compensation of Named Executive Officers
The Summary Compensation Table above quantifies the value of the different forms of compensation earned by or awarded to our named executive officers in fiscal years 2011, 2010 and 2009. The primary elements of the named executive officers’ total compensation reported in the table are base salary, discretionary cash bonus, non-equity incentive plan compensation in the form of performance based cash bonuses and long-term equity incentive consisting of stock options and/or restricted stock. Our named executive officers also earned or were paid the other benefits listed in column entitled “All Other Compensation” of the Summary Compensation Table, as further described in the footnotes to the table.
48
Table of Contents
The Summary Compensation Table should be read in conjunction with the tables and narrative descriptions that follow. A description of the material terms of each named executive officer’s employment agreement, base salary and bonus is provided immediately following this paragraph. The Grants of Plan-Based Awards in Fiscal 2011 table, and the description of the material terms of the stock options and restricted stock granted in fiscal 2011 that follows it, provide information regarding the long-term equity incentives awarded to named executive officers in fiscal 2011. The Outstanding Equity Awards at Fiscal 2011 Year-End table provides further information on the named executive officers’ potential realizable value with respect to their equity awards. The discussion of the potential payments due upon a termination of employment or change in control that follows is intended to further explain the potential future payments that are, or may become, payable to our named executive officers under certain circumstances.
Description of Employment Agreements and Arrangements, Salary, and Bonus Amounts
Employment Agreement with William L. Yde III
Salary and Bonus. On November 18, 2005, we entered into an employment agreement with William L. Yde III, our Chief Executive Officer and President, that had a term of five years and became effective on March 29, 2006, the closing date of our initial public offering. Pursuant to this agreement, Mr. Yde initially received a base salary of $350,000 per year and was entitled to $50,000 increases in his base salary on July 1 of each year provided that the Company achieved certain profit levels to be determined by the Board for the preceding fiscal year. Mr. Yde received base salaries of $450,000 and $475,000 per year for fiscal 2009 and 2010, respectively, and he received an annualized base salary of $525,000 during fiscal 2011 through the effective date of his new employment agreement discussed below. Under the initial agreement, as amended, Mr. Yde was also entitled to receive an annual performance-based bonus of up to 50% of his annual base salary for each fiscal year during the agreement’s term. The amount of each year’s bonus, if any, was determined and paid based upon satisfaction of certain operating profit goals to be determined by our compensation committee for the applicable fiscal year and was contingent upon Mr. Yde remaining an active employee of the Company through the end of the applicable fiscal year. In addition to reimbursing Mr. Yde for reasonable expenses incurred in performing his duties, the employment agreement provided that unless and until the Company elected to provide its United States based employees with medical insurance, the Company would pay Mr. Yde $1,000 per month in lieu providing him with medical insurance. Effective February 9, 2011, we entered into a new employment agreement with Mr. Yde that has a term that runs through June 30, 2014. Pursuant to this new agreement, Mr. Yde currently receives a base salary of $595,000 per year and is eligible for $25,000 discretionary increases in his base salary on July 1 of each year (starting July 1, 2012) provided that the Company achieves certain profit levels to be determined by the Board for the preceding fiscal year. As with his prior employment agreement, Mr. Yde is entitled to receive an annual performance-based bonus of up to 50% of his annual base salary for each fiscal year during the agreement’s term with the amount of each year’s bonus, if any, to be determined and paid based upon satisfaction of certain operating profit goals to be determined by our compensation committee for the applicable fiscal year and is contingent upon Mr. Yde remaining an active employee of the Company through the end of the applicable fiscal year. Also consistent with his prior employment agreement, Mr. Yde’s new employment agreement provides for the reimbursement of reasonable expenses incurred in performing his duties and for the payment of $1,000 per month unless and until the Company elects to provide its United States based employees with medical insurance. The agreement requires Mr. Yde to devote substantially all of his working time to our Company.
Equity-based Incentives. In connection with Mr. Yde entering into his new employment agreement, our Board approved a grant of 50,000 restricted shares of Company common stock on February 9, 2011, the effective date of the agreement. The restricted stock grant is subject to transfer and forfeiture restrictions that lapse in three annual installments of 16,666 shares each on February 9, 2012 and 2013 and 16,668 shares on February 9, 2014. In the event of an acquisition of the Company through the sale of substantially all of the Company’s assets or through a merger, exchange, reorganization or liquidation of the Company or a similar event as determined by the Board or the Compensation Committee thereof, all unvested options to purchase Company stock or other equity-based incentives awarded to Mr. Yde will immediately vest upon the closing of such transaction. Also pursuant to the agreement, our Board, in its sole discretion, may grant Mr. Yde up to 500,000 shares of our common stock (as adjusted for stock splits, stock combinations, reorganizations or similar events) if our stock has traded at an average closing sales price of $30.00 per share for 20 consecutive trading days during the term of the agreement, as reported on NASDAQ (or such other market or exchange if our common stock is then quoted or listed on a market or exchange other than NASDAQ).
Confidentiality, Non-competition and Non-solicitation. The Company’s employment agreement with Mr. Yde contains standard provisions regarding protection of our confidential information (as defined in the employment agreement) and prohibits Mr. Yde from directly or indirectly engaging in the following actions during the period he is employed by us and continuing for one year following the termination of the agreement, without our prior express written consent:
| • | Providing services to any of our competitors anywhere outside of the United States similar to those provided to us during his employment; |
| • | soliciting or attempting to induce any of our customers, suppliers, licensees, licensors or other business relations to cease doing business with us; or |
49
Table of Contents
| • | soliciting or attempting to induce any of our employees to leave our employ, or to work for, render services or provide advice to or supply our confidential business information or trade secrets to any third person or entity. |
Employment Agreement with Scott E. Cody
Salary and Bonus. On February 14, 2006, we entered into an employment agreement with Scott E. Cody, our Chief Operating Officer and Chief Financial Officer. The agreement became effective on March 29, 2006 closing date of our initial public offering and, as amended in 2007 and 2008, the agreement had a term scheduled to expire on June 30, 2011. Under this agreement, as amended, Mr. Cody received a base salary of $300,000 per year in fiscal 2008, and his base salary was subject to 5% increases on July 1 of each year during the term of the agreement. Mr. Cody received base salaries of $315,000, $330,750 and $347,288 per year for fiscal 2009, 2010 and 2011, respectively. Mr. Cody was also entitled to receive an annual performance-based bonus of up to $100,000 for each fiscal year during the agreement’s term. The amount of each year’s bonus, if any, was determined and paid based upon satisfaction of certain operating profit goals to be determined by the compensation committee for the applicable fiscal year and was contingent upon Mr. Cody remaining an active employee of the Company through the end of the applicable fiscal year. In addition to reimbursing Mr. Cody for reasonable expenses incurred in performing his duties, the employment agreement provided that unless and until the Company elected to provide its United States based employees with medical insurance, the Company would pay Mr. Cody $1,000 per month in lieu providing him with medical insurance. Effective February 9, 2011, we entered into a new employment agreement with Mr. Cody for an indeterminate term. Under the new agreement, Mr. Cody was entitled to receive a base salary of $347,288 through June 30, 2011 and is entitled to receive a base salary of $395,000 per year thereafter. Mr. Cody is also entitled to receive an annual performance-based bonus of up to $100,000 for fiscal 2011 and up to 40% of his base salary for each future fiscal year during the agreement’s term. As with his prior employment agreement, the amount of each year’s bonus, if any, will be determined and paid based upon satisfaction of certain operating profit goals to be determined by the compensation committee for the applicable fiscal year and is contingent upon Mr. Cody remaining an active employee of the Company through the end of the applicable fiscal year. Also consistent with his prior employment agreement, Mr. Cody’s new employment agreement provides for the reimbursement of reasonable expenses incurred in performing his duties and for the payment of $1,000 per month unless and until the Company elects to provide its United States based employees with medical insurance. The employment agreement requires Mr. Cody to devote substantially all of his working time to our Company.
Equity-based Incentives. During the fiscal years covered by the Summary Compensation Table above, the Company made various grants of equity based awards to Mr. Cody. On July 9, 2009, we granted Mr. Cody stock options to purchase 100,000 shares of our common stock at an exercise price equal to $3.76 per share, which vests over three years with 33,333 shares vesting on each of July 9, 2010 and 2011 and 33,334 shares vesting on July 9, 2012. On August 12, 2010, we granted Mr. Cody stock options to purchase an additional 100,000 shares of our common stock at an exercise price equal to $5.51 per share, which vests over three years with 33,333 shares vesting on each of August 12, 2011 and 2012 and 33,334 shares vesting on August 12, 2013. In conjunction with entering his new employment agreement with the Company, on February 9, 2011 we granted Mr. Cody 22,725 restricted shares of our common stock. The restricted stock grant is subject to transfer and forfeiture restrictions that lapse in three equal annual installments of 7,575 shares each on February 9, 2012, 2013 and 2014. The exercise prices of all stock options are equal to the fair market value of our common stock on the date of grant. In the event of an acquisition of the Company through the sale of substantially all of the Company’s assets or through a merger, exchange, reorganization or liquidation of the Company or a similar event as determined by our Board or compensation committee, all unvested equity-based incentives awarded to Mr. Cody immediately vest upon the closing of such transaction.
Confidentiality, Non-competition and Non-solicitation. The Company’s employment agreement with Mr. Cody contains standard provisions regarding protection of our confidential information (as defined in the employment agreement) and prohibits Mr. Cody from directly or indirectly engaging in the following actions during the period he is employed by us and continuing for one year following the termination of the employment agreement, without our prior express written consent:
| • | providing services to any of our competitors anywhere outside of the United States similar to those provided to us during his employment; |
| • | soliciting or attempting to induce any of our customers, suppliers, licensees, licensors or other business relations to cease doing business with us; or |
| • | soliciting or attempting to induce any of our employees to leave our employ, or to work for, render services or provide advice to or supply our confidential business information or trade secrets to any third person or entity. |
Employment Arrangement with B. William Pezzimenti
Salary and Bonus. B. William Pezzimenti is employed by Australia Traffic Network pursuant to an unwritten arrangement that has no definite term. His base salary, cash bonus and/or cash-based incentive compensation plan is determined for each fiscal year by our Chief Executive Officer in consultation with our compensation committee. Effective July 1, 2010 his base salary is $566,400 AUD. In each of fiscal 2009, 2010 and 2011, Mr. Pezzimenti has been entitled to receive non-equity incentive compensation in the form of cash bonuses for our Australian operations achieving pre-determined revenue targets. For fiscal 2011, Mr. Pezzimenti was also eligible to receive additional cash bonuses based on our Australian operations achieving pre-determined quarterly EBITDA goals and also based on the amount, if any, by which revenues of our Canadian operations exceeded a pre-determined target. Mr. Pezzimenti’s non-equity incentive compensation plans for fiscal 2009, 2010 and 2011, as well as the plan in place for fiscal 2012, are described in detail under “Compensation Discussion and Analysis” above.
50
Table of Contents
Equity-based Incentives. Mr. Pezzimenti’s equity-based compensation grants are made by our compensation committee, generally at the suggestion of our Chief Executive Officer, from time to time as deemed appropriate. During the fiscal years covered by the Summary Compensation Table above, the Company made various grants of equity based awards to Mr. Pezzimenti. On November 5, 2009, we granted Mr. Pezzimenti 25,000 restricted shares of our common stock and stock options to purchase an additional 25,000 shares of our common stock at an exercise price equal to $4.13 per share. The option vests over three years with 8,334 shares vesting on November 5, 2010, and 8,333 shares vesting on each of November 5, 2011 and 2012. The restricted stock grant is subject to transfer and forfeiture restrictions that lapse in three annual installments of 8,334 shares on November 5, 2010 and 8,333 shares each on November 5, 2011 and 2012. On August 12, 2010, the compensation committee granted Mr. Pezzimenti 35,000 restricted shares of our common stock. The restricted stock grant is subject to transfer and forfeiture restrictions that lapse in three annual installments of 11,667 shares each on August 12, 2011 and 2012 and 11,666 shares on August 12, 2013. On July 6, 2011, the compensation committee granted Mr. Pezzimenti stock options to purchase an additional 30,000 shares of our common stock at an exercise price equal to $11.90 per share. The option vests over three years with 10,000 shares vesting on July 6, 2012, 2013 and 2014. The exercise prices of all of these options are equal to the fair market value of our common stock on the date of grant.
Confidentiality, Non-competition and Non-solicitation. We have entered into an agreement with Mr. Pezzimenti which provides for confidentiality, non-competition and non-solicitation covenants that will remain in effect for a period of one year following termination of Mr. Pezzimenti’s employment.
Employment Agreement with Gary L. Worobow
Salary and Bonus. On March 11, 2009, we entered into an employment agreement (effective March 1, 2009) with Gary L. Worobow, our Executive Vice President, Business and Legal Affairs, that was scheduled to run through June 30, 2012. Pursuant to the agreement, Mr. Worobow was entitled to receive an annualized base salary of $250,000 through January 2010, which was subject to 5% annual increases commencing February 1, 2010. In addition, Mr. Worobow received a one-time bonus equal to one month’s salary upon commencing employment. Mr. Worobow was also entitled to receive an annual performance-based bonus of up to one-third of his base salary for each of fiscal 2010, 2011 and 2012. The amount of each year’s bonus, if any, was to be determined and paid based upon satisfaction of certain operating profit goals to be determined by the compensation committee for the applicable fiscal year and was contingent upon Mr. Worobow remaining an active employee of the Company through the end of the applicable fiscal year. In addition to reimbursing Mr. Worobow for reasonable expenses incurred in performing his duties, including maintaining bar association membership and satisfying continuing legal education requirements, the employment agreement provided that unless and until the Company elects to provide its United States based employees with medical insurance, we would pay Mr. Worobow $1,000 per month in lieu of providing him with medical insurance. The employment agreement required Mr. Worobow to devote substantially all of his working time to our Company. Effective July 1, 2011, we entered a new employment agreement with Mr. Worobow for an indefinite term. Under the new agreement, Mr. Worobow is entitled to receive an annualized base salary to $290,000, which is subject to an annual 5% increases commencing July 1, 2012, and is also entitled to receive an annual performance-based bonus of up to one-third of his base salary. As with his prior employment agreement, the amount of each year’s bonus, if any, will be determined and paid based upon satisfaction of certain operating profit goals to be determined by the compensation committee for the applicable fiscal year and is contingent upon Mr. Worobow remaining an active employee of the Company through the end of the applicable fiscal year. Also consistent with his prior employment agreement, Mr. Worobow’s new agreement provides for the reimbursement of reasonable expenses incurred in performing his duties (including maintaining bar association membership and satisfying continuing legal education requirements) and for the payment of $1,000 per month unless and until the Company elects to provide its United States based employees with medical insurance and requires Mr. Worobow to devote substantially all of his working time to our Company.
Equity Based Incentives. During the fiscal years covered by the Summary Compensation Table above, the Company made various grants of equity based awards to Mr. Worobow. On July 9, 2009, we granted Mr. Worobow stock options to purchase 20,000 shares of our common stock at an exercise price equal to $3.76 per share. The option vests over three years with 6,667 shares vesting on each of July 9, 2010 and 2011 and 6,666 shares vesting on July 9, 2012. On August 12, 2010, we granted Mr. Worobow stock options to purchase an additional 20,000 shares of our common stock at an exercise price equal to $5.51 per share and 20,000 shares of restricted stock. The option and restricted shares both vest over three years with 6,667 shares of each vesting on each of August 12, 2011 and 2010 and 6,666 shares of each vesting on August 12, 2013. On July 6, 2011, the compensation committee granted Mr. Worobow stock options to purchase an additional 10,000 stock options at an exercise price of $11.90 per share and 10,000 shares of restricted stock. The option and restricted shares both vest over three years with 3,334 shares of each vesting on July 6, 2012 and 3,333 shares of each vesting on each of July 6, 2013 and 2014. The exercise prices of all of these stock options are equal to the fair market value of our common stock on the date of grant. In the event of an acquisition of the Company through the sale of substantially all of the Company’s assets or through a merger, exchange, reorganization or liquidation of the Company or a similar event as determined by the Board or the Compensation Committee thereof, all unvested options to purchase Company stock or other equity-based incentives awarded to Mr. Worobow immediately vest upon the closing of such transaction.
51
Table of Contents
Confidentiality, Non-competition and Non-solicitation. The Company’s employment agreement with Mr. Worobow contains standard provisions regarding protection of our confidential information (as defined in the employment agreement) and prohibits Mr. Worobow from directly or indirectly engaging in the following actions during the period he is employed by us and continuing for one year following the termination of the agreement, without our prior express written consent:
| • | Providing services to any of our competitors anywhere outside of the United States similar to those provided to us during his employment; |
| • | soliciting or attempting to induce any of our customers, suppliers, licensees, licensors or other business relations to cease doing business with us; or |
| • | soliciting or attempting to induce any of our employees to leave our employ, or to work for, render services or provide advice to or supply our confidential business information or trade secrets to any third person or entity. |
Grants of Plan-Based Awards in Fiscal 2011
The following table sets forth information with respect to stock options and restricted stock granted to the named executive officers during the fiscal year ended June 30, 2011. All stock options and restricted stock identified in the following table were granted under the Company’s 2005 Stock Incentive Plan, as amended, the material terms of which are described below.
| Option Awards: | ||||||||||||||||||||||||||||||
| Stock Awards: | Number of | Exercise or | Grant Date | |||||||||||||||||||||||||||
| Number of | Securities | Base | Fair Value of | |||||||||||||||||||||||||||
| Estimated Future Payouts Under Non-Equity Incentive Plan Awards |
Shares of Stock |
Underlying Options |
Price of Option |
Stock and Option |
||||||||||||||||||||||||||
| Name |
Threshold ($) | Target ($) | Maximum ($) | Grant Date |
(#) | (#) | Awards ($/Share) | Awards (1) | ||||||||||||||||||||||
| William L. Yde III |
29,750 | (2) | — | 297,500 | (3) | July 21, 2010 | — | — | — | — | ||||||||||||||||||||
| William L. Yde III |
— | — | — | February 9, 2011 | 50,000 | — | — | $ | 551,500 | |||||||||||||||||||||
|
|
|
|
|
|
|
|||||||||||||||||||||||||
| Scott E Cody |
10,000 | (2) | — | 100,000 | (3) | July 21, 2010 | — | — | — | — | ||||||||||||||||||||
| Scott E. Cody |
— | — | — | August 12, 2010 | — | 100,000 | $ | 5.51 | $ | 350,700 | ||||||||||||||||||||
| Scott E. Cody |
— | — | — | February 9, 2011 | 22,725 | — | — | $ | 250,657 | |||||||||||||||||||||
|
|
|
|
|
|
|
|||||||||||||||||||||||||
| Gary L. Worobow |
8,932 | (2) | — | 89,324 | (3) | July 21, 2010 | — | — | — | — | ||||||||||||||||||||
| Gary L. Worobow |
— | — | — | August 12, 2010 | — | 20,000 | $ | 5.51 | $ | 70,140 | ||||||||||||||||||||
| Gary L. Worobow |
— | — | — | August 12, 2010 | 20,000 | — | — | $ | 110,200 | |||||||||||||||||||||
|
|
|
|
|
|
|
|||||||||||||||||||||||||
| B. William Pezzimenti |
88,800 | (4)(5) | 207,600 | (5)(6) | 356,400 | (5)(7) | July 21, 2010 | — | — | — | — | |||||||||||||||||||
|
|
|
|
|
|
|
|||||||||||||||||||||||||
| B. William Pezzimenti |
24,800 | (5)(8) | — | 99,200 | (5)(9) | July 21, 2010 | — | — | — | — | ||||||||||||||||||||
| B. William Pezzimenti |
— | — | — | August 12, 2010 | 35,000 | — | — | $ | 192,850 | |||||||||||||||||||||
| (1) | Amounts shown reflect the dollar amount recognized for financial statement reporting purposes in accordance with FASB ASC 718 that will be expensed over the vesting period. Assumptions used in calculating this amount are included in Note 9 to our audited financial statements for the fiscal year ended June 30, 2011, which are included elsewhere in this report. |
| (2) | Represents the amount of cash incentive compensation that the recipient was entitled to receive if the Company achieved 85% of the fiscal 2011 EBITDA goal of $12.0 million. |
| (3) | Represents the amount of cash incentive compensation that the recipient was entitled to receive if the Company met or exceeded 100% the fiscal 2011 EBITDA goal of $12.0 million. |
| (4) | Represents the amount of cash incentive compensation that the recipient was entitled to receive if the Company’s Australian operations generated revenues in excess of 98% budgeted amounts, but less than 100% of budgets amounts, during each month of fiscal 2011. |
| (5) | Mr. Pezzimenti is paid in Australian dollars. Amount reflected above have been translated to United States dollars based on the average exchange rate for fiscal 2011. |
| (6) | Represents the amount of cash incentive compensation that the recipient was entitled to receive if the Company’s Australian operations generated revenues in excess of 100% budgeted amounts, but less than 104% of budgets amounts, during each month of fiscal 2011. |
| (7) | Represents the amount of cash incentive compensation that the recipient was entitled to receive if the Company’s Australian operations generated revenues in excess of 104% of budgeted amounts during each month of fiscal 2011. |
| (8) | The recipient was entitled to receive $24,800 (based on the average exchange rates for the year) for each quarter of fiscal 2011 during which the Company’s Australian operations achieved a pre-determined EBITDA goal. Represents the amount of cash incentive compensation that the recipient was entitled to receive if the Company’s Australian operations achieved such goal for one quarter during fiscal 2011. |
52
Table of Contents
| (9) | The recipient was entitled to receive $24,800 (based on the average exchange rates for the year) for each quarter of fiscal 2011 during which the Company’s Australian operations achieved a pre-determined EBITDA goal. Represents the amount of cash incentive compensation that the recipient was entitled to receive if the Company’s Australian operations achieved such goal for all four quarters during fiscal 2011. |
Global Traffic Network, Inc. 2005 Stock Incentive Plan
We maintain the 2005 Stock Incentive Plan that, as amended and restated to date (the “2005 Plan”), authorizes the granting of stock based awards to purchase up to 2,400,000 shares of our common stock, of which a total of 1,341,383 shares were subject to outstanding option and restricted stock grants at June 30, 2011. Under the 2005 Plan, our Board or a committee of two or more non-employee directors designated by our Board administers the 2005 Plan. As such, the Board or compensation committee, as applicable, has the power to grant awards, to determine when and to whom awards will be granted, the form of each award, the amount of each award, and any other terms or conditions of each award consistent with the terms of the 2005 Plan. Awards may be made to our employees, directors and consultants. The types of awards that may be granted under the 2005 Plan include incentive and non-qualified stock options, restricted and unrestricted stock, stock appreciation rights, performance shares and other stock-based awards. Each award agreement will specify the number and type of award, together with any other terms and conditions as determined by the Board or committee thereof in its sole discretion.
In the event of a sale or merger of the company, the Board of Directors or applicable committee may take any action with respect to outstanding awards that it deems equitable, including providing for the assumption or substitution of outstanding awards, or the acceleration or termination of unvested awards. The Board of Directors may amend or discontinue the 2005 Plan at any time, except as would impair the rights with respect to any awards outstanding under the 2005 Plan.
Outstanding Equity Awards at 2011 Fiscal Year-End
The following table includes certain information as of June 30, 2011 with respect to the value of all unexercised stock options and restricted shares previously awarded to the named executive officers. All stock options and restricted stock identified in the following table were granted under the 2005 Plan.
| Option Awards | Stock Awards | |||||||||||||||||||||
| Name | Number of Securities Underlying Unexercised Options (#) Exercisable |
Number of Securities Underlying Unexercised Options (#) Not exercisable |
Option Exercise Price ($) |
Option Expiration Date |
Number of Shares of Stock that have not Vested (#) |
Market Value of Shares of Stock that have not Vested ($)(14) |
||||||||||||||||
| William L. Yde III |
— | — | — | — | 50,000 | (1) | $ | 574,500 | ||||||||||||||
| Scott E. Cody |
100,000 | — | $ | 5.00 | March 23, 2016 | — | — | |||||||||||||||
| Scott E. Cody |
100,000 | — | $ | 5.25 | March 29, 2017 | — | — | |||||||||||||||
| Scott E. Cody |
50,000 | — | $ | 6.80 | March 12, 2018 | — | — | |||||||||||||||
| Scott E. Cody |
33,333 | 66,667 | (2) | $ | 3.76 | July 9, 2019 | — | — | ||||||||||||||
| Scott E. Cody |
— | 100,000 | (4) | $ | 5.51 | August 12, 2020 | — | — | ||||||||||||||
| Scott E. Cody |
— | — | — | — | 22,725 | (3) | $ | 261,110 | ||||||||||||||
| B. William Pezzimenti |
— | 40,000 | (5) | $ | 6.80 | March 12, 2018 | — | — | ||||||||||||||
| B. William Pezzimenti |
— | 16,666 | (6) | $ | 4.13 | November 5, 2019 | — | — | ||||||||||||||
| B. William Pezzimenti |
— | — | — | — | 16,666 | (7) | $ | 191,492 | ||||||||||||||
| B. William Pezzimenti |
— | — | — | — | 35,000 | (8) | $ | 402,150 | ||||||||||||||
| Gary L. Worobow |
50,000 | — | $ | 4.66 | December 8, 2016 | — | — | |||||||||||||||
| Gary L. Worobow |
— | — | — | — | 6,666 | (12)(11) | $ | 76,592 | ||||||||||||||
| Gary L. Worobow |
6,667 | 13,333 | (13) | $ | 3.76 | July 9, 2019 | — | — | ||||||||||||||
| Gary L. Worobow |
— | 20,000 | (9) | $ | 5.51 | August 12, 2020 | — | — | ||||||||||||||
| Gary L. Worobow |
— | — | — | — | 20,000 | (10) | $ | 229,800 | ||||||||||||||
53
Table of Contents
| (1) | Vests with respect to 16,666 shares on each of February 9, 2012 and February 9, 2013 and 16,668 shares on February 9, 2014. |
| (2) | Vests with respect to 33,333 shares on July 9, 2011 and 33,334 shares on July 9, 2012. |
| (3) | Vests with respect to 7,575 shares on each of February 9, 2012, February 9, 2013 and February 9, 2014. |
| (4) | Vests with respect to 33,333 shares on each of August 12, 2011 and August 12, 2012 and 33,334 shares on August 12, 2013. |
| (5) | Vests with respect to 20,000 shares on each on March 12, 2012 and March 12, 2013. |
| (6) | Vests with respect to 8,333 shares on each of November 5, 2011 and November 5, 2012. |
| (7) | Vests with respect to 8,333 shares on each of November 5, 2011 and November 5, 2012. |
| (8) | Vests with respect to 11,667 shares on each of August 12, 2011 and August 12, 2012 and 11,666 shares on August 12, 2013. |
| (9) | Vests with respect to 6,667 shares on each of August 12, 2011 and August 12, 2012 and 6,666 shares on August 12, 2013. |
| (10) | Vests with respect to 6,667 shares on each of August 12, 2011 and August 12, 2012 and 6,666 shares on August 12, 2013. |
| (11) | Granted in connection with service as non-employee director prior to commencement of employment with the Company. |
| (12) | Vests with respect to 6,666 shares on February 26, 2012. |
| (13) | Vests with respect to 6,667 shares on July 9, 2011 and 6,666 shares on July 9, 2012. |
| (14) | Market value is based on $11.49 per share, which was the closing price on June 30, 2011, the last day of our fiscal year. |
Option Exercises and Stock Vested
The following table sets forth information concerning each exercise of stock options and each vesting of stock, including performance shares, during the fiscal year ended June 30, 2011 for each named executive officer:
| Option Awards | Stock Awards | |||||||||||||||||
| Name | Number of Acquired on Exercise (#) |
Value Realized on Exercise ($) |
Number of Shares (#) |
Value Realized ($) |
||||||||||||||
| William L. Yde III |
— | $ | — | — | $ | — | ||||||||||||
| Scott E Cody |
— | $ | — | 5,000 | $ | 58,000 | ||||||||||||
| Gary L. Worobow |
— | $ | — | 13,333 | $ | 162,863 | ||||||||||||
| B. William Pezzimenti |
128,334 | $ | 786,855 | 8,334 | $ | 57,225 | ||||||||||||
Potential Payments Upon Termination or Change-in-Control
If Mr. Yde’s employment agreement is terminated voluntarily by Mr. Yde or upon his death or disability, or if we terminate the employment agreement for “cause,” Mr. Yde will only be entitled to compensation and benefits accrued through the effective date of termination. If we terminate the employment agreement without “cause” or if Mr. Yde terminates the employment agreement as a result of a material breach by us
54
Table of Contents
or his being required to report directly to anyone other than our Board (or a committee thereof), Mr. Yde will also be entitled to severance in the form of continuation of his base salary for 18 months following the effective date of termination in accordance with our normal payroll business practices but subject to compliance with the requirements of Section 409A of the Internal Revenue Code of 1986, as amended (“Section 409A”). In the event that severance payments and/or accelerated vesting of equity awards would result in Mr. Yde receiving “excess parachute payments” within the meaning of Section 280G of the Internal Revenue Code of 1986, as amended (“Section 280G”), the severance payments will be reduced to the extent that the reduction would result in Mr. Yde receiving a greater net-after-tax amount. The term “cause” under the employment agreement includes the following events: (i) Mr. Yde’s conviction of a felony; (ii) Mr. Yde’s material breach of the employment agreement; (iii) Mr. Yde’s material violation of a Company policy that has a materially adverse effect on the Company; (iv) Mr. Yde’s failure to perform his duties as our President and Chief Executive Officer as required by the employment agreement, which failure has not been cured following ten days after written notice is given; or (v) Mr. Yde’s habitual intoxication, drug use or chemical substance abuse by any intoxicating or chemical substance. If Mr. Yde’s employment had been terminated without “cause” as of June 30, 2011 (our most recent fiscal year end), we would have been required to make $892,500 of aggregate severance payments to Mr. Yde, which would have been payable in installments over 18 months in accordance with our normal payroll business practices but subject to compliance with the requirements of Section 409A.
If Mr. Cody’s employment agreement is terminated voluntarily by Mr. Cody or upon his death or disability, or if we terminate the employment agreement for “cause,” Mr. Cody will only be entitled to compensation and benefits accrued through the effective date of termination. If we terminate the employment agreement without “cause” or if Mr. Cody terminates the employment agreement as a result of a material breach by us or his being required to report directly to anyone other than our Chief Executive Officer, President or Board (or a committee thereof), Mr. Cody will also be entitled to severance in the form of continuation of his base salary for 12 months following the effective date of termination in accordance with our normal payroll business practices but subject to compliance with the requirements of Section 409A. In the event that severance payments and/or accelerated vesting of equity awards would result in Mr. Cody receiving “excess parachute payments” within the meaning of Section 280G, the severance payments will be reduced to the extent that the reduction would result in Mr. Cody receiving a greater net-after-tax amount. The term “cause” under the employment agreement includes the following events: (i) Mr. Cody’s conviction of a felony; (ii) Mr. Cody’s material breach of the employment agreement; (iii) Mr. Cody’s material violation of a Company policy that has a materially adverse effect on the Company; (iv) Mr. Cody’s failure to perform his duties as the our Chief Financial Officer and Chief Operating Officer as required by the employment agreement, which failure has not been cured following ten days after written notice is given; or (v) Mr. Cody’s habitual intoxication, drug use or chemical substance abuse by any intoxicating or chemical substance. If Mr. Cody’s employment had been terminated without “cause” as of June 30, 2011 (our most recent fiscal year end), we would have been required to make $395,000 of aggregate severance payments to Mr. Cody, which would have been payable in installments through June 30, 2012 in accordance with our normal payroll business practices but subject to compliance with the requirements of Section 409A.
If Mr. Worobow’s employment agreement is terminated voluntarily by Mr. Worobow or upon his death or disability, or if we terminate the employment agreement for “cause,” Mr. Worobow will only be entitled to compensation and benefits accrued through the effective date of termination. If we terminate the employment agreement without “cause” or if Mr. Worobow terminates the employment agreement as a result of a material breach by us or his being required to report directly to anyone other than our Chief Executive Officer, President or Board (or a committee thereof), Mr. Worobow will also be entitled to severance in the form of continuation of his base salary and payment in lieu of medical benefits for 12 months following the effective date of termination in accordance with our normal payroll business practices but subject to compliance with the requirements of Section 409A. In the event that severance payments and/or accelerated vesting of equity awards would result in Mr. Worobow receiving “excess parachute payments” within the meaning of Section 280G, the severance payments will be reduced to the extent that the reduction would result in Mr. Worobow receiving a greater net-after-tax amount. The term “cause” under the employment agreement includes the following events: (i) Mr. Worobow’s conviction of a felony; (ii) Mr. Worobow’s material breach of the employment agreement; (iii) Mr. Worobow’s material violation of a Company policy that has a materially adverse effect on the Company; (iv) Mr. Worobow’s failure to perform his duties as our Executive Vice President, Business and Legal Affairs as required by the employment agreement, which failure has not been cured following ten days after written notice is given; or (v) Mr. Worobow’s habitual intoxication, drug use or chemical substance abuse by any intoxicating or chemical substance. If Mr. Worobow’s employment had been terminated without “cause” as of June 30, 2011 (our most recent fiscal year end), we would have been required to make $302,000 of aggregate severance payments to Mr. Worobow, which would have been payable in installments through June 30, 2012 in accordance with our normal payroll business practices but subject to compliance with the requirements of Section 409A.
55
Table of Contents
Director Compensation — Fiscal 2011
| Name |
Fees Earned or Paid in Cash ($) |
Stock Awards ($)(1) |
Option Awards ($)(1) |
All Other ($) |
Total ($) | |||||||||||||||
| Gary O. Benson |
$ | 12,500 | $ | 122,200 | (2) | $ | — | $ | — | $ | 134,700 | |||||||||
| Shane E. Coppola |
$ | 12,500 | $ | 122,200 | (2) | $ | — | $ | — | $ | 134,700 | |||||||||
| William M. Mower |
$ | 12,500 | $ | 122,200 | (2) | $ | — | $ | — | $ | 134,700 | |||||||||
| Stuart R. Romenesko |
$ | 12,500 | $ | 122,200 | (2) | $ | — | $ | — | $ | 134,700 | |||||||||
| Dale C. Arfman |
$ | 12,500 | $ | 122,200 | (2) | $ | — | $ | — | $ | 134,700 | |||||||||
| (1) | Amounts shown reflect the fair value dollar amount of grants received during period as calculated in accordance with FASB ASC 718. Such amounts are recognized for financial statement reporting purposes on a pro rated basis over the vesting period. Assumptions used in calculating this amount are included in Note 9 to our audited financial statements for the fiscal year ended June 30, 2011, which are included elsewhere in this report. |
| (2) | Based on $12.22 per share, which was the closing price on March 1, 2011, the date of the grant. Vests with respect to 3,334 shares on March 1, 2012 and 3,333 shares each on March 1, 2013 and 2014. |
We currently pay semi-annual cash fees of $12,500 to non-employee directors in connection with serving on the Board and no additional fees for attendance at, or participation in, Board and/or committee meetings. In addition, we make annual grants of 10,000 shares of restricted stock to each of our non-employee directors. Such amounts are subject to revision from time to time by our compensation committee. For director terms commencing at the December 15, 2010 stockholders’ meeting, each non-employee director was granted 10,000 shares of restricted stock. The transfer and forfeiture restrictions are scheduled to lapse with respect to 3,334 shares on March 1, 2012, and with respect to 3,333 shares on each of March 1, 2013 and 2014. Director compensation will be subject to review and adjustment from time to time at the discretion of our Board.
Compensation Committee Interlocks and Insider Participation
During the fiscal year ended June 30, 2011, the compensation committee of our Board was comprised of Messrs. Coppola and Mower. There are no relationships among these individuals, the members of the Board or executive officers of ours that require disclosure under Item 407(e)(4) of Regulation S-K promulgated under the Exchange Act.
Limitation of Liability and Indemnification of Officers and Directors; Commission Position on Indemnification for Securities Act Liabilities
Under our articles of incorporation, we are required to indemnify and hold harmless, to the fullest extent permitted by law, each person (a “Covered Person”) who was or is made or is threatened to be made a party or is otherwise involved in any action, suit or proceeding, whether civil, criminal, administrative or investigative (a “Proceeding”), by reason of the fact that he or she, or a person for whom he or she is the legal representative, is or was a director or officer of ours or, while a director or officer of ours, is or was serving at our request as a director, officer, employee or agent of another corporation or of a partnership, joint venture, trust, enterprise or nonprofit entity, including service with respect to employee benefit plans, against all liability and loss suffered and expenses (including attorneys’ fees) reasonably incurred by such Covered Person. Notwithstanding the preceding sentence, except as otherwise provided in the articles of incorporation, we are required to indemnify a Covered Person in connection with a Proceeding (or part thereof) commenced by such Covered Person only if the commencement of such Proceeding (or part thereof) by the Covered Person was authorized by our Board of Directors.
In addition, Nevada law provides that, unless our articles of incorporation are amended to provide for greater individual liability, our directors and officers are not individually liable to us or our stockholders or creditors for any damages as a result of any act or failure to act in their capacity as a director of officer unless it is proven that (a) the director’s or officer’s act or failure to act constituted a breach of his or her fiduciary duties as a director or officer, and (b) the breach of those duties involved intentional misconduct, fraud or a knowing violation of law. Insofar as indemnification for liabilities arising under the Securities Act of 1933 (the “Securities Act”) may be permitted to our directors, officers and controlling persons, we have been advised that in the opinion of the SEC such indemnification is against public policy as expressed in the Securities Act and is therefore unenforceable.
Item 12. Security Ownership of Certain Beneficial Owners and Management and Related Stockholder Matters
Securities Authorized for Issuance under Equity Compensation Plans
On September 30, 2005, the Company adopted the Global Traffic Network, Inc. 2005 Stock Incentive Plan (the “2005 Plan”), which was initially approved to grant up to an aggregate of 1,200,000 shares of common stock. The purpose of the 2005 Plan, which was approved by the Company’s stockholders on September 30, 2005, is to increase stockholder value and to advance the interests of the Company by furnishing a variety of economic incentives designed to attract, retain and motivate employees (including officers), certain key consultants and directors of the Company. At its annual stockholders’ meeting held February 26, 2009, the Company’s stockholders approved the Company’s adoption of an Amended and Restated 2005 Stock Incentive Plan (the “2005 Plan”) that included, among other things, an additional 600,000 shares reserved for issuance under the 2005 Plan, increasing the total shares authorized for issuance under the 2005 Plan to 1,800,000. At its annual stockholders’ meeting held December 15, 2010, the Company’s stockholders approved the Company’s adoption of an Amended and Restated 2005 Stock Incentive Plan (the “2005 Plan”) that included, among other things, an additional 600,000 shares reserved for issuance under the 2005 Plan, increasing the total shares authorized for issuance under the 2005 Plan to 2,400,000.
56
Table of Contents
The following table sets forth certain information as of June 30, 2011 with respect to the 2005 Plan.
| Plan category |
Number of Securities to be Issued Upon Exercise of Outstanding Options |
Weighted Average Exercise Price of Outstanding Options |
Number of Securities Remaining Available for Future Issuance Under Equity Compensation Plans |
|||||||||
| Equity compensation plans approved by security holders: |
||||||||||||
| Amended and Restated 2005 Stock Incentive Plan |
1,033,664 | $ | 5.17 | 570,607 | ||||||||
|
|
|
|
|
|
|
|||||||
| Total: |
1,033,664 | $ | 5.17 | 570,607 | ||||||||
|
|
|
|
|
|
|
|||||||
| Equity compensation plans not approved by stockholders: |
||||||||||||
| None |
— | — | — | |||||||||
|
|
|
|
|
|
|
|||||||
| Total |
— | — | — | |||||||||
|
|
|
|
|
|
|
|||||||
Beneficial Ownership Table
The following table sets forth certain information, as of August 31, 2011, with respect to each of our directors, each of our named executive officers, all of our directors and executive officers as a group and all persons known by us to be the beneficial owners of more than 5% of our outstanding shares. To our knowledge, the persons named in the table below have sole voting and investment power with respect to all shares of common stock shown as beneficially owned by them, except as indicated by footnote and subject to community property laws where applicable. Percentage ownership is based on 19,060,350 shares outstanding as of August 31, 2011. Beneficial ownership is determined in accordance with the rules of the SEC. In computing the number of shares beneficially owned by a person and the percentage ownership of that person, shares of common stock subject to options held by that person that are exercisable as of August 31, 2011, or will become exercisable within 60 days thereafter, are deemed outstanding, while such shares are not deemed outstanding for purposes of computing percentage ownership of any other person. Unless otherwise indicated, the address of each of the following persons is 880 Third Avenue, 6th Floor, New York, New York 10022.
| Name and Address of Beneficial Owner |
Shares Beneficially Owned |
Percentage of Total |
||||||
| William L. Yde III |
1,301,747 | (1) | 6.83 | % | ||||
| Scott E. Cody |
387,724 | (2) | 2.00 | % | ||||
| B. William Pezzimenti |
65,221 | (3) | * | |||||
| Gary L. Worobow |
140,001 | (4) | * | |||||
| Dale C. Arfman |
1,924,009 | (5) | 10.09 | % | ||||
| Gary O. Benson |
172,000 | (6) | * | |||||
| Shane E. Coppola |
120,000 | (7) | * | |||||
| Stuart R. Romenesko |
120,000 | (7) | * | |||||
| William M. Mower |
43,333 | (8) | * | |||||
| All Directors and Named Executive Officers as a group (9 people) |
4,274,035 | (9) | 21.77 | % | ||||
| Gruber & McBaine Capital Management LLC (10) 50 Osgood Place Penthouse Suite San Francisco, CA 94133-4644 |
957,000 | 5.02 | % | |||||
| T. Rowe Price Associates, Inc. (10) (11) 100 East Pratt Street 10th Floor Baltimore, MD 21202-1009 |
1,595,420 | 8.37 | % | |||||
| Wall Street Associates LLC (10) 1200 Prospect Street Suite 100, La Jolla, CA 92037-3608 |
1,096,300 | 5.75 | % | |||||
| Harvest Capital Strategies LLC (10) 600 Montgomery Street Suite 2000, San Francisco, CA 94111-2722 |
1,575,000 | 8.26 | % | |||||
57
Table of Contents
| * | Less than 1% |
| (1) | Includes 450,000 shares that have been pledged as security for a loan. Also includes 50,000 shares that remain subject to transfer and forfeiture restrictions. |
| (2) | Includes 22,725 shares that remain subject to transfer and forfeiture restrictions and 349,999 shares issuable upon the exercise of options that are currently exercisable or will become exercisable within the next 60 days. |
| (3) | Includes 39,999 shares that remain subject to transfer and forfeiture restrictions. |
| (4) | Includes 29,999 shares that remain subject to transfer and forfeiture restrictions and 70,001 shares issuable upon the exercise of options are that are currently exercisable or will become exercisable within the next 60 days. |
| (5) | Includes 23,333 shares that remain subject to transfer and forfeiture restrictions. Also includes 15,425 shares held by spouse and 51,823 shares held in various trusts of which Mr. Arfman’s spouse is trustee. |
| (6) | Includes 29,999 shares that remain subject to transfer and forfeiture restrictions and 50,000 shares issuable upon the exercise of options that are currently exercisable or will become exercisable within the next 60 days. Also includes 52,000 shares held by DMB 2009, LLC, a limited liability company of which the sole member is a trust for the benefit of Mr. Benson’s spouse. |
| (7) | Includes 29,999 shares that remain subject to transfer and forfeiture restrictions and 50,000 shares issuable upon the exercise of options that are currently exercisable or will become exercisable within the next 60 days. |
| (8) | Includes 29,999 shares that remain subject to transfer and forfeiture restrictions. |
| (9) | Includes 286,052 shares that remain subject to transfer and forfeiture restrictions and 570,000 shares issuable upon the exercise of options are that are currently exercisable or will become exercisable within the next 60 days. |
| (10) | Based on the most recent report filed pursuant to Section 16 of the Securities Exchange Act of 1934, as amended, or the most recent Schedule 13D, 13F or 13G filed with the securities and Exchange Commission, as applicable. |
| (11) | These securities are owned by various individual and institutional investors, including T. Rowe Price New Horizons Fund, Inc., which T. Rowe Price Associates, Inc. (Price Associates) serves as investment advisor with power to direct investments and/or sole power to vote the securities. For purposes of the reporting requirements of the Securities Exchange Act of 1934, Price Associates is deemed to be a beneficial owner of such securities; however, Price Associates expressly disclaims that it is, in fact, the beneficial owner of such securities. |
Item 13. Certain Relationships and Related Transactions, and Director Independence
Certain Relationships and Related Transactions
In accordance with the written charter of our audit committee, our audit committee (with the concurrence of a majority of our independent directors) is responsible for reviewing policies and procedures with respect to related party transactions required to be disclosed pursuant to Item 404 of the Securities and Exchange Commission’s Regulation S-K (including transactions between the Company and its officers and directors, or affiliates of such officers or directors), and approving the terms and conditions of such related party transactions. In accordance with this responsibility, prior to entering into such related party transactions, the audit committee will meet separately to consider and, if deemed advisable, approve the entry into such arrangements. When appropriate based on the facts and circumstance of a particular proposed transaction, such consideration will be undertaken by an independent committee designated by the audit committee. We did not enter into any such related party transactions during fiscal 2011.
58
Table of Contents
Director Independence
The Company’s Board is currently comprised of six members, each of which is identified in this report. The following directors, which constitute a majority of the Board, are “independent directors” as such term is defined in Rule 5605(a)(2) of NASDAQ’s Marketplace Rules: Gary O. Benson, Shane E. Coppola, William M. Mower and Stuart R. Romenesko.
Item 14. Principal Accountant Fees and Services
Fees billed to the Company by Its Independent Registered Public Accounting Firm
The following table presents fees for professional audit services and audit services related to compliance with Section 404 of the Sarbanes-Oxley Act of 2002, tax services and other services rendered by BDO Audit (NSW-VIC) Pty Ltd and its member firms used in connection with its audit of the financial statements and internal control of the Company during the fiscal years ended June 30, 2011 and 2010. These fees are generally invoiced in Australian dollars (and to a lesser extent, British pounds) and have been translated into United States dollars utilizing the exchange rates in effect when the fees were incurred.
| Fiscal Year Ended June 30, 2011 |
Fiscal Year Ended June 30, 2010 |
|||||||
| Audit Fees (1) |
$ | 452,226 | $ | 433,623 | ||||
| Audit-Related Fees (2) |
4,913 | 6,846 | ||||||
| Tax Fees (3) |
— | — | ||||||
| All Other Fees (4) |
— | — | ||||||
| Total Fees |
$ | 457,139 | $ | 440,649 | ||||
| (1) | Audit Fees consist of fees for professional services rendered for the integrated audit of the Company’s consolidated annual financial statements and review of the interim consolidated financial statements included in quarterly reports and services that are normally provided in connection with statutory and regulatory filings or engagements. |
| (2) | Audit-Related Fees consist principally of assurance and related services that are reasonably related to the performance of the audit or review of the Company’s financial statements but not reported under the caption Audit Fees above. |
| (3) | Tax Fees consist of fees for tax compliance, tax advice, and tax planning. |
| (4) | All Other Fees typically consist of fees for permitted non-audit products and services provided. |
The audit committee of the Board has reviewed the services provided by BDO Audit (NSW-VIC) Pty Ltd and its member firms used in connection with its audit of the financial statements and internal control of the Company during the fiscal year ended June 30, 2011 and the fees billed for such services. After consideration, the audit committee has determined that the receipt of these fees by BDO Audit (NSW-VIC) Pty Ltd and its member firms is compatible with the provision of independent audit services. The audit committee discussed these services and fees with BDO Audit (NSW-VIC) Pty Ltd) and Company management to determine that they are permitted under the rules and regulations concerning auditor independence promulgated by the U.S. Securities and Exchange Commission to implement the Sarbanes-Oxley Act of 2002, as well as the Public Company Accounting Oversight Board.
Pre-Approval Policy
The written charter of the audit committee provides that all audit and non-audit accounting services that are permitted to be performed by the Company’s independent registered certified public accounting firm under applicable rules and regulations must be pre-approved by the audit committee or by designated members of the audit committee, other than with respect to de minimus exceptions permitted under the Sarbanes-Oxley Act of 2002. All services performed by our independent registered public account firm during the fiscal years ended June 30, 2011, 2010 and 2009 were pre-approved in accordance with the written charter.
Prior to or as soon as practicable following the beginning of each fiscal year, a description of the audit, audit-related, tax, and other services expected to be performed by the independent registered certified public accounting firm in the following fiscal year will be presented to the audit committee for approval. Following such approval, any requests for audit, audit-related, tax, and other services not presented and pre-approved must be submitted to the audit committee for specific pre-approval and cannot commence until such approval has been granted. However, the authority to grant specific pre-approval between meetings, as necessary, has been delegated to the Chairman of the audit committee. The Chairman then updates the audit committee at the next regularly scheduled meeting of any services that were granted specific pre-approval.
59
Table of Contents
Item 15. Exhibits and Financial Statement Schedules
Documents filed as part of this Form 10-K:
Reports of Independent Registered Public Accounting Firm
Consolidated Balance Sheets at June 30, 2011 and 2010
Consolidated Statements of Income for the years ended June 30, 2011, 2010 and 2009
Consolidated Statements of Shareholders’ Equity for the years ended June 30, 2011, 2010 and 2009
Consolidated Statements of Cash Flows for the years ended June 30, 2011, 2010 and 2009
Notes to Consolidated Financial Statements
Financial Statement Schedule:
Not Applicable
Exhibits:
| Exhibit |
Description | |
| 2.1 | Share Purchase Agreement dated February 1, 2009 by and among UBC Media Group plc, Global Traffic Network (UK) Limited and Global Traffic Network, Inc. (incorporated by reference to Exhibit 10.1 to Form 8-K filed February 3, 2009). | |
| 2.2 | Deed of Amendment to Share Purchase Agreement Relating to The Unique Broadcasting Company Limited dated July 23, 2009 by and among UBC Media Group plc, Global Traffic Network (UK) Limited and Global Traffic Network, Inc. (incorporated by reference to Exhibit 10.1 to the Current Report on Form 8-K filed July 28, 2009). | |
| 2.3 | Form of Agreement and Plan of Merger, dated August 2, 2011, by and among Global Traffic Network, Inc. and GTCR Gridlock Holdings (Cayman), L.P., acting by its general partner, GTCR Gridlock Partners, Ltd., GTCR Gridlock Holdings, Inc., and GTCR Gridlock Acquisition Sub, Inc. (incorporated by reference to Exhibit 2.1 to the Current Report on Form 8-K filed August 3, 2011). | |
| 2.4 | Form of Guaranty, dated as of August 2, 2011, in favor of Global Traffic Network, Inc. (incorporated by reference to Exhibit 2.2 to the Current Report on Form 8-K filed August 3, 2011). | |
| 3.1 | Articles of Incorporation of Global Traffic Network, Inc., a Nevada corporation (incorporated by reference to Exhibit 3.1 to the Current Report on Form 8-K filed February 26, 2008). | |
| 3.2 | Bylaws of Global Traffic Network, Inc., a Nevada corporation (incorporated by reference to Exhibit 3.2 to the Current Report on Form 8-K filed February 26, 2008). | |
| 4.1 | Form of Specimen Stock Certificate (incorporated by reference to Exhibit 4.1 to the Form S-l registration statement of the registrant (File No. 333-130417)). | |
| 10.1 | Information Report Supply Agreement dated June 24, 2008 by and between The Australia Traffic Network Pty Limited and Austereo Pty Limited (incorporated by reference to Exhibit to the Annual Report on Form 10-K filed September 9, 2008).† | |
| 10.2 | Amendment effective July 1, 2009 to Information Report Supply Agreement dated June 24, 2008 by and between The Australia Traffic Network Pty Limited and Austereo Pty Limited (incorporated by reference to Exhibit 13.1 to the Annual Report on Form 10-K filed September 10, 2009).† | |
| 10.3 | Employment Agreement dated February 9, 2011 by and between Global Traffic Network, Inc. and William L. Yde III (incorporated by reference to Exhibit 10.1 to the Form 10-Q dated February 10, 2011). | |
| 10.4 | Employment Agreement dated February 9, 2011 by and between Global Traffic Network, Inc. and Scott E. Cody (incorporated by reference to Exhibit 10.2 the Form 10-Q dated February 10, 2011). | |
| 10.5 | Employment Agreement dated July 1, 2011 by and between Global Traffic Network, Inc. and Gary L. Worobow (incorporated by reference to Exhibit 10.1 to the Current Report on Form 8-K filed July 7, 2011). | |
60
Table of Contents
| Exhibit |
Description | |
| 10.6 | Amended and Restated 2005 Stock Incentive Plan (incorporated by reference to Appendix A to definitive proxy statement filed with the Securities and Exchange Commission on November 17, 2010). | |
| 10.7 | Form of Global Traffic Network, Inc. Stock Option Agreement (2005 Stock Incentive Plan — Employee Non-Qualified) (incorporated by reference to Exhibit 10.14 to the Form S-l registration statement of the registrant (File No. 333-130417)). | |
| 10.8 | Form of Global Traffic Network, Inc. Stock Option Agreement (2005 Stock Incentive Plan — Director) (incorporated by reference to Exhibit 10.15 to the Form S-l registration statement of the registrant (File No. 333-130417)). | |
| 10.9 | Form of Global Traffic Network, Inc. Restricted Stock Agreement (2005 Stock Incentive Plan) (incorporated by reference to Exhibit 10.1 to the Current Report on Form 8-K filed April 11, 2008). | |
| 21.1 | Subsidiaries of Global Traffic Network, Inc. | |
| 23.1 | Consent of BDO Audit (NSW-VIC) Pty Ltd. | |
| 31.1 | Certification of Chief Executive Officer pursuant to Securities Exchange Act Rules 13a-15(e) and 15d-15(e) as adopted pursuant to Section 302 of the Sarbanes-Oxley Act of 2002. | |
| 31.2 | Certification of Chief Financial Officer pursuant to Securities Exchange Act Rules 13a-15(e) and 15d-15(e) as adopted pursuant to Section 302 of the Sarbanes-Oxley Act of 2002. | |
| 32.1 | Certification of Chief Executive Officer and Chief Financial Officer pursuant to 18 U.S.C. Section 1350, as adopted pursuant to Section 906 of the Sarbanes-Oxley Act of 2002. | |
| 99.1 | Press release dated September 13, 2011. | |
| † | Confidential treatment has been granted as to certain portions of this exhibit pursuant to Rule 406 of the Securities Act and/or Rule 24b-2 of the Exchange Act. |
61
Table of Contents
Pursuant to the requirements of Section 13 or 15(d) of the Securities Exchange Act of 1934, the registrant has duly caused this report to be signed on its behalf by the undersigned, thereunto duly authorized.
| GLOBAL TRAFFIC NETWORK, INC. | ||||||||
| Date: September 13, 2011 | By: | /s/ SCOTT E. CODY | ||||||
| Scott E. Cody | ||||||||
| Chief Financial Officer, Chief Operating Officer and Treasurer | ||||||||
Pursuant to the requirements of the Securities Exchange Act of 1934, this report has been signed below by the following persons on behalf of the registrant and in the capacities and on the dates indicated.
| Signature |
Title |
Date | ||
| /S/ WILLIAM L. YDE III William L. Yde III |
Chairman of the Board, Chief Executive Officer and President (Principal Executive Officer) and Director |
September 13, 2011 | ||
| /S/ SCOTT E. CODY Scott E. Cody |
Chief Financial Officer, Chief Operating Officer and Treasurer (Principal Financial Officer and Principal Accounting Officer) |
September 13, 2011 | ||
| /S/ DALE C. ARFMAN Dale C. Arfman |
Director | September 13, 2011 | ||
| /S/ GARY O. BENSON Gary O. Benson |
Director | September 13, 2011 | ||
| /S/ SHANE E. COPPOLA Shane E. Coppola |
Director | September 13, 2011 | ||
| /S/ WILLIAM M. MOWER William M. Mower |
Director | September 13, 2011 | ||
| /S/ STUART R. ROMENESKO Stuart R. Romenesko |
Director | September 13, 2011 | ||
62
Table of Contents
Index to Consolidated Financial Statements
And Financial Statement Schedule
1. Consolidated Financial Statements
2. Financial Statement Schedules:
All schedules have been omitted because they are not applicable, the required information is immaterial, or the required information is included in the consolidated financial statements or notes thereto.
Table of Contents
REPORT OF INDEPENDENT REGISTERED PUBLIC ACCOUNTING FIRM
The Board of Directors
Global Traffic Network, Inc.
We have audited the accompanying consolidated balance sheets of Global Traffic Network, Inc. as of June 30, 2011 and June 30, 2010 and the related consolidated statements of income, changes in shareholders’ equity, and cash flows for each of the three years in the period ended June 30, 2011. These consolidated financial statements are the responsibility of the Company’s management. Our responsibility is to express an opinion on these consolidated financial statements based on our audit.
We conducted our audits in accordance with the standards of the Public Company Accounting Oversight Board (United States). Those standards require that we plan and perform the audit to obtain reasonable assurance about whether the financial statements are free of material misstatement. An audit includes examining, on a test basis, evidence supporting the amounts and disclosures in the financial statements, assessing the accounting principles used and significant estimates made by management, as well as evaluating the overall presentation of the financial statements. We believe that our audits provide a reasonable basis for our opinion.
In our opinion, the consolidated financial statements referred to above present fairly, in all material respects, the financial position of Global Traffic Network, Inc. at June 30, 2011 and June 30, 2010 and the results of its operations and its cash flows for each of the three years in the period ended June 30, 2011, in conformity with accounting principles generally accepted in the United States of America.
We also have audited, in accordance with the standards of the Public Company Accounting Oversight Board (United States), the effectiveness of Global Traffic Network, Inc.’s internal control over financial reporting as of June 30, 2011, based on criteria established in Internal Control—Integrated Framework issued by the Committee of Sponsoring Organizations of the Treadway Commission (COSO) and our report dated September 13, 2011 expressed an unqualified opinion thereon.
BDO Audit (NSW — VIC) Pty Limited
Sydney, NSW, Australia
September 13, 2011
F-1
Table of Contents
REPORT OF INDEPENDENT REGISTERED PUBLIC ACCOUNTING FIRM
The Board of Directors
Global Traffic Network, Inc.
We have audited Global Traffic Network, Inc.’s internal control over financial reporting as of June 30, 2011, based on criteria established in Internal Control—Integrated Framework issued by the Committee of Sponsoring Organizations of the Treadway Commission (the COSO criteria). Global Traffic Network, Inc.’s management is responsible for maintaining effective internal control over financial reporting and for its assessment of the effectiveness of internal control over financial reporting, included in the accompanying Item 9A, Management’s Report on Internal Control Over Financial Reporting. Our responsibility is to express an opinion on the company’s internal control over financial reporting based on our audit.
We conducted our audit in accordance with the standards of the Public Company Accounting Oversight Board (United States). Those standards require that we plan and perform the audit to obtain reasonable assurance about whether effective internal control over financial reporting was maintained in all material respects. Our audit included obtaining an understanding of internal control over financial reporting, assessing the risk that a material weakness exists, and testing and evaluating the design and operating effectiveness of internal control based on the assessed risk. Our audit also included performing such other procedures as we considered necessary in the circumstances. We believe that our audit provides a reasonable basis for our opinion.
A company’s internal control over financial reporting is a process designed to provide reasonable assurance regarding the reliability of financial reporting and the preparation of financial statements for external purposes in accordance with generally accepted accounting principles. A company’s internal control over financial reporting includes those policies and procedures that (1) pertain to the maintenance of records that, in reasonable detail, accurately and fairly reflect the transactions and dispositions of the assets of the company; (2) provide reasonable assurance that transactions are recorded as necessary to permit preparation of financial statements in accordance with generally accepted accounting principles, and that receipts and expenditures of the company are being made only in accordance with authorizations of management and directors of the company; and (3) provide reasonable assurance regarding prevention or timely detection of unauthorized acquisition, use, or disposition of the company’s assets that could have a material effect on the financial statements.
Because of its inherent limitations, internal control over financial reporting may not prevent or detect misstatements. Also, projections of any evaluation of effectiveness to future periods are subject to the risk that controls may become inadequate because of changes in conditions, or that the degree of compliance with the policies or procedures may deteriorate.
In our opinion, Global Traffic Network, Inc. maintained, in all material respects, effective internal control over financial reporting as of June 30, 2011, based on the COSO criteria.
We have also audited, in accordance with the standards of the Public Company Accounting Oversight Board (United States), the accompanying consolidated balance sheets of Global Traffic Network, Inc. as of June 30, 2011 and June 30, 2010, and the related consolidated statements of income, changes in shareholders’ equity and cash flows for each of the three years in the period ended June 30, 2011 and our report dated September 13, 2011 expressed an unqualified opinion.
BDO Audit (NSW — VIC) Pty Limited
Sydney, NSW, Australia
September 13, 2011
F-2
Table of Contents
CONSOLIDATED BALANCE SHEETS
(In thousands except share amounts)
| June 30, 2011 |
June 30, 2010 |
|||||||
| ASSETS: | ||||||||
| Current Assets: |
||||||||
| Cash and cash equivalents |
$ | 41,655 | $ | 19,564 | ||||
| Accounts receivable net of allowance for doubtful accounts of $191 and $69 at June 30, 2011 and June 30, 2010 |
27,508 | 18,790 | ||||||
| Prepaids and other current assets |
1,658 | 1,989 | ||||||
| Deferred tax assets |
387 | 239 | ||||||
|
|
|
|
|
|||||
| Total current assets |
71,208 | 40,582 | ||||||
| Property and equipment, net |
5,841 | 6,693 | ||||||
| Intangible assets, net |
11,245 | 13,013 | ||||||
| Goodwill |
4,572 | 4,257 | ||||||
| Deferred tax assets |
196 | 129 | ||||||
| Other assets |
213 | 414 | ||||||
|
|
|
|
|
|||||
| Total assets |
$ | 93,275 | $ | 65,088 | ||||
|
|
|
|
|
|||||
| LIABILITIES AND SHAREHOLDERS’ EQUITY: | ||||||||
| Current Liabilities: |
||||||||
| Accounts payable and accrued expenses |
$ | 18,835 | $ | 11,709 | ||||
| Deferred revenue |
560 | 810 | ||||||
| Income taxes payable |
2,521 | 1,306 | ||||||
|
|
|
|
|
|||||
| Total current liabilities |
21,916 | 13,825 | ||||||
| Deferred tax liabilities |
2,938 | 2,747 | ||||||
| Other liabilities |
939 | 349 | ||||||
|
|
|
|
|
|||||
| Total liabilities |
25,793 | 16,921 | ||||||
|
|
|
|
|
|||||
| Common stock, $.001 par value; 100,000,000 shares authorized; 19,050,172 and 18,409,834 shares issued and outstanding as of June 30, 2011 and 2010 |
19 | 18 | ||||||
| Preferred stock, $.001 par value; 10,000,000 authorized; 0 issued and outstanding as of June 30, 2011 and 2010 |
— | — | ||||||
| Additional paid in capital |
54,821 | 51,391 | ||||||
| Accumulated other comprehensive income |
7,330 | 389 | ||||||
| Retained earnings (accumulated deficit) |
5,312 | (3,631 | ) | |||||
|
|
|
|
|
|||||
| Total shareholders’ equity |
67,482 | 48,167 | ||||||
|
|
|
|
|
|||||
| Total liabilities and shareholders’ equity |
$ | 93,275 | $ | 65,088 | ||||
|
|
|
|
|
|||||
See accompanying notes to the consolidated financial statements
F-3
Table of Contents
CONSOLIDATED STATEMENTS OF INCOME
(In thousands except share and per share amounts)
| Year Ended June 30, | ||||||||||||
| 2011 | 2010 | 2009 | ||||||||||
| Revenues |
$ | 117,401 | $ | 93,335 | $ | 60,337 | ||||||
| Operating expenses (exclusive of depreciation and amortization expense shown separately below) |
73,693 | 63,266 | 40,937 | |||||||||
| Selling, general and administrative expenses |
25,414 | 21,038 | 15,615 | |||||||||
| Depreciation and amortization expense |
5,975 | 5,326 | 2,547 | |||||||||
|
|
|
|
|
|
|
|||||||
| Net operating income |
12,319 | 3,705 | 1,238 | |||||||||
| Interest expense |
— | 15 | 39 | |||||||||
| Other income (including interest income of $1,318, $727 and $1,015 for the years ended June 30, 2011, 2010 and 2009) |
(1,327 | ) | (967 | ) | (1,050 | ) | ||||||
| Other expense |
138 | 32 | 77 | |||||||||
|
|
|
|
|
|
|
|||||||
| Net income before income taxes |
13,508 | 4,625 | 2,172 | |||||||||
| Income tax expense |
4,565 | 3,998 | 3,257 | |||||||||
|
|
|
|
|
|
|
|||||||
| Net income (loss) |
$ | 8,943 | $ | 627 | $ | (1,085 | ) | |||||
|
|
|
|
|
|
|
|||||||
| Income (loss) per common share: |
||||||||||||
| Basic |
$ | 0.49 | $ | 0.03 | $ | (0.06 | ) | |||||
| Diluted |
$ | 0.48 | $ | 0.03 | $ | (0.06 | ) | |||||
| Weighted average common shares outstanding: |
||||||||||||
| Basic |
18,344,388 | 18,115,530 | 18,065,671 | |||||||||
| Diluted |
18,825,649 | 18,132,721 | 18,065,671 | |||||||||
See accompanying notes to the consolidated financial statements
F-4
Table of Contents
CONSOLIDATED STATEMENTS OF SHAREHOLDERS’ EQUITY
For the years ended June 30, 2011, 2010 and 2009
(Amounts in thousands except share amounts)
| Common Stock | Additional Paid In Capital |
Retained Earnings (Accumulated Deficit) |
Accumulated Other Comprehensive Income (Loss) |
Total Comprehensive (Loss) Income |
Total | |||||||||||||||||||||||
| Shares | Amount | |||||||||||||||||||||||||||
| Balance, June 30, 2008 |
18,156,133 | $ | 18 | $ | 49,015 | $ | (3,173 | ) | $ | 2,866 | $ | 48,726 | ||||||||||||||||
|
|
|
|
|
|
|
|
|
|
|
|
|
|||||||||||||||||
| Net loss |
— | — | — | (1,085 | ) | — | (1,085 | ) | (1,085 | ) | ||||||||||||||||||
| Cashless exercise of stock options |
8,701 | — | (23 | ) | — | — | — | (23 | ) | |||||||||||||||||||
| Stock based compensation |
100,000 | — | 1,154 | — | — | — | 1,154 | |||||||||||||||||||||
| Foreign currency translation adjustment |
— | — | — | — | (1,468 | ) | (1,468 | ) | (1,468 | ) | ||||||||||||||||||
|
|
|
|||||||||||||||||||||||||||
| Comprehensive net loss |
— | — | — | — | — | (2,553 | ) | — | ||||||||||||||||||||
|
|
|
|
|
|
|
|
|
|
|
|
|
|
|
|||||||||||||||
| Balance, June 30, 2009 |
18,264,834 | 18 | 50,146 | (4,258 | ) | 1,398 | 47,304 | |||||||||||||||||||||
|
|
|
|
|
|
|
|
|
|
|
|
|
|||||||||||||||||
| Net income |
— | — | — | 627 | — | 627 | 627 | |||||||||||||||||||||
| Stock based compensation |
145,000 | — | 1,245 | — | — | — | 1,245 | |||||||||||||||||||||
| Foreign currency translation adjustment |
— | — | — | — | (1,009 | ) | (1,009 | ) | (1,009 | ) | ||||||||||||||||||
| Comprehensive net loss |
— | — | — | — | — | (382 | ) | — | ||||||||||||||||||||
|
|
|
|||||||||||||||||||||||||||
| Balance, June 30, 2010 |
18,409,834 | 18 | 51,391 | (3,631 | ) | 389 | 48,167 | |||||||||||||||||||||
|
|
|
|
|
|
|
|
|
|
|
|
|
|||||||||||||||||
| Net income |
— | — | — | 8,943 | — | 8,943 | 8,943 | |||||||||||||||||||||
| Stock based compensation |
177,725 | — | 1,675 | — | — | — | 1,675 | |||||||||||||||||||||
| Foreign currency translation adjustment |
— | — | — | — | 6,941 | 6,941 | 6,941 | |||||||||||||||||||||
| Exercise of warrants |
301,782 | 1 | 1,790 | — | — | — | 1,791 | |||||||||||||||||||||
| Cashless exercise of warrants |
34,097 | — | — | — | — | — | — | |||||||||||||||||||||
| Exercise of stock options |
8,334 | — | 31 | — | — | — | 31 | |||||||||||||||||||||
| Cashless exercise of stock options |
118,400 | — | (66 | ) | — | — | — | (66 | ) | |||||||||||||||||||
| Comprehensive net income |
— | — | — | — | — | $ | 15,884 | — | ||||||||||||||||||||
|
|
|
|||||||||||||||||||||||||||
| Balance, June 30, 2011 |
19,050,172 | $ | 19 | $ | 54,821 | $ | 5,312 | $ | 7,330 | $ | 67,482 | |||||||||||||||||
|
|
|
|
|
|
|
|
|
|
|
|
|
|||||||||||||||||
See accompanying notes to the consolidated financial statements
F-5
Table of Contents
CONSOLIDATED STATEMENTS OF CASH FLOWS
(Amounts in thousands)
| Year ended June 30, | ||||||||||||
| 2011 | 2010 | 2009 | ||||||||||
| Cash flows from operating activities: |
||||||||||||
| Net income (loss) |
$ | 8,943 | $ | 627 | $ | (1,085 | ) | |||||
| Adjustments to reconcile net income (loss) to net cash provided by operating activities: |
||||||||||||
| Depreciation and amortization |
5,975 | 5,326 | 2,547 | |||||||||
| Allowance for doubtful accounts |
122 | (81 | ) | (142 | ) | |||||||
| Non-cash compensation expense |
1,402 | 1,245 | 1,154 | |||||||||
| Change in deferred taxes |
157 | (403 | ) | (188 | ) | |||||||
| Foreign currency translation income |
— | (101 | ) | — | ||||||||
| Loss on disposal or writedown of assets |
94 | 92 | 62 | |||||||||
| Changes in assets and liabilities (net of effects from acquisition of business): |
||||||||||||
| Accounts receivable |
(4,913 | ) | (2,700 | ) | (45 | ) | ||||||
| Prepaid and other current assets and other assets |
878 | (481 | ) | (817 | ) | |||||||
| Accounts payable and accrued expenses and other liabilities |
5,176 | 680 | 292 | |||||||||
| Deferred revenue |
(405 | ) | (391 | ) | (69 | ) | ||||||
| Income taxes payable |
790 | (714 | ) | (735 | ) | |||||||
|
|
|
|
|
|
|
|||||||
| Net cash provided by operating activities |
18,219 | 3,099 | 974 | |||||||||
|
|
|
|
|
|
|
|||||||
| Cash flows from investing activities: |
||||||||||||
| Purchase of property and equipment |
(1,611 | ) | (1,244 | ) | (1,627 | ) | ||||||
| Acquisition of business |
— | (3,488 | ) | (13,133 | ) | |||||||
|
|
|
|
|
|
|
|||||||
| Net cash used in investing activities |
(1,611 | ) | (4,732 | ) | (14,760 | ) | ||||||
|
|
|
|
|
|
|
|||||||
| Cash flows from financing activities: |
||||||||||||
| Repayment of long term debt |
— | (414 | ) | (377 | ) | |||||||
| Proceeds from exercise of warrants |
1,791 | — | — | |||||||||
| Proceeds from exercise of employee stock options |
31 | — | — | |||||||||
|
|
|
|
|
|
|
|||||||
| Net cash provided by (used in) financing activities |
1,822 | (414 | ) | (377 | ) | |||||||
|
|
|
|
|
|
|
|||||||
| Effect of exchange rate changes on cash and cash equivalents |
3,661 | 192 | (1,959 | ) | ||||||||
|
|
|
|
|
|
|
|||||||
| Net increase (decrease) in cash and cash equivalents |
22,091 | (1,855 | ) | (16,122 | ) | |||||||
| Cash and cash equivalents at beginning of fiscal year |
19,564 | 21,419 | 37,541 | |||||||||
|
|
|
|
|
|
|
|||||||
| Cash and cash equivalents at end of fiscal year |
$ | 41,655 | $ | 19,564 | $ | 21,419 | ||||||
|
|
|
|
|
|
|
|||||||
| Supplemental disclosures of cash flow information: |
||||||||||||
| Cash paid during fiscal year for: |
||||||||||||
| Interest |
$ | — | $ | 15 | $ | 39 | ||||||
|
|
|
|
|
|
|
|||||||
| Income taxes |
$ | 5,141 | $ | 5,133 | $ | 3,876 | ||||||
|
|
|
|
|
|
|
|||||||
See accompanying notes to the consolidated financial statements
F-6
Table of Contents
NOTES TO CONSOLIDATED FINANCIAL STATEMENTS
(Amounts in thousands except share and per share amounts)
NOTE 1 — Description of the Company’s Business
Global Traffic Network, Inc. (“Global Delaware”) was a Delaware corporation formed on May 16, 2005 as a holding company for the purpose of becoming the ultimate parent company of Canadian Traffic Network ULC (“CTN”) and The Australia Traffic Network Pty Limited (“ATN”). At the time of Global Delaware’s formation, ATN was a separate entity controlled by the same shareholders that controlled Global Delaware. On December 13, 2005, Global Delaware entered into a Securities Exchange Agreement with ATN and the holders of all of the outstanding shares of ATN pursuant to which Global Delaware exchanged 4,000,000 shares of its common stock and issued $1,400 in promissory notes to the ATN shareholders for all of the outstanding ordinary shares of ATN. The share exchange became effective on March 23, 2006, the effective date of Global Delaware’s initial public offering (“IPO”), at which time ATN became a wholly-owned subsidiary of Global Delaware. On October 19, 2006, the Company formed a wholly-owned subsidiary, Global Traffic Network (UK) Limited (“UKTN”), to operate the Company’s business in the United Kingdom. On December 12, 2007, Global Delaware formed a wholly-owned subsidiary, Global Traffic Network, Inc., a Nevada corporation (“Global Nevada”), for the purpose of changing Global Delaware’s state of incorporation from Delaware to Nevada. On February 26, 2008, Global Delaware merged with and into Global Nevada, with Global Nevada remaining as the surviving corporation. All references to the Company pertain to Global Delaware for time periods prior to the merger and pertain to Global Nevada for time periods following the merger. On March 7, 2008, the Company formed a wholly owned subsidiary, Mobile Traffic Network, Inc. (“MTN”), to conduct non-broadcast operations of the Company related to its mobile telephone technology. Effective October 12, 2010, MTN changed its name to Global Alert Network, Inc. (“GAN”). On March 1, 2009, UKTN acquired all the share capital of The Unique Broadcasting Company Limited (“Unique”) which was subsequently renamed Global Traffic Network (UK) Commercial Limited (“UK-Commercial”). The primary business of UK-Commercial is providing traffic and entertainment news reports to radio stations in the United Kingdom in exchange for commercial airtime inventory which it then sells to advertisers.
The Company provides traffic and news information reports to radio and television stations in international markets. The Company provides traffic information reports to radio and television stations in Australia and Canada and traffic information reports to radio stations in the United Kingdom, entertainment news reports to radio stations in the United Kingdom and maintains an inventory of commercial advertising embedded in radio news reports in Australia. The Company derives a substantial majority of its revenues from the sale of commercial advertising embedded within these information reports and substantially all the Company’s revenue is generated outside of the United States. The Company obtains this advertising inventory from radio and television stations in exchange for information reports and/or cash compensation.
NOTE 2 — Basis of Presentation
The consolidated financial statements consist of the Company and its four wholly-owned subsidiaries, ATN, Global Traffic Canada, Inc. (“GTC”) including its wholly-owned subsidiary, CTN, UKTN including its wholly owned subsidiary UK-Commercial, and GAN. All material intercompany revenues, expenses, assets and liabilities have been eliminated in consolidation of the financial statements.
ATN’s functional currency is Australian dollars, CTN’s functional currency is Canadian dollars and UKTN and UK-Commercial’s functional currency is British pounds, while for reporting purposes the Company’s financial statements are presented in United States dollars. The financial statements have been translated into United States dollars in accordance with FASB Statement No. 52, “Foreign Currency Translation” (“SFAS 52”). Effective July 1, 2009, SFAS 52 was incorporated in the Codification under FASB ASC 830. Income statement amounts are translated from Australian dollars, Canadian dollars, or British pounds to United States dollars based on the average exchange rate for each quarterly period. Assets and liabilities are translated based on the exchange rate as of the applicable balance sheet date. Equity contributions are translated based on the exchange rate at the time of the applicable investment. Foreign currency translation adjustments upon translation of the Company’s financial statements to United States dollars are recognized as other comprehensive income (loss). Realized gains and losses resulting from currency translation adjustments are recognized in the accompanying statements of income as other expense (income).
Subsequent events have been evaluated up to the date on which these financial statements were filed.
Certain amounts reported in prior years have been reclassified to conform to the current year presentation.
NOTE 3 — Summary of Significant Accounting Policies
a) Use of Estimates
The preparation of financial statements in conformity with generally accepted accounting principles requires management to make estimates and assumptions that affect the reported amounts of assets, liabilities, revenue and expenses as well as the disclosure of contingent assets and liabilities. Management continually evaluates its estimates and judgments including those related to allowances for doubtful accounts, useful lives of property, plant and equipment and intangible assets, income taxes and other contingencies. Management bases its estimates and judgments on historical experience and other factors that are believed to be reasonable under the circumstances. Actual results may differ from those estimates under different assumptions or conditions.
F-7
Table of Contents
b) Revenue recognition
Advertising revenue is earned and recognized at the time commercial advertisements are broadcast. Advertising revenues are reported net of commissions provided to third party advertising agencies that represent a majority of the advertisers. Revenue related to the provision of traffic information services to government entities is recognized when the services are performed. All revenue pertains to cash sales and the company recognized no revenue related to the bartering of goods and services. Payments received or amounts invoiced in advance are deferred until earned and such amounts are included as a component of deferred revenue in the accompanying balance sheets. Revenue is reported in the segment country in which the advertisements are broadcast or services provided. Sales taxes, goods and service taxes, value added taxes and similar charges collected by the Company on behalf of government authorities are not included as a component of revenue.
c) Operating expenses
The cost of producing and distributing the radio and television traffic and news reports and services and the obtaining of advertising inventory are considered operating expenses. These consist mainly of personnel, aviation costs, facility costs, third party content providers and station compensation. Operating expenses are recognized when incurred.
d) Station compensation and reimbursement
The Company generally enters into multiyear contracts with radio and television stations. These contracts call for the provision of various levels of service (including, but not limited to providing professional broadcasters, gathering of information, communications costs and aviation services) and, in some cases, cash compensation or reimbursement of expenses. Station compensation and reimbursement is a component of network operations expense and is recognized over the terms of the contracts, which is not materially different than when the services are performed.
Contractual station commitments are as follows:
| June 30, 2011 |
||||
| Year 1 |
$ | 44,282 | ||
| Year 2 |
18,147 | |||
| Year 3 |
6,132 | |||
| Year 4 |
339 | |||
| Year 5 |
— | |||
| Thereafter |
— | |||
e) Cash and cash equivalents
The Company considers all highly liquid instruments purchased with a maturity of less than three months to be cash equivalents. The carrying amount of cash equivalents approximates fair value because of the short maturity of these instruments.
| Year ended June 30, 2011 |
Year ended June 30, 2010 |
|||||||
| Cash and cash equivalents consist of the following: |
||||||||
| Domestic |
$ | 1,416 | $ | 234 | ||||
| Foreign |
40,239 | 19,330 | ||||||
|
|
|
|
|
|||||
| Total cash and cash equivalents |
$ | 41,655 | $ | 19,564 | ||||
Money market instruments with a fair value of $1,026 are included in cash and cash equivalents as of June 30, 2011. Fair value has been determined based on the fair value of identical instruments in active markets. All cash and cash equivalents are classified as level 1 as defined in FASB ASC 820.
F-8
Table of Contents
f) Accounts Receivable
Accounts receivable are recorded at the invoice amount and are not interest bearing. The Company performs credit evaluations of its new customers and generally requires no collateral. The Company determines whether an accounts receivable is past due in a subjective manner based primarily on how long it has been outstanding, but taking into consideration factors such as client size, payment history and country to which the receivable relates. Goods and services, sales and value added taxes, which are invoiced and collected by operating subsidiaries in Australia, Canada and the United Kingdom, are included in accounts receivable. Fees related to credit card payments are expensed when payment for the receivable is received and have historically not been material. The Company provides for losses from uncollectible accounts based on analyzing historical data and current trends and such losses have historically been insignificant in relation to revenue. Past due amounts are written off against the allowance for doubtful accounts when collection is deemed unlikely and all collection efforts have ceased. An allowance for doubtful accounts of $191 and $69 has been established for the years ended June 30, 2011 and 2010.
One group of advertising agencies that represents a number of the Company’s clients in Australia, United Kingdom and Canada constituted approximately 28% of the Company’s revenues for the year ended June 30, 2011 and approximately 23% of the Company’s net accounts receivable as of June 30, 2011. Another group of advertising agencies that represents a number of the Company’s clients in Australia, United Kingdom and Canada constituted approximately 15% of the Company’s revenues for the year ended June 30, 2011 and approximately 16% of the Company’s net accounts receivable as of June 30, 2011. An advertising agency that represents a number of the Company’s clients in Australia constituted approximately 11% of the Company’s revenues for the year ended June 30, 2011 and approximately 11% of the Company’s net accounts receivable as of June 30, 2011. Another group of advertising agencies that represents a number of the Company’s clients in Australia, United Kingdom and Canada constituted approximately 9% of the Company’s revenues for the year ended June 30, 2011 and approximately 11% of the Company’s net accounts receivable as of June 30, 2011.
The Company’s largest advertising client constituted approximately 4% of the Company’s revenues for the year ended June 30, 2011 and the Company’s top ten advertisers constituted approximately 17% of the Company’s revenues for the year ended June 30, 2011.
Allowance for Doubtful Accounts
| Balance at beginning of |
(Reductions)/ Additions |
Deductions | Balance at end of |
|||||||||||||
| year | Expense/(credit) | Write-offs | Year | |||||||||||||
| Year ended June 30, 2011 |
$ | 69 | $ | 128 | $ | (6 | ) | $ | 191 | |||||||
| Year ended June 30, 2010 |
$ | 150 | $ | (21 | ) | $ | (60 | ) | $ | 69 | ||||||
| Year ended June 30, 2009 |
$ | 292 | $ | 159 | $ | (301 | ) | $ | 150 | |||||||
g) Property and Equipment
Property and equipment are stated at cost. Depreciation expense is computed using the straight-line method over the estimated useful lives of the assets, as follows:
| Recording, broadcasting and studio equipment |
5 years | |
| Furniture, and equipment and other |
5 years | |
| Motor vehicles |
7 years | |
| Helicopters and fixed wing aircraft |
6-8 years | |
| Helicopter engine rebuilds |
2-3 years | |
| Computer equipment and software |
3-5 years |
Leasehold improvements and leased assets are amortized over the shorter of the lease term or the asset’s useful life. Depreciation expense was $3,258, $2,528, and $1,622 for the years ended June 30, 2011, 2010 and 2009. Maintenance, repairs and minor replacements are charged to operating expense as incurred. Major replacements and betterments are capitalized and amortized over their useful lives.
h) Intangible assets
Intangible assets reflected on the balance sheet primarily consist of the following:
| Weighted Average Amortization Period (Years) |
June 30, 2011 |
June 30, 2010 |
||||||||||
| Station contracts |
10 years | $ | 9,643 | $ | 10,209 | |||||||
| Radio advertising contracts |
4 years | 1,025 | 1,526 | |||||||||
| Non-competition agreement |
3 years | 535 | 1,245 | |||||||||
| Aircraft license acquisition costs |
N/A | 42 | 33 | |||||||||
|
|
|
|
|
|
|
|||||||
| Total intangible assets |
N/A | $ | 11,245 | $ | 13,013 | |||||||
F-9
Table of Contents
Station contracts consist of the fair value of station affiliate contracts acquired from Wise Broadcasting Network, Inc. (“Wise”) by CTN (the purchase of which was consummated April 2, 2007) and from the acquisition of Unique on March 1, 2009 (see Note 13). The Wise station contracts and Unique station contracts are amortized on a straight line basis over estimated useful lives of five years and ten years, respectively. Radio advertising contracts and non-competition agreement also relate to the acquisition of Unique. Radio advertising contracts are amortized on a straight line basis over the estimated useful life of four years and the non-competition agreement is amortized on a straight line basis over three years which is the contractual term of the non-competition agreement. Aircraft license acquisition costs consist of costs relating to obtaining aircraft operating certificates and licenses in Australia. Due to the long term and indefinite nature of aircraft license acquisition costs, amortization expense is not reflected and the Company regularly reviews the assets for impairment. As of June 30, 2011 and June 30, 2010, there was no impairment of this asset. Amortization expense with respect to intangible assets was $2,717, $2,798 and $925 for the years ended June 30, 2011, 2010 and 2009, respectively. Costs incurred to renew or extend the term of an intangible asset are expensed when incurred. There is no residual value recognized with regard to intangible assets subject to amortization.
Acquired intangible assets
| As of June 30, 2011 | As of June 30, 2010 | |||||||||||||||
| Gross Carrying Amount |
Accumulated Amortization |
Gross Carrying Amount |
Accumulated Amortization |
|||||||||||||
| Amortized intangible assets |
||||||||||||||||
| Station contracts |
$ | 12,881 | $ | 3,238 | $ | 11,986 | $ | 1,777 | ||||||||
| Radio advertising contracts |
2,459 | 1,434 | 2,290 | 763 | ||||||||||||
| Non-competition agreement |
2,406 | 1,871 | 2,240 | 996 | ||||||||||||
| Total |
$ | 17,746 | $ | 6,543 | $ | 16,516 | $ | 3,536 | ||||||||
| Total | ||||
| Estimated future amortization expense relating to acquired intangible assets: |
||||
| For the year ended June 30, 2012 |
$ | 2,453 | ||
| For the year ended June 30, 2013 |
1,661 | |||
| For the year ended June 30, 2014 |
1,251 | |||
| For the year ended June 30, 2015 |
1,251 | |||
| For the year ended June 30, 2016 |
1,251 | |||
| Thereafter |
3,336 | |||
The substantial majority of the Company’s intangible assets pertain to the UK-Commercial operations. The Company does not anticipate that the expiration of the non-competition agreement will have a significant impact on its future cash flows. The Company expects to either renew or replace its advertiser contracts and renew its station contracts beyond their expected life. These intangible represent a substantial majority of the assets of the Company’s United Kingdom segment. Should the Company be unable to renew these agreements, substantially all the current cash flows as reflected in Note 11 for the United Kingdom segment would likely be lost.
i) Goodwill
Goodwill represents the excess of the purchase price of Unique by UKTN over the fair value of the net assets acquired, including the identified definite lived intangible assets. Due to the long term and indefinite nature of goodwill, amortization expense is not reflected and the Company regularly reviews the asset for impairment. As of June 30, 2011 and 2010 there was no impairment of goodwill.
| Balance, June 30, 2009 |
$ | 4,688 | ||
| Acquisitions |
— | |||
| Translation adjustments |
(431 | ) | ||
|
|
|
|||
| Balance, June 30, 2010 |
4,257 | |||
| Acquisitions |
— | |||
| Translation adjustments |
315 | |||
|
|
|
|||
| Balance, June 30, 2011 |
$ | 4,572 |
F-10
Table of Contents
j) Income taxes
The Company has adopted Statement of Financial Accounting Standards No. 109 (“SFAS 109”), “Accounting for Income Taxes.” Effective July 1, 2009, SFAS 109 was incorporated in the Codification under FASB ASC 740. Under the asset and liability method of FASB ASC 740, deferred tax assets and liabilities are recognized for the future tax consequences attributable to net operating loss carry-forwards and to differences between the financial statement carrying amounts of existing assets and liabilities and their respective tax bases. Deferred tax assets and liabilities are measured using enacted tax rates expected to apply to taxable income in the years in which those temporary differences are expected to be recovered or settled. Under FASB ASC 740, the effect of a change in tax rates on deferred tax assets or liabilities is recognized in the statement of income in the period that included the enactment. A valuation allowance is established for deferred tax assets unless their realization is considered more likely than not.
In June 2006, FASB issued FASB Interpretation No. 48 (“FIN 48”), “Accounting for Uncertainty in Income Taxes”, which is an interpretation of SFAS 109. Effective July 1, 2009, FIN 48 was incorporated in the Codification under FASB ASC 740. FASB ASC 740 clarifies the accounting for uncertainty in income taxes recognized in a company’s financial statements and prescribes a recognition threshold and measurement attribute for the financial statement recognition and measurement of a tax position taken or expected to be taken in a tax return. The evaluation of a tax position is a two step process. First step is recognition, in which the company determines whether it is more likely than not that a tax position will be sustained upon examination based on the merits of the position. The second step is measurement in which a tax position which meets the more likely than not threshold of the first step is measured to determine the amount of benefit to recognize in its financial statements.
k) Per share data
Basic and diluted earnings per share are calculated in accordance with FASB Statement No. 128, “Earnings per Share” (“SFAS 128”). Effective July 1, 2009, SFAS 128 was incorporated in the Codification under FASB ASC 260. In calculating basic earnings per share, net income is divided by the weighted average number of common shares outstanding for the period. Diluted earnings per share is calculated based upon the weighted average number of common and common equivalent shares outstanding during the fiscal year. For the fiscal years ended June 30, 2011, 2010 and 2009, there were common equivalent shares outstanding due to outstanding stock options of 1,033,664, 1,148,401 and 890,067, respectively, 307,719, 248,329 and 173,332 shares of restricted stock and a warrant issued to the underwriter of the Company’s IPO to purchase 0, 380,000 and 380,000 common shares, respectively. For the year ended June 30, 2010, 686,667 stock options with exercise prices between $4.95 and $8.70 were excluded from the calculation of diluted shares outstanding because they were anti-dilutive. As a result of the Company’s negative net income for the year ended June 30, 2009, all common stock equivalents for this year were anti-dilutive and, therefore, were not considered in the calculation of diluted earnings per share.
| Year ended June 30, 2011 |
Year ended June 30, 2010 |
Year ended June 30, 2009 |
||||||||||
| Basic Shares Outstanding |
18,344,388 | 18,115,530 | 18,065,671 | |||||||||
| Stock Options, Restricted Stock & Warrants |
481,261 | 17,191 | — | |||||||||
|
|
|
|
|
|
|
|||||||
| Diluted Shares Outstanding |
18,825,649 | 18,132,721 | 18,065,671 | |||||||||
Common Stock Equivalents
| Year ended June 30, 2011 |
Year ended June 30, 2010 |
Year ended June 30, 2009 |
||||||||||
| Stock options |
315,791 | 17,191 | — | |||||||||
| Restricted stock |
87,400 | — | — | |||||||||
| Warrants |
78,070 | — | — | |||||||||
|
|
|
|
|
|
|
|||||||
| Total common stock equivalents |
481,261 | 17,191 | — | |||||||||
l) Fair value of financial instruments
FASB Statement No. 107, “Disclosures about Fair Value of Financial Instruments” (“SFAS 107”) requires disclosure of fair value information about financial instruments for which it is practical to estimate that value. Effective July 1, 2009, SFAS 107 was incorporated in the Codification under FASB ASC 825. The carrying amounts of the Company’s financial instruments, including cash and cash equivalents, accounts receivable, accounts payable and accrued liabilities, approximate fair value because of their short-term maturities. The Company had no long term debt outstanding at June 30, 2011 and 2010.
F-11
Table of Contents
m) Fair Value Measurements
FASB Statement No. 157, “Fair Value Measurements” (“SFAS 157”) defines fair value, establishes a framework for measuring fair value in accordance with generally accepted accounting principles and expands disclosures about fair value measurements. Effective July 1, 2009, SFAS 157 has been incorporated in Codification as FASB ASC 820. FASB ASC 820 establishes a three tier fair value hierarchy which prioritizes the inputs in measuring fair value as follows:
| • | Level 1 — Observable inputs such as quoted prices in active markets; |
| • | Level 2 — Inputs, other than quoted prices in active markets, that are observable either directly or indirectly; and |
| • | Level 3 — Unobservable inputs in which there is little or no market data, which requires the reporting entity to develop its own assumptions. |
The Company does not have any assets or liabilities measured at fair value on a recurring basis at June 30, 2011. The Company had a $66 fair value adjustment to property and equipment (See Note 4) for assets or liabilities measured at fair value on a nonrecurring basis during the year ended June 30, 2010 and no fair value adjustments for the year ended June 30, 2011.
The carrying amounts of cash and cash equivalents, accounts receivable, other current assets, accounts payable and accrued expenses approximate fair value based on their short-term nature.
n) Other Comprehensive Income (Loss)
Comprehensive income (loss) is comprised of net income and all changes to shareholders’ equity except those due to investment by, distributions to and repurchases from shareholders. The balance reflected on the Consolidated Statement of Equity for Accumulated Other Comprehensive Income (Loss) as of June 30, 2008, 2009, 2010 and 2011 consists of foreign exchange translation adjustments.
| Year ended June 30, 2011 |
Year ended June 30, 2010 |
Year ended June 30, 2009 |
||||||||||
| Net income (loss) |
$ | 8,943 | $ | 627 | $ | (1,085 | ) | |||||
| Foreign currency translation adjustment |
6,941 | (1,009 | ) | (1,468 | ) | |||||||
|
|
|
|
|
|
|
|||||||
| Comprehensive income (loss) |
$ | 15,884 | $ | (382 | ) | $ | (2,553 | ) | ||||
o) Recent Accounting Pronouncements
In December 2010, the Financial Accounting Standards Board (“FASB”) issued Accounting Standards Update No. 2010-28, “When to Perform Step 2 of the Goodwill Impairment Test for Reporting Units with Zero or Negative Carrying Amounts” (“ASU 2010-28”) which amends FASB ASC Topic 350 (Intangibles — Goodwill and Other) to modify Step 1 of the goodwill impairment test for reporting units with zero or negative carrying amounts to require performing Step 2 of the goodwill impairment test if it is more likely than not that a goodwill impairment exists. ASU 2010-28 is effective for fiscal years and the interim periods within those years beginning after December 15, 2010. Early adoption is not permitted. The Company intends to adopt the provisions of ASU 2010-28 effective July 1, 2011 and does not expect the adoption to have a material impact on its consolidated financial position or results of operations.
In June 2011, FASB issued Accounting Standards Update No. 2011-05, “Presentation of Comprehensive Income” (“ASU 2011-05”) which amends FASB ASC Topic 220 (Comprehensive Income) to eliminate the option to present the components of comprehensive income as part of the statement of changes in stockholders’ equity. The Company currently presents the components of comprehensive income as part of the statement of changes in stockholders’ equity. The amendment requires all non-owner changes in stockholders equity be presented either a single continuous statement of comprehensive income or in two separate but consecutive statements. In the two statement approach, the first statement presents total net income and its components followed consecutively by a second statement that presents the total other comprehensive income, the components of other comprehensive income and the total of comprehensive income. ASU 2011-05 does not change the items that must be reported in other comprehensive income or when an item of other comprehensive income must be reclassified to net income. ASU 2011-05 is effective for fiscal years and the interim periods within those years beginning after December 15, 2011. Early adoption is permitted as the provisions of ASU 2011-05 are already permitted. The Company intends to adopt the provisions of ASU 2011-05 effective July 1, 2012 and does not expect the adoption to have a material impact on its consolidated financial position or results of operations.
p) Concentration of Credit Risk
The Company maintains cash balances with what management believes to be high credit quality financial institutions. Balances have and continue to exceed those amounts insured, and the majority of the Company’s cash is maintained in instruments not subject to FDIC or other insurance. In addition, a substantial majority of the Company’s cash is maintained in foreign countries, including two financial institutions in Australia, which additionally is subject to currency fluctuation risk.
F-12
Table of Contents
q) Major Suppliers
Approximately 18% of the Company’s radio commercial airtime inventory in Australia (which, when sold to advertisers, generates a material amount of the Company’s Australian revenues) comes from a large broadcaster in Australia, which includes inventory received from this broadcaster under a four year agreement effective July 1, 2008 to provide radio traffic reporting services and receive radio traffic and news commercial airtime inventory. At June 30, 2011, trade payables to this supplier comprised approximately 24% of the Company’s trade payables balance. In addition, the parent company of this broadcaster owns radio stations that comprise approximately 6% of our Australian radio commercial inventory as of June 30, 2011.
Approximately 16% of the Company’s radio commercial airtime inventory in Australia (which, when sold to advertisers, generates a material amount of the Company’s Australian revenues) comes from a different large broadcaster in Australia. Radio commercial advertising inventory is received from this broadcaster under a four year agreement effective July 1, 2008 to provide radio traffic reporting services and receive radio traffic commercial airtime inventory and an agreement through May 31, 2012 with this broadcaster to receive radio news commercial airtime inventory. At June 30, 2011, trade payables to this supplier comprised approximately 8% of the Company’s trade payables balance.
Nineteen of the Company’s Canadian radio station affiliates, which represent approximately 26% of the Canadian radio stations (excluding regional suburban stations) with which the Company has contracted to provide radio traffic reports, are owned by one company. These stations account for approximately 39% of the Company’s radio commercial airtime inventory (excluding regional suburban stations) in Canada. The sale of such inventory constitutes a substantial portion of the Company’s Canadian revenues. The Company’s provision of traffic reports to 18 of these radio stations is governed by a four year agreement effective January 1, 2009. At June 30, 2011, trade payables to this supplier comprised approximately 9% of the Company’s trade payables balance.
Approximately 13% of the Company’s radio traffic commercial airtime inventory in the United Kingdom (which, when sold to advertisers, generates a material amount of the Company’s United Kingdom revenues) comes from a large broadcaster in the United Kingdom. In addition, this commercial airtime inventory comprises approximately 28% of the audience delivery (“impacts”) of the Company’s United Kingdom radio traffic network. The Company provides radio traffic reports and receives radio traffic commercial inventory under a three year agreement effective November 1, 2010. The agreement may be cancelled prior to the end date by either party upon 90 days prior notice during the period commencing August 31, 2012 and ending October 1, 2012. At June 30, 2011, trade payables to this supplier comprised approximately 5% of the Company’s trade payables balance.
Approximately 19% of the Company’s radio traffic commercial airtime inventory in the United Kingdom (which, when sold to advertisers, generates a material amount of the Company’s United Kingdom revenues) comes from another large broadcaster in the United Kingdom. This commercial airtime inventory comprises approximately 24% of the impacts of the Company’s United Kingdom radio traffic network. The Company provides radio traffic reports and receives radio traffic commercial inventory to sell (on a variable cost basis) under the terms of a 26 month agreement effective September 1, 2010. This broadcaster also provides a material portion of the Company’s radio entertainment news commercial airtime inventory (also on a variable cost basis) under the terms of a separate 26 month agreement effective September 1, 2010. At June 30, 2011, trade payables to this supplier comprised approximately 8% of the Company’s trade payables balance.
NOTE 4 — Property and Equipment, Net
Property and equipment, net is as follows as of June 30, 2011 and 2010:
| Year Ended June 30, 2011 |
Year Ended June 30, 2010 |
|||||||
| Helicopters and fixed wing aircraft |
$ | 12,919 | $ | 10,290 | ||||
| Recording, broadcasting and studio equipment |
2,724 | 2,146 | ||||||
| Furniture and equipment and other |
3,054 | 2,186 | ||||||
|
|
|
|
|
|||||
| Less: Accumulated depreciation and amortization |
12,771 | 7,929 | ||||||
|
|
|
|
|
|||||
| Less: Helicopters and fixed wing aircraft held for sale |
85 | — | ||||||
| Property and equipment, net |
$ | 5,841 | $ | 6,693 | ||||
|
|
|
|
|
|||||
| Year Ended June 30, 2011 |
Year ended June 30, 2010 |
|||||||
| Net property and equipment consists of the following: |
||||||||
| Domestic |
$ | — | $ | 1 | ||||
| Foreign |
5,841 | 6,692 | ||||||
|
|
|
|
|
|||||
| Property and equipment, net |
$ | 5,841 | $ | 6,693 | ||||
F-13
Table of Contents
Effective March 1, 2010, the Company changed its estimate of the useful lives of helicopters owned by CTN from eight years to six years and the lives of CTN helicopter engine rebuilds from three years to two years. This change was implemented because the Company determined that the annual flight hours are more than originally anticipated. The life of a helicopter is based upon a blend of the life of the engine, which is approximately 2,200 flight hours, and the life of the airframe. The Company does not anticipate getting less use from the helicopters due to this change in useful life. Also, ATN helicopters were unaffected by this change in useful life as their annual flight hours have been in line with expectations. This change had the effect of increasing depreciation expense $599 and $193, reducing net operating income and net income $599 and $193, and reduced basic and diluted earnings per share $0.03 and $0.01 for the years ended June 30, 2011 and 2010, respectively.
Effective October 1, 2010, the Company shortened its estimate of useful lives of its property plant and equipment associated with the Highways Agency operation to correspond with the expected termination of the contract on August 31, 2011. This resulted in an additional $30 of depreciation expense for the year ended June 30, 2011. In addition, effective June 1, 2011 the Company shortened the lives its non-aviation property plant and equipment associated with its Oxford, UK operations office to correspond with the anticipated abandonment of this location effective August 31, 2011. This resulted in an additional $21 of depreciation expense for the year ended June 30, 2011. These changes had the effect of reducing net operating income and net income $51, and had no impact on basic and diluted earnings per share for the year ended June 30, 2011.
Long lived assets such as property and equipment are reviewed for impairment whenever changes in events or changes in circumstances indicate that the carrying amount of an asset may not be recoverable. During the year ended June 30, 2010, the Company determined that the fair value of one of CTN’s back-up helicopters was less than its net book value at that date. The Company recognized a $66 impairment charge to adjust the net book value of the helicopter to its fair value. The $66 impairment charge is included as a component of operating expenses in the accompanying statement of income for the year ended June 30, 2010. There was no impairment charges related to fixed assets for the years ended June 30, 2011 or 2009. The fair value of the helicopter was determined via discussions with a reseller of used aircraft that is familiar with CTN’s fleet of aircraft. The fair value determination falls within level 2 in the hierarchy of fair value measurements.
The helicopter held for sale at June 30, 2011 was sold in July 2011 for net proceeds of approximately $110. The helicopter is included in the Canada segment. This helicopter was unable to be used for television reporting. Currently, CTN only flies a helicopter in one market without a television contract, so this helicopter was limited to being able to back-up one market, which was determined to be an inefficient allocation of resources. CTN’s existing backup television helicopter is able to also back-up the market without a television contract.
Effective August 31, 2011 UKTN ceased airborne reports in the United Kingdom at which point the aircraft became considered held for sale. The net book value of the aircraft at June 30, 2011 was $142, which, based on the price the assets are listed for sale at and the broker’s input, was the lower than the fair value of the aircraft less costs to sell. The first of these fixed wings were sold in August 2011 for net proceeds of approximately $107, which was in excess of the net book value on June 30, 2011. The Company determined that only one of the fixed wing aircraft was required to meet its obligations through August 31, 2011.
ATN has an obligation to restore certain of its leased premises back to their original condition at the end of their respective leases. As of June 30, 2011, the Company had a liability of $102 accrued, which it anticipates to be the amount required to restore the premises at the end of the leases. This liability is a component of Other Liabilities on the accompanying balance sheet since the leases in question have more than a year to run,
NOTE 5 — Accounts Payable and Accrued Expenses
Accounts payable and accrued expenses consist of the following as of June 30, 2011 and 2010:
| June 30, 2011 |
June 30, 2010 |
|||||||
| Trade payables |
$ | 12,670 | $ | 8,334 | ||||
| Accrued payroll expenses |
3,654 | 2,005 | ||||||
| Accrued expenses and other liabilities |
2,511 | 1,370 | ||||||
|
|
|
|
|
|||||
| Total |
$ | 18,835 | $ | 11,709 | ||||
|
|
|
|
|
|||||
Goods and services, sales and value added taxes, which are charged by vendors to operating subsidiaries in Australia, Canada and United Kingdom is included in trade payables until paid. The net amount of goods and services, sales and valued added tax payable (after deduction of amounts invoiced to clients related to the Company’s billing) is included as a component of accrued expenses and other liabilities.
F-14
Table of Contents
NOTE 6 — Income Taxes
Income tax expense consists of the following:
| Year ended June 30, 2011 |
Year ended June 30, 2010 |
|||||||||||||||||||||||
| Domestic | Foreign | Total | Domestic | Foreign | Total | |||||||||||||||||||
| Net (loss) income before taxes |
$ | (4,298 | ) | $ | 17,806 | $ | 13,508 | $ | (3,775 | ) | $ | 8,400 | $ | 4,625 | ||||||||||
| Income tax provision |
$ | 31 | $ | 6,617 | $ | 6,648 | $ | 1,513 | $ | 4,977 | $ | 6,490 | ||||||||||||
| Current deferred tax asset (liability), net |
1,351 | (148 | ) | 1,203 | (301 | ) | (21 | ) | (322 | ) | ||||||||||||||
| Non-current deferred tax asset (liability), net |
681 | (1,577 | ) | (896 | ) | (478 | ) | (1,590 | ) | (2,068 | ) | |||||||||||||
| Tax carried forward losses |
— | (575 | ) | (575 | ) | — | (283 | ) | (283 | ) | ||||||||||||||
| Movement in deferred tax liability recognized directly in other comprehensive income |
(1,988 | ) | — | (1,988 | ) | — | — | — | ||||||||||||||||
| Provision for uncertain tax positions |
457 | — | 457 | |||||||||||||||||||||
| Less: Valuation allowance |
(1,660 | ) | 1,376 | (284 | ) | (708 | ) | 889 | 181 | |||||||||||||||
| Income tax expense |
$ | (1,128 | ) | $ | 5,693 | $ | 4,565 | $ | 26 | $ | 3,972 | $ | 3,998 | |||||||||||
Deferred income taxes reflect the net tax effects of temporary differences between the carrying amounts of assets and liabilities on the Company’s balance sheets and the amounts used for income tax purposes. Significant components of the Company’s deferred tax assets and liabilities are as follows:
| Year ended June 30, 2011 |
Year ended June 30, 2010 |
|||||||
| Deferred tax assets: |
||||||||
| Depreciation |
$ | 1,620 | $ | 799 | ||||
| Deferred rent |
44 | 33 | ||||||
| Capital losses |
6 | 5 | ||||||
| Foreign tax credit |
3,321 | 1,867 | ||||||
| Stock option expense |
789 | 1,247 | ||||||
| Accrued expenses and other |
512 | 321 | ||||||
| Tax carried forward losses |
5,073 | 5,292 | ||||||
|
|
|
|
|
|||||
| Total deferred tax assets |
11,365 | 9,564 | ||||||
| Deferred tax liabilities |
||||||||
| Intangible assets |
2,906 | 3,602 | ||||||
| Undistributed foreign profits |
4,190 | 1,435 | ||||||
| Prepaid expenses |
39 | 37 | ||||||
|
|
|
|
|
|||||
| Total deferred tax liabilities |
7,135 | 5,074 | ||||||
|
|
|
|
|
|||||
| Net deferred tax assets before valuation allowance |
4,230 | 4,490 | ||||||
| Valuation allowance |
(6,585 | ) | (6,869 | ) | ||||
|
|
|
|
|
|||||
| Net deferred tax (liabilities) assets |
(2,355 | ) | (2,379 | ) | ||||
|
|
|
|
|
|||||
| Year ended June 30, 2011 |
Year ended June 30, 2010 |
Year ended June 30, 2009 |
||||||||||
| Income tax expense (benefit) consists of the following: |
||||||||||||
| Domestic |
$ | (1,128 | ) | $ | 26 | $ | 1 | |||||
| Foreign |
5,693 | 3,972 | 3,256 | |||||||||
|
|
|
|
|
|
|
|||||||
| Income tax expense |
$ | 4,565 | $ | 3,998 | $ | 3,257 | ||||||
F-15
Table of Contents
The reconciliation of the federal statutory income tax rate to the Company’s effective income tax rate is:
| Year ended June 30, 2011 |
Year ended June 30, 2010 |
Year ended June 30, 2009 |
||||||||||
| Federal statutory rate |
35.0 | % | 35.0 | % | 35.0 | % | ||||||
| State taxes net of federal benefit |
1.9 | % | 1.9 | 1.5 | ||||||||
| Differences between U.S. and foreign tax rates |
(7.9 | )% | (7.9 | ) | (6.5 | ) | ||||||
| Permanent differences between book and tax income |
(0.8 | )% | 0.1 | 13.0 | ||||||||
| Effect of change in status of foreign subsidiary |
7.7 | % | 53.4 | — | ||||||||
| Impact of valuation allowance |
(2.1 | )% | 3.9 | 107.0 | ||||||||
|
|
|
|
|
|
|
|||||||
| Effective tax rate |
33.8 | % | 86.4 | % | 150.0 | % | ||||||
|
|
|
|
|
|
|
|||||||
The income tax rate for the year ended June 30, 2011 differs from the United States federal statutory rate of approximately 35% primarily due to $227 of tax benefit in the United Kingdom due to the reduction of the deferred tax liability of UK-Commercial related to the reduction in United Kingdom tax rates from 28% to 26% that occurred during the period. The income tax rates for the years ended June 30, 2010 and 2009 differ from the United States federal statutory rate of approximately 35% primarily due to the Company’s Australian operations reporting a taxable profit and tax expense while the Company’s Canadian, United States and UKTN operations in the United Kingdom generated a net loss, generally without recording an income tax benefit. Although UK-Commercial is profitable on a tax basis, the Company’s United Kingdom operations are generally unable to utilize the group relief provision of the United Kingdom tax code until UK-Commercial’s net operating loss carry forwards have been exhausted.
The valuation allowance for the period ending June 30, 2011 was reduced due to the use of previously valued deferred tax assets related to net operating losses of $1,660 pertaining to ATN net income that was recognized by Global Traffic Network, Inc. (the unconsolidated parent) (“GTN”) during the period, which was offset by $1,376 of additions to the valuation allowance primarily for net operating losses and other deferred taxes of CTN. Prior to July 1, 2009, the Company considered all earnings of ATN to be indefinitely reinvested abroad and therefore did not recognize a deferred tax liability with regards to the undistributed earnings of ATN. As a result of the change in permanent investment status, GTN has recognized deferred tax liabilities of $17,338 for undistributed earnings and profits of ATN to date which are offset by foreign tax credit deferred tax assets of $13,148.
Management evaluates the recoverability of the deferred tax asset and the amount of the required valuation allowance. Due to the uncertainty surrounding the realization of the tax deductions in future tax returns, the Company has recorded a valuation allowance against its net deferred tax asset for CTN and UKTN (but not UK-Commercial) at June 30, 2011 and 2010. At such time as it is determined that it is more likely than not that the deferred tax assets will be realized, the valuation allowance will be reduced. The Company has recorded a valuation allowance for the deferred tax assets of ATN at June 30, 2011 and 2010 of $6 and $5, respectively.
The Company realized a tax benefit of $962, $736 and $236 for the years ended June 30, 2011, 2010 and 2009 respectively due to a reduction of the deferred tax liability that was established due to the acquisition of Unique. The initial amount of this tax liability was $4,342 and the current carrying value is $2,899 (the balance has decreased less than the cumulative tax benefit realized due to increases in currency exchange rates). The Company has recognized deferred tax benefit of $1,988 for the year ended June 30, 2011 related changes in deferred tax liabilities due to changes in currency exchange rates. The Company has not recorded any other tax benefit for the years ended June 30, 2011, 2010 and 2009 because the Company recorded a valuation allowance against all of the Company’s net deferred tax assets of CTN and UKTN due to the uncertainty surrounding the realization of the tax deductions in future tax returns. This valuation allowance will be reduced to the extent the Company determines that the deferred tax assets will more likely than not be realized. The Company recorded a deferred tax asset of $1,252 associated with the net operating losses of Unique which the Company acquired March 1, 2009. The Company has not recorded a valuation allowance against this deferred tax asset since it believes it is more likely than not that it will be able to utilize these net operating losses against future taxable income of UK-Commercial since UK-Commercial has generated taxable income since its acquisition date. The deferred tax asset related to the UK-Commercial net operating losses was $61 as of June 30, 2011 and the Company recognized $843, $348 and $106 of non-cash income tax expense for the years ended June 30, 2011, 2010 and 2009 due to the utilization of this asset. The difference between the original deferred tax asset less the cumulative tax expense recognized and the carrying value of the deferred tax asset as of June 30, 2011 is primarily due to the forfeiture of tax losses due to the sale of Intamedia (see Note 13) as well as changes in foreign exchange rates. The Company will continue to assess this position and, if necessary, establish a valuation allowance in order that the net carrying value of the deferred tax asset approximates its net realizable value. The Company had tax carried forward losses of $5,073 and $5,292 as of June 30, 2011 and 2010, respectively. The tax carried forward losses consisted of:
F-16
Table of Contents
| As of June 30, 2011 |
As of June 30, 2010 |
|||||||
| Domestic |
$ | — | $ | — | ||||
| Foreign |
5,073 | 5,292 | ||||||
|
|
|
|
|
|||||
| Total |
$ | 5,073 | $ | 5,292 | ||||
|
|
|
|
|
|||||
The Company recorded $457 in tax expense for the year ended June 30, 2011 related to an accrual of additional deferred taxes related to an uncertain tax position. During year ended June 30, 2011, the Company converted a significant portion of its advance to UKTN into equity. This conversion made it uncertain as to whether the Company could continue to qualify for the start-up exemption with regards to the non-accrual of interest on this intercompany advance. Due to the tax loss position of GTN for federal income tax purposes, it is unclear as to when this accrual would reverse should the position be upheld.
Unrecognized Tax Benefits
| Year ended June 30, 2011 |
Year ended June 30, 2010 |
Year ended June 30, 2009 |
||||||||||
| Changes in tax positions taken in previous periods |
$ | — | $ | — | $ | — | ||||||
| Tax positions taken in current period |
457 | — | — | |||||||||
| Settlements with taxing authorities |
— | — | — | |||||||||
| Lapse in statute of limitations |
— | — | — | |||||||||
| Total unrecognized tax benefit |
$ | 457 | $ | — | $ | — | ||||||
Foreign tax carry forward losses have a life ranging from twenty years to indefinitely and begin to expire in 2025. There are currently no domestic tax carried forward losses.
There is no interest or penalties included in income tax expense, income taxes payable, deferred tax assets or deferred tax liabilities for any of the periods covered by the financial statements. Interest is treated as interest expense and penalties are treated as general and administrative expenses.
The Company’s major tax jurisdictions are the United States, Canada, United Kingdom and Australia. The Company’s United States, Canada and United Kingdom tax years since inception remain subject to examination by the appropriate governmental agencies in those jurisdictions due to its tax loss position. The Company’s Australian 2007 and subsequent tax years remain subject to examination by the appropriate governmental agencies, except in the case of fraud or avoidance schemes, which is unlimited.
NOTE 7 — Commitments and Contingencies
The Company has various non-cancelable, long-term operating leases for its facilities, aviation services and office equipment. The facility leases have escalation clauses and provisions for payment of taxes, insurance, maintenance and repair expenses. Total expense under these leases is recognized ratably over the lease terms or based on usage, based on the type of agreement. Renewal options are not included in future minimum payments. Future minimum payments, by year and in the aggregate, under such non-cancelable operating leases with initial or remaining terms of one year or more, consist of the following as of June 30, 2011:
| June 30, 2011 |
||||
| Year 1 |
$ | 892 | ||
| Year 2 |
702 | |||
| Year 3 |
338 | |||
| Year 4 |
179 | |||
| Year 5 |
99 | |||
| Thereafter |
120 | |||
|
|
|
|||
| Total |
$ | 2,330 | ||
F-17
Table of Contents
Total rent expense in the accompanying statements of income for the fiscal years ending June 30, 2011, 2010 and 2009 was $1,288, $1,204 and $834, respectively. Rent expense on an annualized basis has exceeded the annual rental commitments primarily due to many of the operations and hangar arrangements being short term in nature.
The Company had an unused bank overdraft line of credit at June 30, 2011 and, based on the rates of exchange on that date, $2,144, was available to the Company. The bank overdraft line of credit is secured by substantially all the assets of ATN.
The Company’s UK-Commercial subsidiary outsources the majority of its radio traffic and entertainment news operations pursuant to contracts with unrelated third parties. These expenses are a component of operating expense and are recognized over the term of the applicable contracts, which is not materially different than when the services are provided. The minimum future payments under these contracts are as follows:
| As of June 30, 2011 |
||||
| Year 1 |
$ | 3,221 | ||
| Year 2 |
1,565 | |||
| Year 3 |
— | |||
| Year 4 |
— | |||
| Year 5 |
— | |||
| Thereafter |
— | |||
|
|
|
|||
| Total |
$ | 4,786 | ||
Under the terms of the agreements with these third parties, the Company is ultimately liable to these vendors should UK-Commercial be unable to pay its obligations.
NOTE 8 — Capital Stock
On March 29, 2006, the Company consummated an initial public offering (the “IPO”) in which it sold 3,800,000 shares of its common stock at a price to the public of $5.00 per share. Prior to the IPO, ATN was a separate entity which was controlled by the same shareholder base that controlled the Company. Pursuant to a Securities Exchange Agreement dated December 13, 2005, immediately prior to the effective time of the IPO, the Company exchanged 4,000,000 shares of its common stock and issued an aggregate of $1,400 in promissory notes to the ATN shareholders for all of the outstanding ordinary shares of ATN (the “Share Exchange”), at which time ATN became a wholly-owned subsidiary of the Company. The promissory notes (the “Share Exchange Notes”), which were intended to cover the estimated tax consequences to such shareholders of the Share Exchange, were paid in their entirety on the closing date of the IPO out of the net proceeds from the IPO. The issuance of the Share Exchange Notes reduced the additional paid in capital of the Company from the IPO. The net proceeds to the Company of the IPO were approximately $16,494. Due to the identical voting control of the Company and ATN prior to the Share Exchange, the transaction was treated as a combination and the equity section of the balance sheet reflects the combination of ATN and the Company’s equity.
On April 28, 2006, the underwriter for the IPO exercised its over-allotment option to acquire an additional 570,000 shares of the Company’s common stock for a purchase price of $4.65 per share (representing the IPO price to the public less underwriting discounts and commissions). On May 4, 2006, the purchase of these shares was completed, resulting in additional net proceeds to the Company of approximately $2,579 after deducting offering expenses.
On July 26, 2007, the Company entered into an underwriting agreement under which the Company agreed to sell 4,500,000 common shares to the underwriters at a price of $6.25 less an underwriters’ discount of 6.5%. The Company also granted the underwriters a thirty day option to purchase an additional 675,000 shares to cover over-allotments. On July 31, 2007 the underwriters exercised their over-allotment option in full and closed on the purchase of the 5,175,000 shares via payment of $30,241 to the Company. The Company’s net proceeds from the follow on offering after expenses were approximately $29,711.
NOTE 9 — Stock based compensation
At its annual stockholders’ meeting held December 15, 2010, the Company’s stockholders approved the Company’s adoption of an Amended and Restated 2005 Stock Incentive Plan (the “Plan”) that included, among other things, an additional 600,000 shares reserved for issuance under the Plan, increasing the total shares authorized for issuance under the Plan to 2,400,000. As of June 30, 2011, 2010 and 2009 there were 1,341,383, 1,396,730 and 1,063,399 outstanding incentive grants under the Plan, respectively. Options and restricted shares granted under the Plan vest ratably on an annual basis over three to five years and expire after ten years from the date of the grant. The Plan allows for cashless exercise under which employees surrender shares in lieu of paying the cash exercise price and remitting the required amounts to satisfy tax withholding obligations. Shares under the Plan have been issued from the Company’s authorized but not outstanding common shares at the time of exercise. Shares surrendered as payment upon cashless exercise of options have been retired upon such exercise. However, the Company maintains no formal policy with regards to shares issued or surrendered under the Plan. The Company does not anticipate incurring cash costs under the Plan (other than de minimus payroll tax withholdings) since it does not currently repurchase shares issued with regards to stock based compensation. Stock options and restricted stock that are issued, outstanding or available for future issuance under the Plan are summarized below:
F-18
Table of Contents
| As of June 30, 2011 |
As of June 30, 2010 |
|||||||
| Shares authorized under plan |
2,400,000 | 1,800,000 | ||||||
| Stock options outstanding |
(1,033,664 | ) | (1,148,401 | ) | ||||
| Stock options exercised |
(263,004 | ) | (24,934 | ) | ||||
| Restricted shares outstanding |
(307,719 | ) | (248,329 | ) | ||||
| Restricted shares converted into common shares upon lapse of restrictions |
(225,006 | ) | (106,671 | ) | ||||
|
|
|
|
|
|||||
| Shares available for issuance under plan |
570,607 | 271,665 | ||||||
|
|
|
|
|
|||||
Stock Options
As prescribed by FASB ASC 718, the Company is required to determine the fair value of the employee and director stock options issued under the Plan. The fair value of these options was estimated at the date of the grant using the Black-Scholes option pricing model with the following assumptions:
| June 30, 2011 |
June 30, 2010 |
June 30, 2009 |
||||||||||
| Risk-free interest rate |
1.41-2.11 | % | 2.27-2.35 | % | 1.74-2.71 | % | ||||||
| Volatility factor |
70.05-70.55 | % | 73.26-76.17 | % | 61.02-75.52 | % | ||||||
| Weighted volatility |
70.53 | % | 75.87 | % | 68.27 | % | ||||||
| Dividend yield |
— | — | — | |||||||||
| Option price |
$ | 5.30-5.51 | $ | 3.76-5.72 | $ | 3.96-6.05 | ||||||
| Weighted average expected life of options |
6 years | 6 years | 6 years | |||||||||
| Weighted average grant date fair value per share |
$ | 3.50 | $ | 2.59 | $ | 3.07 | ||||||
The Company’s outstanding stock options as of June 30, 2011 were as follows:
| Shares | Weighted Average Exercise Price |
Weighted Average Remaining Contractual Term |
Aggregate Fair Value |
Aggregate Intrinsic Value |
||||||||||||||||
| Balance, June 30, 2010 |
1,148,401 | $ | 5.14 | — | $ | 3,309 | — | |||||||||||||
| Exercisable, June 30, 2010 |
763,737 | $ | 5.38 | — | $ | 2,173 | — | |||||||||||||
| Grants |
145,000 | $ | 5.50 | — | $ | 508 | — | |||||||||||||
| Exercised |
(238,070 | ) | $ | 5.20 | — | $ | (703 | ) | 1,572 | |||||||||||
| Forfeitures/expirations |
(21,667 | ) | $ | 5.74 | — | $ | (75 | ) | — | |||||||||||
| Balance, June 30, 2011 |
1,033,664 | $ | 5.17 | 6.63 years | $ | 3,039 | $ | 6,538 | ||||||||||||
| Exercisable, June 30, 2011 |
660,005 | $ | 5.32 | 5.70 years | $ | 1,878 | $ | 4,072 | ||||||||||||
Based on the following assumptions, the fair value with regards to all options issued and outstanding as of June 30, 2011 is $3,039. As of June 30, 2011, there was $776 of total unrecognized compensation cost related to non-vested share-based compensation under the Plan. The cost of the unrecognized compensation is expected to be recognized over a weighted average period of 1.4 years on a pro rata basis over the vesting period. This expense is based on an assumption that there will be no forfeitures; this assumption is based on the positions of the grantees of the options and the low number of forfeitures to date. Since the Plan was adopted, the majority of the previous forfeitures were due to an outside director becoming an employee of the Company and the forfeited director stock options were simultaneously replaced with employee stock options. The expense with regards to stock options for the years ended June 30, 2011, 2010 and 2009 is $538, $677 and $771, respectively and is included in selling, general and administrative expenses. The Company recognized $278 of income tax benefit related to share-based compensation for the year ended June 30, 2011. There is no income tax benefit reflected in the accompanying income statements for the years ended June 30, 2010 and 2009 since a valuation allowance had been created for all deferred tax assets of GTN as of June 30, 2010 and 2009.
The total fair value of options vesting during the years ended June 30, 2011, 2010 and 2009 was $454, $608 and $876, respectively. The total intrinsic value of options exercised during the years ended June 30, 2011, 2010 and 2009 was $1,572, $0 and $109, respectively. The weighted average grant date fair value of options granted during the years ended June 30, 2011, 2010 and 2009 was $508, $725 and $61, respectively.
F-19
Table of Contents
Black-Scholes was developed for estimating the fair value of traded options which have no vesting restrictions and are freely transferable. The options issued under the Plan provide for limited transferability by the employee, contractor or director, and become exercisable with respect to one third to one fifth of their shares on each of the first three to five anniversaries of the date of grant. In addition, volatility is a subjective estimate that is further made difficult by the fact that, due to the limited trading history of the Company’s stock, a proxy for the Company’s volatility initially must be used. Because the Company believes it is the only public company offering traffic services outside the United States, the Company initially chose a recent six year volatility of the largest provider of traffic information in the United States, which is a much larger and longer established company than the Company. The impact of volatility on the expense recognized is that, all things being equal, the greater the volatility, the larger the expense. Effective October 1, 2006, the Company commenced using an estimate of the Company’s stock’s volatility from the IPO date until the grant of the options, which is the largest sample size available. In addition, because the Company has limited experience with regards to the expected life of the options granted with regards to both expected forfeiture rates and expected exercise dates, the Company elected to utilize the weighted mid-point between the vesting period and the maximum life of ten years, which is the point in time at which the options expire. The impact of weighted average life on the expense recognized is to the extent all other factors are the same, the expense increases as the time to exercise (life) increases. The risk free rate of interest was based on yields for five or seven year United States Treasury bonds at the time the options were granted, which most closely matched the expected life of the options.
On July 6, 2011, the compensation committee of the Company granted 145,000 stock options with an exercise price of $11.90. The provisions of these stock options are comparable to those stock options previously granted by the Company.
Restricted Stock
The Company has awarded restricted shares of its common stock under the Plan to certain employees and directors. The awards have restriction periods tied solely to employment and vest over three years. The value of these restricted stock awards is calculated at the fair market value of the shares on the date of grant net of estimated forfeitures and is expensed pro rata over the vesting period.
The following table summarizes the restricted stock activity for the year ended June 30, 2011.
| Shares | Weighted Average Grant Date Fair Value Per Share |
|||||||
| Unvested, June 30, 2010 |
248,329 | $ | 5.47 | |||||
| Grants |
177,725 | $ | 9.66 | |||||
| Converted to common stock |
(118,335 | ) | — | |||||
| Forfeited |
— | — | ||||||
| Unvested, June 30, 2011 |
307,719 | $ | 7.68 | |||||
As of June 30, 2011, there was $1,947 of unrecognized compensation expense related to restricted stock grants. The unrecognized compensation expense is expected to be recognized over a weighted average period of 2.3 years. The expense with regards to restricted stock for the year ended June 30, 2011, 2010 and 2009 was $864, $568 and $383, respectively and is included in selling, general and administrative expenses.
On July 6, 2011, the compensation committee of the Company granted an additional 10,000 shares of restricted stock. The restriction period of this restricted stock grant is comparable to those previously granted by the Company.
Should the Sale Agreement and Plan of merger discussed in Note 15 be consummated, all unvested stock options and restricted stock will vest upon the closing. Upon closing, all stock options will be treated as exercised and the holders will receive proceeds based on the difference between the exercise price and the tender offer of $14.00. All restricted shares will be purchased at the tender offer price of $14.00.
NOTE 10 — Warrant
Pursuant to the underwriting agreement entered into in connection with the IPO, the Company issued a warrant to the underwriter to purchase 380,000 shares of its common stock at a purchase price equal to $6.00 per share, which represented 120% of the $5.00 price to the public in the IPO. The underwriter was permitted to exercise the warrant at any time commencing on March 24, 2007 and ending on March 23, 2011 (the fifth anniversary of the date of the final prospectus used in the IPO). During the year ended June 30, 2011, the underwriter exercised its warrant for both cash and in a cashless manner, resulting in $1,791 of net proceeds to the Company and the issuance of 335,879 additional common shares.
NOTE 11 — Segment Reporting
The Company primarily operates in three geographic areas, Australia, Canada and United Kingdom, through its wholly owned subsidiaries ATN, GTC which operates through its wholly owned subsidiary CTN and UKTN, including its wholly owned subsidiary UK-Commercial. Select income statement information and capital expenditures for the years ended June 30, 2011, 2010 and 2009 and select balance sheet information as of June 30, 2011, 2010 and 2009 is provided below. The All Other category consists primarily of GAN and corporate overhead and assets of GTN. Management fees charged are treated as a contra-expense and eliminate on consolidation. Intercompany advances are treated as non-current assets or liabilities and eliminate on consolidation.
F-20
Table of Contents
| Australia | Year ended June 30, 2011 |
Year ended June 30, 2010 |
Year ended June 30, 2009 |
|||||||||
| Revenues |
69,732 | 56,451 | 42,707 | |||||||||
| Interest expense |
— | 15 | 39 | |||||||||
| Interest revenue |
1,305 | 725 | 700 | |||||||||
| Depreciation & amortization expense |
1,070 | 982 | 737 | |||||||||
| Intercompany management fee expense |
1,802 | 1,588 | 1,336 | |||||||||
| Income tax expense |
5,812 | 4,360 | 3,386 | |||||||||
| Segment profit |
13,497 | 10,117 | 7,894 | |||||||||
| Expenditure for property and equipment |
649 | 362 | 380 | |||||||||
| Segment assets |
52,226 | 31,786 | 30,658 | |||||||||
| Current assets |
49,623 | 29,243 | 27,482 | |||||||||
| Property & equipment, net |
2,190 | 2,065 | 2,552 | |||||||||
| Deferred tax assets, net |
583 | 368 | 323 | |||||||||
| Intangible assets, net |
42 | 33 | 31 | |||||||||
| Goodwill |
— | — | — | |||||||||
| Segment liabilities |
12,916 | 8,855 | 9,692 | |||||||||
| Canada | Year ended June 30, 2011 |
Year ended June 30, 2010 |
Year ended June 30, 2009 |
|||||||||
| Revenues |
15,017 | 9,464 | 6,920 | |||||||||
| Interest expense |
— | — | — | |||||||||
| Interest revenue |
— | — | 1 | |||||||||
| Depreciation & amortization expense |
1,964 | 1,386 | 757 | |||||||||
| Intercompany management fee expense |
— | — | — | |||||||||
| Income tax expense |
— | — | — | |||||||||
| Segment loss |
(1,809 | ) | (4,431 | ) | (3,063 | ) | ||||||
| Expenditure for property and equipment |
950 | 772 | 1,034 | |||||||||
| Segment assets |
10,718 | 8,259 | 6,849 | |||||||||
| Current assets |
7,236 | 3,994 | 2,369 | |||||||||
| Property & equipment, net |
3,387 | 4,115 | 4,299 | |||||||||
| Deferred tax assets (liabilities), net |
— | — | — | |||||||||
| Intangible assets, net |
52 | 115 | 167 | |||||||||
| Goodwill |
— | — | — | |||||||||
| Segment liabilities |
31,996 | 25,820 | 18,877 | |||||||||
| United Kingdom | Year ended June 30, 2011 |
Year ended June 30, 2010 |
Year ended June 30, 2009 |
|||||||||
| Revenues |
32,651 | 27,389 | 10,710 | |||||||||
| Interest expense |
— | — | — | |||||||||
| Interest revenue |
12 | 1 | 17 | |||||||||
| Depreciation & amortization expense |
2,940 | 2,854 | 1,015 | |||||||||
| Intercompany management fee expense |
180 | — | — | |||||||||
| Income tax (benefit) |
(119 | ) | (388 | ) | (130 | ) | ||||||
| Segment profit (loss) |
425 | (1,258 | ) | (1,802 | ) | |||||||
| Expenditure for property and equipment |
12 | 110 | 185 | |||||||||
| Segment assets |
28,800 | 24,695 | 30,017 | |||||||||
| Current assets |
12,813 | 6,998 | 7,671 | |||||||||
| Property & equipment, net |
264 | 512 | 687 | |||||||||
| Deferred tax (liabilities), net |
(2,838 | ) | (2,747 | ) | (3,410 | ) | ||||||
| Intangible assets, net |
11,151 | 12,865 | 16,902 | |||||||||
| Goodwill |
4,572 | 4,257 | 4,688 | |||||||||
| Segment liabilities |
11,184 | 29,469 | 33,981 | |||||||||
F-21
Table of Contents
| All Other | Year ended June 30, 2011 |
Year ended June 30, 2010 |
Year ended June 30, 2009 |
|||||||||
| Revenues |
1 | 31 | — | |||||||||
| Interest expense |
— | — | — | |||||||||
| Interest revenue |
1 | 1 | 297 | |||||||||
| Depreciation & amortization expense |
1 | 104 | 38 | |||||||||
| Intercompany management fee revenue |
(1,982 | ) | (1,588 | ) | (1,336 | ) | ||||||
| Income tax (benefit) expense |
(1,128 | ) | 26 | 1 | ||||||||
| Segment loss |
(3,170 | ) | (3,801 | ) | (4,114 | ) | ||||||
| Expenditure for property and equipment |
— | — | 28 | |||||||||
| Segment assets |
60,163 | 51,141 | 45,458 | |||||||||
| Current assets |
1,536 | 347 | 1,512 | |||||||||
| Property & equipment (net) |
— | 1 | 31 | |||||||||
| Deferred tax assets (liabilities), net |
(100 | ) | — | — | ||||||||
| Intangible assets, net |
— | — | 100 | |||||||||
| Goodwill |
— | — | — | |||||||||
| Segment liabilities |
5,095 | 2,689 | 2,247 | |||||||||
| Intercompany eliminations | June 30, 2011 |
June 30, 2010 |
June 30, 2009 |
|||||||||
| Segment assets |
(58,632 | ) | (50,793 | ) | (43,812 | ) | ||||||
| Current assets |
— | — | — | |||||||||
| Property & equipment (net) |
— | — | — | |||||||||
| Deferred tax assets (liabilities), net |
— | — | — | |||||||||
| Intangible assets, net |
— | — | — | |||||||||
| Goodwill |
— | — | — | |||||||||
| Segment liabilities |
(35,398 | ) | (49,912 | ) | (42,931 | ) | ||||||
| Total | Year ended June 30, 2011 |
Year ended June 30, 2010 |
Year ended June 30, 2009 |
|||||||||
| Revenues |
117,401 | 93,335 | 60,337 | |||||||||
| Interest expense |
— | 15 | 39 | |||||||||
| Interest revenue |
1,318 | 727 | 1,015 | |||||||||
| Depreciation & amortization expense |
5,975 | 5,326 | 2,547 | |||||||||
| Intercompany management fee expense |
— | — | — | |||||||||
| Income tax expense |
4,565 | 3,998 | 3,257 | |||||||||
| Net income (loss) |
8,943 | 627 | (1,085 | ) | ||||||||
| Expenditure for property and equipment |
1,611 | 1,244 | 1,627 | |||||||||
| Total assets |
93,275 | 65,088 | 69,170 | |||||||||
| Current assets |
71,208 | 40,582 | 39,034 | |||||||||
| Property & equipment, net |
5,841 | 6,693 | 7,569 | |||||||||
| Deferred tax (liabilities) assets, net |
(2,355 | ) | (2,379 | ) | (3,087 | ) | ||||||
| Intangible assets, net |
11,245 | 13,103 | 17,200 | |||||||||
| Goodwill |
4,572 | 4,257 | 4,688 | |||||||||
| Total liabilities |
25,793 | 16,921 | 21,866 | |||||||||
Non-cash stock based compensation is not allocated to the operating subsidiaries and is a component of the All Other segment above. Non-cash stock based compensation was $1,402, $1,245 and $1,154 for the years ended June 30, 2011, 2010 and 2009, respectively. Eliminations consist of intercompany payables/receivables and investments in subsidiaries.
The Company offers four primary products in the markets in which it operates. The products consist of radio traffic advertising commercials, radio news advertising commercials, television advertising commercials and government services relating to traffic. All government services revenue pertains to the Company’s United Kingdom segment. Not all products are offered in all markets or in all periods covered by the financial statements. These products are not operated as separate segments but are the responsibility of the regional management of the various segments outlined above. All revenues are generated from external clients.
| Revenues | Traffic | News | Television | Government | Total | |||||||||||||||
| Year ended June 30, 2011 |
$ | 89,509 | $ | 20,315 | $ | 3,538 | $ | 4,039 | $ | 117,401 | ||||||||||
| Year ended June 30, 2010 |
$ | 70,955 | $ | 15,426 | $ | 3,216 | $ | 3,738 | $ | 93,335 | ||||||||||
| Year ended June 30, 2009 |
$ | 44,375 | $ | 8,582 | $ | 3,318 | $ | 4,062 | $ | 60,337 | ||||||||||
F-22
Table of Contents
NOTE 12 — Quarterly Results of Operations (unaudited)
Year ended June 30, 2011
| First Quarter |
Second Quarter |
Third Quarter |
Fourth Quarter |
For the Year |
||||||||||||||||
| Revenues |
$ | 25,303 | $ | 31,811 | $ | 26,788 | $ | 33,499 | $ | 117,401 | ||||||||||
| Net operating income |
2,391 | 5,393 | 398 | 4,137 | 12,319 | |||||||||||||||
| Net income (loss) |
1,334 | 3,750 | (188 | ) | 4,047 | 8,943 | ||||||||||||||
| Net income (loss) per share: |
||||||||||||||||||||
| Basic |
$ | 0.07 | $ | 0.21 | $ | (0.01 | ) | $ | 0.22 | $ | 0.49 | |||||||||
| Diluted |
$ | 0.07 | $ | 0.20 | $ | (0.01 | ) | $ | 0.21 | $ | 0.48 | |||||||||
Year ended June 30, 2010
| First Quarter |
Second Quarter |
Third Quarter |
Fourth Quarter |
For the Year |
||||||||||||||||
| Revenues |
$ | 20,357 | $ | 25,624 | $ | 24,113 | $ | 23,241 | $ | 93,335 | ||||||||||
| Net operating (loss) income |
(602 | ) | 1,923 | 1,365 | 1,019 | 3,705 | ||||||||||||||
| Net (loss) income |
(1,034 | ) | 822 | 483 | 356 | 627 | ||||||||||||||
| Net income (loss) per share: |
||||||||||||||||||||
| Basic |
$ | (0.06 | ) | $ | 0.04 | $ | 0.03 | $ | 0.02 | $ | 0.03 | |||||||||
| Diluted |
$ | (0.06 | ) | $ | 0.04 | $ | 0.03 | $ | 0.02 | $ | 0.03 | |||||||||
NOTE 13 — Acquisition of Businesses
On April 2, 2007, CTN acquired substantially all the assets of Wise Broadcasting Network, Inc. (“Wise”) for approximately $355. Wise’s primary business was the provision of traffic and other information reporting services to radio stations in Canada, mainly in the greater Toronto area. The Company believes the acquisition will enhance its already existing network of station affiliates. The acquisition of Wise would not be material to the Company’s financial statements on a pro forma basis. The purchase price was allocated as follows:
| Current assets |
$ | 56 | ||
| Fixed assets |
11 | |||
| Intangibles |
338 | |||
| Assumed liabilities |
(50 | ) | ||
|
|
|
|||
| Purchase price |
$ | 355 | ||
|
|
|
Effective March 1, 2009, the Company and UKTN completed an acquisition of 100% of the outstanding ordinary shares of Unique from UBC Media Group plc (“UBC”) for an initial payment of £9 million (approximately $12.9 million at closing), plus three potential contingent payments based on performance for the calendar years 2009, 2010 and 2011, after which Unique (subsequently renamed UK-Commercial) became a wholly owned subsidiary of UKTN. Under the terms of the agreement, UBC was entitled to receive an earn-out payment of up to £5.5 million (approximately $9.1 million as of June 30, 2009) based on revenue of the acquired business generated during 2009. UBC was entitled to a £1.0 million payment (approximately $1.6 million as of June 30, 2009) if the acquired business generated 2009 revenue of at least £11.0 million (approximately $18.1 million as of June 30, 2009). The amount of the payment would increase based on a graduated schedule of 2009 revenue, up to a maximum of £5.5 million (approximately $9.1 million as of June 30, 2009) if the acquired business generated 2009 revenues of £13.6 million (approximately $22.4 million as of June 30, 2009) or greater. For each of 2010 and 2011, UBC Media Group was entitled to receive earn-out payments equal to 50% of the amount by which revenue from the acquired business exceeded £12.0 million (approximately $19.7 million as of June 30, 2009) and £12.5 million (approximately $20.6 million as of June 30, 2009), respectively. The closing date purchase price was adjusted upwards by the amount that Unique’s working capital exceeded £0.04 million (approximately $0.07 million) as of the closing date. The working capital adjustment was finalized in July 2009 and the Company paid UBC £0.23 million (approximately $0.4 million). The Company has guaranteed UKTN’s performance to UBC under the share purchase agreement. While the
guarantee continues until UKTN has no further obligations to UBC, subsequent to the settlement of the earn-out described below, the Company believes it is unlikely to have any liability under this guarantee.
F-23
Table of Contents
On July 23, 2009, the Company settled all of its contingent payment obligations to UBC for a payment of £1.95 million (approximately $3.2 million as of closing). In addition, effective as of July 1, 2009, the Company agreed to sell the radio marketing and sales & promotion business (“Intamedia”) that it previously acquired from UBC back to UBC for £50 thousand (approximately $80 thousand). The Company also agreed, subject to certain conditions, to allow Intamedia to continue to operate from its offices on a rent free basis until March 31, 2010. As part of the Intamedia sale, the Company agreed to a limited release from non-competition agreements for UBC and Simon Cole, its Chief Executive Officer, that were previously entered into as part of the Unique acquisition. The release pertained to the Intamedia business line only. The operations of Intamedia were immaterial to both the Company and the United Kingdom segment.
Unique provides traffic and entertainment news information to radio stations throughout the United Kingdom in exchange for commercial airtime inventory that it in turn sells to advertisers, in a business model similar to that of ATN and CTN. As a result of the acquisition, the Company expects to be the leading provider of traffic reporting services to radio stations in the United Kingdom.
The Company accounted for the business acquisitions using the purchase method of accounting. Under the purchase method, the results of an acquired business are included in the Company’s financial statements from the date of acquisition. The assets acquired and the liabilities assumed are recorded at their respective estimated fair values at closing, with any excess of the purchase price over the estimated fair value of the net assets acquired (including identifiable intangible assets) being recorded as goodwill. The results of operations for Unique have been included in the Company’s statement of income since the acquisition date of March 1, 2009. Revenue and net loss for the period March 1, 2009 through June 30, 2009 related to the Unique acquisition was approximately $6.6 million and $0.4 million, respectively. Revenue and net loss for the year ended June 30, 2010 related to the Unique acquisition was approximately $23.2 million and $0.7 million, respectively. Revenue and net income for the year ended June 30, 2011 related to the Unique acquisition was approximately $28.1 million and $0.4 million, respectively.
The Company has employed the income method to estimate the fair value of intangible assets, which is based on forecasted expected future cash flows related to the respective intangible assets. The income method is level three in the hierarchy of fair values (see Note 3(m)), and as such significant judgment is required to estimate the fair value of intangible assets and in assigning their respective useful lives. The fair value calculations are based on historical performance and projections of future performance based on management assumptions. The Company believes that these assumptions and projections are reasonable, but are subject to a great deal of uncertainty and the valuations of the intangible assets may be different under different assumptions. Should the Company’s assessment of the useful lives of the intangible assets change in future periods, due to non-renewal of station contracts, unenforceability of the non-competition agreement, loss of radio advertisers or otherwise, such shorter lives are likely to have a significant negative impact on our profits in the period such revised intangible lives are recognized.
A summary of the purchase price allocation is as follows based on exchange rates on the date of acquisition (amounts in thousands):
| Current Assets |
$ | 3,953 | ||
| Intangible asset — Station Contracts |
11,162 | |||
| Intangible asset — Non-competition agreement |
2,147 | |||
| Intangible asset — Radio advertising contracts |
2,194 | |||
| Goodwill |
4,509 | |||
|
|
|
|||
| Total assets acquired |
23,965 | |||
| Current liabilities assumed |
4,037 | |||
| Deferred tax liability, net |
3,091 | |||
|
|
|
|||
| Net assets acquired |
16,837 | |||
| Less: Acquisition costs |
819 | |||
| Add: Translation adjustment |
41 | |||
|
|
|
|||
| Cash consideration |
16,059 | |||
|
|
|
Because the Company purchased the stock of Unique, it will not be able to deduct any of the amortization of the purchase price for income tax purposes. In accordance with FASB ASC 740, the Company has established a deferred tax liability equal to the estimated tax effect of the intangible asset amortization. This deferred tax liability will be amortized over the lives of the intangible assets, excluding goodwill.
F-24
Table of Contents
Finite lived intangible assets are amortized on a straight line basis with no anticipated residual. The following are the intangible assets acquired (based on the exchange rate at acquisition date) and their respective amortizable lives (amounts in thousands):
| Amount | Amortization Period (Years) |
|||||||
| Station contracts |
$ | 11,162 | 10 years | |||||
| Radio advertising contracts |
2,194 | 4 years | ||||||
| Non-competition agreement |
2,147 | 3 years | ||||||
|
|
|
|
|
|||||
| Total intangible assets with finite lives |
$ | 15,503 | ||||||
NOTE 14 — Termination of Agreement
In October 2010, UKTN was informed that its Traffic Radio services contract with the United Kingdom’s Highways Agency would not be extended beyond its current expiration date of August 31, 2011 due to budgetary constraints of the Highways Agency. For the years ended June 30, 2011, 2010 and 2009, revenue related to this contract was $4,039, $3,792 and $4,061, operating income and net income was $835, $834 and $750, basic earnings per share was $0.05, $0.05 and $0.04 and diluted earnings per share was $0.04, $0.05 and $0.04, respectively.
NOTE 15 — Agreement and Plan of Merger of the Company
On August 2, 2011, the Company entered into a definitive agreement (the “Merger Agreement”) to be acquired by an affiliate of GTCR, LLC (“GTCR”). Under the terms of the Merger Agreement, GTCR Gridlock Holdings, Inc., a newly formed entity affiliated with GTCR, commenced a tender offer on August 9, 2011 to acquire all of the Company’s outstanding common stock for $14.00 per share in cash (the “Offer”), to be followed by a merger (the “Merger”) to acquire all remaining outstanding shares at the same price paid in the Offer. Under the Merger Agreement, in general, the Company is permitted, under a “go-shop” provision, to solicit, provide information to, and engage in discussions with, third parties with respect to alternative acquisition proposals until September 13, 2011. Subject to certain requirements of the Merger Agreement, the Company may negotiate with parties that submit qualifying competing proposals during the initial solicitation period for a period expiring on October 1, 2011. The Offer is required to remain open until the completion of the solicitation period, and if applicable, the subsequent negotiation period. The completion of the Offer and Merger are subject to certain conditions and termination rights set forth in the Merger Agreement. The Company has incurred significant costs, including the fairness opinion and financial and legal advisory fees, relating to the Merger Agreement which will still be paid even if the proposed transactions contemplated therein are not completed. These costs are approximately $1,000 of which only $73 were incurred and recognized in the income statement for the period ended June 30, 2011. Should the transactions contemplated by the Merger Agreement be consummated, the Company will be responsible for an additional “success” fee to its financial advisor as well as additional legal and financial advisory fees. The Company estimates that these additional fees will be in a range of $1,000 to $1,500, but there is no guarantee that such additional fees will not be higher than currently contemplated. In addition, under the Merger Agreement, the Company may be required to pay to GTCR Gridlock Acquisition Sub, Inc. a termination fee of approximately $8.3 million if the Merger Agreement is terminated under certain circumstances. The transactions contemplated by the Merger Agreement are expected to be completed by the fourth quarter of 2011, following which it is anticipated that the Company will terminate the registration of the shares of common stock under the Securities Exchange Act of 1934, as amended, and delist such shares from the NASDAQ Global Market.
NOTE 16 — Litigation
On August 31, 2011, Broadbased Equities, a purported shareholder of the Company, filed a complaint captioned Broadbased Equities v. William L. Yde III, et al. on behalf of itself and as a putative class action on behalf of the Company’s public shareholders in the Supreme Court of the State of New York, County of New York. The complaint names as defendants the members of the Company’s board of directors, as well as the Company, GTCR and certain of its affiliated entities. The plaintiff alleges, among other things, that the Company board of directors breached its fiduciary duties of care, loyalty, good faith and fair dealing to shareholders, and that the Company board of directors and the Company breached their fiduciary duties to disclose material facts to shareholders, in each case, in connection with the Offer and the Merger. The complaint further claims that GTCR and certain of its affiliated entities aided and abetted those alleged breaches of fiduciary duties. The complaint seeks (i) injunctive relief, including to enjoin the Offer and the Merger, (ii) a determination that the action is a proper class action and that the plaintiff is a proper class representative, (iii) a declaration that the defendants breached their fiduciary duties to the plaintiff and other Company shareholders and/or aided and abetted such breaches, (iv) additional disclosures with respect to the Offer and the Merger, (v) compensatory and/or rescissory damages and (vi) an award of attorneys’ and other fees and costs in addition to other unspecified relief. The defendants believe that the allegations in the complaint are without merit and intend to vigorously contest the action. A copy of the complaint is attached as an exhibit to Amendment No. 2 the Schedule 14D-9 filed by the Company on September 6, 2011, and as a result, the foregoing summary of the complaint does not purport to be complete and is qualified in its entirety by reference to such complaint and is incorporated herein by reference.
F-25
Table of Contents
| Exhibit |
Description | |
| 21.1 | Subsidiaries of Global Traffic Network, Inc. | |
| 23.1 | Consent of BDO Audit (NSW — VIC) Pty Limited. | |
| 31.1 | Certification of Chief Executive Officer pursuant to Securities Exchange Act Rules 13a-15(e) and 15d-15(e) as adopted pursuant to Section 302 of the Sarbanes-Oxley Act of 2002. | |
| 31.2 | Certification of Chief Financial Officer pursuant to Securities Exchange Act Rules 13a-15(e) and 15d-15(e) as adopted pursuant to Section 302 of the Sarbanes-Oxley Act of 2002. | |
| 32.1 | Certification of Chief Executive Officer and Chief Financial Officer pursuant to 18 U.S.C. Section 1350, as adopted pursuant to Section 906 of the Sarbanes-Oxley Act of 2002. | |
| 99.1 | Press Release dated September 13, 2011. | |