Attached files
| file | filename |
|---|---|
| 8-K - 8-K - Solera National Bancorp, Inc. | a11-26210_18k.htm |
Exhibit 99.1
|
|
Solera National Bancorp, Inc. RODMAN & RENSHAW Annual Global Investment Conference September 11-13, 2011 |

|
|
This presentation contains forward-looking statements within the meaning of the Private Securities Litigation Reform Act of 1995. The statements contained in this release, which are not historical facts and that relate to future plans or projected results of Solera National Bancorp, Inc. (“Company”) and its wholly-owned subsidiary, Solera National Bank (“Bank”), are forward-looking statements within the meaning of Section 27A of the Securities Act of 1933 and Section 21E of the Securities Exchange Act of 1934. These forward-looking statements are subject to risks and uncertainties that could cause actual results to differ materially from those projected, anticipated or implied. These risks and uncertainties can include the risks associated with the ability to grow the Bank and the services it provides, the ability to successfully integrate new business lines and expand into new markets, competition in the marketplace, general economic conditions and many other risks described in the Company’s Securities and Exchange Commission filings. The most significant of these uncertainties are described in our 2010 Annual Report on Form 10-K and Quarterly Reports on Form 10-Q all of which any reader is encouraged to study (including all amendments to those reports) and exhibits to those reports. We undertake no obligation to update or revise any forward-looking statement. Safe Harbor Statement Page 2 |
|
|
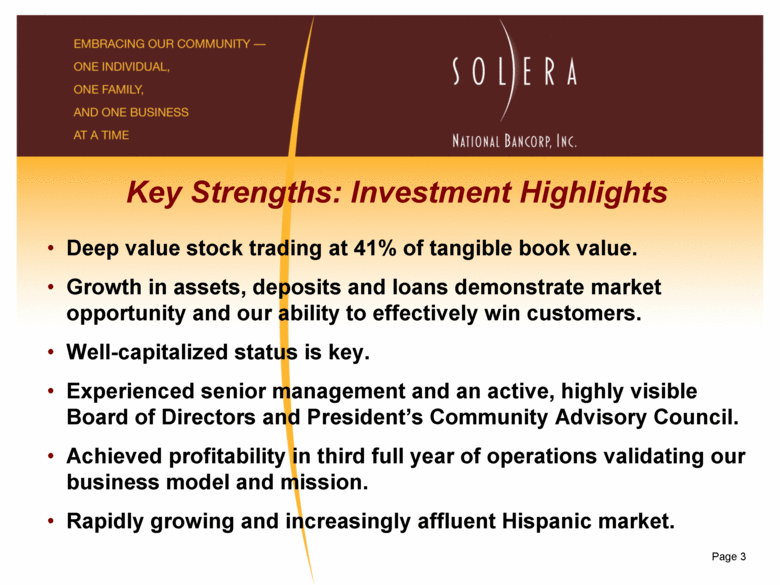
Page 3 Key Strengths: Investment Highlights Deep value stock trading at 41% of tangible book value. Growth in assets, deposits and loans demonstrate market opportunity and our ability to effectively win customers. Well-capitalized status is key. Experienced senior management and an active, highly visible Board of Directors and President’s Community Advisory Council. Achieved profitability in third full year of operations validating our business model and mission. Rapidly growing and increasingly affluent Hispanic market. |
|
|
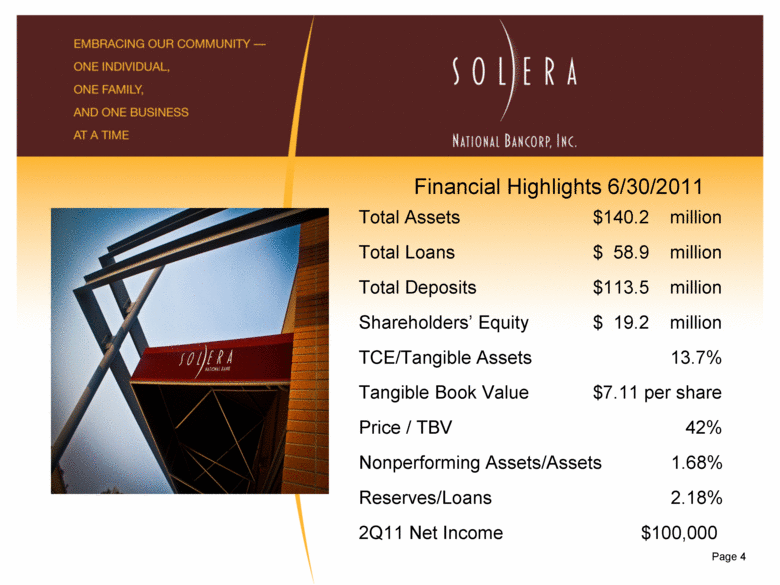
Financial Highlights 6/30/2011 Total Assets $140.2 million Total Loans $ 58.9 million Total Deposits $113.5 million Shareholders’ Equity $ 19.2 million TCE/Tangible Assets 13.7% Tangible Book Value $7.11 per share Price / TBV 42% Nonperforming Assets/Assets 1.68% Reserves/Loans 2.18% 2Q11 Net Income $100,000 Page 4 |
|
|
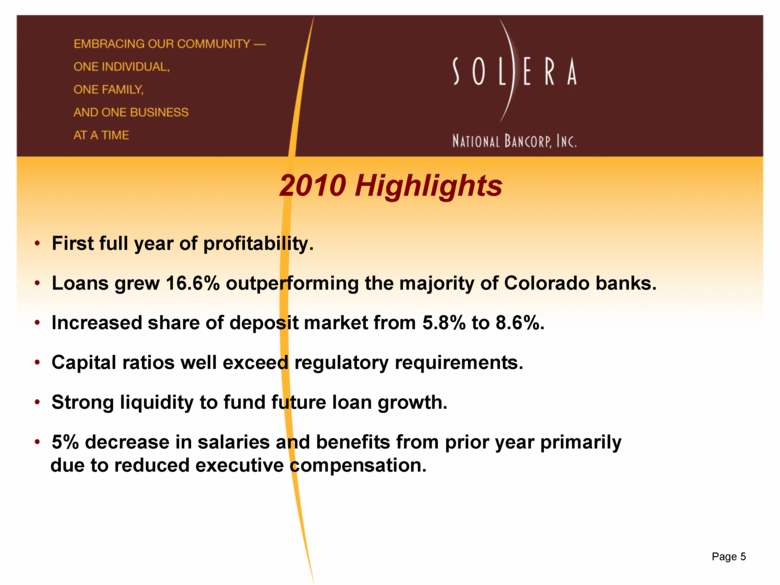
2010 Highlights First full year of profitability. Loans grew 16.6% outperforming the majority of Colorado banks. Increased share of deposit market from 5.8% to 8.6%. Capital ratios well exceed regulatory requirements. Strong liquidity to fund future loan growth. 5% decrease in salaries and benefits from prior year primarily due to reduced executive compensation. Page 5 |
|
|
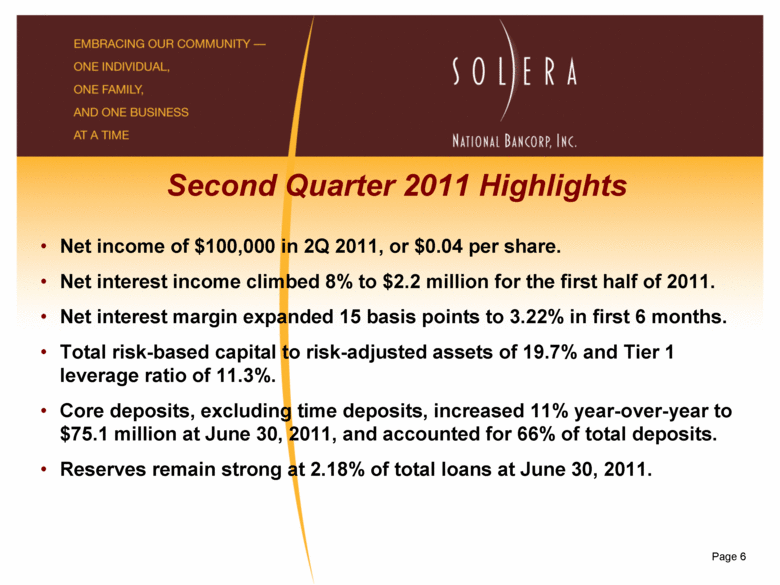
Page 6 Second Quarter 2011 Highlights Net income of $100,000 in 2Q 2011, or $0.04 per share. Net interest income climbed 8% to $2.2 million for the first half of 2011. Net interest margin expanded 15 basis points to 3.22% in first 6 months. Total risk-based capital to risk-adjusted assets of 19.7% and Tier 1 leverage ratio of 11.3%. Core deposits, excluding time deposits, increased 11% year-over-year to $75.1 million at June 30, 2011, and accounted for 66% of total deposits. Reserves remain strong at 2.18% of total loans at June 30, 2011. |
|
|
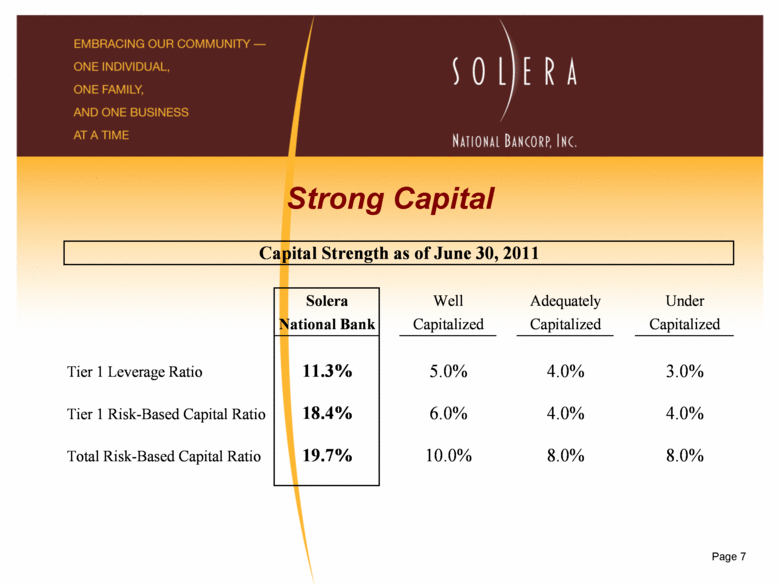
Strong Capital Page 7 Solera Well Adequately Under National Bank Capitalized Capitalized Capitalized Tier 1 Leverage Ratio 11.3% 5.0% 4.0% 3.0% Tier 1 Risk-Based Capital Ratio 18.4% 6.0% 4.0% 4.0% Total Risk-Based Capital Ratio 19.7% 10.0% 8.0% 8.0% Capital Strength as of June 30, 2011 |
|
|
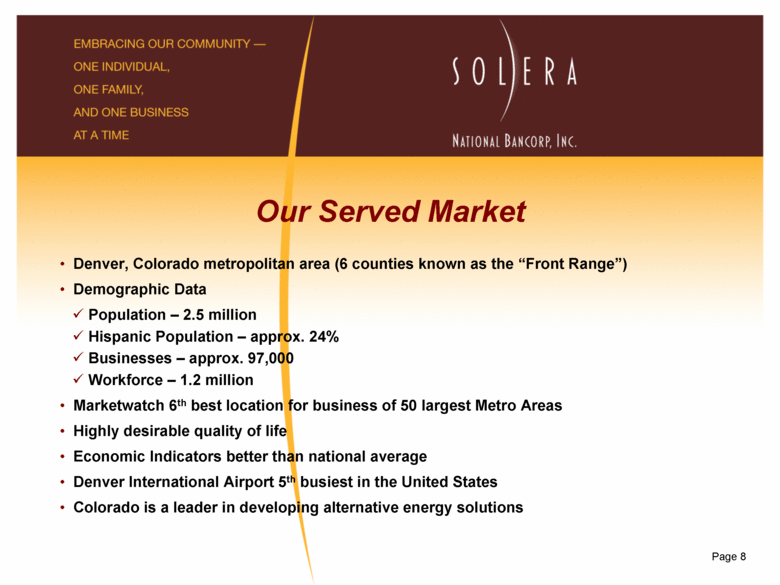
Our Served Market Denver, Colorado metropolitan area (6 counties known as the “Front Range”) Demographic Data Population – 2.5 million Hispanic Population – approx. 24% Businesses – approx. 97,000 Workforce – 1.2 million Marketwatch 6th best location for business of 50 largest Metro Areas Highly desirable quality of life Economic Indicators better than national average Denver International Airport 5th busiest in the United States Colorado is a leader in developing alternative energy solutions Page 8 |
|
|
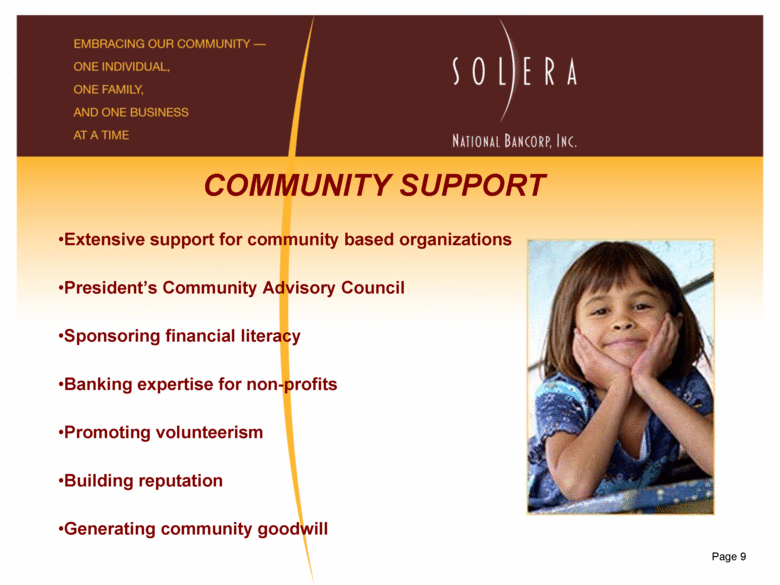
Page 9 COMMUNITY SUPPORT Extensive support for community based organizations President’s Community Advisory Council Sponsoring financial literacy Banking expertise for non-profits Promoting volunteerism Building reputation Generating community goodwill |
|
|
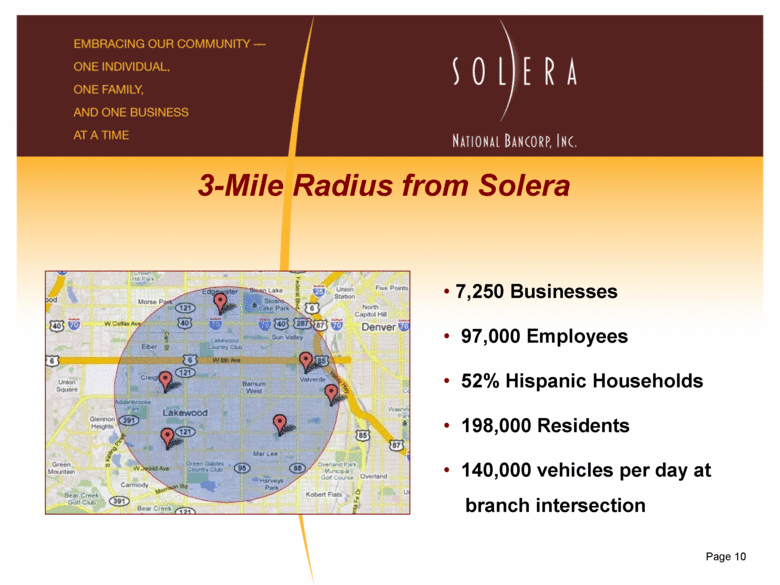
3-Mile Radius from Solera Page 10 7,250 Businesses 97,000 Employees 52% Hispanic Households 198,000 Residents 140,000 vehicles per day at branch intersection |
|
|
Page 11 Market Opportunities, Expansion Potential |

|
|
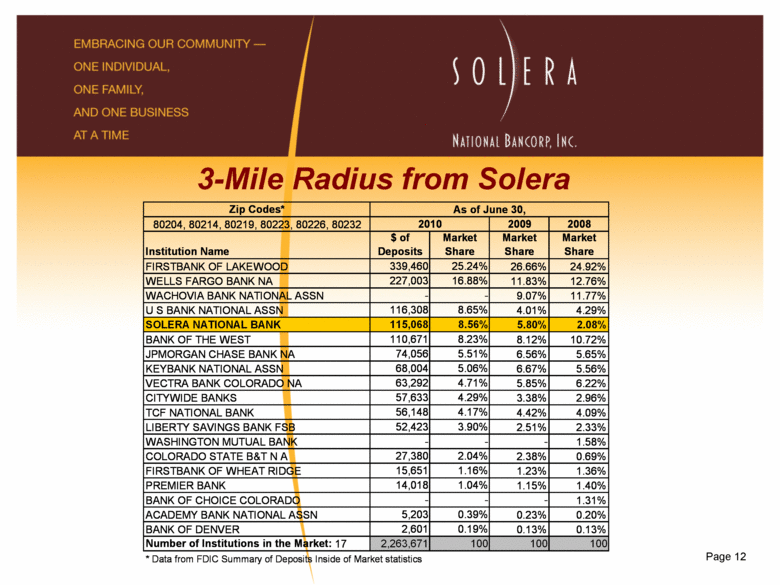
Page 12 3-Mile Radius from Solera Zip Codes* 80204, 80214, 80219, 80223, 80226, 80232 2009 2008 Institution Name $ of Deposits Market Share Market Share Market Share FIRSTBANK OF LAKEWOOD 339,460 25.24% 26.66% 24.92% WELLS FARGO BANK NA 227,003 16.88% 11.83% 12.76% WACHOVIA BANK NATIONAL ASSN - - 9.07% 11.77% U S BANK NATIONAL ASSN 116,308 8.65% 4.01% 4.29% SOLERA NATIONAL BANK 115,068 8.56% 5.80% 2.08% BANK OF THE WEST 110,671 8.23% 8.12% 10.72% JPMORGAN CHASE BANK NA 74,056 5.51% 6.56% 5.65% KEYBANK NATIONAL ASSN 68,004 5.06% 6.67% 5.56% VECTRA BANK COLORADO NA 63,292 4.71% 5.85% 6.22% CITYWIDE BANKS 57,633 4.29% 3.38% 2.96% TCF NATIONAL BANK 56,148 4.17% 4.42% 4.09% LIBERTY SAVINGS BANK FSB 52,423 3.90% 2.51% 2.33% WASHINGTON MUTUAL BANK - - - 1.58% COLORADO STATE B&T N A 27,380 2.04% 2.38% 0.69% FIRSTBANK OF WHEAT RIDGE 15,651 1.16% 1.23% 1.36% PREMIER BANK 14,018 1.04% 1.15% 1.40% BANK OF CHOICE COLORADO - - - 1.31% ACADEMY BANK NATIONAL ASSN 5,203 0.39% 0.23% 0.20% BANK OF DENVER 2,601 0.19% 0.13% 0.13% Number of Institutions in the Market: 17 2,263,671 100 100 100 * Data from FDIC Summary of Deposits Inside of Market statistics As of June 30, 2010 |
|
|
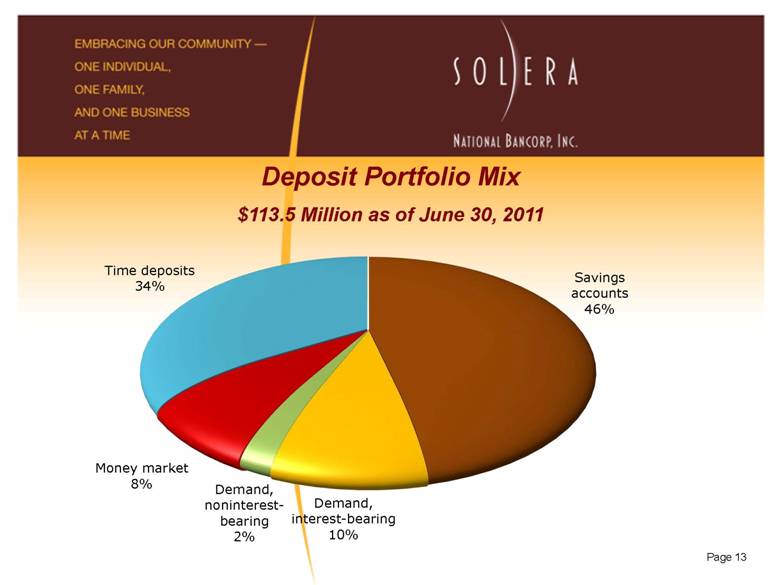
Page 13 Deposit Portfolio Mix $113.5 Million as of June 30, 2011 |
|
|
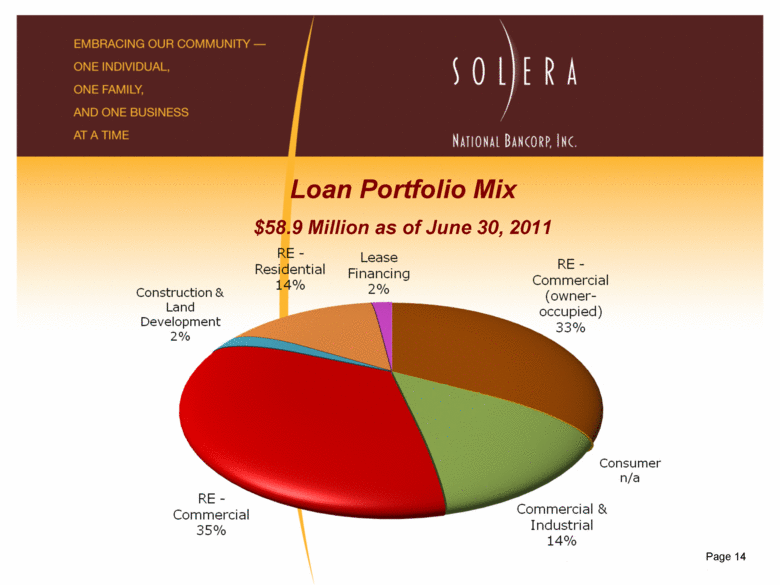
Page 14 Loan Portfolio Mix $58.9 Million as of June 30, 2011 |
|
|
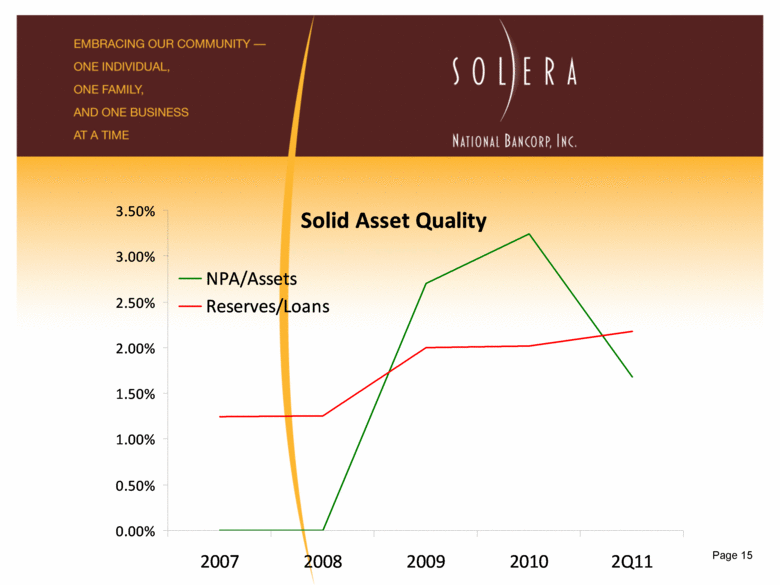
Page 15 Solid Asset Quality 0.00% 0.50% 1.00% 1.50% 2.00% 2.50% 3.00% 3.50% 2007 2008 2009 2010 2Q11 NPA/Assets Reserves/Loans |
|
|
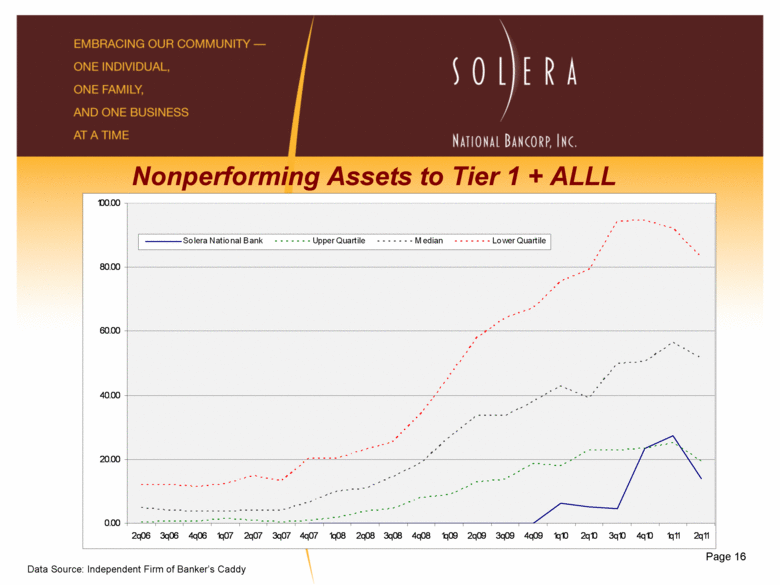
Page 16 Nonperforming Assets to Tier 1 + ALLL Data Source: Independent Firm of Banker’s Caddy 0.00 20.00 40.00 60.00 80.00 100.00 2q06 3q06 4q06 1q07 2q07 3q07 4q07 1q08 2q08 3q08 4q08 1q09 2q09 3q09 4q09 1q10 2q10 3q10 4q10 1q11 2q11 Solera National Bank Upper Quartile Median Lower Quartile |
|
|
Page 17 Executing on Plan Our strong balance sheet, general conservatism and constant focus on risk management has served us well. We have continuously invested in systems, infrastructure, people and products Platform for growth in place Prudent risk management policies and procedures Rising net interest income Growing market share “Big Bank” products; community bank service Higher visibility through marketing initiatives |
|
|
Page 18 Committed to the Fundamental Tenets of Banking Solera is benefiting from an increasing number of customers who embrace the “Back to Basics of Banking.” We have gained many new customers who seek the personalized services and localized decision making that a community bank like ours consistently provides. Human Capital Strong Capital Ratios Ample Liquidity Prudent Risk Management Exceptional Client Service Quality Products and Services Effective Pricing Measured Growth Operational Efficiency Profitability |

|
|
Page 19 The Light of a New Banking Era® Thank you for your time and interest! |