Attached files
| file | filename |
|---|---|
| 8-K - FORM 8-K - REGIONS FINANCIAL CORP | d226222d8k.htm |
 2011 Barclays Capital
Global Financial Services Conference
September 12, 2011
Grayson Hall
President and Chief Executive Officer
Exhibit 99.1 |
 Why
Regions? •
Strong Southeastern franchise with comprehensive line
of product offerings
•
Leading brand favorability and exceptional service
quality
•
Solid core business performance
•
Aggressively identifying and disposing of problem assets
•
Capital and liquidity remain solid
2 |
 Regional Bank Focused in the Southeast
3
Ranked
4
or
Better
in
Market
Share
Targeted Growth Areas
* As of August 26, 2011
Associates: 27,261
Assets: $131B
Loans: $81B
Deposits: $96B
Branches: 1,769
Morgan Keegan Offices: 312
Insurance Offices: 30
ATMs: 2,132
Market Cap: $5.2B*
th |
 4
($ in billions)
National Average: 3.9%
Regions’
Footprint is Characterized by Either High
Market Shares, High Growth Markets or Both
Source: SNL Financial
9.0 and above
8.0 to 8.9
7.0 to 7.9
6.0 to 6.9
5.9 or less
Projected
Population Growth (%)
Top 10 MSAs
Deposits
Market
Share
Market
Rank
’10-’15
Population
Growth
Birmingham, AL
$7.7
27.8%
1
Nashville, TN
$6.6
17.8%
1
Miami, FL
$4.8
3.1%
7
Tampa, FL
$4.7
9.5%
4
Memphis, TN
$3.8
17.3%
2
Atlanta, GA
$3.4
3.1%
6
St. Louis, MO
$3.2
4.4%
6
Jackson, MS
$2.5
23.6%
2
New Orleans, LA
$2.4
8.7%
4
Mobile, AL
$2.3
38.7%
1
1.0%
8.8%
4.4%
1.9%
10.1
%
4.3%
3.6%
1.4%
9.6%
3.4%
Southeastern United States continues
to be a growth market |
 Regions is Well Positioned Competitively in its Core
US Southeastern Markets
National Deposit Market Share
Weighted Average Deposit Market Share
in Regions’
Core Markets
Rank
Name
Market
Share
’10-’15
Population
Growth
1
Bank of America
11.7%
4.8%
2
Wells Fargo
10.6%
5.7%
3
JPMorgan Chase
9.2%
3.5%
4
Citigroup
3.7%
5.3%
5
PNC
2.6%
1.2%
6
U.S. Bancorp
2.5%
4.0%
7
Toronto-Dominion
1.9%
1.6%
8
SunTrust
1.7%
6.1%
9
BB&T
1.5%
5.6%
10
Regions
1.4%
4.7%
Source: SNL Financial. Deposit market share as of June 30, 2010, pro forma
for announced acquisitions. Note: Regions’
core markets defined as Alabama, Arkansas, Florida, Georgia, Louisiana,
Mississippi, Tennessee and Texas. Note: Population growth is weighted by MSA
deposits. Rank
Name
Market
Share
’10-’15
Population
Growth
1
Bank of America
12.7%
4.8%
2
Wells Fargo
10.9%
5.7%
3
JPMorgan Chase
7.5%
3.5%
4
Regions
6.1%
4.7%
5
SunTrust
5.9%
6.1%
6
BBVA / Compass
2.7%
7.9%
7
BB&T
2.3%
5.6%
8
Capital One
1.8%
3.7%
9
Synovus
1.6%
5.7%
10
Hancock Holdings
1.1%
5.3%
5 |
 Comprehensive and Diversified Line of
Product Offerings
–
Small and mid-
sized C&I lending
–
Commercial Real
Estate
–
Equipment
6
–
Mortgage
–
Home Equity
–
Credit Card
–
Direct Lending
–
Indirect Auto
–
Private Banking
–
Insurance
–
Trust Services
Commercial
Consumer
Wealth Management
Finance |
 Competitive Advantage Driven by Customer
Loyalty
Regions continues to
perform in the top 10%
in customer loyalty and
top 20% for branch
service quality
(1)
(1)
Based on Gallup survey
(2)
Based on Prime Performance study
(3)
2010 Greenwich Excellence Award
#1 in Customer Service and
“Friendliest”
Bank
(2)
Regions received
Excellence Award
for Small Business
and Middle Market
Banking
(3)
Top Bank in
Customer
Service Study
Ranked 5
th
in Satisfaction for
Small Business Banking
Ranked 2
nd
in Satisfaction for
Mortgage Servicing
J.D. Power
AND ASSOCIATES
7 |
 Excellent Service Quality and Brand Strength
Being Recognized
(1)
Based on 4 Quarter Rolling Average from TNS Consumer Banking Market Effectiveness
Study (2)
Banks in study include: Bank of America, BB&T, BBVA Compass, Citigroup, Capital
One, J.P. Morgan Chase, SunTrust, U.S. Bank, Wachovia, Wells Fargo
Regions
Ranks
Highest
in
Brand
Favorability
(1)
8
Regions
Bank #2
Bank #3
Bank #4
Bank #5
Bank #6
Bank #7
Bank #8
Bank #9
Bank #10 |
 Quality Loans Key to Profitable Growth
61%
39%
Portfolio Mix*
Consumer Services
›
Growing consumer loans to achieve a
more balanced portfolio
›
Consumer loan growth will be fueled by
new businesses as well as growth in
existing businesses
›
Loan production in mortgage
portfolio was 2
nd
largest ever
›
Indirect auto lending production
increased from $255 million in
1Q11 to $291 million in 2Q11
›
Acquired $1.2 billion Regions-
branded credit portfolio
Business Services
›
Focused on middle market & small
business
›
Represents over 80% of
Business Services Revenue
›
Broad based middle-market
commercial loan growth across
footprint and industries
›
65% of area regions
experienced growth in 2Q11
*Ending Balances
9 |
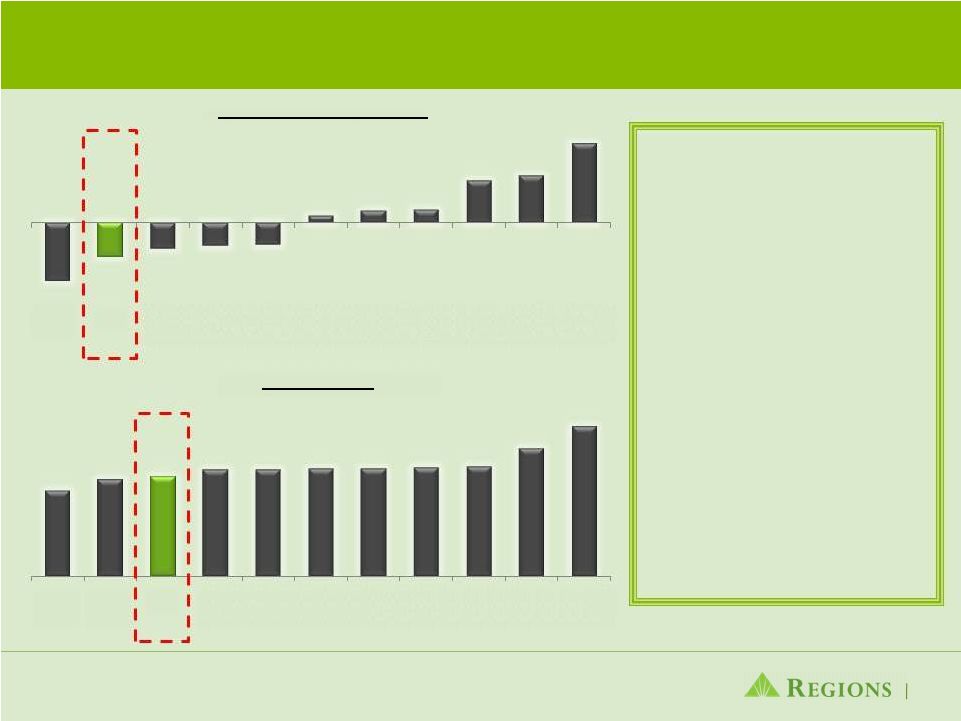
 Regions C&I Loan Growth has significantly
outpaced Peers
10
Source: SNL Financial; FRY-9C Regulatory filings
•
Our Commercial &
Industrial loan growth
has significantly
outpaced peers since the
end of 2009
•
Momentum has
continued in 2011, as
Commercial & Industrial
loans have grown
another 7.9%
•
Commercial & Industrial
commitments increased
7% year-to-date and line
utilization remained
stable
13.5%
9.1%
7.9%
6.4%
5.6%
5.3%
4.9%
4.7%
2.4%
0.5%
-0.6%
Bank
#1
Bank
#2
RF
Bank
#4
Bank
#5
Bank
#6
Bank
#7
Bank
#8
Bank
#9
Bank
#10
Bank
#11
C&I Loan Growth Y-T-D
19.3%
18.9%
16.1%
5.5%
3.9%
3.9%
3.8%
0.6%
-
2.5%
-
5.1%
-
10.9%
RF
Bank
#2
Bank
#3
Bank
#4
Bank
#5
Bank
#6
Bank
#7
Bank
#8
Bank
#9
Bank
#10
Bank
#11
C&I Loan Growth since 4Q09 |
 We
have made great strides in improving deposit mix and cost and funding
costs Deposit Cost
79 bps
Deposit Cost
59 bps
Deposit Cost
53 bps
Q2 2011
Q2 2011
Low Cost
Deposits
73%
Time
Deposits
27%
Low Cost
Deposits
76%
Time
Deposits
24%
Low Cost
Deposits
77%
Time
Deposits
Q1 2011
Q1 2011
Q2 2010
Q2 2010
11
6 bps Improvement
26 bps Improvement
31 bps Improvement
23%
Total Funding Cost
111 bps
Total Funding Cost
86 bps
Total Funding Cost
80 bps |
 Net
Interest Margin Impacted by Excess Liquidity and Non-Accrual Loans
Net Income & Net Interest Margin
Impact of Excess Liquidity &
Non-Accruals on NIM
12
$863
$876
$886
$872
$872
2.87%
2.96%
3.00%
3.07%
3.05%
$500
$550
$600
$650
$700
$750
$800
$850
$900
$950
2Q10
3Q10
4Q10
1Q11
2Q11
$ in millions
Net Interest Income (FTE)
Net Interest Margin
2.87%
2.96%
3.00%
3.07%
3.05%
0.15%
0.08%
0.11%
0.10%
0.13%
0.17%
0.16%
0.16%
0.16%
0.15%
3.19%
3.20%
3.27%
3.33%
3.33%
2.0%
2.2%
2.4%
2.6%
2.8%
3.0%
3.2%
3.4%
2Q10
3Q10
4Q10
1Q11
2Q11
Reported Net Interest Margin
Impact of Excess Liquidity
Impact of Non-Accruals
2.0%
2.2%
2.4%
2.6%
2.8%
3.0%
3.2%
3.4% |
 Regions is the only bank in our peer group to
grow service charges year-over-year
13
Offsetting Durbin
•
Increasing hurdle on
obtaining free checking
•
Debit card usage fee to
begin in 4Q11
•
Shift debit cards to credit
cards increase
interchange fees
•
Cross-sell new products
and services in
development
2.0%
-1.9%
-7.2%
-11.6%
-13.8%
-
15.4%
-18.2%
-18.6%
-21.9%
-24.2%
-37.3%
RF
Bank
#2
Bank
#3
Bank
#4
Bank
#5
Bank
#6
Bank
#7
Bank
#8
Bank
#9
Bank
#10
Bank
#11
Year-Over-Year Growth |
 Expense control continues to be a focus
14
•
While many peers grew
expenses in the second
quarter, Regions
decreased expenses by
4%
•
Over the last year
Regions’
expenses have
remained flat while
peers continue to grow
expenses
•
Expenses per FTE are
among the lowest of all
peers
Source: SNL Financial –excludes nonrecurring expenses
-6.6%
3.9%
3.0%
2.7%
2.5%
0.8%
1.3%
1.4%
4.8%
5.3%
9.0%
Bank
#1
RF
Bank
#3
Bank
#4
Bank
#5
Bank
#6
Bank
#7
Bank
#8
Bank
#9
Bank
#10
Bank
#11
Linked quarter Decline
$35.2
$39.6
$41.1
$43.9
$44.1
$44.2
$44.3
$45.0
$45.3
$52.6
$61.8
Bank
#1
Bank
#2
RF
Bank
#4
Bank
#5
Bank
#6
Bank
#7
Bank
#8
Bank
#9
Bank
#10
Bank
#11
NIE per FTE
-
-
-
- |
 *
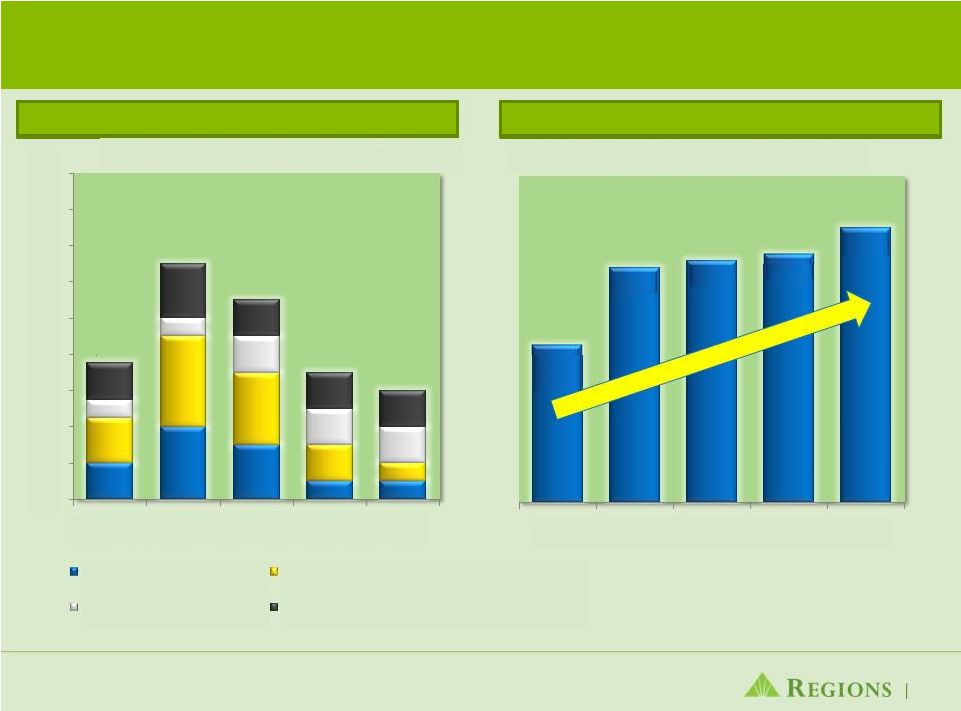
Refer to appendix for reconciliation to GAAP 15
Solid Adjusted Pre-tax Pre-Provision
Income Growth
($ in millions)
Net
Interest
Income
Core Non-
Interest
Revenue
Core Non-
Interest
Expense
Adjusted
Pre-tax
Pre-
provision
Income*
2Q11
864
+
757
-
1,121
=
500
1Q11
863
+
764
-
1,167
=
460
4Q10
877
+
795
-
1,211
=
461
3Q10
868
+
748
-
1,162
=
454
Adjusted
Adjusted
Pre-tax Pre-
Pre-tax Pre-
provision
provision
Income
Income
+9%
+9% |
 3
Consecutive Quarters of Profitability and Adjusted Pre-tax Pre-
provision Income Exceeded Loan Loss Provision for first time
since 1Q09
*Pre-tax pre-provision income adjusted for non-core items as reported
in financial supplement. 16
Pre-tax Pre-Provision Income* Less Provision
$1,179
$770
$651
$760
$682
$482
$398
$386
$397
$486
$454
$461
$460
$500
4Q09
1Q10
2Q10
3Q10
4Q10
1Q11
2Q11
Loan Loss Provision
Pre
tax Pre-Provision Income*
$-
$200
$400
$600
$800
$1,000
$1,200
$1,400
($793)
($373)
($165)
($306)
($221)
($22)
$102
4Q09
1Q10
2Q10
3Q10
4Q10
1Q11
2Q11 |
 Significant Reduction in Highest Risk Portfolio
Segments
17
Reduced Investor Real Estate $12.4 B
or
48%
over 4 years
Reduced High Risk Segments $11.1 B
or
82%
over 4 years
Total Investor Real Estate
Higher Risk Investor Real Estate Segments
$6.3
$2.3
$5.0
$1.2
$0.3
$1.0
$0
$1
$2
$3
$4
$5
$6
$7
Land
Condo
Single Family
4Q06
2Q11
$ 25.8 B
$ 13.4 B
$0
$5
$10
$15
$20
$25
$30
4Q06
2Q11
Mortgage
Construction |
 18
Non-Performing Loan Inflows Declined 24%
Ending Balances
NPL Inflows by Type
Gross NPLs Current and Paying as Agreed
$0.8
$1.3
$0.9
$0.7
$0.6
$0.0
$0.2
$0.4
$0.6
$0.8
$1.0
$1.2
$1.4
$1.6
$1.8
2Q10
3Q10
4Q10
1Q11
2Q11
Land/Condo/Single Family
Income Producing
Business and Community
Commercial
$ in billions
24%
36%
37%
42%
2Q10
3Q10
4Q10
1Q11
2Q11
38% |
 19
Non-Performing Assets Declined 14%*
* 2Q11 shown on a pro-forma basis to include bulk sale completed after
quarter-end Non-performing loans, excluding loans
held for sale, declined $303 million or
10%
$620 million of criticized loans were
sold
or moved to held for sale
Non-performing assets declined $556
million or 14%*
Delinquencies improved for the 5th
straight quarter
Business Services criticized loans
declined approximately $1.2 billion or
14%
Non-Performing Assets
$3.5
$3.4
$3.2
$3.1
$2.8
$0.5
$0.5
$0.4
$0.4
$0.4
$0.3
$0.3
$0.3
$0.4
$0.2
$4.3
$4.2
$3.9
$3.9
$3.4
$0.0
$0.5
$1.0
$1.5
$2.0
$2.5
$3.0
$3.5
$4.0
$4.5
$5.0
2Q10
3Q10
4Q10
1Q11
2Q11*
NPL
OREO & Repo
Held For Sale
$ in billions |
 Substantial Improvement in Loan Loss Provision;
Coverage Ratio Remains Strong
(1) Loan charge-offs related to Sales and Transfer to Held for Sale
(2) Excludes Non-performing Loans Held for Sale
20
Sales/
HFS
(1)
Allowance
&
Coverage
(2)
Loan Charge-Offs
4.04%
3.99%
3.81%
3.79%
3.43%
0.92x
0.94x
1.01x
1.03x
1.12x
0.80x
0.86x
0.92x
0.98x
1.04x
1.10x
1.16x
3.00%
3.10%
3.20%
3.30%
3.40%
3.50%
3.60%
3.70%
3.80%
3.90%
4.00%
4.10%
4.20%
4.30%
4.40%
4.50%
4.60%
2Q10
3Q10
4Q10
1Q11
2Q11
NPL / Loans
Coverage Ratio (ALL/NPL)
333
348
402
210
190
132
233
111
106
207
186
178
169
165
151
(150)
$651
$760
$682
$482
$398
($200)
$0
$200
$400
$600
$800
$1,000
2Q10
3Q10
4Q10
1Q11
2Q11
$ in millions
Business Services and HFS
Consumer
Reserve Increase / Reduction |
 Strong Capital
21
** Non-GAAP -
Subject to change as interpretation of Basel III rules is ongoing and dependent on
guidance from Basel and regulators; see appendix for
reconciliation |
 Loans / Deposits
22
Regions is well positioned for loan growth
Liquidity coverage ratio above the minimum requirement of 100%
Core Deposits as a % of Total Funding
Solid Liquidity
88%
87%
87%
86%
85%
85%
84%
80%
77%
77%
53%
Bank
#1
RF
Bank
#3
Bank
#4
Bank
#5
Bank
#6
Bank
#7
Bank
#8
Bank
#9
Bank
#10
Bank
#11
89.3%
88.9%
87.6%
84.4%
84.3%
2Q10
3Q10
4Q10
1Q11
2Q11 |
 Regions’
Business Plan
is for all associates to
Focus on customers, build
relationships customers value
and manage risks.
Executing this
plan with excellence will result in a
high-performing financial institution.
Focus on the Customer
Build Sustainable Performance
Enhance Risk Management
Risk management will be built on our solid
foundation of trust and integrity. We will
clearly understand the risk we take, be paid
appropriately for that risk and prudently
manage our capital and
liquidity. Business
Plan 23
We will ensure sustainable
profitability by diversifying
and expanding our revenue
streams while exercising
disciplined pricing and
expense management.
We will focus on our
customers to build
relationships they value and
enhance our industry-
leading customer service. |
 Why
Regions? 24
•
Strong Southeastern franchise with comprehensive line
of product offerings
•
Leading brand favorability and exceptional service
quality
•
Solid core business performance
•
Aggressively identifying and disposing of problem assets
•
Capital and liquidity remain solid |
 Appendix |
 Forward-Looking Statements
25
This presentation may include forward-looking statements which reflect Regions’ current views
with respect to future events and financial performance. The Private Securities Litigation Reform Act of 1995 (“the
Act”) provides a “safe harbor” for forward-looking statements which are identified
as such and are accompanied by the identification of important factors that could cause actual results to differ materially from
the forward-looking statements. For these statements, we, together with our subsidiaries,
claim the protection afforded by the safe harbor in the Act. Forward-looking statements are not based on historical
information, but rather are related to future operations, strategies, financial results or other
developments. Forward-looking statements are based on management’s expectations as well as certain assumptions
and estimates made by, and information available to, management at the time the statements are
made. Those statements are based on general assumptions and are subject to various risks, uncertainties and
other factors that may cause actual results to differ materially from the views, beliefs and
projections expressed in such statements. These risks, uncertainties and other factors include, but are not limited to,
those described below:
›
The Dodd-Frank Wall Street Reform and Consumer Protection Act became law on July 21, 2010, and a
number of legislative, regulatory and tax proposals remain pending. Additionally, the U.S.
Treasury and federal banking regulators continue to implement, but are also beginning to wind down, a
number of programs to address capital and liquidity in the banking system. Proposed rules,
including those that are part of the Basel III process, could require banking institutions to increase
levels of capital. All of the foregoing may have significant effects on Regions and the financial
services industry, the exact nature of which cannot be determined at this time. ›
The impact of compensation and other restrictions imposed under the Troubled Asset Relief Program
(“TARP”) until Regions repays the outstanding preferred stock and warrant issued under the
TARP, including restrictions on Regions’ ability to attract and retain talented executives and
associates.
›
Possible additional loan losses, impairment of goodwill and other intangibles, and adjustment of
valuation allowances on deferred tax assets and the impact on earnings and capital.
›
Possible changes in interest rates may increase funding costs and reduce earning asset yields, thus
reducing margins. Increases in benchmark interest rates would also increase debt service
requirements for customers whose terms include a variable interest rate, which may negatively impact
the ability of borrowers to pay as contractually obligated.
›
Possible changes in general economic and business conditions in the United States in general and in the
communities Regions serves in particular, including any prolonging or worsening of the current
unfavorable economic conditions including unemployment levels.
›
Possible changes in the creditworthiness of customers and the possible impairment of the collectability
of loans.
›
Possible changes in trade, monetary and fiscal policies, laws and regulations and other activities of
governments, agencies, and similar organizations, may have an adverse effect on business.
›
The current stresses in the financial and real estate markets, including possible continued
deterioration in property values.
›
Regions' ability to manage fluctuations in the value of assets and liabilities and off-balance
sheet exposure so as to maintain sufficient capital and liquidity to support Regions' business.
›
Regions' ability to expand into new markets and to maintain profit margins in the face of competitive
pressures.
›
Regions' ability to develop competitive new products and services in a timely manner and the acceptance
of such products and services by Regions' customers and potential customers.
›
Regions' ability to keep pace with technological changes. ›
Regions' ability to effectively manage credit risk, interest rate risk, market risk, operational risk,
legal risk, liquidity risk, and regulatory and compliance risk.
›
Regions’ ability to ensure adequate capitalization which is impacted by inherent uncertainties in
forecasting credit losses.
›
The cost and other effects of material contingencies, including litigation contingencies, and any
adverse judicial, administrative or arbitral rulings or proceedings.
›
The effects of increased competition from both banks and non-banks. ›
The effects of geopolitical instability and risks such as terrorist attacks. ›
Possible changes in consumer and business spending and saving habits could affect Regions' ability to
increase assets and to attract deposits.
›
The effects of weather and natural disasters such as floods, droughts, wind, tornadoes and hurricanes,
and the effects of man-made disasters.
›
Possible downgrades in ratings issued by rating agencies. ›
Potential dilution of holders of shares of Regions’ common stock resulting from the U.S.
Treasury’s investment in TARP.
›
Possible changes in the speed of loan prepayments by Regions’ customers and loan origination or
sales volumes.
›
Possible acceleration of prepayments on mortgage-backed securities due to low interest rates and
the related acceleration of premium amortization on those securities.
›
The effects of problems encountered by larger or similar financial institutions that adversely affect
Regions or the banking industry generally.
›
Regions’ ability to receive dividends from its subsidiaries. ›
The effects of the failure of any component of Regions’ business infrastructure which is provided
by a third party.
›
Changes in accounting policies or procedures as may be required by the Financial Accounting Standards
Board or other regulatory agencies.
›
The effects of any damage to Regions’ reputation resulting from developments related to any of the
items identified above.
The foregoing list of factors is not exhaustive. For discussion of these and other factors that may
cause actual results to differ from expectations, look under the captions “Forward-Looking Statements” and
“Risk Factors” in Regions’ Annual Report on Form 10-K for the year ended December
31, 2010 and quarterly reports on Form 10-Q for the quarters ended June 30, 2011 and March 31, 2011, as on file with the
Securities and Exchange Commission.
The words "believe," "expect," "anticipate," "project," and similar
expressions often signify forward-looking statements. You should not place undue reliance on any forward-looking statements, which speak only
as
of
the
date
made.
We
assume
no
obligation
to
update
or
revise
any
forward-looking
statements
that
are
made
from
time
to
time. |
 Non-GAAP Reconciliation
26
($ in millions)
2Q10
3Q10
4Q10
1Q11
2Q11
Net interest income (GAAP)
856
$
868
$
877
$
863
$
864
$
Non-interest income (GAAP)
756
750
1,213
843
781
Adjustments:
Securities (gains) losses, net
-
(2)
(333)
(82)
(24)
Leveraged lease termination gains
-
-
(59)
-
-
Loss (gain) on sale of mortgage loans
-
-
(26)
3
-
Adjusted non-interest income (non-GAAP)
756
748
795
764
757
Adjusted total revenue (non-GAAP)
1,612
$
1,616
$
1,672
$
1,627
$
1,621
$
Non-interest expense (GAAP)
1,326
$
1,163
$
1,266
$
1,167
$
1,198
$
Adjustments:
Regulatory charge
(200)
-
-
-
-
Loss on extinguishment of debt
-
-
(55)
-
-
Securities impairment, net
-
(1)
-
-
-
Branch consolidation and property and equipment charges
-
-
-
-
(77)
Adjusted non-interest expense (non-GAAP)
1,126
$
1,162
$
1,211
$
1,167
$
1,121
$
Adjusted pre-tax pre-provision income
486
$
454
$
461
$
460
$
500
$ |
 Improving Early Stage Credit Metrics…
*Includes classified loans and special mention loans
27
Business Services Criticized Loans *
Business Services Classified Loans
90+Day Delinquencies
30-59 Day Delinquencies
$612
$593
$585
$527
$483
$5,824
$6,687
$7,337
$7,929
$8,196
$7,899
$780
$766
$642
$676
$566
2Q10
3Q10
4Q10
1Q11
2Q11
2Q10
3Q10
4Q10
1Q11
2Q11
2Q10
3Q10
4Q10
1Q11
2Q11
2Q10
3Q10
4Q10
1Q11
2Q11
$9,142
$9,804
$10,593
$11,337 |
 …Result In Improving Asset Quality
28
Total NPLs (excluding HFS)
Total NPAs (including HFS)
NPLs Gross Migration
Investor Real Estate Gross NPA Migration
* 2Q11 shown on a pro-forma basis to include bulk sale completed after
quarter-end $799
$1,340
$947
$730
$555
2Q10
3Q10
4Q10
1Q11
2Q11
2Q10
3Q10
4Q10
1Q11
2Q11
2Q10
3Q10
4Q10
1Q11
2Q11
2Q10
3Q10
4Q10
1Q11
2Q11*
$3,473
$3,372
$3,160
$3,087
$2,784
$504
$266
$238
$996
$480
$516
$270
$335
$605
$224
$179
$403
Land/Single
Family/Condo
Income
Producing CRE
$134
$137
$271
$3,377
$3,933
$3,918
$4,275
$4,226 |
 Credit Fundamentals Strengthening
29
* 2Q11 shown on a pro-forma basis to include bulk sale completed after
quarter-end 2.99%
3.52%
3.22%
2.37%
2.71%
2Q10
3Q10
4Q10
1Q11
2Q11
NCO’s Avg Loans
NPAs + 90 day Delinquencies
NPL Balances Paying Current as Agreed
NPAs + 90 Day Delinquencies/Loans + OREO
+ HFS
$4,887
$4,819
$4,503
$4,460
$3,860
2Q10
3Q10
4Q10
1Q11
2Q11*
5.63%
5.65%
5.38%
5.42%
4.72%
2Q10
3Q10
4Q10
1Q11
2Q11*
24%
36%
37%
38%
42%
2Q10
3Q10
4Q10
1Q11
2Q11 |
 Allowance Coverage Increasing
30
92%
94%
101%
103%
112%
2Q10
3Q10
4Q10
1Q11
2Q11
Allowance for Loan Losses to NPLs (excl HS)
Allowance for Loan Losses to Total Loans
3.71%
3.77%
3.84%
3.92%
3.84%
2Q10
3Q10
4Q10
1Q11
2Q11 |
 Conservative Marks and Reserves
Already Taken on Impaired Loans
31
Note1: Impaired loans include non-accrual commercial and investor real estate
loans, excluding leasing, and all TDRs (including accruing commercial, investor
real estate, and consumer TDRs)
Note 2: Book value represents the unpaid principal balance less charge-offs and
payments applied; it is shown before any allowance for loan losses. Note 3:
Unpaid principal balance represents the contractual obligation due from the customer and includes the net book value plus charge-offs and payments
applied.
Impaired Loans as of June 30, 2011
A
B
C = (A -
B)
D
E = (B + D) / A
($ in millions)
Unpaid
Principal
Balance
Charge-offs
and Payments
Applied
Total
Impaired
Loan Book
Value
Related
Allowance for
Loan Losses
Coverage %
Commercial and industrial
$
585
$
86
$
499
$
183
46.0%
Commercial
real
estate
mortgage
-
owner
occupied
841
121
720
194
37.5%
Commercial
real
estate
construction
-
owner
occupied
44
15
29
9
54.5%
Total commercial
1,470
222
1,248
386
41.4%
Commercial investor real estate mortgage
1,280
221
1,059
237
35.8%
Commercial investor real estate construction
531
126
405
105
43.5%
Total investor real estate
1,811
347
1,464
342
38.0%
Residential first mortgage
1,146
63
1,083
153
18.8%
Home equity
426
14
412
53
15.7%
Indirect
2
-
2
-
0.0%
Other consumer
61
-
61
1
1.6%
Total consumer
1,635
77
1,558
207
17.4%
Total impaired loans
$
4,916
$
646
$
4,270
935
32.2% |
 Adequately Reserved for Troubled Debt
Restructurings
32
June 30, 2011
Consumer loans make up 81% of accruing troubled debt restructurings
Foreclosure rate less than half of the industry average
Note: We expect TDRs to increase as a result of recent accounting literature that
will be effective 3Q11. There will be no material impact to our loan
loss allowance resulting from this rule change.
($ millions)
Loan
Allowance for
Allowance as a %
Balance
Credit Losses
of Loan Balance
Accruing:
Commercial
69
9
13%
Investor Real Estate
273
13
5%
Residential First Mortgage
876
123
14%
Home Equity
383
50
13%
Other Consumer
63
1
2%
Total Accruing
1,664
196
12%
Non-accrual or 90+ DPD:
Commercial
164
43
26%
Investor Real Estate
200
41
20%
Residential First Mortgage
207
29
14%
Home Equity
29
4
13%
Other Consumer
0
0
1%
Total Non-accrual or 90+DPD
600
117
19%
Total Troubled Debt Restructurings
2,264
313
14% |