Attached files
| file | filename |
|---|---|
| 8-K - FORM 8-K - QR Energy, LP | h84538e8vk.htm |
| EX-2.1 - EX-2.1 - QR Energy, LP | h84538exv2w1.htm |
| EX-99.1 - EX-99.1 - QR Energy, LP | h84538exv99w1.htm |
Exhibit 99.2

| QR Energy to Acquire $577 Million of Properties in Core Areas September 12, 2011 |

| Disclosures Forward-Looking Statements and Reserves Disclosures This presentation contains forward-looking statements relating to QR Energy's operations that are based on management's current expectations, estimates and projections about its operations. Words and phrases such as "expect," "estimates," "guidance," "opportunities," "potential," "may," "believe" and "target," references to future years, and variations of such words and similar expressions are intended to identify forward-looking statements. QR Energy believes that its expectations and forecasts are based on reasonable assumptions, however, no assurance can be given that such expectations and forecasts will prove to be correct. A number of risks and uncertainties, many of which are beyond our control, could cause actual results to differ materially from the expectations and forecasts, anticipated results and other forward-looking information expressed in this presentation, including risks relating to QR Energy's financial performance and results, availability of sufficient cash flow to execute our business plan, our level of indebtedness, a significant reduction in the borrowing base under our bank credit facility, our ability to raise capital, prices and demand for oil and natural gas, our ability to replace reserves and efficiently develop our current reserves, adverse market conditions, competition and governmental regulations. For a more complete list of these risks, please read QR Energy's filings with the Securities and Exchange Commission (the "SEC"), which are available on QR Energy's Investor Relations website at http://ir.qrenergylp.com or on the SEC's website at www.sec.gov. The reader should not place undue reliance on these forward-looking statements, which speak only as of the date of this presentation. Unless legally required, QR Energy undertakes no obligation to update publicly any forward-looking statements, whether as a result of new information, future events or otherwise. Unpredictable or unknown factors not discussed herein could also have material adverse effects on forward-looking statements. The SEC permits oil and gas companies, in their filings with the SEC, to disclose only "reserves" as defined by SEC rules. Estimates of reserves in this presentation are based on assumptions with regard to commodity prices (NYMEX spot oil and natural gas prices as of September 2, 2011) that differ from the prices required by the SEC (historical 12 month average) to be used in calculating reserves estimates prepared in accordance with SEC definitions and guidelines. In addition, the estimates of reserves in this presentation were prepared by our internal reserve engineers and are based on various assumptions, including assumptions related to oil and natural gas prices as discussed above, drilling and operating expenses, capital expenditures, taxes and availability of funds. Our internal estimates of proved reserves may not be indicative of or may differ materially from the estimates of our proved reserves as of December 31, 2011 that will be prepared by Miller & Lents, Ltd. as a result of the SEC pricing and other assumptions employed by an independent reserve engineering firm. |

| Transaction expected to be immediately accretive to Distributable Cash Flow per unit Expected to provide path for increases to distribution and Distribution Coverage Ratio Acquisition Summary Acquisition of a portion of remaining assets from sponsor Quantum Resources Funds ("QRF") for total consideration of $577 million $15.55 per Boe of proved reserves1 $72,125 per Boed production Financed with $350 million of equity and $227 million of bank debt2 37.1 MMBoe of proved reserves located in core areas - Permian Basin, Ark-La-Tex and Mid-Continent Proved reserves are 65% proved developed and 41% liquids Key operating areas include Overton & Gladewater (Ark-La-Tex) and Pegasus & Turner-Gregory (Permian Basin) 8,000 Boed production expected in 4Q11 Expected to close on or around October 1, 20113 Timing Financial Impact Asset Overview Transaction Summary 1 Reserves as of 10/1/2011, per internal estimates using spot oil and natural gas prices as of 9/2/2011 ($86.48/Bbl and $3.87/MMBtu) held flat. 2 Debt subject to lender approval. 3 Subject to third party approvals and customary closing conditions. |

| Strategic Rationale Transaction fits strategy of growth through acquisitions of mature, longer life properties Provides strategic scale for operations by more than doubling reserves and production Properties complement existing asset base Substantially expands portfolio of identified development opportunities Immediately accretive to Distributable Cash Flow per unit Provides potential for QRE to increase distributions to unitholders while also increasing Distribution Coverage Ratio |

| Assets to be Acquired Permian Basin 48% of Proved Reserves (17.7 MMBoe) 58% of 4Q11 Est. Net Production (4,607 Boed); 57% Liquids Reserve Life: 10.5 years Mid-Continent 10% of Est. Proved Reserves (3.6 MMBoe) 10% of 4Q11 Est. Net Production (812 Boed); 49% Liquids Reserve Life: 12.1 years Ark-La-Tex 42% of Est. Proved Reserves (15.8 MMBoe) 32% of 4Q11 Est. Net Production (2,581 Boed); 11% Liquids Reserve Life: 16.8 years Proved Reserves (MMBoe) 37.1 4Q11 Estimated Net Production (Boed) 8,000 Proved Developed 65% Liquids (Reserves) 41% Liquids (Production) 41% Proved Reserve Life 12.7 Note: Reserves as of 10/1/2011, per internal estimates using spot oil and natural gas prices as of 9/2/2011 ($86.48/Bbl and $3.87/MMBtu) held flat. |

| Permian Basin Acquisition Area Summary Overview Key fields: Pegasus, Turner-Gregory, Deep Rock Acreage: 56,018 gross / 36,605 net Total proved reserves: 17.7MMBoe1 Estimated 4Q11 net production: 4,607 Boed Productive wellcount: 846 gross / 598 net Percent operated (value): 51% Production by Commodity, Reserves by Category 17.7 MMBoe1 68% Liquids (Reserves) 4,607 Boed Deep Rock Turner- Gregory Pegasus Liquids 57% Natural Gas 43% PDP 73% PNP 2% PUD 25% 1 Reserves as of 10/1/2011, per internal estimates using spot oil and natural gas prices as of 9/2/2011 ($86.48/Bbl and $3.87/MMBtu) held flat. |

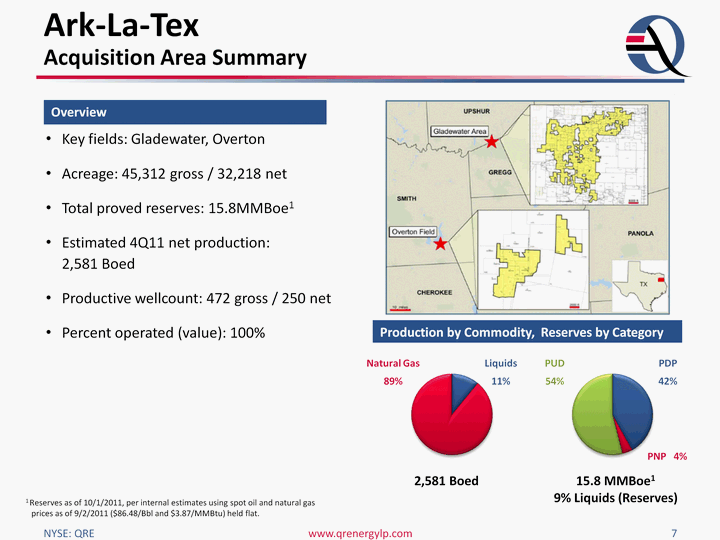
| Ark-La-Tex Acquisition Area Summary 2,581 Boed Production by Commodity, Reserves by Category 15.8 MMBoe1 9% Liquids (Reserves) Liquids 11% Natural Gas 89% Key fields: Gladewater, Overton Acreage: 45,312 gross / 32,218 net Total proved reserves: 15.8MMBoe1 Estimated 4Q11 net production: 2,581 Boed Productive wellcount: 472 gross / 250 net Percent operated (value): 100% PDP 42% PNP 4% PUD 54% Overview 1 Reserves as of 10/1/2011, per internal estimates using spot oil and natural gas prices as of 9/2/2011 ($86.48/Bbl and $3.87/MMBtu) held flat. |

| Pro Forma Assets Permian Basin 53% of Est. Proved Reserves (35.3 MMBoe) 52% of 4Q11 Est. Net Production (6,947 Boed); 66% Liquids Reserve Life: 13.9 years Mid-Continent 9% of Est. Proved Reserves (6.3 MMBoe) 11% of 4Q11 Est. Net Production (1,441 Boed); 45% Liquids Reserve Life: 12.0 years Ark-La-Tex 36% of Est. Proved Reserves (23.9 MMBoe) 33% of 4Q11 Est. Net Production (4,419 Boed); 22% Liquids Reserve Life: 14.8 years Gulf Coast 2% of Est. Proved Reserves (1.5 MMBoe) 4% of 4Q11 Est. Net Production (493 Boed); 73% Liquids Reserve Life: 8.3 years Proved Reserves (MMBoe) 67.0 4Q11 Estimated Net Production (Boed)13,300 Proved Developed 67% Liquids (Reserves) 53% Liquids (Production) 50% Proved Reserve Life 13.8 Note: Reserves as of 10/1/2011, per internal estimates using spot oil and natural gas prices as of 9/2/2011 ($86.48/Bbl and $3.87/MMBtu) held flat. Production assumes midpoint of 4Q11 guidance range. |

| Pro Forma Liquidity and Ownership $ millions CurrentQRE Drop-DownTransaction Pro FormaQRE Total Debt1 $266 $234 $500 Preferred Equity - $350 $350 Common and Subordinated Equity2 $615 - $615 Total Capitalization $881 $584 $1,465 Borrowing Base Credit Capacity3 $330 $300 $630 Available Liquidity3 $64 $66 $130 SponsorOwnership of QRE Equity 52% 100%4 67% 1 Additional borrowings subject to lender approval. Drop-down transaction debt includes approximately $7 million of estimated transaction fees. 2 Equity market value based on 9/9/11 closing price of $17.13 per unit. 3 Borrowing base credit capacity increase and resulting available liquidity subject to lender approval. 4 Sponsor to own 100% of Class C Convertible Preferred Units |

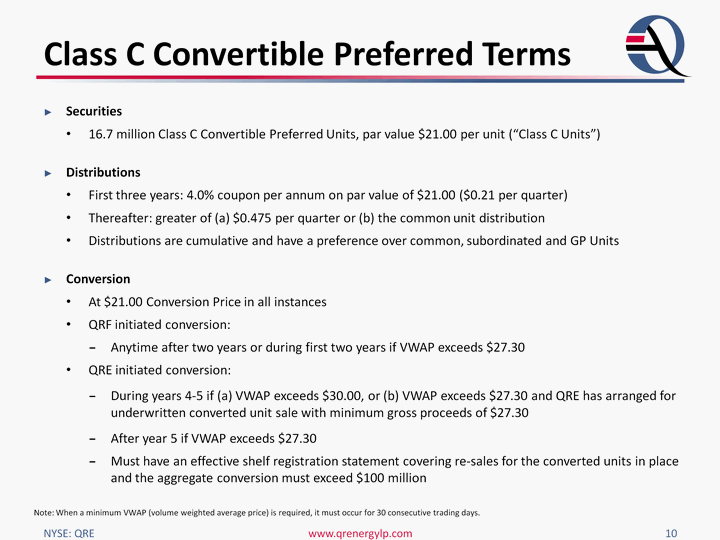
| Class C Convertible Preferred Terms Securities 16.7 million Class C Convertible Preferred Units, par value $21.00 per unit ("Class C Units") Distributions First three years: 4.0% coupon per annum on par value of $21.00 ($0.21 per quarter) Thereafter: greater of (a) $0.475 per quarter or (b) the common unit distribution Distributions are cumulative and have a preference over common, subordinated and GP Units Conversion At $21.00 Conversion Price in all instances QRF initiated conversion: Anytime after two years or during first two years if VWAP exceeds $27.30 QRE initiated conversion: During years 4-5 if (a) VWAP exceeds $30.00, or (b) VWAP exceeds $27.30 and QRE has arranged for underwritten converted unit sale with minimum gross proceeds of $27.30 After year 5 if VWAP exceeds $27.30 Must have an effective shelf registration statement covering re-sales for the converted units in place and the aggregate conversion must exceed $100 million Note: When a minimum VWAP (volume weighted average price) is required, it must occur for 30 consecutive trading days. |

| Assuming flat 4Q11 pro forma production estimate midpoint (13,300 Boed) through 2015, QR Energy has the following percentages of oil and natural gas volumes hedged: Average Hedge Prices $5.78 $5.91 $6.10 $5.13 $97.24 $98.72 $98.23 $95.39 $6.15 $96.91 Note: Includes all current QRE hedges and hedges to be novated to QRE by QRF as part of the transaction. NGL production not hedged; excluded from total. Natural gas production volume multiplied by Btu factor of 1.026x, as natural gas hedge contracts are in MMBtus. Average hedge prices take into account floor prices of oil and natural gas collars. Pro Forma Hedge Portfolio |

| Fourth Quarter 2011 Guidance Guidance 4Q11 Average Net Daily Production (Boed) 13,200 - 13,400 LOE per Boe $11.50 - $12.50 Maintenance Capital Expenditures ($ millions) $12.5 Note: Guidance based upon current estimates and assumes the completion on October 1, 2011 of the acquisition described herein. |

| Summary Transaction fits strategy of growth through acquisitions of mature, longer life properties Provides strategic scale for operations by more than doubling reserves and production Properties complement existing asset base Substantially expands portfolio of identified development opportunities Immediately accretive to Distributable Cash Flow per unit Provides potential for QRE to increase distributions to unitholders while also increasing Distribution Coverage Ratio |

| Contacts Taylor B. Miele Investor Relations Specialist 713-452-2990 Cedric W. Burgher Chief Financial Officer 713-452-2200 |
