Attached files
| file | filename |
|---|---|
| EX-99.1 - EX-99.1 - HCA Healthcare, Inc. | d231012dex991.htm |
| 8-K - FORM 8-K - HCA Healthcare, Inc. | d231012d8k.htm |
 Second Quarter
2011 Review September 12, 2011
Exhibit 99.2 |
 1
Forward Looking Statements
This presentation may contain certain forward-looking statements provided by Company
management. These statements are intended to be covered by the safe-harbor provisions
of the Private Securities Litigation Reform Act of 1995. Forward-looking statements
include all statements that do not relate solely to historical or current facts,
including statements regarding future operations, financial results and projections, cash flows,
costs and cost management initiatives, capital structure management, growth rates, market
share, and operational and strategic initiatives, compliance efforts and results of
compliance audits, and future impact of changes in Medicare case mix index, and can also
be identified by the use of words like “may,” “believe,” “will,” “expect,” “project,” “estimate,”
“anticipate,” “intend,” “plan,” “initiative,”
“continue” or words or phrases of similar meaning. These forward- looking
statements speak only as of the date hereof and are based on our current plans and expectations and are
subject to a number of known and unknown uncertainties and risks, many of which are beyond our
control. These risks and uncertainties are described in headings such as “Risk
Factors” in our annual report on Form 10-K for the year ended December 31, 2010,
and other reports filed with the Securities and Exchange Commission. As a consequence,
current plans, anticipated actions and future financial position and results of operations may differ
significantly from those expressed in any forward-looking statements in today’s
presentation. You are cautioned not to unduly rely on such forward-looking statements
when evaluating the information presented and we do not intend to update any of these
forward-looking statements.
The presentation may contain certain non-GAAP financial measures. The Company’s
earnings release for the quarter and six months ended June 30, 2011, located on the
Company’s investor relations page at www.hcahealthcare.com, includes a
reconciliation of the difference between certain non-GAAP financial measures with the
most directly comparable financial measure calculated in accordance with GAAP. These non-GAAP
financial measures should not be considered an alternative to the GAAP financial
measures. References to
“Company” used herein refer to HCA Holdings, Inc. and its affiliates, unless otherwise stated or
indicated by context.
|
 2
Introduction
•
Purpose of this presentation is to summarize the supplemental analysis
performed and findings reached on our second quarter
•
Medicare revenue growth in second quarter fell short of expectations and
was inconsistent with historical trends
•
Medicare revenue declined in second quarter due to several factors,
including a decline in Medicare case mix index (CMI)
•
Based on information available to us at this time, including this analysis and
preliminary results for July and August, we are confirming 2011 guidance of 3
to 5% growth in adjusted EBITDA for the full year, assuming we substantially
meet HITECH reimbursement parameters |
 3
2011
Annual
Medicare
IPPS
Updates
3.4%
(4Q’06)
3.3%
3.6%
1.9%
(0.55%)
2007
2008
2009
2010
$93
$50
$67
$116
$154
$145
$115
$126
$127
$191
$190
$141
$111
$112
$71
$131
$147
($4)
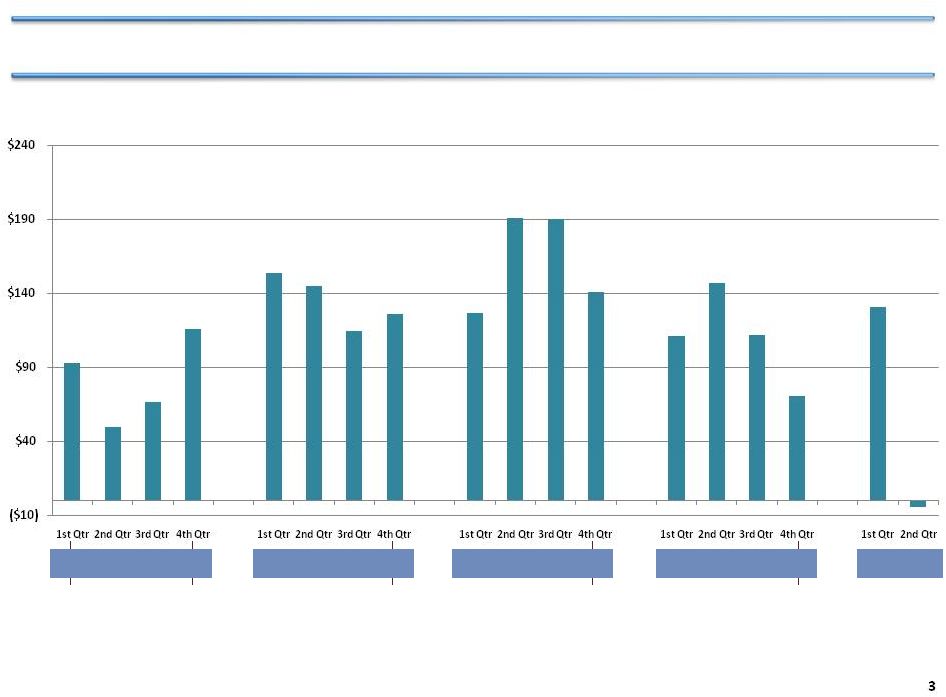
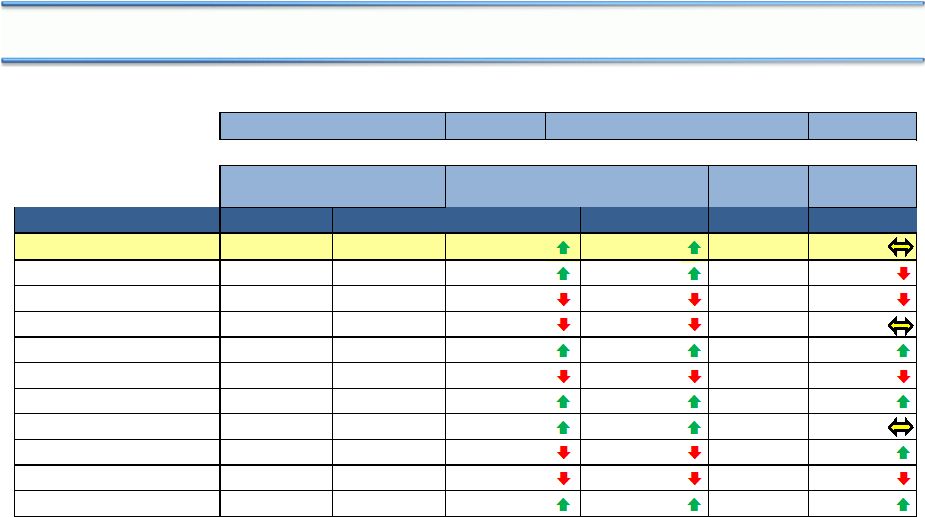
Medicare revenue growth in 2
nd
Quarter 2011 declined unexpectedly
Medicare (Traditional & Managed) Revenue Growth, numbers show year over year change Consolidated
Domestic Ops Same Facility - Hospital Only, Inpatient and Outpatient ($ in millions) |
 Traditional Medicare
Managed Medicare
4
Medicare case mix decline in 2
Quarter 2011 was unexpected
Trend of Medicare CMI
1.4000
1.4500
1.5000
1.5500
1.6000
1.6500
1.7000
2007
2008
2009
2010
2011
nd |
 5
Additional analysis of Q2 included three major areas
•
Data Integrity Review
•
Regulatory and Past Period Adjustments Review
•
Case Mix Review |
 6
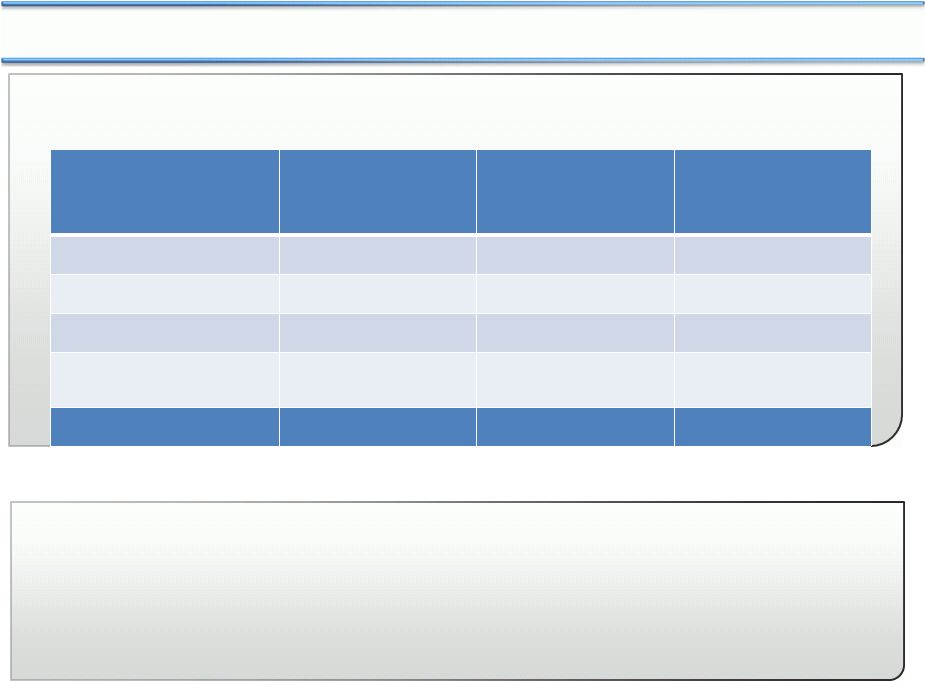
Supplemental data integrity review disclosed no issues
Findings
Analysis
HCA has a robust compliance effort in all areas of compliance risk, including
DRG coding
•
No changes in coding process,
and no significant differences
in historical coding results
•
Confirmed data flow operated
correctly
•
DRG coding audit conducted,
with independent review, of
both shared services and
hospital DRG coding
•
Reviewed systems that involve
flow of data from coding to
billing
|
 7
Regulatory
changes
&
prior
year
cost
reports
and
claims
affected
Medicare
revenue
Analysis
•
•
•
•
Regulatory changes include the
72 hour
rule
(effective
6/30/10),
with adverse impact of $21
million in Q2 (no year over year
impact going forward); and CT scan
reimbursement
(effective
1/1/11) with adverse impact of
$7 million in Q2 (similar impact
anticipated in Q3 and Q4)
Findings
Prior year cost report and
claims revenue was $18 million
less in 2Q/2011 compared with
2Q/2010 (smaller expected
impact in Q3 and Q4)
Reviewed prior year cost report
and claims results
Reviewed impact of regulatory
changes |
 8
Extensive review of Medicare case mix conducted
•
CMI analysis by DRG type --
identified DRGs and facilities that appeared to account for
primary CMI shifts
•
Surveyed facilities for root cause of change and outlook
•
Tested impact of CMS grouper changes implemented on October 1, 2010
|
 9
Decline in Medicare case mix resulted in $28 million adverse impact
Implications for Q3 and Q4
•
Downward pressure on CMI
likely to continue, driven by
falling surgical volume
•
Difficult to predict future
medical case mix
•
Grouper change not expected
to have material impact
•
Shift in volume from
surgical to medical,
primarily in cardiovascular
service line
•
CMI decline within medical
cases, especially pulmonary
•
New CMS grouper, effective
October 2010
Drivers of CMI decline |
 Austin -2.9%
Chattanooga -2.9%
North Central Florida -2.3%
San Antonio -2.3%
Northeast -2.2%
Panhandle West -1.9%
Utah -1.8%
Richmond -1.7%
Southwest VA -1.6%
El Paso -0.8%
Las Vegas -0.5%
Northwest Georgia -0.5%
Denver 0.1%
Dallas Ft. Worth 0.0%
Northwest 0.4%
(incl. Anchorage)
Orlando 0.6%
Valley 1.2%
Central Louisiana 1.7%
Houston 2.0%
Other Georgia 2.1%
Atlanta 3.4%
Tampa 1.3%
Southern California 4.1%
Northern Virginia 4.5%
Lafayette
4.9%
Wichita 5.5%
Oklahoma -9.1%
New Orleans -8.4%
Charleston -6.5%
Miami/Ft. Lauderdale
-3.7%
Middle Georgia -5.0%
Jacksonville -4.5%
Nashville -4.0%
San Jose -3.9%
Myrtle Beach -3.7%
Other North Florida -3.6%
Corpus Christi -3.6%
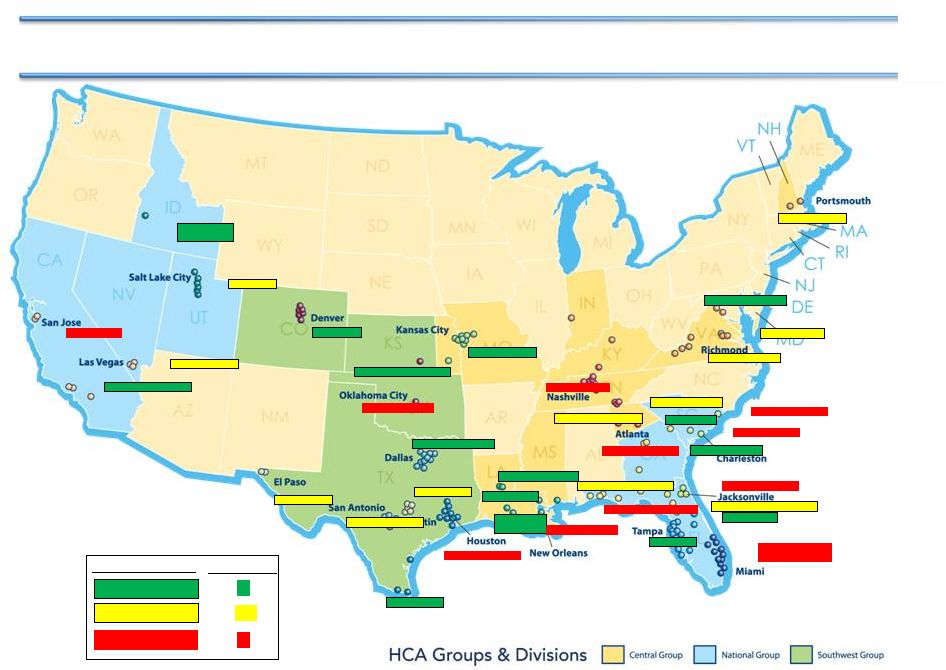
-0.1% to -2.9%
5.5 % to 0.0%
-3.0% to -9.1%
12
15
11
Markets -
38
Range of % Change
No geographical pattern to the decline in Medicare case mix in Q2
Kansas City 0.3%
10
Percent Change from Prior Year
Same Facility |
 11
Losses in Medicare IP cardiovascular
surgical cases were partially offset by gains in medical
cases across multiple service lines
HCA change in number of Medicare cases
(Q2 2011 to Q2 2010)
-504
0
80
33
10
-59
93
0
-1
0
109
-769
Surgical
Total
Medicine
Neuro
Oncology
Urology
OB-GYN
Orthopedics
Gastro
Other
Pulmonary
Surgery
Cardiovascular
4,588
2,103
814
219
419
55
66
260
63
49
540
Medical
n/a
Increase
Decrease
1
2
1
3 |
 12
Medicare
IP
cardiovascuar
1
surgical
cases
drove
a
decline
in
CMI
HCA change in number of Medicare cases
(Q2 2011 to Q2 2010)
0
Surgical
Other
33
Pulmonary
Surgery
109
Cardiovascular
-769
Medical
444
49
n/a
540
% of negative
CMI change
CMI Impact
Change
Drivers of CMI Impact Change:
•
Changes in cardiovascular
account for 50% of the
decline in Medicare CMI
Impact Change
•
Surgery’s negative impact
on Medicare CMI due to
fewer mechanical
ventilation cases (26
cases) which have high
weight
-1.09%
50%
-0.59%
27%
-0.31%
14%
-0.19%
9%
Total IP cardiovascular
1
surgical declined by 1,156 for all payers, with Medicare
accounting for two-thirds (769 cases) of the decline
Increase
Decrease
Sum of negative changes resulting in
net Medicare CMI change of 1.2%
-2.18%
2
3
1 Includes inpatient EP, interventional, cardiothoracic surgery, valve, and vascular surgeries
and procedures; interventional cases included in “Surgical” category
2 Surgery includes ENT, ophthalmology, and general surgery
3 Major components of “Other” includes transplant, gastro, ortho, OB/GYN,
neonatology, rehab, behavioral health, and alcohol/drug |
 13
•
Overall demand for cardiovascular services has been declining about 3% per year for
several years
•
Appears to be an acceleration of this negative trend nationally that impacted HCA
markets in Q2 2011
•
In HCA, 20 hospitals across 10 divisions contributed to the majority of declines. The
primary reasons for decline were:
Physician attrition
Competitor investments, such as starting a new program
Medical management
Generally weaker demand
Cardiovascular declines were driven by several factors |
 14
90
80
100
95
85
HCA
hospitals
Non-HCA
hospitals
Change
in
HCA
and
non-HCA
IP
cardiovascular
surgical
case
volume
1,2
,
all payers
’08-10
CAGR
(%)
2008
Q1
Q2
Q3
Q4
2009
Q1
Q2
Q3
Q4
2010
Q1
Q2
Q3
Q4
HCA cardiovascular IP
surgical market share:
26.7%
27.0%
27.0%
HCA has had slight growth in its share of inpatient cardiovascular surgical case volume
’08-10 share
change
~0.3%
~0%
Annual share change:
0
-2.3%
-3.2%
0.3%
1
Includes inpatient EP, interventional, cardiothoracic surgery, valve, and vascular surgeries
and procedures 2
HCA defines 29 markets based on county service areas. Analysis excluded Kansas City, Denver
and San Jose markets due to incomplete data; also excluded Augusta and N.
Virginia due to low patient volumes (<100 patients/quarter). Remaining 24 markets were used to compare HCA vs. non-HCA hospital evolution in CV IP surgical
volume
SOURCE: Intellimed |
 Total Market
Discharges 4,975,899
HCA Share
Service Line
Market
HCA
Total
All SLs
4,975,899
1,193,717
0.4%
0.3%
24.0%
0.0%
Medicine
863,436
204,873
4.7%
3.6%
23.7%
(0.3%)
Women's
833,216
193,634
(4.0%)
(4.5%)
23.2%
(0.1%)
Cardiology/Cardiovascular
642,064
169,285
(3.1%)
(3.1%)
26.4%
0.0%
Neurosciences
366,760
90,604
1.4%
1.8%
24.7%
0.1%
Gen Surgery
388,670
86,680
(1.1%)
(1.6%)
22.3%
(0.1%)
Orthopedics
307,546
74,921
2.4%
3.1%
24.4%
0.2%
Behavioral
285,172
61,102
6.0%
5.9%
21.4%
0.0%
Oncology
114,781
23,249
(1.4%)
(0.9%)
20.3%
0.1%
Neonatology
100,891
22,391
(1.7%)
(2.1%)
22.2%
(0.1%)
All Other SLs
1,073,363
266,978
1.5%
2.2%
24.9%
0.2%
Market
HCA
Total
Total HCA Discharges
1,193,717
Discharges
Growth
(Over Prior 12 months)
HCA Point
Trend
15
Note 1: Statistics are based on data for the most recently available 24 month period
from 143 HCA facilities in 29 defined markets. Market shares differ from
Slide 14 because of different groupings of cases included in overall categories.
Note 2: Analysis includes data from 10 markets through Q1 ’11, 16 through Q4
’10, 1 through Q3 ’10, 1 through Q2 ’10 (KC), and 1 market through Q4
’09 (San Jose). Note 3: Source = State data via Intellimed.
Overall market share for HCA is stable with some service line variation
|
 16
Conclusion
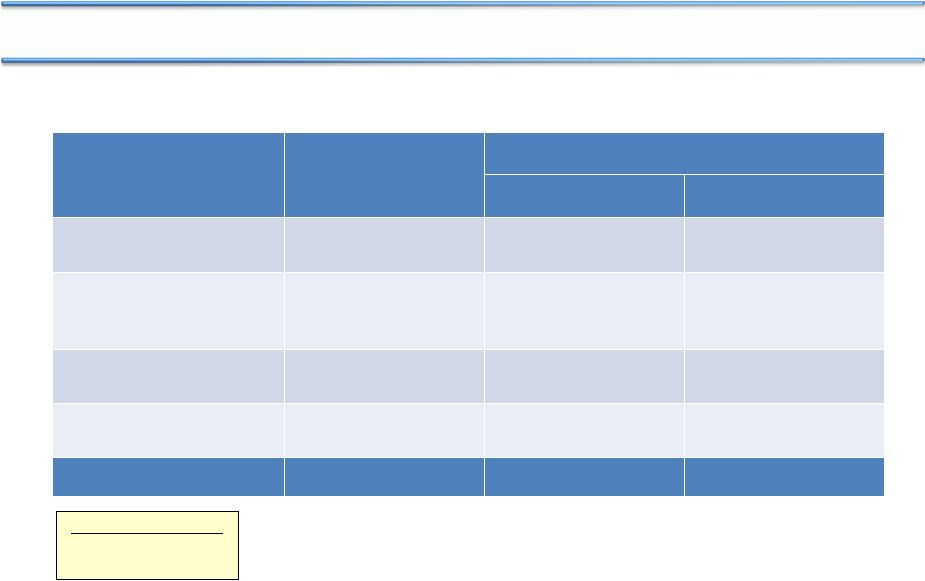
1 Based upon decline in actual CMI change from expected CMI change
•
Relevant HCA actions are being implemented, both as to revenue opportunities and
expense control
•
Based on information available to us at this time, including this analysis and
preliminary results for July and August, we are confirming 2011 guidance of 3 to 5%
growth in adjusted EBITDA for the full year, assuming we substantially meet HITECH
reimbursement parameters
•
Medicare revenue decline in second quarter due to several factors (numbers show year
over year change, Q2 2011 to Q2 2010) and estimates of future impact refer to Q3 and
Q4 2011:
Issue
May impact future
quarters, in whole
or part
Unlikely to impact
future quarters
Not expected to
impact future
quarters
Case Mix
1
$25 Million
$3 Million
72 hour rule
$21 Million
CT Scans
$7 Million
Prior year cost reports &
claims
$5 Million
$13 Million
TOTAL
$37 Million
$16 Million
$21 Million |
 Transaction
Run Rate Annual
Interest
Savings/(Costs)
Estimated EPS Impact
2011
1
2012
2
Extended $3.0B Bank Term
Loans (May)
($36 mm)
($0.03)
($0.04)
Called all $1.0B of 2014 and
$108mm
of
2017
2
lien
notes (June) ³
$90 mm
$0.06
$0.10
Extended $4.5B of interest
rate swaps (2009-2011)
4
$190 mm
$0.03
$0.21
Refinanced $4.8B of 2016
2 lien notes (August)
$114 mm
$0.01
$0.13
TOTAL
$358 mm
$0.07
$0.40
1
Excludes losses on retirement of debt
2
Assumes effective tax rate of 38% and estimated diluted shares of 550 million
3
Funded out of revolving credit facilities
4
Commencing 11/17/11 when $7.1B of higher rate swaps expire
5
Excludes acquisition of HealthONE JV partnership interest
17
Debt/Adjusted EBITDA
12/31/2010A
4.8x
12/31/2011P
4.0x
5
One further topic:
Recent debt refinancings provide financial flexibility and enhance earnings
nd
nd |