Attached files
| file | filename |
|---|---|
| 8-K - FORM 8-K - FIRST NIAGARA FINANCIAL GROUP INC | c22359e8vk.htm |
Exhibit 99.1

| The Differentiated Choice Barclays Capital Global Financial Services Conference September 13, 2011 John R. Koelmel President & Chief Executive Officer Gregory W. Norwood Chief Financial Officer |

| Safe Harbor Statement This presentation contains forward-looking information for First Niagara Financial Group, Inc. Such information constitutes forward-looking statements (within the meaning of the Private Securities Litigation Reform Act of 1995) which involve significant risks and uncertainties. Actual results may differ materially from the results discussed in these forward-looking statements. |

| First Niagara The Differentiated Choice in the Banking Sector The Differentiated Choice in the Banking Sector The Differentiated Choice in the Banking Sector The Differentiated Choice in the Banking Sector The Differentiated Choice in the Banking Sector The Differentiated Choice in the Banking Sector The Differentiated Choice in the Banking Sector The Differentiated Choice in the Banking Sector THE DIFFERENTIATED CHOICE |

| First Niagara We're a growth organization 1 Operating net income is a non-GAAP measure and excludes the merger and integration costs related to the acquisitions of 57 NatCity branches in September 2009 , Harleysville National Corporation in April 2010, NewAlliance Bancshares, Inc. in April 2011 and other non-operating items. Annual Operating Earnings1 (CHART) (CHART) Annual Revenue |

| First Niagara Winning with talent - leaders with market experience Daniel Plis Retail Sales Manager 27 yrs Experience Joined from M&T Bank Joseph Tedesco Retail Sales Manager 25 yrs Experience Joined from Wells Fargo |

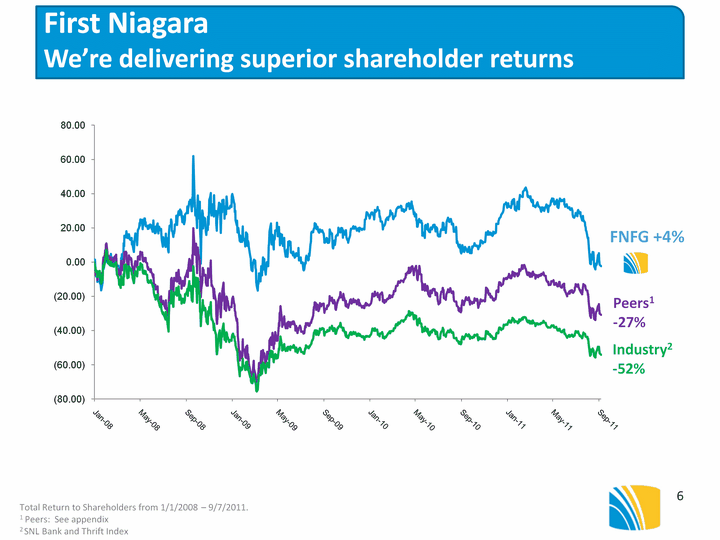
| First Niagara We're delivering superior shareholder returns Total Return to Shareholders from 1/1/2008 - 9/7/2011. 1 Peers: See appendix 2 SNL Bank and Thrift Index FNFG +4% Peers1 -27% Industry2 -52% (CHART) |

| First Niagara - The Differentiated Choice A Growth Organization |

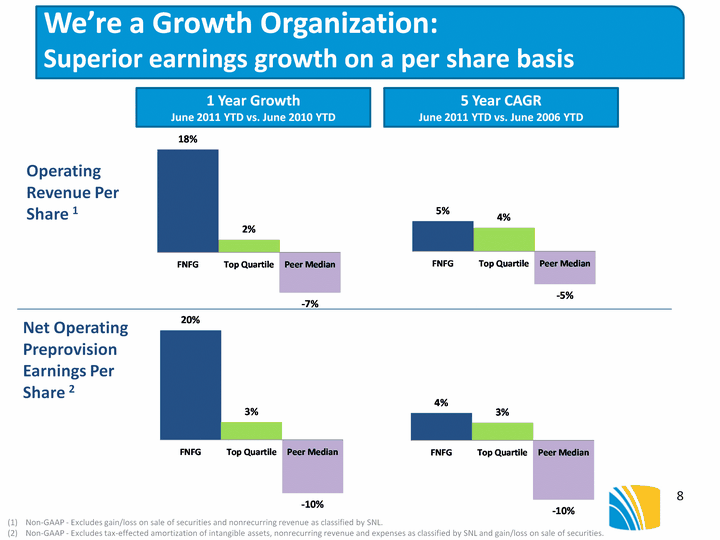
| We're a Growth Organization: Superior earnings growth on a per share basis Operating Revenue Per Share 1 Net Operating Preprovision Earnings Per Share 2 1 Year Growth June 2011 YTD vs. June 2010 YTD 5 Year CAGR June 2011 YTD vs. June 2006 YTD Non-GAAP - Excludes gain/loss on sale of securities and nonrecurring revenue as classified by SNL. Non-GAAP - Excludes tax-effected amortization of intangible assets, nonrecurring revenue and expenses as classified by SNL and gain/loss on sale of securities. |

| We're a Growth Organization: Best in class organic loan growth Outperforming the best of our peers Empowering regional leaders to drive growth Selecting quality, profitable clients within the bank's high underwriting standards Year-over-Year Organic Loan Growth Note: Peer growth rates normalized for major bank acquisitions. |

| We're a Growth Organization: Organic loan growth across our footprint * WPA loans exclude $43M and $280M in Capital Markets multi-regional balances at 6/30/10 and 6/30/11, respectively. Eastern PA Upstate NY Western PA* Capital Markets - Multi Region Total Loan Balances $ millions |

| $2,047 $2,327 6/30/10 6/30/11 $5,464 $5,988 6/30/10 6/30/11 $2,214 $2,283 6/30/10 6/30/11 We're a Growth Organization: Consistent core deposit growth * Core deposits include savings, interest bearing checking, money market and noninterest bearing deposits. Eastern PA Upstate NY Western PA Core Deposit Balances $ millions +3% YOY +10% YOY +14% YOY |

| First Niagara - The Differentiated Choice Winning with Talent |

| Winning with Talent Experienced leaders, scalable for growth Team is built with scalable strengths - leadership and capacity for the future Leadership team has an average of 30 years of experience Organizational development is a priority, with a focus on leadership acceleration programs Leaders bring prior experience from Bank of America, JPMorgan Chase, Citibank, Wells Fargo, PNC, National City, M&T, DTCC, etc. along with numerous organizations outside the financial services industry |

| First Niagara - The Differentiated Choice Delivering Superior Shareholder Returns |

| We're Delivering Superior Shareholder Returns Balance sheet evolution improves risk/reward profile Evolution to a commercial bank balance sheet New loans are underwritten to stringent commercial bank standards 45% of loan portfolio is acquired and marked to market 6/30/11 12/31/06 Loan Portfolio |

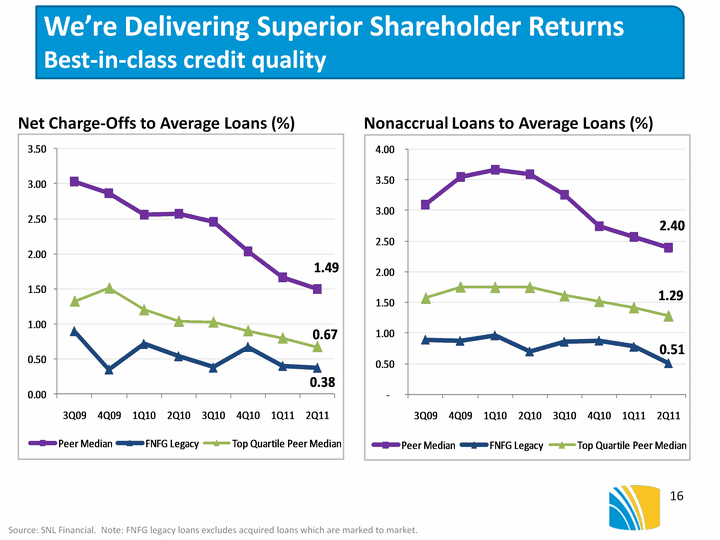
| We're Delivering Superior Shareholder Returns Best-in-class credit quality Net Charge-Offs to Average Loans (%) Nonaccrual Loans to Average Loans (%) Source: SNL Financial. Note: FNFG legacy loans excludes acquired loans which are marked to market. |

| We're Delivering Superior Shareholder Returns High Grade Securities Portfolio 6/30/11 Securities Portfolio Composition 12/31/06 Market Value $1B AAA % 99% Risk-Weighting 20% Market Value $11B AAA % 99% Risk-Weighting 15% Market Value $14B AAA % 97% Risk-Weighting 21% (CHART) (CHART) Pro Forma for HSBC acquisition |

| 6249 LRA We're Delivering Superior Shareholder Returns Significantly improved funding profile Significantly improved funding profile Significantly improved funding profile Cost of Funds(1) 0.75% Total Deposits $19B Total Borrowings $8B Cost of Funds(1) 0.52% Total Deposits $30B Total Borrowings $3B 6/30/11 Pro Forma for HSBC acquisition HSBC acquisition HSBC acquisition Funding Profile 12/31/06 Cost of Funds(1) 2.87% Total Deposits $6B Total Borrowings $748M (CHART) 1. Calculated using weighted average cost of funding for deposits and borrowings as of most recent quarter. |

| We're Delivering Superior Shareholder Returns Returns outperform the sector, continue to accelerate Operating Return on Average Tangible Common Equity Operating Return on Average Tangible Assets Source: SNL Financial. Note: Operating return excludes tax-effected amortization of intangible assets and nonrecurring revenue and expenses as classified by SNL. |

| We're Delivering Superior Shareholder Returns Low risk profile and low earnings volatility drives outperformance Source: SNL Financial. Volatility defined as the standard deviation of the year-over-year change in earnings for the first six months of each year 2006-2011. Earnings exclude tax effected intangible amortization and non recurring revenue and expenses. Quartiles reflect 15 banks in peer group plus First Niagara and are determined from earnings volatility ranking. |

| First Niagara The Differentiated Choice in the Banking Sector The Differentiated Choice in the Banking Sector The Differentiated Choice in the Banking Sector The Differentiated Choice in the Banking Sector The Differentiated Choice in the Banking Sector The Differentiated Choice in the Banking Sector The Differentiated Choice in the Banking Sector The Differentiated Choice in the Banking Sector THE DIFFERENTIATED CHOICE |

| Appendix |

| The Company believes that non-GAAP financial measures provide a meaningful comparison of the underlying operational performance of the Company, and facilitate investors' assessments of business and performance trends in comparison to others in the financial services industry. Operating net income excludes (all amounts are after-tax): 2011 Q2: Noninterest expense: Acquisition, integration and restructuring expenses of $57.6 million. Q1: Noninterest expense: Acquisition, integration and restructuring expenses of $4.9 million. 2010 ( Beginning in Q2 2010, the impact of income taxes on these non-operating items was calculated using the effective tax rate for the quarter) Q4: Noninterest expense: Acquisition related expenses of $3.8 million. Q3: Noninterest expense: Acquisition related expenses of $1.3 million. Q2: Noninterest expense: Harleysville acquisition related expenses of $ 18.8 million, $5.6 million charitable contribution related to the acquired markets and severance and related costs of $0.5 million. Q1: Noninterest expense: Harleysville National Corporation acquisition related expenses of $3.7 million. 2009 Q4: Noninterest expense: Harleysville National Corporation acquisition related expenses of $2.4 million. Q3: Noninterest income: Gain on the sale of the merchant services' customer list of $1.5 million. Noninterest expense: Expenses of $14.9 million primarily related to the National City branch acquisition and merger with Harleysville National Corporation. Also, a $3.0 million contribution to the First Niagara Bank Foundation in support of charitable giving in Western Pennsylvania. Q2: Noninterest expense: FDIC special assessment charge of $3.3 million based on each insured depository institution's assets less Tier 1 Capital. Also, expenses related to the National City branch acquisition of $1.4 million. Q1: Noninterest expense: Settlement of service mark infringement matter of $1.8 million and professional service fees related to the National City branch acquisition of $1.0 million. 2008 Q1: Noninterest expense: Real estate write-downs and severance related to the acquisition of Greater Buffalo Savings Bank of $1.4 million. (millions) 2010 2009 2008 2Q11 1Q11 4Q10 3Q10 2Q10 1Q10 4Q09 3Q09 Reported (GAAP) Net Income $140.4 $79.4 $88.4 $13.6 $44.9 $45.9 $45.6 $20.0 $28.9 $28.9 $10.9 Operating (Non GAAP) Net Income $174.1 $105.6 $89.8 $71.2 $49.8 $49.7 $46.9 $44.9 $32.6 $31.3 $27.3 FNFG: Notes to Operating Results Reported (GAAP) Net Income and Operating (Non-GAAP) Net Income 23 |

| Peer Group for Benchmarking 24 |

| The Differentiated Choice Barclays Capital Global Financial Services Conference September 13, 2011 John R. Koelmel President & Chief Executive Officer Gregory W. Norwood Chief Financial Officer |
