Attached files
| file | filename |
|---|---|
| 8-K - FORM 8-K - ZAYO GROUP LLC | c22276e8vk.htm |
| EX-99.1 - EXHIBIT 99.1 - ZAYO GROUP LLC | c22276exv99w1.htm |
Exhibit 99.2

| Fiscal Year 4Q 2011 Supplemental Earnings Information FY 2Q 2011 Supplemental Earnings InformationFY 4Q 2011 Supplemental Earnings Information 1 |

| Forward-Looking Statements Information contained in this supplemental presentation -looking statements” which can that is identified by the use of forward-looking terminology such as “believes,” “could,” “expects,” “should,” or “anticipates” or the negatives thereof, strategy. No assuranceother can be given that future results expressed or implied by the forward-looking statements will be achieved and actua l results may differ materially from those contemplated by the forward-looking statements. Such statements are liefs and arebased subject to a number of risks and uncertainties that could cause actual results to differ materially from those expressed or implied by the forward-looking statements. These risks and uncertainties include, and operating prospects,but current economic trends, future opportunities, ability sition strategy andto retain ability to integrate acquired companies and assets, outlook of c ustomers, reception of new products and technologies, and strength of competition and pricing. Other factors and risks that may affect our business and future financial results are detailed in our Annual Report on Form 10-K Item 1A: “Risk Factors.” We caution you not -looking statements, which speak only as of their respective dates. Weto place undue reliance on undertake no obligation to publicly update or revise forward-looking statements to reflect events or circumstances after releasing t his supplemental information or to reflect the occurrence of unanticipated events, except as required by law. The following presentation should be read together with our audited Consolidated financial statements and the related notes appearing in the Company’s Annual -K. Report on Form 10FY 4Q 2011 Supplemental Earnings Information 2 |
| Non-GAAP Financial Measures The Company provides financial measures that are not defined under generally accepted accounting principles in the United States, or GAAP, including earnings before interest, taxes, depreciation EBITDA are notand measurements of our financial performance under GAAP and should not be considered in isolation or as alternatives to net income or any other performance measures derived in accordance with GAAP or as alternatives to cash flo ws from operating activities as measures of our liquidity. “Adjusted EBITDA” is defined as EBITDA adjusted -based compensation, and certain non- to exclude cash items. Management uses EBITDA and Adjusted EBITDA to evaluate operating performance and liquidity and these financial measures are among the primary measures used by management for planning and forecasting of future periods. The Company believes Adjusted EBITDA is especially important in a capital-intensive industry such as telecommunicati ons. The Company further believes that the presentation of EBITDA and Adjusted EBITDA is relevant and useful for investors because it allows investors to view results in a manner similar to the method used by management and makes it easier to compare our results with the results of other companies that have different financing and capital structures. EBITDA and Adjusted EBITDA have limitations as analytical tools, and should not be considered in isolation from, or as substitutes for, analysis of our results as reported under GAAP. For example, Adjusted EBITDA: does not reflect capital expenditures, or future requirements for capital and major maintenance expenditures or contractual commitments; does not reflect changes in, or cash requirements for, our working capital needs; does not reflect the significant interest expense, or the cash requirements necessary to service the interest payments, on our debt; and does not reflect cash required to pay income taxes The Company’s computation of Adjusted EBITDA may not be nies, because all companies do not calculate Adjusted EBITDA in the same fashion.Because the Company has acquired numerous entities since inception and incurred transaction costs in connection with each acquisition, has borrowed money in order to finance operations, has used capital and intangible assets in the business, and because the payment of income taxes is necessary if taxable income is generated, any measure that excludes these items has material limitations. As a result of these limitati ons, EBITDA and Adjusted EBITDA should not be considered as measures of discretionary cash available to invest in the growth of the business or as measures of liquidity. In addition to Adjusted EBITDA, management uses Unlevered Free Cash Flow, which measures the ability of Adjusted EBITDA to cover capital expenditures. Over the next two fiscal years, we expect that the level of our investment will be closely correlated to the amount of Adjusted EBITDA we generate. Adjusted EBITDA is a performance, rather th an cash flow measure. Correlating our capital expenditures to our Adjusted EBITDA does not imply that we will be able to fund such capital expenditures solely with cash from operations. Gross profit, defined as revenue less operating costs, excluding depreciation and amortization, is used by management to assess profitability prior to selling, general and administrative expenses, stock-based compensation and depreciation and amortization. The Company also provides invested capital and the ratio of invested capital to Adjusted EBITDA. Management uses invested capital and the invested capital ratio to assess value creation in the business. Tables reconciling such non-GAAP measures are included beginning on page 45 of this presentation. A glossary of terms used throughout is available under the investor section http://www.zayo.com/investor-center.of the Company’s website at FY 4Q 2011 Supplemental Earnings Information 3 |

| Presentation of Certain Consolidated Pro-forma Financial Data Acquisitions have been, and are expected to continue In this Supplementalto be, Earnings Informationcomponent under “Consolidated ro-forma Financial Data,” the Company sets forth its pro-forma annualized revenue growth rate and pro-forma annualizedPAdjusted EBITDA growth rates for the two fiscal quarters in which the Company has completed its most recent acquisitions. These pro-forma measur es are intended to provide additional information regarding such rates of growth on a more comparable basis than would be provided without such pro-forma adjustments. Specifically, with regard to its two most recent acquisitions, AGL Networks and American Fiber SystemsAFS”), (“AGL”) the Company has calculated its pro-forma annualized revenue growth rate and pro-forma annualized Adjusted EBITDA growth rates in the respective fiscal quarters ended September 30, 2010, and December 31, 2010, by adjusting the actual operating results as if both AGL and AFS acquisitions occurred on April 1, 2010.In making such adjustments, the Company made certain pro-forma adjustments to the revenue and Adjusted EBITDA, which principally include an adjustment related to the fair value of the acquired deferred revenue balance, but do not include cost savings and other synergies that were only realized following completion of Reconciliations.” the acquisition. See The Company provided the pro-forma annualized revenue growth rate and pro-forma annualized Adjusted EBITDA growth rate only for the respective fiscal quarters ended September 30, 2010, and December 31, 2010, and only on the slide entitled “Consolidated Pro-forma Financial Data.” The Company provided the pro-forma annualized revenue growth rate and pro-forma annualized Adjusted EBITDA growth rate for the respective fiscal quarters ended June 30, 2010, September 30, 2010, December 31, 2010, and March 31 , 2011 on the entitled: Zayo Bandwidth Financial Data; ZFS Financial Data; and zColo Financial Data. FY 4Q 2011 Supplemental Earnings Information 4 |
| Other Notes Operating Measures This earnings supplement contains operating measures used by the Company in managing the business. Management believes that providing this information enables analysts, investors and others to d to evaluate theobtain a efficacy of the methodology and information used by management to evaluate and measure such performance on a standalone and comparative basis. Certain supplemental information provided and related definitions may no t be directly comparable to similarly titled items reported by other companies. Further, the Company may, from time to time, revise the calculation or presentation of certain operating measures. Certain operating measures, such as sales (bookings), network expense, installation and churn processed, included intercompany items for the three months ended June 30, 2010. The intercompany items were not material and have been eliminated in subsequent periods. For the three months ended December 31, 201 0, the Company began reporting Monthly Amortized Revenue (MAR) in addition to Monthly Recurring Revenue (MRR) as a component of the sales (bookings), installations, churn processed, pipeline and contract value operating measures. Previously reported periods were not revised to include MAR. For the three months ended March 31, 2011 the Company changed the payback period calculation to include non-recurring network expense.Payback period is defined as the period of time (measured in months) in which the gross profit for a gross new sale is equivalent to the estimated capital expenditures and non-recurring network expense less non-recurring revenue related to gross new sale booking. The payback period is an approximation of the return on a gross new sale booking and does not include sales costs, allocation of indirect operating expenses, depreciation and amortization, or any cost of capital. Prior periods were not revised. The company changed the treatment of Ethernet upgrades in the three months ended June 30, 2011. When a customer increases the amount of Mbs. at the same location, only the net increase in revenue is counted as gross new sales (bookings) and gross installations. In prior periods, the full value of the install and full value of the churn were reported. Prior periods were not revised. Revisions Certain prior period operating measures have been revised to reflect corrections or reclassifications of data. These revisions are not material and have no impact on the Company’ ;s reported financials. Estimates Certain operating measures presented herein are based on estimates. The measures are noted as estimates where presented and include: (1) estimated gross profit on gross new sales (bookings); (2) estimated capital expenditures associated with gross new sales (bookings); (3) estimated payback period on gross new sales (bookings )(calculated); (4) estimated commitments of speculative capital expenditures; and (5) estimated timing of service activation pipeline conversion. The operating measures for the period ended March 31, 2011 exclude ZEN. Periods prior to March 31, 2011 include ZEN and have not been revised to exclude ZEN as management has determined it is impractical to do so. Rounding Components may not sum due to rounding. 5 FY 4Q 2011 Supplemental Earnings Information |
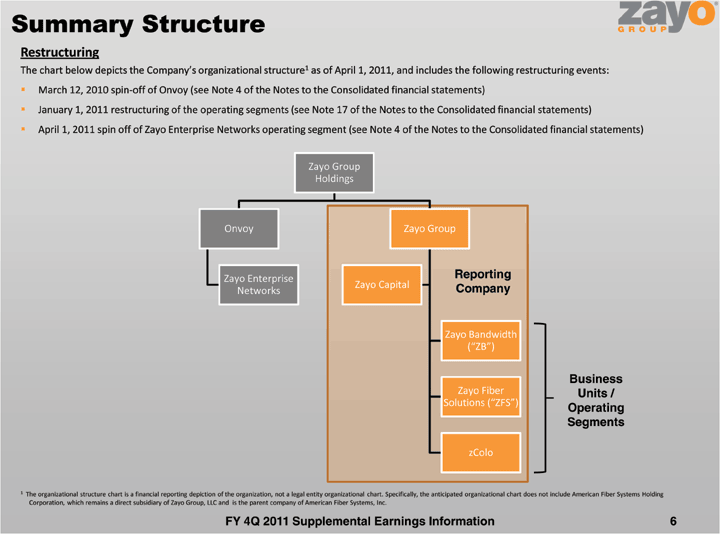
| Summary Structure Restructuring The chart below depicts the 1 as of April 1, 2011, and includes the following restructuring events:Company’s organizational structure March 12, 2010 spin-off of Onvoy (see Note 4 of the Notes to the Consolidated financial statements) January 1, 2011 restructuring of the operating segments (see Note 17 of the Notes to the Consolidated financial statements) April 1, 2011 spin off of Zayo Enterprise Networks operating segment (see Note 4 of the Notes to the Consolidated financial statements) Zayo Group Holdings Onvoy Zayo Group Zayo Enterprise Reporting Zayo Capital Company Networks Zayo Bandwidth (“ZB”) Business Zayo Fiber Units / Solutions (“ZFS”) Operating Segments zColo 1 The organizational structure chart is a financial reporting depiction of the organization, not a legal entity organizational chart. Specifically, the anticipated organizational chart does not include American Fiber Systems Holding Corporation, which remains a direct subsidiary of Zayo Group, LLC and is the parent company of American Fiber Systems, Inc. FY 4Q 2011 Supplemental Earnings Information 6 |
| Reporting Impacts of Restructuring The spin-off and associated restructuring of our operating segments (as more fully described in our Annual Report filed on Form 10-K with the SEC) impact the supplemental reporting and comparability of prior periods March 12, 2010 spin-off of Onvoy The Company determined that the services provided by Onvoy did ion and interconnection business model and spun-off Onvoy to Zayo Group Holdings The results of the Onvoy operati ons have been aggregated perations, net of incomea taxes” in our Consolidated financial statements and in theJanuary 1, 2011 restructuring of the operating segments In order to more closely align product offerings to operating segments, the ZEN segment transferred its bandwidth infrastructure products to the ZB and ZFS segments and its colocation products to the zCOLO legacy managed services and CLEC product offerings The segment reporting note to the Consolidated financial statements and the fina ncial data presented herein have been restated to account for the restructuring of the ZEN segment April 1, 2011 spin off of Zayo Enterprise Networks operating segment The Company determined that the services provided by the restructured ZEN did not fit within the Company’s and interconnection business model and spun-off ZEN to Zayo Group Holdings The results of the Onvoy operations have been aggregated perations, net of incomea taxes” in our Consolidated financial statements and in theFY 4Q 2011 Supplemental Earnings Information 7 |
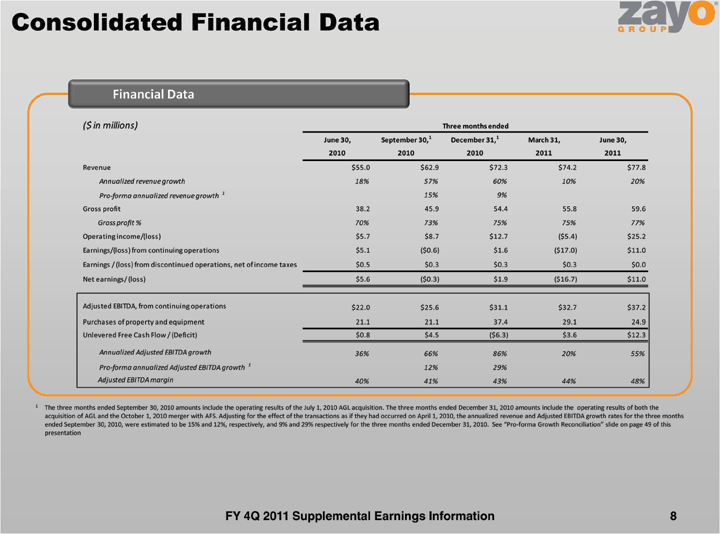
| Consolidated Financial Data Financial Data ($ in millions) Three months endedJune 30, September 30,1 December 31,1 March 31, June 30,2010 2010 2010 2011 2011Revenue $55.0 $62.9 $72.3 $74.2 $77.8 Annualized revenue growth 18% 57% 60% 10% 20%Pro-forma annualized revenue growth 1 15% 9%Gross profit 38.2 45.9 54.4 55.8 59.6 Gross profit % 70% 73% 75% 75% 77%Operating income/(loss) $5.7 $8.7 $12.7 ($5.4) $25.2 Earnings/(loss) from continuing operations $5.1 ($0.6) $1.6 ($17.0) $11.0 Earnings / (loss) from discontinued operations, net of income taxes $0.5 $0.3 $0.3 $0.3 $0.0 Net earnings/ (loss) $5.6 ($0.3) $1.9 ($16.7) $11.0 Adjusted EBITDA, from continuing operations $22.0 $25.6 $31.1 $32.7 $37.2 Purchases of property and equipment 21.1 21.1 37.4 29.1 24.9 Unlevered Free Cash Flow / (Deficit) $0.8 $4.5 ($6.3) $3.6 $12.3 Annualized Adjusted EBITDA growth 36% 66% 86% 20% 55% Pro-forma annualized Adjusted EBITDA growth 1 12% 29% Adjusted EB ITDA margin 40% 41% 43% 44% 48%1 The three months ended September 30, 2010 amounts include the operating results of the July 1, 2010 AGL acquisition. The three months ended December 31, 2010 amounts include the operating results of both the acquisition of AGL and the October 1, 2010 merger with AFS. Adjusting for the effect of the transactions as if they had occurred on April 1, 2010, the annualized revenue and Adjusted EBITDA growth rates for the three months ended September 3 0, 2010, were estimated to be 15% and 12%, respectively, and 9% and 29% respectively for the three months ended December 31, 2010. -forma Growth Reconciliation” See “Pro presentation FY 4Q 2011 Supplemental Earnings Information 8 |
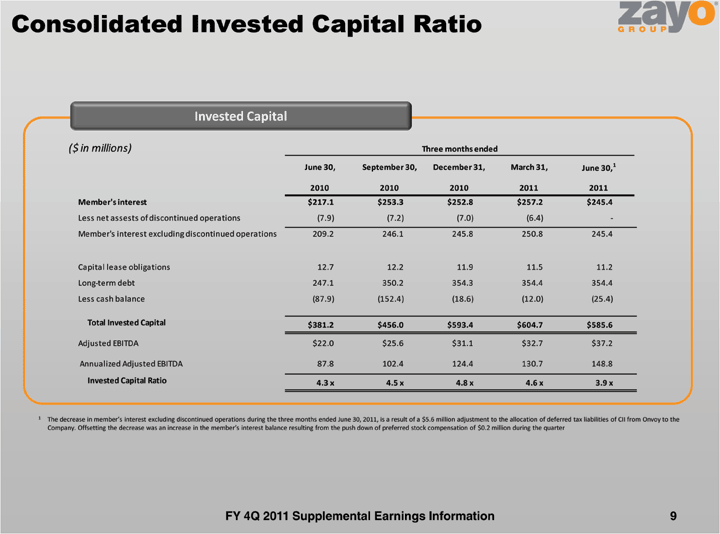
| Consolidated Invested Capital Ratio Invested Capital ($ in millions) Three months endedJune 30, September 30, December 31, March 31, June 30,12010 2010 2010 2011 2011 Member’s interest $217.1 $253.3 $252.8 $257.2 $245.4 Less net assests of discontinued operations (7.9) (7.2) (7.0) (6.4) -Member’s interest excluding discontinued operations 209.2 246.1 245.8 250.8 245.4 Capital lease obligations 12.7 12.2 11.9 11.5 11.2 Long-ter m debt 247.1 350.2 354.3 354.4 354.4 Less cash balance (87.9) (152.4) (18.6) (12.0) (25.4)Total Invested Capital $381.2 $456.0 $593.4 $604.7 $585.6 Adjusted EBITDA $22.0 $25.6 $31.1 $32.7 $37.2 Annualized Adjusted EBITDA 87.8 102.4 124.4 130.7 148.8 Invested Capital Ratio 4.3 x 4.5 x 4.8 x 4.6 x 3.9 x1 The decrease in member’s interest excluding discontinued $5.6 million adjustment to the allocation of deferred tax liabilities of CII from Onvoy to operations during the three months theendedCompany . Offsetting the decrease was an increase in the member’s interest $0.2 million during the quarterbalance resulting from the pushFY 4Q 2011 Supplemental Earnings Information 9 |
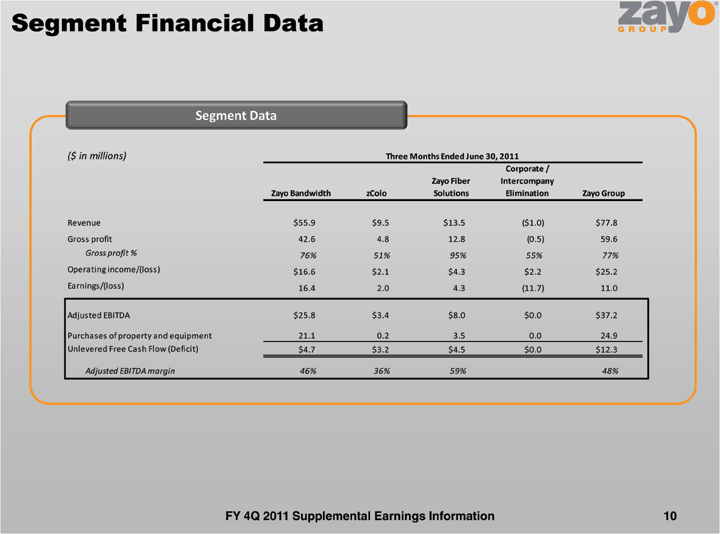
| Segment Financial Data Segment Data ($ in millions) Three Months Ended June 30, 2011 Corporate / Zayo Fiber Intercompany Zayo Bandwidth zColo Solutions Elimination Zayo GroupRevenue $55.9 $9.5 $13.5 ($1.0) $77.8Gross profit 42.6 4.8 12.8 (0.5) 59.6Gross profit % 76% 51% 95% 55% 77%Operating income/(loss) $16.6 $2.1 $4.3 $2.2 $25.2 Earnings/(loss) 16.4 2.0 4.3 (11.7) 11.0Adjusted EBITDA $25.8 $3.4 $8.0 $0.0 $37.2Purchases of property and equipment 21.1 0.2 3.5 0.0 24.9 Unlevered Free Cash Flow (Deficit) $4.7 $3.2 $4.5 $0.0 $12.3Adjusted EBITDA margin 46% 36% 59% 48%FY 4Q 2011 Supplemental Earnings Information 10 |
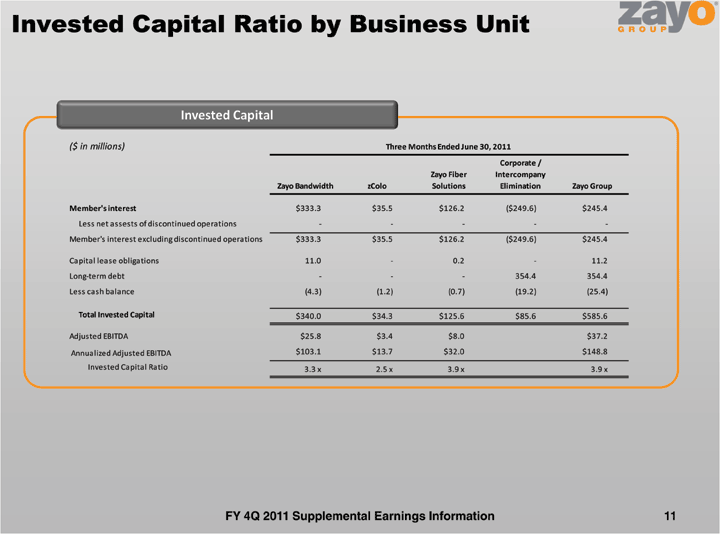
| Invested Capital Ratio by Business Unit Invested Capital ($ in millions) Three Months Ended June 30, 2011Corporate / Zayo Fiber Intercompany Zayo Bandwidth zColo Solutions Elimination Zayo GroupMember’s interest $333.3 $35.5 $126.2 ($249.6) $245.4 Less net assests of discontinued operations — — — — -Member’s interest excluding discontinued operations $333.3 $35.5 $126.2 ($249.6) $245.4 Capital lease obligations 11.0 — 0.2 — 11.2 Long-term debt — — — 354.4 354.4 Less cash balance (4.3) (1.2) (0.7) (19.2) (25.4)Total Invested Capital $340.0 $34.3 $125.6 $85.6 $585.6 Adjusted EBITDA $25.8 $3.4 $8.0 $37.2 Annualized Adj usted EBITDA $103.1 $13.7 $32.0 $148.8 Invested Capital Ratio 3.3 x 2.5 x 3.9 x 3.9 xFY 4Q 2011 Supplemental Earnings Information 11 |
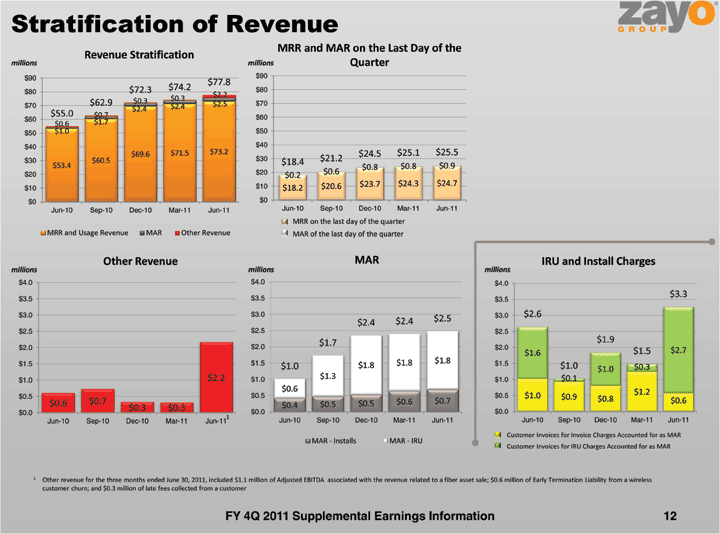
| Stratification of Revenue MRR and MAR on the Last Day of the Revenue Stratificationmillions millions Quarter$90$ 90$77.8 $72.3 $74.2 $80$80$ 2.2 $0.3 $0.3$70$ 62.9 $2.5 $70 $2.4 $2.4 $55.0 $0.7 $60$60 $1.7 $0.6$50$ 1.0 $50$40 $40 $69.6 $71.5 $73.2 $24.5 $25.1 $25.5$30 $60.5 $30 $18.4 $21.2 $53.4 $0.8 $0.8 $0.9$20$ 20 $0.6 $0.2$10$ 20.6 $23.7 $24.3 $24.7 $10$ 18.2 $0$ 0Jun-10 Sep-10 Dec-10 Mar-11 Jun-11 Jun-10 Sep-10 Dec-10 Mar-11 Jun-11MRR on the last day of the quarter MRR and Usage Revenue MAR Other Revenue MAR of the last day of the quarter Other Revenue MAR IRU and Install Charges millions millions millions $4.0 $4.0 $4.0$3.3$3.5 $3.5 $3.5 $3.0 $3.0 $3.0 $2.6$2.4 $2.5 $2.4$2.5 $2.5 $2.5$1.7 $1.9$2.0 $2.0 $2.0$1.6 $1.5 $2.7$1.5 $1.5 $1.8 $1.8 $1.5$1.0 $1.8 $1.0 $0.3 $1.0$2.2 $1.0 $1.3 $1.0 $0.1 $1.0$0.6 $1.2 $0.5 $0.5 $0.5 $1.0 $0.9 $0.7 $0.6 $0.7 $0.8 $0.6 $0.6 $0.4 $0.5 $0.5 $0.3 $0.3 $0.0 $0.0 $0.01 Jun-10 Sep-10 Dec-10 Mar-11 Jun-11 Jun-10 Sep-10 Dec-10 Mar-11 Jun-11 Jun-10 Sep-10 Dec-10 Mar-11 Jun-11Customer Invoices for Invoice Charges Accounted for as MAR MAR — Installs MAR — IRUCustomer Invoices for IRU Charges Accounted for as MAR 1 Other revenue for the three months ended June 30, 2011, included $1.1 million of Adjusted EBITDA associated with the revenue related to a fiber asset sale; $0.6 million of Early Termination Liability from a wireless customer churn; and $0.3 million of late fees collected from a customer FY 4Q 2011 Supplemental Earnings Information 12 |
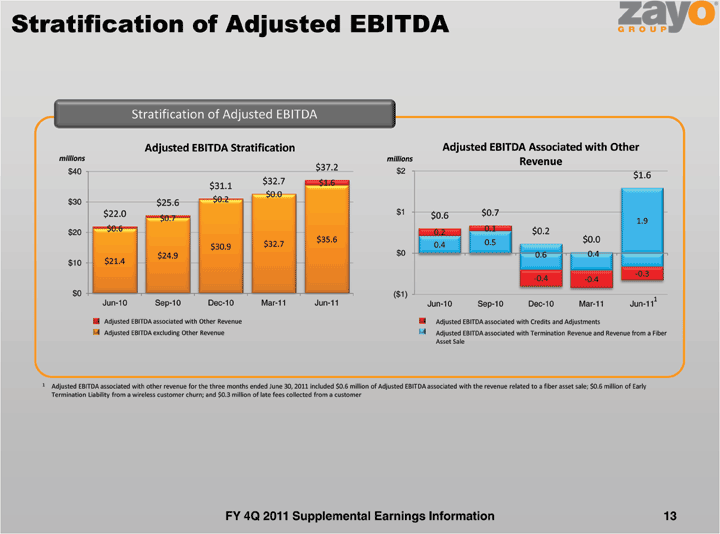
| Stratification of Adjusted EBITDA Stratification of Adjusted EBITDA Adjusted EBITDA Stratification Adjusted EBITDA Associated with Other millions millions Revenue $37.2 $2 $40 $1.6 $32.7 $1.6 $31.1 $0.0$30 $25.6 $0.2 $22.0 $1 $0.6 $0.7 $0.7 1.9 $0.6 0.1 $0.2 $20 0.2 $35.6 0.5 $0.0 $30.9 $32.7 0.4 $24.9 $0 0.6 0.4 $10$ 21.4 -0.3 -0.4 -0.4 $0 ($1)Jun-10 Sep-10 Dec-10 Mar-11 Jun-11 1 Jun-10 Sep-10 Dec-10 Mar-11 Jun-11Adjusted EBITDA associated with Other Revenue Adjusted EBITDA associated with Credits and Adjustments Adjusted EBITDA excluding Other Revenue Adjusted EBITDA associated with Termination Revenue and Revenue from a Fiber Asset Sale 1 Adjusted EBITDA associated with other revenue for the three months ended June 30, 2011 included $0.6 million of Adjusted EBITDA associated with the revenue related to a fiber asset sale; $0.6 million of Early Termination Liability from a wireless customer churn; and $0.3 million of late fees collected from a customer FY 4Q 2011 Supplemental Earnings Information 13 |
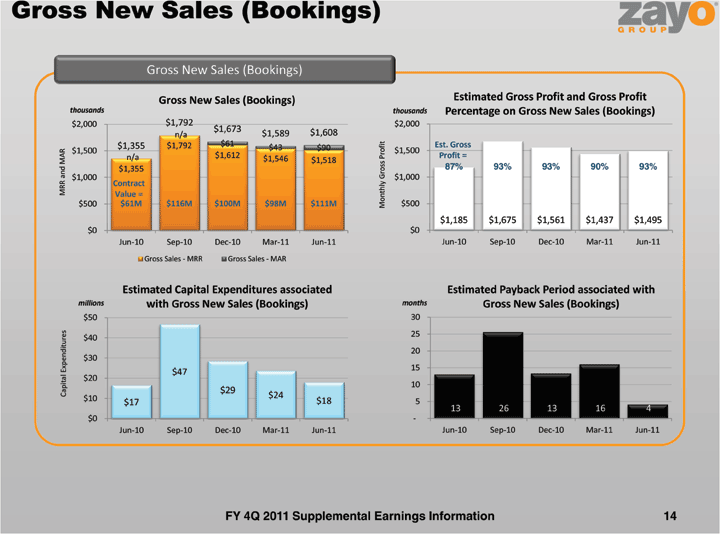
| Gross New Sales (Bookings) Gross New Sales (Bookings) Gross New Sales (Bookings) Estimated Gross Profit and Gross Profit thousands thousands Percentage on Gross New Sales (Bookings) $2,000 $1,792 $2,000 $1,673 $1,608 n/a $1,589 $1,355 $1,792 $61 Est. Gross $1,500 $43 $90 $1,500 n/a $1,612 Profit = $1,546 $1,518 $1,355 Gross Profit 87% 93% 93% 90% 93% $1,000 $1,000Contract MRR and MAR MonthlyValue = $500 $61M $116M $100M $98M $111M $500$1,185 $1,675 $1,561 $1,437 $1,495$0$ 0Jun-10 Sep-10 Dec-10 Mar-11 Jun-11 Jun-10 Sep-10 Dec-10 Mar-11 Jun-11Gross Sales — MRR Gross Sales — MAREstimated Capital Expenditures associated Estimated Payback Period associated with millions with Gross New Sales (Bookings) months Gross New Sales (Bookings) $50 30Expenditures 25 $40 20 $30 15 $47 $20 10Capital $29$10$ 24$17$ 18 513 26 13 16 4$0 -Jun-10 Sep-10 Dec-10 Mar-11 Jun-11 Jun-10 Sep-10 Dec-10 Mar-11 Jun-11FY 4Q 2011 Supplemental Earnings Information 14 |
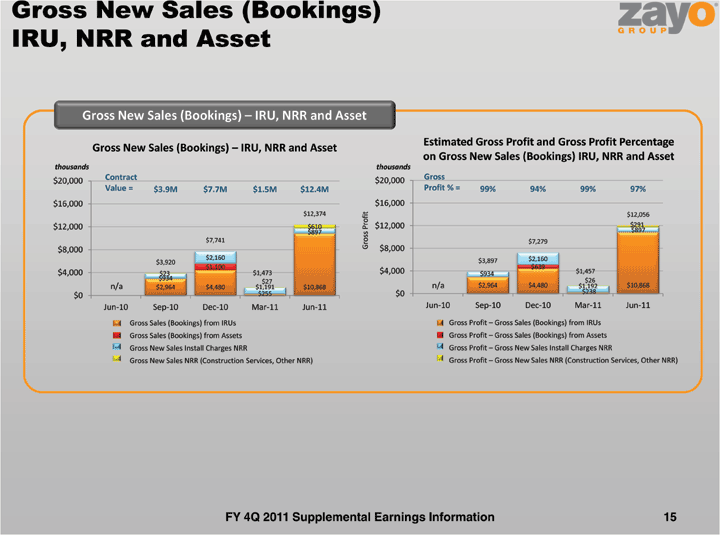
| IRU, NRR and Asset Gross New Sales (Bookings) — IRU, NRR and Asset Estimated Gross Profit and Gross Profit Percentage Gross New Sales (Bookings) — IRU, NRR and Asset on Gross New Sales (Bookings) IRU, NRR and Asset thousands thousands Contract Gross $20,000 $20,000Value = $3.9M $7.7M $1.5M $12.4M Profit % = 99% 94% 99% 97% $16,000 $16,000$12,374 $12,056$12,000 $610 $12,000 $291$897 $897 $7,741 Gross Profit $7,279 $8,000 $8,000$2,160 $2,160 $3,920 $3,897 $1,100 $639 $4,000 $23 $1,473 $4,000 $934 $1,457 $934 $26 $27 n/a $2,964 $4,480 $1,191 $10,868 n/a $2,964 $4,480 $1,192 $10,868 $255 $0 $238$0Jun-10 Sep-10 Dec-10 Mar-11 Jun-11 Jun-10 Sep-10 Dec-10 Mar-11 Jun-11Gross Sales (Bookings) from IRUs Gross Profit — Gross Sales (Bookings) from IRUs Gross Sales (Bookings) from Assets Gross Profit — Gross Sales (Bookings) from Assets Gross New Sales Install Charges NRR Gross Profit — Gross New Sales Install Charges NRR Gross New Sales NRR (Construction Services, Other NRR) Gross Profit — Gross New Sales NRR (Construction Services, Other NRR) FY 4Q 2011 Supplemental Earnings Information 15 |
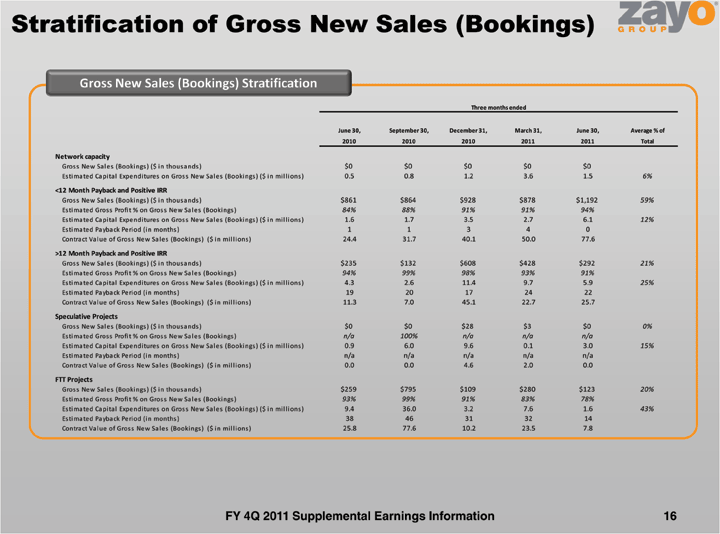
| Stratification of Gross New Sales (Bookings) Gross New Sales (Bookings) Stratification Three months endedJune 30, September 30, December 31, March 31, June 30,2010 2010 2010 2011 2011Network capacityGross New Sales (Bookings) ($ in thousands) $0 $0 $0 $0 $0 Estimated Capital Expenditures on Gross New Sales (Bookings) ($ in millions) 0.5 0.8 1.2 3.6 1.512 Month Payback and Positive IRRGross New Sales (Bookings) ($ in thousands) $861 $864 $928 $878 $1,192 Estimated Gross Profit % on Gross New Sales (Bookings) 84% 88% 91% 91% 94% Estimated Capital Expenditures on Gross New Sales (Bookings) ($ in millions) 1.6 1.7 3.5 2.7 6.1 Estimated Payback Period ( in months) 1 1 3 4 0 Contract Value of Gross New Sales (Bookings) ($ in millions) 24.4 31.7 40.1 50.0 77.612 Month Payback and Positive IRRGross New Sales (Bookings) ($ in thousands) $235 $132 $608 $428 $292 Estimated Gross Profit % on Gross New Sales (Bookings) 94% 99% 98% 93% 91% Estimated Capital Expenditures on Gross New Sales (Bookings) ($ in millions) 4.3 2.6 11.4 9.7 5.9 Estimated Payback Period (in months) 19 20 17 24 22 Contract Value of Gross New Sales (Bookings) ($ in millions) 11.3 7.0 45.1 22.7 25.7Speculative ProjectsGross New Sales (Bookings) ($ in thousands) $0 $0 $28 $3 $0 Estimated Gross Profit % on Gross New Sales (Bookings) n/a 100% n/a n/a n/a Estimated Capital Expenditures on Gross New Sales (Bookings) ($ in millions) 0.9 6.0 9.6 0.1 3.0 Estimated Payback Period (in months) n/a n/a n/a n/a n/a Contract Value of Gross New Sales (Bookings) ($ in millions) 0.0 0.0 4.6 2.0 0.0FTT ProjectsGross New Sales (Bookings) ($ in thousands) $259 $795 $109 $280 $123 Estimated Gross Profit % on Gross New Sales (Bookings) 93% 99% 91% 83% 78% Estimated Capital Expenditures on Gross New Sales (Bookings) ($ in millions) 9.4 36.0 3.2 7.6 1.6 Estimated Payback Period (in months) 38 46 31 32 14 Contract Value of Gross New Sales (Bookings) ($ in millions) 25.8 77.6 10.2 23.5 7.8FY 4Q 2011 Supplemental Earnings Infor mation 16 |
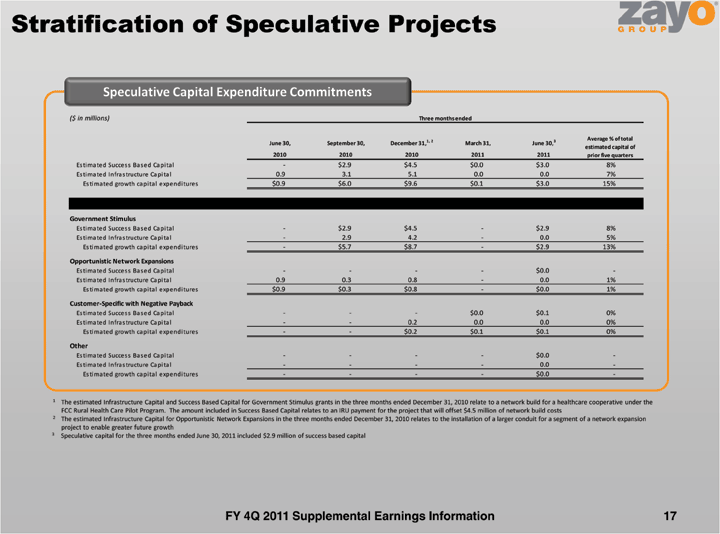
| Stratification of Speculative Projects Speculative Capital Expenditure Commitments ($ in millions) Three months endedJune 30, September 30, December 31, 1, 2 March 31, June 30, 32010 2010 2010 2011 2011 priorEstimated Success Based Capital — $2.9 $4.5 $0.0 $3.0 Estimated Infrastructure Capital 0.9 3.1 5.1 0.0 0.0 Estimated growth capital expenditures $0.9 $6.0 $9.6 $0.1 $3.0By Category:Government StimulusEstimated Success Based C apital — $2.9 $4.5 — $2.9 Estimated Infrastructure Capital — 2.9 4.2 — 0.0 Estimated growth capital expenditures — $5.7 $8.7 — $2.9Opportunistic Network ExpansionsEstimated Success Based Capital — — — — $0.0 Estimated Infrastructure Capital 0.9 0.3 0.8 — 0.0 Estimated growth capital expenditures $0.9 $0.3 $0.8 — $0.0Customer-Specific with Negative PaybackEstimated Success Based Capital — — — $0.0 $0.1 Es timated Infrastructure Capital — — 0.2 0.0 0.0 Estimated growth capital expenditures — — $0.2 $0.1 $0.1OtherEstimated Success Based Capital — — — — $0.0 Estimated Infrastructure Capital — — — — 0.0 Estimated growth capital expenditures — — — — $0.01 The estimated Infrastructure Capital and Success Based Capital for Government Stimulus grants in the three months ended December 31, 2010 relate to a network build for a healthcare cooperative under the FCC Rural Health Care Pilot Program. The amount included in Success Based Capital relates to an IRU payment for the project that will offset $4.5 million of network build costs 2 The estimated Infrastructure Capital for Opportunistic Network Expansions in the three months ended December 31, 2010 relates to the installation of a larger conduit for a segment of a network expansion project to enable greater future growth 3 Speculative capital for the three months ended June 30, 2011 included $2.9 million of success based capital FY 4Q 2011 Supplemental Earnings Information 17 |
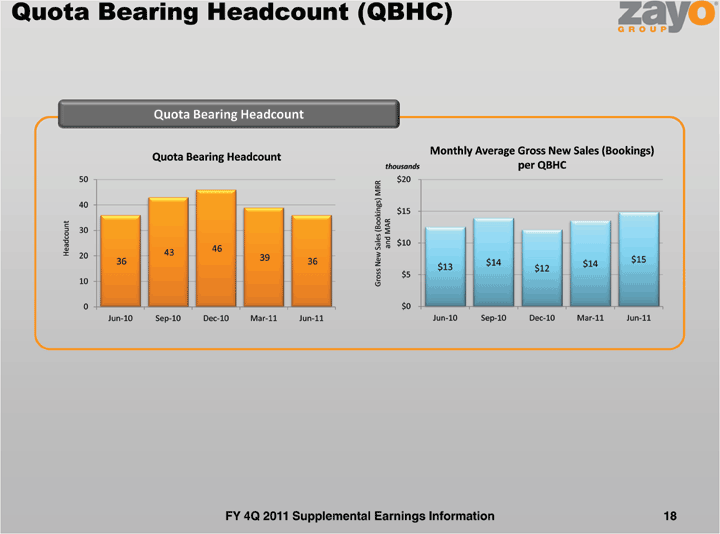
| Quota Bearing Headcount (QBHC) Quota Bearing Headcount Monthly Average Gross New Sales (Bookings) Quota Bearing Headcount per QBHC thousands 50 MRR $2040 (Bookings) $15Headcount 30 and MAR $10 4620 4339$ 15 36 36 $14 $14 $13 $12 $510 Gross New Sales 0$ 0Jun-10 Sep-10 Dec-10 Mar-11 Jun-11 Jun-10 Sep-10 Dec-10 Mar-11 Jun-11FY 4Q 2011 Supplemental Earnings Information 18 |
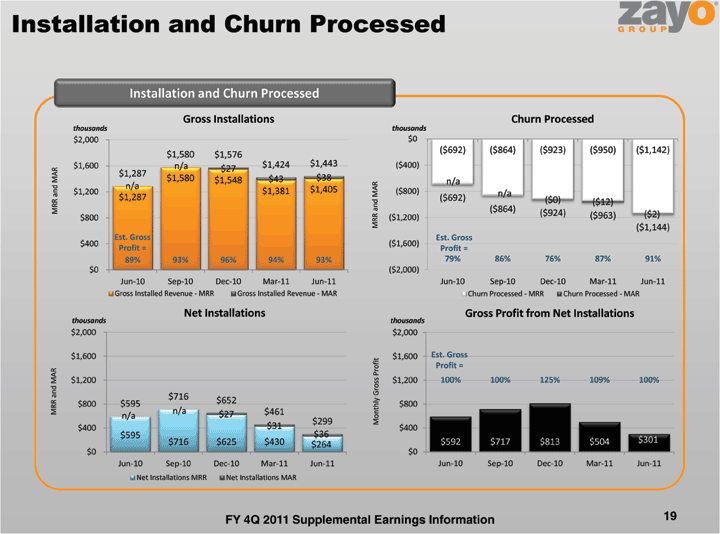
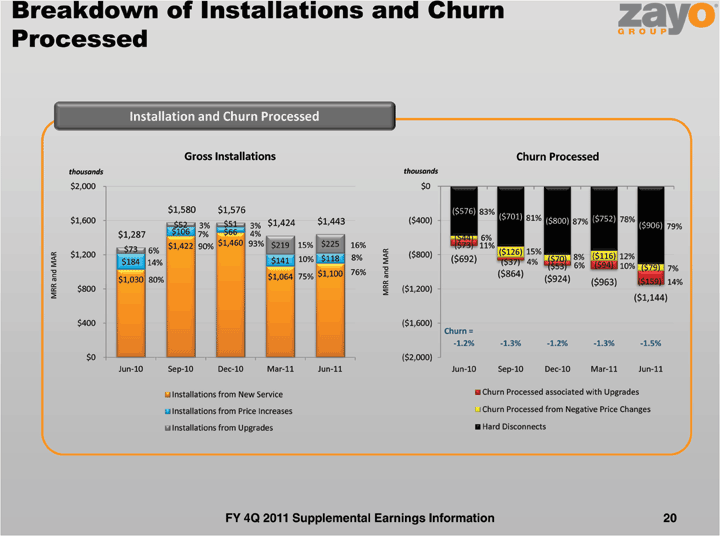
| Installation and Churn Processed Installation and Churn Processed Gross Installations Churn Processedthousands thousands $2,000 $0($692) ($864) ($923) ($950) ($1,142) $1,580 $1,576 $1,600 n/a $1,424 $1,443 ($400) $27 $1,287 $1,580 $1,548 $43 $38 n/a n/a $1,405 $1,200 $1,381 ($800) n/a $1,287 ($692) ($0) ($ 12) MRR and MAR ($864) ($924) ($963) ($2) $800 MRR and MAR ($1,200)($ 1,144) Est. Gross Est. Gross $400 ($1,600)Profit = Profit = 89% 93% 96% 94% 93% 79% 86% 76% 87% 91%$0 ($2,000)Jun-10 Sep-10 Dec-10 Mar-11 Jun-11 Jun-10 Sep-10 Dec-10 Mar-11 Jun-11Gross Installed Revenue — MRR Gross Installed Revenue — MAR Churn Processed — MRR Churn Processed — MARNet Installations Gross Profit from Net Installations thousands thousands $2,000 $2,000$1,600 $1,600 Est. Gross Profit = $1,200 Gross Profit $1,200 100% 100% 125% 109% 100% $716 $652 $800 $595 Monthly $800MRR and MAR n/a $27 $461 n/a $299 $400 $31 $400 $595 $36 $716 $625 $430 $592 $717 $813 $504 $301 $264$0$ 0Jun-10 Sep-10 Dec-10 Mar-11 Jun-11 Jun-10 Sep-10 Dec-10 Mar-11 Jun-11Net Installations MRR Net Installations MARFY 4Q 2011 Supplemental Earnings Information 19 |
| Processed Installation and Churn Processed Gross Installations Churn Processed thousands thousands $2,000 $0 $1,580 $1,576 ($576) 83% ($701) 81% ($752) 78% $1,600 $1,424 $1,443 ($400) ($800) 87% $52 3% $51 3% ($906) 79% $1,287 $106 7% $66 4% ($44) 6% $1,422 $1,460 93% $219 15% $225 16% ($73) 11% $73 90% 6% ($126) 15% $1,200 8% ($800) 8% ($116) 12% $184 $141 10% $118 ($692) 4% ($70) 14% ($37) ($94) ($53) 6% 10% ($79) 7% $1,100 76% ($864) $1,030 $1,064 75% ($924) 80% ($963) ($159) 14% MRR and MAR $800 MRR and MAR ($1,200)($ 1,144) $400 ($1,600)Churn =-1.2% -1.3% -1.2% -1.3% -1.5%$0 ($2,000)Jun-10 Sep-10 Dec-10 Mar-11 Jun-11 Jun-10 Sep-10 Dec-10 Mar-11 Jun-11Installations from New Service Churn Processed associated with Upgrades Installations from Price Increases Churn Processed from Negative Price Changes Installations from Upgrades Hard DisconnectsFY 4Q 2011 Supplemental Earnings Information 20 |
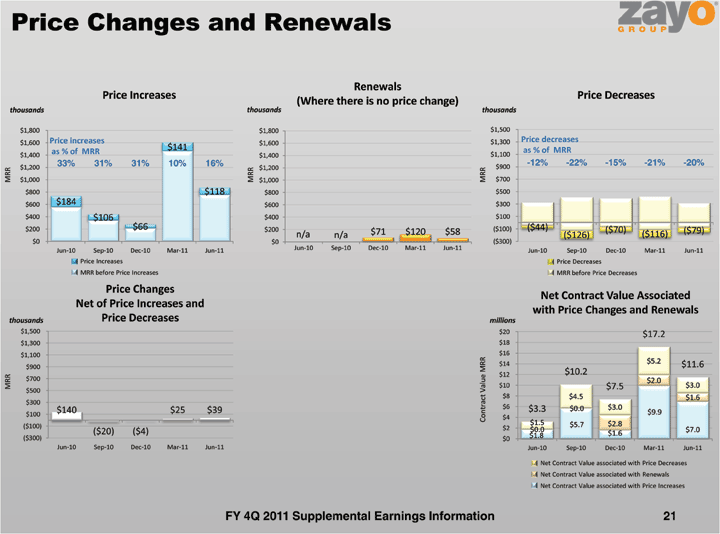
| Price Changes and Renewals RenewalsPrice Increases Price Decreases (Where there is no price change) thousands thousands thousands $1,800 $1,800 $1,500Price increases $1,300 Price decreases $1,600 $1,600$141 as % of MRR as % of MRR $1,100$1,400 $1,40033% 31% 31% 10% 16% -12% -22% -15% -21% -20%$1,200 $1,200 $900 MRR $1,000 MRR $1,000 MRR $700 $800 $118 $800 $500 $600 $184 $600 $300 $400 $106 $400 $100$200 $66 $200 ($100) ($44) ($70) $71 $120 $58 ($116) ($79) n/a n/a ($126) $0$ 0 ($300)Jun-10 Sep-10 Dec-10 Mar-11 Jun-11 Jun-10 Sep-10 Dec-10 Mar-11 Jun-11 Jun-10 Sep-10 Dec-10 Mar-11 Jun-11 Price Increases Price Decreases MRR before Price Increases MRR before Price Decreases Price Changes Net Contract Value Associated Net of Price Increases and with Price Changes and Renewals thousands Price Decreases millions $1,500 $20 $17.2 $1,300 $18 $1,100 $16$14 $5.2 $11.6 $900$12 $10.2 $700 $2.0 MRR Value MRR $10 $7.5 $3.0 $500$8$ 4.5 Contract $1.6 $300$140 $25 $39 $6 $3.3 $0.0 $3.0 $100 $9.9 $4 $1.5 $5.7 $2.8 ($ 100) $2($ 20) ($4) $0.0 $7.0 $1.8 $1.6 ($ 300) $0Jun-10 Sep-10 Dec-10 Mar-11 Jun-11 Jun-10 Sep-10 Dec-10 Mar-11 Jun-11Net Contract Value associated with Price Decreases Net Contract Value associated with Renewals Net Contract Value associated with Price Increases FY 4Q 2011 Supplemental Earnings Information 21 |
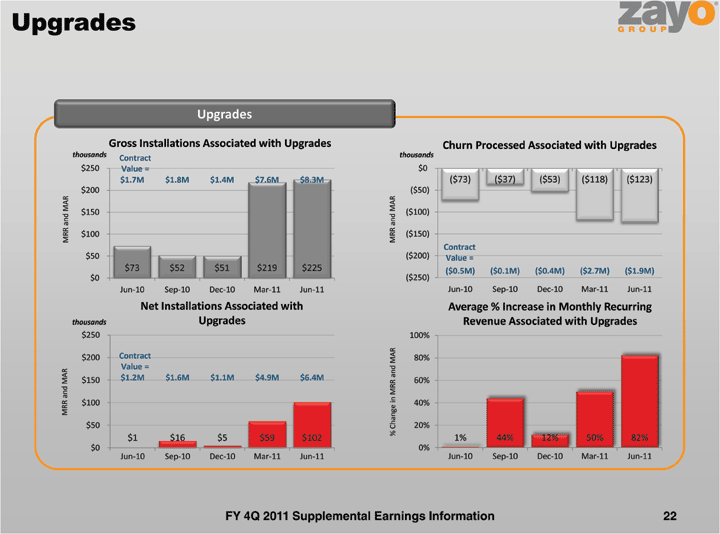
| Upgrades Upgrades Gross Installations Associated with Upgrades Churn Processed Associated with Upgrades thousands Contract thousands $250 Value = $0 $1.7M $1.8M $1.4M $7.6M $8.3M ($73) ($37) ($53) ($118) ($123) $200 ($50)$150 ($100)MRR and MAR $100 MRR and MAR ($150)Contract $50 ($200) Value = $73$ 52 $51 $219 $225 ($0.5M) ($0.1M) ($0.4M) ($2.7M) ($1.9M)$0 ($250)Jun-10 Sep-10 Dec-10 Mar-11 Jun-11 Jun-10 Sep-10 Dec-10 Mar-11 Jun-11Net Installations Associated with Average % Increase in Monthly Recurring thousands Upgrades Revenue Associated with Upgrades $250 100%$200 Contract 80% Value = $150 $1.2M $1.6M $1.1M $4.9M $6.4M 60%MRR and MAR $100 40%$50 % Change in MRR and MAR 20%$1$ 16 $5 $59 $102 1% 44% 12% 50% 82% $0 0%Jun-10 Sep-10 Dec-10 Mar-11 Jun-11 Jun-10 Sep-10 Dec-10 Mar-11 Jun-11FY 4Q 2011 Supplemental Earnings Information 22 |
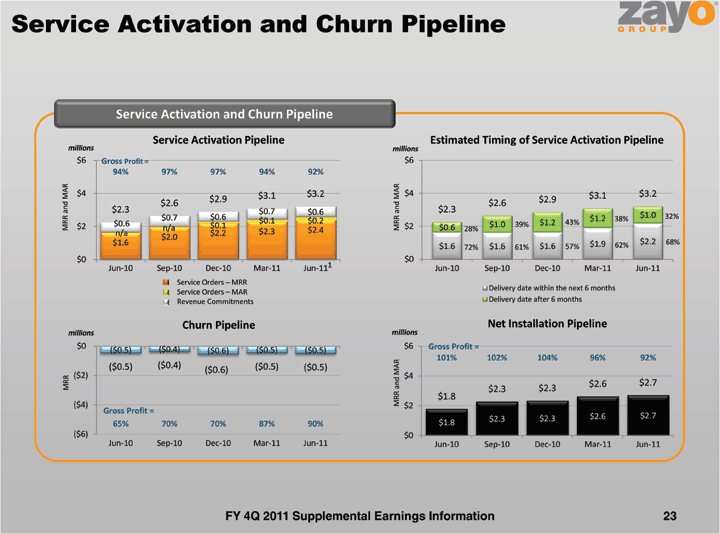
| Service Activation and Churn Pipeline Service Activation and Churn Pipeline Service Activation Pipeline Estimated Timing of Service Activation Pipeline millions millions $6 Gross Profit = $694% 97% 97% 94% 92%$4$ 3.1 $3.2 $4 $3.1 $3.2 $2.9 $2.9 $2.6 $2.6 $2.3 $0.7 $0.6 $2.3 $0.7 $0.6 $1.0 32% $0.1 $0.2 $1.2 38% $0.6 $0.1 $1.0 39% $1.2 43% MRR and MAR $2 n/a MRR and MAR $2 $0.6 28% n/a $2.2 $2.3 $2.4 $2.0 $1.6 $1.9 $2.2 68% $1.6 72% $1.6 61% $1.6 57% 62% $0$ 0Jun-10 Sep-10 Dec-10 Mar-11 Jun-111 Jun-10 Sep-10 Dec-10 Mar-11 Jun-11Service Orders — MRR Delivery date within the next 6 months Service Orders — MAR Revenue Commitments Delivery date after 6 monthsChurn Pipeline Net Installation Pipeline millions millions $0 ($0.4) $6 Gross Profit = ($ 0.5) ($0.6) ($0.5) ($0.5) 101% 102% 104% 96% 92%($ 0.5) ($0.4) ($0.5) ($0.5) ($ 0.6) ($ 2) $4MRR $2.6 $2.7 $2.3 $2.3 MRR and MAR $1.8 ($ 4) $2Gross Profit = $2.3 $2.3 $2.6 $2.7 65% 70% 70% 87% 90% $1.8 ($ 6) $0Jun-10 Sep-10 Dec-10 Mar-11 Jun-11 Jun-10 Sep-10 Dec-10 Mar-11 Jun-11FY 4Q 2011 Supplemental Earnings Information 23 |
| Revenue Under Contract Revenue Under Contract Revenue Under Contract Average Remaining Contract Term millions $1,500 50$1,098 $1,200 $1,005 $1,043 40$67 $63 $790 $55 $900 $217 30 $180 $203 Months $61 $70 $552 $67 $70 $153 $600 n/a 20 38$56 37 37$95 32 n/a $704 $702 $747 25 $300 $577 10 $400$0 -Jun-10 Sep-10 Dec-10 Mar-11 Jun-11 Jun-10 Sep-10 Dec-10 Mar-11 Jun-11Embedded Base — MRR Embedded Base — MAR Service Activation Pipeline Revenue CommitFY 4Q 2011 Supplemental Earnings Information 24 |
| Employee Data Employee Data Number of Employees Annualized Revenue per Employee thousands 500 $800Revenue400 $600Headcount Statement300 $400 $754 $787 443 $708 $698 $703 200 393 393 396 347 Financial $200 1000$ 0Jun-10 Sep-10 Dec-10 Mar-11 Jun-11 Jun-10 Sep-10 Dec-10 Mar-11 Jun-11Annualized Employee Related SG&A per Employee Related SG&A millions thousands Employee $15$ 800% of Revenue = $600$10 18% 18% 17% 17% 16%SG&A SG&A $400 $5 $200$11.2 $12.4 $13.7 $12.5 $12.8 $129 $126 $123 $127 $129 $0$ 0Jun-10 Sep-10 Dec-10 Mar-11 Jun-11 Jun-10 Sep-10 Dec-10 Mar-11 Jun-11FY 4Q 2011 Supplemental Earnings Information 25 |
| Customer Verticals and Product Mix Customer Verticals and Product Mix Zayo Group Customer Verticals June 30, September 30, December 31, March 31, June 30, % of MRR & MAR 2010 2010 2010 2011 2011Wireless 28% 29% 29% 33% 34% National Carrier/ISP 24% 24% 24% 24% 24% Public Sector/Enterprises 15% 14% 17% 11% 13% PTT 11% 10% 8% 9% 8% Regional Carrier/ISP 6% 6% 6% 7% 7% RLEC 5% 5% 5% 6% 6% CATV/Satellite 4% 5% 4% 4% 4% Data Centers/Disaster Recovery/Tech 2% 2% 3% 3% 3% Media/Content 3% 3% 2% 2% 2% Reseller 2% 2% 2% 1% 1%Zayo Group Product Mix June 30, September 30,1 December 31, March 31, June 30, % of MRR & MAR 2010 2010 2010 2011 2011SONET/Digital Signal 55% 49% 45% 45% 42% Ethernet 11% 12% 14% 15% 17% Dark-Fiber 3% 10% 14% 16% 16% Wavelengths 7% 7% 8% 8% 9% Colocation 7% 6% 6% 6% 6% Interconnect 5% 4% 4% 5% 5% DIA 2% 2% 3% 3% 3% Other Transport Services 1% 1% 1% Access 6% 4% 4% 0% 0% Voice/Data Bundles 2% 2% 2% 0% 0% Other 3% 3% 1% 0% 0%1 Period ending September 30, 2010, reflects $282 thousand MRR and MAR t ransitioned from SONET/Digital Signal service to Ethernet services for Fiber-to-the-Tower site level billing modifications. Previously, the balance of revenue commitments per site were billed through SONET/Digital Signal services and are now reflected under Ethernet FY 4Q 2011 Supplemental Earnings Information 26 |
| Customer Concentration Customer Concentration 80%70%60%58% 58% 55% 56% 55% 50% 47% 47% % of MRR 40% 44% 43% 44% 37% 36% 30% 35% 34% 34% 20%10% 13% 13% 12% 11% 11% 9% 9% 9% 9% 7% 7% 8% 7% 8% 8% 0%Jun-10 Sep-10 Dec-10 Mar-11 Jun-11Customer #1 Customer #2 Customer #3 Top 5 Top 10 Top 20 FY 4Q 2011 Supplemental Earnings Information 27 |
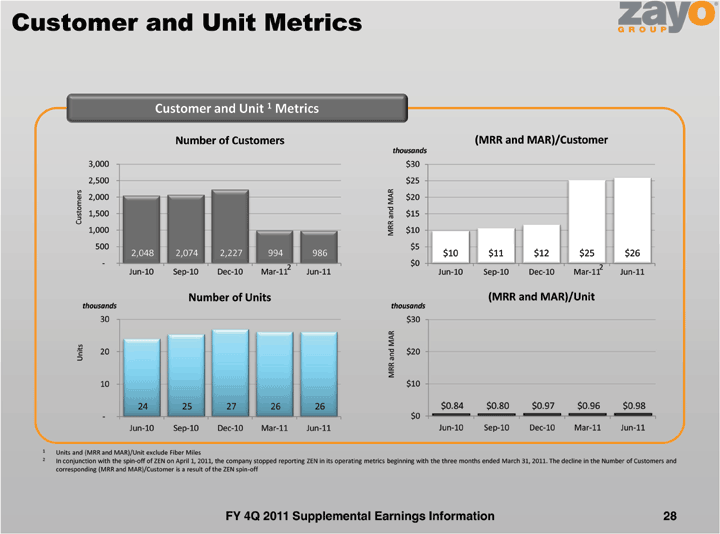
| Customer and Unit Metrics Customer and Unit 1 MetricsNumber of Customers (MRR and MAR)/Customer thousands 3,000 $30 2,500 $25Customers 2,000 $20 1,500 $15 1,000 MRR and MAR $10 500 $5 2,048 2,074 2,227 994 986 $10 $11 $12 $25 $26-$ 02 2 Jun-10 Sep-10 Dec-10 Mar-11 Jun-11 Jun-10 Sep-10 Dec-10 Mar-11 Jun-11Number of Units (MRR and MAR)/Unit thousands thousands 30$ 30Units 20 $20 MRR and MAR 10$ 1024 25 27 26 26 $0.84 $0.80 $0.97 $0.96 $0.98-$ 0Jun-10 Sep-10 Dec-10 Mar-11 Jun-11 Jun-10 Sep-10 Dec-10 Mar-11 Jun-111 Units and (MRR and MAR)/Unit exclude Fiber Miles 2 In conjunction with the spin-off of ZEN on April 1, 2011, the company stopped reporting ZEN in its operating metrics beginning with the three months ended March 31, 2011. The decline in the Number of Customers and corresponding (MRR and MAR)/Customer is a result of the ZEN spin-offFY 4Q 2011 Supplemental Earnings Information 28 |
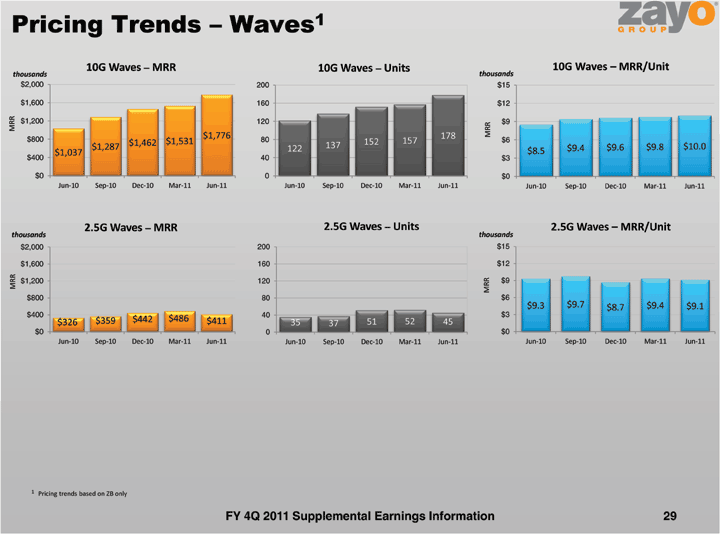
| Pricing Trends — Waves110G Waves — MRR 10G Waves — Units 10G Waves — MRR/Unit thousands thousands $2,000 200 $15$1,600 160 $12MRR $1,200 120 $9$1,776 178 MRR $800 $1,462 $1,531 80 152 157 $6 $1,287 122 137 $9.4 $9.6 $9.8 $10.0 $1,037 $8.5 $400 40 $3$0 0 $0Jun-10 Sep-10 Dec-10 Mar-11 Jun-11 Jun-10 Sep-10 Dec-10 Mar-11 Jun-11 Jun-10 Sep-10 Dec-10 Mar-11 Jun-112.5G Waves — MRR 2.5G Waves — Units 2.5G Waves — MRR/Unit thousands thousands $2,000 200 $15$1,600 160 $12 MRR $1,200 120 MRR $9 $800 80 $6$9.3 $9.7 $8.7 $9.4 $9.1 $400 40 $3$359 $442 $486 $411 51 52 45 $326 35 37 $0 0 $0Jun-10 Sep-10 Dec-10 Mar-11 Jun-11 Jun-10 Sep-10 Dec-10 Mar-11 Jun-11 Jun-10 Sep-10 Dec-10 Mar-11 Jun-111 Pricing trends based on ZB only FY 4Q 2011 Supplemental Earnings Information 29 |
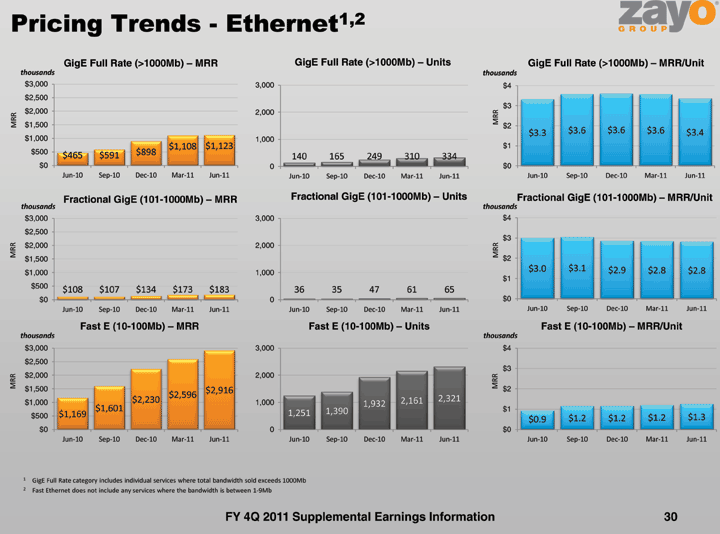
| Pricing Trends — Ethernet1,2 GigE Full Rate (1000Mb) — MRR GigE Full Rate (1000Mb) — Units GigE Full Rate (1000Mb) — MRR/Unit thousands thousands $3,000 3,000 $4 $2,500 $3 $2,000 2,000 MRR MRR $1,500 $2$3.3 $3.6 $3.6 $3.6 $3.4 $1,000 1,000$1,108 $1,123 $1 $500 $465 $591 $898 140 165 249 310 334 $0 0 $0Jun-10 Sep-10 Dec-10 Mar-11 Jun-11 Jun-10 Sep-10 Dec-10 Mar-11 Jun-11 Jun-10 Sep-10 Dec-10 Mar-11 Jun-11Fractional GigE (101-1000Mb) — MRR Fractional GigE (101-1000Mb) — Units Fractional GigE (101-1000Mb) — MRR/Unit thousands thousands $3,000 3,000 $4 $2,500 $3 MRR $2,000 2,000 MRR $1,500 $2$3.0 $3.1 $2.9 $2.8 $2.8 $1,000 1,000 $1$500 $108 $107 $134 $173 $183 36 35 47 61 65 $0 0 $0Jun-10 Sep-10 Dec-10 Mar-11 Jun-11 Jun-10 Sep-10 Dec-10 Mar-11 Jun-11 Jun-10 Sep-10 Dec-10 Mar-11 Jun-11Fast E (10-100Mb) — MRR Fast E (10-100Mb) — Units Fast E (10-100Mb) — MRR/Unit thousands thousands $3,000 3,000 $4 $2,500 $3 MRR $2,000 2,000 MRR $1,500 $2,916 $2$2,596 2,321 $1,000 $2,230 1,000 2,161 1,932 $1,601 1,390 $1 $500 $1,169 1,251 $0.9 $1.2 $1.2 $1.2 $1.3 $0 0 $0Jun-10 Sep-10 Dec-10 Mar-11 Jun-11 Jun-10 Sep-10 Dec-10 Mar-11 Jun-11 Jun-10 Sep-10 Dec-10 Mar-11 Jun-111 GigE Full Rate category includes individual services where total bandwidth sold exceeds 1000Mb 2 Fast Ethernet does not include any services where the bandwidth is between 1-9Mb FY 4Q 2011 Supplemental Earnings Information 30 |
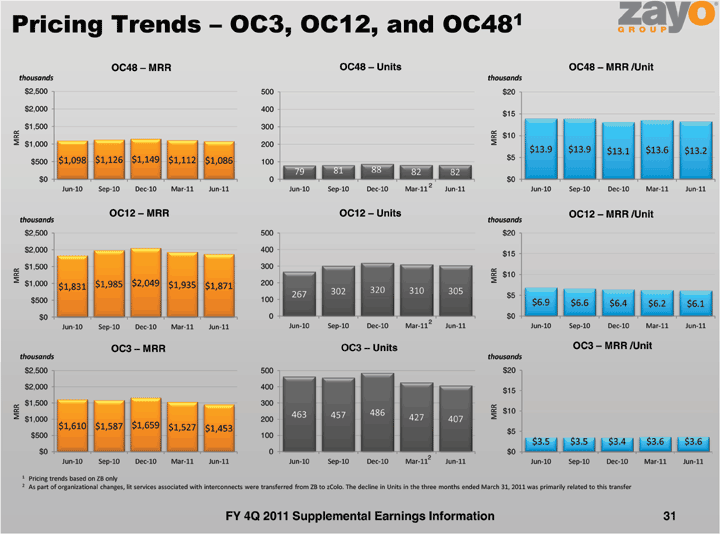
| Pricing Trends — OC3, OC12, and OC481 OC48 — MRR OC48 — Units OC48 — MRR /Unit thousands thousands $2,500 500 $20$2,000 400 $15 $1,500 300MRR MRR $10 $1,000 200$13.9 $13.9 $13.1 $13.6 $13.2 $1,098 $1,126 $1,149 $1,112 $1,086 $5$500 10079 81 88 82 82 $0 0 $02 Jun-10 Sep-10 Dec-10 Mar-11 Jun-11 Jun-10 Sep-10 Dec-10 Mar-11 Jun-11 Jun-10 Sep-10 Dec-10 Mar-11 Jun-11OC12 — MRR OC12 — Units OC12 — MRR /Unit thousands thousands $2,500 500 $20$2,000 400 $15 $1,500 300MRR MRR $10 $1,000 $1,985 $2,049$1,935 $1,871 200 $1,831 320 267 302 310 305 $5$500 100 $6.9 $6.6 $6.4 $6.2 $6.1 $0 0 $02 Jun-10 Sep-10 Dec-10 Mar-11 Jun-11 Jun-10 Sep-10 Dec-10 Mar-11 Jun-11 Jun-10 Sep-10 Dec-10 Mar-11 Jun-11OC3 — MRR OC3 — Units OC3 — MRR /Unit thousands thousands $2,500 500 $20$2,000 400 $15 $1,500 300463 486 $10 MRR 457 427 MRR$1,000 200 407 $1,610 $1,587 $1,659$1,527 $1,453 $5 $500 100$3.5 $3.5 $3.4 $3.6 $3.6 $0 0 $02 Jun-10 Sep-10 Dec-10 Mar-11 Jun-11 Jun-10 Sep-10 Dec-10 Mar-11 Jun-11 Jun-10 Sep-10 Dec-10 Mar-11 Jun-111 Pricing trends based on ZB only 2 As part of organizational changes, lit services associated with interconnects were transferred from ZB to zColo. The decline in Units in the three months ended March 31, 2011 was primarily related to this transfer FY 4Q 2011 Supplemental Earnings Information 31 |
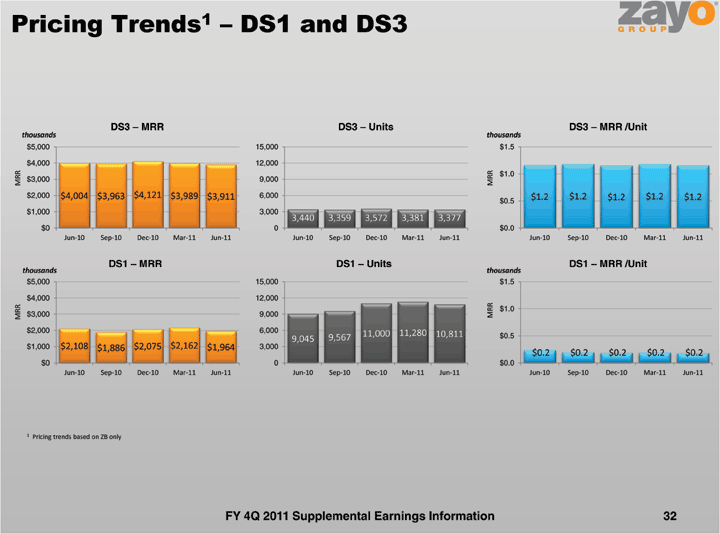
| Pricing Trends1 — DS1 and DS3 DS3 — MRR DS3 — Units DS3 — MRR /Unit thousands thousands $5,000 15,000 $1.5$4,000 12,000 $1.0 MRR $3,000 9,000 MRR$2,000 $4,004 $3,963 $4,121 $3,989 $3,911 6,000 $1.2 $1.2 $1.2 $1.2 $1.2 $0.5 $1,000 3,0003,440 3,359 3,572 3,381 3,377 $0 0 $0.0Jun-10 Sep-10 Dec-10 Mar-11 Jun-11 Jun-10 Sep-10 Dec-10 Mar-11 Jun-11 Jun-10 Sep-10 Dec-10 Mar-11 Jun-11DS1 — MRR DS1 — Units DS1 — MRR /Unit thousands thousands $5,000 15,000 $1.5$4,000 12,000 $1.0 MRR $3,000 9,000 MRR$2,000 6,000 11,000 11,280 10,811 9,045 9,567 $0.5 $1,000 $2,108$1,886 $2,075 $2,162$1,964 3,000 $0.2 $0.2 $0.2 $0.2 $0.2$0 0 $0.0Jun-10 Sep-10 Dec-10 Mar-11 Jun-11 Jun-10 Sep-10 Dec-10 Mar-11 Jun-11 Jun-10 Sep-10 Dec-10 Mar-11 Jun-111 Pricing trends based on ZB only FY 4Q 2011 Supplemental Earnings Information 32 |
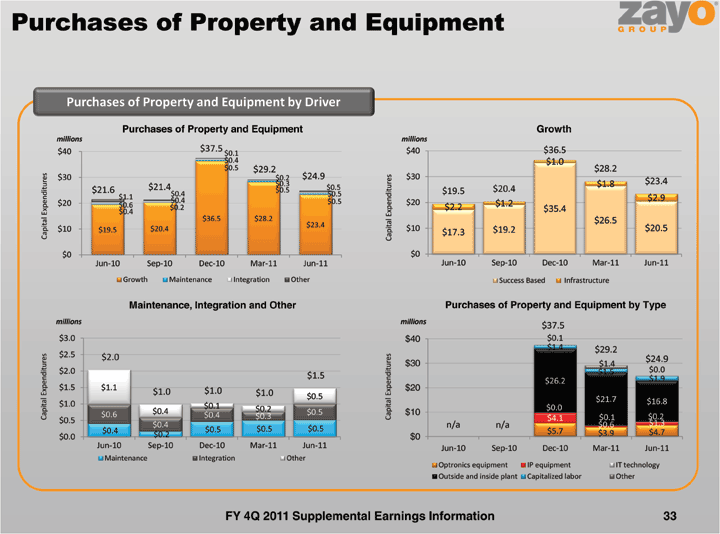
| Purchases of Property and Equipment Purchases of Property and Equipment by Driver Purchases of Property and Equipment Growth millions millions $40$ 37.5 $40 $36.5 $0.1 $0.4 $1.0 $0.5 $29.2 $28.2$30$ 24.9 $30Expenditures $0.2 Expenditures $23.4 $0.3 $1.8 $21.6 $21.4 $0.5 $0.5 $19.5 $20.4 $0.4 $0.5 $1.1 $2.9$20$ 0.4 $0.5 $20 $1.2 $0.6 $0.2 $2.2 $35.4 $0.4 $36.5 $28.2 $26.5 $23.4 $10 $20.5 Capital $10 $19.5 $20.4 Capital $17.3 $19.2$0$ 0Jun-10 Sep-10 Dec-10 Mar-11 Jun-11 Jun-10 Sep-10 Dec-10 Mar-11 Jun-11Growth Maintenance Integration Other Success Based InfrastructureMaintenance, Integration and Other Purchases of Property and Equipment by Type millions millions $37.5 $3.0 $40 $0.1 $1.4 $29.2 $2.5 Expenditures $2.0 Expenditures $24.9$30 $1.4 $2.0 $1.5 $0.0 $1.5 $1.9 $26.2 $1.5 $1.1 $1.0 $20 $1.0 $1.0 $0.5 $21.7 $1.0 $16.8 $0.1 $0.2 $0.0 $0.6 $0.4 $0.5 $10 Capital $0.4 $0.3 Capital $4.1 $0.1 $0.2 $0.5 $1.3 $0.4 n/a n/a $0.6 $0.4 $0.5 $0.5 $0.5 $5.7 $0.2 $3.9 $4.7 $0.0 $0 Jun-10 Sep-10 Dec-10 Mar-11 Jun-11 Jun-10 Sep-10 Dec-10 Mar-11 Jun-11Maintenance Integration OtherOptronics equipment IP equipment IT technology Outside and inside plant Capitalized labor OtherFY 4Q 2011 Supplemental Earnings Information 33 |
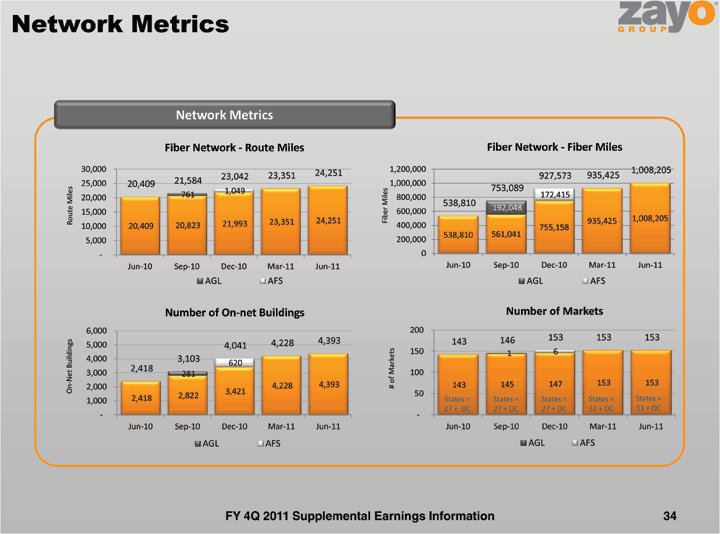
| Network Metrics Network Metrics Fiber Network — Route Miles Fiber Network — Fiber Miles 30,000 1,200,000 1,008,205 23,042 23,351 24,251 927,573 935,425 25,000 20,409 21,584 1,000,000 1,049 753,089 20,000 761 800,000 172,415 538,810 192,048 15,000 600,000 24,251 Fiber Miles 935,425 1,008,205 Route Miles 21,993 23,351 10,000 20,409 20,823 400,000 755,158 538,810 561,041 5,000 200,000- 0Jun-10 Sep-10 Dec-10 Mar-11 Jun-11 Jun-10 Sep-10 Dec-10 Mar-11 Jun-11AGL AFS AGL AFSNumber of On-net Buildings Number of Markets 6,000 200 4,393 143 146 153 153 153 Buildings 5,000 4,041 4,228 150 1 6 4,000 3,103 620 2,418 3,000 281 100 4,228 4,393 # of Markets 143 145 147 153 153On-Net 2,000 3,421 50 2,418 2,822 States = 1,000 States = States = States = States = 27 + DC 27 + DC 27 + DC 31 + DC 31 + DC — -Jun-10 Sep-10 Dec-10 Mar-11 Jun-11 Jun-10 Sep-10 Dec-10 Mar-11 Jun-11AGL AFS AGL AFSFY 4Q 2011 Supplemental Earnings Information 34 |
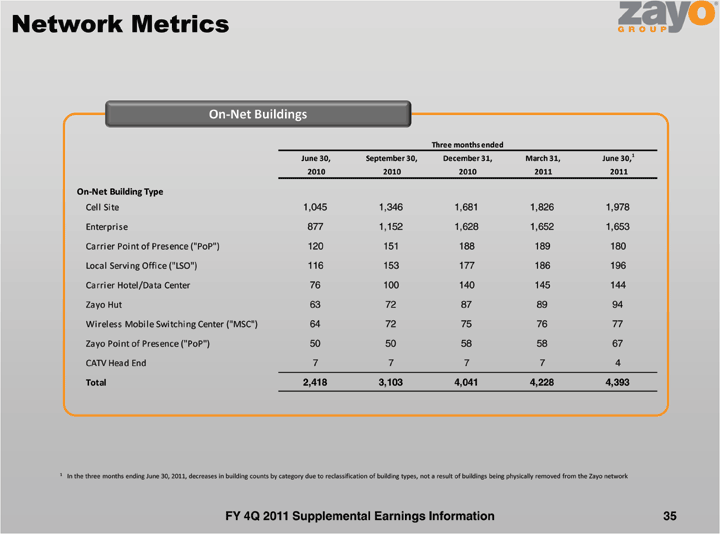
| Network Metrics On-Net Buildings Three months endedJune 30, September 30, December 31, March 31, June 30,12010 2010 2010 2011 2011On-Net Building TypeCell Site 1,045 1,346 1,681 1,826 1,978Enterprise 877 1,152 1,628 1,652 1,653Carrier Point of Presence (“PoP”) 120 151 188 189 180 Local Serving Office (“LSO”) 116 153 177 186 196 Carrier Hotel/Data Center 76 100 140 145 144Zayo Hut 63 72 87 89 94Wireless Mobile Switchi ng Center (“MSC”) 64 72 75 76 77 Zayo Point of Presence (“PoP”) 50 50 58 58 67 CATV Head End 7 7 7 7 4Total 2,418 3,103 4,041 4,228 4,3931 In the three months ending June 30, 2011, decreases in building counts by category due to reclassification of building types, not a result of buildings being physically removed from the Zayo network FY 4Q 2011 Supplemental Earnings Information 35 |
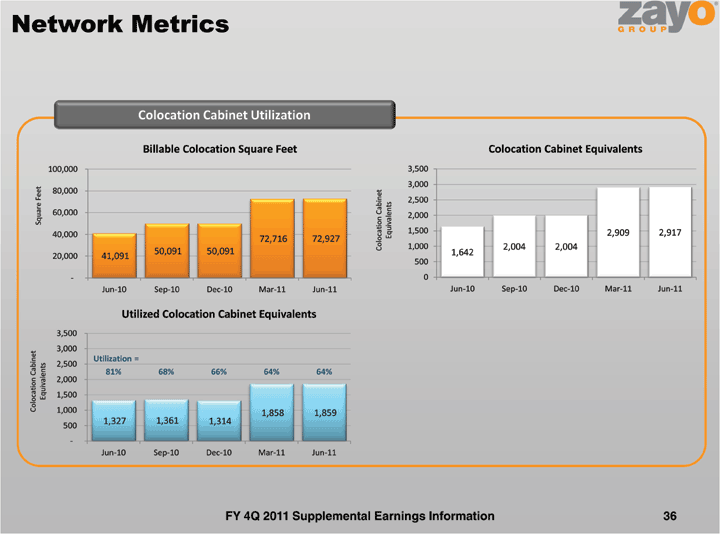
| Network Metrics Colocation Cabinet Utilization Billable Colocation Square Feet Colocation Cabinet Equivalents 100,000 3,500 3,000 80,000 2,500Cabinet Equivalents 60,000Square Feet 2,000 Colocation1,500 2,909 2,917 40,000 72,716 72,9271,000 2,004 2,004 50,091 50,091 1,642 20,000 41,091500- 0Jun-10 Sep-10 Dec-10 Mar-11 Jun-11 Jun-10 Sep-10 Dec-10 Mar-11 Jun-11Utilized Colocation Cabinet Equivalents 3,500 3,000Utilization = 2,500Cabinet Equivalents 81% 68% 66% 64% 64% 2,000Colocation 1,500 1,000 1,858 1,859 1,327 1,361 1,314 500 -Jun-10 Sep-10 Dec-10 Mar-11 Jun-11FY 4Q 2011 Supplemental Earnings Information 36 |

| Fiber to the Tower FY 4Q 2011 Supplemental Earnings Information 37 |
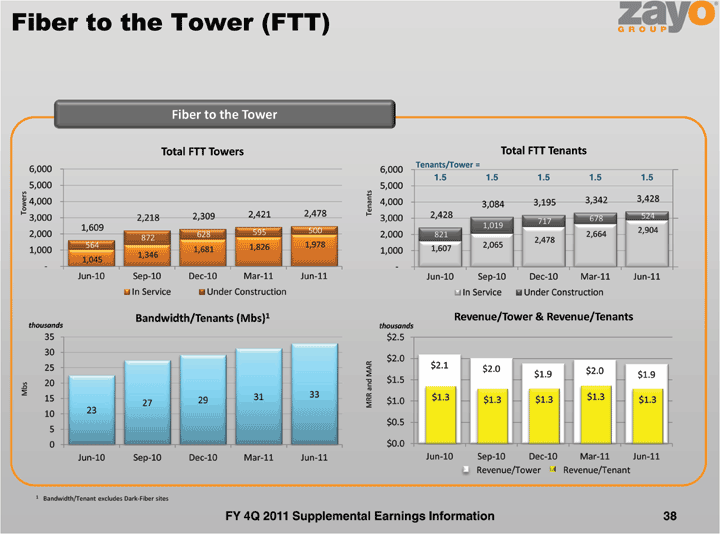
| Fiber to the Tower (FTT) Fiber to the TowerTotal FTT Towers Total FTT Tenants Tenants/Tower = 6,000 6,0001.5 1.5 1.5 1.5 1.5 5,000 5,000 4,000 4,000 3,342 3,428Towers Tenants 3,084 3,195 2,309 2,421 2,478 2,428 524 3,000 2,218 3,000 717 678 1,609 1,019 595 500 2,904 2,000 628 2,000 821 2,664 872 2,478 564 1,826 1,978 2,065 1,000 1,681 1,000 1,607 1,346 1,045- -Jun-10 Sep-10 Dec-10 Mar-11 Jun-11 Jun-10 Sep-10 Dec-10 Mar-11 Jun-11 In Service Under Construction In Service Under ConstructionBandwidth/Tenants (Mbs)1 Revenue/Tower & Revenue/Tenants thousands thousands 35 $2.5 30 $2.025$ 2.1 $2.0 $1.9 $2.0 $1.9 20$ 1.5Mbs 33 $1.3 15 29 31 $1.3 $1.3 $1.3 $1.3 27 MRR and MAR $1.010 23 $0.5 50$ 0.0Jun-10 Sep-10 Dec-10 Mar-11 Jun-11 Jun-10 Sep-10 Dec-10 Mar-11 Jun-11 Revenue/Tower Revenue/Tenant 1 Bandwidth/Tenant excludes Dark-Fiber sites FY 4Q 2011 Supplemental Earnings Information 38 |
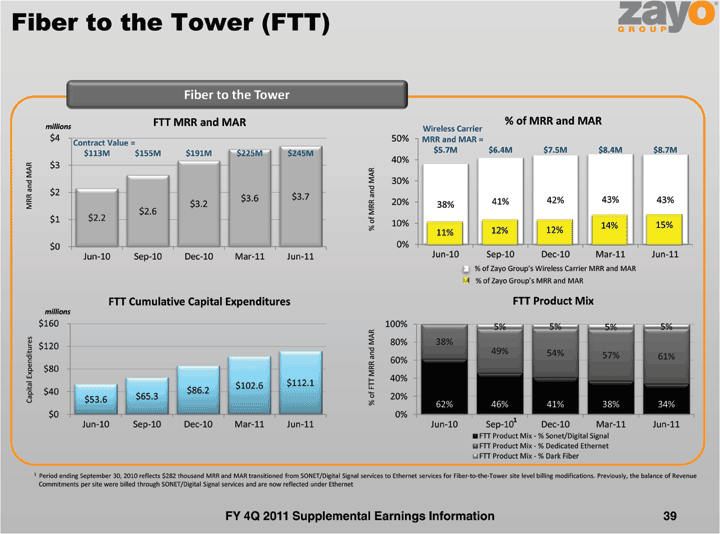
| Fiber to the Tower (FTT) Fiber to the TowerFTT MRR and MAR % of MRR and MAR millions Wireless Carrier $4 50% MRR and MAR = Contract Value = $113M $155M $191M $225M $245M $5.7M $6.4M $7.5M $8.4M $8.7M40% $3 30% $2 $3.6 $3.7 42% 43% 43% MRR and MAR $3.2 20% 38% 41% $2.6$1$ 2.2% of MRR and MAR 10% 14% 15% 11% 12% 12% $0 0%Jun-10 Sep-10 Dec-10 Mar-11 Jun-11 Jun-10 Sep-10 Dec-10 Mar-11 Jun-11% of Zayo Group’s Wireless % of Zayo Group’s MRR and MAR FTT Cumulative Capital Expenditures FTT Product Mix millions $160 100% 5% 5% 5% 5% Expenditures 80% 38% $12049% 54% 57% 61% 60% $80 40% $102.6 $112.1$40$ 86.2Capital $53.6 $65.3 % of FTT MRR and MAR 20%62% 46% 41% 38% 34% $0 0% 1 Jun-10 Sep-10 Dec-10 Mar-11 Jun-11 Jun-10 Sep-10 Dec-10 Mar-11 Jun-11FTT Product Mix — % Sonet/Digital Signal FTT Product Mix — % Dedicated Ethernet FTT Product Mix — % Dark Fiber1 Period ending September 30, 2010 reflects $282 thousand MRR and MAR transitioned from SONET/Digital Signal services t o Ethernet services for Fiber-to-the-Tower site level billing modifications. Previously, the balance of Revenue Commitments per site were billed through SONET/Digital Signal services and are now reflected under Ethernet FY 4Q 2011 Supplemental Earnings Information 39 |
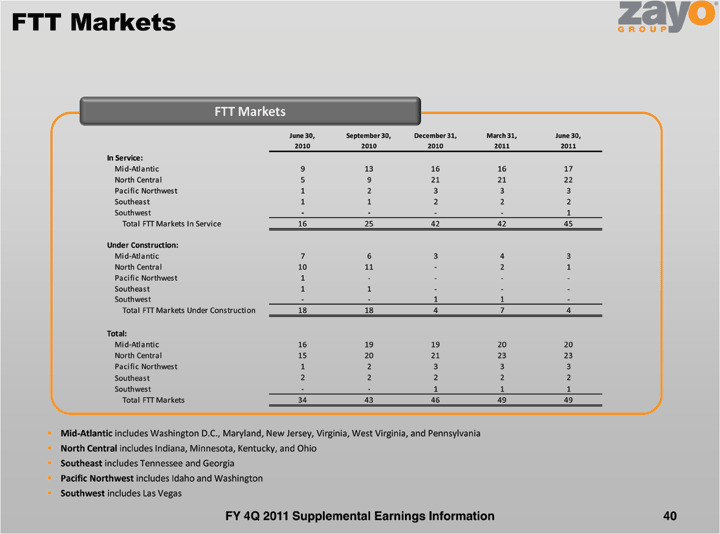
| FTT Markets FTT Markets June 30, September 30, December 31, March 31, June 30, 2010 2010 2010 2011 2011In Service:Mid-Atlantic 9 13 16 16 17 North Central 5 9 21 21 22 Pacific Northwest 1 2 3 3 3 Southeast 1 1 2 2 2 Southwest — — — — 1 Total FTT Markets In Service 16 25 42 42 45Under Construction: Mid-Atlantic 7 6 3 4 3 North Central 10 11 — 2 1 Pacific Northwest 1 — — — -Southeast 1 1 — — -Southwest — — 1 1 -Total FTT Markets Under Construction 18 18 4 7 4Total:Mid-Atlantic 16 19 19 20 20 North Central 15 20 21 23 23 Pacific Northwest 1 2 3 3 3 Southeast 2 2 2 2 2 Southwest — — 1 1 1 Total FTT Markets 34 43 46 49 49 Mid-Atlantic includes Washington D.C., Maryland, New Jersey, Virginia, West Virginia, and Pennsylvania North Central includes Indiana, Minnesota, Kentucky, and Ohio Southeast includes Tennessee and Georgia Pacific Northwest inclu des Idaho and Washington Southwest includes Las Vegas FY 4Q 2011 Supplemental Earnings Information 40 |

| Financial Data by Business Unit FY 4Q 2011 Supplemental Earnings Information 41 |
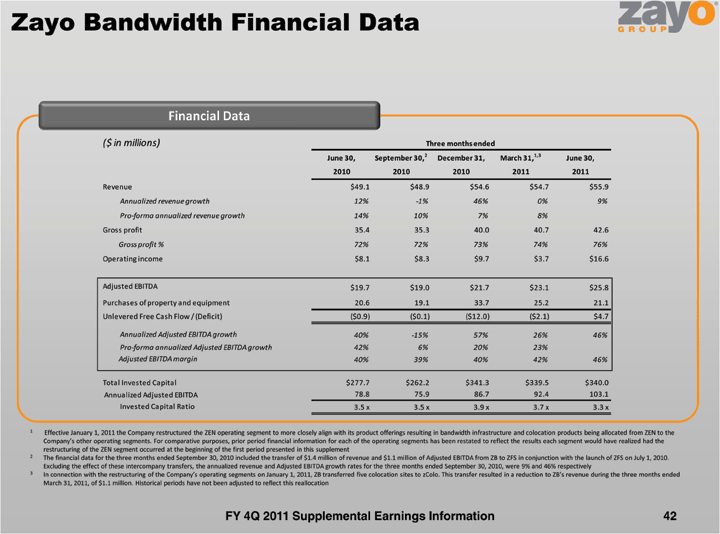
| Zayo Bandwidth Financial Data Financial Data ($ in millions) Three months ended June 30, September 30,2December 31, March 31,1,3 June 30,2010 2010 2010 2011 2011Revenue $49.1 $48.9 $54.6 $54.7 $55.9 Annualized revenue growth 12% -1% 46% 0% 9%Pro-forma annualized revenue growth 14% 10% 7% 8%Gross profit 35.4 35.3 40.0 40.7 42.6 Gross profit % 72% 72% 73% 74% 76%Operating income $8.1 $8.3 $9.7 $3.7 $16.6 Adjusted EBITDA $19.7 $19.0 $21.7 $23.1 $25.8 Purchases of property and equipment 20.6 19.1 33.7 25.2 21.1 Unlevered Free Cash Flow / (Deficit) ($0.9) ($0.1) ($12.0) ($2.1) $4.7 Annualized Adjusted EBITDA growth 40% -15% 57% 26% 46% Pro-forma annualized Adjusted EBITDA growth 42% 6% 20% 23% Adjusted EBITDA margin 40% 39% 40% 42% 46%Total Invested Capital $277.7 $262.2 $341.3 $339.5 $340.0 Annualized Adjusted EBITDA 78.8 75.9 86.7 92.4 103.1 Invested Capital Ratio 3.5 x 3.5 x 3.9 x 3.7 x 3.3 x1 Effective January 1, 2011 the Company rest ructured the ZEN operating segment to more closely align with its product offerings resulting in bandwidth infrastructure and colocation products being allocated from ZEN to the Company’s other operating For comparative purposes, prior period financial segments. information for each of the operating segments has been restated to reflect the results each segment would have realized had the restructuring of the ZEN segment occurred at the beginning of the first period presented in this supplement 2 The f inancial data for the three months ended September 30, 2010 included the transfer of $1.4 million of revenue and $1.1 million of Adjusted EBITDA from ZB to ZFS in conjunction with the launch of ZFS on July 1, 2010. Excluding the effect of these intercompany transfers, the annualized revenue and Adjusted EBITDA growth rates for the three months ended September 30, 2010, were 9% and 46% respectively 3 In connection with the restructuring of the Company’s ites to zColo operating . This transfer resulted in a segments on January 1, reduction 2011,March 31, 2011, of $1.1 million. Historical periods have not been adjusted to reflect this reallocation FY 4Q 2011 Supplemental Earnings Information 42 |
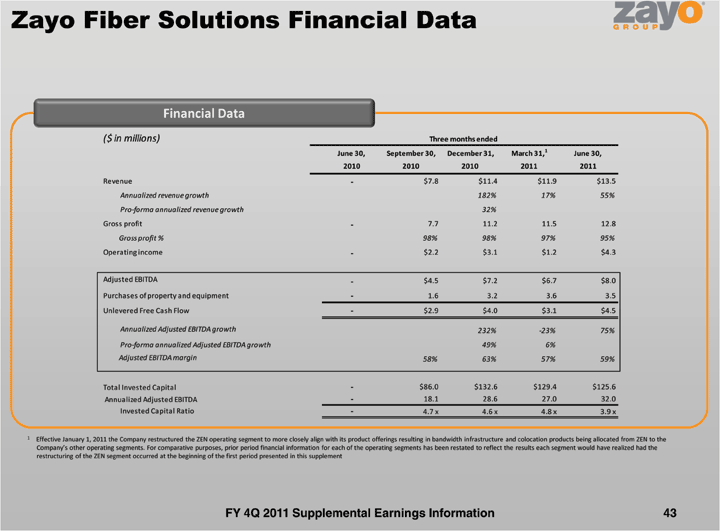
| Zayo Fiber Solutions Financial Data Financial Data ($ in millions) Three months ended June 30, September 30, December 31, March 31,1 June 30, 2010 2010 2010 2011 2011Revenue — $7.8 $11.4 $11.9 $13.5 Annualized revenue growth 182% 17% 55%Pro-forma annualized revenue growth 32%Gross profit — 7.7 11.2 11.5 12.8 Gross profit % 98% 98% 97% 95%Operating income — $2.2 $3.1 $1.2 $4.3 Adjusted EBITDA — $4.5 $7.2 $6.7 $8.0 Purchases of property and equipment — 1.6 3.2 3.6 3.5 Unlevered Free Cash Flow — $2.9 $4.0 $3.1 $4.5 Annualized Adjusted EBITDA growth 232% -23% 75% Pro-forma annualized Adjusted EBITDA growth 49% 6% Adjusted EBITDA margin 58% 63% 57% 59%Total Invested Capital — $86.0 $132.6 $129.4 $125.6 Annualized Adjusted EBITDA — 18.1 28.6 27.0 32.0 Invested Capital Ratio — 4.7 x 4.6 x 4.8 x 3.9 x1 Effective January 1, 2011 the Company restructured the ZEN operating segment t o more closely align with its product offerings resulting in bandwidth infrastructure and colocation products being allocated from ZEN to the Company’s other operating For comparative purposes, prior period financial segments. information for each of the operating segments has been restated to reflect the results each segment would have realized had the restructuring of the ZEN segment occurred at the beginning of the first period presented in this supplement FY 4Q 2011 Supplemental Earnings Informatio n 43 |
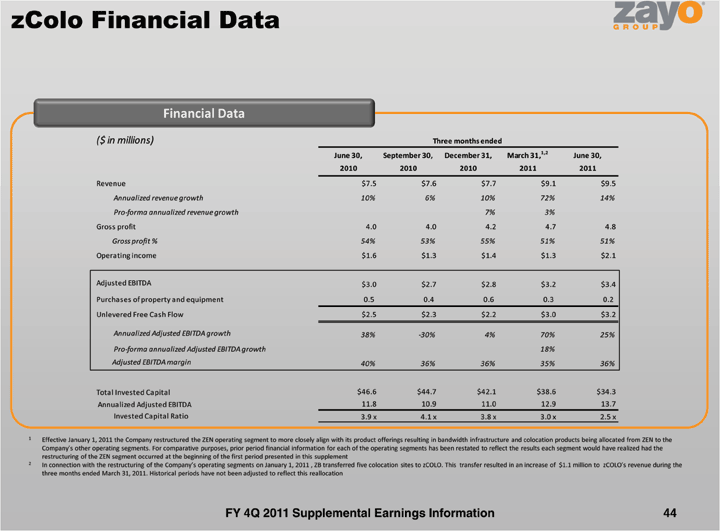
| zColo Financial Data Financial Data ($ in millions) Three months ended June 30, September 30, December 31, March 31,1,2 June 30, 2010 2010 2010 2011 2011Revenue $7.5 $7.6 $7.7 $9.1 $9.5 Annualized revenue growth 10% 6% 10% 72% 14%Pro-forma annualized revenue growth 7% 3%Gross profit 4.0 4.0 4.2 4.7 4.8 Gross profit % 54% 53% 55% 51% 51%Operating income $1.6 $1.3 $1.4 $1.3 $2.1 Adjusted EBITDA $3.0 $2.7 $2.8 $3.2 $3.4 Purchases of proper ty and equipment 0.5 0.4 0.6 0.3 0.2 Unlevered Free Cash Flow $2.5 $2.3 $2.2 $3.0 $3.2 Annualized Adjusted EBITDA growth 38% -30% 4% 70% 25% Pro-forma annualized Adjusted EBITDA growth 18% Adjusted EBITDA margin 40% 36% 36% 35% 36%Total Invested Capital $46.6 $44.7 $42.1 $38.6 $34.3 Annualized Adjusted EBITDA 11.8 10.9 11.0 12.9 13.7 Invested Capital Ratio 3.9 x 4.1 x 3.8 x 3.0 x 2.5 x1 Effective January 1, 2011 the Company restructured the ZEN operating segment to more closely align with its product o fferings resulting in bandwidth infrastructure and colocation products being allocated from ZEN to the Company’s other . For comparative purposes, prior period financial information for each of the operating segments has been restated to reflect the results each segment would have realized had theoperating segments restructuring of the ZEN segment occurred at the beginning of the first period presented in this supplement 2 In connection with the restructuring of the Company’s sites to zCOLO. This operating segments transfer resulted in on January 1, 2011 , an ZB three months ended March 31, 2011. Historical periods have not been adjusted to reflect this reallocation FY 4Q 2011 Supplemental Earnings Information 44 |

| Historical Financial Data & Reconciliations FY 4Q 2011 Supplemental Earnings Information 45 |
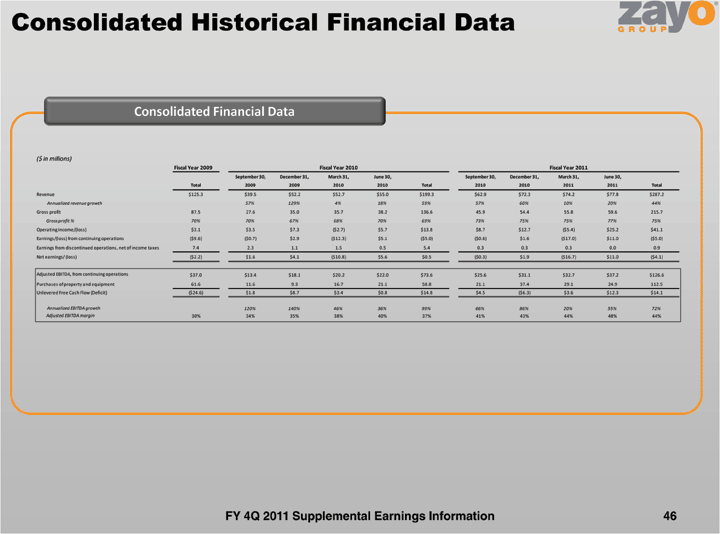
| Consolidated Historical Financial Data Consolidated Financial Data ($ in millions)Fiscal Year 2009 Fiscal Year 2010September 30, December 31, March 31, June 30,Total 2009 2009 2010 2010 TotalRevenue $125.3 $39.5 $52.2 $52.7 $55.0 $199.3 Annualized revenue growth 57% 129% 4% 18% 59%Gross profit 87.5 27.6 35.0 35.7 38.2 136.6 Gross profit % 70% 70% 67% 68% 70% 69%Operating income/(loss) $3.1 $3.5 $7.3 ($2.7) $5.7 $13.8 Earnings/(loss) from con tinuing operations ($9.6) ($0.7) $2.9 ($12.3) $5.1 ($5.0) Earnings from discontinued operations, net of income taxes 7.4 2.3 1.1 1.5 0.5 5.4 Net earnings/ (loss) ($2.2) $1.6 $4.1 ($10.8) $5.6 $0.5 Adjusted EBITDA, from continuing operations $37.0 $13.4 $18.1 $20.2 $22.0 $73.6 Purchases of property and equipment 61.6 11.6 9.3 16.7 21.1 58.8 Unlevered Free Cash Flow (Deficit) ($24.6) $1.8 $8.7 $3.4 $0.8 $14.8 Annualized EBITDA growth 120% 140% 46% 36% 99% Adjusted EBITDA margin 30% 34% 35% 38% 40% 37%FY 4Q 20 11 Supplemental Earnings Information 46 |
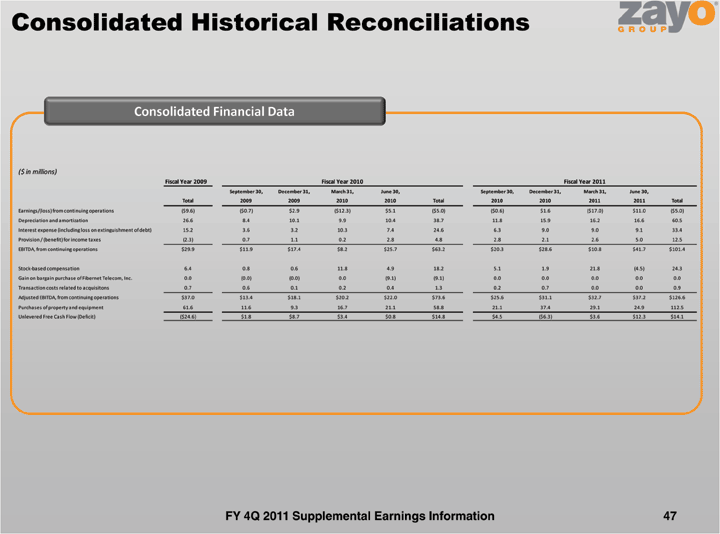
| Consolidated Historical Reconciliations Consolidated Financial Data ($ in millions)Fiscal Year 2009 Fiscal Year 2010September 30, December 31, March 31, June 30,Total 2009 2009 2010 2010 TotalEarnings/(loss) from continuing operations ($9.6) ($0.7) $2.9 ($12.3) $5.1 ($5.0) Depreciation and amortization 26.6 8.4 10.1 9.9 10.4 38.7 Interest expense (including loss on extinguishment of debt) 15.2 3.6 3.2 10.3 7.4 24.6 Provision / (benefit) ;for income taxes (2.3) 0.7 1.1 0.2 2.8 4.8 EBITDA, from continuing operations $29.9 $11.9 $17.4 $8.2 $25.7 $63.2 Stock-based compensation 6.4 0.8 0.6 11.8 4.9 18.2 Gain on bargain purchase of Fibernet Telecom, Inc. 0.0 (0.0) (0.0) 0.0 (9.1) (9.1) Transaction costs related to acquisitons 0.7 0.6 0.1 0.2 0.4 1.3 Adjusted EBITDA, from continuing operations $37.0 $13.4 $18.1 $20.2 $22.0 $73.6 Purchases of property and equipment 61.6 11.6 9.3 16.7 21.1 58.8 Unlevered Free Cash Flow (Deficit) ($24.6) $1.8 $8.7 $ 3.4 $0.8 $14.8 FY 4Q 2011 Supplemental Earnings Information 47 |
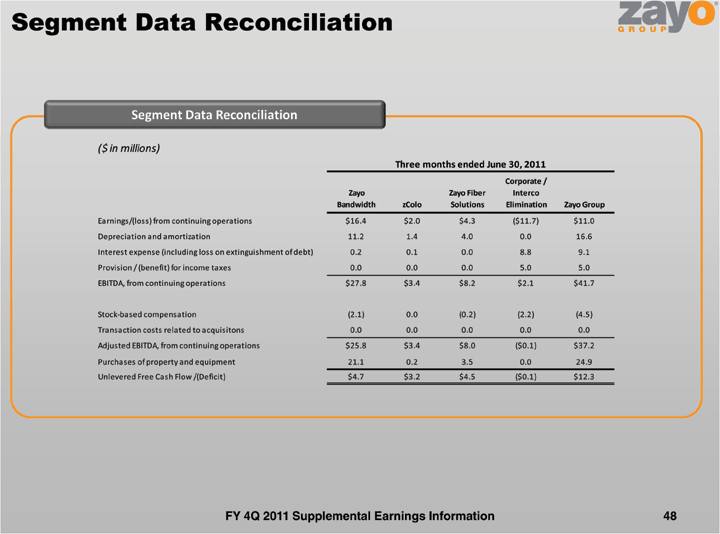
| Segment Data Reconciliation Segment Data Reconciliation ($ in millions)Three months ended June 30, 2011Corporate / Zayo Zayo Fiber Interco Bandwidth zColo Solutions Elimination Zayo GroupEarnings/(loss) from continuing operations $16.4 $2.0 $4.3 ($11.7) $11.0 Depreciation and amortization 11.2 1.4 4.0 0.0 16.6 Interest expense (including loss on extinguishment of debt) 0.2 0.1 0.0 8.8 9.1 Provision / (benefit) for income taxes 0.0 0.0 0.0 5.0 5.0 EBITDA, from continuing operations $27.8 $3.4 $8.2 $2.1 $41.7 Stock-based compensation (2.1) 0.0 (0.2) (2.2) (4.5) Transaction costs related to acquisitons 0.0 0.0 0.0 0.0 0.0 Adjusted EBITDA, from continuing operations $ 25.8 $3.4 $8.0 ($0.1) $37.2 Purchases of property and equipment 21.1 0.2 3.5 0.0 24.9 Unlevered Free Cash Flow /(Deficit) $4.7 $3.2 $4.5 ($0.1) $12.3 FY 4Q 2011 Supplemental Earnings Information 48 |
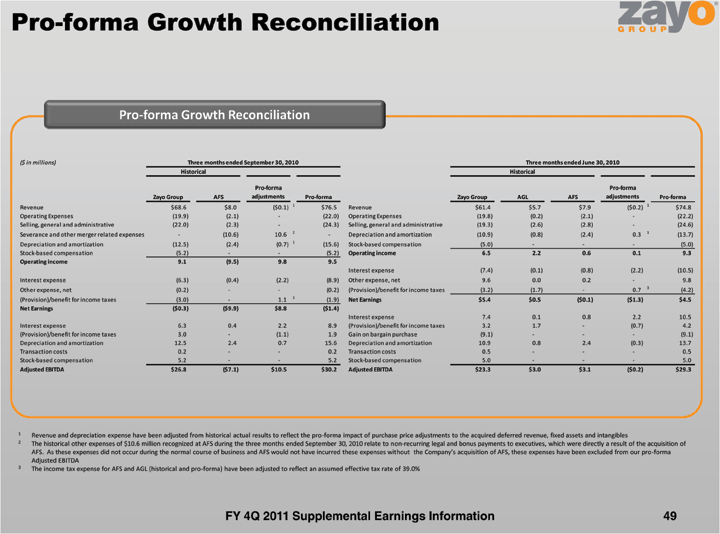
| Pro-forma Growth Reconciliation Pro-forma Growth Reconciliation ($ in millions) Three months ended September 30, 2010 Three months ended Historical HistoricalPro-forma Zayo Group AFS adjustments Pro-forma Zayo Group AGLRevenue $68.6 $8.0 ($0.1) 1 $76.5 Revenue $61.4 $5.7 Operating Expenses (19.9) (2.1) — (22.0) Operating Expenses (19.8) (0.2) Selling, general and administrative (22.0) (2.3) — (24.3) Selling, general and administrative (19.3) (2.6) Severance and other merger related expenses — (10.6) 10.6 2 — Depreciation and amortization (10.9) (0.8) Depreciation and amortization (12.5) (2.4) (0.7) 1 (15.6) Stock-based compensation (5.0) -Stock-based compensation (5.2) — — (5.2 ) Operating income 6.5 2.2 Operating income 9.1 (9.5) 9.8 9.5Interest expense (7.4) (0.1) Interest expense (6.3) (0.4) (2.2) (8.9) Other expense, net 9.6 0.0 Other expense, net (0.2) — — (0.2) (Provision)/benefit for income taxes (3.2) (1.7) (Provision)/benefit for income taxes (3.0) — 1.1 3 (1.9) Net Earnings $5.4 $0.5 Net Earnings ($0.3) ($9.9) $8.8 ($1.4)Interest expense 7.4 0.1 Interest expense 6.3 0.4 2.2 8.9 (Provision)/benefit for income taxes 3.2 1.7 (Provision)/benefit for inco me taxes 3.0 — (1.1) 1.9 Gain on bargain purchase (9.1) -Depreciation and amortization 12.5 2.4 0.7 15.6 Depreciation and amortization 10.9 0.8 Transaction costs 0.2 — — 0.2 Transaction costs 0.5 -Stock-based compensation 5.2 — — 5.2 Stock-based compensation 5.0 -Adjusted EBITDA $26.8 ($7.1) $10.5 $30.2 Adjusted EBITDA $23.3 $3.01 Revenue and depreciation expense have been adjusted from historical actual results to reflect the pro-forma impact of purchase price adjustments to the acquired deferred revenue, fixed assets and intangibles 2 The historical other expenses of $10.6 million recognized at AFS during the three months ended September 30, 2010 relate to non-recurring legal and bonus payments to executives, which were directly a result of the acquisition of AFS. As these expenses did not occur during the normal course of business and AFS would not have incurred these expenses without the Company’s acquisition of AFS, -formathese Adjusted EBITDA 3 The incom e tax expense for AFS and AGL (historical and pro-forma) have been adjusted to reflect an assumed effective tax rate of 39.0% FY 4Q 2011 Supplemental Earnings Information 49 |