Attached files
| file | filename |
|---|---|
| EX-2.1 - EX-2.1 - INTERMOLECULAR INC | a2205414zex-2_1.htm |
| EX-23.1 - EX-23.1 - INTERMOLECULAR INC | a2205414zex-23_1.htm |
Use these links to rapidly review the document
TABLE OF CONTENTS
INDEX TO CONSOLIDATED FINANCIAL STATEMENTS
As filed with the Securities and Exchange Commission on September 9, 2011
Registration No. 333-175877
UNITED STATES
SECURITIES AND EXCHANGE COMMISSION
Washington, D.C. 20549
AMENDMENT NO. 1
TO
FORM S-1
REGISTRATION STATEMENT
UNDER
THE SECURITIES ACT OF 1933
INTERMOLECULAR, INC.
(Exact name of registrant as specified in its charter)
| Delaware (State or other jurisdiction of incorporation or organization) |
3674 (Primary Standard Industrial Classification Code Number) |
20-1616267 (I.R.S. Employer Identification Number) |
3011 N. First Street
San Jose, CA 95134
(408) 582-5700
(Address, including zip code, and telephone number, including area code, of Registrant's principal executive offices)
David Lazovsky
President and Chief Executive Officer
Intermolecular, Inc.
3011 N. First Street
San Jose, CA 95134
(408) 582-5700
(Name, address, including zip code, and telephone number, including area code, of agent for service)
| Copies to: | ||
Patrick A. Pohlen Latham & Watkins LLP 140 Scott Drive Menlo Park, CA 94025 Telephone: (650) 328-4600 Facsimile: (650) 463-2600 |
Alan F. Denenberg Davis Polk & Wardwell LLP 1600 El Camino Real Menlo Park, CA 94025 Telephone: (650) 752-2000 Facsimile: (650) 752-2111 |
|
Approximate date of commencement of proposed sale to the public:
As soon as practicable after the effective date of this Registration Statement.
If any of the securities being registered on this Form are to be offered on a delayed or continuous basis pursuant to Rule 415 under the Securities Act of 1933, check the following box. o
If this Form is filed to register additional securities for an offering pursuant to Rule 462(b) under the Securities Act, check the following box and list the Securities Act registration statement number of the earlier effective registration statement for the same offering. o
If this Form is a post-effective amendment filed pursuant to Rule 462(c) under the Securities Act, check the following box and list the Securities Act registration statement number of the earlier effective registration statement for the same offering. o
If this Form is a post-effective amendment filed pursuant to Rule 462(d) under the Securities Act, check the following box and list the Securities Act registration statement number of the earlier effective registration statement for the same offering. o
Indicate by check mark whether the registrant is a large accelerated filer, an accelerated filer, a non-accelerated filer, or a smaller reporting company. See the definitions of "large accelerated filer," "accelerated filer" and "smaller reporting company" in Rule 12b-2 of the Exchange Act.
| Large accelerated filer o | Accelerated filer o | Non-accelerated filer ý (Do not check if a smaller reporting company) |
Smaller reporting company o |
The Registrant hereby amends this Registration Statement on such date or dates as may be necessary to delay its effective date until the Registrant shall file a further amendment which specifically states that this Registration Statement shall thereafter become effective in accordance with Section 8(a) of the Securities Act of 1933 or until the Registration Statement shall become effective on such date as the Commission, acting pursuant to said Section 8(a), may determine.
The information in this prospectus is not complete and may be changed. We and the selling stockholders may not sell these securities until the registration statement filed with the Securities and Exchange Commission is effective. This prospectus is not an offer to sell these securities and we and the selling stockholders are not soliciting offers to buy these securities in any jurisdiction where the offer or sale is not permitted.
SUBJECT TO COMPLETION, DATED SEPTEMBER 9, 2011
Shares

Common Stock
Intermolecular, Inc. is offering shares of its common stock, and the selling stockholders identified in this prospectus are offering an additional shares. We will not receive any proceeds from the sale of the shares of common stock to be offered by the selling stockholders. This is our initial public offering and no public market currently exists for our shares. We anticipate that the initial public offering price of our common stock will be between $ and $ per share.
We have applied to have our common stock listed on The NASDAQ Global Market under the trading symbol "IMI."
Investing in our common stock involves risks. See "Risk Factors" beginning on page 11.
PRICE $ A SHARE
| |
Price to Public | Underwriting Discounts and Commissions |
Proceeds to Intermolecular |
Proceeds to the Selling Stockholders |
|||||||||
|---|---|---|---|---|---|---|---|---|---|---|---|---|---|
Per Share |
$ | $ | $ | $ | |||||||||
Total |
$ | $ | $ | $ | |||||||||
We have granted the underwriters the right to purchase up to an additional shares of common stock to cover over-allotments.
The Securities and Exchange Commission and state securities regulators have not approved or disapproved these securities or determined if this prospectus is truthful or complete. Any representation to the contrary is a criminal offense.
The underwriters expect to deliver the shares of common stock to purchasers on , 2011.
| Morgan Stanley | J.P. Morgan | |
Barclays Capital |
||
| Pacific Crest Securities | Needham & Company, LLC |
The date of this prospectus is , 2011.
Neither we, the selling stockholders nor the underwriters have authorized anyone to provide you with information different from that contained in this prospectus. We take no responsibility for, and can provide no assurance as to the reliability of, any information that others may give you. We, the underwriters and the selling stockholders are offering to sell, and seeking offers to buy, shares of common stock only in jurisdictions where offers and sales are permitted. The information contained in this prospectus is accurate only as of the date on the front cover of this prospectus, or such other dates as are stated in this prospectus, regardless of the time of delivery of this prospectus or of any sale of our common stock.
Dealer Prospectus Delivery Obligation
Until , 2011 (25 days after commencement of this offering), all dealers that buy, sell, or trade shares of our common stock, whether or not participating in this offering, may be required to deliver a prospectus. This delivery requirement is in addition to the obligation of dealers to deliver a prospectus when acting as underwriters and with respect to their unsold allotments or subscriptions.
i
This summary highlights information contained elsewhere in this prospectus and does not contain all of the information you should consider in making your investment decision. You should read the following summary together with the more detailed information appearing elsewhere in this prospectus, including "Selected Consolidated Financial Data," "Management's Discussion and Analysis of Financial Condition and Results of Operations," "Risk Factors," "Business" and our consolidated financial statements and related notes, before deciding whether to purchase shares of our capital stock. Unless otherwise indicated herein, "Intermolecular, Inc.," "Intermolecular," "the Company," "we," "us" and "our" refer to Intermolecular, Inc. and its subsidiaries.
Our Company
We have pioneered a proprietary approach to accelerate research and development, innovation and time-to-market for the semiconductor and clean-energy industries. Our approach consists of our proprietary high productivity combinatorial (HPC) platform, coupled with our multi-disciplinary team. Through paid collaborative development programs (CDPs) with our customers, we develop proprietary technology and intellectual property (IP) for our customers focused on advanced materials, processes, integration and device architectures. This developed technology enables our customers to bring optimized, high-volume manufacturing-ready integrated devices to market faster and with less risk than traditional approaches to R&D. We provide our customers with the developed proprietary technology through various fee arrangements and grant them rights to associated IP, primarily through royalty-bearing licenses.
We currently target large, high-volume semiconductor and high-growth emerging clean-energy markets, including DRAM, flash memory, complex logic, flat glass, solar cells, LEDs and other energy-efficient technologies with our HPC platform. Within these broad markets, we have engaged in paid programs for 18 customers, including ATMI, Elpida Memory, GLOBALFOUNDRIES, Guardian Industries, SanDisk, Taiwan Semiconductor Manufacturing Company (TSMC) and Toshiba. ATMI and Elpida have commenced shipping products incorporating technology developed through our CDPs and pay us licensing and royalty fees. To date, we have received the majority of our revenue from customers in DRAM, flash memory, complex logic and energy-efficient applications in flat glass, and have not yet received a material amount of revenue from customers in solar cells, LEDs and other energy-efficient technologies.
Our HPC platform consists of our Tempus HPC processing tools, automated characterization and informatics and analysis software. Our platform is purpose-built for R&D using combinatorial process systems. Combinatorial processing is a methodology for discovery and development that employs parallel and other high-throughput experimentation, which allows R&D experimentation to be performed at speeds up to 100 times faster than traditional methods. Our processing tools allow us to perform up to 192 experiments on a single substrate as compared to traditional methods, which typically allow only a single experiment at a time. Our multi-disciplinary team of approximately 135 scientists and engineers, of whom approximately 55 have Ph.D.s, designs customized workflows for our customers' specific applications using the HPC platform and applies the workflows in collaboration with our customers.
Our business model aligns our interests with those of our customers as we collaborate to develop differentiated proprietary technology and IP for high-volume integrated devices through CDPs. Customers pay us development service fees during multi-year CDPs, which typically last for two years and may range from one to three years. Our customers also receive rights to the technology and IP developed during the CDPs, and once our customers commercialize products using this technology and IP, they pay us primarily through royalty fees. In certain cases, we sell HPC processing tools to our customers who pay a recurring license fee to operate those tools with our combinatorial processing capabilities. By aligning our interests with those of our customers, we facilitate collaboration and open
1
communication that is more likely to result in innovative, differentiated products and future CDPs with those customers.
We were founded in 2004 and are headquartered in San Jose, California. Our total revenue increased to $23.8 million for the six months ended June 30, 2011 from $16.5 million for the six months ended June 30, 2010. Our total revenue increased to $42.7 million for the year ended December 31, 2010 from $26.9 million for the year ended December 31, 2009. Our backlog as of June 30, 2011 was $108.8 million, of which $28.3 million is scheduled to be recognized as revenue during the remainder of the year ending December 31, 2011. Our adjusted EBITDA for the six months ended June 30, 2011 was $2.0 million, and our adjusted EBITDA for the year ended December 31, 2010 was $4.6 million. Our net loss decreased to $3.2 million for the six months ended June 30, 2011 from $3.3 million for the six months ended June 30, 2010. Our net loss decreased to $1.8 million for the year ended December 31, 2010 from $5.3 million for the year ended December 31, 2009. Since inception, we have incurred net losses leading to an accumulated deficit of $73.2 million as of June 30, 2011.
Industry
High-volume integrated devices serve large and growing markets, including the markets for semiconductors, clean energy (which includes flat glass, solar cells, LEDs, advanced batteries and other energy-efficient technologies) and flat-panel displays. According to IHS iSuppli, the semiconductor market had $304 billion in sales in 2010 and is expected to grow at a compound annual growth rate (CAGR) of 5.7% from 2010 to 2015. Also, based on data from Freedonia Group, GlobalData, IHS iSuppli and MarketsandMarkets, the clean-energy markets had $166 billion in sales in 2010 and are collectively expected to grow at a CAGR of 10.8% from 2010 to 2015.
Success in these markets requires rapid and cost-effective product innovation, fast time-to-market, competitive pricing, production scalability and the ability to achieve specific requirements. Devices in these markets are typically manufactured using thin-film deposition of advanced materials through customized processes that create a specific device architecture. To deliver performance and cost improvements, it is increasingly necessary to evaluate elements in the periodic table that have previously not been used in high-volume manufacturing, and to develop advanced device structures capable of addressing particular application requirements. These device structures must then be scaled and integrated into cost-effective manufacturing processes. In addition, innovation in these markets and control of the resulting IP are critical to enable competitive differentiation.
Existing approaches used to explore new materials, processes, integration and device architectures are complex and time-consuming. Traditionally, device manufacturers have conducted R&D using expensive high-volume manufacturing tools that are not specifically built for that purpose. Production tools can typically only run one process at a time and are required to be taken off high-volume manufacturing lines to perform and evaluate experiments. These high-volume manufacturing environments are not conducive to R&D because these environments require stability to minimize risk and to reduce contamination that the research-based introduction of new materials, tools or processes may cause. In addition to some of the challenges above, certain clean-energy device manufacturers use laboratory-scale tools for R&D, which do not address the scale-up requirements critical to high-volume manufacturing. These factors combine to increase development risks due to long learning cycles, limited data sets, narrow exploration capabilities and slow time-to-market. Moreover, third-party approaches to complement internal R&D typically are not tailored for customer-specific applications, do not offer proprietary IP or competitive differentiation and do not provide high-volume manufacturing-ready technology.
Traditional R&D approaches are increasingly challenged by the market need to accelerate innovation and time-to-market for the semiconductor and clean-energy industries. Substantially improved methodologies are required to generate the learning cycles necessary to accelerate innovation, improve product development and ensure manufacturing scalability of high-volume integrated devices in these markets. Further, companies require new ways to develop proprietary technology and obtain IP rights to support competitive advantage for their new products.
2
Our Solution and Benefits to Our Customers
We develop technology and IP rights focused on advanced materials, processes, integration and device architectures in collaboration with our customers. This technology enables our customers to bring optimized, high-volume manufacturing-ready integrated devices to market faster and with less risk than traditional approaches to R&D. Our HPC platform increases R&D productivity because it is purpose-built for R&D and utilizes advanced combinatorial processing systems, which allow experiments to be performed at speeds up to 100 times faster than traditional methods.
The key elements of our HPC platform include the following:
- •
- Tempus HPC
processing. We use our Tempus HPC processing tools to rapidly process different experiments consisting of various combinations of
materials, processing parameters, sequencing and device structures.
- •
- Automated
characterization. We use automated characterization systems to characterize the substrates processed by our Tempus HPC processing tools,
thereby rapidly generating experimental data while matching our processing throughput.
- •
- Informatics and analysis software. We use our informatics and analysis software to automate experiment generation, characterization, data analysis and reporting, in each case while matching our processing throughput, and to create an aggregated and searchable database of information that includes the experimental results we generate.
Our differentiated platform solution and approach to collaborative engagements are designed to deliver the following significant benefits to our customers:
- •
- Accelerated time-to-market with better,
lower-cost products. Faster processing of experiments, throughput-matched characterization and real-time data
management and analysis allow additional learning cycles and broader exploration of materials and process solution combinations.
- •
- Development of application and manufacturing-ready IP tailored to our
customers' specifications. We use our HPC platform and customized workflows to develop IP-protected, proprietary technology
that is tailored to our customers' applications and ready for high-volume manufacturing.
- •
- Increased R&D productivity and reduced technology risk. We narrow the potential combinations of advanced materials, processes and device architecture solutions through a series of increasingly rigorous screening stages to guide the selection of solutions, which mitigates our customers' technology risk earlier in the development cycle.
Strengths
We have pioneered, developed and patented a proprietary platform and methodology for accelerating R&D in the semiconductor and clean-energy markets. Our strengths include:
- •
- Proprietary and patented HPC
platform. Our HPC platform employs proprietary and patented combinatorial methods to parallel process up to 192 experiments on a single
substrate as compared to traditional methods, which typically allow only a single experiment at a time. As of September 1, 2011, we owned or had exclusive rights within our field of use to 600
U.S. patents and patent applications (most of which also have foreign counterparts), which provide us with a competitive advantage in the use of combinatorial methods and systems in our target
markets.
- •
- Flexible technology platform configurable for and extendable to multiple markets. Our HPC platform can be configured for many applications and extended to address a broad set of integrated device markets.
3
- •
- Seasoned engineering team with multi-disciplinary
expertise. We have assembled a multi-disciplinary team of approximately 135 scientists and engineers, of whom approximately 55 have
Ph.D.s, with expertise across various disciplines, fields and technologies, including engineering, materials science, process development and integration, equipment, device process technologies and
device integration.
- •
- Collaborative customer engagements leading to IP generation and
strategic alignment. Our business model aligns our financial interests with those of our customers, to whom we grant rights to
proprietary technology and IP developed during our collaborations. This alignment of interests facilitates collaboration and open communication that improves development efficiencies and is more
likely to result in innovative, differentiated products and future CDPs with those customers.
- •
- Attractive business model with contracted CDP revenue and recurring high-margin royalties. Our multi-year CDPs generate predictable CDP and services revenue from our customers. Our CDPs also establish the terms upon which we will receive recurring licensing and royalty revenue from the sale of our customers' products that incorporate technology developed through our CDPs.
Our Strategy
Our mission is to drive our customers' success by transforming R&D and accelerating innovation in markets that derive competitive advantage from the interaction of materials science, processes, integration and device architecture. To accomplish this, we intend to continue to execute on our strategy, the key elements of which are:
- •
- Target large, high-volume semiconductor markets;
- •
- Target large, high-growth, emerging clean-energy markets;
- •
- Engage with existing and potential market leaders in our target markets;
- •
- Create proprietary IP with our customers;
- •
- Enhance our HPC platform and multi-disciplinary team; and
- •
- Explore and develop new technologies in high-volume integrated devices.
Risks Related to Our Financial Condition and Business
Our business is subject to a number of risks and uncertainties that you should understand before making an investment decision. These risks are discussed more fully in the section of this prospectus entitled "Risk Factors" and include:
- •
- We have a limited operating history, which makes it difficult for investors to evaluate our current business and future
prospects;
- •
- Our operating results may fluctuate from quarter to quarter, which may make it difficult to predict our future performance
and may result in volatility in the market price of our common stock if we fail to meet the expectations of public market analysts and investors in these periods;
- •
- We have incurred operating losses since our inception and may not be able to achieve or maintain profitability;
- •
- We depend on a limited number of customers, which have historically been in the semiconductor industry, and a loss of any
of them would adversely affect our business and operating results;
- •
- Our rapid growth has presented significant challenges to our management and administrative systems and resources, and we may experience difficulties managing our growth, particularly as
4
- •
- Our business prospects and future growth depend on royalties, which may be difficult to structure and enforce;
- •
- Our sales cycles are long, and we commit significant resources to a project before we have any commitment that a potential
customer may agree to use our platform. One or more failures to enter into a CDP after we have devoted significant resources to a project could adversely affect our business and operating results;
- •
- The semiconductor industry is rapidly changing and an inability to evolve existing products in a timely manner, anticipate
trends in technology development and introduce new technologies could adversely affect our business and operating results;
- •
- The clean-energy industry is in a very early stage of development, and we may not earn significant revenue from our
initiatives in this industry for an extended period, if ever;
- •
- If a project to which we have devoted technology and significant resources fails to produce any measurable success or
value to our customers in the form of differentiated technology and intellectual property, we may not earn licensing and royalty revenue sufficient to recover the upfront costs and cash invested in
the CDP, which could adversely affect our results of operations;
- •
- A decline in sales in the end markets for products incorporating technology developed through our CDPs could adversely
affect our business and results of operations;
- •
- If we are unable to scale our development efforts and secure new CDPs, our growth prospects would be limited and our
business and operating results could be adversely affected;
- •
- We may not be successful in maintaining and managing CDPs, which would adversely affect our ability to develop successful
products and our financial condition and operating results; and
- •
- Failure to adequately protect against conflicts of interest and breaches of confidentiality, or failure to convince our customers to grant us access to their proprietary information in light of such risks, would harm our reputation and our relationships with our customers, and our business prospects and operating results would be adversely affected.
we handle the additional responsibilities of becoming a public company, which could adversely affect our business and operating results;
Corporate Information
We were originally incorporated as The BEP Group, Inc. in Delaware in June 2004. In November 2004, we changed our name to Intermolecular, Inc. Our principal executive offices are located at 3011 N. First Street, San Jose, California 95134, and our telephone number is (408) 582-5700. Our website address is www.intermolecular.com. Information contained on or accessible through our website is not incorporated by reference into this prospectus, and you should not consider information contained on or accessible through our website to be part of this prospectus.
Our logo, "Intermolecular," "Tempus" and other trademarks or service marks of Intermolecular, Inc. appearing in this prospectus are the property of Intermolecular, Inc. This prospectus contains additional trade names, trademarks and service marks of other companies. We do not intend our use or display of other companies' trade names, trademarks or service marks to imply relationships with, or endorsement or sponsorship of us by, these other companies. Use of such trademarks and service marks in this prospectus may occur without their respective superscript symbols (TM or SM) to facilitate readability only and does not constitute a waiver of any rights that might be associated with the respective trademarks or service marks.
5
Common stock offered by us |
shares (or shares if the underwriters exercise their over-allotment option in full). | |
Common stock offered by the selling stockholders |
shares. |
|
Common stock to be outstanding after this offering |
shares (or shares if the underwriters exercise their over-allotment option in full). |
|
Proposed symbol |
"IMI" |
|
Use of proceeds |
We intend to use the net proceeds received by us from this offering for working capital and other general corporate purposes, including the costs associated with being a public company. If and to the extent the gross proceeds from the sale by Symyx Technologies, Inc. (Symyx) of shares in this offering are less than $67 million, we will use a portion of our net proceeds to satisfy an obligation to Symyx in connection with an agreement for the purchase of IP from Symyx and the termination of related royalty obligations. We have also agreed to reimburse Symyx for 50% of their underwriting discounts and commissions. We may also use a portion of the net proceeds to expand our current business through acquisitions of other businesses, products, intellectual property or technologies. Other than as set forth above, we do not have agreements or commitments for any specific acquisitions at this time. We will not receive any proceeds from the sale of the shares of common stock to be offered by the selling stockholders. Please see "Use of Proceeds." |
|
Risk factors |
See "Risk Factors" starting on page 11 of this prospectus for a discussion of factors you should carefully consider before deciding to invest in our common stock. |
The number of shares of common stock to be outstanding after this offering is based on 72,639,388 shares outstanding as of June 30, 2011 and excludes:
- •
- 16,403,610 shares of common stock issuable upon the exercise of options outstanding, at a weighted average exercise price
of $1.09 per share;
- •
- 1,824,736 shares of common stock issuable upon the exercise of warrants outstanding (not including those to be exercised
in connection with the completion of this offering), at a weighted average exercise price of $2.84 per share;
- •
- 236,157 shares of common stock reserved for future issuance under our 2004 Equity Incentive Plan, which will become
available for issuance under our 2011 Equity Incentive Award Plan after completion of this offering; and
- •
- shares of common stock that will be reserved for future issuance under our 2011 Equity Incentive Award Plan, as well as any automatic increases in the number of shares of our common stock reserved for future issuance under this benefit plan, which will become effective immediately prior to the consummation of this offering.
6
Except as otherwise indicated, all information in this prospectus assumes:
- •
- the automatic conversion of all outstanding shares of our redeemable convertible preferred stock into 58,461,447 shares of
common stock in connection with the consummation of this offering and the related conversion of an outstanding warrant exercisable for our redeemable convertible preferred stock into a warrant
exercisable for common stock;
- •
- the cash exercise of certain warrants outstanding to purchase shares of our common stock as of June 30, 2011, which
will expire upon completion of this offering if unexercised, resulting in the issuance of 2,621,985 shares of common stock for an aggregate exercise price of approximately $6.4 million; and
- •
- no exercise of the underwriters' over-allotment option.
7
Summary Consolidated Financial Data
The following table sets forth a summary of our historical consolidated financial data for the periods ended or as of the dates indicated. You should read this table together with our consolidated financial statements and the accompanying notes, "Selected Consolidated Financial Data" and "Management's Discussion and Analysis of Financial Condition and Results of Operations" appearing elsewhere in this prospectus. The summary consolidated financial data in this section is not intended to replace our consolidated financial statements and the accompanying notes. Our historical results are not necessarily indicative of our future results.
| |
Years Ended December 31, | Six Months Ended June 30, |
|||||||||||||||||
|---|---|---|---|---|---|---|---|---|---|---|---|---|---|---|---|---|---|---|---|
| |
2008 | 2009 | 2010 | 2010 | 2011 | ||||||||||||||
| |
|
|
|
(unaudited) |
|||||||||||||||
| |
(in thousands, except share and per share amounts) |
||||||||||||||||||
Consolidated Statement of Operations Data: |
|||||||||||||||||||
Revenue: |
|||||||||||||||||||
CDP and services revenue |
$ | 14,647 | $ | 14,182 | $ | 27,705 | $ | 9,806 | $ | 15,820 | |||||||||
Product revenue |
6,206 | 9,065 | 6,959 | 3,300 | 1,360 | ||||||||||||||
Licensing and royalty revenue |
2,276 | 3,663 | 8,010 | 3,386 | 6,644 | ||||||||||||||
Total revenue |
23,129 | 26,910 | 42,674 | 16,492 | 23,824 | ||||||||||||||
Cost of revenue |
12,625 | 13,018 | 20,926 | 8,752 | 11,323 | ||||||||||||||
Gross profit |
10,504 | 13,892 | 21,748 | 7,740 | 12,501 | ||||||||||||||
Operating expenses: |
|||||||||||||||||||
Research and development |
11,849 | 10,983 | 13,917 | 6,353 | 9,488 | ||||||||||||||
Sales and marketing |
3,849 | 3,211 | 4,074 | 1,926 | 1,980 | ||||||||||||||
General and administrative |
4,300 | 4,867 | 5,761 | 2,877 | 3,925 | ||||||||||||||
Total operating expenses |
19,998 | 19,061 | 23,752 | 11,156 | 15,393 | ||||||||||||||
Loss from operations |
(9,494 | ) | (5,169 | ) | (2,004 | ) | (3,416 | ) | (2,892 | ) | |||||||||
Other income (expense): |
|||||||||||||||||||
Interest income, net |
174 | (6 | ) | 43 | 17 | 10 | |||||||||||||
Other income (expense), net |
6 | (62 | ) | 202 | 55 | (335 | ) | ||||||||||||
Total other income (expense), net |
180 | (68 | ) | 245 | 72 | (325 | ) | ||||||||||||
Loss before provision for income taxes |
(9,314 | ) | (5,237 | ) | (1,759 | ) | (3,344 | ) | (3,217 | ) | |||||||||
Provision for income taxes |
186 | 17 | 19 | 2 | 13 | ||||||||||||||
Net loss |
(9,500 | ) | (5,254 | ) | (1,778 | ) | (3,346 | ) | (3,230 | ) | |||||||||
Accretion on redeemable convertible preferred stock |
(5,436 | ) | (9,170 | ) | (14,162 | ) | (6,340 | ) | (7,095 | ) | |||||||||
Net loss attributable to common stockholders |
$ | (14,936 | ) | $ | (14,424 | ) | $ | (15,940 | ) | $ | (9,686 | ) | $ | (10,325 | ) | ||||
Net loss per share of common stock, basic and diluted |
$ | (1.39 | ) | $ | (1.31 | ) | $ | (1.43 | ) | $ | (0.87 | ) | $ | (0.91 | ) | ||||
Weighted-average number of shares used in computing net loss per share of common stock, basic and diluted(1) |
10,716,462 | 11,023,779 | 11,134,573 | 11,115,486 | 11,296,902 | ||||||||||||||
Pro forma net loss per share of common stock, basic and diluted(1) |
$ | (0.03 | ) | $ | (0.04 | ) | |||||||||||||
Weighted-average number of shares used in computing pro forma net loss per share of common stock, basic and diluted(1) |
65,376,321 | 68,243,300 | |||||||||||||||||
Other Data: |
|||||||||||||||||||
Adjusted EBITDA(2)(unaudited) |
$ | (5,062 | ) | $ | 272 | $ | 4,589 | $ | (274 | ) | $ | 2,026 | |||||||
8
| |
As of June 30, 2011 | |||||||||
|---|---|---|---|---|---|---|---|---|---|---|
| |
Actual | Pro Forma(3) | Pro Forma as Adjusted(4) |
|||||||
| |
(unaudited) |
|||||||||
| |
(in thousands) |
|||||||||
Consolidated Balance Sheet Data: |
||||||||||
Cash, cash equivalents and short-term investments |
$ | 35,630 | $ | 42,006 | $ | |||||
Working capital |
23,927 | 30,973 | ||||||||
Total assets |
69,299 | 75,675 | ||||||||
Preferred stock warrant liability |
670 | — | ||||||||
Redeemable convertible preferred stock |
80,515 | — | ||||||||
Accumulated accretion of redeemable convertible preferred stock to redemption values |
41,521 | — | ||||||||
Total stockholders' (deficit) equity |
(73,175 | ) | 55,907 | |||||||
- (1)
- Please
see Note 9 to our audited consolidated financial statements for an explanation of the calculations of our basic and diluted net loss per share
of common stock and pro forma net loss per share of common stock.
- (2)
- The following table presents a reconciliation of adjusted EBITDA to our net loss, the most comparable GAAP measure, for each of the periods indicated:
| |
Years Ended December 31, | Six Months Ended June 30, | |||||||||||||||
|---|---|---|---|---|---|---|---|---|---|---|---|---|---|---|---|---|---|
| |
2008 | 2009 | 2010 | 2010 | 2011 | ||||||||||||
| |
|
|
|
(unaudited) |
|||||||||||||
| |
(in thousands) |
||||||||||||||||
Net loss |
$ | (9,500 | ) | $ | (5,254 | ) | $ | (1,778 | ) | $ | (3,346 | ) | $ | (3,230 | ) | ||
Non-GAAP adjustments: |
|||||||||||||||||
Revenue(a) |
— | — | — | — | 312 | ||||||||||||
Interest, net |
(94 | ) | 48 | 13 | (17 | ) | 445 | ||||||||||
Provision for taxes |
186 | 17 | 19 | 2 | 13 | ||||||||||||
Depreciation and amortization |
3,430 | 4,380 | 4,971 | 2,412 | 3,504 | ||||||||||||
Stock-based compensation expense(b) |
916 | 1,081 | 1,364 | 675 | 982 | ||||||||||||
Adjusted EBITDA (unaudited) |
$ | (5,062 | ) | $ | 272 | $ | 4,589 | $ | (274 | ) | $ | 2,026 | |||||
- (a)
- Reduction
in revenue as a result of common stock warrants issued in connection with a customer agreement
- (b)
- Includes stock-based compensation as follows:
| |
Years Ended December 31, | Six Months Ended June 30, |
|||||||||||||||
|---|---|---|---|---|---|---|---|---|---|---|---|---|---|---|---|---|---|
| |
2008 | 2009 | 2010 | 2010 | 2011 | ||||||||||||
| |
|
|
|
(unaudited) |
|||||||||||||
| |
(in thousands) |
||||||||||||||||
Cost of revenue |
$ | 71 | $ | 134 | $ | 285 | $ | 118 | $ | 233 | |||||||
Research and development |
170 | 222 | 204 | 118 | 191 | ||||||||||||
Sales and marketing |
408 | 378 | 422 | 231 | 303 | ||||||||||||
General and administrative |
267 | 347 | 453 | 208 | 255 | ||||||||||||
Total stock-based compensation |
$ | 916 | $ | 1,081 | $ | 1,364 | $ | 675 | $ | 982 | |||||||
- (3)
- The pro forma column in the consolidated balance sheet data table above reflects (i) the conversion of all outstanding shares of our redeemable convertible preferred stock into 58,461,447 shares of common stock immediately before the completion of this offering, (ii) the resulting reclassification of accumulated accretion of redeemable convertible preferred stock and preferred stock warrant liability to additional paid-in capital, (iii) the conversion of a warrant for redeemable convertible preferred stock into a warrant to purchase 168,747 shares of our common stock at an exercise price of $0.44 per share immediately before the completion of this offering and the resulting reclassification of the preferred stock warrant liability to additional paid-in capital and (iv) the cash exercise of certain warrants outstanding to purchase shares of our common stock as of June 30, 2011, which will expire upon completion of this offering if unexercised, and the resulting receipt of approximately $6.4 million in net proceeds and issuance of 2,621,985 shares of common stock.
9
- (4)
- The pro forma as adjusted column in the consolidated balance sheet data table above reflects (i) the conversion of all outstanding shares of our redeemable convertible preferred stock into 58,461,447 shares of common stock immediately before the completion of this offering, (ii) the resulting reclassification of accumulated accretion of redeemable convertible preferred stock and preferred stock warrant liability to additional paid-in capital, (iii) the conversion of a warrant for redeemable convertible preferred stock into a warrant to purchase 168,747 shares of our common stock at an exercise price of $0.44 per share immediately before the completion of this offering and the resulting reclassification of the preferred stock warrant liability to additional paid-in capital, (iv) the cash exercise of certain warrants outstanding to purchase shares of our common stock as of June 30, 2011, which will expire upon completion of this offering if unexercised, and the resulting receipt of approximately $6.4 million in net proceeds and issuance of 2,621,985 shares of common stock, and (v) the issuance of the shares offered by us in this offering and the net proceeds therefrom at an assumed initial public offering price of $ (the midpoint of the price range set forth on the cover page of this prospectus).
10
Investing in our common stock involves a high degree of risk. You should carefully consider the following risk factors, as well as the other information in this prospectus, before deciding whether to invest in shares of our common stock. The occurrence of any of the events or circumstances described below or other adverse events could harm our business, financial condition, results of operations and growth prospects. If such an event or circumstance were to occur, the trading price of our common stock may decline and you may lose all or part of your investment. Additional risks or uncertainties not presently known to us or that we currently deem immaterial may also harm our business.
Risks Related to Our Financial Condition and Business
We have a limited operating history, which makes it difficult for investors to evaluate our current business and future prospects.
We were incorporated in June 2004 and do not have a long history of operating results on which you can base your evaluation of our business. We are still proving our business model, and we have not yet demonstrated our ability to generate significant revenue, particularly licensing and royalty revenue. As a result, it may be difficult for public market analysts and investors to evaluate our future prospects. If we do not generate significant licensing and royalty revenue, we may never be profitable. Furthermore, because of our limited operating history and because the semiconductor and clean-energy industries are rapidly evolving, we have limited experience in analyzing and understanding the trends that may emerge and affect our business. If we are unable to obtain significant licensing and royalty revenue from products that incorporate technology developed through our collaborative development programs (CDPs), we will have expended a significant amount of time and resources without obtaining the benefits we anticipated, and our financial condition and results of operations would be materially and adversely affected.
Our operating results may fluctuate from quarter to quarter, which may make it difficult to predict our future performance and may result in volatility in the market price of our common stock if we fail to meet the expectations of public market analysts and investors in these periods.
Our revenue, expenses and operating results have fluctuated, and may in the future fluctuate significantly from quarter to quarter due to a number of factors, many of which are outside our control. Factors that may contribute to these fluctuations include the following, as well as other factors described elsewhere in this prospectus:
- •
- our dependence on a limited number of customers;
- •
- our ability to manage our growth, including an increasing number of employees, customers and CDPs;
- •
- the length of our sales and development cycles, and our ability to generate material revenue after we have devoted
significant resources to developing a project;
- •
- our ability to evolve existing products, anticipate trends in technology development and introduce new developments in a
timely manner in the rapidly changing semiconductor and clean-energy industries;
- •
- our customers' ability to manufacture, market and sell products that incorporate technology developed through the CDPs;
- •
- fluctuations in the number and price of products sold by our customers that incorporate technology developed through the CDPs, and the shortening life cycles of those products, in each case impacting our licensing and royalty revenue;
11
- •
- our ability to scale our development efforts, our ability to secure new CDPs with new or existing customers and the timing
of those CDPs;
- •
- the degree to which existing CDPs are completed or expanded;
- •
- one-time, non-cash charges to revenue associated with the vesting of contingent warrants issued to
two of our customers that are currently outstanding;
- •
- our ability to maintain existing commercial terms or enter into new licensing arrangements with our customers once they
begin to sell their end products;
- •
- our ability to make the substantial research and development (R&D) investments required to stay competitive in our
business;
- •
- our ability to develop our high productivity combinatorial (HPC) platform and expertise to support our future growth plans
in adjacent vertical markets such as clean-energy markets;
- •
- any potential involvement in intellectual property litigation;
- •
- any potential payments to our customers resulting from our intellectual property indemnification policies and obligations;
- •
- our reliance on our customers to deliver timely and accurate information to accurately report our financial results from
licensing and royalty revenue;
- •
- our potential need for additional capital to finance our business;
- •
- any delay in shipments caused by shortages of components incorporated in our customers' products, design errors or other
manufacturing problems associated with our customers' products;
- •
- the highly cyclical nature of and price volatility in the semiconductor industry;
- •
- the emerging and uncertain nature of the clean-energy industry;
- •
- potential warranty claims, product recalls and product liability for our HPC tools and for our customers' products that
incorporate technology developed through our CDPs;
- •
- global or regional economic, political and social conditions; and
- •
- business interruptions such as earthquakes and other natural disasters.
Due to these factors and other risks discussed in this section, you should not rely on quarter-to-quarter comparisons to predict our future performance. Our revenue mix may also vary from quarter to quarter as we enter into new CDPs and related customer arrangements, existing CDPs are completed or expanded and licensing and royalty arrangements take effect. Unfavorable changes in any of these factors may adversely affect our business and operating results. Additionally, our common stock could be subject to significant price volatility should our actual or projected revenue or earnings fail to meet the expectations of the investment community. Furthermore, stocks of high technology companies are subject to extreme price and volume fluctuations that are often unrelated or disproportionate to the operating performance of those companies.
We have incurred operating losses since our inception and may not be able to achieve or maintain profitability.
We have generated net losses each year since our inception, including $3.2 million for the six months ended June 30, 2011 and $1.8 million and $5.3 million for the years ended December 31, 2010 and 2009, respectively. Our accumulated deficit as of June 30, 2011 was $73.2 million. We will need to significantly increase revenue to achieve profitability and we may not achieve or subsequently maintain
12
profitability if our revenue increases more slowly than we expect or not at all. Our ability to achieve our objectives and achieve or maintain the profitability of our business will depend, in large part, on potential customers accepting our HPC platform and methodology as effective tools in the development of new products; and on our success in helping our customers develop products that are successful in the marketplace. Historically, semiconductor companies have conducted R&D activities internally using traditional research methods. In order for us to achieve our business objectives, we must convince these companies that our technology and capabilities justify collaborating with us on their basic R&D programs. We must also convince potential customers in the clean-energy industry that our HPC platform and approach are useful tools in an emerging industry. We cannot assure you we will achieve the levels of customer acceptance necessary for us to maintain and grow a profitable business. Our ability to achieve profitability also depends upon many other factors, including many that are beyond our control. These factors include, without limitation:
- •
- changes in the demand for our products and services;
- •
- the introduction of competitive technologies;
- •
- our ability to engage with new customers that would use our technology and expertise to further develop and commercialize
their products;
- •
- our ability to enter into CDPs with customers who are or become market leaders;
- •
- the competitiveness and financial strength of our existing and potential customers;
- •
- changes in the R&D budgets of our customers and potential customers;
- •
- our ability to develop our technology for and secure customers in the clean-energy industry; and
- •
- our participation in the development of products that our customers choose to commercialize that generate a substantial stream of licensing and royalty revenue for us.
In addition, we expect to continue to incur significant expenses or revenue adjustments in connection with, among other things:
- •
- increased R&D spending, including expansion of our R&D teams and workflow platforms;
- •
- expansion of our sales and marketing efforts;
- •
- additional non-cash charges relating to amortization of intangibles and deferred stock compensation; and
- •
- one-time, non-cash charges to revenue associated with the vesting of contingent warrants issued to two of our customers that are currently outstanding.
We cannot assure you we will achieve the levels of customer acceptance necessary for us to maintain and grow a profitable business, or that any of these other factors will be satisfactory. Also, we cannot assure you that customers, even those that accept our HPC platform as a valid tool for R&D, will be satisfied with the integrated devices developed through our CDPs or will be able to successfully commercialize end products incorporating the developed technology. Failure to achieve the necessary customer acceptance or extend or add current or new customer relationships, as well as difficulty with any of these other factors would adversely affect our revenue and profitability and our financial condition and results of operations would be materially and adversely affected.
We depend on a limited number of customers, which have historically been in the semiconductor industry, and a loss of any of them would adversely affect our business and operating results.
Our customer base is highly concentrated. Revenue has historically come from a few customers, and we expect that revenue from a small number of customers will continue to account for a high
13
percentage of our revenue for the foreseeable future. Due to the concentrated nature of manufacturers in the DRAM, flash memory and complex logic markets, our revenue is and may continue to be concentrated among and reliant upon key high-volume customers. For example, our four largest customers in the six months ended June 30, 2011, all of which are in the semiconductor industry, accounted for 75% of our revenue, and our two largest customers for the years ended December 31, 2010 and 2009, both of which are in the semiconductor industry, accounted for 72% and 88% of our revenue, respectively. Our largest customer accounted for 33%, 52% and 59% of our revenue in each of these periods, respectively. The loss of any of these customers or a decrease in the manufacturing or sales volumes of their products, and the related impact on our future anticipated licensing and royalty revenue, would materially and adversely affect our business, financial condition or results of operations, and we may not be able to replace the business from these customers. In addition, this type of loss could cause significant fluctuations in our results of operations because our expenses are fixed in the short term and our sales and development cycle to obtain new customers is long.
Our rapid growth has presented significant challenges to our management and administrative systems and resources, and we may experience difficulties managing our growth, particularly as we handle the additional responsibilities of becoming a public company, which could adversely affect our business and operating results.
We will need to continue to grow in all operational areas and to successfully integrate and support our existing and new employees, which may make it difficult to implement our business strategy in the time frame we anticipate, if at all. Our business has grown rapidly, and we expect this growth to continue as we expand our R&D capacity for current and additional CDPs. For example, we had 190 full-time employees as of June 30, 2011 and 107 employees at the end of 2008. The rapid expansion of our business and addition of new personnel has placed a strain on our management, operational systems and facilities and may continue to do so. To effectively manage our operations and growth as well as our new obligations as a public company, we must continue to expend funds to enhance our operational, financial and management controls, reporting systems and procedures and to attract and retain sufficient numbers of talented employees. If we are unable to expand our R&D capacity and implement improvements to our control systems efficiently and quickly, or if we encounter deficiencies in existing systems and controls, then we will not be able to successfully grow our business as planned. Our future operating results will also depend on our management's ability to:
- •
- implement and improve our sales, marketing and customer support programs and our R&D efforts;
- •
- enhance our operational and financial control systems;
- •
- expand, train and manage our employee base;
- •
- integrate any acquired businesses; and
- •
- effectively address new issues related to our growth as they arise.
We may not manage our expansion successfully, which could adversely affect our business, financial condition or results of operations.
Our business prospects and future growth depend on royalties, which may be difficult to structure and enforce.
We believe that our royalty-bearing licenses with our customers lay the framework for ongoing royalty revenue from our customers' products that incorporate technology developed through our CDPs with these customers, and that this revenue stream will increase as revenue from products developed using our platform increases. We are dependent upon our ability to structure, negotiate and enforce agreements for the determination and payment of royalties. Unless we adequately demonstrate the value of our platform to our potential customers we may face resistance to structuring royalty arrangements in the future that are acceptable to us, or our customers may not agree to enter into
14
royalty-bearing licenses with us at all. If we are unable to maintain the royalty-bearing license aspect of our business model, our operating results would suffer and we may not achieve profitability.
Our sales cycles are long, and we commit significant resources to a project before we have any commitment that a potential customer may agree to use our platform or service. One or more failures to enter into a CDP after we have devoted significant resources to a project could adversely affect our business and operating results.
Our sales efforts require us to educate our potential customers about the benefits of our solutions, which often requires significant time and expense, including a significant amount of our senior management's time and effort. Our sales cycles to date have typically ranged from 9 to 24 months and may be even longer in the future. Furthermore, we need to target those individuals within a customer's organization who have overall responsibility for the profitability of their products. These individuals tend to be senior management or executive officers. We may face difficulty identifying and establishing contact with these individuals. In addition, our customers' technology and product pipeline are highly confidential and they may choose to withhold certain information from us during the sales cycle to protect their own proprietary technology. Our ability to implement our HPC platform and methodology is heavily dependent upon the information provided to us by our customers. If our customers reveal the complexities of their specifications after we enter into a CDP with them, that complexity may cause delays unanticipated at the time we entered into the program. During our sales cycles, we incur significant expenses and, in many cases, may begin to build, configure or expand new systems, develop software and design workflows to meet our customers' requirements prior to obtaining contractual commitments, without any assurance of resulting revenue. Where a potential customer engagement requires a new dedicated HPC platform, we may invest in new HPC capacity ahead of a customer commitment. Our HPC platform build, configuration and customization cycles to date have ranged from three to nine months and may be even longer in the future. Investment of time and expense in a particular customer engagement that does not ultimately result in material revenue will adversely affect our revenue and results of operations. Other factors impacting sales and the length of our sales and development cycles include, but are not limited to, the following:
- •
- the complexity and cost of our HPC platform and difficulties we may encounter in meeting individual customer
specifications and commitments;
- •
- our ability to build, configure or expand new systems, develop software and design workflows to meet our customers'
requirements;
- •
- the limited number of customers that are appropriate sales targets for our platform and that are willing to enter into
licensing agreements with us;
- •
- our customers' budgetary constraints and internal review procedures that must be completed to begin collaboration with us;
and
- •
- the cultural transition required for a customer's internal R&D team to embrace us as a collaborative partner.
The semiconductor industry is rapidly changing and an inability to evolve existing products in a timely manner, anticipate trends in technology development and introduce new technologies could adversely affect our business and operating results.
We must continually devote significant engineering resources to keep up with the rapidly evolving technologies, materials and equipment used in semiconductor design and manufacturing processes. These innovations are inherently complex and require long development cycles. The semiconductor industry is subject to a number of evolving trends, including:
- •
- the growing varieties of semiconductor architecture, applications and processes;
15
- •
- differing market growth rates and capital requirements for different applications, such as flash memory, DRAM, logic and
foundry, and the resulting effect on customers' spending patterns and on our ability to compete in these market segments;
- •
- the importance of growing market positions in larger market segments;
- •
- the increasing consolidation of semiconductor manufacturing towards foundries and large scale manufacturers and subsequent
concentration of research and innovation in manufacturing process development; and
- •
- the cost, technical complexity and timing of a proposed industry transition from 300mm to 450mm wafers.
These and other changes could have a material impact on our business. Not only do we need the technical expertise to implement the changes necessary to keep our technologies current, but we also rely heavily on the judgment of our management and advisors to anticipate future market trends. Our customers expect us to stay ahead of the technology curve in their sectors and expect that the technology developed through our CDPs will help them develop new products that keep pace with or push the limits of technological innovation. If we are not able to accurately predict industry changes, or if we are unable to apply our HPC platform to our customers' needs on a timely basis, our existing solutions will be rendered obsolete and we may lose customers. If we do not keep pace with technology, our existing and potential customers may choose to develop their own solutions internally as an alternative to ours, and we could lose market share to competitors, which could adversely affect our operating results.
The clean-energy industry is in a very early stage of development, and we may not earn significant revenue from our initiatives in this industry for an extended period, if ever.
Most sectors of the clean-energy industry are in the very early stages of development. Many of the associated technologies have not yet achieved commercial viability in comparison to available alternatives, and may never achieve market adoption. Many of the associated technologies will require substantial investments of capital to achieve scale, which may not be available on attractive terms, if at all. Companies within the clean-energy industry may also be hesitant to enter into CDPs with us given our recent entry into the clean-energy industry. Certain technologies may depend on government subsidies to be commercially viable, and those subsidies may not be available from federal and state governments facing increasing financial constraints. If sectors of the clean-energy industry take an extended period to achieve market acceptance and to garner significant revenue, we may not earn material revenue from our initiatives in this area until such time, if ever. Furthermore, it may be difficult for us to predict which clean-energy companies may become market leaders, and we may invest time and resources in collaborations with companies who are ultimately unsuccessful in the clean-energy industry, which could adversely affect our operating results.
If a project to which we have devoted technology and significant resources fails to produce any measurable success or value to our customers in the form of differentiated technology and intellectual property, we may not earn licensing and royalty revenue sufficient to recover the upfront costs and cash invested in the CDP, which could adversely affect our results of operations.
In some cases, the revenue we receive from our customers during the development stage is not sufficient for us to fully recover our costs and cash invested in HPC platforms dedicated to customer engagement, and our business model relies on licensing and royalty revenue based on the sales by our customers in the end-markets of products incorporating the technology developed through our CDPs. Our CDPs involve complex R&D, and our ability to develop the differentiated technology and intellectual property sought by our customers is inherently uncertain and difficult to predict. In addition, there are a limited number of CDPs to which we can commit our resources at any given time.
16
If a project to which we have devoted technology and significant resources fails to produce any measurable success or value to our customers in the form of differentiated technology and intellectual property that they may use in their products, we may not receive meaningful amounts of, or any, licensing and royalty revenue. In this case, we may not recover the upfront costs and cash invested in the CDP, which could adversely affect our results of operations. In addition, even if we successfully develop differentiated technology and intellectual property through a CDP that our customer is able to commercialize, there may be a significant delay before we receive any licensing or royalty revenue due to the complexities inherent in production and manufacturing in our target markets.
A decline in sales in the end markets for products incorporating technology developed through our CDPs could adversely affect our business and results of operations.
Our success is tied to our customers' ability to successfully commercialize the products that incorporate technology developed through our CDPs. The markets for our customers' products are intensely competitive and are characterized by rapid technological change. These changes result in frequent product introductions, short product life cycles and increased product capabilities. Competition is based on a variety of factors including price, performance, product quality, software availability, marketing and distribution capability, customer support, name recognition and financial strength. Products incorporating the technology developed through our CDPs may not achieve market success or may become obsolete. We cannot assure you that our customers will dedicate the resources necessary to promote and commercialize products developed through our CDPs, successfully execute their business strategies for such products, be able to manufacture such products in quantities sufficient to meet demand or cost-effectively manufacture products at high volume. Our customers are not contractually obliged to manufacture, distribute or sell any products incorporating our CDP-developed technology. Our customers may develop internally or in collaboration with others technology that they might utilize instead of technology developed through our CDPs. Any of these factors, as well as more general market or industry issues, could result in a decline in sales of the products incorporating our technology, which would result in a decrease in any associated licensing and royalty revenue or the failure of any licensing and royalty revenue to materialize at all, and could adversely affect our business and results of operations. Any failure of a customer to achieve market success for products developed through our CDPs could also negatively affect such customer's willingness to work with us on other collaborations and could more generally harm our reputation and business prospects.
If we are unable to scale our development services and secure new CDPs, our growth prospects would be limited and our business and operating results could be adversely affected.
Our customers require a significant amount of individualized attention as well as dedicated lab space for CDPs. We have limited space and internal capacity, both in terms of personnel as well as capital equipment resources, to meet these types of demands for our customers. In addition, because of the significant confidentiality concerns associated with the projects and products we work on and the restrictions on resource and information sharing we have implemented in response, we are not able to fully capitalize upon economies of scale. If the demand for our services and products exceeds our capacity to meet such demand, we may be required to turn down potential opportunities, which would cause us to lose potential revenue, and our potential customers may take their business to a competitor or decide to develop or expand internal R&D capabilities. If we are unable to scale our development services to meet demand, our growth may be hindered and our business and operating results could be adversely affected.
17
We may not be successful in maintaining and managing CDPs, which would adversely affect our ability to develop successful products and our financial condition and operating results.
CDPs are complex and time-consuming to implement and they may require substantial resources to maintain. We may not be successful in all of our collaboration efforts and may fail to achieve the technological innovations sought by our customers in a reasonable amount of time or at all. When we collaborate with a customer, we rely to some degree on the efforts and resources of that customer. Our customers may not devote sufficient resources to collaborations or may otherwise fail in the aspects of the collaboration for which they are responsible. Disagreements over the implementation and management of the program may occur, which could lead to material delays and/or a failure to achieve the successful development of technology through the CDP. If we fail to achieve successful collaborations, or if our customers are dissatisfied with the results of or the way we design and manage a CDP, our operating results and financial condition would be materially and adversely affected.
Our strategy includes conducting proprietary R&D efforts in collaboration with and on behalf of multiple customers. Failure to adequately protect against potential conflicts of interest and breaches of confidentiality would harm our reputation and our relationships with our customers, and our business prospects and operating results would be adversely affected. Moreover, some potential customers may hesitate to grant us access to their proprietary information, which could impair our ability to provide value for such customers.
Our strategy includes conducting proprietary R&D efforts in collaboration with and on behalf of customers who in some cases may have overlapping interests and technologies. We seek to structure our collaborative agreements and business practices to minimize any potential conflicts and the possibility of any breaches of confidentiality. We may need access to some of our customers' proprietary information, and they may be reluctant to share it with us because of the risk of a potential conflict between us and/or our customers and other potential customers and the risk of a breach of confidentiality. Our failure to do so could result in our inability to attract new customers or retain existing customers, or lead to our having incomplete information with respect to existing customers that could impair our ability to fully address the customers' needs and demonstrate the value of our technology to the customers. Even if we make significant efforts to isolate each development activity, we may fail to meet the contractual confidentiality commitments as to one or more customers. Moreover, even if we meet these commitments, conflicts between a customer and us, or between or among customers, could nevertheless arise. In either event, we may become involved in a dispute with our customers regarding the solutions developed during the collaboration or the rights to these solutions, including possible litigation. Disputes of this nature could harm the relationship between us and our customers, and could adversely affect our ability to enter into new CDPs and cause our revenue and operating results to decline.
We may be unable to make the substantial R&D investments required to remain competitive in our business.
The semiconductor and clean-energy industries require substantial investment in R&D to develop and bring to market new and enhanced technologies and products. To remain competitive, we anticipate that we will need to maintain or increase our levels of R&D expenditures to keep pace with the development efforts of our customers. We expect R&D expenses to increase in absolute dollars for the foreseeable future, due to the increasing complexity and number of solutions we plan to develop both for our customers and internally, the expansion of our customer base and any associated increase in upfront R&D costs. In addition, the ultimate success of products incorporating our technology will depend in part on significant continued investment in R&D by our customers. We do not know whether we or our customers will have sufficient resources to maintain or increase the level of investment in R&D required to remain competitive. In addition, we cannot assure you that the technologies, products and applications on which we and our customers have focused our R&D expenditures will become commercially successful. If we are required to invest significantly greater
18
resources than anticipated in our R&D efforts without a corresponding increase in revenue, our operating results could be materially and adversely affected.
If we are unable to develop our platform and expertise to support our future growth plans, our business and operating results could be adversely affected.
We intend to further develop and broaden our HPC platform, including our software and informatics capabilities, to address a wider range of markets and customers for multiple applications within semiconductors, flat glass, solar cells, light emitting diodes (LEDs), flat-panel displays, advanced batteries and other energy-efficient technologies. However, we have limited expertise and experience in certain of these fields, and if we are unable to develop our platform and expertise to support these fields our business growth might be limited, and our business and operating results could be adversely affected.
If we lose one or more of our key personnel without obtaining adequate replacements in a timely manner or if we are unable to retain and recruit skilled personnel, our operations could become disrupted and the growth of our business could be delayed or restricted.
Our success depends, in large part, on the continued contributions of our senior management team, in particular, the services of Mr. David Lazovsky, our President and Chief Executive Officer, and Dr. Tony Chiang, our Chief Technology Officer. If we lose the services of Mr. Lazovsky or Dr. Chiang, it could slow the execution of our business plan, hinder our development processes and impair our sales efforts, and searching for a replacement could divert our other senior management's time and increase our operating expenses. In addition, our customers could become concerned about our future operations, which could harm our reputation.
None of our senior management is bound by written employment contracts to remain with us for a specified period. The loss of any of our senior management could harm our ability to implement our business strategy and respond to the rapidly changing market conditions in which we operate. Upon hiring or promotion, new senior management personnel must spend a significant amount of time learning our technology, business model and management systems and their new roles, in addition to performing their regular duties. Accordingly, until new senior personnel become familiar with our technology, business model and systems or with their new roles, we may experience some disruption to our ongoing operations. Moreover, the loss of a member of our senior management or our professional staff would require the remaining management to divert attention to seeking a replacement.
Our future success and competitiveness depends on our ability to retain and motivate our unique team of highly skilled scientists and engineers, who have expertise across various disciplines, fields and technologies, including engineering, materials science, process development and integration, equipment, device process technologies and device integration. In addition, as we grow, we will have to continue to retain, attract and motivate qualified and talented personnel, including our scientists and engineers, management, sales and marketing and legal and finance personnel. Because our CDPs are customer-specific and project-specific and last for a significant period of time, the loss of key scientists or engineers or other personnel could have an adverse effect on a particular development program and on our ability to deliver results to a customer in a timely manner or at all. We do not know whether we will be able to retain all of these employees as we continue to pursue our business strategy. Competition for personnel is intense in the semiconductor and clean-energy industries.
We may encounter difficulties in hiring qualified scientists and engineers because there is a limited pool of scientists and engineers with the specialized expertise required to understand and implement our platform in conjunction with our customers. Further, we may have difficulty in obtaining visas permitting entry for some of our employees who are foreign nationals into the United States, and delays in obtaining visas permitting entry into other key countries for several of our key personnel,
19
which could disrupt our ability to strategically locate our personnel. The loss of the services of key employees or our inability to retain, attract and motivate qualified scientists and engineers could have a material adverse effect on our business, financial condition and results of operations.
Following the completion of this offering, we may have a financial obligation to Symyx Technologies, Inc.
In connection with an agreement for the purchase of intellectual property and the termination of our royalty obligations under an existing license agreement, we have an obligation to issue a promissory note to Symyx Technologies, Inc. (Symyx), a wholly-owned subsidiary of Accelrys, Inc., upon the consummation of this offering to the extent the gross proceeds from Symyx's sale of shares in this offering (before deducting underwriting discounts and commissions and estimated offering expenses) are less than $67 million. At an assumed initial public offering price of $ per share (the midpoint of the price range set forth on the cover page of this prospectus) the gross proceeds from the sale of Symyx's shares would be $ million, and we would have a $ obligation to Symyx. A $1.00 increase (decrease) in the assumed initial public offering price of $ per share would increase (decrease) the gross proceeds to Symyx by $ million. Such note, if issued, would have a term of 24 months and an interest rate equal to 4%. Such note would be payable in an amount equal to the lesser of the principal amount and the greater of $500,000 per quarter or the amount of accrued interest, with a balloon payment at maturity if applicable. Such note would also be pre-payable by us at any time without penalty or premium, and would be secured by tangible personal property, excluding intellectual property. If we issue such note, a portion of the net proceeds of this offering received by us would be used to make payments of scheduled interest and payment of principal at any time at or prior to maturity. Such financial obligation would limit our ability to use the net proceeds of this offering for other purposes.
We may be unable to effectively protect our intellectual property, which would negatively affect our ability to compete.
We depend on our proprietary HPC platform for our success and ability to compete. If others are able to reproduce our technology, our business will suffer significantly unless we can prevent them from competing with us. As of September 1, 2011, we owned 106 U.S. patents and patent applications (most of which also have foreign counterparts), which we believe protect our rights in our HPC platform, and we continue to file patent applications to seek protection for the further evolution of our HPC platform. Patent laws provide only limited protection, however. We cannot assure you that all maintenance fees have been paid or that all filings have been made with the appropriate regulatory or governmental authorities with respect to any IP registered or applied for outside of the U.S. that we purchase. Also, patent protection in foreign countries may be limited or unavailable where we need this type of protection. A more detailed description of how we protect our IP is set forth in the section entitled "Business—Intellectual Property."
The patent positions of technology companies, including ours, are often uncertain and involve complex legal and factual questions. We will be able to protect our proprietary rights from unauthorized use by third parties only to the extent that our proprietary technologies are covered by valid and enforceable patents or are effectively maintained as trade secrets. We apply for patents covering our HPC platform and further advancements of our HPC platform as we deem appropriate. However, we may not obtain patents on all inventions for which we seek patents, and any patents we obtain may be challenged (both before and after any such patents issue) and may be narrowed in scope or extinguished as a result of these challenges. Additional uncertainty may result from potential passage of patent reform legislation by the United States Congress, legal precedent as handed down by the United States Federal Circuit and Supreme Court as they determine legal issues concerning the scope and construction of patent claims and inconsistent interpretation of patent laws by the lower courts. For these reasons, among others, our existing patents and any future patents we obtain may not be sufficiently broad to prevent others from practicing our technologies or from developing similar or superior products. In that case, our revenue and operating results could decline.
20
Our strategy includes obtaining patent protection for technology developed in collaboration with our customers. A portion of our revenue from our customers derives from the licenses granted to our customers under these patents. If we are unable to obtain this type of protection, we would not be able to enforce exclusive rights to the technologies in question, and our revenue and operating results could decline.
We have in the past, and may in the future, develop patented technology with U.S. federal government funding. When new technologies are developed with U.S. government funding, the government obtains certain rights in any resulting patents, including a nonexclusive license authorizing the government to use the invention for non-commercial purposes. These rights may permit the government to disclose our confidential information to third parties and to exercise "march-in" rights to use or allow third parties to use our patented technology. The government can exercise its march-in rights if it determines that action is necessary because we fail to achieve practical application of the U.S. government-funded technology, because action is necessary to alleviate health or safety needs, to meet requirements of federal regulations, or to give preference to U.S. industry. In addition, U.S. government-funded technology may be subject to restrictions on transfer to foreign entities, and some U.S. government-funded data may be subject to public disclosure under the Freedom of Information Act.
Many of our customers and competitors have significant operations outside the United States. Foreign laws may not afford us sufficient protections for our intellectual property, however, and we may not always seek patent protection outside the United States. We believe that our success depends, in part, upon our ability to obtain international protection for our IP. However, the laws of some foreign countries may not be as comprehensive as those of the United States and may not be sufficient to protect our proprietary rights abroad. Accordingly, our international competitors could obtain foreign patent protection for, and market overseas, products and technologies for which we are seeking patent protection in the United States.
Confidentiality agreements with employees and others may not adequately prevent disclosures of trade secrets and other proprietary information.
We rely in part on trade secret protection to protect our confidential and proprietary information and processes. However, trade secrets are difficult to protect. We have taken measures to protect our trade secrets and proprietary information, but these measures may not be effective. We require new employees and consultants to execute confidentiality agreements upon the commencement of an employment or consulting arrangement with us. These agreements generally require that all confidential information developed by the individual or made known to the individual by us during the course of the individual's relationship with us be kept confidential and not disclosed to third parties. These agreements also generally provide that inventions conceived by the individual in the course of rendering services to us shall be our exclusive property. Nevertheless, employees, collaborators or consultants may still disclose or misuse our confidential information, and we may not be able to meaningfully protect our trade secrets. In addition, others may independently develop substantially equivalent information or techniques or otherwise lawfully gain access to our trade secrets, and thereafter communicate this information to others without maintaining its confidentiality. Costly and time-consuming litigation could be necessary to enforce and determine the scope of our proprietary rights, and failure to obtain or maintain trade secret protection could adversely affect our competitive business position.
21
Significant litigation over intellectual property in the industry may cause us to become involved in costly and lengthy litigation, which could subject us to liability, require us to stop licensing our developed technology or force us to develop new technology.
Whether or not patents are granted to us, litigation may be necessary to enforce our IP rights, to defend against a claim of infringement of IP rights of others or to determine the validity and scope of the proprietary rights of others. Because infringement is a fact-intensive inquiry, and because patent applications in the United States and many foreign jurisdictions are typically not published until eighteen months after filing (or, in some cases, are not published until they issue as patents), we cannot be certain that we do not now, and will not in the future, infringe a third party's patent rights. We may also become party to claims by our customers to IP rights developed by us in connection with a CDP. If our customers become involved in disputes with third parties over allegations that our customers' practice of our IP rights infringes the IP rights of such third parties, it may also become necessary for us to become involved in such disputes.
Any claim, even if without merit, could be time consuming to defend, result in costly litigation, or require us to enter into licensing agreements, resulting in unexpected operating costs. Moreover, our opponents in any litigation may have significantly more resources with which to defend against or assert claims in the litigation. A successful claim of infringement against us in connection with the use of our technologies could force us to stop using our technologies that incorporate the infringed IP; pay substantial monetary damages or royalties; grant cross-licenses to third parties relating to our own IP; obtain a license from the owner of the infringed IP, which may not be available to us on acceptable terms or at all; or re-engineer our platform or products to avoid further IP infringement, which may be technically impossible or commercially infeasible. The occurrence of any of these eventualities could adversely affect our business Even if we are successful in defending such a claim, litigation could also divert our resources, including our managerial and engineering resources. Any infringement claim or other litigation against or by us could have a material negative effect on our business.
Our intellectual property indemnification policies and obligations may adversely impact our business and operating results.
Any assertion by a third party asserting ownership or other rights to technology developed through our CDPs could result in our customers becoming the target of litigation and we may be bound to indemnify our customers under the terms of our license agreements. These obligations could result in substantial expenses to us, which could have a material adverse effect on our business, financial condition and results of operations. In addition to the time and expense required for us to satisfy our support and indemnification obligations to our customers, any litigation could severely disrupt or shut down the business of our customers, which in turn could damage our relations with them and have a material adverse effect on our reputation, business, financial condition and results of operations.
We will need to rely on our customers to deliver timely and accurate information to accurately report our financial results from licensing and royalty revenue in the time frame and manner required by law.
We will need to receive timely, accurate and complete information from our customers to accurately report our financial results on a timely basis. Licensing and royalty revenue we may receive in the future may be based on the revenue from the sale of our customers' products that incorporate technology developed through our CDPs, and we will need to rely on our customers to provide us with complete and accurate information regarding revenue and payments owed to us on a timely basis. If the information that we receive is not accurate, we may not receive the full amount of revenue that we are entitled to under these arrangements on a timely basis, which could result in adjustments to our financial results in a future period. Although we typically have audit rights with these parties, performing this type of audit could be harmful to our collaborative relationships, expensive and
22
time-consuming and may not be sufficient to reveal any discrepancies in a timeframe consistent with our reporting requirements.
We may need additional capital in the future to finance our business.
Our future capital requirements may be substantial, particularly as we continue to develop our business and expand our collaborative development efforts. Although we believe that, based on our current level of operations and anticipated growth, our existing cash, cash equivalents and marketable securities, combined with the net proceeds from this offering, will provide adequate funds for ongoing operations, planned capital expenditures and working capital requirements for at least the next 12 months, we may need additional capital if our current plans and assumptions change. Our need for additional capital will depend on many factors, including the financial success of our business, whether we are successful in obtaining payments from customers, whether we can enter into additional collaborations, the progress and scope of collaborative R&D projects performed by us and our customers, the effect of any acquisitions of other businesses or technologies that we may make in the future, the filing, prosecution and enforcement of patent claims, how quickly we expand, how much we need to develop or enhance our solutions or HPC platform and any necessary responses to competitive pressures.
If our capital resources are insufficient to meet our capital requirements, and our revenue is insufficient to support any of these activities, then we will have to raise additional funds. If future financings involve the issuance of equity securities, our then-existing stockholders would suffer dilution. If we raised additional debt financing, we may be subject to restrictive covenants that limit our ability to conduct our business. We may not be able to raise sufficient additional funds on terms that are favorable to us, if at all. If we fail to raise sufficient funds and continue to incur losses, our ability to fund our operations, take advantage of strategic opportunities, develop products or technologies or otherwise respond to competitive pressures could be significantly limited. If this happens, we may be forced to delay or terminate R&D programs, curtail or cease operations, obtain funds through collaborative and licensing arrangements that may require us to relinquish commercial rights, or grant licenses on terms that are not favorable to us. If adequate funds are not available, we may not be able to successfully execute our business plan or continue our business.
Failure of suppliers to timely deliver sufficient quantities of the components, materials or software used in our collaborations, may result in delays or other disruptions in executing our CDPs, which could adversely affect our business and operating results.
We have historically relied on a small number of contract manufacturing companies for the manufacture and assembly of a majority of our HPC tools. While we are not dependent on any single contract manufacturing company, key parts of our tools are currently available only from a limited number of sources. In addition, components of our capital equipment are available from only a few suppliers. If supplies from these vendors are delayed or interrupted for any reason, we may not be able to get equipment or components for our tools or our own research efforts in a timely fashion or in sufficient quantities or under acceptable terms, if at all. Even though alternative sources of supply would be available, it could be time-consuming and expensive for us to qualify new vendors and work with them to integrate our designs into the tools they manufacture for us. In addition, we depend upon our vendors to provide components of appropriate quality and reliability. Consequently, if supplies from these vendors were delayed or interrupted for any reason, it could materially and adversely affect our business.
23
Our business strategy requires us to evaluate, integrate and develop elements of our customers' value chains, including development and manufacturing processes. Our ability to evaluate these effectively may sometimes depend on the cooperation from our customers' materials suppliers and equipment manufacturers as well as access to their data and tools. If these third parties do not cooperate with us or provide us access to the necessary materials, tools or equipment we may not be able to deliver effective solutions to our customers, which would adversely affect our business and results of operations.
We have to evaluate multiple elements of our customers' value chains to help them test and develop end products that meet their specifications, including the materials, tools and equipment used by them during the manufacturing process. Our ability to evaluate a customer's value chain effectively may sometimes depend on cooperation from such customer's materials suppliers and equipment manufacturers and on access to their data and tools. Our evaluation of the materials and equipment in the value chain must be unbiased to maintain credibility with our customers, and our evaluation sometimes results in recommendations that our customers change materials, tools or equipment. Our recommendations may negatively impact our relationships with materials and tool providers and equipment manufacturers. Tensions in our relationships with these providers and manufacturers may cause these parties to limit or deny our access to their newest materials and equipment, which would in turn limit our ability to complete our development activities with our customers or control the quality of the combinatorial methods applied to their development efforts, which would adversely affect our business and operations.
If we cannot compete successfully in our industry, our results of operations and financial condition would be adversely affected.
Competition in our market may intensify in the future, which could slow our ability to grow or execute our strategy and could lead to increased pricing pressure, negatively impacting our revenue. Our current and potential customers may choose to develop their own combinatorial development methods internally, particularly if we are slow in deploying our solutions or improving them to meet market needs. We currently face indirect competition from the internal R&D groups at integrated circuit (IC) companies, particularly those of our customers who work with us to develop knowledge of combinatorial methods and who may then use our methods independently. Our customers do not license our technology exclusively, and several of them also design, develop, manufacture and market semiconductor projects based on their own or other architectures and develop their own intellectual property internally. They often compete with each other and with us in various applications. Our customers are generally much larger and have significantly greater resources than us. We also face indirect competition from university collaborations, consortia and alliance partnerships. In addition, there may be other providers of high-throughput empirical solutions for the design of and R&D relating to integrated devices of which we are not aware and there may be new entrants to the industry in the future, particularly if acceptance of these solutions grows. In addition, we believe that the demand for solutions that address the need for better integration between the design and manufacturing processes may encourage direct competitors to enter into our market. Other potential competitors include fabrication facilities that may decide to offer solutions competitive with ours as part of their value proposition to their customers. If these potential competitors change the pricing environment or are able to attract industry partners or customers faster than we can, we may not be able to grow and execute our strategy as quickly or at all.
The semiconductor industry is highly cyclical, subject to price volatility, difficult to predict and subject to significant downturns.
Currently, the substantial majority of our revenue is dependent upon the overall condition of the semiconductor industry, especially in light of the licensing component of our revenue. The semiconductor industry is highly cyclical and subject to rapid technological change and has been subject
24
to significant economic downturns at various times, such as the recent economic downturn, characterized by diminished product demand, accelerated erosion of average selling prices and production overcapacity. The semiconductor industry also periodically experiences increased demand and production capacity constraints. In addition, the semiconductor industry has historically experienced price volatility. As a result, we may experience significant fluctuations in operating results due to general semiconductor industry conditions and overall economic conditions.
In 2008 and 2009, the semiconductor industry experienced significant challenges as a result of the severe tightening of the credit markets, turmoil in the financial markets, and weakened global economy. While the semiconductor market recovered somewhat in 2010 and the first part of 2011, the recovery may not continue, which limits our ability to forecast our business. There may be sudden changes in our customers' manufacturing capacity requirements and spending, which depend in part on capacity utilization, demand for our customers' IC products by consumers, inventory levels relative to demand, and access to affordable capital. In addition, the semiconductor industry has experienced significant consolidation in the past and may continue to see high levels of consolidation in the future. If any of our customers are acquired, the acquiror may not continue to engage in a CDP with us. Alternatively, our customers may opt to acquire companies or technologies that decrease their need for our services or otherwise divert their R&D resources. As a result of these and other potential changes, the timing and length of any cycles can be difficult to predict. Further, uncertainty about future global economic conditions and any effect on the semiconductor industry could make it challenging for us to forecast our operating results, make business decisions and identify the risks that may affect our business, financial condition and results of operations. If we are not able to timely and appropriately adapt to changes resulting from the difficult macroeconomic environment, our business, financial condition and results of operations may be significantly negatively affected.
A substantial portion of our revenue is derived from business arrangements with related parties, and such arrangements could create conflicts of interest that could adversely affect our business and results of operations.
Some of our customers and other business partners hold a significant stake in our capital stock. Related party transactions disclosed in our financial statements accounted for $10.4 million and $26.0 million, or 43.5% and 61.0%, respectively, of our revenue for the six months ended June 30, 2011 and the year ended December 31, 2010. ATMI, which beneficially owns approximately 10.6% of our capital stock as of September 1, 2011, accounted for $7.8 million and $22.1 million, or 32.7% and 51.8%, respectively, of our revenue for the six months ended June 30, 2011 and the year ended December 31, 2010. For more information about these transactions, see "Certain Relationships and Related Party Transactions" and Note 11 to our consolidated financial statements. We have also entered into CDPs with GLOBALFOUNDRIES, whose majority stockholder, Advanced Technology Investment Company, LLC, beneficially owns approximately 4.4% of our capital stock (assuming exercise of an outstanding warrant held by them) as of September 1, 2011, and SanDisk Corporation and Toshiba Corporation, which collectively hold warrants exercisable for an aggregate of 1,644,736 shares of our common stock.
We believe that the transactions and agreements that we have entered into with related parties are on terms that are at least as favorable as could reasonably have been obtained at such time from third parties. However, these relationships could create, or appear to create, potential conflicts of interest when our board of directors is faced with decisions that could have different implications for us and our related parties or their affiliates. In addition, conflicts of interest may arise between us and our related parties and their affiliates. The appearance of conflicts, even if such conflicts do not materialize, might adversely affect the public's perception of us, as well as our relationship with other companies and our ability to enter into new relationships in the future, including new CDPs with competitors of such related parties, which could have a material adverse effect on our ability to do business.
25
We are subject to warranty claims, product recalls and product liability.
We may, from time to time, be subject to warranty or product liability claims for our HPC tools that may in the future lead to expenses as we compensate affected customers for costs incurred related to product quality issues. Although we maintain product liability insurance, such insurance is subject to significant deductibles and there is no guarantee that such insurance will be available or adequate to protect against all such claims. Alternatively, we may elect to self-insure with respect to certain matters. We may incur costs and expenses in the event of any recall of a HPC tool sold to our customers. We may incur replacement costs, contract damage claims from our customers and reputational harm. Costs or payments made in connection with warranty and product liability claims and product recalls could materially affect our financial condition and results of operations.
Compliance with environmental, health and safety laws and regulations could increase costs or cause us to incur substantial liabilities.
We are subject to various foreign, federal, state and local environmental laws and regulations governing, among other matters, emissions and discharges of hazardous materials into the air and water, the use, generation, storage, handling, transportation and disposal of, and exposure to, hazardous materials and wastes, remediation of contamination and employee health and safety. In addition, under certain of these environmental laws, liability can be joint and several and without regard to comparative fault. Our operations involve the use of hazardous materials and produce hazardous waste, and we could become liable for any injury or contamination that could arise due to such use or disposal of these materials. Failure to comply with environmental laws and regulations could result in the imposition of substantial civil and criminal fines and sanctions, could require operational changes or limits or the installation of costly equipment or otherwise lead to third party claims. Future environmental laws and regulations, stricter enforcement of existing laws and regulations, or the discovery of previously unknown contamination or violations of such laws and regulations could require us to incur costs or become the basis for new or increased liabilities, which could impair our operations and adversely affect our business and results of operations.
Acquisitions may harm our business and operating results, cause us to incur debt or assume contingent liabilities or dilute our shareholders.
We have made and may in the future make strategic investments or acquisitions where there is an opportunity to expand the potential applications and reach of our HPC platform. Exploring and implementing any investments or acquisitions may place strain upon our ability to manage our future growth and may divert management attention from our core development and licensing business. There are also other risks associated with this strategy. We cannot assure you that we will be able to make investments or acquire businesses on satisfactory terms, that any business acquired by us or in which we invest will be integrated successfully into our operations or be able to operate profitably, or that we will be able to realize any expected synergies or benefits from such investments or acquisitions. Our relative inexperience in effecting such transactions heightens these risks. In addition, to finance any acquisitions or investments, we may utilize our existing funds, or might need to raise additional funds through public or private equity or debt financings. Prolonged tightening of the financial markets may impact our ability to obtain financing to fund future acquisitions and we could be forced to obtain financing on less than favorable terms. Additionally, equity financings may result in dilution to our stockholders. We cannot predict the number, timing or size of investments or acquisitions, or the effect that any such transactions might have on our operating results.
26
Global or regional economic, political and social conditions could adversely affect our business and operating results.
We operate in multiple jurisdictions throughout the world and are subject to foreign business, political and economic risks. In particular, we are subject to risks arising from adverse changes in global economic conditions. Global economic uncertainties in the key markets of many of our customers may cause our customers to delay or reduce technology purchases and investments. The impact of this on us is difficult to predict, but if businesses defer licensing our technology, require fewer CDPs or development tools, or if consumers defer purchases of new products that incorporate technology developed through our CDPs, our revenue could decline. A decline in revenue would have an adverse effect on our results of operations and our financial condition.
In addition, some of our largest customers are located outside of the United States, primarily in Asia, which further exposes us to foreign risks. Also, a substantial portion of the consumer products market that serves as the end-market for the products we help our customers to develop is located in Asia. As a result, our operations are subject to substantial influence by political and economic conditions in Asia, as well as natural disasters such as the recent earthquake and tsunami and related nuclear power plant crisis in Japan. Reduced end user demand as well as disruptions to the supply chain for our customers resulting from these events could lead to a reduction in our revenue and an adverse impact on our financial condition.
We are also subject to general geopolitical risks in connection with international operations, such as political, social and economic instability, terrorism, interference with information or communication of networks or systems, potential hostilities, changes in diplomatic and trade relationships, and disease outbreaks, and any disruptive effect these events would have on our business operations. Although to date we have not experienced any material adverse effect on our operations as a result of these types of regulatory, geopolitical, and other factors, we cannot assure investors that these factors will not have a material adverse effect on our business, financial condition, and operating results or require us to modify our current business practices. Inconsistencies among, and unexpected changes in, a wide variety of foreign laws and regulatory environments with which we are not familiar, including, among other issues, with respect to employees, protection of our intellectual property, and a wide variety of operational regulations and trade and export controls under domestic, foreign, and international law may also have unexpected, adverse impacts on our operations and financial condition.
In the future, exchange rate fluctuations could affect our revenue, which could adversely affect our business and operating results.
Our licensing and royalty revenue is derived from sales of our customers' products that incorporate technology developed through our CDPs. To the extent that sales for these customer products are denominated in a foreign currency, an increase in the value of the U.S. dollar relative to such foreign currencies could adversely affect our licensing and royalty revenue irrespective of the volume of such products sold, which could adversely affect our business and operating results.
In addition, we derive a significant portion of our revenue from customers in foreign countries, particularly those based in Japan. Revenue generated from customers in Japan accounted for 29%, 30% and 27% of total revenue for the years ended December 31, 2010, 2009 and 2008, respectively. We expect that a significant portion of our total future revenue will continue to be derived from companies based in Japan and other foreign countries. If the U.S. dollar increases in value relative to the currencies in any of these countries, the cost of our CDPs, which have historically been billed in U.S. dollars, will be more expensive to existing and potential customers in those countries, which could adversely affect our ability to generate new or expand existing CDPs.
27
Business interruptions could delay us in the process of developing our products and could disrupt our sales.
Our headquarters are located in the San Francisco Bay Area near known earthquake fault zones and are vulnerable to significant damage from earthquakes. We are also vulnerable to other types of natural disasters and other events that could disrupt our operations, such as terrorist acts and other events beyond our control. We do not carry insurance for earthquakes and we may not carry sufficient business interruption insurance to compensate us for losses that may occur. Any losses or damages we incur could have a material adverse effect on our cash flows and success as an overall business.
Our ability to use our net operating loss carryforwards to offset future taxable income, and our ability to use our tax credit carryforwards, may be subject to certain limitations.
In general, a corporation that undergoes an "ownership change" under Section 382 of the Internal Revenue Code is subject to limitations on its ability to utilize its pre-change net operating loss carryforwards (NOLs) to offset future taxable income and its ability to utilize tax credit carryforwards. As of December 31, 2010, we reported U.S. federal NOLs of approximately $17.4 million. In general, an "ownership change" occurs if the aggregate stock ownership of certain stockholders (generally, 5% shareholders, applying certain aggregation and look-through rules) increases by more than 50 percentage points over such stockholders' lowest percentage ownership during the testing period (generally, three years). We have not determined whether an ownership change has occurred in the past. If we have experienced an ownership change in the past, or if we undergo an ownership change in connection with this offering, our ability to utilize NOLs and tax credit carryforwards could be limited. Furthermore, future changes in our stock ownership, such as certain stock issuances and transfers between stockholders, some of which changes are outside of our control, could result in ownership changes under Section 382 of the Internal Revenue Code. For these reasons, we may not be able to utilize a material portion of our NOLs and tax credit carryforwards, even if we attain profitability.
Risks Relating to this Offering and Ownership of Our Common Stock
An active trading market for our common stock may not develop, and you may not be able to resell your shares at or above the initial public offering price.
Prior to this offering, there has been no public market for shares of our common stock. Although we will apply to have our common stock approved for quotation on a stock exchange, an active trading market for our shares may never develop or be sustained following this offering. The initial public offering price of our common stock will be determined through negotiations between us and the underwriters. This initial public offering price may not be indicative of the market price of our common stock after this offering. In the absence of an active trading market for our common stock, investors may not be able to sell their common stock at or above the initial public offering price or at the time that they would like to sell.
Our stock price may be volatile, and the market price of our common stock after this offering may drop below the price you pay.
The market price of our common stock could be subject to significant fluctuations after this offering and it may decline below the initial public offering price. Market prices for securities of early stage companies have historically been particularly volatile. As a result of this volatility, you may not be able to sell your common stock at or above the initial public offering price. These fluctuations could be in response to, among other things, the factors described in this "Risk Factors" section or elsewhere in this registration statement, or other factors, some of which are beyond our control, such as:
- •
- fluctuations in our financial results or outlook or those of companies perceived to be similar to us;
28
- •
- changes in estimates of our financial results or recommendations by securities analysts;
- •
- changes in market valuations of similar companies;
- •
- changes in our capital structure, such as future issuances of securities or the incurrence of debt;
- •
- announcements by us or our competitors of significant contracts, acquisitions or strategic alliances;
- •
- litigation involving us, our general industry or both;
- •
- additions or departures of key personnel;
- •
- regulatory developments in the U.S., countries in Asia, and/or other foreign countries;
- •
- investors' general perception of us; and
- •
- changes in general economic, industry and market conditions.
Furthermore, the stock markets have experienced price and volume fluctuations that have affected, and continue to affect, the market prices of equity securities of many companies. These fluctuations often have been unrelated or disproportionate to the operating performance of those companies. These broad market fluctuations, as well as general economic, political and market conditions, such as recessions, interest rate changes and international currency fluctuations, may negatively affect the market price of our common stock.
In the past, many companies that have experienced volatility in the market price of their stock have become subject to securities class action litigation. We may be the target of this type of litigation in the future. Securities litigation against us could result in substantial costs and divert our management's attention from other business concerns, which could seriously harm our business.
We will incur increased costs and demands upon management as a result of complying with the laws and regulations affecting public companies, which could harm our results of operations.
As a public company, we will incur significant additional accounting, legal and other expenses that we did not incur as a private company, including costs associated with public company reporting requirements. We have incurred and will continue to incur costs associated with corporate governance requirements, including requirements under Section 404 and other provisions of the Sarbanes-Oxley Act, as well as rules implemented by the Securities Exchange Commission, or SEC, and the exchange on which we list our common stock. The expenses incurred by public companies for reporting and corporate governance purposes have increased dramatically in recent years. We expect these rules and regulations to substantially increase our financial and legal compliance costs. In addition, these rules and regulations are subject to change from time to time, and we may incur additional financial and legal compliance costs as we seek to understand and comply with changes in these rules and regulations. We also expect that as we become a public company it will be more difficult and more expensive for us to obtain director and officer liability insurance, and we may be required to accept reduced policy limits and coverage or incur substantially higher costs to obtain the same or similar coverage previously available. As a result, it may be more difficult for us to attract and retain qualified individuals to serve on our board of directors or as our executive officers.
If we experience material weaknesses or otherwise fail to maintain an effective system of internal controls in the future, we may not be able to accurately report our financial condition or results of operations, which may adversely affect investor confidence in our company and, as a result, the value of our common stock.
As a result of becoming a public company, we will be required, under Section 404 of the Sarbanes-Oxley Act, to furnish a report by management on, among other things, the effectiveness of our internal control over financial reporting for the first fiscal year beginning after the effective date of this
29
offering. This assessment will need to include disclosure of any material weaknesses identified by our management in our internal control over financial reporting, as well as an opinion from our independent registered public accounting firm on the effectiveness of our internal control over financial reporting. A material weakness is a control deficiency or combination of control deficiencies that results in more than a remote likelihood that a material misstatement of annual or interim financial statements will not be prevented or detected.
We are in the very early stages of the costly and challenging process of hiring personnel and compiling the system and processing documentation necessary to perform the evaluation needed to comply with Section 404. We may not be able to complete our evaluation, testing and any required remediation in a timely fashion. During the evaluation and testing process, if we identify one or more material weaknesses in our internal control over financial reporting, we will be unable to assert that our internal controls are effective. We cannot assure you that there will not be material weaknesses and significant deficiencies in our internal controls in the future. If we are unable to conclude that our internal control over financial reporting is effective, or if our independent registered public accounting firm were to issue an adverse opinion on the effectiveness of our internal control over financial reporting, we could lose investor confidence in the accuracy and completeness of our financial reports, which would cause the price of our common stock to decline.
We have not completed a testing cycle under Section 404 of the Sarbanes-Oxley Act and cannot assure you that we will be able to implement and maintain an effective internal control over financial reporting in the future. Any failure to maintain such controls could severely inhibit our ability to accurately report our financial condition or results of operations.
The concentration of our capital stock ownership with insiders upon the completion of this offering will limit your ability to influence corporate matters.
We anticipate that our executive officers, directors, current five percent or greater stockholders and entities affiliated with them will together beneficially own approximately % of our common stock outstanding after this offering. Entities affiliated with Redpoint Ventures, entities affiliated with CMEA Ventures and entities affiliated with U.S. Venture Partners will beneficially own approximately %, % and % of our common stock outstanding after this offering. This significant concentration of share ownership may adversely affect the trading price for our common stock because investors often perceive disadvantages in owning stock in companies with concentrated stock ownership. Also, these stockholders, acting together, will be able to influence our management and affairs and matters requiring stockholder approval, including the election of directors and the approval of significant corporate transactions, such as mergers, consolidations or the sale of substantially all of our assets. Consequently, this concentration of ownership may have the effect of delaying or preventing a change of control, including a merger, consolidation or other business combination involving us, or discouraging a potential acquirer from making a tender offer or otherwise attempting to obtain control, even if that change of control would benefit our other stockholders.
A significant portion of our total outstanding shares may be sold into the public market in the near future, which could cause the market price of our common stock to drop significantly, even if our business is doing well.
Sales of a substantial number of shares of our common stock in the public market could occur at any time after the expiration of the lock-up agreements described in the "Underwriting" and "Shares Eligible for Future Sale—Lock-up Agreements" sections of this prospectus. These sales, or the market perception that the holders of a large number of shares intend to sell shares, could reduce the market price of our common stock. After this offering, we will have shares of common stock outstanding based on the number of shares outstanding as of June 30, 2011 and assuming the conversion of all shares of preferred stock into shares of our common stock and no exercise of outstanding options or
30
warrants after June 30, 2011. This includes the shares that we are selling in this offering, which may be resold in the public market immediately after this offering. The remaining shares, or % of our outstanding shares after this offering, are currently restricted as a result of securities laws or lock-up agreements but will be able to be sold, subject to any applicable volume limitations under federal securities laws, in the near future as set forth below:
- •
- shares will be eligible for sale immediately upon completion of this offering; and
- •
- shares will be eligible for sale upon the expiration of 180-day lock-up and/or market standoff agreements, subject in some cases to the volume and other restrictions of Rule 144 and Rule 701 promulgated under the Securities Act of 1933, as amended, or the Securities Act, and upon the lapse of our right of repurchase with respect to any unvested shares.
The lock-up agreements expire 180 days after the date of this prospectus, except that the 180-day period may be extended in certain cases for up to 34 additional days under certain circumstances where we announce or pre-announce earnings or a material event occurs within approximately 17 days prior to, or approximately 16 days after, the termination of the 180-day period. The representatives of the underwriters may, in their sole discretion and at any time without notice, release all or any portion of the securities subject to lock-up agreements.
Following this offering, holders of shares of our common stock (including shares issuable upon exercise of certain stock options) not sold in this offering will be entitled to rights with respect to the registration of these shares under the Securities Act. See "Description of Capital Stock—Registration Rights." If we register their shares of common stock following the expiration of the lock-up agreements, these stockholders could sell those shares in the public market without being subject to the volume and other restrictions of Rule 144 and Rule 701.
After the closing of this offering, we intend to register approximately shares of common stock that have been reserved for issuance under our stock incentive plans. Of these shares, approximately shares will be eligible for sale upon the exercise of outstanding options after the expiration of the lock-up agreements.
Purchasers in this offering will experience immediate and substantial dilution in the book value of their investment.
The initial public offering price of our common stock is substantially higher than the net tangible book value per share of our outstanding common stock immediately after this offering. Therefore, if you purchase our common stock in this offering, you will incur immediate dilution of approximately $ in net tangible book value per share from the price you paid, based on an assumed initial offering price of $ per share, the midpoint of the range set forth on the cover of this prospectus. In addition, investors purchasing common stock in this offering will own only approximately % of our shares outstanding after this offering even though they will have contributed % of the total consideration received by us in connection with our sales of common stock. Moreover, we issued options and warrants in the past to acquire our stock at prices significantly below the initial public offering price. As of June 30, 2011, 16,403,610 shares of common stock were issuable upon exercise of outstanding stock options with a weighted average exercise price of $1.09 per share. As of June 30, 2011, warrants to purchase 4,446,721 shares of common stock (assuming conversion of all shares of preferred stock into common stock as of June 30, 2011) were issuable upon exercise of outstanding warrants with a weighted average exercise price of $2.60 per share. To the extent that these outstanding options and warrants are ultimately exercised, you will incur further dilution. For a further description of the dilution that you will experience immediately after this offering, see the "Dilution" section of this prospectus.
31
If securities or industry analysts do not publish or cease publishing research or reports about us, our business or our market, or if they change their recommendations regarding our stock adversely, our stock price and trading volume could decline.
The trading market for our common stock will be influenced by the research and reports that industry or securities analysts may publish about us, our business, our market or our competitors. If any of the analysts who may cover us change their recommendation regarding our stock adversely, or provide more favorable relative recommendations about our competitors, our stock price would likely decline. If any analyst who may cover us were to cease coverage of our company or fail to regularly publish reports on us, we could lose visibility in the financial markets, which in turn could cause our stock price or trading volume to decline.
Our management will have broad discretion over the use of the proceeds we receive in this offering and might not apply the proceeds in ways that increase the value of your investment.
Our management will have broad discretion in the application of the net proceeds from this offering, and you will be relying on the judgment of our management regarding the application of these proceeds. Our management might not apply our net proceeds of this offering in ways that increase the value of your investment. We expect to use the net proceeds to us from this offering for working capital and other general corporate purposes, which may in the future include expansion of production facilities and HPC platform and equipment, investments in, or acquisitions of, complementary businesses, joint ventures, partnerships, services, intellectual property or technologies. Our management might not be able to yield a significant return, if any, on any investment of these net proceeds. You will not have the opportunity to influence our decisions on how to use our net proceeds from this offering.
After the completion of this offering, we do not expect to declare any dividends in the foreseeable future.
After the completion of this offering, we do not anticipate declaring any cash dividends to holders of our common stock in the foreseeable future. Consequently, investors may need to rely on sales of their common stock after price appreciation, which may never occur, as the only way to realize any future gains on their investment. Investors seeking cash dividends should not purchase our common stock.
Anti-takeover provisions contained in our certificate of incorporation and bylaws, as well as provisions of Delaware law, could impair a takeover attempt.
Our amended and restated certificate of incorporation and our amended and restated bylaws to be effective upon the completion of this offering will contain provisions that could delay or prevent a change in control of our company. These provisions could also make it more difficult for stockholders to elect directors and take other corporate actions. These provisions include:
- •
- staggered board of directors;
- •
- authorizing the board to issue, without stockholder approval, preferred stock with rights senior to those of our common
stock;
- •
- authorizing the board to amend our bylaws and to fill board vacancies until the next annual meeting of the stockholders;
- •
- prohibiting stockholder action by written consent;
- •
- limiting the liability of, and providing indemnification to, our directors and officers;
- •
- eliminating the ability of our stockholders to call special meetings; and
- •
- requiring advance notification of stockholder nominations and proposals.
32
Section 203 of the Delaware General Corporation Law prohibits, subject to some exceptions, "business combinations" between a Delaware corporation and an "interested stockholder," which is generally defined as a stockholder who becomes a beneficial owner of 15% or more of a Delaware corporation's voting stock, for a three-year period following the date that the stockholder became an interested stockholder.
These and other provisions in our amended and restated certificate of incorporation and our amended and restated bylaws to be effective upon the completion of this offering under Delaware law could discourage potential takeover attempts, reduce the price that investors might be willing to pay in the future for shares of our common stock and result in the market price of our common stock being lower than it would be without these provisions. See "Description of Capital Stock—Preferred Stock" and "Description of Capital Stock—Anti-Takeover Provisions."
33
This prospectus contains forward-looking statements that involve risks and uncertainties. The forward-looking statements are contained principally in the sections entitled "Prospectus Summary," "Risk Factors," "Management's Discussion and Analysis of Financial Condition and Results of Operations" and "Business." These statements relate to future events or our future financial or operational performance and involve known and unknown risks, uncertainties and other factors that could cause our actual results, levels of activity, performance or achievement to differ materially from those expressed or implied by these forward-looking statements. These risks and uncertainties are contained principally in the section entitled "Risk Factors."
Forward-looking statements include all statements that are not historical facts. In some cases, you can identify forward-looking statements by terms such as "may," "will," "should," "could," "would," "expects," "plans," "anticipates," "believes," "estimates," "projects," "predicts," "potential," or the negative of those terms, and similar expressions and comparable terminology intended to identify forward-looking statements. These statements reflect our current views with respect to future events and are based on assumptions and subject to risks and uncertainties. Given these uncertainties, you should not place undue reliance on these forward-looking statements. These forward-looking statements represent our estimates and assumptions only as of the date of this prospectus and, except as required by law, we undertake no obligation to update or revise publicly any forward-looking statements, whether as a result of new information, future events or otherwise after the date of this prospectus.
MARKET, INDUSTRY AND OTHER DATA
Unless otherwise indicated, information contained in this prospectus concerning our industry and the markets in which we operate, including our general expectations and market position, market opportunity and market size, is based on information from various sources, on assumptions that we have made that are based on those data and other similar sources and on our knowledge of the markets for our services. These data involve a number of assumptions and limitations, and you are cautioned not to give undue weight to such estimates. We have not independently verified any third party information and cannot assure you of its accuracy or completeness. While we believe the market position, market opportunity and market size information included in this prospectus is generally reliable, such information is inherently imprecise. In addition, projections, assumptions and estimates of our future performance and the future performance of the industry in which we operate is necessarily subject to a high degree of uncertainty and risk due to a variety of factors, including those described in "Risk Factors" and elsewhere in this prospectus. These and other factors could cause results to differ materially from those expressed in the estimates made by the independent parties and by us.
34
We estimate that we will receive net proceeds of approximately $ million from the sale of shares of common stock offered by us in this offering, based on an assumed initial public offering price of $ per share (the midpoint of the price range set forth on the cover page of this prospectus) and after deducting the underwriting discounts and commissions and estimated offering expenses payable by us. A $1.00 increase (decrease) in the assumed initial public offering price of $ per share would increase (decrease) the net proceeds to us from this offering by $ million, assuming that the number of shares offered by us, as set forth on the cover page of this prospectus, remains the same and after deducting the underwriting discounts and commissions and estimated offering expenses payable by us. If the underwriters' over-allotment option to purchase additional shares from us is exercised in full, we estimate that we will receive additional net proceeds of $ million. We will not receive any proceeds from the sale of the shares of common stock to be offered by the selling stockholders.
We intend to use the net proceeds received by us from this offering for working capital and other general corporate purposes.
In connection with an agreement for the purchase of intellectual property and the termination of our royalty obligations under an existing license agreement, we have an obligation to issue a promissory note to Symyx Technologies, Inc. (Symyx), a wholly-owned subsidiary of Accelrys, Inc., upon the consummation of this offering to the extent the gross proceeds from Symyx's sale of shares in this offering (before deducting underwriting discounts and commissions and estimated offering expenses) are less than $67 million. At an assumed initial public offering price of $ per share (the midpoint of the price range set forth on the cover page of this prospectus), the gross proceeds from the sale of Symyx's shares would be $ million, and we would have a $ obligation to Symyx. A $1.00 increase (decrease) in the assumed initial public offering price of $ per share would increase (decrease) the gross proceeds to Symyx by $ million. Such note, if issued, would have a term of 24 months and an interest rate equal to 4%. Such note would be payable in an amount equal to the lesser of the principal amount and the greater of $500,000 per quarter or the amount of accrued interest, with a balloon payment at maturity if applicable. Such note would also be pre-payable by us at any time without penalty or premium, and would be secured by tangible personal property, excluding intellectual property. If we issue such note, a portion of the net proceeds of this offering would be used to make payments of scheduled interest and payment of principal at any time at or prior to maturity. We have also agreed to reimburse Symyx for 50% of their underwriting discounts and commissions.
We may also use a portion of the net proceeds to expand our current business through acquisitions of other businesses, products, intellectual property or technologies. Other than as set forth above, we do not have agreements or commitments for any specific acquisitions at this time.
Pending the use of the net proceeds from this offering, we plan to invest the net proceeds in short- and intermediate-term, interest-bearing obligations, investment-grade instruments, certificates of deposit or director or guaranteed obligations of the U.S. government. We cannot predict whether the proceeds invested will yield a favorable return, if any.
We have never declared or paid any cash dividends on our common stock. We currently intend to retain any future earnings for use in the operation and expansion of our business, and currently do not plan to declare or pay any dividends on shares of our common stock in the foreseeable future. Subject to the foregoing, the payment of cash dividends in the future, if any, will be at the discretion of our board of directors and will depend upon a number of factors, including our earnings, capital requirements, requirements under the Delaware General Corporation Law, restrictions and covenants pursuant to any credit facilities we may enter into, our overall financial condition and any other factors deemed relevant by our board of directors.
35
The following table sets forth our capitalization as of June 30, 2011 as follows:
- •
- on an actual basis;
- •
- on a pro forma basis to reflect:
- •
- the conversion of all outstanding shares of our redeemable convertible preferred stock into 58,461,447 shares of common
stock in connection with the consummation of this offering;
- •
- the resulting reclassification of accumulated accretion of redeemable convertible preferred stock and preferred stock
warrant liability to additional paid-in capital;
- •
- the conversion of a warrant for redeemable convertible preferred stock into a warrant to purchase 168,747 shares of our
common stock at an exercise price of $0.44 per share immediately before the consummation of this offering, and the resulting reclassification of the preferred stock warrant liability to
additional paid-in capital; and
- •
- the cash exercise of certain warrants outstanding to purchase shares of our common stock as of June 30, 2011, which
will expire upon completion of this offering if unexercised, resulting in the issuance of 2,621,985 shares of common stock for an aggregate exercise price of approximately $6.4 million.
- •
- on a pro forma as adjusted basis after further giving effect to the filing of our amended and restated certificate of incorporation, which will occur in connection with the consummation of this offering, and the receipt of the net proceeds from the sale of shares of common stock offered by us in this offering at an assumed initial public offering price of $ per share (the midpoint of the price range set forth on the cover page of this prospectus), after deducting the underwriting discounts and commissions and estimated offering expenses payable by us.
The pro forma and pro forma as adjusted information below is illustrative only and our capitalization following the completion of this offering will be adjusted based on the actual initial public offering price and other terms of this offering determined at pricing. You should read this table in conjunction with the sections titled "Selected Consolidated Financial Data" and "Management's
36
Discussion and Analysis of Financial Condition and Results of Operations" and our consolidated financial statements and related notes included elsewhere in this prospectus.
| |
As of June 30, 2011 | ||||||||||||
|---|---|---|---|---|---|---|---|---|---|---|---|---|---|
| |
Actual | Pro Forma | Pro Forma as Adjusted |
||||||||||
| |
(unaudited) |
||||||||||||
| |
(in thousands, except share and per share amounts) |
||||||||||||
Preferred stock warrant liability |
670 | — | |||||||||||
Redeemable convertible preferred stock, par value $0.001 per share: 59,230,199 shares authorized, 58,461,447 shares issued and outstanding, actual; no shares authorized, no shares issued and outstanding, pro forma and pro forma as adjusted |
80,515 | — | |||||||||||
Accumulated accretion of redeemable convertible preferred stock to redemption values |
41,521 | — | |||||||||||
Stockholders' equity (deficit): |
|||||||||||||
Common stock, par value $0.001 per share: 105,000,000 shares authorized, 11,555,956 shares issued and outstanding, actual; 105,000,000 shares authorized, 72,639,388 shares issued and outstanding, pro forma; shares issued and outstanding, pro forma as adjusted |
12 | 73 | |||||||||||
Additional paid-in capital |
— | 129,021 | |||||||||||
Accumulated deficit |
(73,187 | ) | (73,187 | ) | |||||||||
Total stockholders' equity (deficit) |
(73,175 | ) | 55,907 | ||||||||||
Total capitalization |
$ | 49,531 | $ | 55,907 | $ | ||||||||
If the underwriters' over-allotment option were exercised in full, pro forma as adjusted cash and cash equivalents, common stock and additional paid-in capital, stockholders' equity (deficit) and shares issued and outstanding as of June 30, 2011 would be $ million, $ million, $ million and shares, respectively.
A $1.00 increase (decrease) in the assumed initial public offering price of $ per share (the midpoint of the price range set forth on the cover page of this prospectus) would increase (decrease) each of pro forma as adjusted additional paid-in capital, stockholders' equity (deficit) and total capitalization by approximately $ million, assuming that the number of shares offered by us, as set forth on the cover page of this prospectus, remains the same. We may also increase or decrease the number of shares we are offering. An increase (decrease) of 1,000,000 in the number of shares we are offering would increase (decrease) each of pro forma as adjusted additional paid-in capital, stockholders' equity (deficit) and total capitalization by approximately $ million, assuming the assumed initial public offering price per share (the midpoint of the price range set forth on the cover page of this prospectus) remains the same. An increase of 1,000,000 in the number of shares we are offering, together with a $1.00 increase in the assumed initial public offering price per share, would increase each of pro forma as adjusted additional paid-in capital, stockholders' equity (deficit) and total capitalization by approximately $ million. A decrease of 1,000,000 in the number of shares we are offering, together with a $1.00 decrease in the assumed initial public offering price per share, would decrease each of pro forma as adjusted additional paid-in capital, stockholders' equity (deficit) and total capitalization by approximately $ million. The pro forma as adjusted information is illustrative only, and we will adjust this information based on the actual initial public offering price and other terms of this offering determined at pricing.
37
The number of actual, pro forma and pro forma as adjusted shares of common stock issued and outstanding in the table above each excludes the following shares as of June 30, 2011:
- •
- 16,403,610 shares of common stock issuable upon the exercise of options outstanding, at a weighted average exercise price
of $1.09 per share;
- •
- 1,824,736 shares of common stock issuable upon the exercise of warrants outstanding (not including those to be exercised
in connection with the completion of this offering), at a weighted average exercise price of $2.84 per share;
- •
- 236,157 shares of common stock reserved for future issuance under our 2004 Equity Incentive Plan, which will become
available for issuance under our 2011 Equity Incentive Award Plan after completion of this offering; and
- •
- shares of common stock that will be reserved for future issuance under our 2011 Equity Incentive Award Plan, as well as any automatic increases in the number of shares of our common stock reserved for future issuance under this benefit plan, which will become effective immediately prior to the consummation of this offering.
38
If you invest in our common stock in this offering, your interest will be diluted to the extent of the difference between the initial public offering price per share of our common stock and the pro forma as adjusted net tangible book value per share of our common stock immediately after this offering.
Net tangible book value per share is determined by dividing our total tangible assets less our total liabilities by the number of shares of common stock outstanding. Our historical net tangible book value (deficit) as of June 30, 2011 was $(75.8) million, or $(6.56) per share.
Our pro forma net tangible book value (deficit) as of June 30, 2011 was $53.3 million, or $0.73 per share, after giving effect to the following:
- •
- the conversion of all outstanding shares of our redeemable convertible preferred stock into 58,461,447 shares of common
stock in connection with the consummation of this offering;
- •
- the resulting reclassification of accumulated accretion of redeemable convertible preferred stock and preferred stock
warrant liability to additional paid-in capital;
- •
- the conversion of a warrant for redeemable convertible preferred stock into a warrant to purchase 168,477 shares of our
common stock at an exercise price of $0.44 per share immediately before the consummation of this offering, and the resulting reclassification of the preferred stock warrant liability to additional
paid-in capital;
- •
- the cash exercise of certain warrants outstanding to purchase shares of our common stock as of June 30, 2011, which
will expire upon completion of this offering if unexercised, resulting in the issuance of 2,621,985 shares of common stock for an aggregate exercise price of approximately $6.4 million; and
- •
- no exercise of the underwriters' over-allotment option.
After further giving effect to the filing of our amended and restated certificate of incorporation, which will occur in connection with the consummation of this offering, and our receipt of the net proceeds from the sale of shares of common stock offered by us in this offering at an assumed initial public offering price of $ per share (the midpoint of the price range set forth on the cover page of this prospectus), after deducting the underwriting discounts and commissions and estimated offering expenses payable by us, our pro forma as adjusted net tangible book value as of June 30, 2011 would have been $ million, or $ per share. This represents an immediate increase in net tangible book value of $ per share to existing stockholders and an immediate dilution in net tangible book value of $ per share to purchasers of common stock in this offering, as illustrated in the following table:
Assumed initial public offering price per share, based on the midpoint of the price range set forth on the cover page of this prospectus. |
$ | |||||||
Pro forma net tangible book value (deficit) per share as of June 30, 2011 |
$ | |||||||
Increase in pro forma net tangible book value (deficit) per share attributable to new investors |
||||||||
Pro forma as adjusted net tangible book value per share after this offering |
||||||||
Dilution per share to investors in this offering |
$ | |||||||
If the underwriters' over-allotment option to purchase additional shares from us is exercised in full, the pro forma as adjusted net tangible book value per share after this offering would be $ per
39
share, the increase in pro forma as adjusted net tangible book value per share to existing stockholders would be $ per share and the dilution to new investors purchasing shares in this offering would be $ per share.
A $1.00 increase (decrease) in the assumed initial public offering price of $ per share (the midpoint of the price range set forth on the cover page of this prospectus) would increase (decrease) our pro forma as adjusted net tangible book value by $ million, the pro forma as adjusted net tangible book value per share by $ per share and the dilution in the pro forma net tangible book value to new investors in this offering by $ per share and the dilution in the pro forma net tangible book value to new investors purchasing shares in this offering by $ per share, assuming the number of shares offered by us, as set forth on the cover page of this prospectus, remains the same and after deducting the underwriting discounts and commissions and estimated offering expenses payable by us.
The following table presents on a pro forma as adjusted basis as of June 30, 2011, after giving effect to the pro forma adjustments described above, the differences between the existing stockholders and the new investors purchasing shares in this offering with respect to the number of shares purchased from us, the total consideration paid, which includes net proceeds received from the issuance of common and redeemable convertible preferred stock, cash received from the exercise of stock options and the value of any stock issued for services and the average price paid per share:
| |
|
|
Total Consideration |
|
|||||||||||||
|---|---|---|---|---|---|---|---|---|---|---|---|---|---|---|---|---|---|
| |
Shares Purchased | |
|||||||||||||||
| |
Average Price per Share |
||||||||||||||||
| |
Number | Percent | Amount | Percent | |||||||||||||
| |
|
|
(in thousands) |
|
|
||||||||||||
Existing stockholders |
% | $ | % | $ | |||||||||||||
New investors |
|||||||||||||||||
Totals |
100.0 | % | $ | 100.0 | % | ||||||||||||
The sale by the selling stockholders in this offering will cause the number of shares held by existing stockholders to be reduced to shares or % of the total number of shares of our common stock outstanding after this offering. If the underwriters exercise their over-allotment option in full, our existing stockholders would own % and our new investors would own % of the total number of shares of our common stock outstanding after this offering.
The foregoing calculations are based on 72,639,388 shares of common stock outstanding as of June 30, 2011, assuming the conversion of all outstanding shares of our redeemable convertible preferred stock into 58,461,447 shares of common stock in connection with the consummation of this offering and the cash exercise of certain warrants outstanding to purchase shares of our common stock as of June 30, 2011, which will expire upon completion of this offering if unexercised, resulting in the issuance of 2,621,985 shares of common stock for an aggregate exercise price of approximately $6.4 million, and exclude the following:
- •
- 16,403,610 shares of common stock issuable upon the exercise of options outstanding, at a weighted average exercise price
of $1.09 per share;
- •
- 1,824,736 shares of common stock issuable upon the exercise of warrants outstanding (not including those to be exercised
in connection with the completion of this offering), at a weighted average exercise price of $2.84 per share;
- •
- 236,157 shares of common stock reserved for future issuance under our 2004 Equity Incentive Plan, which will become available for issuance under our 2011 Equity Incentive Award Plan after completion of this offering; and
40
- •
- shares of common stock that will be reserved for future issuance under our 2011 Equity Incentive Award Plan, as well as any automatic increases in the number of shares of our common stock reserved for future issuance under this benefit plan, which will become effective immediately prior to the consummation of this offering.
To the extent that outstanding options or warrants are exercised, you will experience further dilution. If all of our outstanding options and warrants were exercised, our pro forma net tangible book value as of June 30, 2011 would have been $ million, or $ per share, and the pro forma, as adjusted net tangible book value after this offering would have been $ million, or $ per share, causing dilution to new investors of $ per share.
In addition, we may choose to raise additional capital due to market conditions or strategic considerations even if we believe we have sufficient funds for our current or future operating plans. To the extent that we raise additional capital through the sale of equity or convertible debt securities, the issuance of these securities could result in further dilution to our stockholders.
41
SELECTED CONSOLIDATED FINANCIAL DATA
The selected consolidated statement of operations data for the years ended December 31, 2008, 2009 and 2010 and the consolidated balance sheet data as of December 31, 2009 and 2010 are derived from our audited consolidated financial statements included elsewhere in this prospectus. The selected consolidated statement of operations data for the six months ended June 30, 2010 and 2011 and the consolidated balance sheet data as of June 30, 2011 are derived from our unaudited consolidated financial statements included elsewhere in this prospectus. The selected consolidated statement of operations data for the years ended December 31, 2006 and 2007 and the consolidated balance sheet data as of December 31, 2006, 2007 and 2008 are derived from our audited consolidated financial statements which are not included in this prospectus. The unaudited interim consolidated financial statements include, in the opinion of management, all adjustments, which consist only of normal recurring adjustments, that management considers necessary for the fair statement of the financial information set forth in those statements. Our historical results are not necessarily indicative of the results that may be expected in the future. You should read the following selected consolidated historical financial data below in conjunction with the section titled "Management's Discussion and Analysis of Financial Condition and Results of Operations" and the consolidated financial statements and related notes included elsewhere in this prospectus.
42
| |
Years Ended December 31, | Six Months Ended June 30, | |||||||||||||||||||||||
|---|---|---|---|---|---|---|---|---|---|---|---|---|---|---|---|---|---|---|---|---|---|---|---|---|---|
| |
2006 | 2007 | 2008 | 2009 | 2010 | 2010 | 2011 | ||||||||||||||||||
| |
|
|
|
|
|
(unaudited) |
|||||||||||||||||||
| |
(in thousands, except share and per share amounts) |
||||||||||||||||||||||||
Consolidated Statement of Operations Data: |
|||||||||||||||||||||||||
Revenue: |
|||||||||||||||||||||||||
CDP and services revenue |
$ | 3,628 | $ | 8,594 | $ | 14,647 | $ | 14,182 | $ | 27,705 | $ | 9,806 | $ | 15,820 | |||||||||||
Product revenue |
— | — | 6,206 | 9,065 | 6,959 | 3,300 | 1,360 | ||||||||||||||||||
Licensing and royalty revenue |
— | — | 2,276 | 3,663 | 8,010 | 3,386 | 6,644 | ||||||||||||||||||
Total revenue |
3,628 | 8,594 | 23,129 | 26,910 | 42,674 | 16,492 | 23,824 | ||||||||||||||||||
Cost of revenue |
1,992 | 4,873 | 12,625 | 13,018 | 20,926 | 8,752 | 11,323 | ||||||||||||||||||
Gross profit |
1,636 | 3,721 | 10,504 | 13,892 | 21,748 | 7,740 | 12,501 | ||||||||||||||||||
Operating expenses: |
|||||||||||||||||||||||||
Research and development |
5,175 | 9,415 | 11,849 | 10,983 | 13,917 | 6,353 | 9,488 | ||||||||||||||||||
Sales and marketing |
773 | 1,541 | 3,849 | 3,211 | 4,074 | 1,926 | 1,980 | ||||||||||||||||||
General and administrative |
3,647 | 3,837 | 4,300 | 4,867 | 5,761 | 2,877 | 3,925 | ||||||||||||||||||
Total operating expenses |
9,595 | 14,793 | 19,998 | 19,061 | 23,752 | 11,156 | 15,393 | ||||||||||||||||||
Loss from operations |
(7,959 | ) | (11,072 | ) | (9,494 | ) | (5,169 | ) | (2,004 | ) | (3,416 | ) | (2,892 | ) | |||||||||||
Other income (expense): |
|||||||||||||||||||||||||
Interest income, net |
448 | 850 | 174 | (6 | ) | 43 | 17 | 10 | |||||||||||||||||
Other income (expense), net |
— | — | 6 | (62 | ) | 202 | 55 | (335 | ) | ||||||||||||||||
Total other income (expense), net |
448 | 850 | 180 | (68 | ) | 245 | 72 | (325 | ) | ||||||||||||||||
Loss before provision for income taxes |
(7,511 | ) | (10,222 | ) | (9,314 | ) | (5,237 | ) | (1,759 | ) | (3,344 | ) | (3,217 | ) | |||||||||||
Provision for income taxes |
1 | 1 | 186 | 17 | 19 | 2 | 13 | ||||||||||||||||||
Net loss |
(7,512 | ) | (10,223 | ) | (9,500 | ) | (5,254 | ) | (1,778 | ) | (3,346 | ) | (3,230 | ) | |||||||||||
Accretion on redeemable convertible preferred stock |
(1,351 | ) | (4,168 | ) | (5,436 | ) | (9,170 | ) | (14,162 | ) | (6,340 | ) | (7,095 | ) | |||||||||||
Net loss attributable to common stockholders |
$ | (8,863 | ) | $ | (14,391 | ) | $ | (14,936 | ) | $ | (14,424 | ) | $ | (15,940 | ) | $ | (9,686 | ) | $ | (10,325 | ) | ||||
Net loss per share of common stock, basic and diluted |
$ | (0.91 | ) | $ | (1.40 | ) | $ | (1.39 | ) | $ | (1.31 | ) | $ | (1.43 | ) | $ | (0.87 | ) | $ | (0.91 | ) | ||||
Weighted-average number of shares used in computing net loss per share of common stock, basic and diluted(1) |
9,730,679 | 10,246,738 | 10,716,462 | 11,023,779 | 11,134,573 | 11,115,486 | 11,296,902 | ||||||||||||||||||
Pro forma net loss per share of common stock, basic and diluted(1) |
$ | (0.03 | ) | $ | (0.04 | ) | |||||||||||||||||||
Weighted-average number of shares used in computing pro forma net loss per share of common stock, basic and diluted(1) |
65,376,321 | 68,243,300 | |||||||||||||||||||||||
Other Data: |
|||||||||||||||||||||||||
Adjusted EBITDA (unaudited) |
$ | (5,238 | ) | $ | (7,737 | ) | $ | (5,062 | ) | $ | 272 | $ | 4,589 | $ | (274 | ) | $ | 2,026 | |||||||
| |
Years Ended December 31, | |
|||||||||||||||||
|---|---|---|---|---|---|---|---|---|---|---|---|---|---|---|---|---|---|---|---|
| |
As of June 30, 2011 |
||||||||||||||||||
| |
2006 | 2007 | 2008 | 2009 | 2010 | ||||||||||||||
| |
|
|
|
|
|
(unaudited) |
|||||||||||||
| |
(in thousands) |
||||||||||||||||||
Consolidated Balance Sheet Data: |
|||||||||||||||||||
Cash, cash equivalents and short-term investments |
$ | 20,698 | $ | 26,744 | $ | 40,902 | $ | 32,620 | $ | 23,064 | $ | 35,630 | |||||||
Working capital |
22,519 | 18,552 | 26,663 | 16,389 | 4,825 | 23,927 | |||||||||||||
Total assets |
28,906 | 40,877 | 62,190 | 54,469 | 55,571 | 69,299 | |||||||||||||
Long-term debt, including current portion |
— | 3,194 | 4,445 | — | — | — | |||||||||||||
Preferred stock warrant liability |
— | — | — | 159 | 215 | 670 | |||||||||||||
Redeemable convertible preferred stock |
35,738 | 35,738 | 55,633 | 55,633 | 55,633 | 80,515 | |||||||||||||
Accumulated accretion of redeemable convertible preferred stock to redemption values |
1,490 | 5,658 | 11,094 | 20,264 | 34,426 | 41,521 | |||||||||||||
Total stockholders' deficit |
(9,629 | ) | (22,706 | ) | (36,579 | ) | (49,889 | ) | (64,356 | ) | (73,175 | ) | |||||||
- (1)
- Please see Note 9 to our audited consolidated financial statements for an explanation of the calculations of our basic and diluted net loss per share of common stock and pro forma net loss per share of common stock.
43
Non-GAAP Financial Measure
We believe that the use of adjusted EBITDA, a non-GAAP financial measure, is helpful for an investor in determining whether to invest in our common stock. We include adjusted EBITDA in this prospectus because (i) we seek to manage our business to a consistent level of adjusted EBITDA, (ii) it is a key basis upon which our management assesses our operating performance, (iii) it is one of the primary metrics investors use in evaluating companies' performance in our industry and (iv) it is a factor in the evaluation of the performance of our management in determining compensation. We define adjusted EBITDA as net income (loss) less interest, provision for income taxes, depreciation and amortization expense, non-cash revenue adjustments as a result of common stock warrants issued to customers and stock-based compensation expense.
We use adjusted EBITDA as a key performance measure because we believe it facilitates operating performance comparisons from period to period by excluding potential differences caused by variations in capital structures, tax positions (such as the impact of changes in effective tax rates or fluctuations in permanent differences or discrete quarterly items), the impact of depreciation and amortization expense, the non-cash impact of common stock warrants issued to customers and the impact of stock-based compensation expense.
In addition, we believe adjusted EBITDA and similar measures are widely used by investors, securities analysts, ratings agencies and other interested parties in our industry as a measure of financial performance and debt-service capabilities. Our use of adjusted EBITDA has limitations as an analytical tool, and you should not consider it in isolation or as a substitute for analysis of our results as reported under GAAP. Some of these limitations are:
- •
- Adjusted EBITDA does not reflect our cash expenditures for capital equipment or other contractual commitments;
- •
- Although depreciation and amortization are non-cash charges, the assets being depreciated and amortized may
have to be replaced in the future, and adjusted EBITDA does not reflect cash capital expenditure requirements for such replacements;
- •
- Adjusted EBITDA does not reflect changes in, or cash requirements for, our working capital needs;
- •
- Adjusted EBITDA does not reflect the significant interest expense or the cash requirements necessary to service interest
or principal payments on our indebtedness;
- •
- Adjusted EBITDA does not reflect certain tax payments that may represent a reduction in cash available to us; and
- •
- Other companies, including companies in our industry, may calculate adjusted EBITDA measures differently, which reduces their usefulness as a comparative measure.
Because of these limitations, adjusted EBITDA should not be considered as a measure of discretionary cash available to us to invest in the growth of our business. When evaluating our performance, you should consider adjusted EBITDA alongside other financial performance measures, including our net loss and other GAAP results.
44
The following table presents a reconciliation of adjusted EBITDA to our net income (loss), the most comparable GAAP measure, for each of the periods indicated:
| |
Years Ended December 31, | Six Months Ended June 30, |
|||||||||||||||||||||
|---|---|---|---|---|---|---|---|---|---|---|---|---|---|---|---|---|---|---|---|---|---|---|---|
| |
2006 | 2007 | 2008 | 2009 | 2010 | 2010 | 2011 | ||||||||||||||||
| |
|
|
|
|
|
(unaudited) |
|||||||||||||||||
| |
(in thousands) |
||||||||||||||||||||||
Net loss |
$ | (7,512 | ) | $ | (10,223 | ) | $ | (9,500 | ) | $ | (5,254 | ) | $ | (1,778 | ) | $ | (3,346 | ) | $ | (3,230 | ) | ||
Non-GAAP adjustments: |
|||||||||||||||||||||||
Revenue(1) |
— | 519 | — | — | — | — | 312 | ||||||||||||||||
Interest, net |
(448 | ) | (850 | ) | (94 | ) | 48 | 13 | (17 | ) | 445 | ||||||||||||
Provision for taxes |
1 | 1 | 186 | 17 | 19 | 2 | 13 | ||||||||||||||||
Depreciation and amortization |
872 | 2,105 | 3,430 | 4,380 | 4,971 | 2,412 | 3,504 | ||||||||||||||||
Stock-based compensation expense(2) |
1,849 | 711 | 916 | 1,081 | 1,364 | 675 | 982 | ||||||||||||||||
Adjusted EBITDA (unaudited) |
$ | (5,238 | ) | $ | (7,737 | ) | $ | (5,062 | ) | $ | 272 | $ | 4,589 | $ | (274 | ) | $ | 2,026 | |||||
- (1)
- Reduction
in revenue as a result of common stock warrants issued in connection with a customer agreement
- (2)
- Includes stock-based compensation as follows:
| |
Years Ended December 31, | Six Months Ended June 30, | |||||||||||||||||||||
|---|---|---|---|---|---|---|---|---|---|---|---|---|---|---|---|---|---|---|---|---|---|---|---|
| |
2006 | 2007 | 2008 | 2009 | 2010 | 2010 | 2011 | ||||||||||||||||
| |
|
|
|
|
|
(unaudited) |
|||||||||||||||||
| |
(in thousands) |
||||||||||||||||||||||
Cost of revenue |
$ | 19 | $ | 81 | $ | 71 | $ | 134 | $ | 285 | $ | 118 | $ | 233 | |||||||||
Research and development |
179 | 192 | 170 | 222 | 204 | 118 | 191 | ||||||||||||||||
Sales and marketing |
108 | 256 | 408 | 378 | 422 | 231 | 303 | ||||||||||||||||
General and administrative |
1,543 | 182 | 267 | 347 | 453 | 208 | 255 | ||||||||||||||||
Total stock-based compensation |
$ | 1,849 | $ | 711 | $ | 916 | $ | 1,081 | $ | 1,364 | $ | 675 | $ | 982 | |||||||||
45
MANAGEMENT'S DISCUSSION AND ANALYSIS OF
FINANCIAL CONDITION AND RESULTS OF OPERATIONS
The following discussion and analysis of our financial condition and results of operations should be read in conjunction with our consolidated financial statements and related notes included elsewhere in this prospectus. This discussion contains forward-looking statements that involve risks and uncertainties. Our actual results could differ materially from those discussed below. Factors that could cause or contribute to such differences include, but are not limited to, those identified below and those discussed in the section entitled "Risk Factors" included elsewhere in this prospectus.
Overview
We have pioneered a proprietary approach to accelerate research and development, innovation and time-to-market for the semiconductor and clean-energy industries. Using our approach, we develop technology and intellectual property (IP) focused on advanced materials, processes, integration and device architectures in collaboration with our customers. This technology enables our customers to bring optimized, high-volume manufacturing-ready integrated devices to market faster and with less risk than traditional approaches to research and development (R&D). We provide our customers with proprietary technology through various fee arrangements and grant them rights to associated IP, primarily through royalty-bearing licenses. Our proprietary approach is broadly applicable to high-volume integrated device markets, which include semiconductors, flat glass, solar cells, light-emitting diodes (LEDs), flat-panel displays, advanced batteries and other energy-efficient technologies.
We currently target large, high-volume semiconductor and high-growth emerging clean-energy markets, including DRAM, flash memory, complex logic, flat glass, solar cells, LEDs and energy-efficient technologies. Within these broad markets, we target customers that have track records of technological innovation, deploy significant resources and are pursuing technical advancements that are critical to their success and strategy. We have engaged in paid programs with 18 customers, including ATMI, Elpida Memory, GLOBALFOUNDRIES, Guardian Industries, SanDisk, Taiwan Semiconductor Manufacturing Company (TSMC) and Toshiba. ATMI and Elpida have commenced shipping products incorporating technology developed through our collaborative development programs (CDPs) and pay us licensing and royalty fees. To date, we have received the majority of our revenue from customers in DRAM, flash memory, complex logic and energy-efficient applications in flat glass, and have not yet received a material amount of revenue from customers in solar cells, LEDs and other energy-efficient technologies.
We were founded in 2004 and are headquartered in San Jose, California. Our total revenue increased to $23.8 million for the six months ended June 30, 2011 from $16.5 million for the six months ended June 30, 2010. Our total revenue increased to $42.7 million for the year ended December 31, 2010 from $26.9 million for the year ended December 31, 2009. Our backlog as of June 30, 2011 was $108.8 million, of which $28.3 million is scheduled to be recognized as revenue during the remainder of the year ending December 31, 2011. Our adjusted EBITDA for the six months ended June 30, 2011 was $2.0 million, and our adjusted EBITDA for the year ended December 31, 2010 was $4.6 million. Our net loss decreased to $3.2 million for the six months ended June 30, 2011 from $3.3 million for the six months ended June 30, 2010. Our net loss decreased to $1.8 million for the year ended December 31, 2010 from $5.3 million from the year ended December 31, 2009. Since inception, we have incurred net losses leading to an accumulated deficit of $73.2 million as of June 30, 2011.
How We Generate Revenue
Our business model aligns our interests with those of our customers as we collaborate to develop proprietary technology and IP for high-volume integrated devices through CDPs. As such, our customer engagement process generates revenue in three ways: CDP and services revenue; product revenue; and licensing and royalty revenue. CDPs are our primary engagement model with customers and are
46
structured to result in licensing and royalty revenue. When we initially engage with a customer, we generate revenue from micro-CDPs, CDPs and licensing of our HPC platform. When technology developed through CDPs is incorporated in our customers' commercialized products, we generate licensing and royalty revenue. In certain cases, we sell HPC processing tools to our customers who pay a recurring license fee to operate those tools with our combinatorial processing capabilities.
| |
Years Ended December 31, | Six Months Ended June 30, |
||||||||||||||||
|---|---|---|---|---|---|---|---|---|---|---|---|---|---|---|---|---|---|---|
| |
2008 | 2009 | 2010 | 2010 | 2011 | |||||||||||||
| |
|
|
|
(unaudited) |
||||||||||||||
| |
(in thousands) |
|||||||||||||||||
Revenue: |
||||||||||||||||||
CDP and services revenue |
$ | 14,647 | $ | 14,182 | $ | 27,705 | $ | 9,806 | $ | 15,820 | ||||||||
Product revenue |
6,206 | 9,065 | 6,959 | 3,300 | 1,360 | |||||||||||||
Licensing and royalty revenue |
2,276 | 3,663 | 8,010 | 3,386 | 6,644 | |||||||||||||
Total revenue |
$ | 23,129 | $ | 26,910 | $ | 42,674 | $ | 16,492 | $ | 23,824 | ||||||||
- •
- CDP and services revenue. CDP revenue includes payments
for full time equivalent (FTE) employees, milestone payments, subscription payments for dedicated workflow tools used in the CDP, reimbursed payments for consumables and outside services from third
parties. Individual CDPs typically range from one to three years. Services revenue outside of CDPs is substantially comprised of support and maintenance fees and extended warranty agreements.
- •
- Product revenue. Product revenue consists of sales of our
workflow hardware and embedded software. In support of our business strategy, we selectively sell our proprietary tools to increase opportunities for CDPs and licensing fees and royalties.
Historically, we have not sold a significant number of our workflow products and we do not anticipate selling a significant number in the future. As our other revenue streams increase we expect our
product revenue to decrease as a percentage of our overall revenue. We recognize revenue from the sale of products generally on a straight-line basis over the maintenance period once delivery has
occurred (title and risk of loss have passed to the customer), and customer acceptance, if required, has been achieved.
- •
- Licensing and royalty revenue. Licensing and royalty revenue consists of licensing fees and royalties for granting our customers rights to our proprietary technology and IP. Specifically, this includes licensing the HPC capabilities of our workflows, licensing our informatics and analysis software and licensing fees and royalties on products commercialized by our customers that incorporate technology developed through our CDPs. In the last three years, licensing and royalty revenue has been the fastest growing element of our revenue. Over the long term, we expect licensing and royalty revenue to be an increasing and significant component of our revenue.
Our revenue growth has been primarily driven by the adoption of our collaboration model and HPC platform leading to both new CDPs and the ramp of licensing and royalty revenue from products commercialized by our customers that incorporate technology developed through our CDPs. Successful CDPs result in the commercialization of products whereby we receive licensing fees and royalties over the course of the respective product cycles. Certain of our semiconductor customers have already commenced shipping products incorporating technology developed through our CDPs, which generate associated licensing and royalty revenue. Our revenue mix may vary from quarter to quarter as we enter into new CDPs and related customer arrangements, existing CDPs are completed or expanded and licensing and royalty arrangements generate revenue.
Prior to entering into a new CDP, we negotiate licensing fees and royalty rates for technology to be developed in CDPs. The fees and rates are negotiated with each customer on the basis of multiple
47
factors including the size of the servable market of the technology to be developed, the value contribution of the technology to the customer's product, and the anticipated overall margin structure of the customer's product. Licensing fees and royalty rates are set for each CDP-developed technology. While royalty rates vary, when working with device manufacturers, we typically target 1-2% of their projected end-product revenue for each CDP-developed technology. When working with suppliers to device manufacturers, we typically target higher royalty rates depending on the anticipated value contribution of the technology to their product. Licensing fees and royalty rates are structured in a variety of ways including fixed quarterly fees, percentage of revenue and fee per product.
Our proprietary platform was initially created to address critical development challenges in the semiconductor industry and we began generating revenue in 2006. The applicability of our platform to address similar challenges in adjacent vertical markets such as clean-energy markets has created, and we believe will continue to create, new market opportunities for us. During the year ended December 31, 2010, we began generating revenue from customers in the clean-energy industry. We believe collaborating with companies in the clean-energy industry will accelerate the long-term growth of our business. The following table sets forth our revenue by customer end market:
| |
Years Ended December 31, | Six Months Ended June 30, |
|||||||||||||||
|---|---|---|---|---|---|---|---|---|---|---|---|---|---|---|---|---|---|
| |
2008 | 2009 | 2010 | 2010 | 2011 | ||||||||||||
| |
|
|
|
(unaudited) |
|||||||||||||
| |
(in thousands) |
||||||||||||||||
Semiconductor |
$ | 23,129 | $ | 26,910 | $ | 40,678 | $ | 16,216 | $ | 21,810 | |||||||
Clean energy |
— | — | 1,996 | 276 | 2,014 | ||||||||||||
Total |
$ | 23,129 | $ | 26,910 | $ | 42,674 | $ | 16,492 | $ | 23,824 | |||||||
Key Financial Metrics
We monitor the key financial metrics set forth below to help us evaluate growth trends, establish budgets, measure the effectiveness of our sales and marketing efforts, manage our human resources and assess operational efficiencies.
Revenue growth and mix. We monitor revenue from CDPs for existing and new customers, applications and the resulting licensing fees and royalties. As our customer engagements progress, we expect licensing and royalty revenue to be an increasing and significant component of our revenue. We are broadening our development and sales efforts by expanding CDPs in the semiconductor industry resulting from the adoption of our HPC platform for technology development and engaging in CDPs with companies in the clean-energy industry as we believe this will accelerate the future growth of our business.
Backlog. We monitor our backlog as it represents the aggregate value of contracted business not yet recognized. Our backlog consists of future revenue that our customers are contractually committed to pay in our CDPs and guaranteed licensing and royalty revenue for our developed technology and intellectual property. Our backlog as of June 30, 2011, December 31, 2010 and 2009 was $108.8 million, $78.2 million and $34.5 million, respectively. As of June 30, 2011, our backlog for customers in the semiconductor industry was $105.7 million, of which $26.5 million is scheduled to be recognized as revenue during the remainder of the year ending December 31, 2011 and $79.2 million in future periods beyond this year. As of June 30, 2011, our backlog for customers in the clean-energy industry was $3.1 million, of which $1.8 million is scheduled to be recognized as revenue during the remainder of the year ending December 31, 2011 and $1.3 million in future periods beyond this period.
Adjusted EBITDA. We monitor our adjusted EBITDA to measure the profitability of our business. We use adjusted EBITDA as a key performance measure because we believe it facilitates operating
48
performance comparisons from period to period by excluding potential differences caused by variations in capital structures, tax positions (such as the impact of changes in effective tax rates or fluctuations in permanent differences or discrete quarterly items), the impact of depreciation and amortization expense, the non-cash impact of common stock warrants issued to customers and the impact of stock-based compensation expense. See "Selected Consolidated Financial Data—Non-GAAP Financial Measure" for a reconciliation of adjusted EBITDA to our net income (loss), the most comparable GAAP measure.
Factors Affecting our Performance
Reliance on our customers' success. Our success is tied to our customers' ability to successfully commercialize the products that incorporate technology developed through CDPs. We believe that we significantly improve our customers' ability to succeed in their end markets, but if they are unable to do so, the longer-term licensing and royalty revenue that we expect may be delayed or may not materialize. We attempt to manage this risk by carefully selecting projects and only participating in opportunities that we deem to have significant potential for long-term success.
Exposure to semiconductor memory and solar power end markets. Our performance is linked to the end markets in which our customers operate. Certain of these markets, such as the semiconductor memory markets and the solar panel market, have historically shown significant price volatility as a result of imbalances in supply and demand. As such, these markets have been traditionally challenging for participants. We believe that we manage this end market risk by participating in multiple end markets and by selecting customers that we believe will be successful in those markets.
Revenue mix and royalty rates. Our revenue from CDPs and product sales vary from contract to contract depending on the customer's requirements and the scope of the collaboration. The gross profit from CDPs and product sales may vary based on the size and scope of the contract. Our royalty rates vary from contract to contract depending on multiple factors, including the industry, the scope of our collaboration, and the degree to which our IP is central to the development of a given product. Individual royalty opportunities vary depending on the end market size and the duration of the specific end product life cycle. The gross profit from licensing and royalty revenue may vary based on the size and scope of the contract. We target an average gross margin contribution that is consistent across the industries and end markets we serve.
Long sales cycles. Our sales cycles are long, and we commit significant resources to and incur significant expenses for a project before a potential customer commits to use our HPC platform or CDPs. To be successful, we must establish contact with potential customers, often with senior management or executive officers, and educate them about the benefits of our HPC platform. Our sales cycles to date have typically ranged from 9 to 24 months and may be even longer in the future. Investment of time and resources in a particular customer engagement that does not ultimately result in material revenue will adversely affect our revenue and results of operations.
Customer concentration. Due to the concentrated nature of manufacturers in the DRAM, flash memory and complex logic markets, our revenue is and may continue to be concentrated to key high-volume customers. For example, our four largest customers in the six months ended June 30, 2011, all of which are in the semiconductor industry, accounted for 75% of our revenue. These customers collectively reported $25 billion of semiconductor revenue in 2010, and we believe there is an opportunity to expand our engagements with these customers into new applications over time. In addition, because our platform is broadly applicable to semiconductors, flat glass, solar cells, LEDs, flat-panel displays, advanced batteries and other energy-efficient technologies, we believe we have significant opportunities to engage with a broad range of customers.
Related Party Transactions. Some of our customers and other business partners hold a significant stake in our capital stock. Related party transactions disclosed in our financial statements accounted for
49
$10.4 million and $26.0 million, or 43.5% and 61.0%, respectively, of our revenue for the six months ended June 30, 2011 and the year ended December 31, 2010. ATMI, which beneficially owns approximately 10.6% of our capital stock as of September 1, 2011, accounted for $7.8 million and $22.1 million, or 32.7% and 51.8%, respectively, of our revenue for the six months ended June 30, 2011 and the year ended December 31, 2010. We believe that the transactions and agreements that we have entered into with related parties are on terms that are at least as favorable as could reasonably have been obtained at such time from third parties. However, these relationships could create, or appear to create, potential conflicts of interest when our board of directors is faced with decisions that could have different implications for us and our related parties or their affiliates. In addition, conflicts of interest may arise between us and our related parties and their affiliates. The appearance of conflicts, even if such conflicts do not materialize, might adversely affect the public's perception of us, as well as our relationship with other companies and our ability to enter into new relationships in the future, including new CDPs with competitors of such related parties, which could have a material adverse effect on our ability to do business.
Warrants Issued in Connection with a CDP
In March 2010, in connection with a CDP, we issued contingent warrants to two customers to purchase an aggregate of up to 1,644,736 shares of our common stock at a cash exercise price of $3.04144 per share. The exercise price was equal to the price of the then-most recent sale of preferred stock. These warrants become exercisable for four months after an election by the holders to license technology developed through the associated CDP. If either of the customers elect to license this technology, we will record a one-time, non-cash charge based on the fair value of these warrants as measured on the date of election against any revenue derived from these agreements. The fair value will be determined using the Black-Scholes option pricing model and may be significant. This election is available to the customers through May 2012 and may be extended for up to an additional two years if the customers extend the CDP.
In June 2011, in connection with a CDP, we issued a fully vested and exercisable warrant to a customer to purchase 822,000 shares of our common stock at a cash exercise price of $4.15412 per share. The exercise price was equal to the price of the then-most recent sale of preferred stock. The fair value of the warrant as measured on the date of grant using the Black-Scholes options pricing model was $312,000 and was recognized as a reduction of revenue derived from the agreement during the six month period ended June 30, 2011.
Cost of Revenue and Operating Expenses
Cost of Revenue
The following table sets forth our cost of revenue by revenue category:
| |
Years Ended December 31, | Six Months Ended June 30, |
||||||||||||||||
|---|---|---|---|---|---|---|---|---|---|---|---|---|---|---|---|---|---|---|
| |
2008 | 2009 | 2010 | 2010 | 2011 | |||||||||||||
| |
|
|
|
(unaudited) |
||||||||||||||
| |
(in thousands) |
|||||||||||||||||
Cost of revenue: |
||||||||||||||||||
Cost of CDP and services revenue |
$ | 9,141 | $ | 8,849 | $ | 16,855 | $ | 6,932 | $ | 10,533 | ||||||||
Cost of product revenue |
3,370 | 3,972 | 3,665 | 1,652 | 469 | |||||||||||||
Cost of licensing and royalty revenue |
114 | 197 | 406 | 168 | 321 | |||||||||||||
Total cost of revenue |
$ | 12,625 | $ | 13,018 | $ | 20,926 | $ | 8,752 | $ | 11,323 | ||||||||
Our cost of revenue is variable and depends on the product mix and type of revenue earned in each period relating to our customer programs. As customers commercialize products that incorporate
50
technology developed through our CDPs, we expect our cost of revenue to decrease as a percentage of total revenue as licensing and royalty revenue become an increasing component of our revenue.
- •
- Cost of CDP and services revenue. Our cost of CDP and
services revenue is primarily comprised of salaries and other personnel-related expenses (including stock-based compensation) for our collaborative research and development scientists, engineers and
development fab process operations employees. Additionally, our cost of revenue includes costs of wafers, targets, materials, program-related supplies and depreciation of equipment used in CDPs.
- •
- Cost of product revenue. Our cost of product revenue
primarily includes our cost of products sold. Our cost of product revenue will fluctuate based on the type of product and configuration sold. Historically, we have not sold a significant number of our
workflow products and we do not anticipate selling a significant number in the future. Our cost of product revenue is recognized in a similar manner as the corresponding product revenue and is
generally recognized on a straight-line basis over the maintenance period. The variability in cost of product revenue as a percentage of revenue is related to the quantity and
configuration of products sold during the period and the corresponding maintenance period that product revenue and cost of product revenue is being recognized.
- •
- Cost of licensing and royalty revenue. Our cost of licensing and royalty revenue includes license fees paid to Symyx.
Research and Development
Our R&D expenses consist of costs incurred for development and continuous improvement of our HPC platform, expansion of software capabilities and application research and development that are not associated with customer programs. R&D costs include personnel-related expenses (including stock-based compensation expenses), for our technical staff as well as consultant costs, parts and prototypes, wafers, chemicals, supply costs, facilities costs, utilities costs related to laboratories and offices occupied by technical staff, depreciation on equipment used by technical staff, and outside services, such as machining and third-party R&D costs. Overhead costs that are not allocated to a customer program are recognized as expenses within R&D. We expect our R&D expenses will continue to increase for the foreseeable future as we continue to devote substantial internal resources to develop and improve our HPC platform and extend the applicability of our platform to a broader set of applications within the industries we serve.
Sales and Marketing
Our sales and marketing expenses consist primarily of personnel-related costs (including stock-based compensation) for our sales and marketing employees, as well as payments of commissions to our sales employees, facility costs and professional expenses. Professional expenses consist of external website and marketing communication consulting costs and market research. We expect that our sales and marketing expenses will continue to increase for the foreseeable future as we increase the number of our sales and marketing employees to support the growth in our business and as we incur external marketing communication costs.
General and Administrative
General and administrative expenses consist primarily of personnel-related costs (including stock-based compensation) as well as professional services and facilities costs related to our executive, finance, legal, human resources, management information systems and information technology functions. Professional services consist of outside accounting, information technology, consulting and legal costs.
51
Following the completion of this offering, we expect to incur significant additional accounting and legal costs related to compliance with rules and regulations enacted by the Securities and Exchange Commission, including the additional costs of achieving and maintaining compliance with Section 404 of the Sarbanes-Oxley Act, as well as additional insurance, investor relations and other costs associated with being a public company. In addition to these expenses, we expect that our general and administrative expenses will continue to increase for the foreseeable future.
Interest Income, net
Interest income represents interest earned on our cash, cash equivalents and short-term investments. We expect interest income will vary each reporting period depending on our average investment balances during the period and market interest rates.
Interest expense consists of interest accrued or paid on lines of credit outstanding. We expect interest expense to fluctuate in the future with changes in obligations and market interest rates.
Other Income (Expense), net
Other income consists of municipal economic development grant proceeds received during the year ended December 31, 2010. Other income (expense), net also consists of the change in fair value of our preferred stock warrants and other income. Our outstanding preferred stock warrant, which was issued in connection with a line of credit, is classified as a liability and is remeasured to fair value at each balance sheet date with the corresponding gain or loss from the adjustment recorded as other income (expense), net. We will continue to record adjustments to the fair value of the preferred stock warrant until it is exercised, automatically converted into a warrant to purchase common stock or expires, at which time the warrant will no longer be remeasured at each balance sheet date.
Provision for Income Taxes
We are subject to taxes in the United States as well as other tax jurisdictions or countries in which we conduct business. Earnings from our non-U.S. activities are subject to local country income tax and may be subject to current U.S. income tax. To date, we have incurred net losses and have not recorded any U.S. federal income tax benefits as these losses have been offset by valuation allowances. As of December 31, 2010, we had net operating loss carryforwards for federal and state income tax purposes of approximately $17.4 million and $18.5 million, respectively, to offset future taxable income. In addition, we had $2.5 million in U.S. federal R&D credit and $2.5 million in California R&D credit carryforwards to offset future income tax liabilities. Our ability to use our net operating loss carryforwards to offset future taxable income and our ability to use our tax credit carryforwards to offset future income tax liabilities may be subject to certain limitations arising from "ownership changes" within the meaning of Section 382 of the Internal Revenue Code.
52
Results of Operations
Comparison of the Six Months Ended June 30, 2010 and 2011
| |
Six Months Ended June 30, | |
|
|||||||||||||
|---|---|---|---|---|---|---|---|---|---|---|---|---|---|---|---|---|
| |
2010 | 2011 | $ Change | % Change | ||||||||||||
| |
(unaudited) |
|
|
|||||||||||||
| |
(in thousands) |
|
||||||||||||||
Revenue: |
||||||||||||||||
CDP and services revenue |
$ | 9,806 | $ | 15,820 | $ | 6,014 | 61 | % | ||||||||
Product revenue |
3,300 | 1,360 | (1,940 | ) | (59 | )% | ||||||||||
Licensing and royalty revenue |
3,386 | 6,644 | 3,258 | 96 | % | |||||||||||
Total revenue |
16,492 | 23,824 | 7,332 | 44 | % | |||||||||||
Cost of revenue |
8,752 | 11,323 | 2,571 | 29 | % | |||||||||||
Gross profit |
7,740 | 12,501 | 4,761 | 62 | % | |||||||||||
Operating expenses: |
||||||||||||||||
Research and development |
6,353 | 9,488 | 3,135 | 49 | % | |||||||||||
Sales and marketing |
1,926 | 1,980 | 54 | 3 | % | |||||||||||
General and administrative |
2,877 | 3,925 | 1,048 | 36 | % | |||||||||||
Total operating expenses |
11,156 | 15,393 | 4,237 | 38 | % | |||||||||||
Loss from operations |
(3,416 | ) | (2,892 | ) | 524 | |||||||||||
Other income (expense): |
||||||||||||||||
Interest income, net |
17 | 10 | (7 | ) | ||||||||||||
Other income (expense), net |
55 | (335 | ) | (390 | ) | |||||||||||
Total other income (expense), net |
72 | (325 | ) | (397 | ) | |||||||||||
Loss before provision for income taxes |
(3,344 | ) | (3,217 | ) | 127 | |||||||||||
Provision for income taxes |
2 | 13 | 11 | |||||||||||||
Net loss |
$ | (3,346 | ) | $ | (3,230 | ) | $ | 116 | ||||||||
Revenue
Our revenue increased by $7.3 million, or 44%, to $23.8 million during the six months ended June 30, 2011 from $16.5 million during the six months ended June 30, 2010. This increase was due to increases in CDP and services revenue and licensing and royalty revenue of $9.2 million which were partially offset by decreases in product revenue of $1.9 million.
CDP and services revenue increased by $6.0 million, or 61%, to $15.8 million during the six months ended June 30, 2011 from $9.8 million during the six months ended June 30, 2010. This increase was primarily attributable to $3.8 million in revenue derived from new customer engagements, combined with $3.4 million from the expansion of existing customer engagements, offset by a $1.2 million decrease in revenue from the scheduled completion of CDPs. Of the new customer engagements, $2.6 million in revenue was derived from three new CDPs.
Product revenue decreased by $1.9 million, or 59%, to $1.4 million during the six months ended June 30, 2011 from $3.3 million during the six months ended June 30, 2010. The decrease in product revenue is due to differences in both the type of product sold during each period as well as the length of the corresponding maintenance periods for the respective products for which the revenue was recognized. We have not had any product sales of our workflow hardware that were initiated during 2011.
Licensing and royalty revenue increased by $3.2 million, or 96%, to $6.6 million during the six months ended June 30, 2011 from $3.4 million during the six months ended June 30, 2010. This
53
increase was primarily attributable to an increase in sales of products subject to licensing fees and royalties.
The following table presents revenue by geographic region (based on invoiced locations) during the six months ended June 30, 2011 and 2010 in dollars (in thousands) and as a percentage of revenue for the periods presented:
| |
Six Months Ended June 30, | |||||||||||||
|---|---|---|---|---|---|---|---|---|---|---|---|---|---|---|
| |
2010 | 2011 | ||||||||||||
| |
Revenue | % of Revenue | Revenue | % of Revenue | ||||||||||
| |
(unaudited) |
|||||||||||||
| |
(in thousands) |
|
(in thousands) |
|
||||||||||
United States |
$ | 11,699 | 71 | % | $ | 14,886 | 63 | % | ||||||
Japan |
4,583 | 28 | % | 7,468 | 31 | % | ||||||||
Taiwan |
— | 0 | % | 1,470 | 6 | % | ||||||||
Europe |
210 | 1 | % | — | 0 | % | ||||||||
Total |
$ | 16,492 | 100 | % | $ | 23,824 | 100 | % | ||||||
Cost of Revenue
Cost of revenue increased by $2.6 million, or 29%, to $11.3 million during the six months ended June 30, 2011 from $8.7 million during the six months ended June 30, 2010. This change is directly attributable to the increased CDP and services revenue we recognized from our new and ongoing customer engagements, which resulted in a $3.6 million increase in direct labor, materials and other costs associated with these programs. Additionally, cost of licensing and royalty revenue increased by $0.2 million directly attributable to increased licensing and royalty revenue. This increase was partially offset by a $1.2 million decrease in cost of product revenue associated with the decrease in product revenue recognized during the period.
Research and Development
R&D expenses increased by $3.1 million, or 49%, to $9.5 million during the six months ended June 30, 2011 from $6.4 million during the six months ended June 30, 2010. The change is attributable to $1.1 million in higher personnel costs as a result of increased headcount, $0.8 million increase in facility and occupancy-related costs due to clean room expansion, $0.1 million in parts costs for internal R&D projects, $1.0 million increase in depreciation expense and $0.1 million of higher consulting and professional service fees.
Sales and Marketing
Sales and marketing expenses were essentially flat for the six months ended June 30, 2011 compared to the six months ended June 30, 2010.
General and Administrative
General and administrative expenses increased by $1.0 million, or 36%, to $3.9 million during the six months ended June 30, 2011 from $2.9 million during the six months ended June 30, 2010. The increase is primarily attributable to $0.4 million in higher professional fees associated with legal and accounting services and $0.3 million in higher personnel costs as a result of increased headcount.
Interest Income, net
Interest income, net was essentially flat for the six months ended June 30, 2011 compared to the six months ended June 30, 2010.
54
Loss from Operations
Our operating loss decreased by $0.5 million, to an operating loss of $2.9 million during the six months ended June 30, 2011 from an operating loss of $3.4 million during the six months ended June 30, 2010. To the extent we are successful in growing our revenue and increasing licensing and royalty revenue as a percentage of our total revenue, and if our expenses increase at a slower rate than our revenue, we expect that our net loss will decrease in the future. Our operating expenses increased by $4.2 million to $15.4 million during the six months ended June 30, 2011 from $11.2 million during the six months ended June 30, 2010. We expect our operating expenses to continue to increase as we expand and invest in our business, making investments in both personnel and capital resources leading to increased depreciation expense.
Other Income (Expense), net
Other income (expense) decreased by $0.4 million to $(0.3) million during the six months ended June 30, 2011 from an expense of $0.1 million during the six months ended June 30, 2010. This increase was due to the remeasurement of our preferred stock warrant liability to its current fair value.
Provision for Income Taxes
Provision for income taxes as of June 30, 2011 and 2010 consisted of income taxes on our foreign entities and were not significant during either period.
Net Loss
Our net loss decreased by $0.1 million, to a net loss of $3.2 million during the six months ended June 30, 2011 from a net loss of $3.3 million during the six months ended June 30, 2010. The increase in net loss from our operating loss during the six months ended June 30, 2011 was primarily attributed to the remeasurement of our preferred stock warrant liability to its current fair value that resulted in an expense of $0.5 million.
55
Comparison of the Years Ended December 31, 2009 and 2010
| |
Years Ended December 31, |
|
|
|||||||||||||
|---|---|---|---|---|---|---|---|---|---|---|---|---|---|---|---|---|
| |
2009 | 2010 | $ Change | % Change | ||||||||||||
| |
(in thousands) |
|
||||||||||||||
Revenue: |
||||||||||||||||
CDP and services revenue |
$ | 14,182 | $ | 27,705 | $ | 13,523 | 95 | % | ||||||||
Product revenue |
9,065 | 6,959 | (2,106 | ) | (23 | )% | ||||||||||
Licensing and royalty revenue |
3,663 | 8,010 | 4,347 | 119 | % | |||||||||||
Total revenue |
26,910 | 42,674 | 15,764 | 59 | % | |||||||||||
Cost of revenue |
13,018 | 20,926 | 7,908 | 61 | % | |||||||||||
Gross profit |
13,892 | 21,748 | 7,856 | 57 | % | |||||||||||
Operating expenses: |
||||||||||||||||
Research and development |
10,983 | 13,917 | 2,934 | 27 | % | |||||||||||
Sales and marketing |
3,211 | 4,074 | 863 | 27 | % | |||||||||||
General and administrative |
4,867 | 5,761 | 894 | 18 | % | |||||||||||
Total operating expenses |
19,061 | 23,752 | 4,691 | 25 | % | |||||||||||
Loss from operations |
(5,169 | ) | (2,004 | ) | 3,165 | |||||||||||
Other income (expense): |
||||||||||||||||
Interest income, net |
(6 | ) | 43 | 49 | ||||||||||||
Other income (expense), net |
(62 | ) | 202 | 264 | ||||||||||||
Total other income (expense), net |
(68 | ) | 245 | 313 | ||||||||||||
Loss before provision for income taxes |
(5,237 | ) | (1,759 | ) | 3,478 | |||||||||||
Provision for income taxes |
17 | 19 | 2 | |||||||||||||
Net loss |
$ | (5,254 | ) | $ | (1,778 | ) | $ | 3,476 | ||||||||
Revenue
Our revenue increased by $15.8 million, or 59%, to $42.7 million during the year ended December 31, 2010 from $26.9 million during the year ended December 31, 2009, primarily due to increases in revenue from CDPs and licensing arrangements partially offset by reductions in revenue from product revenue.
CDP and services revenue increased by $13.5 million, or 95%, to $27.7 million during the year ended December 31, 2010 from $14.2 million during the year ended December 31, 2009. This change is attributable to $10.2 million in revenue derived from three customer engagements, including one for a customer in the clean-energy industry, that commenced during the year ended December 31, 2010. The remaining $3.3 million increase is due to the net effect of expansions of existing CDPs, partially offset by reductions from the scheduled completion of two CDPs.
Product revenue decreased by $2.1 million, or 23%, to $7.0 million during the year ended December 31, 2010 from $9.1 million during the year ended December 31, 2009. This decrease is primarily attributable to the recognition of revenue during the year ended December 31, 2009 from four workflow platform sales as compared to recognition of revenue during the year ended December 31, 2010 from two workflow platform sales.
Licensing and royalty revenue increased by $4.3 million, or 119%, to $8.0 million during the year ended December 31, 2010 from $3.7 million during the year ended December 31, 2009. This change is primarily attributable to a $2.5 million increase in licensing fees and royalties from commercialized products and a $1.8 million increase in licensing fees from licenses to the HPC capabilities of our workflows and other technology.
56
Revenue to customers in the various geographic regions remained relatively unchanged. The following table presents revenue by geographic region (based on invoiced locations) during the years ended December 31, 2010 and 2009 in dollars and as a percentage of revenue for the periods presented:
| |
Years Ended December 31, | |||||||||||||
|---|---|---|---|---|---|---|---|---|---|---|---|---|---|---|
| |
2009 | 2010 | ||||||||||||
| |
Revenue | % of Revenue | Revenue | % of Revenue | ||||||||||
| |
(in thousands) |
|
(in thousands) |
|
||||||||||
United States |
$ | 18,894 | 70 | % | $ | 29,526 | 70 | % | ||||||
Japan |
7,906 | 30 | % | 12,449 | 29 | % | ||||||||
Taiwan |
— | 0 | % | 489 | 1 | % | ||||||||
Europe |
110 | 0 | % | 210 | 0 | % | ||||||||
Total |
$ | 26,910 | 100 | % | $ | 42,674 | 100 | % | ||||||
Cost of Revenue
Cost of revenue increased by $7.9 million, or 61%, to $20.9 million during the year ended December 31, 2010 from $13.0 million during the year ended December 31, 2009. This change is directly attributable to the increased CDP and services revenue during the year ended December 31, 2010 that we recognized from our new and ongoing CDPs, which resulted in a $8.0 million increase in direct labor, materials and other costs associated with these programs, including an increase in licensing fees payable to Symyx in the amount of $0.9 million. Additionally, cost of licensing and royalty revenue increased by $0.2 million directly attributable to increased licensing and royalty revenue. These increases were partially offset by a $0.3 million decrease in direct workflow platform costs due to fewer workflow platform sales during the year ended December 31, 2010.
Research and Development
R&D expenses increased by $2.9 million, or 27%, to $13.9 million during the year ended December 31, 2010 from $11.0 million during the year ended December 31, 2009. The change is attributable to $2.1 million in higher personnel costs as a result of increased headcount, a $1.6 million increase in facility and occupancy-related costs due to clean room expansion, $0.8 million in parts costs for internal R&D projects and $0.3 million of higher consulting and professional service fees. These increases were partially offset by a decrease in R&D expenses due to an increase in the use of equipment for CDPs resulting in an increase in the allocation of expenses to cost of revenue during the year ended December 31, 2010 as compared to the year ended December 31, 2009.
Sales and Marketing
Sales and marketing expenses increased by $0.9 million, or 27%, to $4.1 million during the year ended December 31, 2010 from $3.2 million during the year ended December 31, 2009. The change is primarily attributable to $0.5 million in higher personnel costs related to commissions earned on 2010 bookings and collections combined with $0.2 million in higher travel, entertainment and marketing expenses attributable to increased sales and marketing efforts during the year ended December 31, 2010.
General and Administrative
General and administrative expenses increased by $0.9 million, or 18%, to $5.8 million during the year ended December 31, 2010 from $4.9 million during the year ended December 31, 2009. The increase is primarily attributable to $0.5 million in higher personnel costs as a result of increased headcount, $0.2 million in higher professional fees, $0.1 million in higher facility and occupancy-related costs and $0.1 million in higher travel and entertainment costs.
57
Interest Income, net
Interest income, net changed by $49,000 to income of $43,000 during the year ended December 31, 2010 from an expense of $6,000 during the year ended December 31, 2009. The change is due primarily to the $0.1 million reduction in interest expense during the year ended December 31, 2010 due to the repayment of our obligations under our amended loan and security agreement which were partially offset by $44,000 of interest income earned on our cash, cash equivalents and short-term investments.
Loss from Operations
Our operating loss decreased by $3.2 million, to an operating loss of $2.0 million during the year ended December 31, 2010 from an operating loss of $5.2 million during the year ended December 31, 2009. The decrease in operating loss is related to increased revenue and the composition of that revenue. The increase in licensing and royalty revenue as a percentage of our total revenue and the increase in our operating expenses growing at a slower rate than revenue have resulted in a decrease in our operating loss.
Other Income (Expense), net
Other income (expense) increased by $0.3 million to income of $0.2 million during the year ended December 31, 2010 from an expense of $0.1 million during the year ended December 31, 2009. The change was directly attributable to municipal economic development grant proceeds we received during the year ended December 31, 2010.
Provision for Income Taxes
The income tax provision for the year ended December 31, 2010 was $19,000 compared to $17,000 for the year ended December 31, 2009. Both amounts consisted of income taxes on our foreign entities and were not significant in either period.
Net Loss
Our net loss decreased by $3.5 million, to a net loss of $1.8 million during the year ended December 31, 2010 from a net loss of $5.3 million during the year ended December 31, 2009. The decrease in net loss from our operating loss during the year ended December 31, 2010 was primarily attributed to municipal economic development grant proceeds and interest income we received during the year.
58
Comparison of the Years Ended December 31, 2008 and 2009
| |
Years Ended December 31, |
|
|
|||||||||||||
|---|---|---|---|---|---|---|---|---|---|---|---|---|---|---|---|---|
| |
2008 | 2009 | $ Change | % Change | ||||||||||||
| |
(in thousands) |
|
||||||||||||||
Revenue: |
||||||||||||||||
CDP and services revenue |
$ | 14,647 | $ | 14,182 | $ | (465 | ) | (3 | )% | |||||||
Product revenue |
6,206 | 9,065 | 2,859 | 46 | % | |||||||||||
Licensing and royalty revenue |
2,276 | 3,663 | 1,387 | 61 | % | |||||||||||
Total revenue |
23,129 | 26,910 | 3,781 | 16 | % | |||||||||||
Cost of revenue |
12,625 | 13,018 | 393 | 3 | % | |||||||||||
Gross profit |
10,504 | 13,892 | 3,388 | 32 | % | |||||||||||
Operating expenses: |
||||||||||||||||
Research and development |
11,849 | 10,983 | (866 | ) | (7 | )% | ||||||||||
Sales and marketing |
3,849 | 3,211 | (638 | ) | (17 | )% | ||||||||||
General and administrative |
4,300 | 4,867 | 567 | 13 | % | |||||||||||
Total operating expenses |
19,998 | 19,061 | (937 | ) | (5 | )% | ||||||||||
Loss from operations |
(9,494 | ) | (5,169 | ) | 4,325 | |||||||||||
Other income (expense): |
||||||||||||||||
Interest income, net |
174 | (6 | ) | (180 | ) | |||||||||||
Other income (expense), net |
6 | (62 | ) | (68 | ) | |||||||||||
Total other income (expense), net |
180 | (68 | ) | (248 | ) | |||||||||||
Loss before provision for income taxes |
(9,314 | ) | (5,237 | ) | 4,077 | |||||||||||
Provision for income taxes |
186 | 17 | (169 | ) | ||||||||||||
Net loss |
$ | (9,500 | ) | $ | (5,254 | ) | $ | 4,246 | ||||||||
Revenue
Our revenue increased by $3.8 million, or 16%, to $26.9 million during the year ended December 31, 2009 from $23.1 million during the year ended December 31, 2008 primarily due to increases in product revenue and licensing and royalty revenue offset by a reduction in revenue from ongoing CDPs.
CDP and services revenue decreased by $0.5 million, or 3%, to $14.2 million during the year ended December 31, 2009 from $14.6 million during the year ended December 31, 2008. The change is primarily due to a decrease in revenue of $4.0 million from the scheduled completion of CDPs, offset by a $3.5 million increase in revenue from the expansion of existing CDPs.
Product revenue increased by $2.9 million, or 46%, to $9.1 million during the year ended December 31, 2009 from $6.2 million during the year ended December 31, 2008. The increase in revenue during the year ended December 31, 2009 is primarily attributable to the recognition of revenue during the year ended December 31, 2008 from two workflow platform sales as compared to the recognition of revenue during the year ended December 31, 2009 from two previous and two additional workflow platform sales.
Licensing and royalty revenue increased by $1.4 million, or 61%, to $3.7 million during the year ended December 31, 2009 from $2.3 million during the year ended December 31, 2008. This change is primarily attributable to a $0.5 million increase in licensing and royalty fees from commercialized products and a $0.9 million increase in licensing fees from licenses to the HPC capabilities of our workflows.
59
Revenue from customers in the various geographic regions (based on invoiced locations) remained relatively unchanged. The following table presents revenue by geographic region during the years ended December 31, 2008 and 2009 in dollars and as a percentage of revenue for the periods presented:
| |
Years Ended December 31, | |||||||||||||
|---|---|---|---|---|---|---|---|---|---|---|---|---|---|---|
| |
2008 | 2009 | ||||||||||||
| |
Revenue | % of Revenue | Revenue | % of Revenue | ||||||||||
| |
(in thousands) |
|
(in thousands) |
|
||||||||||
United States |
$ | 16,522 | 72 | % | $ | 18,894 | 70 | % | ||||||
Japan |
6,267 | 27 | % | 7,906 | 30 | % | ||||||||
Taiwan |
90 | 0 | % | — | 0 | % | ||||||||
Europe |
250 | 1 | % | 110 | 0 | % | ||||||||
Total |
$ | 23,129 | 100 | % | $ | 26,910 | 100 | % | ||||||
Cost of Revenue
Cost of revenue increased by $0.4 million, or 3%, to $13.0 million during the year ended December 31, 2009 from $12.6 million during the year ended December 31, 2008. The increase is directly attributable to the increase in product revenue during the year ended December 31, 2009, which resulted in a $0.6 million increase in direct workflow platform costs, including an increase in licensing fees payable to Symyx in the amount of $0.1 million. Additionally, cost of licensing and royalty revenue increased by $0.1 million directly attributable to increased licensing and royalty revenue. These increases were partially offset by a $0.3 million reduction in direct labor, materials and other costs associated with our ongoing CDPs due to the reduction in services revenue during the year ended December 31, 2009.
Research and Development
R&D expenses decreased by $0.9 million, or 7%, to $11.0 million during the year ended December 31, 2009 from $11.8 million during the year ended December 31, 2008. The decrease is attributable to a $1.1 million decrease in personnel costs, $0.7 million reduction in parts costs for internal R&D programs and $0.3 million reduction in consulting and professional service fees due to R&D personnel being used for ongoing CDPs during the year ended December 31, 2009 as compared to being used during the year ended December 31, 2008 for internal R&D projects. These decreases were partially offset by an increase in facility and occupancy-related expenses and an increase in R&D expenses due to a reduction in the use of equipment for CDPs resulting in a decrease in the allocation of expenses to cost of revenue during the year ended December 31, 2009 as compared to the year ended December 31, 2008.
Sales and Marketing
Sales and marketing expenses decreased by $0.6 million, or 17%, to $3.2 million during the year ended December 31, 2009 from $3.8 million during the year ended December 31, 2008. The decrease is attributable to a $0.3 million decrease in personnel costs related to staff turnover and reduced commission expense and $0.3 million decrease in travel, entertainment and marketing expenses.
General and Administrative
General and administrative expenses increased by $0.6 million, or 13%, to $4.9 million during the year ended December 31, 2009 from $4.3 million during the year ended December 31, 2008. The increase is attributable to $0.3 million in higher facility and occupancy-related costs, $0.2 million in higher personnel costs due to changes in headcount and $0.1 million in higher consulting and professional services costs.
60
Interest Income, net
Interest income, net decreased by $0.2 million to an expense of $6,000 during the year ended December 31, 2009 from $0.2 million during the year ended December 31, 2008. The change is attributable to a $0.5 million reduction in interest income combined with a $0.3 million reduction in interest expense. The decrease in interest income is attributable to lower average cash, cash equivalents and short-term investments on hand during the year ended December 31, 2009 compared to the year ended December 31, 2008 as we used the proceeds received from our Series D convertible preferred stock financing during the year ended December 31, 2008 for capital expenditures and principal repayments on our debt obligations during the year ended December 31, 2009. The decrease in interest expense is attributable to the repayment of our obligations under our amended loan and security agreement in February 2009.
Loss from Operations
Our operating loss decreased by $4.3 million, to an operating loss of $5.2 million during the year ended December 31, 2009 from an operating loss of $9.5 million during the year ended December 31, 2008. The decrease in operating loss is related to increased product and licensing and royalty revenue. The increase in revenue combined with the overall decline in operating expense has resulted in a decrease in our operating loss during the year ended December 31, 2009.
Other Income (Expense), net
Other income (expense) decreased by $0.1 million to an expense of $0.1 million during the year ended December 31, 2009 from income of $6,000 during the year ended December 31, 2008. The change is not significant.
Provision for Income Taxes
The tax provision for the year ended December 31, 2009 of $17,000 consisted of $13,000 in foreign income taxes on our foreign entities and $4,000 in state income taxes. The tax provision for the year ended December 31, 2008 of $186,000 consisted of $11,000 in income taxes on our foreign entities and $175,000 in state income taxes.
Net Loss
Our net loss was essentially the same as our loss from operations for the years ended December 31, 2009 and December 31, 2008.
Liquidity and Capital Resources
To date, we have substantially satisfied our capital and liquidity needs through private placements of redeemable convertible preferred stock and, to a lesser extent, cash flow from operations. As of June 30, 2011, we had $35.6 million of cash, cash equivalents and short-term investments and $23.9 million of net working capital. During the six months ended June 30, 2011, we closed a private placement of our Series E redeemable convertible preferred stock for $24.9 million in net proceeds. As of June 30, 2011, we had no debt outstanding under our amended loan and security agreement or any other debt instruments and had access to advances of $10.0 million under the amended loan and security agreement.
To date, we have incurred significant losses. During the six months ended June 30, 2011 and 2010 and the years ended December 31, 2010, 2009 and 2008, we incurred net losses of $3.2 million, $3.3 million, $1.8 million, $5.3 million and $9.5 million. As of June 30, 2011, our accumulated deficit was $73.2 million.
We have experienced positive cash flows from operations during the years ended December 31, 2010, 2009 and 2008. We may continue to generate positive cash flows from operations on an annual
61
basis, although this may fluctuate significantly on a quarterly basis. As such, we believe that our existing sources of liquidity will be sufficient to fund our operations for at least the next 12 months. Our future capital requirements will depend on many factors, including our rate of revenue growth, the expansion of our sales and marketing activities, the timing and extent of our spending to support our R&D efforts and our ability to expand CDPs in the semiconductor industry, resulting from the adoption of our HPC platform for technology development, and our ability to engage in CDPs with companies in the clean-energy industry. To the extent that existing cash and cash equivalents and cash from operations are insufficient to fund our future activities, we may need to raise additional funds through public or private equity or debt financing. We may also seek to invest in or acquire complementary businesses, applications or technologies, any of which could also require us to seek additional equity or debt financing. Additional funds may not be available on terms favorable to us or at all.
Cash Flows
The following summary of our cash flows for the periods indicated has been derived from our consolidated financial statements included elsewhere in this prospectus:
| |
Years Ended December 31, | Six Months Ended June 30, |
||||||||||||||
|---|---|---|---|---|---|---|---|---|---|---|---|---|---|---|---|---|
| |
2008 | 2009 | 2010 | 2010 | 2011 | |||||||||||
| |
|
|
|
(unaudited) |
||||||||||||
| |
(in thousands) |
|||||||||||||||
Net cash provided by (used in) operating activities |
$ | 981 | $ | 1,088 | $ | 1,175 | $ | (4,977 | ) | $ | (5,985 | ) | ||||
Net cash (used in) provided by investing activities |
$ | (8,162 | ) | $ | (16,708 | ) | $ | 924 | $ | 3,302 | $ | (7,282 | ) | |||
Net cash provided by (used in) financing activities |
$ | 21,339 | $ | (4,426 | ) | $ | 109 | $ | 56 | $ | 25,083 | |||||
Cash Flows from Operating Activities
We have experienced positive cash flows from operating activities during each of the years ended December 31, 2010, 2009 and 2008 including the receipt of advance payments from CDPs, product sales and licensing and royalty fees.
Net cash used in operating activities during the six months ended June 30, 2011 was primarily attributable to our net loss of $3.2 million and non-cash charges of $3.5 million of depreciation and amortization and $1.0 million in stock-based compensation, and $0.8 million related to both common and preferred stock warrant charges. The net decline in cash flow from our operating assets and liabilities of $(8.0) million was primarily as a result of a $8.3 million reduction in deferred revenue, and a $0.7 million decrease in accounts payable, offset by an increase in accrued and other liabilities of $1.1 million.
Net cash provided by operating activities during the year ended December 31, 2010 of $1.2 million reflects the net loss of $1.8 million and non-cash charges of $5.0 million for depreciation and amortization and $1.4 million for stock-based compensation. The net change in our operating assets and liabilities of $(3.4) million was primarily a result of a $0.8 million increase in inventory, a $2.9 million increase in accounts receivable and a $4.5 million decrease in deferred revenue which were partially offset by a $3.3 million increase in accounts payable and accrued expenses.
Net cash provided by operating activities during the year ended December 31, 2009 of $1.1 million reflects the net loss of $5.3 million and non-cash charges of $4.4 million for depreciation and amortization and $1.1 million for stock-based compensation. The net change in our operating assets and liabilities of $0.8 million was primarily the result of a $0.5 million decrease in deferred revenue which was partially offset by $1.6 million in our prepaid expenses and other assets, inventory and accounts receivable balances.
62
Net cash provided by operating activities during the year ended December 31, 2008 of $1.0 million reflects the net loss of $9.5 million and non-cash charges which consist of $3.4 million for depreciation and amortization and $0.9 million for stock-based compensation. The net change in our operating assets and liabilities of $6.1 million was primarily due to an advance royalty payment in the amount of $10.0 million that will be earned through 2012 that resulted in a net increase in deferred revenue of $9.5 million, which was partially offset by a $3.9 million increase in prepaid expenses and other assets, inventory and accounts receivable balances.
Cash Flows from Investing Activities
Our investing activities consist primarily of purchases and sales of short-term investments, capital expenditures to purchase property and equipment and our investments in intangible assets relating to our patents and trademarks. In the future, we expect we will continue to make significant capital expenditures to support our expanding operations and incur costs to protect our investment in our developed technology and IP.
During the six months ended June 30, 2011, cash used in investing activities was $7.3 million as a result of $6.2 million in capital expenditures, $0.8 million in the purchase of short-term investments and $0.3 million in capitalized patent and trademark costs.
During the year ended December 31, 2010, cash provided by investing activities of $0.9 million was primarily attributable to the $11.8 million in net proceeds received from the sale of our investments which were partially offset by $10.5 million of capital expenditures and $0.3 million in capitalized intangible asset costs. These capital expenditures were incurred as a result of us relocating our operations during the year ended December 31, 2010 to a new facility to support our expanding operations, as well as to prepare for new business programs requiring additional equipment.
During the year ended December 31, 2009, cash used in investing activities of $16.7 million was due to $11.8 million for the purchase of investments, $4.8 million in capital expenditures relating to the acquisition of lab equipment and machinery and $0.1 million in capitalized intangible asset costs.
During the year ended December 31, 2008, cash used in investing activities of $8.2 million was attributable to $7.6 million in capital expenditures and $0.5 million in capitalized intangible asset costs.
Cash Flows from Financing Activities
To date, we have financed our operations primarily with proceeds from the sale of our redeemable convertible preferred stock.
During the six months ended June 30, 2011, cash provided by financing activities was $25.1 million, primarily as a result of the receipt of $24.9 million in net proceeds from the sale of our Series E redeemable convertible preferred stock in March and June 2011.
During the year ended December 31, 2010, cash provided by financing activities was $0.1 million which consisted of proceeds received from the exercise of stock options.
During the year ended December 31, 2009, cash used in financing activities was $4.4 million, primarily as a result of us paying off our outstanding loan balances under our amended loan and security agreement.
During the year ended December 31, 2008, cash provided by financing activities was $21.3 million primarily due to the receipt of $19.9 million in net proceeds from the sale of our Series D redeemable convertible preferred stock combined with $3.0 million in proceeds from borrowings under our amended loan and security agreement in May 2008 which were partially offset by principal repayments on our debt obligations of $1.7 million.
63
Contractual Obligations
The following summarizes our contractual obligations as of December 31, 2010:
| |
Payments Due by Period | ||||||||||||||||||
|---|---|---|---|---|---|---|---|---|---|---|---|---|---|---|---|---|---|---|---|
| |
2011 | 2012 | 2013 | 2014 | 2015 | Total | |||||||||||||
| |
(in thousands) |
||||||||||||||||||
Contractual Obligations: |
|||||||||||||||||||
Operating lease obligations |
$ | 1,550 | $ | 1,573 | $ | 1,657 | $ | 1,707 | $ | 728 | $ | 7,215 | |||||||
Total |
$ | 1,550 | $ | 1,573 | $ | 1,657 | $ | 1,707 | $ | 728 | $ | 7,215 | |||||||
Operating lease agreements represent our obligations to make payments under our non-cancelable lease agreements for our facilities in San Jose, California. During the six months ended June 30, 2011, we made regular lease payments of $681,000 under the operating lease agreements.
Off-Balance Sheet Arrangements
Through June 30, 2011, we did not have any relationships with unconsolidated entities or financial partnerships, such as entities often referred to as structured finance or special purpose entities, which would have been established for the purpose of facilitating off-balance sheet arrangements or other contractually narrow or limited purposes.
Segment Information
We have one business activity, which is to develop and apply high productivity combinatorial R&D technologies. Although we track revenue earned from customers in the semiconductor and clean-energy industries, we do not currently track and maintain discrete financial information, including operating margins for these industry sectors. As such, we are a single reporting and operating unit structure.
Quantitative and Qualitative Disclosures about Market Risk
We are exposed to market risks in the ordinary course of our business. Market risk represents the risk of loss that may impact our financial position due to adverse changes in financial market prices and rates. Our market risk exposure is primarily a result of fluctuations in interest rates and foreign currency exchange rates. We do not hold or issue financial instruments for trading purposes.
Interest Rate Sensitivity
Our exposure to market risk for changes in interest rates relates primarily to our investment portfolio and our outstanding debt obligations. Our cash, cash equivalents and investment accounts as of June 30, 2011 total $35.6 million, consisting primarily of cash, money market funds and certificates of deposit with maturities of less than one year from the date of purchase. Our primary exposure to market risk is interest income sensitivity, which is affected by changes in the general level of the interest rates in the United States. However, because of the short-term nature of the instruments in our portfolio, a sudden change in market interest rates would not be expected to have a material impact on our consolidated financial condition or our results of operation.
We have no long-term debt outstanding as of June 30, 2011 under our amended loan and security agreement. Our obligations under this debt agreement carry interest rates that are fixed and are not subject to fluctuations. However, in the future, to the extent we enter into other long-term debt arrangements, we would be subject to fluctuations in interest rates which could have a material impact on our future financial condition and results of operation.
Foreign Currency Exchange Risk
As we expand internationally, our consolidated results of operations and cash flows will become increasingly subject to fluctuations due to changes in foreign currency exchange rates. Our revenue is
64
denominated in U.S. dollars. Our expenses are generally denominated in the currencies in which our operations are located, which is primarily in the United States, with an insignificant portion of expenses incurred in our wholly-owned subsidiaries in Hong Kong and Japan and our wholly-owned branch in Taiwan in their local currencies. The effect of a hypothetical 10% change in foreign currency exchanges rates applicable to our business would not have a material impact on our consolidated financial statements. To date, we have not entered into any material foreign currency hedging contracts although we may do so in the future.
Critical Accounting Policies and Estimates
Our consolidated financial statements have been prepared in conformity with generally accepted accounting principles in the United States and include our accounts and the accounts of our wholly-owned subsidiaries. The preparation of our consolidated financial statements requires our management to make estimates, assumptions and judgments that affect the reported amounts of assets and liabilities and disclosures for contingent assets and liabilities as of the date of the financial statements, and the reported amounts of revenue and expenses during the applicable periods. Management bases its estimates, assumptions and judgments on historical experience and on various other factors that are believed to be reasonable under the circumstances. Different assumptions and judgments would change the estimates used in the preparation of our consolidated financial statements which, in turn, could change the results from those reported. Our management evaluates its estimates, assumptions and judgments on an ongoing basis.
The critical accounting policies requiring estimates, assumptions and judgments that we believe have the most significant impact on our consolidated financial statements are described below.
Revenue Recognition
We generate revenue from three principal sources: CDPs and other services, which also includes other R&D services and product maintenance and support; product sales; and technology licensing and royalty fees. It is possible for our customers to work with us across multiple areas of our business, and certain of our customer arrangements involve the delivery or performance of multiple products, services or licenses. For example, product sale arrangements include product maintenance and support, and CDPs and other R&D services include licensing of technology and may also include sales of products. When there are multiple elements of deliverables in a contract entered into or modified on or prior to December 31, 2010, we identify all deliverables and allocate revenue among all of the undelivered elements, which might include CDP and other services revenue, product revenue and licensing and royalty revenue, based on objective and reliable evidence of fair value for any such element. In the event that vendor-specific objective evidence does not exist, revenue will be recognized over the term of the agreement and will be allocated among the deliverables based on the relative stated invoice price for the elements. In an arrangement that includes software that is more than incidental to the products or services as a whole, we recognize revenue from the software and software-related elements, as well as any non-software deliverable(s) for which a software deliverable is essential to its functionality, in accordance with the authoritative guidance on software revenue recognition.
CDP and services revenue. We enter into CDPs with customers under which we conduct R&D activities jointly with the customer. These agreements specify minimum levels of research effort required to be performed by us. Payments received under the agreements are not refundable if the research effort is not successful. Historically, we have not provided any refunds under these arrangements.
We retain rights to certain elements of technology developed during the course of performance, which the customer has an option to license in the future under the terms defined in the agreement. We typically recognize revenue from these arrangements on a time and materials basis. Most arrangements with customers have fixed monthly fees and requirements to provide regular reporting of
65
R&D activities performed. Payments received prior to performance are deferred and recognized as revenue when earned over future performance periods.
Product maintenance and support services revenue is included in CDP and services revenue. These services entitle customers to receive product updates and enhancements or technical support and maintenance, depending on the offering. The related revenue is recognized ratably over the period the services are delivered. We do not have vendor-specific objective evidence of selling price for our product maintenance and support services.
Product revenue. We recognize revenue from the sale of products generally on a straight line basis over the maintenance period once delivery has occurred (title and risk of loss have passed to the customer), and customer acceptance, if required, has been achieved. We have determined that the software included with its equipment products is more than incidental to the product as a whole. We do not have vendor-specific objective evidence of selling price for our products.
Licensing and royalty revenue. We recognize revenue for licenses to IP when earned pursuant to the terms of the agreements. Time-based license revenue is recognized ratably over the license term. License and royalty revenue that becomes triggered by specific customer actions, such as exercise of a license option or by sales volume, is recognized when they occur based on royalty reports or other information received from the licensee, generally one quarter in arrears. Minimum and prepaid royalties and license fees are recognized ratably over the related periods.
In October 2009, the Financial Accounting Standards Board (FASB) issued a new accounting standard which excludes from the scope of software revenue guidance the revenue arrangements which include tangible products that contain software components and non-software components that function together to deliver the tangible product's essential functionality. At the same time, the FASB also issued another accounting standard which changes the requirements for establishing separate units of accounting in a multiple-element arrangement and requires the allocation of arrangement consideration to each deliverable to be based on its relative selling price. The new standards are effective prospectively for revenue arrangements entered into or materially modified in fiscal years beginning on or after June 15, 2010. We adopted the new standards commencing on January 1, 2011 and therefore will apply such standards against all arrangements entered into or modified on or after January 1, 2011. The adoption did not have an impact on our consolidated financial condition, operating revenue, results of operations or cash flows for the six month period ended June 30, 2011 as there were no multiple-element arrangements that originated during the period. The adoption of this standard may impact future revenue recognition for multiple-element arrangements where product maintenance and support and time-based licenses are the only undelivered elements. The impact of adopting these provisions will result in more product revenue recognized in earlier periods than would otherwise have been the case prior to adoption, as we allocate revenue using the relative selling price method as opposed to recognizing all revenue from the arrangement ratably over the longer of the product maintenance and support term or license period.
Stock-Based Compensation
We recognize compensation costs related to stock options and shares of restricted stock granted to employees based on the estimated fair value of the awards on the date of grant, net of estimated forfeitures. We estimate the grant date fair value, and the resulting stock-based compensation expense, using the Black-Scholes option-pricing model. The grant date fair value of the stock-based awards is generally recognized on a straight-line basis over the requisite service period, which is generally the vesting period of the respective awards.
66
The fair value of the awards granted during the six months ended June 30, 2011 and 2010 and the years ended December 31, 2010, 2009 and 2008 was calculated using the Black-Scholes option valuation model with the following weighted-average assumptions:
| |
Years Ended December 31, |
Six Months Ended June 30, |
||||||||||||||
|---|---|---|---|---|---|---|---|---|---|---|---|---|---|---|---|---|
| |
2008 | 2009 | 2010 | 2010 | 2011 | |||||||||||
| |
|
|
|
(unaudited) |
||||||||||||
Expected term (in years) |
6.0 | 6.0 | 6.0 | 6.0 | 6.0 | |||||||||||
Risk-free interest rate |
3.3 | % | 2.5 | % | 2.2 | % | 2.7 | % | 2.4 | % | ||||||
Expected volatility |
55 | % | 55 | % | 55 | % | 55 | % | 57 | % | ||||||
Expected dividend rate |
0 | % | 0 | % | 0 | % | 0 | % | 0 | % | ||||||
The Black-Scholes model requires the use of highly subjective and complex assumptions which determine the fair value of share-based awards, including the expected term and the price volatility of the underlying stock. These assumptions include:
Expected Term. The expected term represents the period that the stock-based awards are expected to be outstanding. For option grants that are considered to be "plain vanilla," we used the simplified method to determine the expected term as provided by the SEC. The simplified method calculates the expected term as the average of the time-to-vesting and the contractual life of the options.
Expected Volatility. The expected volatility is derived from historical volatilities of several unrelated, publicly listed peer companies over a period approximately equal to the expected term of the award because we have limited information on the volatility of our common stock since we have no trading history. When making the selections of our industry peer companies to be used in the volatility calculation, we considered the size, operational and economic similarities to our principal business operations.
Expected Dividend Rate. The expected dividend rate was assumed to be zero as we have never paid dividends and have no current plans to do so.
Risk-Free Interest Rate. The risk-free interest rate is based on the U.S. Treasury yield in effect at the time of grant for zero coupon U.S. Treasury notes with maturities approximately equal to the expected term of the awards.
In addition to the assumptions used in the Black-Scholes option-pricing model, we must also estimate a forfeiture rate to calculate the stock-based compensation for our awards. Our forfeiture rate is based on an analysis of our actual forfeitures. We will continue to evaluate the appropriateness of the forfeiture rate based on actual forfeiture experience, analysis of employee turnover and other factors. Quarterly changes in the estimated forfeiture rate can have a significant impact on our stock-based compensation expense as the cumulative effect of adjusting the rate is recognized in the period the forfeiture estimate is changed. If a revised forfeiture rate is higher than the previously estimated forfeiture rate, an adjustment is made that will result in a decrease to the stock-based compensation expense recognized in the financial statements. If a revised forfeiture rate is lower than the previously estimated forfeiture rate, an adjustment is made that will result in an increase to the stock-based compensation expense recognized in the financial statements.
We will continue to use judgment in evaluating the expected volatility, expected terms and forfeiture rates utilized for our stock-based compensation calculations on a prospective basis. As we continue to accumulate additional data related to our common stock and stock option exercises, we may have refinements to the estimates of our expected volatility, expected terms and forfeiture rates, which could materially impact our future stock-based compensation expense.
67
We are also required to estimate the fair value of the common stock underlying our stock-based awards when performing the fair value calculations with the Black-Scholes option-pricing model. The fair value of the common stock underlying our stock-based awards was estimated on each grant date by our board of directors, with input from management. Our board of directors is comprised of a majority of non-employee directors with significant experience in the semiconductor industry. We believe that our board of directors has the relevant experience and expertise to determine a fair value of our common stock on each respective grant date. Given the absence of a public trading market of our common stock, and in accordance with the American Institute of Certified Public Accountants Practice Guide, Valuation of Privately-Held-Company Equity Securities Issued as Compensation, our board of directors exercised reasonable judgment and considered numerous objective and subjective factors to determine the best estimate of the fair value of our common stock including:
- •
- contemporaneous valuations performed by unrelated third party specialists;
- •
- prices for our convertible preferred stock sold to outside investors in arm's-length transactions;
- •
- the rights, preferences and privileges of our convertible preferred stock relative to those of our common stock;
- •
- actual operating and financial performance;
- •
- the likelihood of achieving a liquidity event, such as an initial public offering or a sale of our company given
prevailing market conditions and the nature and history of our business;
- •
- illiquidity of stock-based awards involving securities in a private company;
- •
- industry information such as market size and growth; and
- •
- macroeconomic conditions.
In valuing our common stock, the board of directors considered contemporaneous valuations, which determined the equity value of our business by taking a weighted combination of the value indications under two valuation approaches, an income approach and a market approach. The income approach estimates the present value of future estimated cash flows, based upon forecasted revenue and costs. These future cash flows are discounted to their present values using a discount rate which is derived from an analysis of the cost of capital of comparable publicly traded companies in the same industry or similar lines of business as of each valuation date and is adjusted to reflect the risks inherent in the projected cash flows. The market approach estimates the fair value of a company by applying market multiples of comparable publicly traded companies in the same industry or similar lines of business which are based on key metrics implied by the enterprise values or acquisition values of the comparable publicly traded companies.
The results of the income approach and the market approach were then weighted evenly to determine the fair value of our business. This fair value was then allocated to each of our classes of stock using the Probability Weighted Expected Return Method (PWERM).
The PWERM involves a forward-looking analysis of the possible future outcomes of the business. This method is particularly useful when discrete future outcomes can be predicted at a high confidence level with a probability distribution. Discrete future outcomes considered under the PWERM included non-initial public offering (IPO) market-based outcomes as well as IPO scenarios. In the non-IPO scenarios, a large portion of the equity value is allocated to the convertible preferred stock to incorporate higher aggregate liquidation preferences. In the IPO scenarios, the equity value is allocated pro rata among the shares of common stock and each series of convertible preferred stock, which causes the common stock to have a higher relative value per share than under the non-IPO scenario. The fair value of the enterprise determined using the IPO and non-IPO scenarios will be weighted according to the board of directors' estimate of the probability of each scenario. The Black-Scholes option-pricing model incorporates various subjective assumptions, including expected volatility, expected term, and the risk-free interest rates, as well as the fair value of the common stock on the grant date as
68
determined by management. These input factors are subjective and are determined using management's judgment. If a difference arises between the assumptions used in determining stock-based compensation expense and the actual factors that become known over time, we may change the input factors used in determining future stock-based compensation expense. Any such changes could materially impact our results of operations in the period in which the changes are made and in periods thereafter.
Information regarding stock option grants to our employees since January 1, 2010 is summarized as follows:
Grant Date
|
Number of Options Granted |
Exercise Price | Fair Value Per Share of Common Stock |
Intrinsic Value Per Share |
|||||||||
|---|---|---|---|---|---|---|---|---|---|---|---|---|---|
February 4, 2010 |
1,986,250 | $ | 1.33 | $ | 1.33 | — | |||||||
March 2, 2010 |
52,000 | 1.33 | 1.33 | — | |||||||||
May 4, 2010 |
67,500 | 1.33 | 1.33 | — | |||||||||
June 25, 2010 |
43,500 | 1.33 | 1.33 | — | |||||||||
August 19, 2010 |
594,000 | 1.33 | 1.33 | — | |||||||||
December 14, 2010 |
416,500 | 1.70 | 1.70 | — | |||||||||
March 31, 2011 |
1,236,500 | 3.10 | 3.10 | — | |||||||||
April 27, 2011 |
261,000 | 3.10 | 3.10 | — | |||||||||
May 20, 2011 |
282,000 | 3.10 | 3.10 | — | |||||||||
June 6, 2011 |
662,500 | 3.10 | 3.36 | * | $ | 0.26 | |||||||
June 24, 2011 |
58,000 | 3.10 | 4.15 | * | 1.05 | ||||||||
- *
- We reassessed the fair value of our common stock subsequent to the grant date of these options. The intrinsic value per share represents the difference between the exercise price, which was the original fair value determination made by our board on the date of option grant, and the assessed fair value applied retrospectively for accounting purposes.
Other than as discussed in the section entitled "Grants Made on June 6, 2011 and June 24, 2011," no single event caused the valuation of our common stock to increase or decrease through June 30, 2011. Instead, a combination of the factors described below in each period led to the changes in the fair value of the underlying common stock.
Grants Made between February 4, 2010 and August 19, 2010
On February 4, 2010, the board determined the fair value of the common stock to be between $1.30 and $1.35 per share based on a number of factors, including its review of a contemporaneous valuation analysis conducted as of December 31, 2009. This contemporaneous valuation was prepared on a minority, non-marketable interest basis assuming we were in the Expansion stage of our development. The contemporaneous valuation weighted the income approach and market approach equally to determine the fair value of our business.
The weightings assigned to each scenario in the PWERM analysis contained in the contemporaneous valuation analysis as of December 31, 2009 were as follows:
IPO |
25.0 - 30.0% | |
Strategic Merger or Sale |
25.0 - 30.0% | |
Remain Private Company |
45.0 - 37.5% | |
Liquidation |
5.0 - 2.5% |
The IPO, Sale and Remaining Private scenarios were discounted to present value using a discount rate of 30% and a holding period between two and four years. The liquidation scenario assumes the business was dissolved and, therefore, no value was assigned to this scenario.
69
During the period between the February 2010 and August 2010 valuations, we granted 1,986,250 options on February 4, 2010, 52,000 options on March 2, 2010, 67,500 options on May 4, 2010, 43,500 options on June 25, 2010 and 594,000 options on August 19, 2010. All of the options granted during this period were assigned an exercise price of $1.33 per share, which the board determined to be the fair value based on many factors, including its review of the contemporaneous valuation conducted as of December 31, 2009, which valued the common stock at a range of fair values of $1.30 to $1.35 per share, and based on its determination that there were no events in the period between the date of each of the option grants and the date of the contemporaneous valuation that would result in a change to the fair value of the underlying common stock.
Grants Made on December 14, 2010
On December 14, 2010, the board determined a fair value of the common stock to be between $1.65 and $1.75 per share based on a number of factors, including its review of a contemporaneous valuation analysis conducted as of October 31, 2010. This contemporaneous valuation was prepared on a minority, non-marketable interest basis assuming we were in the Expansion stage of our development. The contemporaneous valuation weighted the income approach and market approach equally to determine the fair value of our business.
The weightings assigned to each scenario in the PWERM analysis contained in the contemporaneous valuation analysis as of October 31, 2010 were as follows:
IPO |
30.0 - 35.0% | |
Strategic Merger or Sale |
30.0 - 35.0% | |
Remain Private Company |
35.0 - 27.5% | |
Liquidation |
5.0 - 2.5% |
The IPO, Sale and Remaining Private scenarios were discounted to present value using a discount rate of 28% and a holding period between two and three years. The liquidation scenario assumes the business was dissolved and, therefore, no value was assigned to this scenario.
We granted 416,500 options on December 14, 2010 with an exercise price of $1.70, which the board determined to be the fair value based on many factors, including its review of the contemporaneous valuation conducted as of October 31, 2010, which valued the common stock at a range of fair values of $1.65 to $1.75 per share, and based on its determination that there were no events in the period between the date of the option grant and the date of the contemporaneous valuation that would result in a change to the fair value of the underlying common stock.
No single event caused the valuation of the common stock to increase from August 2010 to December 2010; rather it was a combination of factors. This increase in value reflects a number of milestones attained between valuation dates related to new CDPs entered into during the period or the extension of existing CDPs. The increase is also consistent with the stock price movement associated with the guideline companies as well as various market indices from December 31, 2009 to October 31, 2010.
Grants Made between March 31, 2011 and May 20, 2011
On March 31, 2011, the board determined a fair value of the common stock to be between $3.00 and $3.20 per share based on a number of factors, including its review of a contemporaneous valuation analysis conducted as of March 4, 2011. This contemporaneous valuation was prepared on a minority, non-marketable interest basis assuming we were in the Expansion stage of our development. The contemporaneous valuation weighted the income approach and market approach equally to determine the fair value of our business.
70
The weightings assigned to each scenario in the PWERM analysis contained in the contemporaneous valuation as of March 4, 2011 were as follows:
IPO |
50.0 - 55.0% | |
Strategic Merger or Sale |
25.0 - 30.0% | |
Remain Private Company |
22.5 - 15.0% | |
Liquidation |
2.5 - 0.0% |
The IPO, Sale and Remaining Private scenarios were discounted to present value using a discount rate of 40% and an 18-month holding period. The liquidation scenario assumes the business was dissolved and, therefore, no value was assigned to this scenario. The discount rate is derived from an analysis of the cost of capital of comparable publicly-traded companies in the same industry or similar lines of business and is adjusted to reflect the risks inherent in the projected cash flows. The increase in the discount rate from the October 2010 valuation to the March 2011 valuation reflects the increased risk of achieving our updated projected financial results which, in the March 2011 valuation, assumed a much greater success rate for certain developed technology to move into customer manufacturing on existing and prospective projects, thereby, increasing the projected financial results and the related risk of achieving the higher results. Accordingly, the discount rate was increased to reflect these increased risks.
We granted 1,779,500 options between March 31, 2011 and May 20, 2011 with an exercise price of $3.10 per share, which the board determined to be the fair value based on many factors, including its review of the contemporaneous valuation conducted as of March 4, 2011, which valued the common stock at a range of fair values of $3.00 to $3.20 per share, and based on its determination that there were no events in the period between the date of the contemporaneous valuation and May 20, 2011 that would result in a change to the fair value of the underlying common stock on each grant date.
Similar to the change in fair value between the August 2010 and December 2010 valuations, no single event caused the valuation of the common stock to increase for this period; rather it was a combination of factors. This increase in value reflects the much higher growth and profit potential of our business. In addition, our board substantially increased the probability of an IPO exit from 30-35% to 50-55%, which assumes a conversion of the preferred stock and minimizes the value of the preferred stock liquidation preferences, and thus, increases the common stock value and its relative value to the preferred stock. The IPO probability was increased given higher revenue forecast and greater visibility of future earnings. As of the date of this valuation, and continuing through May 20, 2011, we had not yet had any formal meetings with potential underwriters about an IPO but were beginning to have preliminary and other informal discussions on the matter.
The value increase also reflects the newly extended CDPs, the raising of the Series E preferred stock financing in March 2011 in which we raised $15.0 million through the sale of 3,610,873 preferred shares for $4.15 per share, as well as our boards' optimism with respect to the royalty element with each customer engagement. As a result, our board increased its projected net cash flows, revenue and operating profits during the later years of our projections. In addition, the revenue multiples used in the market approach were increased from 3.5x to 4.0x. The increase in value is also consistent with the stock price movement associated with the guideline companies as well as various market indices from October 31, 2010 to March 4, 2011.
Grants Made on June 6, 2011 and June 24, 2011
On June 6, 2011 and June 24, 2011, we granted 662,500 and 58,000 options, respectively, with an exercise price of $3.10 per share. All options granted by our board were intended to be exercisable at the fair value of our stock at the time of grant, based on information known at that time.
On August 25, 2011, our board determined a fair value of our common stock to be between $5.90 and $6.05 per share based on a number of factors, including its review of a contemporaneous valuation
71
analysis conducted as of August 5, 2011. This contemporaneous valuation was prepared on a minority, non-marketable interest basis assuming we were in the Expansion stage of our development. The contemporaneous valuation weighted the income approach and market approach equally to determine the fair value of our business.
The weightings assigned to each scenario in the PWERM analysis contained in the contemporaneous valuation as of August 5, 2011 were as follows:
IPO |
70.0 - 75.0% | |
Strategic Merger or Sale |
10.0 - 15.0% | |
Remain Private Company |
20.0 - 10.0% | |
Liquidation |
0.0 - 0.0% |
The IPO, Sale and Remaining Private scenarios were discounted to present value using a discount rate of 18% and a 9-month holding period. The liquidation scenario assumes the business was dissolved and, therefore, no value was assigned to this scenario. The increase in probability weighting for an IPO is related to the filing of our registration statement on July 29, 2011, increasing the likelihood of the IPO outcome and increasing the corresponding value of a Strategic Merger or Sale as the value ascribed to a Strategic Merger or Sale scenario assumes a premium over the estimated IPO value. The discount rate is derived from an analysis of the cost of capital of comparable publicly-traded companies in the same industry or similar lines of business and is adjusted to reflect the risks inherent in the projected cash flows. The decrease in the discount rate from the March 2011 valuation is related to a reduction in the risk of our achieving our estimated future cash flows primarily as a result of our entering a multi-year CDP with a key strategic customer on June 1, 2011. This effectiveness of a multi-year CDP on June 1, 2011 increased backlog as of June 30, 2011 by approximately 90%.
For the purposes of recording stock-based compensation expense as part of our quarter-end close process, we reassessed the fair value of our common stock. We considered the results and underlying assumptions included in the valuation of the common stock as determined by our board on August 25, 2011 that have been summarized above. This assessment led us to conclude that the fair value of our common stock for financial reporting purposes increased on a straight-line basis from May 31, 2011 through the effective date of the valuation. The May 31, 2011 date, which was the last date preceding the effectiveness of a multi-year CDP agreement, was selected as this was the first initial material event that occurred since the prior valuation date. Following May 31, 2011, additional events leading to an increased likelihood of an IPO outcome occurred that were considered in the August 5, 2011 contemporaneous valuation. As a result, we reassessed the fair value of our common stock as of June 6, 2011 and June 24, 2011 as $3.36 and $4.15, respectively.
Our board substantially increased the probability of an IPO exit from 50-55% to 70-75%, which assumes a conversion of the preferred stock and minimizes the value of the preferred stock liquidation preferences, and thus, increases the common stock value and its relative value to the preferred stock. The IPO probability was increased given our IPO organizational meeting that was held on June 20, 2011 and the filing of our registration statement that occurred on July 29, 2011.
The value increase reflects the newly signed CDP with a strategic customer and the second closing of our Series E preferred stock financing in June 2011 in which we raised $10.0 million through the sale of 2,407,249 preferred shares for $4.15 per share.
As of June 30, 2011 we had $5.1 million of unrecognized stock-based compensation expense, net of estimated forfeitures, that is expected to be recognized over a weighted average period of 3.2 years. In future periods, our stock-based compensation expense is expected to increase as a result of our existing unrecognized stock-based compensation to be recognized as these awards vest and as we issue additional stock-based awards to attract and retain employees.
The intrinsic value of all outstanding options as of June 30, 2011 was $54.4 million based on the estimated fair value for our common stock of $4.41 per share.
72
Determining the fair value of our common stock requires making complex and subjective judgments. Our approach to valuation is based on a discounted future cash flow approach that uses our estimates of revenue, driven by assumed market growth rates and estimated costs, as well as appropriate discount rates. These estimates are consistent with the plans and estimates that we use to manage the business. There is inherent uncertainty in making these estimates.
Although it is reasonable to expect that the completion of the IPO will add value to the shares because they will have increased liquidity and marketability, the amount of additional value cannot be measured with precision or certainty.
Recent Accounting Pronouncements
In January 2010, the FASB issued an amendment to an accounting standard which requires new disclosures for fair value measurements and provides clarification for existing fair value disclosure requirements. The amendment will require an entity to disclose separately the amounts of significant transfers in and out of Levels I and II fair value measurements and to describe the reasons for the transfers; and to disclose information about purchases, sales, issuances and settlements separately in the reconciliation for fair value measurements using significant unobservable inputs, or Level III inputs. This amendment clarifies existing disclosure requirements for the level of disaggregation used for classes of assets and liabilities measured at fair value and requires disclosures about the valuation techniques and inputs used to measure fair value for both recurring and nonrecurring fair value measurements using Level II and Level III inputs. This guidance is effective for interim and annual reporting periods beginning after December 15, 2009, except for certain Level III activity disclosure requirements that will be effective for reporting periods beginning after December 15, 2010. Accordingly, we have adopted this amendment as of January 1, 2010, except for the additional Level III requirements which we will adopt during the year ending December 31, 2011.
73
Overview
We have pioneered a proprietary approach to accelerate research and development, innovation and time-to-market for the semiconductor and clean-energy industries. Through paid collaborative development programs (CDPs) with our customers, we develop proprietary technology and intellectual property (IP) for our customers focused on advanced materials, processes, integration and device architectures. This technology enables our customers to bring optimized, high-volume manufacturing-ready integrated devices to market faster and with less risk than traditional approaches to research and development (R&D). We provide our customers with proprietary technology through various fee arrangements and grant them rights to associated IP, primarily through royalty-bearing licenses. Our proprietary approach is broadly applicable to high-volume integrated device markets, which include the markets for semiconductors, flat glass, solar cells, light-emitting diodes (LEDs), flat-panel displays, advanced batteries and other energy-efficient technologies.
Our approach consists of our proprietary high productivity combinatorial (HPC) platform, coupled with our multi-disciplinary team. Our HPC platform consists of our Tempus HPC processing tools, automated characterization and informatics and analysis software. Our platform is purpose-built for R&D using combinatorial process systems. Combinatorial processing is a methodology for discovery and development that employs parallel and other high-throughput experimentation, which allows R&D experimentation to be performed at speeds up to 100 times faster than traditional methods. Our processing tools allow us to perform up to 192 experiments on a single substrate as compared to traditional methods, which typically allow only a single experiment at a time. Our automated characterization systems and proprietary informatics and analytics match the high throughput of our processing tools. Our multi-disciplinary team of approximately 135 scientists and engineers, of whom approximately 55 have Ph.D.s, designs customized workflows for our customers' specific applications using the HPC platform and applies the workflows in collaboration with our customers. The combination of the HPC platform and our team generates significant competitive advantages for our customers. By accelerating innovation and enabling our customers to commercialize higher-performance and lower-cost integrated devices faster than through traditional methods of R&D, we provide them an opportunity to gain market share and generate higher margins, often through a first-mover advantage.
Our business model aligns our interests with those of our customers as we collaborate to develop differentiated proprietary technology and IP for high-volume integrated devices through collaborative development programs. Customers pay us development services fees during multi-year CDPs, which typically last for two years and may range from one to three years. Our customers receive rights to the technology and IP developed during the CDPs, and once our customers commercialize products using this technology and IP, they pay us primarily through royalties. In certain cases, we sell HPC processing tools to our customers who pay a recurring license to operate those tools with our combinatorial processing capabilities. By aligning our interests with those of our customers, we facilitate collaboration and open communication that is more likely to result in innovative, differentiated products and future CDPs with those customers.
We currently target large, high-volume semiconductor and high-growth emerging clean-energy markets, including DRAM, flash memory, complex logic, flat glass, solar cells, LEDs and other energy-efficient technologies. According to IHS iSuppli, the semiconductor market had $304 billion in sales in 2010 and is expected to grow at a compound annual growth rate (CAGR) of 5.7% from 2010 to 2015. Based on data from Freedonia Group, GlobalData, IHS iSuppli and MarketsandMarkets, the clean-energy markets had $166 billion in sales in 2010 and are collectively expected to grow at a CAGR of 10.8% from 2010 to 2015. Within these broad markets, we target customers that have track records of technological innovation, deploy significant resources and are pursuing technical advancements that are critical to their success and strategy. We have engaged in paid programs with 18 customers. Our largest
74
customers are ATMI, Elpida Memory, GLOBALFOUNDRIES, Guardian Industries, SanDisk, Taiwan Semiconductor Manufacturing Company (TSMC) and Toshiba, which collectively recorded $46 billion in revenue in 2010 associated with the semiconductor and clean-energy markets. ATMI and Elpida have commenced shipping products incorporating technology developed through our CDPs and pay us licensing and royalty fees. To date, we have received the majority of our revenue from customers in DRAM, flash memory, complex logic and energy-efficient applications in flat glass, and have not yet received a material amount of revenue from customers in solar cells, LEDs and other energy-efficient technologies.
We were founded in 2004 and are headquartered in San Jose, California. Our total revenue increased to $42.7 million for the year ended December 31, 2010 from $26.9 million for the year ended December 31, 2009. Our total revenue increased to $23.8 million for the six months ended June 30, 2011 from $16.5 million for the six months ended June 30, 2010. Our backlog as of June 30, 2011 was $108.8 million, of which $28.3 million is scheduled to be recognized as revenue during the remainder of the year ending December 31, 2011. Our adjusted EBITDA for the six months ended June 30, 2011 was $2.0 million, and our adjusted EBITDA for the year ended December 31, 2010 was $4.6 million. Our net loss decreased to $1.8 million for the year ended December 31, 2010 from $5.3 million for the year ended December 31, 2009. Our net loss decreased to $3.2 million for the six months ended June 30, 2011 from $3.3 million for the six months ended June 30, 2010. Since inception, we have incurred net losses leading to an accumulated deficit of $73.2 million as of June 30, 2011.
Industry Background
High-volume integrated devices serve large and growing markets, including the markets for semiconductors, flat glass, solar cells, LEDs, flat-panel displays, advanced batteries and other energy-efficient technologies. Success in these markets requires rapid and cost-effective product innovation, fast time-to-market, competitive pricing, production scalability and the ability to achieve specific requirements. These devices are typically manufactured using thin-film deposition of advanced materials through customized processes that create a specific device architecture. It is increasingly necessary to evaluate elements in the periodic table that have previously not been used in high-volume manufacturing to deliver performance and cost improvements, and to develop advanced device structures capable of addressing particular application requirements. These device structures must then be scaled and integrated into cost-effective manufacturing processes to serve high-volume integrated device markets. Traditional R&D approaches are increasingly challenged by the market need to accelerate innovation and time-to-market for the semiconductor and clean-energy industries.
Semiconductor Industry
Since the inception of the semiconductor industry more than 50 years ago, innovation has been continually driven by consumer demands for smaller, higher-performance, more power-efficient and less expensive electronic products. Recently, this innovation has been driven by broad end-market demand for smartphones, PCs, tablet computers, cloud computing, high-definition media, and advanced aerospace and industrial applications. The semiconductor industry is characterized by intense competition, with many semiconductor companies seeking to gain market advantage over competitors by expanding their broad product portfolios, using their deep design and/or process capabilities and leveraging their IP libraries. Increasingly, these companies are relying on combinations of advanced materials, processes, integration and device architectures to compete and differentiate their products.
Historically, the pace of semiconductor innovation has been enabled by device scaling, in which, according to Moore's Law, the number of transistors in a design generally doubles every two years. This increasing density has reduced costs and improved capabilities over time, thereby driving market demand and growth. However, semiconductors are approaching the limitations of device scaling with the current set of materials and manufacturing processes. Consequently, semiconductor manufacturers
75
are turning to advanced materials, processes, integration and new device architectures to enable continued device scaling and to deliver improved product performance and cost competitiveness. The reliance on advanced materials, processes, integration and new device architectures has in turn made advancements in semiconductor technology increasingly complex and expensive. Each new process node requires experimentation with more elements in the periodic table and more material combinations to deliver the desired physical and electrical characteristics for device performance and manufacturability. For example, the broad adoption of copper interconnects enabled the industry to continue device scaling in the microprocessor field, but as this advancement required changes not only in materials, but also in processes, integration and device architectures to achieve high-volume, cost-effective manufacturing, the transition was challenging and slow.
Semiconductor manufacturing companies have used device scaling to shrink transistors and develop new process technology nodes to address customer requirements for lower cost and higher performance ICs. However, advanced R&D and new fabrication facility costs have increased significantly over time, especially as the use of advanced materials and processes have become increasingly important to the development and introduction of the latest generation process technology nodes. According to data compiled by a leading manufacturer in the semiconductor industry and presented at a 2009 industry conference, the industry average for logic process R&D has reached between $600 million and $900 million for nodes between 45nm and 32nm. This represents more than an 80% increase from 65nm and older nodes, and expectations are for process R&D to reach $1.3 billion for 22nm and 12nm nodes, an additional 70% increase in process R&D costs. In addition, according to IC Knowledge, costs of semiconductor fabrication facilities have increased from approximately $50 million in 1975 to the approximately $3.5 billion required to open a new 32nm facility currently, with the expectation that costs for a leading edge facility will reach $8 billion by 2015. The greater expertise and higher costs required to explore advanced materials, processes, integration and new device architectures have led to increased specialization among materials, capital equipment, semiconductor manufacturing and IC design companies. However, this specialization has left gaps in the industry knowledge base with respect to the complexities of the interaction between materials science, process technology, device integration and the scale-up to high-volume IC production.
To succeed in the market and deliver an appropriate financial return, semiconductor companies are under intense pressure to rapidly develop optimized ICs and efficiently scale them to cost-effective production. Using advanced semiconductor materials, processes, integration and new device architectures requires intensive, time-consuming experimentation because advanced materials are not well understood and accurate, robust models do not exist. As a result, semiconductor companies must increasingly rely on time and resource-intensive, empirical R&D to develop innovative solutions and enable manufacturability at lower costs.
Clean-Energy Industry
The emerging clean-energy markets also depend on improvements in advanced materials, processes, integration and new device architectures. Clean-energy markets, which include the markets for flat glass, solar, LEDs, advanced batteries and other energy-efficient technologies, remain in early stages of technological evolution. Companies in the fast-evolving clean-energy markets are in the early stages of understanding materials, processes, integration, device architectures and manufacturing methodologies. As a result, those companies that successfully develop relevant, scalable proprietary materials and device technologies will likely have a competitive advantage over their peers in both time-to-market and price.
Decreasing prices, government policies and social awareness are driving growth in the clean-energy markets and certain sectors have entered high-volume production. Reduced prices and improved performance relative to traditional alternatives generally catalyze widespread adoption of new technologies. For example, LEDs are currently more expensive to purchase than incandescent and
76
fluorescent lighting. To increase penetration of the general lighting market, price reductions and improvements in performance, such as brightness, color, form factor and features like dimming, will be critical. New advanced materials, improved process technologies and new device architectures will enable larger wafer sizes, higher-volume production and improved yields for lower-cost and higher-performing LEDs.
Because of the early stages of technology development in the clean-energy markets, there are significant opportunities for cost savings and potential competitive advantage. Market participants who resolve the price-performance challenges ahead of their competitors through advanced materials, processes, integration and new device architectures may greatly accelerate market adoption and establish themselves as market leaders. These opportunities amplify the importance of empirical R&D to develop low-cost, high-performance solutions in these early-stage markets.
Current Challenges with Innovation in High-Volume Integrated Device Markets
Advanced materials and device integration are driving forces behind technology advancement in the high-volume integrated device markets. In addition, innovation in these markets and control of the resulting IP are critical to enable competitive differentiation. However, the existing approach used to explore new materials, processes, integration and device architectures is complex, time-consuming and requires empirical R&D. For example, Intel, an industry leader, has stated at technology conferences that while the Tri-Gate advanced transistor technology was invented in 2002, it was not optimized for high-volume manufacturing until 2011.
Traditionally, device manufacturers have conducted R&D using expensive high-volume manufacturing tools that are not specifically built for that purpose. Production tools typically can only run one process at a time, which leads to limited cycles of learning. Furthermore, using tools deployed in a production environment for R&D requires reserving tool time on high-volume manufacturing lines to evaluate each experiment, resulting in substantial opportunity costs for existing product manufacturing. High-volume manufacturing environments are also not conducive to R&D because these environments require stability to minimize risk and to reduce contamination that the research-based introduction of new materials, tools or processes may cause. Additionally, high-volume manufacturing is conducted by operators focused on repetitive, mistake-free processing, not on many cycles of trial and error. In addition to some of the challenges above, certain clean-energy device manufacturers use laboratory-scale tools for R&D, which do not address the scale-up requirements critical to high-volume manufacturing. These factors combine to increase development risks due to long learning cycles, limited data sets, narrow exploration capabilities and slow time-to-market.
Successful R&D programs require flexibility around experimentation and the introduction of new materials, chemicals, processes and tools to derive the most efficient high-volume integrated device solutions. Furthermore, we believe they are best administered by scientists and engineers with experience across various disciplines of equipment, materials, device architectures and processes to conduct successful experiments and derive optimized solutions.
The following existing approaches have been used to complement internal R&D, but each has specific limitations:
- •
- Equipment suppliers. Equipment suppliers provide solutions that are not
tailored to specific customer applications. Additionally, they provide high-volume manufacturing solutions that are not purpose-built for researching the interaction of advanced materials,
processes, integration and device architectures.
- •
- Industry consortia. Industry consortia provide solutions that offer no competitive differentiation because the customer must share the IP with all consortium participants, including competitors.
77
- •
- Alliance partnerships. Alliance partnerships impose limitations on the
overall outcome, as they are typically structured to find generic solutions rather than the solutions for a particular application. Additionally, these generic solutions are offered to a small set of
competitors and are not customer-specific or application-specific.
- •
- University research. University research provides theoretical solutions
requiring additional work and time to commercialize, since this work typically does not address manufacturing or commercialization challenges.
- •
- Third-party IP licensing. Third-party IP licensing is primarily used for defensive purposes or market access. Those who cross-license IP do not receive a solution that is specific to the customer, manufacturing process or application, and the received solution is not differentiated from what their competitors receive through the same license.
Substantially improved methodologies are required to generate the learning cycles necessary to accelerate innovation, improve product development and ensure manufacturing scalability of high-volume integrated devices. Further, companies require new ways to develop proprietary technology and obtain IP rights to support competitive advantage for their new products.
Our Solution
We have pioneered a proprietary approach to accelerate research and development, innovation and time-to-market for the semiconductor and clean-energy industries. Using our approach, we develop technology and IP rights focused on advanced materials, processes, integration and device architectures in collaboration with our customers. This technology enables our customers to bring optimized, high-volume manufacturing-ready integrated devices to market faster and with less risk than traditional approaches to R&D. Our proprietary HPC platform consists of our Tempus HPC processing tools, automated characterization and informatics and analysis software. Our HPC platform increases R&D productivity because it is purpose-built for R&D and utilizes advanced combinatorial processing systems, which allow for experiments to be performed at speeds up to 100 times faster than traditional methods. We provide our customers with proprietary technology through various fee arrangements and grant them rights to IP developed during the collaboration, primarily through royalty-bearing licenses. Our multi-disciplinary team of approximately 135 scientists and engineers, of whom approximately 55 have Ph.D.s, designs customized workflows for our customers' specific applications using our HPC platform and applies the workflows in collaboration with our customers to develop proprietary technology for them.
The key elements of our HPC platform include the following:
- •
- Tempus HPC processing. We use our
Tempus HPC processing tools to rapidly process different experiments consisting of various combinations of materials, processing parameters, sequencing and device structures. We are able to perform up
to 192 experiments on a single substrate, as compared to traditional methods, which typically allow only a single experiment at a time.
- •
- Automated characterization. We use
automated characterization systems to characterize the substrates processed by our Tempus HPC processing tools, thereby rapidly generating experimental data while matching our processing throughput.
- •
- Informatics and analysis software. We use our informatics and analysis software to automate experiment generation, characterization, data analysis and reporting, in each case while matching our processing throughput, and to create an aggregated and searchable database of information that includes the experimental results we generate.
78
The following graphic illustrates how these elements combine to form our HPC platform:
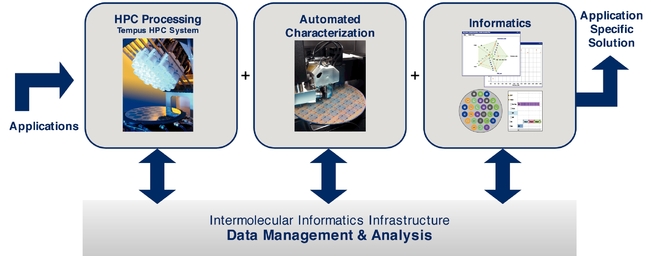
Benefits to Our Customers
Our business model aligns our interests with those of our customers as we collaborate to develop optimized, manufacturing-ready IP for high-volume integrated devices. We provide our customers with proprietary technology through various fee arrangements and grant them rights to IP developed during our CDPs, primarily through royalty-bearing licenses. Our differentiated platform solution and approach to collaborative engagements are designed to deliver the following significant benefits to our customers:
- •
- Accelerated time-to-market with better, lower-cost
products. Faster processing of experiments, throughput-matched characterization and real-time data management and analysis
allow additional learning cycles and broader exploration of materials and process solution combinations. In highly competitive markets, the resulting speed to market with improved,
lower-cost products enables our customers to gain market share and improve profitability. For example, during our engagement with Elpida to introduce their next generation DRAM, we were
able to accelerate time-to-market by reducing experimentation cycle times from weeks to hours, thereby increasing learning cycles for them by 100 times per month. The increased
volume of experimental data evaluated during the R&D process enabled a lower-cost and more power-efficient solution to enter high-volume manufacturing in the fourth quarter of
2010.
- •
- Development of application and manufacturing-ready IP tailored to our customers'
specifications. When we engage in a CDP with our customers, we use our HPC platform and customized workflows to develop
IP-protected, proprietary technology that is tailored to our customers' applications and ready for high-volume manufacturing. We provide our customers rights to the IP for
their applications primarily through royalty-bearing licenses.
- •
- Increased R&D productivity and reduced technology risk. Using our combinatorial processes, we narrow the potential combinations of advanced materials, processes and device architecture solutions through a series of increasingly rigorous screening stages to guide the selection of solutions that meet device performance requirements and that are cost-efficient and ready for high-volume manufacturing. The combinatorial process of screening and evaluating these solutions and their manufacturability mitigates our customers' technology risk earlier in the development cycle. For example, during our engagement with Guardian to develop anti-reflective glass coatings for solar panels, we were able to customize a workflow that allowed our HPC platform to evaluate a broad range of materials and process conditions to quickly identify combinations resulting in coatings with desired optical and durability characteristics. With our
79
extensive screening process, we were able to develop multiple formulations meeting Guardian's desired performance criteria that Guardian believes will both facilitate their transition to large scale manufacturing and reduce their commercialization risk.
Strengths
We have pioneered, developed and patented a proprietary platform and methodology for accelerating R&D in the semiconductor and clean-energy markets. Our strengths include:
- •
- Proprietary and patented HPC
platform. Our HPC platform employs proprietary and patented combinatorial methods to parallel process up to 192 experiments on a single
substrate as compared to traditional methods, which typically allow only a single experiment at a time. As of September 1, 2011, we owned or had exclusive rights within our field of use to 600
U.S. patents and patent applications (most of which also have foreign counterparts), which provide us with a competitive advantage in the use of combinatorial methods and systems in our target
markets.
- •
- Flexible technology platform configurable for and extendable to
multiple markets. Our HPC platform can be configured for many applications and extended to address the broad set of integrated device
markets. Because of the similarities in materials deposition, manufacturing processes and device integration complexities across markets, our platform allows us to create customized workflows and
support innovation across multiple markets.
- •
- Seasoned engineering team with multi-disciplinary
expertise. We have assembled a multi-disciplinary team of approximately 135 scientists and engineers, of whom approximately 55 have
Ph.D.s, with expertise across various disciplines, fields and technologies, including engineering, materials science, process development and integration, equipment, device process technologies and
device integration.
- •
- Collaborative customer engagements leading to IP generation and
strategic alignment. Our business model aligns our financial interests with those of our customers, to whom we grant rights to
proprietary technology and IP developed during our collaborations. Customers pay us development service and HPC platform subscription fees during multi-year CDPs. As they commercialize
products incorporating technology developed through the CDPs, our customers then pay licensing fees and/or royalties, including fixed fees and fees based on percentages of revenue and/or fee per
product. In certain cases, we sell HPC processing tools to our customers and receive recurring license fees. This alignment of interests facilitates collaboration and open communication that improves
development efficiencies and is more likely to result in innovative, differentiated products, which in turn creates a cycle of success that leads to future CDPs with those customers.
- •
- Attractive business model with contracted CDP revenue and recurring high-margin royalties. Our multi-year CDPs generate predictable CDP and services revenue from our customers. Our CDPs also establish the terms upon which we will receive licensing and royalty revenue from the sale of our customers' products that incorporate technology developed through our CDPs. These royalty arrangements create a business model with attractive margins and a high degree of near-term visibility. We expect to generate more revenue through royalty-based licenses as more of our customers commercialize and ramp production of products incorporating technology developed through the CDPs.
80
Our Strategy
Our mission is to drive our customers' success by transforming R&D and accelerating innovation in markets that derive competitive advantage from the interaction of materials science, processes, integration and device architecture. To accomplish this, we:
- •
- Target large, high-volume semiconductor
markets. We target large, high-volume semiconductor markets, including DRAM, flash memory and complex logic. Success in
these markets requires semiconductor companies to consistently remain at the leading edge of cost and performance, which demands innovation around materials science, processes, integration and device
architectures.
- •
- Target large, high-growth, emerging clean-energy
markets. We target large, high growth, emerging clean-energy markets, including the markets for flat glass, thin film and crystalline
solar, LEDs, advanced batteries and other energy-efficient technologies. We believe we can deliver significant improvements in cost, performance and manufacturability in these markets with our HPC
platform.
- •
- Engage with existing and potential market leaders in our target
markets. We enter into CDPs with companies that are well-positioned to lead their markets. We engage with customers that
have track records of technological innovation, deploy significant resources and are pursuing advancements that are critical to their success and strategy.
- •
- Create proprietary IP with our
customers. We develop differentiated, IP-protected technologies with our customers, and we grant them rights to these
technologies and IP, primarily through royalty-bearing licenses. We structure our customer engagements so that our business interests align with their market success.
- •
- Enhance our HPC platform and multi-disciplinary
team. We continue to develop, broaden and protect our processing, characterization, data analysis and workflow capabilities. To enhance
our existing platform, we will expand our existing multi-disciplinary team by continuing to recruit personnel with broad skill sets.
- •
- Explore and develop new technologies in high-volume integrated devices. We will continue to explore and internally develop new technologies and expertise to serve future customers in our targeted markets, including, in particular, clean energy. We will focus these efforts in markets which are in the early stages of development to speed innovation, capture value and facilitate success for customers.
Our Platform
HPC Workflows
We begin the development and discovery process by working with our customers to define the specific requirements a new solution should have to meet the needs of a given application. Generally, these criteria are well beyond the performance attributes of currently available solution sets. We then apply the components of our HPC platform to develop and discover solution sets that match these criteria.
Once an experiment is processed, the data sets of each experiment are stored in a secure database and analyzed for desired properties. As with processing, our clean room labs include a broad array of characterization and metrology instruments and software to evaluate different properties under a wide variety of process conditions. These properties include physical, electrical, mechanical, thermal, chemical, and optical properties. In general, we are able to design, process and characterize tens to hundreds of experiments in a single day.
81
To reach the point of commercialization or transfer to our customers' manufacturing process qualification, a solution set must progress through an extensive series of screening stages. Below is an illustration of the screening process of the HPC platform for use in evaluating materials, unit processes, and process sequences.
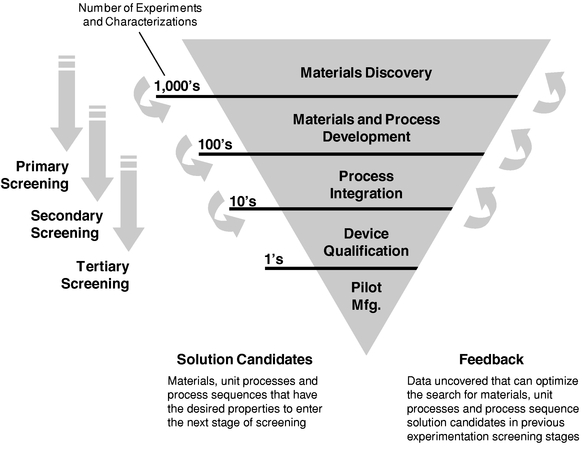
- •
- Primary Screening. Primary screening incorporates and
focuses on materials discovery. Materials are screened for certain properties to select possible candidates for a next level of screening. In the initial primary screening there may be thousands of
candidates that are subsequently reduced to hundreds of candidates.
- •
- Secondary Screening. Solution candidate materials from
primary screening are advanced to secondary screening processes that will examine materials and unit process development. In this secondary screening, processes and integration may be additionally
considered to narrow the candidates from hundreds of candidates to tens of candidates.
- •
- Tertiary Screening. Solution candidate materials and
process conditions that continue to meet or exceed the defined criteria through the secondary screening stage are then either transferred to our customer or processed internally for additional
characterization and scale up. These candidates are then characterized on a larger scale, and correlation of the desired process is developed to allow the transfer of the developed technology in a
manufacturing scale process.
- •
- Manufacturing and Commercialization. Once a candidate has passed this development scale analysis, it is ready for commercialization and the customer will decide whether to commercialize the developed technology.
Secondary screening begins while primary screening is still ongoing, and while we are still generating additional primary screening candidates. Tertiary screening begins once we have identified a
82
reasonable set of options from secondary screening, and while we are still generating additional secondary screening candidates. As these stages overlap, there may be feedback from later stages that is then incorporated back into an earlier stage to further optimize the selection of materials, unit processes and process sequences.
Wet Processing Tools
We offer a series of wet processing tools which apply HPC methods to fluids-based applications such as cleans, deposition and wet etch, self-assembly, and surface treatment processes. These tools, which can be used alone or in combination, include:
- •
- Tempus F-10. A stand-alone system used for
primary screening through the automatic creation of formulations, especially those involving powders and viscous liquids.
- •
- Tempus F-20. A stand-alone system for
materials and process screening, which is used for library creation as well as processing of wafer coupons. This product can be used for primary or secondary screening, depending on the reactor block
design and the substrate type.
- •
- Tempus F-30. A stand-alone system for integration and tertiary scale up screening, which is used to scale up the most promising results from primary and secondary screening to full-size patterned wafers (200 or 300mm).
Dry Processing Tools
In addition, we offer dry processing tools which apply HPC methods to vapor-based applications. Each of these tools can be used in primary, secondary and tertiary screening. These tools, which can be used alone or in combination, include:
- •
- Tempus P-30-HPC-Physical Vapor Deposition
(PVD). A 300mm chamber with the ability to use up to four PVD sources and three optional deposition methods (including DC, RF and pulse DC) on a vast range of film
thicknesses and/or compositions and/or film stacks within each site-isolated region of a substrate.
- •
- Tempus A-30-HPC-Atomic Layer Deposition
(ALD). A 300mm chamber capable of site isolation of both metal and dielectric films across quadrants of the wafer, with the ability to introduce variation of film
thickness and/or composition and/or film stacks within each quadrant.
- •
- Tempus AP-30. A configurable platform with multiple A-30 or P-30 chambers and common support modules to facilitate both ALD and PVD for rapid screening of thin-film metal alloys, dielectrics and multilayer stacks. Processes can be scaled to facilitate high-volume manufacturing.
Automated Characterization
Immediately after processing substrates on our Tempus HPC processing tools, we use automated and customized characterization instruments to rapidly generate physical and electrical data from the experiments. The aggregated data is automatically loaded into our informatics data warehouse. As with processing, our clean room labs include a broad array of characterization and metrology instruments and software to evaluate different properties under a wide variety of process conditions. Our characterization instruments match the throughput of our processing tools to maximize experimental learning cycles.
83
Informatics Software, Analysis and Services
Our informatics software has the ability to automate the capture, entry and storage of HPC processing and automated characterization and metrology data and then to evaluate, summarize and securely distribute in real time this data to the appropriate parties. Additionally, we use our informatics software to leverage experiments processed and characterized in the past for a customer to increase the speed and effectiveness of the engagement. The key components of our informatics software include:
- •
- Workflow management software. Manages the design and
process of experiments, metrology and collection of data and summarizes aggregated data to the various working teams in the form of status reports; provides our customers with real-time
access to results of our experiments and analysis;
- •
- Analysis and reporting software. Provides data and
analysis tools to evaluate process distributions, correlate electrical distributions, map defectivity distributions, perform spectral analysis and facilitate interactive creation of summary reporting;
- •
- Security and collaboration management software. Provides
secure communication between geographically dispersed working teams, ensures the security of created documentation and presentations, manages the minutes for meetings, provides programs and project
plans to coordinate working teams, shares summary reports across the working team and provides reviews of finished processes and status of ongoing processes; and
- •
- Integration services. Facilitate collaboration between our tools and the customer's process and metrology tools, automate the recipe loading, automate data collection and leverage software to customize reports.
Our Technology
Embedded throughout our hardware and software, our technology is based upon the parallel and/or rapid serial experimentation capabilities of combinatorial methods. High-productivity combinatorial methods generally refer to techniques that vary materials, unit processes, process, and device integration sequences across multiple regions of one or more substrates, the output of which can then be evaluated in parallel. Our informatics software and analytical methods characterize and analyze these combinations of materials, unit processes, process, and device integration sequences for the most promising solutions in a structured, automated and throughput-matched fashion. The relationship between materials, processes, integration and device output are established earlier in the development process, so that performance and manufacturability considerations are taken into account from the outset, instead of late in the R&D process.
Although our approach is unique in the semiconductor and clean-energy industries, combinatorial technology has been widely used in other industries, especially where new materials function as primary enablers of product innovation. Examples include the pharmaceutical, biotechnology, and energy sectors, where combinatorial techniques have been accelerating development since the early 1990s.
We are able to deploy and benefit from our proprietary combinatorial methods because of our multi-disciplinary team of approximately 135 scientists and engineers, of whom approximately 55 have
84
Ph.D.s. Our team has expertise in a wide range of disciplines, fields and technologies, including the following:
| Disciplines | Applications | Equipment (Hardware & Process) |
Devices (Processes and Integration) |
|||
|---|---|---|---|---|---|---|
| Chemistry Physics Materials science Engineering • Chemical • Electrical • Mechanical • Software • Controls • Systems |
Equipment development • Systems engineering • Semiconductor tools • Flat panel display tools • Software Design, qualification, manufacturing • Modeling / TCAD • Development / integration • Yield management • Statistical methods • Test structures • Inspection, review & characterization • Electrical test |
Deposition • ALD • PVD • PECVD • CVD (metals/dielectrics) • ECD / electroless • CBD / curtain coating Wet processing Laser annealing Defect detection • Optical, e-beam, laser • High-speed voltage contrast |
Process, equipment, integration • DRAM / Non-Volatile Memory • Microprocessors • Solar cells (CIGS, thin film Si, cSi) • Low e glass coatings • LED Process technologies • Selenization / absorber formation • Shallow trench isolation gapfill • High-k / metal gate • Contact & advanced silicide • Advanced Cu—interconnect (Cu, Al) • Advanced packaging |
Our Collaborative Development Programs
Our CDPs allow our customers to collaborate with our multi-disciplinary team on specific technical problems. We establish processes and procedures to protect our customers' confidential information during these CDPs. Our CDP work is primarily carried out at our facility in close collaboration with our customers. In addition, we support device qualification for pilot manufacturing at our customers' manufacturing and development sites. Customer teams and our teams collaborate on development of new materials, unit processes, process modules and integration sequences, and qualify the supply chain for high-volume manufacturing. Our multi-disciplinary team can rapidly adapt our Tempus HPC platform to meet customer application requirements and develop and optimize device and product technologies to ensure success with customer programs.
We typically initiate new customer engagements with smaller, customer-paid programs called micro-CDPs. Our micro-CDPs precede the full CDP. These are smaller programs that require significantly less investment from our team but allow us to demonstrate the capabilities of our HPC platform to a customer without requiring a customer to commit to a multi-year agreement. We use these micro-CDPs to demonstrate the capabilities and value of our HPC platform to these new customers, with the objective of engaging with these customers in a full CDP.
Our CDPs are designed to result in the development of proprietary technology and IP for new devices, manufacturing process technology and materials, which we license to our customers for use in volume production. We provide our customers with proprietary technology through various fee arrangements and grant them rights to associated IP primarily through royalty-bearing licenses.
Our Customers
Our customers include semiconductor device, semiconductor materials and equipment and clean-energy market leaders, including ATMI, Elpida, GLOBALFOUNDRIES, Guardian, SanDisk, Toshiba and TSMC. Typically, our customers engage in CDPs with our team leveraging our HPC platform to develop and commercialize high-volume integrated devices using collaboratively developed technology. To date, ATMI and Elpida have already successfully developed products through their CDPs and we
85
have granted them rights to the associated technology and IP rights through royalty-bearing licenses. Successes in our initial CDPs have led to expanded relationships and follow-on programs with existing customers for new products and applications.
One example of a customer who has successfully developed and commercialized products through a CDP and expanded upon initial CDPs through follow-on programs is Elpida. We initially began working with Elpida through a micro-CDP in November 2007, resulting in a full CDP in May 2008. In this resulting CDP, we were able to accelerate time-to-market by reducing experimentation cycle times from weeks to hours, thereby increasing learning cycles for them by over 100 times per month. The increased volume of experimental data evaluated during the collaboration enabled the development of a lower-cost and more power-efficient solution through innovations in materials, processes and integration. As a result of our engagement success, Elpida subsequently engaged us in follow-on programs for new products. Elpida incorporated technology developed through this CDP in their next generation DRAM products which entered high-volume manufacturing in the fourth quarter of 2010.
The majority of our revenue comes from ATMI and Elpida, which represented a combined 53%, 72%, 88% and 81% of our total revenue for the six months ended June 30, 2011 and the fiscal years ended December 31, 2010, 2009 and 2008, respectively. We believe that the revenue concentration associated with these two customers will likely continue to decline as our other customers begin to transition technology developed through CDPs into licensing and royalty revenue and as we continue to enter into new CDPs with new and existing customers in the semiconductor and clean-energy markets.
Intellectual Property
Our success depends in large part on our IP. We have patented and continue to seek patent protection for combinatorial methods and systems included in our HPC platform. We have also patented and continue to seek patent protection of innovations that result from applying our HPC platform to design, develop and manufacture ICs, photovoltaic cells, glass coatings, LEDs, organic light-emitting diodes (OLEDs) and thin films for electronics, optical and energy applications (Fields). As of September 1, 2011, we owned 216 U.S. patents and patent applications (most of which also have foreign counterparts), of which 106 are related to the HPC platform and 110 are related to innovations in the Fields. We also have a license to approximately 384 U.S. patents and patent applications granted to us by Symyx Technologies, Inc. (Symyx), a wholly-owned subsidiary of Accelrys, Inc., that exclusively provides us the right to use combinatorial methods and systems in the Fields.
As of September 1, 2011, we owned 12 patents and 94 patent applications related to our HPC platform in the United States, and two patents and 41 patent applications in other jurisdictions. The expiration dates of these patent rights range from May 2025 to September 2031. We continue to file patent applications to seek protection for further advancements of our HPC platform. We own all rights to such patents and generally do not grant licenses to third parties under these patents other than in connection with the use of our HPC platform. Our patents and patent applications cover the following aspects of the HPC platform:
- •
- Combinatorial systems and methods related to fluids-based processing;
- •
- Combinatorial systems and methods related to vacuum-based processes, including deposition and etch;
- •
- Systems and methods for site-isolated processing;
- •
- Combinatorial systems and methods related to high-volume manufacturing; and
- •
- Processing techniques using combinatorial and non-combinatorial methods.
86
In addition to the patents we own, we have rights to approximately 384 U.S. patents and patent applications pursuant to licenses and sublicenses granted to us by Symyx to use combinatorial methods and to make, use and sell combinatorial systems. These rights are exclusive to us in the Fields. The expiration dates of the rights arising from the 384 U.S. patents and patent applications that exclusively provide us the right to use combinatorial methods and systems in the fields of ICs, photovoltaic cells, glass coatings, LEDs, organic light emitting diodes (OLEDs) and thin films for electronics, optical and energy applications range from October 2014 to November 2028. On July 28, 2011, we entered an asset purchase agreement with Symyx, pursuant to which Symyx will transfer to us all the patents for combinatorial methods and systems owned by them, effective upon the consummation of this offering. See "Certain Relationships and Related Party Transactions—Symyx" for further details about this transaction.
We also have and seek patent protection for innovations developed using our HPC Platform (applications IP). Such innovations cover advancements in new materials, processes, process conditions, process sequences and device architectures in applications such as semiconductor memory, semiconductor complex logic, glass coatings, solar cells and LEDs. As of September 1, 2011, we owned 21 patents and 89 patent applications in the U.S. covering applications IP, as well as one patent and 27 patent applications in other countries. We may develop applications IP either on our own or in collaboration with our customers through CDPs.
In most cases, we maintain an ownership interest in the applications IP that results from CDPs and we grant licenses under this applications IP to the CDP customer. Such licenses generally allow the CDP customer to have exclusivity for a limited term in a particular field. We keep the right to grant licenses under the CDP patents outside that field. Furthermore, if the CDP customer elects to not extend the term of exclusivity beyond the limited term, we have the right to grant licenses to third parties within the field. If required we assign separate teams for each CDP, maintain separate databases of experimental data and limit access to such databases only to the specific team that assists the CDP customer.
We may also develop applications IP internally where we believe such IP may have broad applicability in the relevant market. We are able to leverage this IP to begin CDPs with new customers. In addition, our ability to own the applications IP in these situations allows us to leverage learning and patent protection across industries and applications while providing our existing customers with the IP rights they desire to gain competitive advantage in their fields for the markets they serve.
Sales and Marketing
We sell and market our solutions worldwide through our own sales force by developing direct relationships with our customers. We have sales personnel located in Japan, Taiwan, Europe and the United States, including account managers, who are responsible for specific customer accounts, and product marketing personnel, who provide business development support and application and workflow platform expertise. We often base customer support personnel at or near the offices of our major customers to improve our level of service and expand our sales.
Our business development and product marketing group focuses on our strategy, platform and technology roadmap, new platform introduction process, demand assessment and competitive analysis. The group coordinates new application evaluation and development both internally with our engineering teams and externally with new and existing customers. We intend to increase our sales and marketing efforts and further expand our business development and product marketing organization.
Manufacturing
We manufacture our HPC tools through partnerships with experienced contract manufacturers that manufacture and assemble sub assemblies incorporating our designs. We believe that our third party
87
manufacturers have adequate sources and supplies of the raw materials needed to manufacture our products. We believe that partnering with contract manufacturers provides us with access to the most current facilities and processes without significant capital outlay on our part, allowing us to focus our resources on R&D, product design and collaboration program support. Although we have historically relied on a small number of contract manufacturers for the manufacture and assembly of a majority of our workflow platforms, we have relationships with a variety of contract manufacturers and are not dependent on any single contract manufacturer.
Research and Development
We conduct R&D activities for CDPs and for internal research and development on both workflow platform development and application R&D. We employ a research and development team of approximately 157 full-time employees. This R&D team includes many experienced semiconductor engineers with advanced degrees from leading universities around the world and managers with experience from leading chip manufacturers, solar PV companies and equipment suppliers. We believe these R&D professionals on our team have enabled us to develop our HPC platform, support customer CDPs, implement our technology roadmap rapidly and provide us with the foundation for our technology advancement in the future.
Our customer-sponsored R&D expenses included in cost of revenue were $9.1 million in 2008, $8.8 million in 2009 and $16.9 million in 2010, which represented approximately 39%, 33% and 40%, respectively, of our revenue in those years.
We devote a substantial portion of our resources to engineering next generation platforms by integrating future generations of technology and developing a standardized software and informatics platform. We work closely with multiple vendors during the development of new workflows or workflow modifications for use in our future platforms. We work with our software and component vendors to establish integration standards. To that end, we are developing scalable software architectures that will allow us to integrate new processes requested by our customers to further expand the opportunities with new and existing customers, accelerate time-to-market, and allow our workflow platforms to operate with adjacent vertical technologies such as clean-energy markets. Our internal R&D expenses were $11.8 million, $11.0 million and $13.9 million for the fiscal years ended December 31, 2008, 2009 and 2010, respectively, which represented approximately 51%, 41% and 33%, respectively, of our revenue in those years.
Competition
The principal capabilities required to be competitive in our market include technical expertise, processes and integration capabilities, diversity of platform offerings, development speed and performance, quality and reliability of field engineers, depth of collaboration with customers and technical support. We believe we compete favorably with respect to these factors because of the breadth of capabilities of our HPC platform, the depth of multi-disciplinary expertise of our internal research team and external engineering teams who collaborate with customers and our use of combinatorial processing and throughput matched characterization and analysis. These differentiating factors allow us to explore more comprehensive solution sets and provide faster solutions to our customers. We are not aware of any companies that currently compete or have to date competed with us in the use of combinatorial methods in research and development applications; however, we do believe that we compete for the R&D resources of our customers with equipment suppliers, industry consortia, alliance partnership, university research and third-party IP licensing. In addition, many of our customers design, develop, manufacture and market solutions based on their own unique device architectures and develop their own intellectual property in-house.
88
A portion of our revenue is generated from the sales of end products by our customers, and our competitive position therefore is dependent on their competitive positions. The markets for our customers' products that incorporate technology developed through our CDPs are intensely competitive and characterized by rapid technological change. These changes result in frequent product introductions, short product development cycles and increased product capabilities typically representing significant price and performance improvements.
Environmental Regulation
We are subject to various foreign, federal, state and local environmental laws and regulations governing, among other matters, emissions and discharges of hazardous materials into the air and water, the use, generation, storage, handling, transportation and disposal of, and exposure to, hazardous materials and wastes, remediation of contamination and employee health and safety. In addition, under certain of these environmental laws, liability can be joint and several and without regard to comparative fault. Our operations involve the use of hazardous materials and produce hazardous waste, and we could become liable for any injury or contamination that could arise due to such use or disposal of these materials. Failure to comply with environmental laws and regulations or to obtain or maintain required environmental permits could result in the imposition of substantial civil and criminal fines and sanctions, could require operational changes or limits or the installation of costly equipment or otherwise lead to third party claims. Future environmental laws and regulations, stricter enforcement of existing laws and regulations, or the discovery of previously unknown contamination or violations of such laws and regulations could require us to incur costs, or become the basis for new or increased liabilities or subject us to fines or other sanctions.
Employees
As of June 30, 2011, we had a total of 190 full-time employees, consisting of 157 people engaged in CDPs and R&D activities and 33 people in sales and marketing, legal and general and administrative roles. None of our employees are represented by a labor union, and we consider our employee relations to be good.
Our CDPs are labor-intensive, and as we engage in additional CDPs, we will need to hire enough highly-skilled engineers and other technical staff to support the CDPs. We evaluate our hiring needs on a project by project basis, taking into account current and anticipated CDP timelines and lifecycles. We believe our location in San Jose, California provides us with access to a large population of highly-skilled engineers who will be able to meet the technical requirements of our new CDPs.
Facilities
Our facilities currently consist of an aggregate of approximately 146,000 square feet of office, research and development clean room space in San Jose, California, pursuant to a lease that expires in 2015. For our CDP engagements, as of September 1, 2011 we are using approximately 35% of the capacity of our clean room space in San Jose. We have historically expanded and invested in our facilities to support the growth of our CDPs and we expect to be able to continue to do so on commercially reasonable terms as we engage in new CDPs in the future. We have no reason to believe that additional space that we may need in the future will not be available on commercially reasonable terms.
Legal Proceedings
We are not currently a party to any material pending legal proceedings.
89
CUSTOMER AND COLLABORATIVE AGREEMENTS
The descriptions below contain only a summary of the material terms of the agreements and do not purport to be complete. These descriptions are qualified in their entirety by reference to the respective agreements that are filed as exhibits to the registration statement of which this prospectus is a part.
Collaborative Development Program Agreement with GLOBALFOUNDRIES (GF)
In June 2011, we entered into a CDP agreement with GF to develop and improve certain semiconductor products.
Under the agreement, we will provide development services to GF and grant GF non-exclusive use of our proprietary HPC platform (which includes a subscription to the platform and a license to the associated software) for the purpose of developing and improving certain semiconductor products.
Each party will own the rights arising out of the CDP created by its inventors ("GF CDP IP"). We agreed that we would not grant a license under our rights in the GF CDP IP to any third party outside a certain field without the prior written consent of GF.
GF has agreed to pay us (i) royalties on sales of products that incorporate the GF CDP IP, (ii) fees for providing development services to GF, (iii) subscription and license fees for use of the HPC platform, and (iv) certain pre-approved expenses and material costs. GF may grant sublicenses to use the GF CDP IP to third parties, but must share with us the royalties it receives from certain third party sublicenses. We also granted GF an option to purchase certain HPC processing tools.
We are required to supply a certain number of full-time employees or contractors dedicated to supporting the development activities under the CDP.
The initial period for development activities and use of the HPC platform is three years, and will automatically renew for additional one-year periods unless either party elects to terminate. The initial term of the agreement is five years from the date of the last sale of a product that incorporates GF CDP IP.
Collaborative Development Program Agreement with Toshiba and SanDisk
In March 2010, we entered into a CDP agreement with Toshiba and SanDisk to develop certain memory technologies and related materials.
Under the agreement, we will provide development services to Toshiba and SanDisk and grant Toshiba and SanDisk non-exclusive use of our proprietary HPC platform (which includes a subscription to the platform and a license to the associated software).
Toshiba and SanDisk will own the rights to the technology and IP arising out of the CDP that is based on Toshiba or SanDisk background technology or that is solely developed by Toshiba or SanDisk. We will own the rights to the technology and IP arising out of the CDP that is solely developed by us and that is based on our background technology. Jointly developed technology and IP arising out of the CDP that is based on our background technology will be jointly owned. Patent rights based on technology solely developed by us that is based on Toshiba or SanDisk background technology will be jointly owned.
We granted Toshiba and SanDisk an exclusive license under our rights in the technology and IP arising out of the CDP (Toshiba-SanDisk CDP IP) during the term of the CDP. After the conclusion of the CDP term, Toshiba and SanDisk each shall have the option (i) to continue to maintain an exclusive license to certain or all of the Toshiba-SanDisk CDP IP, (ii) to convert the exclusive license to non-exclusive, or (iii) to terminate the exclusive license.
90
Toshiba and SanDisk have agreed to pay us (i) volume-based royalties on sales of products that incorporate the Toshiba-SanDisk CDP IP subject to certain minimum and maximum levels, (ii) fees for providing development services to Toshiba and SanDisk, (iii) subscription and license fees for use of the HPC platform, and (iv) certain pre-approved expenses and material costs. Toshiba or SanDisk may request that we grant to other third parties a royalty-bearing license to the Toshiba-SanDisk CDP IP.
The initial period for the development activities is two years, and may be extended for up to two additional one-year periods. The obligations of Toshiba and SanDisk to pay royalties under the licenses granted by us shall continue for the duration of such licenses.
Advanced Memory Development Program Agreement with Elpida Memory, Inc. (Elpida)
In May 2008, we entered into an Advanced Memory Development Program Agreement with Elpida relating to a CDP to develop and improve certain advanced memory products. The Elpida agreement was supplemented and/or amended in August 2008, January 2009, May 2009 and July 2010.
Under the agreement, we will provide development services to Elpida and grant Elpida non-exclusive use of our proprietary HPC platform (which includes a subscription to the platform and a license to the associated software) for the purpose of developing and improving certain advanced memory products.
We own the rights for certain technology and IP arising out of the CDP (our CDP IP). Elpida owns the rights for certain other technology and IP arising out of the CDP (Elpida CDP IP). All other technology and IP arising out of the CDP will be jointly owned by Elpida and us (joint CDP IP). We have also granted Elpida an exclusive license to use our CDP IP and the joint CDP IP in certain fields during the term of the agreement.
Elpida has agreed to pay us (i) royalties on sales of products that incorporate our technology, our CDP IP, Elpida CDP IP or joint CDP IP subject to certain minimum and maximum levels; (ii) fees for providing development services to Elpida, (iii) subscription and license fees for use of the HPC platform, and (iv) certain pre-approved expenses and material costs.
The current period for development activities and use of the HPC platform is through April 1, 2013, after which the exclusive license converts to a non-exclusive license unless Elpida meets certain minimum quarterly sales thresholds from high-volume manufacturing of royalty-bearing products. Elpida's obligation to pay royalties under the licenses granted by us shall continue for the duration of such licenses.
ATMI Engagement
In November 2006, we entered into an alliance agreement with ATMI to develop advanced materials for semiconductor products under one or more individual CDPs as agreed between the parties from time to time. Each CDP would provide payments from ATMI to us (i) for providing development services to ATMI, (ii) for subscription and license fees for use of the HPC platform, and (iii) for certain pre-approved expenses and material costs. ATMI owns any technology and IP that it independently creates during the alliance agreement. We own the technology and IP we independently create. Unless modified by the terms of a CDP, we also own the Alliance Technology arising out of the CDP and the HPC technology. The initial term of the alliance activities is ten years.
The parties have had one CDP under the alliance agreement. Under that CDP, ATMI owns any technology and IP that it independently creates during the alliance agreement, as well as any materials manufacturing technology and associated IP rights that are created during the course of the alliance agreement (the Alliance Materials Manufacturing Technology). We own the technology and IP we independently create and, other than the Alliance Materials Manufacturing Technology, any other technology and IP that is created during the course of the alliance agreement (the Alliance IP). We
91
granted to ATMI a limited, field-restricted, exclusive license to use the Alliance IP, with the right to sublicense, and ATMI has agreed to pay us royalties or share revenues on the sales or licenses of ATMI products that incorporate the Alliance IP. We retained the right to be the sole licensor of any Alliance IP to any IC manufacturers or original equipment manufacturers.
In July 2007, we entered into a Wets Workflow Purchase Agreement with ATMI, which was extended through amendments in December 2007, December 2008, March 2009, August 2010 and March 2011 (as amended, the ATMI Wets Workflow Agreement), pursuant to which we agreed to sell to ATMI certain HPC processing tools and license informatics software related to liquid or fluids-based materials (wets) used in semiconductor processing and manufacturing (collectively, the wets workflow). The wets workflow may only be used at certain designated sites and solely for the purpose of developing and commercializing materials, wets processing processes, products and materials manufacturing technologies in a certain field. ATMI is obligated to pay us royalties on products that incorporate any material identified, first synthesized, or discovered through use of any wets workflow (the ATMI products). During the term of the agreement, we have agreed not to enter into any joint marketing, sales or development agreements in certain fields with certain competitors of ATMI. During the term of the agreement and subject to economic terms, we also agreed not to ship certain elements of the wets workflow and certain other proprietary HPC processing tools to certain ATMI competitors for use in certain defined fields. We have agreed to evaluate ATMI materials for CDPs between us and integrated device manufacturers for an IC or solar application. We have agreed to recommend ATMI materials to our customers in these CDPs, provided that the ATMI materials are timely available, meet our customer's requirements and are cost competitive. If we identify an opportunity for ATMI and us to work in a joint development program or if ATMI introduces us to such an opportunity with an integrated device manufacturer, we and ATMI will enter into good faith negotiations to agree on an economic arrangement, unless ATMI does not have HPC-related resources available to contribute to such an opportunity. We are required to supply a certain number of full-time employees or contractors dedicated to supporting ATMI's use of the wets workflow. The agreement will continue in effect as long as any license granted under any applicable purchase order under the agreement remains in effect, which will be at least through December 31, 2013.
In December 2008, we entered into a Dry Workflow Purchase Agreement with ATMI, which was extended thru amendments in August 2010 and March 2011 (as amended, the ATMI Dry Workflow Agreement), pursuant to which we agreed to sell to ATMI certain HPC processing tools and license informatics software related to vapor-based applications (dry) used in semiconductor processing and manufacturing (collectively, the dry workflow). For sales of compounds or materials (or composition of compounds or materials) identified, first synthesized, or discovered in whole or in part through the use of the dry workflow, and any derivative thereof (the ATMI dry products), ATMI would pay us a royalty on these ATMI dry products. We are required to supply a certain number of full-time employees or contractors dedicated to supporting ATMI's use of the dry workflow. The agreement will continue in effect as long as any license granted under any applicable purchase order under the agreement remains in effect, which will be at least through December 31, 2013.
Symyx Agreements and Asset Purchase
In March 2005, we entered into a Collaborative Development and License Agreement with Symyx Technologies, Inc. (Symyx). In addition, in December 2005, we entered into an Alliance Agreement (Symyx Alliance Agreement) with Symyx, and we amended the Symyx Alliance Agreement in August 2006, June 2007, August 2007, November 2007 and September 2009.
Under the Symyx agreements, Symyx granted us a license to certain high-throughput combinatorial patents held or licensed by them and related software to design, develop and manufacture integrated circuits, photovoltaic cells, glass coatings, light emitting diodes, organic light-emitting diodes and thin films for electronics, optical and energy applications (Fields), and we agreed to pay Symyx royalties in
92
connection with such license. During the three months ended March 31, 2011 and 2010 and the years ended December 31, 2010, 2009 and 2008, we recorded $421,000, $279,000, $2.0 million, $1.2 million and $1.0 million in royalty expense, respectively, and had accrued liabilities due to Symyx of $375,000, $795,000 and $502,000 as of March 31, 2011 and December 31, 2010 and 2009, respectively. In addition, during the three months ended March 31, 2011 and 2010 and the years ended December 31, 2010, 2009 and 2008, we purchased $0, $0, $6,000, $14,000 and $286,000, respectively, of fixed assets, maintenance and consumables from Symyx.
On July 28, 2011, we entered into an agreement with Symyx, pursuant to which we agreed to use commercially reasonable efforts to allow Symyx to sell in this offering shares of our common stock held by them. Pursuant to the agreement, Symyx agreed to sell such shares and, upon consummation of this offering, including the sale of such shares, to terminate our future royalty obligations under the Symyx agreements to the extent they would have accrued after December 31, 2011. Additionally, upon consummation of this offering and such sale, Symyx would transfer to us all the patents held by them that relate to combinatorial processing. For a more detailed description of the asset purchase, see "Certain Relationships and Related Party Transactions—Symyx."
93
Executive Officers, Directors and Key Employees
The following table sets forth certain information about our executive officers, key employees and directors, as of September 1, 2011.
Name
|
Age | Position | |||
|---|---|---|---|---|---|
Executive Officers |
|||||
David E. Lazovsky |
39 | President, Chief Executive Officer and Director | |||
Peter L. Eidelman |
45 | Chief Financial Officer | |||
Tony P. Chiang, Ph.D. |
41 | Chief Technology Officer | |||
John R. Behnke |
50 | Senior Vice President and General Manager, Semiconductor Group | |||
James Craig Hunter |
42 | Senior Vice President and General Manager, Clean Energy Group | |||
Sandeep Jaggi, J.D., Ph.D. |
48 | General Counsel and Senior Vice President of Intellectual Property | |||
Zia Malik |
59 | Senior Vice President, Global Sales and Marketing | |||
Directors |
|||||
Thomas R. Baruch(1)(3) |
72 | Chairman of the Board | |||
Marvin D. Burkett(2) |
69 | Director | |||
Irwin B. Federman(1) |
76 | Director | |||
Isy Goldwasser |
41 | Director | |||
Bruce M. McWilliams(2)(3) |
55 | Director | |||
George M. Scalise(2)(3) |
77 | Director | |||
John L. Walecka(1) |
51 | Director | |||
- (1)
- Member
of the Compensation Committee.
- (2)
- Member
of the Audit Committee.
- (3)
- Member of the Nominating and Corporate Governance Committee.
Executive Officers
David E. Lazovsky is our founder and has served as our President and Chief Executive Officer and as a member of our board of directors since September 2004. Mr. Lazovsky brings an in-depth knowledge of semiconductor manufacturing operations and our business and operations to our board of directors. He previously held several senior management positions at Applied Materials Inc. (Applied Materials). From 1996 through August 2004, Mr. Lazovsky held management positions in the Metal Deposition and Thin Films Product Business Group where he was responsible for managing more than $1 billion in Applied Materials' semiconductor manufacturing equipment business. From 2003 until 2004, Mr. Lazovsky managed key strategic accounts in Business Management where he worked closely with leading integrated circuit manufacturers to ensure Applied Materials was developing and providing cutting-edge technology solutions. From 2002 until 2003, Mr. Lazovsky served as the Technology Program Manager for the Endura 2 Platform, Applied Materials' flagship 300mm metallization platform. From 2000 until 2002, Mr. Lazovsky served as Director of Business Management for the European region in the Metal Deposition Product Business Group. Previously, Mr. Lazovsky served as a Business Manager from 1997 to 2000, Account Product Manager from 1996 to 1997 and Total Product Support Engineer from 1995 to 1996. Mr. Lazovsky holds a B.S. in mechanical engineering from Ohio University and, as of September 1, 2011, held 23 pending or issued U.S. patents.
94
Peter L. Eidelman has served as our Chief Financial Officer since February 2006. Prior to joining Intermolecular, Mr. Eidelman served as Senior Vice President and Chief Financial Officer at Cellon International from October 2002 to February 2006, where he led the company through several financings, acquisitions, restructurings and divestitures. Mr. Eidelman also served as Chief Financial Officer and Treasurer of Sunrise Telecom Inc. from July 1997 to October 2002, which he helped guide through an initial public offering. Earlier in his career he was the manager of tax, accounting and compliance for Amdahl Corporation from 1994 to July 1997 and a manager at the public accounting firm of Coopers & Lybrand (now part of PricewaterhouseCoopers) from 1988 to 1993. Mr. Eidelman holds a B.S. in accounting from the University of Massachusetts at Amherst and studied business and taxation at Bentley College in Waltham, Massachusetts. He also completed an executive management program at the Wharton School, University of Pennsylvania. Mr. Eidelman is a certified public accountant and a member of the American Institute of Certified Public Accountants, Financial Executives International and the Tax Executives Institute.
Tony P. Chiang, Ph.D. has served as our Chief Technology Officer since May 2005 and is responsible for our technology strategy and direction, HPC platform development, core technology and applications development and informatics and operations. Prior to joining Intermolecular, in August 2000, Dr. Chiang founded Angstron Systems Inc. (Angstron), a venture-backed atomic layer deposition start-up company that was acquired by Novellus Systems Inc. (Novellus) in April 2004. Following the acquisition, Dr. Chiang then served as Director of Technology for Novellus until April 2005. From February 1996 until he founded Angstron, Dr. Chiang worked in technology development, product, program and account management roles at Applied Materials, where he led the development, productization and qualification of several generations of enabling thin film deposition technologies used in high-volume manufacturing. Dr. Chiang holds a B.S. in materials science and engineering from Cornell University and a Ph.D. in materials science and engineering from the Massachusetts Institute of Technology. As of September 1, 2011, he held 151 pending or issued U.S. patents spanning advanced materials, process, device and device integration technologies, as well as combinatorial systems and methods.
John R. Behnke has served as our Senior Vice President and General Manager of our Semiconductor Group since July 2011 and had previously served as our Vice President, Worldwide Sales and Marketing since October 2009. Mr. Behnke has more than 27 years of semiconductor industry experience. Most recently he served as Corporate Vice President, Initial Manufacturing Operations & Silicon Technology at Spansion, Inc. (Spansion), with responsibility for all wafer fabrication and its Submicron Development Center. His responsibilities included development of Spansion's proprietary Charge Trapping NOR and NAND process technologies. Mr. Behnke's previous responsibilities at Spansion included product deployment for its Wireless Business Unit. Mr. Behnke worked at Spansion from the time of its initial public offering and spin-off from Advanced Micro Devices, Inc. (AMD)/ Fujitsu in December 2005 until August 2009. Prior to Spansion's spin-off from AMD/Fujitsu, he held various positions in AMD, including as Director of Operations and Technology in its Fab 25 wafer fabrication facility in Austin, Texas from 2000 to 2005, where he was involved in the development of AMD's APC/APM technologies. Prior to Spansion and AMD, Mr. Behnke worked at the Hughes Research Lab in Malibu, California from 1985 to 1992 on the development of InP/GaAs HEMT low noise amplifiers and radiation-hardened SOS. Mr. Behnke holds a B.S. in mechanical engineering with an industrial engineering minor from Marquette University and completed a Clean Energy program at the University of Texas at Austin. As of September 1, 2011, he held five pending or issued U.S. patents.
J. Craig Hunter has served as Senior Vice President and General Manager of our Clean Energy Group since July 2011 and had previously served as Vice President and General Manager of our Clean Energy Technologies Group since January 2009. From June 2008 to December 2008, he was an Entrepreneur in Residence at Sequoia Capital, with a focus on the photovoltaic industry. Mr. Hunter
95
previously held several management positions at Applied Materials, including the Managing Director of Channel Development from March 2008 to May 2008, the General Manager of their thin-film solar business from 2005 through March 2008, during which time he oversaw the development of that business from conception of the SunFab Thin Film Line to manufacturing the first solar panels, and Senior Manager of product management of the PVD and e-beam inspection tools used in LCD manufacturing from 2003 through 2005. Prior to joining Applied Materials, Mr. Hunter served in a variety of senior management roles, including Chief Financial Officer of Evercare Corporation, a manufacturer of consumer products, from 1999 to 2001, and Director of Mergers and Acquisitions at The Beacon Group in New York from 1997 to 1999. Mr. Hunter holds a B.A. in East Asian Studies from Harvard College and graduated with high distinction from Harvard Business School. As of September 1, 2011, he held six pending or issued U.S. patents.
Sandeep Jaggi, J.D., Ph.D. has served as our General Counsel and Senior Vice President of Intellectual Property since July 2011, and had previously served as our Vice President, Legal Affairs, Licensing and Intellectual Property since July 2010. Prior to joining Intermolecular, he was General Counsel and Senior Vice President of Intellectual Property at Robert Bosch Healthcare Inc. (formerly known as Health Hero Network Inc.) from January 2006 to July 2010. Prior to Robert Bosch Healthcare Inc., he held several senior management positions at LSI Logic, Inc. from August 1995 to January 2006, including Vice President, Chief IP Counsel, Assistant Corporate Secretary and Assistant General Counsel. From October 1989 to August 1995, Dr. Jaggi worked for Lockheed Martin at NASA's Stennis Space Center in Mississippi and NASA's Johnson Space Center in Houston, Texas, where he held several positions including Project Leader, Principal Engineer and Senior Scientist. During his time in Houston, he founded ETS Inc., which commercialized space based-technologies for NASA and the U.S. Navy. He obtained a J.D. with a specialization in intellectual property law from Santa Clara University and also holds a B.Tech. in Electrical Engineering from the Indian Institute of Technology, New Delhi, and an M.S. and Ph.D. in Electrical Engineering from Tulane University. As of September 1, 2011, he held 13 pending or issued U.S. patents and is licensed to practice law in the state of California and before the United States Patent and Trademark Office.
Zia Malik has served as our Senior Vice President, Global Sales and Marketing since May 2011. Prior to joining Intermolecular, he was the founder and Chief Executive Officer of Princely Solar LLC (Princely Solar) from July 2007 to May 2011, and remains a member of Princely Solar's board of directors. Prior to Princely Solar, Mr. Malik held the position of Vice President of Worldwide Sales at PDF Solutions, Inc. from December 2003 to June 2007, where he executed that company's strategy to expand sales into Singapore, Korea and China. Mr. Malik also served as Vice President of Operations at Ishoni Networks from September 2003 to December 2003, and as the Director, Foundry and Contracts Management Group at National Semiconductor Corporation from February 1997 to September 2000. While at National Semiconductor Corporation, Mr. Malik managed the company's diverse contract manufacturing portfolio and was responsible for all technical functions associated with the technology transfer agreements for the company's domestic and international foundries. Mr. Malik obtained a M.S. in Chemistry from the University of Karachi and a master's degree in business administration from the University of Phoenix.
Directors
Thomas R. Baruch has served as a member of our board of directors since November 2004. Mr. Baruch is the founder and a partner emeritus of CMEA Ventures, a venture capital firm that was established in 1989 as an affiliated fund of New Enterprise Associates. Mr. Baruch brings to our board of directors an extensive knowledge of the clean technology industry and experience he has gained working closely with entrepreneurs to build industry-leading companies in the clean-energy industry, as well as years of public company governance experience. Mr. Baruch currently works with various clean technology companies, including serving as a member of the board of directors for FORO Energy, a
96
company developing a new hybrid thermal mechanical drilling technology for geothermal energy wells, as the Chairman of the board of directors of Cnano Technology Limited, a leading nanomaterial company that manufactures and develops carbon nanotubes for advanced energy and other applications, and as the Chairman of the board of directors of Wildcat Discovery Technologies, Inc., a company focused on the discovery of advanced materials for clean-energy technology applications. In addition, Mr. Baruch is currently on the board of directors of Codexis, Inc., where he is Chairman and also serves on the audit, compensation and nominating and corporate governance committees of the board of directors, and Entropic Communications, Inc., where he serves on the compensation and nominating and corporate governance committees of the board of directors. Before starting CMEA Ventures, Mr. Baruch was a founder and Chief Executive Officer of Microwave Technology, Inc., a supplier of gallium arsenide integrated circuits. Prior to his employment with Microwave Technology, Inc., Mr. Baruch managed a dedicated venture fund at Exxon Corporation, and was president of the Exxon Materials Division. Earlier in his career, Mr. Baruch worked as a patent attorney and remains a registered patent attorney. He is also both a member of the Executive Committee of the Council of Competitiveness and a member of the Steering Committee of the ESIS Initiative (Energy, Security, Innovation and Sustainability) of the Council of Competitiveness. Mr. Baruch is a member of the board of trustees of Rensselaer Polytechnic Institute, the National Advisory Council on Innovation and Entrepreneurship and the Sierra's Club Climate Recovery Cabinet. Mr. Baruch holds a B.S. in engineering from Rensselaer Polytechnic Institute and a J.D. from Capital University.
Marvin D. Burkett has served as a member of our board of directors since June 2011. A 40-year veteran of the semiconductor industry, Mr. Burkett brings to our board of directors years of experience with global semiconductor and personal computing companies, as well as in-depth knowledge of public company financial and accounting principles. Mr. Burkett served as Senior Advisor to NVIDIA Corporation (NVIDIA) from February 2009 until January 2011. Previously, he began at NVIDIA in August 2002 and served as its Chief Financial Officer from September 2002 to February 2009. Prior to NVIDIA, Mr. Burkett served as the Chief Financial Officer of Arcot Systems, Inc., and also as its Financial Consultant from February 2000 to September 2002. Mr. Burkett also served as an Executive Vice President and Chief Financial Officer of Packard Bell NEC (PBNEC) from 1998 to 1999. Prior to PBNEC, he spent 26 years at AMD from 1972 to 1998, where he served in a variety of positions, including Chief Financial Officer, Senior Vice President, Chief Administrative Officer and Corporate Controller. Mr. Burkett also worked in the Semiconductor Division of Raytheon Company. Mr. Burkett has served as a member of the board of directors and the chair for the audit committee of the board of directors for each of Audience, Inc., since September 2010, G2 Holdings Corporation since January 2011 and NetLogic Microsystems, Inc., since December 2010. Mr. Burket has also served as a member of the board of directors for Entegris, Inc., since May 2010, where he is also the chair for the audit committee and a member of the compensation committee. Mr. Burkett holds a master's degree in business administration and a BS degree in applied mathematics and business administration, both from the University of Arizona.
Irwin B. Federman has served as a member of our board of directors since June 2005. Mr. Federman brings to our board of directors an extensive knowledge of the semiconductor industry as well as public company governance experience. Mr. Federman has been a managing member at U.S. Venture Partners, a venture capital firm, since April 1990. Mr. Federman was President and Chief Executive Officer of Monolithic Memories, Inc., a semiconductor company, from 1979 to 1987, where he also served as the Chief Financial Officer from 1970 to 1979. Mr. Federman also serves on the board of directors and as a member of the audit and compensation committees of the board of directors for each of SanDisk Corporation, Check Point Software Technologies Ltd., a security software company, and Mellanox Technologies, Ltd., a semiconductor company. Mr. Federman also serves on the board of directors for various private corporations, including Neoconix, Inc., ON24, Inc., Silego Technology, Inc. and Supply Frame, Inc., as well as charitable trusts, including the San Francisco Ballet,
97
the Brooklyn College Foundation and the San Francisco Museum of Modern Art. Previously, Mr. Federman served as a director of Centillium Communications, Inc., a developer and supplier of communications integrated circuits, and Nuance Communications, Inc., a speech recognition software company. Mr. Federman holds a B.S. in Economics from Brooklyn College and was awarded an Honorary Doctorate of Engineering from Santa Clara University.
Isy Goldwasser has served as a member of our board of directors since August 2008. Mr. Goldwasser has been an entrepreneur-in-residence at Khosla Ventures since April 2011 and is an investor in the life sciences and energy industries. Mr. Goldwasser has also been an independent consultant providing technical and business advisory services for Accelyrs, Inc. (Accelrys) since April 2011. Mr. Goldwasser brings to our board of directors an in-depth knowledge of and years of investment experience in the life sciences and energy industries. Mr. Goldwasser served as advisor to the Chief Executive Officer of Accelrys from July 2010 to April 2011, following the merger of Symyx Technologies, Inc. (Symyx) and Accelrys. He was the first employee of Symyx at its founding in 1995, and became its President in 1998 and its Chief Executive Officer in June 2007. Mr. Goldwasser also serves on the board of directors of Kalypsys, Inc. Mr. Goldwasser holds a B.S. in chemical engineering from the Massachusetts Institute of Technology and an M.S. degree in chemical engineering from Stanford University.
Bruce M. McWilliams has served as a member of our board of directors since March 2005. Dr. McWilliams brings to our board of directors broad experience in the electronics manufacturing and clean technology sectors as well as extensive management experience. Dr. McWilliams has served as Chief Executive Officer of SuVolta, Inc., a developer of low-power, high-performance integrated circuit technology, since June 2009. Dr. McWilliams also served as a director of Tessera Technologies, Inc. from 1999 to January 2011, where he previously served as its Chief Executive Officer from June 1999 to September 2008 and Chief Strategic Officer from September 2008 to March 2009. Dr. McWilliams also founded and served as Chief Executive Officer of SVision LLC, a silicon chip-based display company, from 1996 to 1999. His management experience also includes serving as Senior Vice President at Flextronics International, or Flextronics, from 1995 to 1996, a position he assumed upon Flextronics' acquisition of nCHIP, Inc., a multi-chip module packaging company that he co-founded and led as Chief Executive Officer from 1989 to 1995. He currently serves on the board of directors of NemoTEK Technologies, a mobile phone camera manufacturing company, REEL Solar, Inc., a solar heating technology company, and NovaTorque, Inc., a magnet motor design company, and is also a trustee of Carnegie Mellon University and a member of its advisory boards for Physics and Human and Computer Interaction. He holds B.S., M.S. and Ph.D. degrees in physics from Carnegie Mellon University.
George M. Scalise has served as a member of our board of directors since December 2004. Mr. Scalise brings to our board of directors extensive knowledge of the semiconductor industry and market analysis. Mr. Scalise served as President Emeritus of the Semiconductor Industry Association, or SIA, an association of semiconductor manufacturers and suppliers, from July 2010 to December 2010. Mr. Scalise previously worked at Apple Computer, Inc., where he served as Executive Vice President and Chief Administrative Officer from March 1997 to May 1998, and has also held executive management positions at National Semiconductor Corporation, Maxtor Corporation, AMD, Fairchild Semiconductor Corporation and Motorola Semiconductor. Mr. Scalise was Chairman of the Board of the Federal Reserve Bank of San Francisco from May 2003 to December 2005, and also served on President George W. Bush's Council of Advisors on Science and Technology. He currently serves on the boards of directors of MindTree Limited and Cadence Design Systems. He served on the California Council on Science and Technology and was a member of the Joint High-Level Advisory Panel of the United States-Israel Science and Technology Commission, and chaired the Secretary of Energy Advisory Board at the US Department of Energy. Mr. Scalise holds a B.S. in mechanical engineering from Purdue University.
98
John L. Walecka has served as a member of our board of directors since January 2005. Mr. Walecka is a founding partner and has served as a general partner of Redpoint Ventures since its founding in 1999, and brings to our board of directors the extensive experience he has gained working closely with entrepreneurs to build industry-leading companies in emerging cleantech and technology sectors. Prior to founding Redpoint, he was a general partner with Brentwood Venture Capital from 1984 to 1999. Mr. Walecka currently works with Entropic Communications, Inc., where he serves as a member of the board of directors, as well as Fortinet, Inc., where he serves as a member of the board of directors as well as a member of the audit, compensation and nominating and corporate governance committees. Mr. Walecka also serves as a member of the boards of directors of Avnera Corporation, Envia Systems, Inc., Schooner Information Technology, Inc., and Datameer Inc. Mr. Walecka also works with software infrastructure and security products for the enterprise market as well as enabling products for the cable, consumer and broadband markets. Mr. Walecka served as director of the Western Association of Venture Capitalists and is currently a director of the Stanford Business School Venture Capital Trust and an advisor to the Stanford Engineering School. Earlier in his career, he worked for Hewlett Packard Corporation and the Stanford University Smart Product Design Laboratory. He holds B.S. and M.S. degrees in engineering from Stanford, and an MBA from Stanford's Graduate School of Business.
Scientific Advisory Board
We maintain a scientific advisory board consisting of members with experience and expertise in the field of molecular engineering electronics who provide us with consulting services. Our scientific advisory board consists of the following members:
Georges Belfort, Ph.D., is the Russell Sage Endowed Professor of Chemical Engineering in the Howard P. Isermann Department of Chemical and Biological Engineering at Rensselaer Polytechnic Institute. Prior to joining Rensselaer, he spent four years on the faculty of the School of Applied Science at Hebrew University in Jerusalem. Dr. Belfort received his B.S. degree in chemical engineering from the University of Cape Town, and his M.S. and Ph.D. in engineering from the University of California, Irvine. He has won several major awards in separation science, and has made important contributions to the field of surface and interfacial science. He was elected to the National Academy of Engineering in 2003.
James R. Engstrom, Ph.D., is currently the BP Amoco/H. Laurance Fuller Professor in the School of Chemical and Biomolecular Engineering at Cornell University. Since 2002 he has also been a member of the Graduate Field of Chemistry and Chemical Biology. Dr. Engstrom is the recipient of numerous awards, including a 1991 NSF Presidential Young Investigator Award, the Lilly Endowment Teaching Fellowship in 1995, and two College of Engineering Teaching Awards. In 2005 he was made a Fellow of the American Vacuum Society. From 1998 to 2001, he worked for Symyx Technologies, Inc., where he was vice president of high-throughput screening and electronic materials. Presently, Dr. Engstrom's research is focused on inorganic-organic interfaces, and organic thin-film electronics. He earned a B.S. in chemical engineering from the University of Minnesota, and a Ph.D. in chemical engineering from the California Institute of Technology.
J.M.J. Fréchet, Ph.D., is currently Vice President for Research at King Abdullah University of Science and Technology, where he has served since June 2010. Previously, Dr. Fréchet served as the Henry Rapoport Endowed Chair in Organic Chemistry at the Department of Chemistry, University of California, Berkeley. He also serves as scientific director for the Molecular Foundry at Lawrence Berkeley National Laboratory. His research, reported in nearly 1,000 scientific publications and patents, focuses mainly on organic and polymer chemistry applied to nanoscience and nanotechnology, with emphasis on the design, synthesis, fundamental understanding and applications of functional macromolecules. Dr. Fréchet is a member of the National Academy of Sciences and the National Academy of Engineering. In addition to a B.S. in chemical engineering from the Institut de Chimie et
99
Physique Industrielles in Lyon, France, he holds M.S. and Ph.D. degrees in chemistry from Syracuse University and the State University of New York, respectively.
Craig J. Hawker, Ph.D., is director of the Materials Research Laboratory and professor of Materials and Chemistry at the University of California, Santa Barbara. Prior to joining the university, he was a research staff member at the IBM Almaden Research Center in San Jose. Dr. Hawker is editor of the Journal of Polymer Science-Polymer Chemistry, and is an honorary Professor of Chemistry at the University of Queensland. He serves on the scientific advisory boards of Relypsa, Inc., and Warwick Effect Polymers Ltd. He is the recipient of numerous awards, most notably election to the Royal Society, the 2010 MacroUK Award for Outstanding Achievement, and the 2008 DSM International Performance Materials Award. Dr. Hawker's research has focused on the interface between organic and polymer chemistry, with emphasis on the design, synthesis and application of well-defined macromolecular structures in biotechnology, microelectronics, and surface science.
Yoshio Nishi, Ph.D., has been professor of electrical engineering at Stanford University since 2002, and serves as director of research at the Center for Integrated Systems and director of Stanford Site at National Nanotechnology Infrastructure Network. With a Ph.D. in electronics engineering from the University of Tokyo, Dr. Nishi has worked at the senior level with Toshiba R&D for VLSI memory technology and Si-SiO2 interface physics, Hewlett-Packard Laboratories ULSI Research Lab, and Texas Instruments, Inc. R&D. He has contributed to more than 250 publications, co-authored or edited 11 books, and has been responsible for over 70 Japan and U.S. patents. A fellow of the Institute of Electrical and Electronics Engineers (IEEE) and a member of the Japan Society of Applied Physics and The Electrochemical Society, he has received numerous awards over the past 15 years.
Ralph G. Nuzzo, Ph.D., a recognized leader in the chemistry of materials, is director of the Frederick Seitz Materials Research Laboratory and the Center for Microanalysis of Materials at the University of Illinois Urbana-Champaign. He also serves as the William H. and Janet Lycan Professor of Chemistry and a Professor of Materials Science and Engineering at the university. Dr. Nuzzo received his B.S. in chemistry from Rutgers University and his Ph.D. in organic chemistry from MIT. After completing his graduate studies, he was a distinguished member of the technical staff in materials research at Bell Laboratories.
J. George Shanthikumar, Ph.D., is Professor of Industrial Engineering and Operations Research at the University of California, Berkeley. He has authored or coauthored more than 250 papers and has coauthored three books, "Stochastic Models of Manufacturing Systems," "Stochastic Orders And Their Applications" and "Stochastic Orders." He is a co-editor of Flexible Services and Manufacturing Journal, and has served on numerous technical journal editorial boards. As a consultant for KLA-Tencor Corp., he worked on joint development projects with semiconductor companies such as AMD, IBM, Intel, LSI Logic, Motorola, Texas Instruments, Toshiba, Fujitsu, TSMC and UMC. He received a B.S. in mechanical engineering from the University of Sri Lanka, and an M.S. and Ph.D. in industrial engineering from the University of Toronto.
Anthony J. Tether, Ph.D., was director of the Defense Advanced Research Projects Agency (DARPA) from 2001 to 2009. Prior to this, Dr. Tether founded The Sequoia Group and served as its Chief Executive Officer and President; he also served as Chief Executive Officer of Dynamics Technology Inc. and in top-level management roles at Science Applications International Corporation and Ford Aerospace Corp. He has also held other positions in the Department of Defense, serving as Director of DARPA's Strategic Technology Office, and as the Director of National Intelligence in the Office of the Secretary of Defense. Dr. Tether has served on Army, Navy and Defense Science Boards, and on the Office of National Drug Control Policy Research and Development Committee. He is a Life Member of IEEE. Dr. Tether received his B.S. in electrical engineering from Rensselaer Polytechnic Institute, and his M.S. and Ph.D. in electrical engineering from Stanford University.
100
W. Henry Weinberg, Ph.D., is an award-winning scientist and advisor to start-ups and venture firms in the chemical space. He currently serves as general editor of the prestigious review journal Surface Science Reports. Previously, he was Chief Technical Officer at Draths Corporation and Chief Technology Officer at Symyx. For more than 24 years, he was on the faculty of both the California Institute of Technology and the University of California, Santa Barbara. Dr. Weinberg was also principal investigator in the US-USSR Exchange Program in Chemical Catalysis between 1974 and 1980, and has served on many review panels for industrial, academic and governmental organizations. He holds a B.S. degree in chemical engineering from the University of South Carolina, and a Ph.D. in chemical engineering from the University of California, Berkeley.
Board Composition
In accordance with our amended and restated certificate of incorporation to take effect following the completion of this offering, our board of directors will be divided into three classes with staggered three-year terms. At each annual meeting of stockholders, the successors to directors whose terms then expire will be elected to serve from the time of election and qualification until the third annual meeting following their election. After the completion of this offering, our directors will be divided among the three classes as follows:
- •
- the Class I directors will be ,
and , and their terms will expire at
the annual meeting of stockholders to be held in 2012;
- •
- the Class II directors will be ,
and , and their terms will expire at
the annual meeting of stockholders to be held in 2013; and
- •
- the Class III directors will be , and , and their terms will expire at the annual meeting of stockholders to be held in 2014.
Our amended and restated certificate of incorporation will provide that the authorized number of directors may be changed only by resolution of the board of directors. Any additional directorships resulting from an increase in the number of directors will be distributed among the three classes so that, as nearly as possible, each class will consist of one-third of the directors. The division of our board of directors into three classes with staggered three-year terms may delay or prevent a change of our management or a change of control at our company.
Voting Arrangements
Pursuant to a voting agreement that we entered into with certain holders of our common stock and certain holders of our redeemable convertible preferred stock:
- •
- CMEA Ventures VI, L.P. (or its affiliates) has the right to nominate a director to our board of directors;
- •
- Redpoint Ventures II, L.P. (or its affiliates) has the right to nominate a director to our board of directors;
- •
- U.S. Venture Partners IX, L.P. (or its affiliates) has the right to nominate a director to our board of directors;
- •
- Symyx Technologies, Inc. (or its affiliates) (Symyx) has the right to nominate a director to our board of
directors, subject to approval by our board of directors in the event such nominee is not the then-current Chairman, Chief Executive Officer, President or Chief Operating Officer of Symyx;
- •
- our then-incumbent Chief Executive Officer has the right to be nominated to serve on our board of directors; and
101
- •
- the holders of a majority of our common stock and the holders of a majority of our redeemable convertible preferred stock, in each case voting as a separate class, have the right to nominate two directors to our board of directors,
and the holders of our common stock and redeemable convertible preferred stock who are parties to the voting agreement are obligated to vote for such nominee. The provisions of this voting agreement will terminate upon the completion of this offering and there will be no further contractual obligations regarding the election of our directors. Our directors hold office until their successors have been elected and qualified or appointed, or the earlier of their death, resignation or removal.
Director Independence
Upon the completion of this offering, our common stock will be listed on either the Nasdaq Global Market or the New York Stock Exchange. Under the rules of The Nasdaq Stock Market and the New York Stock Exchange, independent directors must comprise a majority of a listed company's board of directors within a specified period of the completion of this offering. In addition, the rules of The Nasdaq Stock Market and the New York Stock Exchange require that, subject to specified exceptions, each member of a listed company's audit, compensation and nominating and governance committees be independent. Audit committee members must also satisfy the independence criteria set forth in Rule 10A-3 under the Securities Exchange Act of 1934, as amended. Under the rules of The Nasdaq Stock Market and the New York Stock Exchange, a director will only qualify as an "independent director" if, in the opinion of that company's board of directors, that person does not have a relationship that would interfere with the exercise of independent judgment in carrying out the responsibilities of a director.
To be considered independent for purposes of Rule 10A-3, a member of an audit committee of a listed company may not, other than in his or her capacity as a member of the audit committee, the board of directors, or any other board committee: (1) accept, directly or indirectly, any consulting, advisory, or other compensatory fee from the listed company or any of its subsidiaries; or (2) be an affiliated person of the listed company or any of its subsidiaries.
In , our board of directors undertook a review of its composition, the composition of its committees and the independence of each director. Based upon information requested from and provided by each director concerning his background, employment and affiliations, including family relationships, our board of directors has determined that none of Messrs. Baruch, Burkett, Federman, Scalise and Walecka or Dr. McWilliams, representing six of our eight directors, has a relationship that would interfere with the exercise of independent judgment in carrying out the responsibilities of a director and that each of these directors is "independent" as that term is defined under the rules of The Nasdaq Stock Market or the New York Stock Exchange. Our board of directors also determined that Messrs. Burkett and Scalise and Dr. McWilliams, who comprise our audit committee, Messrs. Baruch, Federman and Walecka, who comprise our compensation committee, and Messrs. Baruch and Scalise and Dr. McWilliams, who comprise our nominating and governance committee, satisfy the independence standards for those committees established by applicable SEC rules and the rules of The Nasdaq Stock Market and the New York Stock Exchange. In making this determination, our board of directors considered the relationships that each non-employee director has with our company and all other facts and circumstances our board of directors deemed relevant in determining their independence, including the beneficial ownership of our capital stock by each non-employee director.
Board Committees
Our board of directors has the following committees: an audit committee, a compensation committee and a nominating and corporate governance committee. The composition and
102
responsibilities of each committee are described below. Members serve on these committees until their resignation or until otherwise determined by our board of directors.
Audit Committee
Our audit committee oversees our corporate accounting and financial reporting process. Among other matters, the audit committee: appoints the independent registered public accounting firm; evaluates the independent registered public accounting firm's qualifications, independence and performance; determines the engagement of the independent registered public accounting firm; reviews and approves the scope of the annual audit and the audit fee; discusses with management and the independent registered public accounting firm the results of the annual audit and the review of our quarterly consolidated financial statements; approves the retention of the independent registered public accounting firm to perform any proposed permissible non-audit services; monitors the rotation of partners of the independent registered public accounting firm on our engagement team as required by law; reviews our consolidated financial statements and our management's discussion and analysis of financial condition and results of operations to be included in our annual and quarterly reports to be filed with the SEC; reviews our critical accounting policies and estimates; and annually reviews the audit committee charter and the committee's performance. The current members of our audit committee are Messrs. Burkett and Scalise and Dr. McWilliams. Mr. Burkett serves as the chairman of the committee. All members of our audit committee meet the requirements for financial literacy under the applicable rules and regulations of the SEC, The Nasdaq Stock Market and the New York Stock Exchange. Our board of directors has determined that Mr. Burkett is an audit committee financial expert as defined under the applicable rules of the SEC and has the requisite financial sophistication as defined under the applicable rules and regulations of The Nasdaq Stock Market and the New York Stock Exchange. Each of the members of our audit committee qualifies as an independent director under the applicable rules and regulations of the SEC, The Nasdaq Stock Market and the New York Stock Exchange relating to audit committee independence. The audit committee operates under a written charter that satisfies the applicable standards of the SEC, The Nasdaq Stock Market and the New York Stock Exchange.
Compensation Committee
Our compensation committee reviews and recommends policies relating to compensation and benefits of our officers and employees. The compensation committee reviews and approves corporate goals and objectives relevant to compensation of our Chief Executive Officer and other executive officers, evaluates the performance of these officers in light of those goals and objectives, and sets the compensation of these officers based on such evaluations. The compensation committee also approves grants of stock options and other awards under our stock plans. The compensation committee will review and evaluate, at least annually, the performance of the compensation committee and its members, including compliance of the compensation committee with its charter. The current members of our compensation committee are Messrs. Baruch, Federman and Walecka. Mr. Baruch serves as the chairman of the committee. Each of the members of our compensation committee is an independent or outside director under the applicable rules and regulations of the SEC, The Nasdaq Stock Market, the New York Stock Exchange and the Internal Revenue Code of 1986, as amended relating to compensation committee independence. The compensation committee operates under a written charter.
Nominating and Corporate Governance Committee
The nominating and corporate governance committee is responsible for making recommendations to our board of directors regarding candidates for directorships and the size and composition of our board of directors. In addition, the nominating and corporate governance committee is responsible for overseeing our corporate governance policies and reporting and making recommendations to our board
103
of directors concerning governance matters. The current members of our nominating and corporate governance committee are Messrs. Baruch and Scalise and Dr. McWilliams. Mr. Baruch serves as the chairman of the committee. Each of the members of our nominating and corporate governance committee is an independent director under the applicable rules and regulations of the SEC, The Nasdaq Stock Market and the New York Stock Exchange relating to nominating and corporate governance committee independence. The nominating and corporate governance committee operates under a written charter.
There are no family relationships among any of our directors or executive officers.
Compensation Committee Interlocks and Insider Participation
None of the members of our compensation committee has at any time during the prior three years been an officer or employee of ours. None of our executive officers currently serves or in the prior three years has served as a member of the board of directors or compensation committee of any entity that has one or more executive officers serving on our board of directors or compensation committee.
Code of Business Conduct and Ethics
We will adopt a code of business conduct and ethics that applies to all of our employees, officers and directors, including those officers responsible for financial reporting. The code of business conduct and ethics will be available on our website at www.intermolecular.com. Any amendments to the code, or any waivers of its requirements, will be disclosed on our website. Information contained on or accessible through our website is not incorporated by reference into this prospectus, and you should not consider information contained on or accessible through our website to be part of this prospectus.
104
Compensation Discussion and Analysis
This section discusses the principles underlying our policies and decisions with respect to the compensation of our executive officers who are named in the "2010 Summary Compensation Table" and the most important factors relevant to an analysis of these policies and decisions. In 2010, our "named executive officers" were as follows:
- •
- David. E. Lazovsky, Chief Executive Officer and President;
- •
- Peter L. Eidelman, Chief Financial Officer;
- •
- Tony P. Chiang, Chief Technology Officer;
- •
- J. Craig Hunter, Senior Vice President and General Manager, Clean Energy Group; and
- •
- Sandeep Jaggi, General Counsel and Senior Vice President of Intellectual Property.
The titles above reflect promotions received by Mr. Hunter and Dr. Jaggi in July 2011. In 2010, Mr. Hunter's principal position was Vice President and General Manager, Clean Energy Technologies, and Dr. Jaggi's position was Vice President, Legal Affairs, Licensing and Intellectual Property.
The following discussion and analysis of compensation arrangements of our named executive officers should be read together with the compensation tables and related disclosures set forth below. This discussion may contain forward-looking statements that are based on our current plans, considerations, expectations and determinations regarding future compensation programs. Actual compensation programs that we adopt following the completion of this offering may differ materially from the currently-planned programs summarized in this discussion.
Determination of Compensation
Roles of Our Compensation Committee and Chief Executive Officer in Compensation Decisions
Our compensation committee is responsible for overseeing our executive compensation program, as well as determining and approving the ongoing compensation arrangements for our Chief Executive Officer and other named executive officers. The compensation committee meets periodically throughout the year to review and determine adjustments, if any, to the compensation, including base salary, annual bonus and long-term equity awards, for our named executive officers, including our Chief Executive Officer. For 2010, the compensation committee determined each individual component of compensation for our named executive officers. Following the completion of this offering, the compensation committee will continue to oversee the review process for all named executive officers.
Our Chief Executive Officer evaluates the individual performance and contributions of each other named executive officer and, at least annually, reports to the compensation committee his recommendations regarding each element of the other named executive officers' compensation. Our Chief Executive Officer does not participate in any formal discussion with the compensation committee regarding decisions on his own compensation and recuses himself from meetings when his compensation is discussed.
We do not generally rely on formulaic guidelines for determining the mix or levels of cash and equity-based compensation, but rather maintain a flexible compensation program that allows us to adapt components and levels of compensation to motivate and reward individual named executive officers within the context of our desire to attain financial and operational goals. Subjective factors considered in compensation determinations include a named executive officer's skills and capabilities, contributions as a member of the executive management team, contributions to our overall performance and whether the total compensation potential and structure is sufficient to ensure the
105
retention of a named executive officer when considering the compensation potential that may be available elsewhere.
Competitive Market Data and Engagement of Compensation Consultants
The market for experienced management is highly competitive in our industry. Our goal is to attract and retain the most highly qualified executives to manage each of our business functions. In doing so, we draw upon a pool of talent that is highly sought after both by large and established technology companies in our geographic area and by other competitive companies in development or early stage phases. Established organizations in our industry seek to recruit top talent from emerging companies in the sector just as smaller organizations look to attract and retain the best talent from the industry as a whole. The competition for technical and non-technical skills is aggressive across the sector and we expect it to remain aggressive for the foreseeable future.
Our compensation committee determines compensation for our named executive officers, in large part based upon our financial resources, but also considering competitive market data. Prior to 2010, in making compensation determinations the compensation committee relied on the recommendations from our Chief Executive Officer and the experience of its members in similar companies. In setting both cash and equity compensation for 2010, our compensation committee conducted a review of our named executive officer compensation, as well as the mix of elements used to compensate our named executive officers, and compared this compensation information with data contained in third-party surveys produced by Thelander and Radford. The surveys compiled executive compensation data primarily from private technology and life sciences companies and reported such data on an aggregate basis. The surveys reported compensation, position and responsibilities of executives. While our compensation committee reviewed compensation levels and elements derived from this supplemental industry data, our compensation committee was not aware of the identity of any of the surveyed companies and, as such, did not rely on data for any single company.
Historically, our compensation committee has not engaged the services of a compensation consultant; however, in connection with this offering, our compensation committee has engaged a compensation consultant directly to assist the committee in designing programs and setting compensation levels that are appropriate for a public company.
Executive Compensation Philosophy and Objectives
We operate in the highly competitive and dynamic technology industry, which is characterized by frequent technological advances and rapidly changing market requirements. To succeed in this environment, we must continuously develop and refine new and existing products and services, and to achieve these objectives, we need a highly talented and seasoned team of technical, sales, marketing, operations, financial and other business professionals. Our executive compensation philosophy recognizes that, given that the market for experienced management is highly competitive in our industry, key and core to our success is our ability to attract and retain the most highly-qualified executives to manage each of our business functions. We regard as fundamental that executive officer compensation be structured to provide competitive base salaries and benefits to attract and retain superior employees, and to provide incentive compensation to motivate executive officers to attain, and to reward executive officers for attaining, established financial, operational and other goals that are consistent with increasing stockholder value.
In determining the form and amount of compensation payable to the named executive officers, we are guided by the following objectives and principles:
- •
- Compensation levels should be competitive to attract and retain key executives. We aim to provide an executive compensation program that attracts, motivates and retains high performance individuals and rewards them for our achieving and maintaining a competitive position in our
106
- •
- Compensation should relate directly to performance, and incentive compensation should constitute a
significant portion of total compensation. We aim to foster a pay-for-performance culture, with a significant portion of total compensation being "at
risk." Accordingly, a significant portion of total compensation should be tied to and vary with our financial, operational and strategic performance, as well as individual performance. Executives with
greater roles and the ability to directly impact our strategic goals and long-term results should bear a greater proportion of the risk that these goals and results are not achieved. The
amount of "at risk pay" is determined accordingly.
- •
- Long-term incentive compensation should align executives' interests with our stockholders' interests. Awards of long-term incentives, including equity-based compensation, encourage executives to focus on our long-term growth and prospects and incentivize executives to manage the company from the perspective of stockholders with a meaningful stake in our success, as well as to focus on long-term career orientation.
industry. Total compensation (i.e., maximum achievable compensation) should increase with position and responsibility.
We design the principal components of our executive compensation program to fulfill one or more of the principles and objectives described above. Compensation for our named executive officers consists of the elements identified in the following table:
Compensation
Element
|
Primary Objective | |
|---|---|---|
Base salary |
To recognize ongoing performance of job responsibilities and as a necessary tool in attracting and retaining employees | |
Annual performance-based cash compensation (bonuses) |
To emphasize corporate and individual objectives and provide reward opportunities for our named executive officers (and employees generally) when key business and individual objectives are met |
|
Long-term equity incentive compensation |
To incentivize and reward increases in stockholder value, to emphasize and reinforce our focus on team success and to attract and retain key employees |
|
Retirement savings (401(k)) plan |
To provide retirement savings in a tax-efficient manner |
|
Health and welfare benefits |
To provide a basic level of protection from health, dental, life and disability risks |
We view the components of our executive compensation program as related but distinct, and we regularly reassess the total compensation of our named executive officers to ensure that our overall compensation objectives are met. Historically, not all components have been provided to our named executive officers. We have considered, but not relied exclusively upon, the following factors in determining the appropriate level for each compensation component: our understanding of the competitive market based on the collective experience of members of our compensation committee and their review of compensation surveys; our recruiting and retention goals; our view of internal equity and consistency; the length of service of our executive officers; our overall performance and other considerations our compensation committee determines are relevant.
Each of the primary elements of our executive compensation program is discussed in more detail below. While we have identified particular compensation objectives that each element of executive compensation serves, our compensation programs are designed to be flexible and complementary and
107
to collectively serve all of the executive compensation objectives described above. Accordingly, whether or not specifically mentioned below, we believe that, as a part of our overall executive compensation policy, each individual element, to a greater or lesser extent, serves each of our compensation objectives and that, collectively, they are effective in achieving our overall objectives.
Elements of Executive Compensation Program
The following describes the primary components of our executive compensation program for each of our named executive officers, the rationale for that component and how compensation amounts are determined.
Base Salary
We provide our executive officers, including our named executive officers, with a base salary to compensate them for services rendered to our company during the fiscal year. The base salary payable to each named executive officer is intended to provide a fixed component of compensation reflecting the executive's skill set, experience, role and responsibilities. Generally, initial base salary amounts were established based on consideration of, among other factors, the scope of the named executive officer's responsibilities, years of service and the compensation committee's general knowledge of the competitive market based on, among other things, experience with other companies and our industry.
Thereafter, the base salaries of our named executive officers have been reviewed annually by the compensation committee and merit salary increases have been made as deemed appropriate based on such factors as the scope of an executive officer's responsibilities, individual contribution, prior experience and sustained performance.
In February 2010, the compensation committee approved a base salary increase of 3.5% for each of our named executive officers other than Dr. Chiang, who received an increase of 8%. The base salary increases were partially merit-based and also reflected a cost of living adjustment for each of our named executive officers. Dr. Chiang received a larger salary increase based on his significant contributions to us in 2009, reflecting his increased responsibilities with respect to managing our engineering and technology divisions. The actual base salaries paid to the named executive officers during 2010 are set forth in the "2010 Summary Compensation Table" below.
In February 2011, the compensation committee approved base salary increases of 22.3%, 8.5%, 8.2% and 8.7%, for Messrs. Lazovsky, Eidelman and Hunter and Dr. Chiang, respectively. The base salary increases reflected the compensation committee's review of compensation survey data and the experience of its members with similar companies.
Annual Performance-Based Compensation
We use cash bonuses to motivate our named executive officers to achieve our short-term financial and strategic objectives while making progress towards our longer-term growth and other goals.
We provide cash bonuses to incentivize named executive officers to achieve annual corporate performance goals. All of our named executive officers are eligible for annual cash bonuses, which are determined annually at the discretion of the compensation committee. Determination of the bonus payouts for the named executive officers is based on funding of our company-wide bonus pool. For 2010, the bonus pool was funded based on our achievement of pre-established targets. A base bonus pool was established at a level of 8% of our base salary accrual. Our compensation committee established the target size of the bonus pool based upon the experience of its members with similar companies and after reviewing the compensation surveys. The achievement of each corporate performance objective target was weighted, such that the available bonus pool would be determined by multiplying the percentage of corporate performance objectives actually achieved (as determined based
108
on the respective weighting of each objective) by the base bonus pool. The table below sets forth the 2010 pre-established corporate performance targets and relevant weighting:
2010 Corporate Performance Objectives
|
Weighting of Corporate Performance Objectives |
|||
|---|---|---|---|---|
Positive pro forma profit |
6.66 | % | ||
EBITDA profit greater than 10% |
6.67 | % | ||
2010 year-end cash greater than $20 million |
6.67 | % | ||
Bookings greater than $50 million |
30 | % | ||
Revenue greater than $40 million |
15 | % | ||
Customer production qualification milestone |
10 | % | ||
Customer qualification milestone |
10 | % | ||
Customer HPC-derived product revenue greater than $10 million |
7.5 | % | ||
HPC WF and Informatics license renewals greater than $5.3 million |
7.5 | % | ||
In order to be considered in determining the size of the bonus pool, we must achieve at least 80% of the goal of certain performance objectives, such as bookings greater than $50 million and revenue greater than $40 million; other performance objectives, such as positive pro forma profit, require achievement of the stated goal in order to be considered in determining the size of the bonus pool. Based on our achievement of each performance objective, the weighting of the performance objective may be increased or decreased as determined by the compensation committee in its discretion. Based on our actual achievement in 2010 of 98% of the corporate performance objectives, in early 2011, the compensation committee established a bonus pool equal to 8% of our base salary accrual, or approximately $1.2 million, of which 40% was reserved for executive management, including named executive officers. The compensation committee in its discretion determines the size of our Chief Executive Officer's cash bonus award. Except with respect to himself, our Chief Executive Officer recommends the size of the cash bonus award for each named executive officer, but each award is ultimately determined by the compensation committee in its discretion. One factor considered in making bonus determinations was the compensation committee's performance review of our executive officers, which accounts for, among other things, the executive's initiative, teamwork, management skills and communications. The cash bonuses paid to our named executive officers for the 2010 fiscal year are set forth in the "2010 Summary Compensation Table" below.
In addition, in the first quarter of 2010, we awarded a $110,000 discretionary cash bonus to Mr. Lazovsky based on the successful execution of a multi-year customer contract. As he was eligible to receive a cash bonus upon execution of the contract, we did not award Mr. Lazovsky a separate discretionary annual cash bonus under our 2009 bonus pool for services rendered in 2009.
Long-Term Equity-Based Incentives
The goals of our long-term equity-based awards are to reward and encourage long-term corporate performance based on the value of our common stock and, thereby, to align the interests of our executive officers, including our named executive officers, with those of our stockholders. Our board of directors adopted the 2004 Equity Incentive Plan (amended and restated on September 5, 2007), or the 2004 Plan, in order to attract and retain the best available personnel for positions of substantial responsibility, to provide additional incentives to our employees, consultants and non-employee directors and to promote the success of our business. The 2004 Plan provides for the grant of stock options and restricted stock.
We intend to adopt a 2011 Equity Incentive Award Plan, or the 2011 Plan, which will be effective upon the consummation of this offering. Upon the effectiveness of the 2011 Plan, no further grants will
109
be made under the 2004 Plan. For additional information regarding the 2004 Plan and the 2011 Plan, see the section entitled "—Equity Incentive Plans" below. We do not currently have any formal stock ownership requirements or guidelines for our named executive officers, given the limited market for our securities. Our compensation committee will continue to periodically review best practices and re-evaluate our position with respect to such requirements or guidelines.
Equity Award Features. Historically we have granted stock options to our named executive officers. Since our named executive officers are able to benefit from stock options only if the market price of our common stock increases relative to the stock option's exercise price, we believe stock options provide meaningful incentives to our named executive officers to achieve increases in the value of our stock over time and are an effective tool for meeting our compensation goal of increasing long-term stockholder value by tying the value of these stock options to our future performance. We also believe stock option grants encourage the retention of our named executive officers because the vesting of equity awards is largely based on continued employment.
We generally use stock options to compensate our named executive officers in the form of both initial grants in connection with the commencement of employment and additional "incentive" grants. The compensation committee, based on recommendations from our Chief Executive Officer and its review of compensation survey data, approves a pool of shares to be awarded to employees as an annual incentive grant and reserves 25 - 30% of the pool for stock options to be granted to the executive management team. To date, there has been no set program for the award of incentive grants, and our compensation committee retains discretion to make stock option awards to employees at any time, including in connection with the promotion of an employee, to reward an employee, for retention purposes or in other circumstances recommended by management.
The exercise price of each stock option grant is equal to the fair market value of our common stock on the grant date. Since 2007, the determination of the appropriate fair market value of our common stock has been made by our compensation committee. In the absence of a public trading market, our compensation committee has reviewed a common stock valuation analysis prepared by an independent third-party appraiser in determining the fair market value of our common stock. It is our policy that stock options granted after the completion of this offering will have a per share exercise price that is not less than the closing price of a share of our common stock on the grant date. Stock options typically vest over a four-year period as follows: 25% of the shares underlying an option vest on the first anniversary of the vesting commencement date, and the remainder of the shares underlying an option vest in substantially equal monthly installments over the next 36 months. Stock options granted to our named executive officers in 2007 and prior years may be exercised prior to fully vesting but are subject to a right of repurchase by us at the exercise price paid by the named executive officer that lapses pursuant to the vesting schedule of the option. We believe the vesting schedule of our stock options appropriately encourages long-term employment with our company while allowing our executives to realize compensation in line with the value they have created for our stockholders.
In February 2010, each of our named executive officers, other than Mr. Jaggi, was granted an option to purchase shares of our common stock as part of our annual incentive grant program. These options are subject to the vesting terms described in the paragraph immediately above and were granted at an exercise price of $1.33 per share, which was equal to the fair market value of our common stock on the grant date. In August 2010, in connection with the commencement of his employment, Mr. Jaggi was granted an option to purchase 500,000 shares of our common stock at an exercise price of $1.33 per share, which was equal to the fair market value of our common stock on the grant date.
In March 2011, each of our named executive officers was granted an option to purchase shares of our common stock as part of our annual incentive grant program. These options are subject to the vesting terms described above and were granted at an exercise price of $3.10 per share, which was
110
equal to the fair market value of our common stock on the grant date. In determining the size of the incentive grants, the compensation committee approved a pool of 1.2 million shares, of which 30% were reserved for executives. In determining the size of the stock option pool and the allocation to named executive officers, the compensation committee reviewed the compensation survey data and drew upon the experience of its members with similar companies.
Name
|
2010 Stock Option Grants |
March 2011 Stock Option Grants |
|||||
|---|---|---|---|---|---|---|---|
David E. Lazovsky |
375,000 | 105,000 | |||||
Peter L. Eidelman |
200,000 | 50,000 | |||||
Tony P. Chiang |
375,000 | 75,000 | |||||
J. Craig Hunter |
130,000 | 50,000 | |||||
Sandeep Jaggi |
500,000 | 50,000 | |||||
Retirement Savings.
We maintain a retirement savings plan under section 401(k) of the Internal Revenue Code, or the Code, to provide retirement benefits to our eligible employees. The Code allows eligible employees to defer a portion of their compensation, within prescribed limits, which may be on a pre-tax basis through contributions to the 401(k) plan. Historically, the 401(k) plan has been funded entirely with employee contributions; however, in the future, we may match a portion of our employees' annual contributions, within prescribed limits.
Employee Benefits and Perquisites.
All of our full-time employees, including our named executive officers, are eligible to participate in our health and welfare plans, including:
- •
- medical, dental and vision benefits;
- •
- medical and dependent care flexible spending accounts;
- •
- short-term and long-term disability insurance; and
- •
- life insurance.
Tax and Accounting Considerations
Internal Revenue Code Section 162(m). Generally, Section 162(m) of the Code, or Section 162(m), disallows a tax deduction for any publicly-held corporation for individual compensation exceeding $1.0 million in any taxable year to its chief executive officer and each of its other named executive officers, other than its chief financial officer, unless compensation qualifies as "performance-based compensation" within the meaning of the Code. As we are not currently publicly traded, our compensation committee has not previously taken the deductibility limit imposed by Section 162(m) into consideration in setting compensation. Following this offering, we expect that our compensation committee will seek to qualify the variable compensation paid to our named executive officers for an exemption from the deductibility limitations of Section 162(m). As such, in approving the amount and form of compensation for our named executive officers in the future, our compensation committee will consider all elements of the cost to us of providing such compensation, including the potential impact of Section 162(m). However, our compensation committee may, in its judgment, authorize compensation payments that do not comply with the exemptions in Section 162(m) when it believes that such payments are appropriate to attract and retain executive talent.
111
Furthermore, we do not expect Section 162(m) to apply to awards under the 2011 Plan until the earliest to occur of our annual stockholders' meeting in 2015, a material modification of the 2011 Plan or exhaustion of the shares reserved for issuance under the 2011 Plan.
Internal Revenue Code Section 409A. Section 409A of the Code requires that "nonqualified deferred compensation" be deferred and paid under plans or arrangements that satisfy the requirements of the Code with respect to the timing of deferral elections, timing of payments and certain other matters. Failure to satisfy these requirements can expose employees and other service providers to accelerated income tax liabilities, penalty taxes and interest on their vested compensation under such plans. Accordingly, as a general matter, it is our intention to design and administer our compensation and benefits plans and arrangements for all of our employees and other service providers, including our named executive officers, so that they are either exempt from, or satisfy the requirements of, Section 409A of the Code.
Internal Revenue Code Section 280G. Section 280G of the Code, or Section 280G, disallows a tax deduction with respect to excess parachute payments to certain executives of companies which undergo a change in control. In addition, Section 4999 of the Code, or Section 4999, imposes a 20% excise tax on the individual with respect to the excess parachute payment. Parachute payments are compensation linked to or triggered by a change in control and may include, but are not limited to, bonus payments, severance payments, certain fringe benefits, and payments and acceleration of vesting from long-term incentive plans including stock options and other equity-based compensation. Excess parachute payments are parachute payments that exceed a threshold determined under Section 280G based on the executive's prior compensation. In approving the compensation arrangements for our named executive officers in the future, our compensation committee will consider all elements of the cost to the company of providing such compensation, including the potential impact of Section 280G. However, our compensation committee may, in its judgment, authorize compensation arrangements that could give rise to loss of deductibility under Section 280G and the imposition of excise taxes under Section 4999 when it believes that such arrangements are appropriate to attract and retain executive talent.
Accounting for Stock-Based Compensation. We follow Financial Accounting Standards Board Accounting Standards Codification Topic 718, or ASC Topic 718, for our stock-based compensation awards. ASC Topic 718 requires companies to calculate the grant date "fair value" of their stock-based awards using a variety of assumptions. ASC Topic 718 also requires companies to recognize the compensation cost of their stock-based awards in their income statements over the period that an employee is required to render service in exchange for the award. Grants of stock options, restricted stock, restricted stock units and other equity-based awards under our equity incentive award plans will be accounted for under ASC Topic 718. Our compensation committee will regularly consider the accounting implications of significant compensation decisions, especially in connection with decisions that relate to our equity incentive award plans and programs. As accounting standards change, we may revise certain programs to appropriately align accounting expenses of our equity awards with our overall executive compensation philosophy and objectives.
112
Compensation Tables
2010 Summary Compensation Table
The following table sets forth information concerning the compensation of our named executive officers for the year ended December 31, 2010.
Name and Principal Position
|
Year | Salary($) | Bonus($)(3) | Option Awards($)(5) |
Total($) | ||||||||||||
|---|---|---|---|---|---|---|---|---|---|---|---|---|---|---|---|---|---|
David E. Lazovsky |
2010 | 256,875 | 235,000 | (4) | 498,750 | 990,625 | |||||||||||
Chief Executive Officer and President |
|||||||||||||||||
Peter L. Eidelman |
2010 | 234,945 | 72,000 | 266,000 | 572,945 | ||||||||||||
Chief Financial Officer |
|||||||||||||||||
Tony P. Chiang |
2010 | 252,240 | 100,200 | 498,750 | 851,190 | ||||||||||||
Chief Technology Officer |
|||||||||||||||||
J. Craig Hunter(1) |
2010 | 206,417 | 50,100 | 172,900 | 429,417 | ||||||||||||
Senior Vice President and General Manager, |
|||||||||||||||||
Sandeep Jaggi(1)(2) |
2010 | 106,534 | 24,200 | 665,000 | 795,734 | ||||||||||||
General Counsel and Senior Vice President of |
|||||||||||||||||
- (1)
- In
2010, Mr. Hunter's principal position was Vice President and General Manager, Clean Energy Technologies, and Dr. Jaggi's position was Vice
President, Legal Affairs, Licensing and Intellectual Property. Mr. Hunter and Dr. Jaggi were promoted to their current positions in July 2011.
- (2)
- Dr. Jaggi's
2010 salary and bonus reflect his partial-year employment, which commenced on July 12, 2010.
- (3)
- Amounts
represent discretionary annual cash bonuses awarded from our 2010 bonus pool, which was funded based on our achievement of
pre-established corporate performance objectives.
- (4)
- Amount
represents (i) $125,000 attributable to the discretionary annual cash bonus awarded to Mr. Lazovsky for performance of services
rendered in 2010; and (ii) a cash bonus of $110,000 awarded to Mr. Lazovsky based on the successful execution of a multi-year customer contract in the first quarter of 2010.
As Mr. Lazovsky was eligible to receive a cash bonus upon execution of this contract, he was not awarded a separate discretionary annual cash bonus under our 2009 bonus pool for services
rendered in 2009.
- (5)
- Amounts reflect the full grant-date fair value of stock options granted, computed in accordance with ASC Topic 718, rather than the amounts paid to or realized by the named individual. We provide information regarding the assumptions used to calculate the value of all stock option awards made to named executive officers in "Management's Discussion and Analysis of Financial Condition and Results of Operations—Critical Accounting Policies and Estimates—Stock-Based Compensation."
113
Grants of Plan-Based Awards in 2010
The following table sets forth information regarding grants of plan-based awards made to our named executive officers for the year ended December 31, 2010.
Name
|
Grant Date | All Other Option Awards: Number of Securities Underlying Options (# shares)(1) |
Exercise or Base Price of Option Awards Per Share($) |
Grant Date Fair Value of Stock and Options Awards ($)(2) |
||||||||
|---|---|---|---|---|---|---|---|---|---|---|---|---|
David E. Lazovsky |
February 4, 2010 | 375,000 | 1.33 | 498,750 | ||||||||
Peter L. Eidelman |
February 4, 2010 |
200,000 |
1.33 |
266,000 |
||||||||
Tony P. Chiang |
February 4, 2010 |
375,000 |
1.33 |
498,750 |
||||||||
J. Craig Hunter |
February 4, 2010 |
130,000 |
1.33 |
172,900 |
||||||||
Sandeep Jaggi |
August 19, 2010 |
500,000 |
1.33 |
665,000 |
||||||||
- (1)
- Represents
incentive stock options granted pursuant to our 2004 Plan. In August 2010, in connection with the commencement of his employment,
Dr. Jaggi was granted a stock option to purchase 500,000 shares of our common stock.
- (2)
- Amounts reflect the full grant-date fair value of stock options granted during 2010 computed in accordance with ASC Topic 718, rather than the amounts paid to or realized by the named individual. We provide information regarding the assumptions used to calculate the value of all stock option awards made to executive officers in "Management's Discussion and Analysis of Financial Condition and Results of Operations—Critical Accounting Policies and Estimates—Stock-Based Compensation."
114
Outstanding Equity Awards at 2010 Fiscal Year-End
The following table summarizes the number of shares of common stock underlying outstanding equity incentive plan awards for each named executive officer as of December 31, 2010.
| |
Option Awards(1)(2) | |||||||||||||||
|---|---|---|---|---|---|---|---|---|---|---|---|---|---|---|---|---|
Name
|
Vesting Commencement Date |
Number of Securities Underlying Unexercised Options (#) Exercisable |
Number of Securities Underlying Unexercised Options (#) Unexercisable |
Option Exercise Price ($) |
Option Expiration Date |
|||||||||||
David E. Lazovsky |
July 9, 2007 |
(3) |
600,000 |
0 |
0.83 |
September 4, 2017 |
||||||||||
|
January 20, 2009 | 191,666 | 208,334 | 1.00 | January 19, 2019 | |||||||||||
|
February 1, 2010 | 0 | 375,000 | 1.33 | February 3, 2020 | |||||||||||
Peter L. Eidelman |
February 27, 2006 |
(3) |
625,000 |
0 |
0.10 |
May 4, 2016 |
||||||||||
|
July 9, 2007 | (3) | 115,000 | 0 | 0.83 | September 4, 2017 | ||||||||||
|
January 20, 2009 | 100,625 | 109,375 | 1.00 | January 19, 2019 | |||||||||||
|
February 1, 2010 | 0 | 200,000 | 1.33 | February 3, 2020 | |||||||||||
Tony P. Chiang |
May 9, 2005 |
(3) |
2,250,000 |
0 |
0.05 |
June 14, 2015 |
||||||||||
|
July 9, 2007 | (3) | 200,000 | 0 | 0.83 | September 4, 2017 | ||||||||||
|
January 20, 2009 | 191,666 | 208,334 | 1.00 | January 19, 2019 | |||||||||||
|
February 1, 2010 | 0 | 375,000 | 1.33 | February 3, 2020 | |||||||||||
J. Craig Hunter |
January 30, 2009 |
335,416 |
364,584 |
1.00 |
February 24, 2019 |
|||||||||||
|
February 1, 2010 | 0 | 130,000 | 1.33 | February 3, 2020 | |||||||||||
Sandeep Jaggi |
July 12, 2010 |
0 |
500,000 |
1.33 |
August 18, 2020 |
|||||||||||
- (1)
- Each
stock option was granted pursuant to our 2004 Plan.
- (2)
- Unless
otherwise noted, these options vest as to 1/4th of the total number of shares subject to the option on the first anniversary of
the vesting commencement date, and as to 1/48th of the total number of shares subject to the option in monthly installments over the three-year period thereafter,
subject to continued service with our company through the applicable vesting dates and accelerated vesting under certain circumstances, as described under the section entitled "Potential Payments Upon
Termination or Change in Control" below.
- (3)
- Contains an early exercise provision permitting the executive to exercise the option prior to vesting, with any unvested shares subject to repurchase by us at the exercise price paid until the shares vest in accordance with the vesting schedule of the option.
2010 Option Exercises and Stock Vested
The Company has not granted any stock awards to its named executive officers. Additionally, our named executive officers did not exercise any stock options during 2010.
Potential Payments Upon Termination or Change in Control
Employment Letters
The employment letters for Mr. Hunter and Dr. Jaggi provide that the 50% of the shares subject to the stock options granted to each executive in connection with entering into their employment letters will accelerate immediately upon a termination of employment without "cause" or for "good reason" within twelve months of a "change in control" (each as defined in the relevant employment letter). Our compensation committee determined to provide these change in control severance arrangements in
115
order to mitigate some of the risk that exists for executives working in a small technology company. These arrangements are intended to attract and retain qualified executives that have alternatives that may appear to them to be less risky absent these arrangements, and to mitigate a potential disincentive to consider and execute any acquisition, particularly where the services of these executives may not be required by the acquirer.
Summary of Potential Payments
The following table summarizes the payments that would be made to certain of our named executive officers upon the occurrence of certain qualifying terminations of employment in connection with a change in control, assuming such named executive officer's termination of employment with us occurred on December 31, 2010 and, where relevant, that a change in control of Intermolecular occurred on December 31, 2010. Amounts shown in the table below do not include (i) accrued but unpaid salary, and (ii) other benefits earned or accrued by the named executive officer during his employment that are available to all salaried employees, such as accrued vacation.
Name
|
Benefit(1) | Termination without Cause or for Good Reason($) |
||||
|---|---|---|---|---|---|---|
J. Craig Hunter |
Value of Accelerated Option Awards | 127,604 | ||||
Sandeep Jaggi |
Value of Accelerated Option Awards | 92,500 | ||||
- (1)
- Represents the aggregate value of the named executive officer's unvested stock options that would have vested on an accelerated basis, determined by multiplying the number of accelerating option shares by the fair market value of our common stock ($1.70) on December 31, 2010 (as determined by our board of directors) and subtracting the applicable exercise prices.
2010 Director Compensation
2010 Non-Employee Director Compensation Program.
In 2010, none of our non-employee directors received cash or equity compensation for their services as a director.
Equity Incentive Plans
2011 Equity Incentive Award Plan
We intend to adopt the 2011 Plan, which will be effective on the date of adoption. The principal purpose of the 2011 Plan is to attract, retain and motivate selected employees, consultants and directors through the granting of stock-based compensation awards and cash-based performance bonus awards. The 2011 Plan is also designed to permit us to make cash-based awards and equity-based awards intended to qualify as "performance-based compensation" under Section 162(m).
The principal features of the 2011 Plan are summarized below. This summary is qualified in its entirety by reference to the text of the 2011 Plan, which is filed as an exhibit to the registration statement of which this prospectus is a part.
Share Reserve. Under the 2011 Plan, shares of our common stock will be initially reserved for issuance pursuant to a variety of stock-based compensation awards, including stock options, stock appreciation rights, or SARs, restricted stock awards, restricted stock unit awards, deferred stock awards, dividend equivalent awards, stock payment awards, performance awards and other stock-based awards, plus the number of shares remaining available for future awards under the 2004 Plan as of the completion of this offering. The number of shares initially reserved for issuance or transfer pursuant to awards under the 2011 Plan will be increased by (i) the number of shares represented by awards
116
outstanding under our 2004 Plan that are forfeited or lapse unexercised and which following the effective date are not issued under the 2004 Plan and (ii) an annual increase on the first day of each fiscal year beginning in 2012 and ending in 2021, equal to the least of (A) shares, (B) percent ( %) of the shares of stock outstanding (on an as converted basis) on the last day of the immediately preceding fiscal year and (C) such smaller number of shares of stock as determined by our board of directors; provided, however, that no more than shares of stock may be issued upon the exercise of incentive stock options.
The following counting provisions will be in effect for the share reserve under the 2011 Plan:
- •
- to the extent that an award terminates, expires or lapses for any reason or an award is settled in cash without the
delivery of shares, any shares subject to the award at such time will be available for future grants under the 2011 Plan;
- •
- to the extent shares are tendered or withheld to satisfy the grant, exercise price or tax withholding obligation with
respect to any award under the 2011 Plan, such tendered or withheld shares will be available for future grants under the 2011 Plan;
- •
- to the extent that shares of our common stock are repurchased by us prior to vesting so that shares are returned to us,
such shares will be available for future grants under the 2011 Plan;
- •
- the payment of dividend equivalents in cash in conjunction with any outstanding awards will not be counted against the
shares available for issuance under the 2011 Plan; and
- •
- to the extent permitted by applicable law or any exchange rule, shares issued in assumption of, or in substitution for, any outstanding awards of any entity acquired in any form of combination by us or any of our subsidiaries will not be counted against the shares available for issuance under the 2011 Plan.
Administration. The compensation committee of our board of directors will administer the 2011 Plan unless our board of directors assumes authority for administration. The compensation committee must consist of at least three members of our board of directors, each of whom is intended to qualify as an "outside director," within the meaning of Section 162(m), a "non-employee director" for purposes of Rule 16b-3 under the Exchange Act and an "independent director" within the meaning of the rules of the Nasdaq Global Market and the New York Stock Exchange, or other principal securities market on which shares of our common stock are traded. The 2011 Plan provides that the compensation committee may delegate its authority to grant awards to employees other than our executive officers and certain of our senior executives to a committee consisting of one or more members of our board of directors or one or more of our officers and the equity awards policy we expect to adopt in 2011 calls for the compensation committee to approve all equity awards, other than awards made to our non-employee directors, which must be approved by our full board of directors.
Subject to the terms and conditions of the 2011 Plan, the administrator has the authority to select the persons to whom awards are to be made, to determine the number of shares to be subject to awards and the terms and conditions of awards, and to make all other determinations and to take all other actions necessary or advisable for the administration of the 2011 Plan. The administrator is also authorized to adopt, amend or rescind rules relating to administration of the 2011 Plan. Our board of directors may at any time remove the compensation committee as the administrator and revest in itself the authority to administer the 2011 Plan. The full board of directors will administer the 2011 Plan with respect to awards to non-employee directors.
Eligibility. Options, SARs, restricted stock and all other stock-based and cash-based awards under the 2011 Plan may be granted to individuals who are then our officers, employees or consultants or are the officers, employees or consultants of certain of our subsidiaries. Such awards also may be granted
117
to our directors. Only employees of our company or certain of our subsidiaries may be granted incentive stock options, or ISOs.
Awards. The 2011 Plan provides that the administrator may grant or issue stock options, SARs, restricted stock, restricted stock units, deferred stock, dividend equivalents, performance awards, stock payments and other stock-based and cash-based awards, or any combination thereof. Each award will be set forth in a separate agreement with the person receiving the award and will indicate the type, terms and conditions of the award.
Nonstatutory Stock Options, or NSOs, will provide for the right to purchase shares of our common stock at a specified price which may not be less than fair market value on the date of grant, and usually will become exercisable (at the discretion of the administrator) in one or more installments after the grant date, subject to the participant's continued employment or service with us and/or subject to the satisfaction of corporate performance targets and individual performance targets established by the administrator. NSOs may be granted for any term specified by the administrator that does not exceed ten years.
Incentive Stock Options will be designed in a manner intended to comply with the provisions of Section 422 of the Code and will be subject to specified restrictions contained in the Code. Among such restrictions, ISOs must have an exercise price of not less than the fair market value of a share of common stock on the date of grant, may only be granted to employees, and must not be exercisable after a period of ten years measured from the date of grant. In the case of an ISO granted to an individual who owns (or is deemed to own) at least 10% of the total combined voting power of all classes of our capital stock, the 2011 Plan provides that the exercise price must be at least 110% of the fair market value of a share of common stock on the date of grant and the ISO must not be exercisable after a period of five years measured from the date of grant.
Restricted Stock may be granted to any eligible individual and made subject to such restrictions as may be determined by the administrator. Restricted stock, typically, may be forfeited for no consideration or repurchased by us at the original purchase price if the conditions or restrictions on vesting are not met. In general, restricted stock may not be sold or otherwise transferred until restrictions are removed or expire. Purchasers of restricted stock, unlike recipients of options, will have voting rights and will have the right to receive dividends, if any, prior to the time when the restrictions lapse, however, extraordinary dividends will generally be placed in escrow, and will not be released until restrictions are removed or expire.
Restricted Stock Units may be awarded to any eligible individual, typically without payment of consideration, but subject to vesting conditions based on continued employment or service or on performance criteria established by the administrator. Like restricted stock, restricted stock units may not be sold, or otherwise transferred or hypothecated, until vesting conditions are removed or expire. Unlike restricted stock, stock underlying restricted stock units will not be issued until the restricted stock units have vested, and recipients of restricted stock units generally will have no voting or dividend rights prior to the time when vesting conditions are satisfied.
Deferred Stock Awards represent the right to receive shares of our common stock on a future date. Deferred stock may not be sold or otherwise hypothecated or transferred until issued. Deferred stock will not be issued until the deferred stock award has vested, and recipients of deferred stock generally will have no voting or dividend rights prior to the time when the vesting conditions are satisfied and the shares are issued. Deferred stock awards generally will be forfeited, and the underlying shares of deferred stock will not be issued, if the applicable vesting conditions and other restrictions are not met.
Stock Appreciation Rights, or SARs, may be granted in connection with stock options or other awards, or separately. SARs granted in connection with stock options or other awards typically will
118
provide for payments to the holder based upon increases in the price of our common stock over a set exercise price. The exercise price of any SAR granted under the 2011 Plan must be at least 100% of the fair market value of a share of our common stock on the date of grant. Except as required by Section 162(m) with respect to a SAR intended to qualify as performance-based compensation as described in Section 162(m), there are no restrictions specified in the 2011 Plan on the exercise of SARs or the amount of gain realizable therefrom, although restrictions may be imposed by the administrator in the SAR agreements. SARs under the 2011 Plan will be settled in cash or shares of our common stock, or in a combination of both, at the election of the administrator.
Dividend Equivalents represent the value of the dividends, if any, per share paid by us, calculated with reference to the number of shares covered by the award. Dividend equivalents may be settled in cash or shares and at such times as determined by the compensation committee or board of directors, as applicable.
Performance Awards may be granted by the administrator on an individual or group basis. Generally, these awards will be based upon specific performance targets and may be paid in cash or in common stock or in a combination of both. Performance awards may include "phantom" stock awards that provide for payments based upon the value of our common stock. Performance awards may also include bonuses that may be granted by the administrator on an individual or group basis and which may be payable in cash or in common stock or in a combination of both.
Stock Payments may be authorized by the administrator in the form of common stock or an option or other right to purchase common stock as part of a deferred compensation or other arrangement in lieu of all or any part of compensation, including bonuses, that would otherwise be payable in cash to the employee, consultant or non-employee director.
Change in Control. In the event of a change in control where the acquiror does not assume or replace awards granted, prior to the consummation of such transaction, awards issued under the 2011 Plan will be subject to accelerated vesting such that 100% of such awards will become vested and exercisable or payable, as applicable. In addition, the administrator will also have complete discretion to structure one or more awards under the 2011 Plan to provide that such awards will become vested and exercisable or payable on an accelerated basis in the event such awards are assumed or replaced with equivalent awards but the individual's service with us or the acquiring entity is subsequently terminated within a designated period following the change in control event. The administrator may also make appropriate adjustments to awards under the 2011 Plan and is authorized to provide for the acceleration, cash-out, termination, assumption, substitution or conversion of such awards in the event of a change in control or certain other unusual or nonrecurring events or transactions. Under the 2011 Plan, a change in control is generally defined as:
- •
- the transfer or exchange in a single transaction or series of related transactions by our stockholders of more than 50% of
our voting stock to a person or group;
- •
- a change in the composition of our board of directors over a two-year period such that 50% or more of the
members of the board of directors were elected through one or more contested elections;
- •
- a merger, consolidation, reorganization or business combination in which we are involved, directly or indirectly, other
than a merger, consolidation, reorganization or business combination which results in our outstanding voting securities immediately before the transaction continuing to represent a majority of the
voting power of the acquiring company's outstanding voting securities and after which no person or group beneficially owns 50% or more of the outstanding voting securities of the surviving entity
immediately after the transaction;
- •
- the sale, exchange, or transfer of all or substantially all of our assets; or
119
- •
- stockholder approval of our liquidation or dissolution.
Adjustments of Awards. In the event of any stock dividend, stock split, combination or exchange of shares, merger, consolidation, spin-off, recapitalization, distribution of our assets to stockholders (other than normal cash dividends) or any other corporate event affecting the number of outstanding shares of our common stock or the share price of our common stock that would require adjustments to the 2011 Plan or any awards under the 2011 Plan in order to prevent the dilution or enlargement of the potential benefits intended to be made available thereunder, the administrator will make appropriate, proportionate adjustments to:
- •
- the aggregate number and type of shares subject to the 2011 Plan;
- •
- the number and kind of shares subject to outstanding awards and terms and conditions of outstanding awards (including,
without limitation, any applicable performance targets or criteria with respect to such awards); and
- •
- the grant or exercise price per share of any outstanding awards under the 2011 Plan.
Amendment. Our board of directors may amend or modify the 2011 Plan at any time and from time to time. However, we must generally obtain stockholder approval:
- •
- to increase the number of shares available under the 2011 Plan (other than in connection with certain corporate events, as
described above);
- •
- to grant options with an exercise price that is below 100% of the fair market value of shares of our common stock on the
grant date;
- •
- to extend the exercise period for an option beyond ten years from the date of grant; or
- •
- to the extent required by applicable law, rule or regulation (including any applicable stock exchange rule).
Notwithstanding the foregoing, an option may be amended to reduce the per share exercise price below the per share exercise price of such option on the grant date and options may be granted in exchange for, or in connection with, the cancellation or surrender of options having a higher per share exercise price without receiving additional stockholder approval.
Termination. The board of directors may terminate the 2011 Plan at any time. No incentive stock options may be granted pursuant to the 2011 Plan after the tenth anniversary of the effective date of the 2011 Plan. Any award that is outstanding on the termination date of the 2011 Plan will remain in force according to the terms of the 2011 Plan and the applicable award agreement.
Securities Laws and U.S. Federal Income Taxes. The 2011 Plan is designed to comply with various securities and U.S. federal tax laws as follows:
Securities Laws. The 2011 Plan is intended to conform to all provisions of the Securities Act and the Exchange Act and any and all regulations and rules promulgated by the SEC thereunder, including without limitation, Rule 16b-3. The 2011 Plan will be administered, and options will be granted and may be exercised, only in such a manner as to conform to such laws, rules and regulations.
Section 409A of the Code. Certain awards under the 2011 Plan may be considered "nonqualified deferred compensation" for purposes of Section 409A of the Code (Section 409A) which imposes certain additional requirements regarding the payment of deferred compensation. Generally, if at any time during a taxable year a nonqualified deferred compensation plan fails to meet the requirements of Section 409A, or is not operated in accordance with those requirements, all amounts deferred under the 2011 Plan and all other equity incentive plans for the taxable year and all preceding taxable years by any participant with respect to whom the failure relates are includible in gross income for the
120
taxable year to the extent not subject to a substantial risk of forfeiture and not previously included in gross income. If a deferred amount is required to be included in income under Section 409A, the amount also is subject to interest and an additional income tax. The interest imposed is equal to the interest at the underpayment rate plus one percentage point, imposed on the underpayments that would have occurred had the compensation been includible in income for the taxable year when first deferred, or if later, when not subject to a substantial risk of forfeiture. The additional U.S. federal income tax is equal to 20% of the compensation required to be included in gross income. In addition, certain states, including California, have laws similar to Section 409A, which impose additional state penalty taxes on such compensation.
Section 162(m) of the Code. In general, under Section 162(m), income tax deductions of publicly held corporations may be limited to the extent total compensation (including, but not limited to, base salary, annual bonus, and income attributable to stock option exercises and other non-qualified benefits) for certain executive officers exceeds $1,000,000 (less the amount of any "excess parachute payments" as defined in Section 280G) in any taxable year of the corporation. However, under Section 162(m), the deduction limit does not apply to certain "performance-based compensation" established by an independent compensation committee that is adequately disclosed to and approved by stockholders. In particular, stock options and SARs will satisfy the "performance-based compensation" exception if the awards are made by a qualifying compensation committee, the 2011 Plan sets the maximum number of shares that can be granted to any person within a specified period and the compensation is based solely on an increase in the stock price after the grant date. Specifically, the option exercise price must be equal to or greater than the fair market value of the stock subject to the award on the grant date. Under a Code Section 162(m) transition rule for compensation plans of corporations which are privately held and which become publicly held in an initial public offering, the 2011 Plan will not be subject to Section 162(m) until a specified transition date, which is the earlier of:
- •
- the material modification of the 2011 Plan;
- •
- the issuance of all of the shares of our common stock reserved for issuance under the 2011 Plan; or
- •
- the first meeting of our stockholders at which members of our board of directors are to be elected that occurs after the close of the third calendar year following the calendar year in which our initial public offering occurs.
After the transition date, rights or awards granted under the 2011 Plan, other than options and SARs, will not qualify as "performance-based compensation" for purposes of Section 162(m) unless such rights or awards are granted or vest upon pre-established objective performance goals, the material terms of which are disclosed to and approved by our stockholders. Thus, after the transition date, we expect that such other rights or awards under the plan will not constitute performance-based compensation for purposes of Section 162(m).
We intend to file with the SEC a registration statement on Form S-8 covering the shares of our common stock issuable under the 2011 Plan.
2004 Equity Incentive Plan (Amended and Restated September 5, 2007)
Our board of directors adopted, and our stockholders approved, the 2004 Plan in September 2004. The 2004 Plan provides for the grant of stock options and stock purchase rights to our employees, directors and consultants of our company. As a result of our adoption of the 2011 Plan (discussed above), we will not make any further awards under the 2004 Plan following the completion of this offering; all outstanding awards will continue to be governed by their existing terms. The material terms of the 2004 Plan are summarized below.
121
Administration. Our compensation committee has been delegated the authority to administer the 2004 Plan and the awards granted thereunder. After the closing of this offering, certain limitations as to the composition of the plan administrator may be imposed under Section 162(m), Section 16 of the Exchange Act, and/or stock exchange rules, as applicable. Our board of directors administers the 2004 Plan with respect to awards to independent directors.
Limitations on Awards. The aggregate number of shares of our common stock that is authorized pursuant to the 2004 Plan is 20,514,693 shares, which shares may be authorized but unissued shares or shares of reacquired common stock. Shares tendered or withheld to satisfy grant or exercise price or tax withholding obligations associated with an award granted under the 2004 Plan, shares subject to an award that is granted under the 2004 Plan that is forfeited or expires and shares of restricted stock that are repurchased by us at their original purchase price may be used again for new grants under the 2004 Plan.
Stock Options. The 2004 Plan provides for the grant of stock options, including ISOs and NSOs. ISOs, by contrast to NSOs, may provide tax deferral beyond exercise and favorable capital gains tax treatment to their holders if certain holding period and other Code requirements are satisfied. The exercise price of a stock option may not be less than 100% of the fair market value of the underlying share on the date of grant (or 110% in the case of ISOs granted to an optionee who owns stock representing more than 10% of the voting power of all classes of our common stock). A stock option may provide for "early exercise" prior to vesting in exchange for shares of restricted stock that vest on the option's vesting schedule.
In general, the maximum term of options granted is ten years. The maximum term of options granted to an optionee who owns stock representing more than 10% of the voting power of all classes of our common stock is five years. If an optionee's service relationship with us terminates other than by disability or death, the optionee may exercise the vested portion of any option in such period of time as specified in the optionee's option agreement, but prior to the date of this offering, to the extent required by applicable law, in no event will such period be less than 30 days following the termination of service. In the absence of a specified time in such option agreement, the option shall remain exercisable for three months following the optionee's termination of service with us. Shares of common stock representing any unvested portion of the option on the date of termination shall immediately cease to be issuable and shall become available for issuance under the 2004 Plan. If, after termination, the optionee does not exercise the option within the time period specified, the option shall terminate and the shares of common stock covered by such option will become available for issuance under the 2004 Plan. If an optionee's service relationship with us terminates by disability or death, the optionee may exercise the vested portion of any option in such period of time as specified in the optionee's option agreement, but prior to the date of this offering, to the extent required by applicable law, in no event will such period be less than six months following the termination of service. In the absence of a specified time in such option agreement, the option shall remain exercisable for 12 months following the optionee's termination of service with us.
Stock Purchase Rights. The 2004 Plan provides that we may issue stock purchase rights alone, in addition to or in tandem with options granted under the 2004 Plan and/or cash awards made outside the 2004 Plan. Any stock purchase rights will be governed by a restricted stock purchase agreement. We will have the right to repurchase shares of common stock acquired by the purchaser upon exercise of a stock purchase right upon the termination of the purchaser's status as an employee, director or consultant for any reason. Once the stock purchase right is exercised, the purchaser shall have rights equivalent to those of our other stockholders.
Corporate Transactions. In the event of certain significant corporate transactions, the plan administrator has the discretion to take one or more of the following actions: (a) provide for the purchase or any option, stock purchase right or restricted stock for an amount of cash equal to the
122
amount that could have been obtained upon the exercise of such option or stock purchase right; (b) provide that any option or stock purchase right be made exercisable; (c) provide for the assumption of any option, stock purchase right or restricted stock; (d) provide adjustments in the number and type of shares of common stock subject to outstanding options and stock purchase rights; and (e) provide for the termination of any option or stock purchase right. In addition, in the event of certain non-reciprocal transactions with our shareholders known as "equity restructurings," the plan administrator may make equitable adjustments to the 2004 Plan and outstanding awards.
Change in Control. In the event we undergo a change in control, and any surviving corporation does not assume or substitute similar awards for options, stock purchase rights or restricted stock under the 2004 Plan, the vesting of options, stock purchase rights or restricted stock held by participants in the 2004 Plan whose status as an employee, director or consultant has not terminated prior to such event shall be accelerated and made fully exercisable at least ten days prior to the closing of the event of change in control, and any options or stock purchase rights outstanding under the 2004 Plan shall terminate if not exercised prior to the closing of the event of change in control.
Plan Amendment and Termination. Our board of directors may amend or terminate the 2004 Plan at any time; however, (i) no amendment or termination may adversely affect an outstanding award without the affected participant's consent, and (ii) except in connection with certain changes in our capital structure, stockholder approval will be required for any amendment that increases the number of shares available under the 2004 Plan or extends the term of the 2004 Plan. No award may be granted pursuant to the 2004 Plan after September 7, 2014, however, we will cease granting awards under the 2004 Plan upon effectiveness of the 2011 Plan.
We intend to file with the SEC a registration statement on Form S-8 covering the shares of our common stock issuable under the 2004 Plan.
Confidentiality Information, Secrecy and Invention Agreements
Each of our named executive officers has entered into a standard form agreement with respect to confidential information, secrecy and inventions. Among other things, this agreement obligates each named executive officer to refrain from disclosing any of our proprietary information received during the course of employment and, with some exceptions, to assign to us any inventions conceived or developed during the course of employment.
Limitation on Liability and Indemnification Matters
Our amended and restated certificate of incorporation and amended and restated bylaws, each to be effective upon the completion of this offering, will provide that we will indemnify our directors, officers, employees and agents to the fullest extent permitted by the Delaware General Corporation Law, which prohibits our amended and restated certificate of incorporation from limiting the liability of our directors for the following:
- •
- any breach of the director's duty of loyalty to us or to our stockholders;
- •
- acts or omissions not in good faith or that involve intentional misconduct or a knowing violation of law;
- •
- unlawful payment of dividends or unlawful stock repurchases or redemptions; and
- •
- any transaction from which the director derived an improper personal benefit.
If Delaware law is amended to authorize corporate action further eliminating or limiting the personal liability of a director, then the liability of our directors will be eliminated or limited to the fullest extent permitted by Delaware law, as so amended. Our amended and restated certificate of incorporation does not eliminate a director's duty of care and, in appropriate circumstances, equitable
123
remedies, such as injunctive or other forms of non-monetary relief, remain available under Delaware law. This provision also does not affect a director's responsibilities under any other laws, such as the federal securities laws or other state or federal laws. Under our amended and restated bylaws, we will also be empowered to enter into indemnification agreements with our directors, officers, employees and other agents and to purchase insurance on behalf of any person whom we are required or permitted to indemnify.
In addition to the indemnification required in our amended and restated certificate of incorporation and amended and restated bylaws, we have entered into indemnification agreements with each of our directors, and will enter into new indemnification agreements with each of our current directors, officers and certain employees before the completion of this offering. These agreements provide for the indemnification of our directors, officers and certain employees for all reasonable expenses and liabilities incurred in connection with any action or proceeding brought against them by reason of the fact that they are or were our agents. We believe that these provisions in our amended and restated certificate of incorporation and amended and restated bylaws and indemnification agreements are necessary to attract and retain qualified persons as directors and officers. Furthermore, we have obtained director and officer liability insurance to cover liabilities our directors and officers may incur in connection with their services to us. This description of the indemnification provisions of our amended and restated certificate of incorporation, our amended and restated bylaws and our indemnification agreements is qualified in its entirety by reference to these documents, each of which is attached as an exhibit to this registration statement.
The limitation of liability and indemnification provisions in our amended and restated certificate of incorporation and amended and restated bylaws may discourage stockholders from bringing a lawsuit against directors for breach of their fiduciary duties. They may also reduce the likelihood of derivative litigation against directors and officers, even though an action, if successful, might benefit us and our stockholders. A stockholder's investment may be harmed to the extent we pay the costs of settlement and damage awards against directors and officers pursuant to these indemnification provisions. Insofar as indemnification for liabilities arising under the Securities Act may be permitted to our directors, officers and controlling persons pursuant to the foregoing provisions, or otherwise, we have been advised that, in the opinion of the SEC, such indemnification is against public policy as expressed in the Securities Act, and is, therefore, unenforceable. There is no pending litigation or proceeding naming any of our directors or officers as to which indemnification is being sought, nor are we aware of any pending or threatened litigation that may result in claims for indemnification by any director or officer.
Rule 10b5-1 Sales Plans
Our directors and executive officers may adopt written plans, known as Rule 10b5-1 plans, in which they will contract with a broker to buy or sell shares of our common stock on a periodic basis. Under a Rule 10b5-1 plan, a broker executes trades pursuant to parameters established by the director or officer when entering into the plan, without further direction from them. The director or officer may amend or terminate the plan in some circumstances. Our directors and executive officers may also buy or sell additional shares outside of a Rule 10b5-1 plan when they are not in possession of material, nonpublic information.
124
CERTAIN RELATIONSHIPS AND RELATED PARTY TRANSACTIONS
We describe below each transaction, since January 1, 2008, to which we were a party or will be a party, in which:
- •
- the amounts involved exceeded or will exceed $120,000; and
- •
- a director, executive officer, holder or group of holders known to us to beneficially own more than 5% of any class of our voting securities or any member of their immediate family had or will have a direct or indirect material interest in the transaction.
Preferred Stock Issuances
Issuance of Series E Preferred Stock
On March 4, 2011 and June 14, 2011, we sold 3,610,873 shares and 2,407,249 shares of Series E preferred stock, respectively, at a price of $4.15412 per share for aggregate gross proceeds of approximately $25.0 million. The table below sets forth the number of shares of Series E preferred stock sold to our directors, executive officers and 5% stockholders and their affiliates.
Name
|
Number of Shares of Series E Preferred Stock |
Aggregate Purchase Price |
|||||
|---|---|---|---|---|---|---|---|
ATMI, Inc.(1) |
1,623,838 | $ | 6,745,617.92 | ||||
CMEA Ventures VI, L.P.(2)(3) |
601,811 | $ | 2,499,995.12 | ||||
Redpoint Ventures II, L.P.(4)(5) |
695,003 | $ | 2,887,125.87 | ||||
Symyx Technologies, Inc. |
198,211 | $ | 823,392.28 | ||||
U.S. Venture Partners IX, L.P.(6) |
492,010 | $ | 2,043,868.59 | ||||
- (1)
- George
M. Scalise is one of our directors and is a member of the board of directors of ATMI, Inc.
- (2)
- Includes
13,788 shares purchased by CMEA Ventures VI GmbH & Co. KG.
- (3)
- Thomas
R. Baruch is one of our directors and is a general partner of CMEA Ventures Management, L.P., which is the general partner of each of CMEA Venture
Partners VI, L.P. and CMEA Ventures VI GmbH & Co. KG.
- (4)
- Includes
15,708 shares purchased by Redpoint Associates II, LLC.
- (5)
- John
L. Walecka is one of our directors and is a managing member of each of Redpoint Ventures II, L.P. and Redpoint
Associates II, LLC.
- (6)
- Irwin B. Federman is one of our directors and is a managing member of Presidio Management Group IX, LLC, which is the general partner of U.S. Venture Partners IX, L.P.
Issuance of Series D Preferred Stock
On December 16, 2008, we sold 6,575,832 shares of Series D preferred stock at a price of $3.04144 per share for gross proceeds of approximately $20.0 million. The table below sets forth the number of
125
shares of Series D preferred stock sold to our directors, executive officers and 5% stockholders and their affiliates.
Name
|
Number of Shares of Series D Preferred Stock |
Aggregate Purchase Price |
|||||
|---|---|---|---|---|---|---|---|
ATMI, Inc. |
3,287,916 | $ | 9,999,999.24 | ||||
CMEA Ventures VI, L.P.(1)(2) |
1,014,233 | $ | 3,084,728.82 | ||||
Redpoint Ventures II, L.P.(3)(4) |
1,014,233 | $ | 3,084,728.82 | ||||
Symyx Technologies, Inc.(5) |
541,448 | $ | 1,646,781.61 | ||||
U.S. Venture Partners IX, L.P.(6) |
718,002 | $ | 2,183,760.01 | ||||
- (1)
- Includes
23,226 shares purchased by CMEA Ventures VI GmbH & Co. KG.
- (2)
- Thomas
R. Baruch is one of our directors and is a general partner of CMEA Ventures Management, L.P., which is the general partner of each of CMEA
Ventures VI, L.P. and CMEA Ventures VI GmbH & Co. KG.
- (3)
- Includes
22,922 shares purchased by Redpoint Associates II, LLC.
- (4)
- John
L. Walecka is one of our directors and is a managing member of each of Redpoint Ventures II, L.P. and Redpoint
Associates II, LLC.
- (5)
- Isy
Goldwasser is one of our directors and, at the time of the transaction, was an executive officer of Symyx Technologies, Inc.
- (6)
- Irwin B. Federman is one of our directors and is a managing member of Presidio Management Group IX, LLC, which is the general partner of U.S. Venture Partners IX, L.P.
Symyx
In March 2005, we entered into a Collaborative Development and License Agreement with Symyx Technologies, Inc. (Symyx). In addition, in December 2005, we entered into an Alliance Agreement (Symyx Alliance Agreement) with Symyx, and we amended the Symyx Alliance Agreement in August 2006, June 2007, August 2007, November 2007 and September 2009. Prior to the completion of this offering, Symyx is a beneficial owner of approximately 10.9% of our common stock. Isy Goldwasser is one of our directors and, at the time of these transactions, was an executive officer of Symyx.
Under the Symyx agreements, Symyx granted us a license to certain high-throughput combinatorial patents held or licensed by them and related software to design, develop and manufacture integrated circuits, photovoltaic cells, glass coatings, light emitting diodes, organic light-emitting diodes and thin films for electronics, optical and energy applications (Fields), and we agreed to pay Symyx royalties in connection with such license. During the six months ended June 30, 2011 and 2010 and the years ended December 31, 2010, 2009 and 2008, we recorded $0.9 million, $0.8 million, $2.0 million, $1.2 million and $1.0 million in royalty expense, respectively, and had accrued liabilities due to Symyx of $405,000, $795,000 and $502,000 as of June 30, 2011 and December 31, 2010 and 2009, respectively. In addition, during the six months ended June 30, 2011 and 2010 and the years ended December 31, 2010, 2009 and 2008, we purchased $0, $0, $6,000, $14,000 and $286,000, respectively, of fixed assets, maintenance and consumables from Symyx.
On July 28, 2011, we entered into an agreement with Symyx, pursuant to which we agreed to use commercially reasonable efforts to allow Symyx to sell in this offering shares of our common stock held by them. Pursuant to the agreement, Symyx agreed to sell such shares and, upon consummation of this offering, including the sale of such shares, to terminate our future royalty
126
obligations under the Symyx agreements to the extent they would have accrued after December 31, 2011. Additionally, upon consummation of this offering and such sale, Symyx would transfer to us all the patents held by them that relate to combinatorial processing. To the extent the gross proceeds (before deducting underwriting discounts and commissions and offering expenses) to Symyx from the sale of their shares in this offering are less than $67 million, we would issue Symyx a secured promissory note that would have a term of 24 months and an interest rate equal to 4%. Such note would be payable in an amount equal to the greater of $500,000 per quarter or the amount of accrued interest, with a balloon payment at maturity, if applicable. Such note would also be pre-payable by us at any time without penalty or premium, and would be secured by tangible personal property, excluding intellectual property. In addition, we have agreed to reimburse Symyx for 50% of the underwriting discounts and commissions payable by them in connection with this offering, which amount is equal to $ , based on an assumed initial public offering price of $ (the midpoint of the price range set forth on the cover page of this prospectus). In addition, we agreed to continue to license from them the rights they have to certain patents held by Lawrence Berkeley National Laboratory and for which we have an exclusive sub-license in the Fields and to assume certain royalty and license fee obligations to Berkeley in connection with such sub-license, not to exceed $300,000 per year.
ATMI, Inc.
In November 2006, we entered into an Alliance Agreement with ATMI, which is the beneficial owner of approximately 10.6% of our common stock outstanding as of June 30, 2011. In July 2007, we entered into a Wets Workflow Purchase Agreement with ATMI, and then in December 2008 entered into a Dry Workflow Purchase Agreement with ATMI, pursuant to which we sold to ATMI certain high productivity development tools. Under the Alliance Agreement and related ancillary agreements, we agreed to work with ATMI to conduct R&D and other activities with respect to materials and HPC technology for use in semiconductor applications. Under the agreements, ATMI pays us fees for services and both parties may provide royalties to the other for licensed technology sold to third parties. During the six months ended June 30, 2011 and 2010 and the years ended December 31, 2010, 2009 and 2008, we recorded revenue in the amount of $7.8 million, $10.3 million, $22.1 million, $16.0 million and $13.4 million, respectively, in equipment sales, license fees and service fees and had accounts receivable in the amount of $447,000, $461,000 and $1.2 million as of June 30, 2011 and December 31, 2010 and 2009, respectively, related to these agreements. We recorded a deferred revenue balance in the amount of $8.2 million, $13.3 million and $22.8 million related to these agreements as of June 30, 2011 and December 31, 2010 and 2009, respectively.
Investor Rights Agreement
We have entered into an amended and restated investor rights agreement with certain holders of our preferred stock and warrants, including entities with which certain of our directors are affiliated. As of June 30, 2011, the holders of 60,922,194 million shares of our common stock issuable upon the conversion of our preferred stock or exercise of warrants, are entitled to rights with respect to the registration of their shares under the Securities Act. For a more detailed description of these registration rights, see "Description of Capital Stock—Registration Rights." The investor rights agreement also provides for rights of first refusal. We have obtained waivers so that the rights of first refusal will not apply to, and will terminate upon completion of, this offering.
Voting Agreement
We have entered into an amended and restated voting agreement with certain holders of our common stock and preferred stock. Upon the closing of this offering, the amended and restated voting agreement will terminate. For a description of the amended and restated voting agreement, see the section titled "Management—Voting Arrangements."
127
Right of First Refusal and Co-Sale Agreement
We have entered into an amended and restated right of first refusal and co-sale agreement with certain holders of our common stock and preferred stock. This agreement provides for rights of first refusal and co-sale relating to certain shares of our common stock in favor of the holders of certain shares of our preferred stock. Upon the closing of this offering, the amended and restated right of first refusal and co-sale agreement will terminate.
Indemnification Agreements
We have entered into indemnification agreements with each of our directors and will enter into new indemnification agreements with each of our current directors, officers and certain employees before the completion of this offering. These agreements, among other things, will require us to indemnify each director and executive officer to the fullest extent permitted by Delaware law, including indemnification of expenses such as attorneys' fees, judgments, fines and settlement amounts incurred by the director or executive officer in any action or proceeding, including any action or proceeding by or in right of us, arising out of the person's services as a director or executive officer. See "Executive Compensation—Limitation on Liability and Indemnification Matters."
Stock Options
We have granted stock options to our executive officers and certain of our directors. For more information regarding these stock options, see the section titled "Executive Compensation—Compensation Discussion and Analysis."
Policies and Procedures for Related Party Transactions
Our board of directors intends to adopt a written related person transaction policy to set forth the policies and procedures for the review and approval or ratification of related person transactions. This policy will cover, with certain exceptions set forth in Item 404 of Regulation S-K under the Securities Act, any transaction, arrangement or relationship, or any series of similar transactions, arrangements or relationships in which we were or are to be a participant, where the amount involved exceeds $120,000 and a related person had or will have a direct or indirect material interest, including, without limitation, purchases of goods or services by or from the related person or entities in which the related person has a material interest, indebtedness, guarantees of indebtedness and employment by us of a related person.
As provided by our audit committee charter to be effective upon completion of this offering, our audit committee will be responsible for reviewing and approving in advance any related party transaction.
128
PRINCIPAL AND SELLING STOCKHOLDERS
The following table sets forth information known to us about the beneficial ownership of our common stock at September 1, 2011, as adjusted to reflect the sale of the shares of common stock in this offering, by:
- •
- each person or group of affiliated persons known to us to be the beneficial owner of more than 5% of our common stock;
- •
- each named executive officer and each director;
- •
- all of our executive officers and directors as a group; and
- •
- each of the selling stockholders.
The information in the table below is calculated based on 72,876,287 shares of common stock outstanding before this offering and shares of common stock outstanding after this offering. The number of shares outstanding before and after this offering is based on the number of shares of common stock outstanding on September 1, 2011, as adjusted to give effect to:
- •
- the conversion of all 58,461,447 shares of our convertible preferred stock outstanding on September 1, 2011 into an
aggregate of 58,461,447 shares of our common stock, which will be effective immediately prior to the consummation of this offering; and
- •
- the cash exercise of warrants outstanding to purchase shares of our common stock as of September 1, 2011, which will expire upon completion of this offering if unexercised, resulting in the issuance of 2,626,985 shares of common stock for an aggregate exercise price of approximately $6.4 million.
In computing the number of shares of common stock beneficially owned by a person, entity or group and the corresponding percentage ownership of that person, entity or group, shares of common stock underlying common stock or preferred stock options and warrants that are held by that person, entity or group and that are currently exercisable or exercisable within 60 days of September 1, 2011 are considered to be outstanding. We did not deem these shares to be outstanding, however, for the purpose of computing the percentage ownership of any other person, entity or group.
Unless otherwise noted below, the address of each beneficial owner listed on the table is c/o Intermolecular, Inc., 3011 N. First Street, San Jose, California 95134. We have determined beneficial ownership in accordance with the rules of the SEC. Except as indicated by the footnotes below, we believe, based on the information furnished to us, that the persons and entities named in the
129
tables below have sole voting and investment power with respect to all shares of common stock that they beneficially own, subject to applicable community property laws where applicable.
| |
|
|
|
|
|
|
|
Beneficial Ownership After this Offering (Over-allotment Option Exercised in Full) |
|||||||||||||||||
|---|---|---|---|---|---|---|---|---|---|---|---|---|---|---|---|---|---|---|---|---|---|---|---|---|---|
| |
Beneficially Owned Prior to this Offering | Beneficial Ownership After this Offering |
|||||||||||||||||||||||
| |
|
Number of Shares Exercisable within 60 Days |
|
|
|||||||||||||||||||||
| |
Common Stock |
Number of Shares Beneficially Owned |
Percentage of Beneficial Ownership |
Shares Being Offered |
Number of Shares Beneficially Owned |
Percentage of Beneficial Ownership |
Percentage of Beneficial Ownership |
||||||||||||||||||
5% Stockholders |
|||||||||||||||||||||||||
ATMI, Inc.(1) |
7,714,485 | — | 7,714,485 | 10.59 | % | ||||||||||||||||||||
Entities affiliated with CMEA Ventures(2) |
15,096,892 | — | 15,096,892 | 20.72 | % | ||||||||||||||||||||
Entities affiliated with Redpoint Ventures(3) |
15,190,084 | — | 15,190,084 | 20.84 | % | ||||||||||||||||||||
Symyx Technologies, Inc.(4) |
7,936,409 | — | 7,936,409 | 10.89 | % | ||||||||||||||||||||
U.S. Venture Partners(5) |
10,753,439 | — | 10,753,439 | 14.76 | % | ||||||||||||||||||||
Named Executive Officers and Directors |
|||||||||||||||||||||||||
David E. Lazovsky(6) |
7,587,268 | 1,031,250 | 8,618,518 | 11.66 | % | ||||||||||||||||||||
Peter L. Eidelman(7) |
— | 967,708 | 967,708 | 1.31 | % | ||||||||||||||||||||
Tony P. Chiang, Ph.D.(8) |
— | 2,881,250 | 2,881,250 | 3.80 | % | ||||||||||||||||||||
J. Craig Hunter(9) |
— | 535,416 | 535,416 | * | |||||||||||||||||||||
Sandeep Jaggi, J.D., Ph.D.(10) |
— | 156,250 | 156,250 | * | |||||||||||||||||||||
Thomas R. Baruch(11) |
15,096,892 | 250,000 | 15,346,892 | 20.99 | % | ||||||||||||||||||||
Marvin D. Burkett(12) |
— | 25,000 | 25,000 | * | |||||||||||||||||||||
Irwin B. Federman(13) |
10,753,439 | — | 10,753,439 | 14.76 | % | ||||||||||||||||||||
Isy Goldwasser(14) |
— | — | — | — | |||||||||||||||||||||
Bruce M. McWilliams(15) |
440,000 | 210,000 | 650,000 | * | |||||||||||||||||||||
George M. Scalise(16) |
380,000 | — | 380,000 | * | |||||||||||||||||||||
John L. Walecka(17) |
15,190,084 | — | 15,190,084 | 20.84 | % | ||||||||||||||||||||
All executive officers and directors as a |
49,447,683 | 6,306,874 | 55,754,557 | 70.41 | % | ||||||||||||||||||||
- *
- Represents
beneficial ownership of less than 1%.
- (1)
- Includes
1,470,000 shares to be issued upon the cash exercise of a warrant upon the consummation of this offering. The address of Advanced Technology
Materials, Inc. is 7 Commerce Drive, Danbury, Connecticut 06810.
- (2)
- Includes:
(i) 14,751,005 shares held prior to this offering by CMEA Ventures VI, L.P. (CMEA VI) and (ii) 345,887 shares held
prior to this offering by CMEA Ventures VI GmbH & Co. KG (CMEA VI GmbH). CMEA Ventures VI Management, L.P. (CMEA VI Mgmt) is the general partner of each of CMEA VI
and CMEA VI GmbH. Thomas R. Baruch, David J. Collier, Karl D. Handelsman, Faysal A. Sohail and James F. Watson are the general partners of CMEA VI Mgmt and, as such, have voting and dispositive
power over these shares. Each disclaims beneficial ownership of the shares held by these entities, except to the extent of any pecuniary interest therein. The address of each of the entities
affiliated with CMEA Ventures is One Embarcadero Center, Suite 3250, San Francisco, California 94111.
- (3)
- Includes:
(i) 14,846,786 shares held prior to this offering by Redpoint Ventures II, L.P. (RV II) and (ii) 343,298 shares held
prior to this offering by Redpoint Associates II, LLC (RA II). Redpoint Ventures II, LLC (RV II LLC), a Delaware limited liability company, is the sole general partner of RV II.
Voting and dispositive decisions with respect to shares held by RV II and RA II are shared by Jeffery D. Brody, R. Thomas Dyal, Timothy M. Haley, G. Bradford Jones, John L. Walecka and Geoffrey Y.
Yang in their capacities as managing members of each of RV II and RA II. Each disclaims beneficial ownership of the shares held by these entities, except to the extent of any pecuniary interest
therein. The address of each of the entities affiliated with Redpoint Ventures is 3000 Sand Hill Road, Building Two, Suite 290, Menlo Park, California 94025.
- (4)
- Includes
7,936,409 shares held prior to this offering. The address of Symyx Technologies, Inc. is c/o Accelrys, Inc., 10188 Telesis Court,
Suite 100, San Diego, California 92121.
- (5)
- Includes
10,753,439 shares held prior to this offering by U.S. Venture Partners IX, L.P. (USVP IX). Presidio Management Group IX, LLC (PMG
IX) is the general partner of USVP IX. Each of Irwin B. Federman, Winston S. Fu, Steven M. Kransz, David E. Liddle, Paul Matteucci, Jonathan D. Root, Christopher Rust, Casey M. Tansey
and Philip M. Young are the managing members of PMG IX and may be deemed to share voting and dispositive power over the shares held by USVP IX. Such persons disclaim beneficial ownership of the shares
held by USVP IX, except to the extent of any pecuniary interest therein. The address of U.S. Venture Partners is 2735 Sand Hill Road, Menlo Park, California 94025.
- (6)
- Consists
of: (i) 6,595,504 shares held by David E. Lazovsky, (ii) 450,000 shares held by The David E. Lazovsky 2010 Annuity Trust,
(iii) 450,000 shares held by The Juel D. Lazovsky 2010 Annuity Trust, (iv) 91,764 shares held by The Lazovsky 2010 Irrevocable Children's Trust and (v) 1,031,250 shares that may
be acquired pursuant to the exercise of stock options within 60 days of September 1, 2011 by Mr. Lazovsky.
- (7)
- Consists
of 967,708 shares that may be acquired pursuant to the exercise of stock options within 60 days of September 1, 2011.
- (8)
- Consists
of 2,881,250 shares that may be acquired pursuant to the exercise of stock options within 60 days of September 1, 2011.
- (9)
- Consists of 535,416 shares that may be acquired pursuant to the exercise of stock options within 60 days of September 1, 2011.
130
- (10)
- Consists
of 156,250 shares that may be acquired pursuant to the exercise of stock options within 60 days of September 1, 2011.
- (11)
- Consists
of the shares described in Note (2) above. Mr. Baruch disclaims beneficial ownership of the shares held by the entities affiliated
with CMEA Ventures as descibed in Note (2) above, except to the extent of his pecuniary interest therein. Also includes 250,000 shares that may be acquired pursuant to the exercise of stock
options within 60 days of September 1, 2011.
- (12)
- Consists
of 25,000 shares that may be acquired pursuant to the exercise of stock options within 60 days of September 1, 2011.
- (13)
- Consists
of the shares described in Note (5) above. Mr. Federman disclaims beneficial ownership of the shares held by the entities affiliated
with U.S. Ventures as descibed in Note (5) above, except to the extent of his pecuniary interest therein.
- (14)
- Excludes
shares held by Symyx Technologies, Inc.
- (15)
- Consists
of: (i) 440,000 shares held by Bruce and Astrid McWilliams 1997 Trust UAD 11/06/97 and (ii) 210,000 shares that may be
acquired pursuant to the exercise of stock options within 60 days of September 1, 2011.
- (16)
- Consists
of 380,000 shares held by George M. Scalise and Dorothea Scalise TR Family Trust UA 12/28/88.
- (17)
- Consists
of the shares described in Note (3) above. Mr. Walecka disclaims beneficial ownership of the shares held by the entities affiliated
with Redpoint Ventures as descibed in Note (3) above, except to the extent of his pecuniary interest therein.
- (18)
- Includes: (i) 41,040,415 shares held by entities affiliated with certain of our directors and (ii) 49,447,683 shares beneficially owned by our executive officers and directors, which includes the 41,040,415 shares held by such entities and 6,306,874 shares that may be acquired pursuant the exercise of stock options within 60 days of September 1, 2011.
131
General
Upon the completion of this offering, we will have authorized under our amended and restated certificate of incorporation shares of common stock, $0.001 par value per share, and shares of preferred stock, $ par value per share. The following information assumes the filing of our amended and restated certificate of incorporation and the conversion of all outstanding shares of our preferred stock into shares of common stock upon the completion of this offering.
As of June 30, 2011, there were outstanding:
- •
- 70,017,403 shares of our common stock held by 79 stockholders of record; and
- •
- 16,403,610 shares issuable upon exercise of outstanding stock options.
The following description of our capital stock and provisions of our amended and restated certificate of incorporation and amended and restated bylaws to be in effect upon the completion of this offering is a summary and is qualified in its entirety by reference to the full copies of these documents, which have been filed with the SEC as exhibits to our registration statement, of which this prospectus forms a part. The descriptions of the common stock and preferred stock reflect changes to our capital structure that will occur upon the closing of this offering. Currently, there is no established public trading market for our common stock.
Common Stock
Voting Rights
Each holder of our common stock is entitled to one vote for each share on all matters submitted to a vote of the stockholders, including the election of directors. Our stockholders do not have cumulative voting rights in the election of directors. Accordingly, holders of a majority of the voting shares are able to elect all of the directors.
Dividends
Subject to preferences that may be applicable to any then outstanding preferred stock, holders of our common stock are entitled to receive dividends, if any, as may be declared from time to time by our board of directors out of legally available funds.
Liquidation
In the event of our liquidation, dissolution or winding up, holders of our common stock will be entitled to share ratably in the net assets legally available for distribution to stockholders after the payment of all of our debts and other liabilities and the satisfaction of any liquidation preference granted to the holders of any then outstanding shares of preferred stock.
Rights and Preferences
Holders of our common stock have no preemptive, conversion, subscription or other rights, and there are no redemption or sinking fund provisions applicable to our common stock. The rights, preferences and privileges of the holders of our common stock are subject to and may be adversely affected by the rights of the holders of shares of any series of preferred stock that we may designate in the future.
132
Preferred Stock
Upon the completion of this offering, our board of directors will have the authority, without further action by our stockholders, to issue up to shares of preferred stock in one or more series and to fix the rights, preferences, privileges and restrictions thereof. These rights, preferences and privileges could include dividend rights, conversion rights, voting rights, terms of redemption, liquidation preferences, sinking fund terms and the number of shares constituting any series or the designation of such series, any or all of which may be greater than the rights of common stock. The issuance of our preferred stock could adversely affect the voting power of holders of common stock and the likelihood that such holders will receive dividend payments and payments upon liquidation. In addition, the issuance of preferred stock could have the effect of delaying, deferring or preventing a change of control of our company or other corporate action. Upon completion of this offering, no shares of preferred stock will be outstanding, and we have no present plan to issue any shares of preferred stock.
Warrants
The following table sets forth information about outstanding warrants to purchase shares of our stock as of June 30, 2011. In connection with the consummation of this offering, the warrant to purchase shares of our Series B redeemable convertible preferred stock will convert into a warrant to purchase shares of our common stock. Certain of the warrants below (as indicated), which will expire upon completion of this offering if unexercised, will be exercised on a cash basis in connection with the consummation of this offering, resulting in the issuance of 2,621,985 shares of common stock.
Class of Stock
|
Number of Shares |
Exercise Price/Share |
Expiration Date |
|||||
|---|---|---|---|---|---|---|---|---|
Common |
150,000 | $ | 0.75 | (1)(2) | ||||
Common |
11,238 | $ | 0.83 | (2)(3) | ||||
Common |
1,470,000 | $ | 1.88 | 12/1/2012(2) | ||||
Common |
180,000 | $ | 1.02 | (4) | ||||
Common |
1,644,736 | $ | 3.04144 | (5) | ||||
Common |
822,000 | $ | 4.15412 | 12/1/2012(2) | ||||
Series B preferred stock |
168,747 | $ | 0.44445 | 11/4/2012(2) | ||||
- (1)
- Expires
ten days following the termination of a Campaign Proposal Agreement, dated April 26, 2007, by and between Loomis Group, Inc. and us.
- (2)
- Warrants
will be exercised on a cash basis in connection with the consummation of this offering.
- (3)
- Expires
ten days following the termination of a Standard Production Agreement, dated April 19, 2007, by and between Compass Rose Media, LLC
and us.
- (4)
- Expires
on the earlier of (i) three months after Timane S.a r.l. (Timane), the holder of the warrant, ceases to be a service provider
to us or the death or disability of Dr. Rabinzohn if he becomes a service provider after Timane ceases to be a service provider or (ii) June 15, 2018.
- (5)
- Expires 120 days from the end of the Collaborative Development Program under the Collaborative Development Program Agreement by and among Toshiba Corporation, SanDisk Corporation and us, dated March 15, 2010.
133
Registration Rights
We are party to an investor rights agreement, which provides that holders of our preferred stock have the right to demand that we file a registration statement or request that their shares be covered by a registration statement that we are otherwise filing. In the event that we propose to register any of our securities under the Securities Act, either for our own account or for the account of other security holders, these holders are entitled to notice of such registration and are entitled to certain "piggyback" registration rights allowing the holder to include their common stock in such registration, subject to certain marketing and other limitations. Pursuant to the investor rights agreement, the holders of common stock issuable upon conversion of our preferred stock have the right upon the earlier of six months after the completion of this offering and March 4, 2014 to require us, on not more than two occasions, to file a registration statement under the Securities Act to register the resale of their shares of common stock with an anticipated aggregate offering price, net of underwriting discounts and commissions, of at least $5 million. We may, in certain circumstances, defer such registrations and any underwriters will have the right, subject to certain limitations, to limit the number of shares included in such registrations. Further, these holders may require us to register the resale of all or a portion of their shares on a registration statement on Form S-3 once we are eligible to use Form S-3, subject to certain conditions and limitations. In an underwritten offering, the underwriter has the right, subject to specified conditions, to limit the number of registrable securities such holders may include. Additionally, the holders of registration rights have waived their rights to include any of their shares in this offering prior to the completion of this offering.
Anti-Takeover Provisions
Certificate of Incorporation and Bylaws to be in Effect Upon the Completion of this Offering
Our amended and restated certificate of incorporation to be in effect upon the completion of this offering will provide for our board of directors to be divided into three classes, with staggered three-year terms. Only one class of directors will be elected at each annual meeting of our stockholders, with the other classes continuing for the remainder of their respective three-year terms. Because our stockholders do not have cumulative voting rights, our stockholders holding a majority of the shares of common stock outstanding will be able to elect all of our directors. Our amended and restated certificate of incorporation and amended and restated bylaws to be effective upon the completion of this offering will provide that all stockholder action must be effected at a duly called meeting of stockholders and not by a consent in writing, and that only our board of directors, chairman of the board, Chief Executive Officer or President (in the absence of a Chief Executive Officer) may call a special meeting of stockholders.
Our amended and restated certificate of incorporation will require a % stockholder vote for the amendment, repeal or modification of certain provisions of our amended and restated certificate of incorporation and amended and restated bylaws relating to the classification of our board of directors, the requirement that stockholder actions be effected at a duly called meeting, and the designated parties entitled to call a special meeting of the stockholders. The combination of the classification of our board of directors, the lack of cumulative voting and the % stockholder voting requirements will make it more difficult for our existing stockholders to replace our board of directors as well as for another party to obtain control of us by replacing our board of directors. Because our board of directors has the power to retain and discharge our officers, these provisions could also make it more difficult for existing stockholders or another party to effect a change in management. In addition, the authorization of undesignated preferred stock makes it possible for our board of directors to issue preferred stock with voting or other rights or preferences that could impede the success of any attempt to change our control.
134
These provisions may have the effect of deterring hostile takeovers or delaying changes in our control or management. These provisions are intended to enhance the likelihood of continued stability in the composition of our board of directors and its policies and to discourage certain types of transactions that may involve an actual or threatened acquisition of us. These provisions are designed to reduce our vulnerability to an unsolicited acquisition proposal. The provisions also are intended to discourage certain tactics that may be used in proxy fights. However, such provisions could have the effect of discouraging others from making tender offers for our shares and, as a consequence, they also may inhibit fluctuations in the market price of our shares that could result from actual or rumored takeover attempts. Such provisions may also have the effect of preventing changes in our management.
Section 203 of the Delaware General Corporation Law
We are subject to Section 203 of the Delaware General Corporation Law, which prohibits a Delaware corporation from engaging in any business combination with any interested stockholder for a period of three years after the date that such stockholder became an interested stockholder, with the following exceptions:
- •
- if, before such date, the board of directors of the corporation approved either the business combination or the
transaction that resulted in the stockholder becoming an interested holder;
- •
- if, upon completion of the transaction that resulted in the stockholder becoming an interested stockholder, the interested
stockholder owned at least 85% of the voting stock of the corporation outstanding at the time the transaction began, excluding for purposes of determining the voting stock outstanding (but not the
outstanding voting stock owned by the interested stockholder) those shares owned (i) by persons who are directors and also officers and (ii) employee stock plans in which employee
participants do not have the right to determine confidentially whether shares held subject to the plan will be tendered in a tender or exchange offer; or
- •
- if, on or after such date, the business combination is approved by the board of directors and authorized at an annual or special meeting of the stockholders, and not by written consent, by the affirmative vote of at least 662/3% of the outstanding voting stock that is not owned by the interested stockholder.
In general, Section 203 defines business combination to include the following:
- •
- any merger or consolidation involving the corporation and the interested stockholder;
- •
- any sale, transfer, pledge or other disposition of 10% or more of the assets of the corporation involving the interested
stockholder;
- •
- subject to certain exceptions, any transaction that results in the issuance or transfer by the corporation of any stock of
the corporation to the interested stockholder;
- •
- any transaction involving the corporation that has the effect of increasing the proportionate share of the stock or any
class or series of the corporation beneficially owned by the interested stockholder; or
- •
- the receipt by the interested stockholder of the benefit of any loss, advances, guarantees, pledges or other financial benefits by or through the corporation.
In general, Section 203 defines an "interested stockholder" as an entity or person who, together with the person's affiliates and associates, beneficially owns, or is an affiliate or associate of the corporation and within three years prior to the time of determination of interested stockholder status did own, 15% or more of the outstanding voting stock of the corporation.
135
Limitations of Liability and Indemnification Matters
For an in depth discussion of liability and indemnification, please see "Executive Compensation—Limitation on Liability and Indemnification Matters."
NASDAQ Global Market Listing
We have applied to have our common stock listed on The NASDAQ Global Market under the trading symbol "IMI."
Transfer Agent and Registrar
The transfer agent and registrar for our common stock is .
136
SHARES ELIGIBLE FOR FUTURE SALE
Prior to this offering, there has been no public market for our common stock. Future sales of our common stock in the public market, or the availability of such shares for sale in the public market, could adversely affect market prices of our common stock prevailing from time to time. As described below, only a limited number of shares will be available for sale shortly after this offering due to contractual and legal restrictions on resale. Nevertheless, sales of our common stock in the public market after such restrictions lapse, or the perception that those sales may occur, could adversely affect the prevailing market price of our common stock and our ability to raise equity capital in the future.
Based on the number of shares of common stock outstanding as of June 30, 2011, upon completion of this offering, we will have an aggregate of shares of common stock outstanding. All of the shares sold by us in this offering will be freely tradable unless purchased by our affiliates.
The remaining shares of common stock outstanding after this offering will be restricted as a result of securities laws or lock-up agreements as described below. Following the expiration of the lock-up period, all shares will be eligible for resale in compliance with Rule 144 or Rule 701 promulgated under the Securities Act to the extent such shares have been released from any repurchase option that we may hold. "Restricted securities" as defined under Rule 144 were issued and sold by us in reliance on exemptions from the registration requirements of the Securities Act. These shares may be sold in the public market only if registered or pursuant to an exemption from registration, such as Rule 144 or Rule 701 under the Securities Act. Subject to the lock-up agreements as described below and the provisions of Rule 144 or Rule 701, the shares of common stock outstanding after this offering (excluding the shares sold by us in this offering) will generally become available for sale in the public market as follows:
Approximate Number of Shares |
Date | |
|---|---|---|
| Immediately | ||
Beginning 90 days after the date of this prospectus |
||
Beginning 180 days after the date of this prospectus |
Rule 144
Rule 144 provides an exemption from the registration and prospectus-delivery requirements of the Securities Act. This exemption is available to affiliates of ours that sell our restricted or non-restricted securities and also to non-affiliates that sell our restricted securities. Restricted securities include securities acquired from the issuer of those securities, or from an affiliate of the issuer, in a transaction or chain of transactions not involving any public offering. The shares we are selling in this offering are not restricted securities. However, all the shares we have issued before this offering are restricted securities, and they will continue to be restricted securities until they are resold pursuant to Rule 144 or pursuant to an effective registration statement.
In general, under Rule 144, as in effect on the date of this prospectus, a person who is, or at any time during the 90 days preceding the sale was, an affiliate of ours generally may sell, within any three-month period, a number of shares that does not exceed the greater of:
- •
- 1% of the number of shares of common stock outstanding, which will equal approximately shares immediately after this offering (or shares if the underwriters' over-allotment is exercised in full); or
137
- •
- the average weekly trading volume of our common stock on the applicable stock exchange during the four calendar weeks immediately preceding the date on which a notice of sale is filed with the SEC.
In addition, sales by these persons must also satisfy requirements relating to the manner of sale, public notice, the availability of current public information about us and, in the case of restricted securities, a minimum holding period for those securities. All other persons may rely on Rule 144 to freely sell our restricted securities, so long as they satisfy both the minimum holding period requirement and, until a one-year holding period has elapsed, the current public information requirement.
Rule 144 does not supersede our security holders' contractual obligations under the lock-up agreements described below.
Rule 701
Generally, an employee, officer, director or qualified consultant of ours who purchased shares of our common stock before the effective date of the registration statement relating to this prospectus, or who holds options as of that date, pursuant to a written compensatory plan or contract may rely on the resale provisions of Rule 701 under the Securities Act. Under Rule 701, of these persons:
- •
- those who are not our affiliates may generally sell those securities, commencing 90 days after the effective date
of the registration statement, without having to comply with the current public information and minimum holding period requirements of Rule 144; and
- •
- those who are our affiliates may generally sell those securities under Rule 701, commencing 90 days after the effective date of the registration statement, without having to comply with Rule 144's minimum holding period restriction.
Rule 701 does not supersede our security holders' contractual obligations under the lock-up agreements described below.
Lock-up Agreements
We, along with our directors, executive officers, the selling stockholders and substantially all of our other security holders, have agreed with the underwriters that, subject to certain exceptions, for a period of 180 days following the date of this prospectus, we or they will not offer, sell, contract to sell, pledge, or otherwise dispose of, directly or indirectly, any shares of common stock or any securities convertible into or exercisable or exchangeable for shares of common stock, or enter into any swap or other arrangement that transfers to another, in whole or in part, any of the economic consequences of ownership of the common stock or any securities convertible into or exercisable or exchangeable for shares of common stock, whether any of these transactions are to be settled by delivery of our common stock or other securities, in cash or otherwise, or publicly disclose the intention to effect any of these transactions. Morgan Stanley & Co. LLC and J.P. Morgan Securities LLC may, in their sole discretion, at any time without prior notice, release all or any portion of the shares from the restrictions in any such agreement.
If:
- •
- during the last 17 days of the 180-day restricted period, we issue an earnings release or material news or a
material event relating to us occurs; or
- •
- prior to the expiration of the 180-day restricted period, we announce that we will release earnings results during the 16 day period beginning on the last day of the 180-day period or provide notification to Morgan Stanley & Co. LLC and J.P. Morgan Securities LLC of any earnings release or material news or material event that may give rise to an extension of the initial 180-day restricted period.
138
Registration Rights
We are party to an investor rights agreement that provides that holders of our preferred stock have the right to demand that we file a registration statement or request that their shares be covered by a registration statement that we are otherwise filing. See "Description of Capital Stock—Registration Rights." Except for shares purchased by affiliates, registration of their shares under the Securities Act would result in these shares becoming freely tradable without restriction under the Securities Act immediately upon effectiveness of the registration, subject to the expiration of the lock-up period and to the extent such shares have been released from any repurchase option that we may hold.
Stock Plans
As soon as practicable after the completion of this offering, we intend to file a Form S-8 registration statement under the Securities Act to register shares of our common stock subject to options outstanding or reserved for issuance under our 2004 Equity Incentive Plan and our 2011 Equity Incentive Award Plan. This registration statement will become effective immediately upon filing, and shares covered by this registration statement will thereupon be eligible for sale in the public markets, subject to Rule 144 limitations applicable to affiliates and any lock-up agreements. For a more complete discussion of our stock plans, see "Executive Compensation—Equity Incentive Plans."
139
MATERIAL UNITED STATES FEDERAL INCOME TAX
CONSEQUENCES TO NON-U.S. HOLDERS
The following is a summary of the material United States federal income tax consequences to non-U.S. holders (as defined below) of the acquisition, ownership and disposition of our common stock issued pursuant to this offering. This discussion is not a complete analysis of all of the potential United States federal income tax consequences relating thereto, nor does it address any estate and gift tax consequences or any tax consequences arising under any state, local or foreign tax laws, or any other United States federal tax laws. This discussion is based on the Internal Revenue Code of 1986, as amended, or the Code, Treasury Regulations promulgated thereunder, judicial decisions, and published rulings and administrative pronouncements of the Internal Revenue Service, or IRS, all as in effect as of the date of this offering. These authorities may change, possibly retroactively, resulting in United States federal income tax consequences different from those discussed below. No ruling has been or will be sought from the IRS with respect to the matters discussed below, and there can be no assurance that the IRS will not take a contrary position regarding the tax consequences of the acquisition, ownership or disposition of our common stock, or that any such contrary position would not be sustained by a court.
This discussion is limited to non-U.S. holders who purchase our common stock issued pursuant to this offering and who hold our common stock as a "capital asset" within the meaning of Section 1221 of the Code (generally, property held for investment). This discussion does not address all of the United States federal income tax consequences that may be relevant to a particular holder in light of such holder's particular circumstances. This discussion also does not consider any specific facts or circumstances that may be relevant to holders subject to special rules under the United States federal income tax laws, including, without limitation:
- •
- U.S. expatriates or former long-term residents of the United States;
- •
- partnerships or other pass-through entities;
- •
- "controlled foreign corporations," "passive foreign investment companies" or corporations that accumulate earnings to
avoid United States federal income tax;
- •
- banks, insurance companies, or other financial institutions;
- •
- brokers, dealers, or traders in securities, commodities or currencies;
- •
- tax-exempt organizations;
- •
- tax-qualified retirement plans; or
- •
- persons holding our common stock as part of a hedge, straddle or other risk reduction strategy or as part of a conversion transaction or other integrated investment.
PROSPECTIVE INVESTORS ARE URGED TO CONSULT THEIR TAX ADVISORS REGARDING THE PARTICULAR UNITED STATES FEDERAL INCOME TAX CONSEQUENCES TO THEM OF ACQUIRING, OWNING AND DISPOSING OF OUR COMMON STOCK, AS WELL AS ANY TAX CONSEQUENCES ARISING UNDER ANY STATE, LOCAL OR FOREIGN TAX LAWS AND ANY OTHER UNITED STATES FEDERAL TAX LAWS.
Definition of Non-U.S. Holder
For purposes of this discussion, a non-U.S. holder is any beneficial owner of our common stock that is not a "U.S. person" or a partnership (or other entity treated as a partnership) for United States federal income tax purposes. A U.S. person is any of the following:
- •
- an individual citizen or resident of the United States;
140
- •
- a corporation (or other entity treated as a corporation for United States federal income tax purposes) created or
organized under the laws of the United States, any state therein or the District of Columbia;
- •
- an estate the income of which is subject to United States federal income tax regardless of its source; or
- •
- a trust (1) the administration of which is subject to the primary supervision of a United States court and all substantial decisions of which are controlled by one or more United States persons or (2) that has a valid election in effect under applicable Treasury Regulations to be treated as a U.S. person.
Distributions on Our Common Stock
If we make cash or other property distributions on our common stock, such distributions will constitute dividends for United States federal income tax purposes to the extent paid from our current or accumulated earnings and profits, as determined under United States federal income tax principles. Amounts not treated as dividends for United States federal income tax purposes will constitute a return of capital and will first be applied against and reduce a holder's adjusted tax basis in the common stock, but not below zero. Distributions in excess of our current and accumulated earnings and profits and in excess of a non-U.S. holder's tax basis in its shares will be treated as gain realized on the sale or other disposition of the common stock and will be treated as described under "Gain on Disposition of Our Common Stock" below.
Dividends paid to a non-U.S. holder of our common stock will be subject to United States federal withholding tax at a rate of 30% of the gross amount of the dividends, or such lower rate specified by an applicable income tax treaty. To receive the benefit of a reduced treaty rate, a non-U.S. holder must furnish to us or our paying agent a valid IRS Form W-8BEN (or applicable successor form) certifying such holder's qualification for the reduced rate. This certification must be provided to us or our paying agent prior to the payment of dividends and must be updated periodically. Non-U.S. holders that do not timely provide us or our paying agent with the required certification, but who qualify for a reduced treaty rate, may obtain a refund of any excess amounts withheld by timely filing an appropriate claim for refund with the IRS.
If a non-U.S. holder holds our common stock in connection with the conduct of a trade or business in the United States, and dividends paid on the common stock are effectively connected with such holder's United States trade or business (and if required by an applicable income tax treaty, attributable to a permanent establishment maintained by the non-U.S. holder in the United States), the non-U.S. holder will be exempt from United States federal withholding tax. To claim the exemption, the non-U.S. holder must furnish to us or our paying agent a properly executed IRS Form W-8ECI (or applicable successor form).
Any dividends paid on our common stock that are effectively connected with a non-U.S. holder's United States trade or business (and if required by an applicable income tax treaty, attributable to a permanent establishment maintained by the non-U.S. holder in the United States) will be subject to United States federal income tax on a net income basis at the regular graduated United States federal income tax rates in much the same manner as if such holder were a resident of the United States. A non-U.S. holder that is a foreign corporation also may be subject to a branch profits tax equal to 30% (or such lower rate specified by an applicable income tax treaty) of a portion of its effectively connected earnings and profits for the taxable year, as adjusted for certain items. Non-U.S. holders are urged to consult any applicable income tax treaties that may provide for different rules.
141
A non-U.S. holder who claims the benefit of an applicable income tax treaty will be required to satisfy applicable certification and other requirements prior to the distribution date. Non-U.S. holders should consult their tax advisors regarding their entitlement to benefits under a relevant income tax treaty.
Gain on Disposition of Our Common Stock
A non-U.S. holder will not be subject to United States federal income tax on any gain realized upon the sale or other disposition of our common stock, unless:
- •
- the gain is effectively connected with the non-U.S. holder's conduct of a trade or business in the United
States, and if required by an applicable income tax treaty, attributable to a permanent establishment maintained by the non-U.S. holder in the United States;
- •
- the non-U.S. holder is a nonresident alien individual present in the United States for 183 days or more
during the calendar year of the disposition, and certain other requirements are met; or
- •
- our common stock constitutes a "United States real property interest" by reason of our status as a United States real property holding corporation, or USRPHC, for United States federal income tax purposes at any time within the shorter of the five-year period preceding the disposition or the non-U.S. holder's holding period for our common stock. The determination of whether we are a USRPHC depends on the fair market value of our United States real property interests relative to the fair market value of our other trade or business assets and our foreign real property interests.
We believe we are not currently and do not anticipate becoming a USRPHC for United States federal income tax purposes. Even if we become a USRPHC, however, so long as our common stock is regularly traded on an established securities market, such common stock will be treated as U.S. real property interests only if the non-U.S. holder actually or constructively holds more than 5% of our common stock.
Gain described in the first bullet point above will be subject to United States federal income tax on a net income basis at the regular graduated United States federal income tax rates in much the same manner as if such holder were a resident of the United States. Further, non-U.S. holders that are foreign corporations also may be subject to a branch profits tax equal to 30% (or such lower rate specified by an applicable income tax treaty) of a portion of its effectively connected earnings and profits for the taxable year, as adjusted for certain items.
Gain described in the second bullet point above will be subject to United States federal income tax at a flat 30% rate (or such lower rate specified by an applicable income tax treaty), but may be offset by United States source capital losses (even though the individual is not considered a resident of the United States).
Non-U.S. holders are urged to consult any applicable income tax treaties that may provide for different rules.
Information Reporting and Backup Withholding
We must report annually to the IRS and to each non-U.S. holder the amount of distributions on our common stock paid to such holder and the amount of any tax withheld with respect to those distributions. These information reporting requirements apply even if no withholding was required because the distributions were effectively connected with the holder's conduct of a United States trade or business, or withholding was reduced or eliminated by an applicable income tax treaty. This information also may be made available under a specific treaty or agreement with the tax authorities in the country in which the non-U.S. holder resides or is established. Backup withholding may apply to
142
distribution payments to a non-U.S. holder of our common stock and information reporting and backup withholding may apply to the payments of the proceeds of a sale of our common stock within the United States or through certain United States-related financial intermediaries, unless the non-U.S. holder furnishes to us or our paying agent the required certification as to its non-U.S. status, such as by providing a valid IRS Form W-8BEN or IRS Form W-8ECI, or certain other requirements are met. Notwithstanding the foregoing, backup withholding may apply if either we have or our paying agent has actual knowledge, or reason to know, that the holder is a U.S. person who is not an exempt recipient.
Backup withholding is not an additional tax. Any amounts withheld under the backup withholding rules may be allowed as a refund or a credit against a non-U.S. holder's United States federal income tax liability, provided the required information is timely furnished to the IRS.
New Legislation Relating to Foreign Accounts
Newly enacted legislation may impose withholding taxes on certain types of payments made to "foreign financial institutions" (as specially defined for the purposes of these rules) and certain other non-United States entities. Under this legislation, the failure to comply with additional certification, information reporting and other specified requirements could result in withholding tax being imposed on payments of dividends and sales proceeds to foreign intermediaries and certain non-United States holders. The legislation imposes a 30% withholding tax on dividends on, or gross proceeds from the sale or other disposition of, our common stock paid to a foreign financial institution or to a foreign non-financial entity, unless (i) the foreign financial institution undertakes certain diligence and reporting obligations or (ii) the foreign non-financial entity either certifies it does not have any substantial United States owners or furnishes identifying information regarding each substantial United States owner. If the payee is a foreign financial institution, it must enter into an agreement with the United States Treasury requiring, among other things, that it undertake to identify accounts held by certain United States persons or United States-owned foreign entities, annually report certain information about such accounts and withhold 30% on payments to account holders whose actions prevent it from complying with these reporting and other requirements. The legislation will apply to payments made after December 31, 2012 (subject to certain transition rules). Prospective investors should consult their tax advisors regarding this legislation.
143
Under the terms and subject to the conditions in an underwriting agreement dated the date of this prospectus, the underwriters named below, for whom Morgan Stanley & Co. LLC, J.P. Morgan Securities LLC and Barclays Capital Inc. are acting as representatives, have severally agreed to purchase, and we and the selling stockholders have agreed to sell to them, severally, the number of shares indicated below:
Name
|
Number of Shares | ||
|---|---|---|---|
Morgan Stanley & Co. LLC |
|||
J.P. Morgan Securities LLC |
|||
Barclays Capital Inc. |
|||
Pacific Crest Securities LLC |
|||
Needham & Company, LLC |
|||
Total |
|||
The underwriters and the representatives are collectively referred to as the "underwriters" and the "representatives," respectively. The underwriters are offering the shares of common stock subject to their acceptance of the shares from us and subject to prior sale. The underwriting agreement provides that the obligations of the several underwriters to pay for and accept delivery of the shares of common stock offered by this prospectus are subject to the approval of certain legal matters by their counsel and to certain other conditions. The underwriters are obligated to take and pay for all of the shares of common stock offered by this prospectus if any such shares are taken. However, the underwriters are not required to take or pay for the shares covered by the underwriters' option to purchase additional shares described below.
The underwriters initially propose to offer part of the shares of common stock directly to the public at the offering price listed on the cover page of this prospectus and part to certain dealers at a price that represents a concession not in excess of $ per share. After the initial offering of the shares of common stock, the offering price and other selling terms may from time to time be varied by the representatives.
We have granted to the underwriters an option, exercisable for 30 days from the date of this prospectus, to purchase, from time to time, in whole or in part, up to additional shares of common stock at the public offering price listed on the cover page of this prospectus, less underwriting discounts and commissions. The underwriters may exercise this option solely for the purpose of covering over-allotments, if any, made in connection with the offering of the shares of common stock offered by this prospectus. To the extent the option is exercised, each underwriter will become obligated, subject to certain conditions, to purchase about the same percentage of the additional shares of common stock as the number listed next to the underwriter's name in the preceding table bears to the total number of shares of common stock listed next to the names of all underwriters in the preceding table.
The following table shows the per share and total public offering price, underwriting discounts and commissions, and proceeds before expenses to us and the selling stockholders. These amounts are
144
shown assuming both no exercise and full exercise of the underwriters' option to purchase up to an additional shares of common stock.
| |
|
Total | |||||||||
|---|---|---|---|---|---|---|---|---|---|---|---|
| |
Per Share | No Exercise | Full Exercise | ||||||||
Public offering price |
$ | $ | $ | ||||||||
Underwriting discounts and commissions to be paid by: |
|||||||||||
Us |
$ | $ | $ | ||||||||
The selling stockholders |
$ | $ | $ | ||||||||
Proceeds, before expenses, to us |
$ | $ | $ | ||||||||
Proceeds, before expenses, to selling stockholders |
$ | $ | $ | ||||||||
The estimated offering expenses payable by us, exclusive of the underwriting discounts and commissions but inclusive of our obligation to reimburse Symyx for 50% of their underwriting discounts and commissions, are approximately $ .
The underwriters have informed us that they do not intend sales to discretionary accounts to exceed 5% of the total number of shares of common stock offered by them.
We have applied to have our common stock listed on The NASDAQ Global Market under the trading symbol "IMI."
We and all directors and officers and the holders of substantially all of our outstanding stock and stock options have agreed that, without the prior written consent of Morgan Stanley & Co. LLC and J.P. Morgan Securities LLC on behalf of the underwriters, we and they will not, during the period ending 180 days after the date of this prospectus:
- •
- offer, pledge, sell, contract to sell, sell any option or contract to purchase, purchase any option or contract to sell,
grant any option, right or warrant to purchase, lend, or otherwise transfer or dispose of, directly or indirectly, any shares of common stock or any securities convertible into or exercisable or
exchangeable for shares of common stock;
- •
- enter into any swap or other arrangement that transfers to another, in whole or in part, any of the economic consequences
of ownership of the common stock; or
- •
- file any registration statement with the SEC relating to the offering of any shares of common stock or any securities convertible into or exercisable or exchangeable for common stock,
whether any such transaction described in the first two bullet points above is to be settled by delivery of common stock or such other securities, in cash or otherwise. In addition, each such person agrees that, without the prior written consent of Morgan Stanley & Co. LLC and J.P. Morgan Securities LLC on behalf of the underwriters, it will not, during the period ending 180 days after the date of this prospectus, make any demand for, or exercise any right with respect to, the registration of any shares of common stock or any security convertible into or exercisable or exchangeable for common stock.
The restrictions described in the immediately preceding paragraph do not apply to:
- •
- the sale of shares to the underwriters;
- •
- the issuance of shares of common stock by us upon the exercise of an option or a warrant or the conversion of a security
outstanding on the date of this prospectus of which the underwriters have been advised in writing;
- •
- the issuance by us of stock options, restricted stock, restricted stock units or other equity awards pursuant to our equity incentive award plans described elsewhere in this prospectus;
145
- •
- the issuance by us of securities (and the agreement that provides for the issuance of such securities), or public
announcement thereof, in full or partial consideration of one or more future acquisitions or strategic investments, or the filing of a registration statement on Form S-4 under the
Securities Act related thereto; provided that the number of shares of common stock issued or issuable shall not, in the aggregate, exceed 10% of the number of shares of common stock outstanding as of
, 2011;
- •
- transactions by any person other than us relating to shares of common stock or other securities acquired in open market
transactions after the completion of the offering of the shares; provided that no filing under Section 16(a) of the Exchange Act is required or voluntarily made in connection with subsequent
sales of the common stock or other securities acquired in such open market transactions;
- •
- transfers by any person other than us of shares of common stock or any security convertible into or exercisable or
exchangeable for common stock (i) to an immediate family member of such person or to a trust formed for the benefit of an immediately family member, (ii) to a trust or other entity
formed for estate planning purposes in which such person is a beneficiary, (iii) as a bona fide gift or by will or intestacy; (iv) if such person is a corporation, partnership or other
business entity, (A) to limited partners, members or stockholders of such person or (B) to another corporation, partnership or other business entity that controls, is controlled by or is
under common control with such person; or (v) if such person is a trust, to a trustor or beneficiary of the trust; provided that (i) each transferee, donee or distributee shall sign and
deliver a lock-up agreement substantially in the form of the lock-up agreement signed and delivered by us and all directors and officers and the holders of substantially all of
our outstanding stock and stock options and (ii) no filing under Section 16(a) of the Exchange Act is required or voluntarily made during the restricted period;
- •
- the establishment of a trading plan pursuant to Rule 10b5-1 under the Exchange Act for the transfer of
shares of common stock, provided that such plan does not provide for the transfer of common stock during the restricted period and no public announcement or filing under the Exchange Act regarding the
establishment of such plan is required or voluntarily made during the restricted period;
- •
- transfers by any person other than us of shares of common stock to us pursuant to a net exercise or cashless exercise by
such person of any option or warrant to purchase shares of common stock or any security convertible into or exercisable or exchangeable for common stock that is outstanding as of the date of this
prospectus; provided that any common ctock acquired upon the net exercise or cashless exercise of such equity awards shall be subject to the same lock up restrictions and provided further that no
filing under Section 16(a) of the Exchange Act is required or voluntarily made during the restricted period; or
- •
- transfer by any person other than us of shares of common stock or any security convertible into or exercisable or exchangeable for common stock pursuant to a bona fide third party tender offer, merger, consolidation or other similar transaction made to all holders of common stock involving a change of control of us; provided that in the event that the tender offer, merger, consolidation or other such transaction is not completed, the common stock owned by such shall remain subject to the lock up restrictions.
The 180 day restricted period described in the immediately preceding paragraph will be extended if:
- •
- during the last 17 days of the 180-day restricted period, we issue an earnings release or material news or a material event relating to us occurs; or
146
- •
- prior to the expiration of the 180-day restricted period, we announce that we will release earnings results during the 16-day period beginning on the last day of the 180-day period or provide notification to Morgan Stanley & Co. LLC and J.P. Morgan Securities LLC of any earnings release or material news or material event that may give rise to an extension of the initial 180-day restricted period.
in which case the restrictions described in the immediately preceding paragraph will continue to apply until the expiration of the 18 day period beginning on the issuance of the earnings release or the occurrence of the material news or material event.
Morgan Stanley & Co. LLC and J.P. Morgan Securities LLC, in their sole discretion, may release the common stock and other securities subject to the lock-up agreements described above in whole or in part at any time with or without notice. When determining whether or not to release common stock and other securities from lock-up agreements, Morgan Stanley & Co. LLC and J.P. Morgan Securities LLC will consider, among other factors, the holder's reasons for requesting the release, the number of shares of common stock and other securities for which the release is being requested and market conditions at the time. At least two business days before the effectiveness of any written consent of Morgan Stanley & Co. LLC and J.P. Morgan Securities LLC during the 180 day period, (1) Morgan Stanley & Co. LLC and J.P. Morgan Securities LLC will notify the Company of the impending release or waiver of any restriction and (2) the Company has agreed to announce the impending release or waiver by press release through a major news service at least two business days before the effective date of the release or waiver, except where the release or waiver is effected solely to permit a transfer of common stock that is not for consideration and where the transferee has agreed in writing to be bound by the terms of this agreement.
In order to facilitate the offering of the common stock, the underwriters may engage in transactions that stabilize, maintain or otherwise affect the price of the common stock. Specifically, the underwriters may sell more shares than they are obligated to purchase under the underwriting agreement, creating a short position. A short sale is covered if the short position is no greater than the number of shares available for purchase by the underwriters under the option to purchase additional shares of common stock. The underwriters can close out a covered short sale by exercising the option to purchase additional shares of common stock or purchasing shares in the open market. In determining the source of shares to close out a covered short sale, the underwriters will consider, among other things, the open market price of shares compared to the price available under the option to purchase additional shares of common stock. The underwriters may also sell shares in excess of the option to purchase additional shares of common stock, creating a naked short position. The underwriters must close out any naked short position by purchasing shares in the open market. A naked short position is more likely to be created if the underwriters are concerned that there may be downward pressure on the price of the common stock in the open market after pricing that could adversely affect investors who purchase in this offering. As an additional means of facilitating the offering, the underwriters may bid for, and purchase, shares of common stock in the open market to stabilize the price of the common stock. These activities may raise or maintain the market price of the common stock above independent market levels or prevent or retard a decline in the market price of the common stock. The underwriters are not required to engage in these activities and may end any of these activities at any time.
The estimated offering expenses payable by us, in addition to the underwriting discounts and commissions, are approximately $ million, which includes legal, accounting and printing costs and various other fees associated with registering and listing our common stock. The underwriters have agreed to reimburse us and the selling stockholders for certain of these expenses.
We, the selling stockholders and the underwriters have agreed to indemnify each other against certain liabilities, including liabilities under the Securities Act.
147
A prospectus in electronic format may be made available on websites maintained by one or more underwriters, or selling group members, if any, participating in this offering. The representatives may agree to allocate a number of shares of common stock to underwriters for sale to their online brokerage account holders. Internet distributions will be allocated by the representatives to underwriters that may make Internet distributions on the same basis as other allocations.
Other than the prospectus in electronic format, the information on any underwriter's or selling group member's website and any information contained in any other website maintained by an underwriter or selling group member is not part of the prospectus or the registration statement of which this prospectus forms a part, has not been approved and/or endorsed by us or any underwriter or selling group member in its capacity as underwriter or selling group member and should not be relied upon by investors.
Pricing of the Offering
Prior to this offering, there has been no public market for our common stock. The initial public offering price will be determined by negotiations between us and the representatives. Among the factors to be considered in determining the initial public offering price will be our future prospects and those of our industry in general, our sales, earnings and certain other financial and operating information in recent periods, and the price-earnings ratios, price-sales ratios, market prices of securities, and certain financial and operating information of companies engaged in activities similar to ours.
Selling Restrictions
European Economic Area
In relation to each Member State of the European Economic Area which has implemented the Prospectus Directive (each, a "Relevant Member State") an offer to the public of any shares of our common stock may not be made in that Relevant Member State, except that an offer to the public in that Relevant Member State of any shares of our common stock may be made at any time under the following exemptions under the Prospectus Directive, if they have been implemented in that Relevant Member State:
(a) to any legal entity which is a qualified investor as defined in the Prospectus Directive;
(b) to fewer than 100 or, if the Relevant Member State has implemented the relevant provision of the 2010 PD Amending Directive, 150, natural or legal persons (other than qualified investors as defined in the Prospectus Directive), as permitted under the Prospectus Directive, subject to obtaining the prior consent of the representatives for any such offer; or
(c) in any other circumstances falling within Article 3(2) of the Prospectus Directive, provided that no such offer of shares of our common stock shall result in a requirement for the publication by us or any underwriter of a prospectus pursuant to Article 3 of the Prospectus Directive.
For the purposes of this provision, the expression an "offer to the public" in relation to any shares of our common stock in any Relevant Member State means the communication in any form and by any means of sufficient information on the terms of the offer and any shares of our common stock to be offered so as to enable an investor to decide to purchase any shares of our common stock, as the same may be varied in that Member State by any measure implementing the Prospectus Directive in that Member State, the expression "Prospectus Directive" means Directive 2003/71/EC (and amendments thereto, including the 2010 PD Amending Directive, to the extent implemented in the Relevant Member State), and includes any relevant implementing measure in the Relevant Member State, and the expression "2010 PD Amending Directive" means Directive 2010/73/EU.
148
United Kingdom
Each underwriter has represented and agreed that:
(a) it has only communicated or caused to be communicated and will only communicate or cause to be communicated an invitation or inducement to engage in investment activity (within the meaning of Section 21 of the FSMA) received by it in connection with the issue or sale of the shares of our common stock in circumstances in which Section 21(1) of the FSMA does not apply to us; and
(b) it has complied and will comply with all applicable provisions of the FSMA with respect to anything done by it in relation to the shares of our common stock in, from or otherwise involving the United Kingdom.
Australia
No prospectus or other disclosure document (as defined in the Corporations Act 2001 (Cth) of Australia (Corporations Act)) in relation to the shares of our common stock has been or will be lodged with the Australian Securities & Investments Commission (ASIC). This document has not been lodged with ASIC and is only directed to certain categories of exempt persons. Accordingly, if you receive this document in Australia:
(a) you confirm and warrant that you are either:
(i) a "sophisticated investor" under section 708(8)(a) or (b) of the Corporations Act;
(ii) a "sophisticated investor" under section 708(8)(c) or (d) of the Corporations Act and that you have provided an accountant's certificate to us which complies with the requirements of section 708(8)(c)(i) or (ii) of the Corporations Act and related regulations before the offer has been made;
(iii) a person associated with the company under section 708(12) of the Corporations Act; or
(iv) a "professional investor" within the meaning of section 708(11)(a) or (b) of the Corporations Act,
and to the extent that you are unable to confirm or warrant that you are an exempt sophisticated investor, associated person or professional investor under the Corporations Act any offer made to you under this document is void and incapable of acceptance; and
(b) you warrant and agree that you will not offer any of the shares of our common stock for resale in Australia within 12 months of those shares of our common stock being issued unless any such resale offer is exempt from the requirement to issue a disclosure document under section 708 of the Corporations Act.
Hong Kong
Each underwriter has represented and agreed that:
(a) it has not offered or sold and will not offer or sell in Hong Kong, by means of any document, any shares of our common stock other than (i) to "professional investors" as defined in the Securities and Futures Ordinance (Cap. 571) of Hong Kong and any rules made under that Ordinance; or (ii) in other circumstances which do not result in the document being a "prospectus" as defined in the Companies Ordinance (Cap. 32) of Hong Kong or which do not constitute an offer to the public within the meaning of that Ordinance; and
149
(b) it has not issued or had in its possession for the purposes of issue, and will not issue or have in its possession for the purposes of issue, whether in Hong Kong or elsewhere, any advertisement, invitation or document relating to the shares of our common stock, which is directed at, or the contents of which are likely to be accessed or read by, the public of Hong Kong (except if permitted to do so under the securities laws of Hong Kong) other than with respect to the shares of our common stock which are or are intended to be disposed of only to persons outside of Hong Kong or only to "professional investors" as defined in the Securities and Futures Ordinance and any rules made under that Ordinance.
India
This prospectus has not been and will not be registered as a prospectus with the Registrar of Companies in India or with the Securities and Exchange Board of India. This prospectus or any other material relating to these securities is for information purposes only and may not be circulated or distributed, directly or indirectly, to the public or any members of the public in India and in any event to not more than 50 persons in India. Further, persons into whose possession this prospectus comes are required to inform themselves about and to observe any such restrictions. Each prospective investor is advised to consult its advisors about the particular consequences to it of an investment in these securities. Each prospective investor is also advised that any investment in these securities by it is subject to the regulations prescribed by the Reserve Bank of India and the Foreign Exchange Management Act and any regulations framed thereunder.
Japan
No securities registration statement (SRS) has been filed under Article 4, Paragraph 1 of the Financial Instruments and Exchange Law of Japan (Law No. 25 of 1948, as amended) (FIEL) in relation to the shares of our common stock. The shares of our common stock are being offered in a private placement to "qualified institutional investors" (tekikaku-kikan-toshika) under Article 10 of the Cabinet Office Ordinance concerning Definitions provided in Article 2 of the FIEL (the Ministry of Finance Ordinance No. 14, as amended) (QIIs), under Article 2, Paragraph 3, Item 2 i of the FIEL.
Korea
The shares of our common stock may not be offered, sold and delivered directly or indirectly, or offered or sold to any person for reoffering or resale, directly or indirectly, in Korea or to any resident of Korea except pursuant to the applicable laws and regulations of Korea, including the Korea Securities and Exchange Act and the Foreign Exchange Transaction Law and the decrees and regulations thereunder. The shares of our common stock have not been registered with the Financial Services Commission of Korea for public offering in Korea. Furthermore, the shares of our common stock may not be resold to Korean residents unless the purchaser of the shares of our common stock complies with all applicable regulatory requirements (including but not limited to government approval requirements under the Foreign Exchange Transaction Law and its subordinate decrees and regulations) in connection with the purchase of the shares of our common stock.
Singapore
This prospectus has not been registered as a prospectus with the Monetary Authority of Singapore. Accordingly, this prospectus and any other document or material in connection with the offer or sale, or invitation for subscription or purchase, of the shares of our common stock may not be circulated or distributed, nor may the of our common stock be offered or sold, or be made the subject of an invitation for subscription or purchase, whether directly or indirectly, to persons in Singapore other than (i) to an institutional investor under Section 274 of the Securities and Future Act, Chapter 289 of Singapore (the SFA), (ii) to a "relevant person" as defined in Section 275(2) of the SFA, or any person
150
pursuant to Section 275 (1A), and in accordance with the conditions, specified in Section 275 of the SFA or (iii) otherwise pursuant to, and in accordance with the conditions of, any other applicable provision of the SFA.
Where the shares of our common stock are subscribed and purchased under Section 275 of the SFA by a relevant person which is:
(a) a corporation (which is not an accredited investor (as defined in Section 4A of the SFA)) the sole business of which is to hold investments and the entire share capital of which is owned by one or more individuals, each of whom is an accredited investor; or
(b) a trust (where the trustee is not an accredited investor (as defined in Section 4A of the SFA)) whose sole whole purpose is to hold investments and each beneficiary is an accredited investor,
shares, debentures and units of shares and debentures of that corporation or the beneficiaries' rights and interest (howsoever described) in that trust shall not be transferable within six months after that corporation or that trust has acquired the shares of our common stock under Section 275 of the SFA except:
(i) to an institutional investor under Section 274 of the SFA or to a relevant person (as defined in Section 275(2) of the SFA) and in accordance with the conditions, specified in Section 275 of the SFA;
(ii) (in the case of a corporation) where the transfer arises from an offer referred to in Section 275(1A) of the SFA, or (in the case of a trust) where the transfer arises from an offer that is made on terms that such rights or interests are acquired at a consideration of not less than S$200,000 (or its equivalent in a foreign currency) for each transaction, whether such amount is to be paid for in cash or by exchange of securities or other assets;
(iii) where no consideration is or will be given for the transfer; or
(iv) where the transfer is by operation of law.
By accepting this prospectus, the recipient hereof represents and warrants that he is entitled to receive it in accordance with the restrictions set forth above and agrees to be bound by limitations contained herein. Any failure to comply with these limitations may constitute a violation of law.
151
The validity of our common stock offered by this prospectus will be passed upon for us by Latham & Watkins LLP, Menlo Park, California. Certain attorneys and investment funds affiliated with Latham & Watkins LLP collectively own shares of preferred stock, which will convert into shares of common stock upon the completion of this offering, as well as options to purchase shares of our common stock pursuant to our 2004 Equity Incentive Plan, altogether comprising less than 1% of our shares of common stock upon the completion of this offering. Certain legal matters in connection with this offering will be passed upon for the selling stockholders by . Certain legal matters in connection with this offering will be passed upon for the underwriters by Davis Polk & Wardwell LLP, Menlo Park, California.
The consolidated financial statements of Intermolecular, Inc. and subsidiaries as of December 31, 2010 and 2009, and for each of the years in the three-year period ended December 31, 2010, have been included herein and in the registration statement in reliance upon the report of KPMG LLP, independent registered public accounting firm, appearing elsewhere herein, and upon the authority of said firm as experts in accounting and auditing. The audit report covering the December 31, 2010 financial statements refers to the change in the manner in which the Company accounted for convertible preferred stock.
WHERE YOU CAN FIND ADDITIONAL INFORMATION
We have filed with the SEC a registration statement on Form S-1 under the Securities Act with respect to the shares of our common stock offered hereby. This prospectus does not contain all of the information set forth in the registration statement and the exhibits and schedules thereto. Some items are omitted in accordance with the rules and regulations of the SEC. For further information with respect to us and the common stock offered hereby, we refer you to the registration statement and the exhibits and schedules filed therewith. Statements contained in this prospectus as to the contents of any contract, agreement or any other document are summaries of the material terms of this contract, agreement or other document. A copy of the registration statement, and the exhibits and schedules thereto, may be inspected without charge at the public reference facilities maintained by the SEC at 100 F Street, N.E., Washington, D.C. 20549. Copies of these materials may be obtained by writing to the Public Reference Section of the SEC at 100 F Street, N.E., Washington, D.C. 20549. Please call the SEC at 1-800-SEC-0330 for further information on the operation of the public reference facility. The SEC maintains a website that contains reports, proxy and information statements and other information regarding registrants that file electronically with the SEC. The address of the SEC's website is http://www.sec.gov.
Upon completion of this offering, we will become subject to the information and periodic reporting requirements of the Exchange Act and, in accordance therewith, will file periodic reports, proxy statements and other information with the SEC. Such periodic reports, proxy statements and other information will be available for inspection and copying at the public reference room and web site of the SEC referred to above. We maintain a website at www.intermolecular.com. You may access our annual report on Form 10-K, quarterly reports on Form 10-Q, current reports on Form 8-K, and amendments to those reports filed or furnished pursuant to Section 13(a) or 15(d) of the Exchange Act with the SEC free of charge at our website as soon as reasonably practicable after such material is electronically filed with, or furnished to, the SEC. The reference to our website address does not constitute incorporation by reference of the information contained on or accessible through our website.
152
INDEX TO CONSOLIDATED FINANCIAL STATEMENTS
INTERMOLECULAR, INC. AND SUBSIDIARIES
Consolidated Financial Statements
Years Ended December 31, 2008, 2009 and 2010 and the
Six Months Ended June 30, 2010 and 2011
F-1
Report of Independent Registered Public Accounting Firm
The
Board of Directors
Intermolecular, Inc.:
We have audited the accompanying consolidated balance sheets of Intermolecular, Inc. and subsidiaries (the Company) as of December 31, 2009 and 2010, and the related consolidated statements of operations, redeemable convertible preferred stock and of stockholders' deficit and cash flows for each of the years in the three-year period ended December 31, 2010. These consolidated financial statements are the responsibility of the Company's management. Our responsibility is to express an opinion on these consolidated financial statements based on our audits.
We conducted our audits in accordance with the standards of the Public Company Accounting Oversight Board (United States). Those standards require that we plan and perform the audit to obtain reasonable assurance about whether the financial statements are free of material misstatement. An audit includes examining, on a test basis, evidence supporting the amounts and disclosures in the financial statements. An audit also includes assessing the accounting principles used and significant estimates made by management, as well as evaluating the overall financial statement presentation. We believe that our audits provide a reasonable basis for our opinion.
In our opinion, the consolidated financial statements referred to above present fairly, in all material respects, the financial position of Intermolecular, Inc. and subsidiaries as of December 31, 2009 and 2010, and the results of their operations and their cash flows for each of the years in the three-year period ended December 31, 2010, in conformity with U.S. generally accepted accounting principles.
As discussed in note 6(a) to the consolidated financial statements, effective for all periods presented, the Company changed the manner in which it accounted for redeemable convertible preferred stock.
/s/ KPMG LLP
Mountain
View, California
June 30, 2011, except as related
to note 6(a) to the consolidated
financial statements which is as
of July 28, 2011
F-2
INTERMOLECULAR, INC. AND SUBSIDIARIES
Consolidated Balance Sheets
(In thousands, except share and per share data)
| |
December 31, 2009 |
December 31, 2010 |
June 30, 2011 |
Pro Forma Stockholders' Equity as of June 30, 2011 |
||||||||||||
|---|---|---|---|---|---|---|---|---|---|---|---|---|---|---|---|---|
| |
|
|
(unaudited) |
|||||||||||||
ASSETS |
||||||||||||||||
Current assets: |
||||||||||||||||
Cash and cash equivalents |
$ | 20,856 | $ | 23,064 | $ | 34,880 | ||||||||||
Short-term investments |
11,764 | — | 750 | |||||||||||||
Accounts receivable, net of allowance for doubtful accounts of zero as of December 31, 2009 and 2010 and June 30, 2011 (unaudited) |
— | 3,296 | 3,298 | |||||||||||||
Accounts receivable, due from related parties |
1,189 | 836 | 972 | |||||||||||||
Prepaid expenses and other current assets |
3,442 | 1,868 | 2,029 | |||||||||||||
Total current assets |
37,251 | 29,064 | 41,929 | |||||||||||||
Inventory |
1,379 | 2,189 | 2,055 | |||||||||||||
Property and equipment, net |
13,874 | 21,728 | 22,278 | |||||||||||||
Intangible assets, net |
1,664 | 2,238 | 2,638 | |||||||||||||
Restricted cash |
173 | 173 | 173 | |||||||||||||
Other assets |
128 | 179 | 226 | |||||||||||||
Total assets |
$ | 54,469 | $ | 55,571 | $ | 69,299 | ||||||||||
LIABILITIES, REDEEMABLE CONVERTIBLE PREFERRED STOCK AND STOCKHOLDERS' EQUITY (DEFICIT) |
||||||||||||||||
Current liabilities: |
||||||||||||||||
Accounts payable |
$ | 426 | $ | 2,806 | $ | 839 | ||||||||||
Accrued payable, due to related parties |
502 | 795 | — | |||||||||||||
Accrued liabilities |
1,428 | 2,720 | 3,854 | |||||||||||||
Accrued compensation and employee benefits |
1,219 | 2,243 | 2,025 | |||||||||||||
Deferred revenue, current portion |
1,876 | 5,233 | 3,289 | |||||||||||||
Related party deferred revenue, current portion |
15,252 | 10,227 | 7,325 | |||||||||||||
Preferred stock warrant liability |
159 | 215 | 670 | |||||||||||||
Total current liabilities |
20,862 | 24,239 | 18,002 | |||||||||||||
Deferred revenue, net of current portion |
— | 1,470 | — | |||||||||||||
Related party deferred revenue, net of current portion |
7,500 | 3,216 | 1,250 | |||||||||||||
Deferred rent, net of current portion |
99 | 808 | 1,071 | |||||||||||||
Other long-term liabilities |
— | 135 | 115 | |||||||||||||
Total liabilities |
28,461 | 29,868 | 20,438 | |||||||||||||
Commitments and contingencies (note 5) |
||||||||||||||||
Redeemable convertible preferred stock, par value $0.001 per share—56,000,000, 56,000,000 and 59,230,199 shares authorized as of December 31, 2009 and 2010 and June 30, 2011 (unaudited); 52,443,325, 52,443,325 and 58,461,447 shares issued and outstanding as of December 31, 2009 and 2010 and June 30, 2011 (unaudited); liquidation preference of $80,975 as of June 30, 2011 (unaudited), actual; no shares issued and outstanding, pro forma (unaudited) |
55,633 | 55,633 | 80,515 | |||||||||||||
Accumulated accretion of redeemable convertible preferred stock to redemption values |
20,264 | 34,426 | 41,521 | |||||||||||||
Total redeemable convertible preferred stock |
75,897 | 90,059 | 122,036 | |||||||||||||
Stockholders' equity (deficit): |
||||||||||||||||
Common stock, par value $0.001 per share—85,000,000, 85,000,000 and 105,000,000 shares authorized as of December 31, 2009 and 2010 and June 30, 2011 (unaudited); 11,065,607, 11,239,439 and 11,555,956 shares issued and outstanding as of December 31, 2009 and 2010 and June 30, 2011 (unaudited), actual; 72,639,388 shares issued and outstanding, pro forma (unaudited) |
11 | 11 | 12 | $ | 73 | |||||||||||
Additional paid-in capital |
— | — | — | 129,021 | ||||||||||||
Accumulated deficit |
(49,900 | ) | (64,367 | ) | (73,187 | ) | (73,187 | ) | ||||||||
Total stockholders' (deficit) equity |
(49,889 | ) | (64,356 | ) | (73,175 | ) | $ | 55,907 | ||||||||
Total liabilities, redeemable convertible preferred stock and stockholders' equity (deficit) |
$ | 54,469 | $ | 55,571 | $ | 69,299 | ||||||||||
See accompanying notes to consolidated financial statements.
F-3
INTERMOLECULAR, INC. AND SUBSIDIARIES
Consolidated Statement of Operations
(In thousands, except share and per share data)
| |
Years Ended December 31, | Six Months Ended June 30, |
|||||||||||||||||
|---|---|---|---|---|---|---|---|---|---|---|---|---|---|---|---|---|---|---|---|
| |
2008 | 2009 | 2010 | 2010 | 2011 | ||||||||||||||
| |
|
|
|
(unaudited) |
|||||||||||||||
Revenue: |
|||||||||||||||||||
Collaborative development program and services revenue |
$ | 14,647 | $ | 14,182 | $ | 27,705 | $ | 9,806 | $ | 15,820 | |||||||||
Product revenue |
6,206 | 9,065 | 6,959 | 3,300 | 1,360 | ||||||||||||||
Licensing and royalty revenue |
2,276 | 3,663 | 8,010 | 3,386 | 6,644 | ||||||||||||||
Total revenue |
23,129 | 26,910 | 42,674 | 16,492 | 23,824 | ||||||||||||||
Cost of revenue: |
|||||||||||||||||||
Cost of collaborative development program and services revenue |
9,141 | 8,849 | 16,855 | 6,932 | 10,533 | ||||||||||||||
Cost of product revenue |
3,370 | 3,972 | 3,665 | 1,652 | 469 | ||||||||||||||
Cost of licensing and royalty revenue |
114 | 197 | 406 | 168 | 321 | ||||||||||||||
Total cost of revenue |
12,625 | 13,018 | 20,926 | 8,752 | 11,323 | ||||||||||||||
Gross profit |
10,504 | 13,892 | 21,748 | 7,740 | 12,501 | ||||||||||||||
Operating expenses: |
|||||||||||||||||||
Research and development |
11,849 | 10,983 | 13,917 | 6,353 | 9,488 | ||||||||||||||
Sales and marketing |
3,849 | 3,211 | 4,074 | 1,926 | 1,980 | ||||||||||||||
General and administrative |
4,300 | 4,867 | 5,761 | 2,877 | 3,925 | ||||||||||||||
Total operating expenses |
19,998 | 19,061 | 23,752 | 11,156 | 15,393 | ||||||||||||||
Loss from operations |
(9,494 | ) | (5,169 | ) | (2,004 | ) | (3,416 | ) | (2,892 | ) | |||||||||
Other income (expense): |
|||||||||||||||||||
Interest income, net |
174 | (6 | ) | 43 | 17 | 10 | |||||||||||||
Other income (expense), net |
6 | (62 | ) | 202 | 55 | (335 | ) | ||||||||||||
Total other income (expense), net |
180 | (68 | ) | 245 | 72 | (325 | ) | ||||||||||||
Loss before provision for income taxes |
(9,314 |
) |
(5,237 |
) |
(1,759 |
) |
(3,344 |
) |
(3,217 |
) |
|||||||||
Provision for income taxes |
186 | 17 | 19 | 2 | 13 | ||||||||||||||
Net loss |
(9,500 | ) | (5,254 | ) | (1,778 | ) | (3,346 | ) | $ | (3,230 | ) | ||||||||
Accretion on redeemable convertible preferred stock |
(5,436 |
) |
(9,170 |
) |
(14,162 |
) |
(6,340 |
) |
(7,095 |
) |
|||||||||
Net loss attributable to common stockholders |
$ | (14,936 | ) | $ | (14,424 | ) | $ | (15,940 | ) | $ | (9,686 | ) | $ | (10,325 | ) | ||||
Net loss per share of common stock, basic and diluted |
$ | (1.39 | ) | $ | (1.31 | ) | $ | (1.43 | ) | $ | (0.87 | ) | $ | (0.91 | ) | ||||
Weighted-average number of shares used in computing net loss per share of common stock, basic and diluted |
10,716,462 | 11,023,779 | 11,134,573 | 11,115,486 | 11,296,902 | ||||||||||||||
Pro forma net loss per share of common stock, basic and diluted |
$ | (0.03 | ) | $ | (0.04 | ) | |||||||||||||
Weighted-average number of shares used in computing pro forma net loss per share of common stock, basic and diluted |
65,376,321 | 68,243,300 | |||||||||||||||||
Related Party Transactions
The Consolidated Statements of Operations shown above include the following related party transactions:
| |
Years Ended December 31, | Six Months Ended June 30, |
||||||||||||||||
|---|---|---|---|---|---|---|---|---|---|---|---|---|---|---|---|---|---|---|
| |
2008 | 2009 | 2010 | 2010 | 2011 | |||||||||||||
| |
|
|
|
(unaudited) |
||||||||||||||
Revenue: |
||||||||||||||||||
Collaborative development program and services revenue |
$ | 6,625 | $ | 3,263 | $ | 13,382 | $ | 4,883 | $ | 5,511 | ||||||||
Product revenue |
6,206 | 9,065 | 6,047 | 3,300 | 4 | |||||||||||||
Licensing and royalty revenue |
2,276 | 3,663 | 6,584 | 3,261 | 4,844 | |||||||||||||
Total revenue |
$ | 15,107 | $ | 15,991 | $ | 26,013 | $ | 11,444 | $ | 10,359 | ||||||||
Cost of Revenue: |
||||||||||||||||||
Cost of collaborative development program and services revenue |
625 | 597 | 1,250 | 443 | 299 | |||||||||||||
Cost of product revenue |
310 | 429 | 322 | 164 | 45 | |||||||||||||
Cost of licensing and royalty revenue |
114 | 197 | 406 | 168 | 220 | |||||||||||||
Total cost of revenue |
$ | 1,049 | $ | 1,223 | $ | 1,978 | $ | 775 | $ | 564 | ||||||||
See accompanying notes to consolidated financial statements.
F-4
INTERMOLECULAR, INC. AND SUBSIDIARIES
Consolidated Statements of Redeemable Convertible Preferred Stock and of Stockholders' Deficit
(In thousands, except share data)
| |
|
|
|
Stockholders' Deficit | |||||||||||||||||||||
|---|---|---|---|---|---|---|---|---|---|---|---|---|---|---|---|---|---|---|---|---|---|---|---|---|---|
| |
Redeemable Convertible Preferred Stock |
|
|||||||||||||||||||||||
| |
|
Common stock | |
|
|
||||||||||||||||||||
| |
|
Additional paid-in capital |
Accumulated deficit |
Total stockholders' deficit |
|||||||||||||||||||||
| |
Shares | Amount | Shares | Amount | |||||||||||||||||||||
| |
|
||||||||||||||||||||||||
Balances as of December 31, 2007 |
45,867,493 | $ | 41,394 | 10,517,487 | $ | 11 | $ | — | $ | (22,717 | ) | $ | (22,706 | ) | |||||||||||
Issuance of common stock from option exercises |
— | — | 489,270 | — | 147 | — | 147 | ||||||||||||||||||
Issuance of Series D redeemable convertible preferred stock (net of issuance costs of $90) |
6,575,832 | 19,910 | — | — | — | — | — | ||||||||||||||||||
Stock-based compensation |
— | — | — | — | 916 | — | 916 | ||||||||||||||||||
Accretion of preferred stock to redemption amount |
— | 5,436 | — | — | (1,063 | ) | (4,373 | ) | (5,436 | ) | |||||||||||||||
Net loss (restated) |
— | — | — | — | — | (9,500 | ) | (9,500 | ) | ||||||||||||||||
Balances as of December 31, 2008 |
52,443,325 | 66,740 | 11,006,757 | 11 | — | (36,590 | ) | (36,579 | ) | ||||||||||||||||
Issuance of common stock from option exercises |
— | — | 58,850 | — | 33 | — | 33 | ||||||||||||||||||
Issuance cost increase of Series D redeemable convertible preferred stock increase to $103 |
— | (13 | ) | — | — | — | — | — | |||||||||||||||||
Stock-based compensation |
— | — | — | — | 1,081 | — | 1,081 | ||||||||||||||||||
Accretion of preferred stock to redemption amount |
— | 9,170 | — | — | (1,114 | ) | (8,056 | ) | (9,170 | ) | |||||||||||||||
Net loss (restated) |
— | — | — | — | — | (5,254 | ) | (5,254 | ) | ||||||||||||||||
Balances as of December 31, 2009 |
52,443,325 | 75,897 | 11,065,607 | 11 | — | (49,900 | ) | (49,889 | ) | ||||||||||||||||
Issuance of common stock from option exercises |
— | — | 173,832 | — | 109 | — | 109 | ||||||||||||||||||
Stock-based compensation |
— | — | — | — | 1,364 | — | 1,364 | ||||||||||||||||||
Accretion of preferred stock to redemption amount |
— | 14,162 | — | — | (1,473 | ) | (12,689 | ) | (14,162 | ) | |||||||||||||||
Net loss |
— | — | — | — | — | (1,778 | ) | (1,778 | ) | ||||||||||||||||
Balances as of December 31, 2010 |
52,443,325 | 90,059 | 11,239,439 | 11 | — | (64,367 | ) | (64,356 | ) | ||||||||||||||||
Issuance of Series E redeemable convertible preferred stock (net of issuance costs of $118) (unaudited) |
6,018,122 | 24,882 | — | — | — | — | — | ||||||||||||||||||
Issuance of common stock from option exercises (unaudited) |
— | — | 306,517 | 1 | 170 | — | 171 | ||||||||||||||||||
Stock-based compensation (unaudited) |
— | — | — | — | 982 | — | 982 | ||||||||||||||||||
Issuance of common stock warrants (unaudited) |
— | — | — | — | 312 | — | 312 | ||||||||||||||||||
Non-cash issuance of common stock for services (unaudited) |
— | — | 10,000 | — | 41 | — | 41 | ||||||||||||||||||
Accretion of preferred stock to redemption amount (unaudited) |
— | 7,095 | — | — | (1,505 | ) | (5,590 | ) | (7,095 | ) | |||||||||||||||
Net loss (unaudited) |
— | — | — | — | — | (3,230 | ) | (3,230 | ) | ||||||||||||||||
Balances as of June 30, 2011 (unaudited) |
58,461,447 | $ | 122,036 | 11,555,956 | $ | 12 | $ | — | $ | (73,187 | ) | $ | (73,175 | ) | |||||||||||
See accompanying notes to consolidated financial statements.
F-5
INTERMOLECULAR, INC. AND SUBSIDIARIES
Consolidated Statements of Cash Flows
(In thousands)
| |
Years Ended December 31, | Six Months Ended June 30, |
||||||||||||||||||
|---|---|---|---|---|---|---|---|---|---|---|---|---|---|---|---|---|---|---|---|---|
| |
2008 | 2009 | 2010 | 2010 | 2011 | |||||||||||||||
| |
|
|
|
(unaudited) |
||||||||||||||||
Cash flows from operating activities: |
||||||||||||||||||||
Net loss |
$ | (9,500 | ) | $ | (5,254 | ) | $ | (1,778 | ) | $ | (3,346 | ) | $ | (3,230 | ) | |||||
Adjustments to reconcile net loss to net cash used in operating activities: |
||||||||||||||||||||
Depreciation and amortization |
3,430 | 4,380 | 4,971 | 2,412 | 3,504 | |||||||||||||||
Stock-based compensation |
916 | 1,081 | 1,364 | 675 | 982 | |||||||||||||||
Revaluation of preferred stock warrant liability |
80 | 42 | 56 | — | 455 | |||||||||||||||
Common stock warrant charge (contra revenue) |
— | — | — | — | 312 | |||||||||||||||
Changes in operating assets and liabilities: |
||||||||||||||||||||
Prepaid expenses and other assets |
(2,683 | ) | 279 | 1,523 | 1,209 | (167 | ) | |||||||||||||
Inventory |
(354 | ) | 778 | (810 | ) | (729 | ) | 134 | ||||||||||||
Accounts receivable |
(831 | ) | 567 | (2,943 | ) | (1,776 | ) | (138 | ) | |||||||||||
Accounts payable |
960 | (561 | ) | 1,000 | 198 | (668 | ) | |||||||||||||
Accrued and other liabilities |
(554 | ) | 293 | 2,274 | 391 | 1,113 | ||||||||||||||
Deferred revenue |
1,368 | 476 | 4,827 | 1,188 | (3,414 | ) | ||||||||||||||
Related party deferred revenue |
8,149 | (993 | ) | (9,309 | ) | (5,199 | ) | (4,868 | ) | |||||||||||
Net cash provided by (used in) operating activities |
981 | 1,088 | 1,175 | (4,977 | ) | (5,985 | ) | |||||||||||||
Cash flows from investing activities: |
||||||||||||||||||||
Purchase of short-term investments |
— | (11,764 | ) | — | 1,133 | (750 | ) | |||||||||||||
Redemption of short-term investments |
— | — | 11,764 | 5,016 | — | |||||||||||||||
Purchase of property and equipment |
(7,631 | ) | (4,810 | ) | (10,517 | ) | (2,691 | ) | (6,190 | ) | ||||||||||
Capitalized intangible assets |
(531 | ) | (134 | ) | (323 | ) | (156 | ) | (342 | ) | ||||||||||
Net cash (used in) provided by investing activities |
(8,162 | ) | (16,708 | ) | 924 | 3,302 | (7,282 | ) | ||||||||||||
Cash flows from financing activities: |
||||||||||||||||||||
Proceeds from long-term debt |
3,000 | — | — | — | — | |||||||||||||||
Payment of long-term debt |
(1,749 | ) | (4,446 | ) | — | — | — | |||||||||||||
Proceeds from issuance of common stock |
178 | 33 | 109 | 56 | 201 | |||||||||||||||
Proceeds from issuance of redeemable convertible preferred stock, net of issuance costs |
19,910 | (13 | ) | — | — | 24,882 | ||||||||||||||
Net cash provided by (used in) financing activities |
21,339 | (4,426 | ) | 109 | 56 | 25,083 | ||||||||||||||
Net increase in cash and cash equivalents |
14,158 | (20,046 | ) | 2,208 | (1,619 | ) | 11,816 | |||||||||||||
Cash and cash equivalents at beginning of period |
26,744 | 40,902 | 20,856 | 20,856 | 23,064 | |||||||||||||||
Cash and cash equivalents at end of period |
$ | 40,902 | $ | 20,856 | $ | 23,064 | $ | 19,237 | $ | 34,880 | ||||||||||
Supplemental disclosure of cash flow information: |
||||||||||||||||||||
Cash paid for interest |
$ | 295 | $ | 113 | $ | — | $ | — | $ | — | ||||||||||
Cash paid for income taxes, net of refunds received |
$ | 3 | $ | 279 | $ | (73 | ) | $ | 10 | $ | 11 | |||||||||
Noncash investing and financing activities |
||||||||||||||||||||
Accretion of redeemable convertible preferred stock |
$ | 5,436 | $ | 9,170 | $ | 14,162 | $ | 6,340 | $ | 7,095 | ||||||||||
See accompanying notes to consolidated financial statements.
F-6
INTERMOLECULAR, INC. AND SUBSIDIARIES
Notes to Consolidated Financial Statements
1. The Company and Summary of Significant Accounting Policies
Business
Intermolecular, Inc. and subsidiaries (the Company) is headquartered in San Jose, California and has wholly-owned subsidiaries in Hong Kong and Japan and a wholly-owned branch in Taiwan.
The Company develops and applies high productivity combinatorial research and development technologies to accelerate research and development, innovation and time to market for the semiconductor and clean-energy industries. The Company creates high productivity combinational systems and methods, which allow the Company to perform collaborative research and development services, sell high productivity combinatorial systems, and license intellectual property to customers.
The Company's consolidated financial statements have been prepared on a going-concern basis, which contemplates the realization of assets and the settlement of liabilities and commitments in the normal course of business. Since inception, the Company has incurred net losses and has accumulated a deficit of $64.4 million and $73.2 million as of December 31, 2010 and June 30, 2011, respectively.
Basis of Presentation
The Company's consolidated financial statements have been prepared in conformity with accounting principles generally accepted in the United States of America (GAAP) and include the accounts of the Company and its consolidated subsidiaries. All intercompany transactions and balances have been eliminated during consolidation. Certain prior-year balances have been reclassified to conform to current financial statement presentation.
The Company has evaluated subsequent events through June 30, 2011, which is the date the annual financial statements were issued. For the issuance of financial statements for the six months ended June 30, 2011, the unaudited interim period presented herein, such evaluation was performed through September 8, 2011.
Use of Estimates
The preparation of the accompanying consolidated financial statements in conformity with GAAP requires management to make estimates and assumptions about future events. These estimates and the underlying assumptions affect the amounts of assets and liabilities reported, disclosures about contingent assets and liabilities, and reported amounts of revenue and expenses. Such estimates include the valuations of accounts receivable, inventories, intangible assets, capital stock and warrants and assumptions used in the calculation of income taxes and stock-based compensation, among others. These estimates and assumptions are based on management's best estimates and judgment. Management evaluates its estimates and assumptions on an ongoing basis using historical experience and other factors and adjusts such estimates and assumptions when facts and circumstances dictate. As future events and their effects cannot be determined with precision, actual results could differ significantly from these estimates.
Unaudited Interim Financial Information
The accompanying interim consolidated balance sheet as of June 30, 2011, the consolidated interim statements of operations and cash flows during the six months ended June 30, 2010 and 2011 and the interim consolidated statement of redeemable convertible preferred stock and of stockholders' deficit during the six months ended June 30, 2011 are unaudited. The unaudited interim consolidated financial
F-7
INTERMOLECULAR, INC. AND SUBSIDIARIES
Notes to Consolidated Financial Statements (Continued)
1. The Company and Summary of Significant Accounting Policies (Continued)
statements have been prepared on a basis consistent with the annual consolidated financial statements and, in the opinion of management, reflect all adjustments, which include only normal recurring adjustments, necessary to present fairly the Company's consolidated financial position as of June 30, 2011 and its consolidated results of operations and cash flows during the six months ended June 30, 2010 and 2011. The financial data and the other financial information disclosed in these notes to the consolidated financial statements related to the six month periods are also unaudited. The consolidated results of operations during the six months ended June 30, 2011 are not necessarily indicative of the results to be expected during the year ending December 31, 2011 or for any other future annual or interim period.
Unaudited Pro Forma Stockholders' Equity
The unaudited pro forma stockholders' equity as of June 30, 2011 has been prepared assuming the automatic conversion of all outstanding shares of the Company's redeemable convertible preferred stock into shares of common stock immediately before the completion of an initial public offering and the resulting reclassification of accumulated accretion of redeemable convertible preferred stock and preferred stock warrant liability to additional paid-in capital. The pro forma shares of common stock outstanding as of June 30, 2011 reflect the conversion of the redeemable convertible preferred stock into 58,461,447 shares of common stock and the conversion of 2,621,985 preferred and common stock warrants that expire upon an initial public offering if unexercised.
Concentration of Credit Risk
Financial instruments that potentially subject the Company to concentration of credit risk consist of cash, cash equivalents and short-term investments. The Company's cash, cash equivalents and short-term investments consist of demand deposits, money market accounts and certificates of deposit maintained with high quality financial institutions.
Cash and Cash Equivalents
The Company considers all highly liquid investments purchased with a maturity of three months or less to be cash equivalents. The Company's cash equivalents are comprised of money market funds and are maintained with high quality financial institutions.
Short-Term Investments
The Company considers all high quality investments purchased with a maturity between three and twelve months to be short-term investments. The Company has short-term investments consisting of certificates of deposit maintained with high quality credit institutions. The carrying value of these investments approximates their fair value due to the short term of their maturities.
Restricted Cash
In connection with a lease transaction, the Company has restricted cash pledged as collateral representing a security deposit required by the lease agreement for its headquarters.
F-8
INTERMOLECULAR, INC. AND SUBSIDIARIES
Notes to Consolidated Financial Statements (Continued)
1. The Company and Summary of Significant Accounting Policies (Continued)
Inventory
Inventories are stated at the lower of cost or market value, with cost determined on an average cost basis. Inventories consist only of raw materials. Inventories in excess of salable amounts and spare parts inventories that are considered obsolete are recorded as a cost in the period in which they occur. The Company did not experience any significant inventory impairments during the three-year-period ended December 31, 2010 and the six months ended June 30, 2011.
Property and Equipment
Property and equipment are stated at cost less accumulated depreciation and amortization. Depreciation of equipment is recognized on a straight-line basis over the estimated useful lives of the equipment, ranging from three to five years. Leasehold improvements are amortized over the shorter of the lease term or the estimated useful life of the assets. Maintenance and repairs that do not extend the life of or improve an asset are expensed in the period incurred.
Intangible Assets
Intangible assets consist of issued and pending patents and trademarks as a result of third-party legal fees incurred in the patent and trademark application processes. Intangible assets with finite lives are amortized on a straight-line basis over their useful lives, while intangible assets without finite lives are not amortized. Upon the issuance of pending patent and trademark applications, the period of benefit will be determined. Patents, upon issuance, have a maximum life of 20 years from their application filing date. Trademarks, upon issuance, have an indefinite life and will not be amortized.
Impairment of Long-Lived Assets
The Company evaluates its long-lived assets, which consist of property and equipment and intangible assets, for indicators of possible impairment when events or changes in circumstances indicate the carrying amount of an asset may not be recoverable. Impairment exists if the carrying amounts of such assets exceed the estimates of future net undiscounted cash flows expected to be generated by such assets. Should impairment exist, the impairment loss would be measured based on the excess carrying value of the asset over the estimated fair value of the asset. As of December 31, 2009 and 2010 and June 30, 2011, the Company has not recorded an impairment on any of its long-lived assets.
Revenue Recognition
The Company derives its revenue from three principal sources: collaborative development programs and other services; product sales; and technology licensing and royalty fees. Revenue is recognized when all of the following criteria are met:
- •
- Persuasive evidence of an arrangement exists;
- •
- Delivery has occurred;
- •
- The vendor's fee is fixed or determinable; and
- •
- Collectability of the fee is probable.
F-9
INTERMOLECULAR, INC. AND SUBSIDIARIES
Notes to Consolidated Financial Statements (Continued)
1. The Company and Summary of Significant Accounting Policies (Continued)
Persuasive evidence of the arrangement represents a written contract signed by both the Company and the customer, or a customer purchase order. The Company assesses whether a price is fixed or determinable by, among other things, reviewing contractual terms and conditions related to payment terms. The Company assesses collectability based on factors such as the customer's creditworthiness and past collection history, if applicable. If collection is not probable, revenue recognition is deferred until receipt of payment.
Collaborative development programs and other services—The Company enters into collaborative development programs and other research and development service agreements with customers under which the Company conducts research and development activities jointly with the customer. The agreements specify minimum levels of research effort required to be performed by the Company. Payments received under the agreements are not refundable if the research effort is not successful. The Company retains rights to certain elements of technology developed in the course of its performance, which the customer has an option to license in the future under the terms defined in the agreement. The Company recognizes revenue from these arrangements on a time and material basis. Most arrangements with customers have fixed monthly fees and requirements to provide regular reporting of research and development activities performed. Payments received prior to performance are deferred and recognized as revenue when earned over future performance periods. Certain customer contracts require the Company to maintain dedicated equipment to support contractual capacity requirements as part of their collaborative development programs. These programs have future minimum payments associated with the dedicated equipment of $5.2 million and $11.3 million as of December 31, 2010 and 2011, respectively.
Product maintenance and support services—Included in collaborative development programs and other services revenue, these services entitle customers to receive product updates and enhancements or technical support and maintenance, depending on the offering. The related revenue is recognized ratably over the period the services are delivered.
Product revenue—The Company recognizes revenue from the sale of products once delivery has occurred (title and risk of loss have passed to the customer), and customer acceptance, if required, has been achieved. The Company has determined that the software included with its equipment products is more than incidental to the product as a whole.
Licensing and royalty revenue—The Company recognizes revenue for licenses to intellectual property when earned pursuant to the terms of the agreements. Time-based license revenue is recognized ratably over the license term. Licensing and royalty revenue that becomes triggered by specific customer actions, such as exercise of a license option or by sales volume, is recognized when it occurs based on royalty reports or other information received from the licensee. Minimum and prepaid royalties and license fees are recognized ratably over the related periods.
Multiple-element arrangements—Certain of the Company's customer arrangements involve the delivery or performance of multiple products, services or licenses. Product sale arrangements include product maintenance and support. Collaborative development programs and other research and development services include licenses of technology and may also include sales of products.
The Company evaluates whether a delivered element has value to the customer without the remaining undelivered elements by determining whether the delivered element could be sold by the
F-10
INTERMOLECULAR, INC. AND SUBSIDIARIES
Notes to Consolidated Financial Statements (Continued)
1. The Company and Summary of Significant Accounting Policies (Continued)
Company, or resold by the customer, on a stand-alone basis. The Company concluded that all of its products and services deliverables have value to the customers on a stand-alone basis, as all these deliverables have been or could be sold and used by customers on a stand-alone basis. Intellectual property license arrangements have value on a stand-alone basis if the customer could purchase and use them without the remaining elements of the arrangement. In addition, the Company assesses whether there is objective and reliable evidence of fair values of all undelivered elements. Fair values of such elements are determined by reference to the Company-specific objective evidence, such as pricing of these elements when sold separately, substantive renewal prices for product maintenance and support and time-based licenses, or other available evidence. If the fair value of any undelivered elements in a multiple-element arrangement cannot be objectively determined, revenue is deferred until all elements are delivered, or until fair value can objectively be determined for any remaining undelivered elements. However, in situations where the undelivered elements are software-related hardware elements, the Company will recognize revenue under a proportional performance model when fair value for the hardware elements is not available, if the undelivered hardware elements are substantially similar products. If product maintenance and support and time-based licenses are the only undelivered elements without objective and reliable evidence of fair value, all revenue from the arrangement is amortized over the longer of the product maintenance and support term or license period. For purposes of classification in the consolidated statements of operations, revenue is allocated between collaborative development programs and services revenue, product revenue and licensing and royalty revenue based on objective and reliable evidence of fair value for any elements for which it exists or based on the relative stated invoice amount for elements for which objective and reliable evidence of fair value does not exist.
In 2009, the Financial Accounting Standards Board (FASB) issued ASU 2009-13 Revenue Recognition (Topic 605): Multiple-Deliverable Revenue Arrangements—a consensus of the FASB Emerging Issues Task Force (ASU 2009-13) and ASU 2009-14 Software (Topic 985): Certain Revenue Arrangements That Include Software Elements—a consensus of the FASB Emerging Issues Task Force (ASU 2009-14). ASU 2009-13 and 14 are amendments to the accounting standards for revenue recognition to remove tangible products containing software components and nonsoftware components that function together to deliver the product's essential functionality from the scope of industry-specific software revenue recognition guidance, and also:
- •
- provide updated guidance on whether multiple deliverables exist, how the deliverables in an arrangement should be
separated, and how the consideration should be allocated;
- •
- require an entity to allocate revenue in an arrangement using estimated selling prices (ESP) of deliverables if the
Company does not have vendor-specific objective evidence of selling price (VSOE) or third-party evidence of selling price (TPE); and
- •
- eliminate the use of the residual method and require an entity to allocate revenue using the relative selling price method.
For all transactions entered into after December 31, 2010, the Company recognizes revenue using estimated selling prices of the delivered goods and services based on a hierarchy of methods contained in ASU 2009-13. The Company uses VSOE for determination of estimated selling price of elements in each arrangement if available, and since third-party evidence is not available for those elements where vendor-specific objective evidence of selling price cannot be determined, the Company evaluates factors to determine its ESP for all other elements. In multiple-element arrangements where hardware and
F-11
INTERMOLECULAR, INC. AND SUBSIDIARIES
Notes to Consolidated Financial Statements (Continued)
1. The Company and Summary of Significant Accounting Policies (Continued)
software are sold as part of the solution, revenue is allocated to the hardware and software as a group using the relative selling prices of each of the deliverables in the arrangement based upon the aforementioned selling price hierarchy.
The adoption of ASU 2009-13 and 14 did not have any impact on the Company's consolidated financial condition, operating revenue, results of operations or cash flows for the six month period ended June 30, 2011 as there were no multiple-element arrangements that included the sale of products originating during the period. The adoption of this standard may impact future revenue recognition for multiple-element product arrangements where product maintenance and support and time-based licenses are the only undelivered elements. The impact of adopting these provisions will result in more product revenue being recognized in earlier periods as the Company allocates revenue using the relative selling price method as opposed to recognizing all revenue from the arrangement ratably over the longer of the product maintenance and support term or license period.
Deferred Revenue
Deferred revenue represents amounts collected from customers for which the related revenue has not been recognized, because one or more of the revenue recognition criteria have not been met. The current portion of deferred revenue represents the amount that is expected to be recognized as revenue within one year from the balance sheet date.
Accounts Receivable and Allowance for Doubtful Accounts
Trade accounts receivable are recorded at invoiced amounts, which include unbilled contractually obligated amounts, net of allowances for doubtful accounts if applicable, and do not bear interest.
The allowance for doubtful accounts is based on the Company's assessment of the collectability of its customer accounts. The Company reviews the allowance by considering certain factors such as historical experience, industry data, credit quality, age of balances and current economic conditions that may affect a customers' ability to pay. The Company determined that an allowance for doubtful accounts was not required as of December 31, 2009 and 2010 or June 30, 2011 and did not recognize any charges to bad debt during the years ended December 31, 2008, 2009 and 2010 and the six months ended June 30, 2010 and 2011.
F-12
INTERMOLECULAR, INC. AND SUBSIDIARIES
Notes to Consolidated Financial Statements (Continued)
1. The Company and Summary of Significant Accounting Policies (Continued)
Concentration of Revenue and Accounts Receivable
Significant customers are those that represent more than 10% of the Company's total revenue or accounts receivable. For each significant customer, including related parties, revenue as a percentage of total revenue and accounts receivable as a percentage of total accounts receivable are as follows:
| |
Revenue | Accounts Receivable | |||||||||||||||||||||||
|---|---|---|---|---|---|---|---|---|---|---|---|---|---|---|---|---|---|---|---|---|---|---|---|---|---|
| |
Years Ended December 31, |
Six Months Ended June 30, |
As of December 31, |
|
|||||||||||||||||||||
| |
As of June 30, 2011 |
||||||||||||||||||||||||
| |
2008 | 2009 | 2010 | 2010 | 2011 | 2009 | 2010 | ||||||||||||||||||
| |
|
|
|
(unaudited) |
|
|
(unaudited) |
||||||||||||||||||
Customer A |
58 | % | 59 | % | 52 | % | 62 | % | 33 | % | 100 | % | 11 | % | 10 | % | |||||||||
Customer B |
* | — | * | * | 11 | % | — | 20 | % | 12 | % | ||||||||||||||
Customer C |
* | — | * | — | * | — | 12 | % | — | ||||||||||||||||
Customer D |
23 | % | 29 | % | 20 | % | 21 | % | 20 | % | — | * | * | ||||||||||||
Customer E |
— | — | * | * | 11 | % | — | 11 | % | 22 | % | ||||||||||||||
Customer F |
— | — | * | * | * | — | 19 | % | 14 | % | |||||||||||||||
Customer G |
— | — | * | — | * | — | 24 | % | 28 | % | |||||||||||||||
- *
- less than 10%
Cost of Revenue
Cost of revenue is primarily comprised of salaries and other personnel-related expenses for collaborative research and development scientists, engineers and development fab process operations employees. Additionally, cost of revenue includes wafers, targets, materials, program-related supplies, depreciation on equipment used in collaborative development programs and allocated facility-related costs. Product cost of revenue primarily includes cost of products sold. Cost of licensing and royalty includes related party license fees paid to Symyx.
Research and Development
Research and development expenses, including direct and allocated expenses, are expensed as incurred. Research and development costs include salaries of technical staff, consultant costs, research and development parts and prototypes, wafers, chemicals, research and development supply costs, facilities rental, utilities costs related to laboratories and offices occupied by technical staff, depreciation on equipment used by technical staff, and outside services, such as machining and third-party research and development costs.
Software Development Costs
The costs to develop software have not been capitalized as the technological feasibility of the related software is not established until substantially all product development is complete.
Income Taxes
Income taxes have been accounted for under the asset and liability method. Deferred tax assets and liabilities are determined based on the difference between the financial statement and tax bases of
F-13
INTERMOLECULAR, INC. AND SUBSIDIARIES
Notes to Consolidated Financial Statements (Continued)
1. The Company and Summary of Significant Accounting Policies (Continued)
assets and liabilities as measured by the enacted tax rates that will be in effect when these differences reverse. Accordingly, realization of any deferred tax assets is dependent on future taxable income against which these deductions, losses and credits can be utilized.
The Company assesses the likelihood that the deferred tax assets will be recovered and establishes a valuation allowance to the extent the Company believes that it is more likely than not that all or some portion of the asset will not be realized due to the inability to generate sufficient taxable income in the period and/or of the character necessary to utilize the benefit of the deferred tax asset. The Company recorded a full valuation allowance against its deferred tax assets as of December 31, 2009 and 2010 and June 30, 2011. Based on the available evidence, the Company believed it was more likely than not that it would not be able to utilize its deferred tax assets in the future. The Company intends to maintain a full valuation allowance until and if sufficient evidence exists to support all or a portion of its reversal.
The Company regularly reviews its tax positions for benefits to be realized. A tax position must be more likely than not to be sustained upon examination. The amount recognized is measured as the largest amount of benefit that is more likely than not to be realized upon settlement. The Company's policy is to recognize interest and penalties related to income tax matters as income tax expense. Through June 30, 2011, the Company did not have any interest or penalties associated with unrecognized tax benefits.
Share-Based Compensation
Compensation costs related to employee stock options granted during the years ended December 31, 2008, 2009 and 2010 and the six months ended June 30, 2010 and 2011 are based on the fair value of the options on the date of grant, net of estimated forfeitures. The Company determines the grant date fair value of the options using the Black-Scholes option-pricing model and the related stock-based compensation expense is generally recognized on a straight-line basis over the period in which an employee is required to provide service in exchange for the options, or the vesting period of the respective options.
The Company accounts for stock options issued to nonemployees based on the fair value of the options determined using the Black-Scholes option-pricing model. The fair value of stock options granted to nonemployees is remeasured each reporting period as the stock options vest and the resulting change in value, if any, is recognized in the Company's consolidated statements of operations during the period the related services are rendered.
Comprehensive Loss
Comprehensive loss consists of the same components as net loss and therefore the Company does not separately disclose a statement of comprehensive loss.
Employee Savings Plan
The Company has a savings plan in the United States that qualifies under Section 401(k) of the Internal Revenue Code. Participating employees may contribute up to the statutory limits. The Company has not made employer contributions to the plan to date.
F-14
INTERMOLECULAR, INC. AND SUBSIDIARIES
Notes to Consolidated Financial Statements (Continued)
1. The Company and Summary of Significant Accounting Policies (Continued)
Segment Information
The Company operates in one reportable segment. The Company's chief operating decision-maker, its chief executive officer, reviews its operating results on an aggregate basis and manages its operations as a single operating segment.
Deferred Offering Costs
Deferred offering costs, consisting of legal, accounting and filing fees relating to the initial public offering, are capitalized. The deferred offering costs will be offset against initial public offering proceeds upon the effectiveness of the offering. In the event the offering is terminated, deferred offering costs will be expensed. As of June 30, 2011, the Company had capitalized $0.7 million of deferred offering costs in prepaid expenses and other current assets on the consolidated balance sheet. No amounts were deferred as of December 31, 2009 and 2010.
Fair Value of Financial Instruments
The Company measures and reports its cash equivalents, short-term investments and preferred stock warrant liabilities at fair value. Fair value is defined as the exchange price that would be received for an asset or an exit price paid to transfer a liability in the principal or most advantageous market for the asset or liability in an orderly transaction between market participants on the measurement date. Valuation techniques used to measure fair value must maximize the use of observable inputs and minimize the use of unobservable inputs. The fair value hierarchy defines a three-level valuation hierarchy for disclosure of fair value measurements as follows:
Level I—Unadjusted quoted prices in active markets for identical assets or liabilities;
Level II—Inputs other than quoted prices included within Level I that are observable, unadjusted quoted prices in markets that are not active, or other inputs that are observable or can be corroborated by observable market data for substantially the full term of the related assets or liabilities; and
Level III—Unobservable inputs that are supported by little or no market activity for the related assets or liabilities.
The categorization of a financial instrument within the valuation hierarchy is based upon the lowest level of input that is significant to the fair value measurement.
The Company's financial instruments consist of Level I and Level III liabilities. Level I securities include highly liquid money market funds and short-term investments. The Company does not hold any Level II instruments. Level III liabilities that are measured at fair value on a recurring basis consist of preferred stock warrant liabilities. The fair values of the outstanding preferred stock warrants are measured using the Black-Scholes option-pricing model. Inputs used to determine estimated fair value include the estimated fair value of the underlying stock at the valuation measurement date, the remaining contractual term of the warrants, risk-free interest rates, expected dividends and the expected volatility of the underlying stock.
F-15
INTERMOLECULAR, INC. AND SUBSIDIARIES
Notes to Consolidated Financial Statements (Continued)
1. The Company and Summary of Significant Accounting Policies (Continued)
Foreign Currency
The functional currency of foreign subsidiaries is the U.S. dollar and foreign currency transaction gains and losses are recorded in other income (expense), net.
Net Loss per Share of Common Stock
The Company's basic net loss per share of common stock is calculated by dividing the net loss by the weighted average number of shares of common stock outstanding for the period. The diluted net loss per share of common stock is computed by giving effect to all potential common stock equivalents outstanding for the period determined using the if-converted method. For purposes of this calculation, redeemable convertible preferred stock, options to purchase common stock, common stock subject to repurchase, warrants to purchase redeemable convertible preferred stock and warrants to purchase common stock are considered to be common stock equivalents but have been excluded from the calculation of diluted net loss per share of common stock as their effect is antidilutive.
Unaudited Pro Forma Net Loss per Share of Common Stock
In contemplation of the Company's initial public offering, the Company has presented the unaudited pro forma basic and diluted net loss per share of common stock which has been computed to give effect to the automatic conversion of the redeemable convertible preferred stock into shares of common stock on a weighted average basis and the conversion of certain preferred and common stock warrants that expire upon an initial public offering if unexercised. Also, the numerator in the pro forma basic and diluted net loss per share calculation has been adjusted to remove gains and losses resulting from the accretion of redeemable convertible preferred stock and the remeasurement of the preferred stock warrant liability as if the conversion had occurred as of the beginning of the period.
Recent Accounting Pronouncements
In January 2010, the FASB issued an amendment to an accounting standard that requires new disclosures for fair value measurements and provides clarification for existing fair value disclosure requirements. The amendment will require an entity to disclose separately the amounts of significant transfers in and out of Levels I and II fair value measurements and to describe the reasons for the transfers; and to disclose information about purchases, sales, issuances and settlements separately in the reconciliation for fair value measurements using significant unobservable inputs, or Level III inputs. This amendment clarifies existing disclosure requirements for the level of disaggregation used for classes of assets and liabilities measured at fair value and requires disclosures about the valuation techniques and inputs used to measure fair value for both recurring and nonrecurring fair value measurements using Level II and Level III inputs. This guidance is effective for interim and annual reporting periods beginning after December 15, 2009, except for certain Level III activity disclosure requirements that will be effective for reporting periods beginning after December 15, 2010. Accordingly, the Company adopted this amendment as of January 1, 2010, except for the additional Level III requirements, which will be adopted during the year ending December 31, 2011. The Company did not hold any Level II investments during any of the years presented and has disclosed in note 7 the underlying inputs used to value its Level III preferred stock warrant liability.
F-16
INTERMOLECULAR, INC. AND SUBSIDIARIES
Notes to Consolidated Financial Statements (Continued)
2. Fair Value of Financial Instruments
The Company measures and reports its cash equivalents, short-term investments and preferred stock warrant liability at fair value. The following table sets forth the fair value of the Company's financial assets and liabilities by level within the fair value hierarchy (in thousands):
| |
As of December 31, 2009 | |||||||||||||
|---|---|---|---|---|---|---|---|---|---|---|---|---|---|---|
| |
Fair Value | Level I | Level II | Level III | ||||||||||
Assets: |
||||||||||||||
Money market funds |
$ | 20,285 | $ | 20,285 | $ | — | $ | — | ||||||
Short-term investments |
11,764 | 11,764 | — | — | ||||||||||
Total assets measured at fair value |
$ | 32,049 | $ | 32,049 | $ | — | $ | — | ||||||
Liabilities: |
||||||||||||||
Preferred stock warrant liability |
$ | 159 | $ | — | $ | — | $ | 159 | ||||||
Total liabilities measured at fair value |
$ | 159 | $ | — | $ | — | $ | 159 | ||||||
| |
As of December 31, 2010 | |||||||||||||
|---|---|---|---|---|---|---|---|---|---|---|---|---|---|---|
| |
Fair Value | Level I | Level II | Level III | ||||||||||
Assets: |
||||||||||||||
Money market funds |
$ | 20,659 | $ | 20,659 | $ | — | $ | — | ||||||
Total assets measured at fair value |
$ | 20,659 | $ | 20,659 | $ | — | $ | — | ||||||
Liabilities: |
||||||||||||||
Preferred stock warrant liability |
$ | 215 | $ | — | $ | — | $ | 215 | ||||||
Total liabilities measured at fair value |
$ | 215 | $ | — | $ | — | $ | 215 | ||||||
| |
As of June 30, 2011 | |||||||||||||
|---|---|---|---|---|---|---|---|---|---|---|---|---|---|---|
| |
Fair Value | Level I | Level II | Level III | ||||||||||
| |
(unaudited) |
|||||||||||||
Assets: |
||||||||||||||
Money market funds |
$ | 23,667 | $ | 23,667 | $ | — | $ | — | ||||||
Short-term investments |
750 | 750 | ||||||||||||
Total assets measured at fair value |
$ | 24,417 | $ | 24,417 | $ | — | $ | — | ||||||
Liabilities: |
||||||||||||||
Preferred stock warrant liability |
$ | 670 | $ | — | $ | — | $ | 670 | ||||||
Total liabilities measured at fair value |
$ | 670 | $ | — | $ | — | $ | 670 | ||||||
F-17
INTERMOLECULAR, INC. AND SUBSIDIARIES
Notes to Consolidated Financial Statements (Continued)
2. Fair Value of Financial Instruments (Continued)
The following table sets forth a summary of the changes in the fair value of the Company's Level III financial liabilities (in thousands):
| |
Years Ended December 31, |
Six Months Ended June 30, |
||||||||||||||
|---|---|---|---|---|---|---|---|---|---|---|---|---|---|---|---|---|
| |
2008 | 2009 | 2010 | 2010 | 2011 | |||||||||||
| |
|
|
|
(unaudited) |
||||||||||||
Fair value—beginning of period |
$ | 37 | $ | 117 | $ | 159 | $ | 159 | $ | 215 | ||||||
Change in fair value of warrant liabilities |
80 | 42 | 56 | — | 455 | |||||||||||
Fair value—end of period |
$ | 117 | $ | 159 | $ | 215 | $ | 159 | $ | 670 | ||||||
3. Property and Equipment
Property and equipment consist of the following (in thousands):
| |
As of December 31, | As of June 30, | |||||||||
|---|---|---|---|---|---|---|---|---|---|---|---|
| |
2009 | 2010 | 2011 | ||||||||
| |
|
|
(unaudited) |
||||||||
Lab equipment and machinery |
$ | 16,128 | $ | 24,766 | $ | 30,208 | |||||
Leasehold improvements |
3,488 | 5,055 | 5,782 | ||||||||
Computer equipment and software |
1,842 | 2,314 | 2,551 | ||||||||
Furniture and fixtures |
79 | 108 | 122 | ||||||||
Construction in progress |
3,280 | 5,252 | 2,870 | ||||||||
Total property and equipment |
24,817 | 37,495 | 41,533 | ||||||||
Less accumulated depreciation |
(10,943 | ) | (15,767 | ) | (19,255 | ) | |||||
Property and equipment, net |
$ | 13,874 | $ | 21,728 | $ | 22,278 | |||||
As of December 31, 2009 and 2010 and June 30, 2011, no property and equipment were pledged as collateral against borrowings. Amortization of leasehold improvements is included in depreciation expense. Depreciation expense was $3.4 million, $4.4 million, $5.0 million, $2.4 million and $3.5 million during the years ended December 31, 2008, 2009 and 2010 and the six months ended June 30, 2010 and 2011, respectively.
The Company maintained dedicated equipment to support contractual customer capacity requirements as part of certain collaborative development programs that are classified as lab equipment and machinery that have a net book value of $2.1 million and $6.4 million as of December 31, 2010 and June 30, 2011, respectively.
F-18
INTERMOLECULAR, INC. AND SUBSIDIARIES
Notes to Consolidated Financial Statements (Continued)
4. Intangible Assets
Intangible assets consist of the following (in thousands):
| |
As of December 31, | |
|||||||||
|---|---|---|---|---|---|---|---|---|---|---|---|
| |
As of June 30, 2011 |
||||||||||
| |
2009 | 2010 | |||||||||
| |
|
|
(unaudited) |
||||||||
Patents issued |
$ | 121 | $ | 209 | $ | 424 | |||||
Patents pending |
1,514 | 2,009 | 2,204 | ||||||||
Trademarks |
38 | 38 | 38 | ||||||||
Total intangible assets |
1,673 | 2,256 | 2,666 | ||||||||
Less patent amortization |
(9 | ) | (18 | ) | (28 | ) | |||||
Intangible assets, net |
$ | 1,664 | $ | 2,238 | $ | 2,638 | |||||
Amortization commences upon patent issuance. The useful life of the patents, once approved, will not exceed 20 years, and will depend on the nature of the patent. The average estimated amortization period of our current portfolio is 17 years. Amortization expense during the years ended December 31, 2008, 2009, 2010 and the six months ended June 30, 2010 and 2011 was $4,000, $5,000, $9,000, $3,000 and $10,000, respectively.
Estimated future aggregate annual amortization expense for both issued and pending intangible assets is as follows (in thousands):
| |
|
|||||
|---|---|---|---|---|---|---|
As of December 31: |
||||||
2011 |
$ |
73 |
||||
2012 |
123 | |||||
2013 |
123 | |||||
2014 |
123 | |||||
2015 |
123 | |||||
Thereafter |
1,635 | |||||
Total |
$ | 2,200 | ||||
5. Commitments and Contingencies
Leases
The Company entered into an operating lease agreement in July 2005 for its facility in California with a lease term that expires on October 31, 2011. During the year ended December 31, 2008, the space under the operating lease was expanded to support the Company's operating needs. During the year ended December 31, 2010, the Company relocated its operations to a new facility and, accordingly, entered into an operating lease agreement in May 2010 that expires in May 2015. Rent expense for both facilities, which is being recognized on a straight-line basis over the lease term, was approximately $725,000, $797,000, $1.6 million, $581,000 and $1.1 million during the years ended December 31, 2008, 2009 and 2010 and the six months ended June 30, 2010 and 2011, respectively. Future commitments
F-19
INTERMOLECULAR, INC. AND SUBSIDIARIES
Notes to Consolidated Financial Statements (Continued)
5. Commitments and Contingencies (Continued)
and obligations under the operating leases to be satisfied as they become due over the term are as follows (in thousands):
| |
|
|||||
|---|---|---|---|---|---|---|
As of December 31: |
||||||
The years ending December 31, |
||||||
2011 |
$ | 1,550 | ||||
2012 |
1,573 | |||||
2013 |
1,657 | |||||
2014 |
1,707 | |||||
2015 |
728 | |||||
Total |
$ | 7,215 | ||||
| |
|
|||||
|---|---|---|---|---|---|---|
As of June 30 (unaudited): |
||||||
Six month period ending December 31, 2011 |
$ |
869 |
||||
The years ending December 31, |
||||||
2012 |
1,573 | |||||
2013 |
1,657 | |||||
2014 |
1,707 | |||||
2015 |
728 | |||||
Total |
$ | 6,534 | ||||
During 2010 and the six months ended June 30, 2011, the Company made regular payments of $874,000 and $681,000, respectively, on the operating leases.
Equipment Loan
On June 1, 2007, the Company borrowed $3.8 million pursuant to the terms of a loan and security agreement with a bank that was signed in 2005. In May 2008, the Company borrowed an additional $3.0 million under this loan and security agreement. The loan amounts were payable over a 36-month term ending June 1, 2010 and May 1, 2011, respectively. The outstanding loan balances under this loan and security agreement were paid off in February 2009. Effective January 27, 2010 and March 26, 2010, the Company amended the terms of the loan and security agreement to extend the availability of additional loan advances through December 31, 2011. Any additional borrowing will be payable in 36 monthly installments ending no later than December 1, 2013. These loans are secured by all company assets, excluding intellectual property. The amount borrowed must be requested in no less than $500,000 increments. The loan amount must be 100% first position secured by eligible equipment purchased within 270 days before the equipment advance. The loan advance allows for a look back for eligible equipment purchased, as long as the loan request is made within 90 days of the execution of the loan and security agreement. Equipment advances will accrue interest at a 5.50% annual rate.
In connection with the original loan and security agreement, the Company issued a warrant to purchase Series B redeemable convertible preferred stock for 2.5% of the value of the loan facility. As of December 31, 2009 and 2010 and June 30, 2011, there were no outstanding balances under the equipment loans and the Company was compliant with all loan covenants, which primarily consist of
F-20
INTERMOLECULAR, INC. AND SUBSIDIARIES
Notes to Consolidated Financial Statements (Continued)
5. Commitments and Contingencies (Continued)
monthly and annual financial statement reporting and the maintenance of certain minimum financial ratios. Also as of December 31, 2009 and 2010 and June 30, 2011, there was $10.0 million available for advances under this loan and security agreement.
Litigation
The Company is subject to various claims arising in the ordinary course of business. Although no assurance may be given, the Company believes that it is not presently a party to any litigation of which the outcome, if determined adversely, would individually or in the aggregate be reasonably expected to have a material adverse effect on the business, operating results, cash flows or financial position of the Company.
Third parties and others may claim in the future that the Company has infringed their past, current or future intellectual property rights. These claims, whether meritorious or not, could be time-consuming, result in costly litigation, require expensive changes in the Company's methods of doing business or require the Company to enter into costly royalty or licensing agreements, if available. As a result, these claims could harm the Company's business, operating results, cash flows and financial position.
Indemnification
From time to time, the Company agrees to indemnify certain customers against certain third-party liabilities, including liability if its products infringe a third party's intellectual property rights. The indemnification is typically limited to no more than the amount paid by the customer. As of December 31, 2010 and June 30, 2011, the Company was not subject to any material pending intellectual property-related litigation for which it is indemnifying a customer.
6. Redeemable Convertible Preferred Stock and Stockholders' Deficit
(a) Redeemable Convertible Preferred Stock
During the year ended December 31, 2008, the Company issued 6,575,832 shares of Series D at $3.04 per share, resulting in net cash proceeds of $19.9 million.
During the six months ended June 30, 2011, the Company issued 6,018,122 shares of Series E at $4.15 per share, resulting in net cash proceeds of $24.9 million.
The following tables are in thousands, except share data:
| |
As of December 31, 2009 | |||||||||
|---|---|---|---|---|---|---|---|---|---|---|
| |
Shares Authorized |
Shares Issued and Outstanding |
Aggregate Liquidation Preference |
|||||||
| |
|
|
|
|||||||
Series A |
8,399,831 | 8,399,831 | $ | 800 | ||||||
Series B |
22,949,711 | 22,780,964 | 10,125 | |||||||
Series C |
14,686,698 | 14,686,698 | 25,050 | |||||||
Series D |
9,963,760 | 6,575,832 | 20,000 | |||||||
Total |
56,000,000 | 52,443,325 | $ | 55,975 | ||||||
F-21
INTERMOLECULAR, INC. AND SUBSIDIARIES
Notes to Consolidated Financial Statements (Continued)
6. Redeemable Convertible Preferred Stock and Stockholders' Deficit (Continued)
| |
As of December 31, 2010 | |||||||||
|---|---|---|---|---|---|---|---|---|---|---|
| |
Shares Authorized |
Shares Issued and Outstanding |
Aggregate Liquidation Preference |
|||||||
| |
|
|
|
|||||||
Series A |
8,399,831 | 8,399,831 | $ | 800 | ||||||
Series B |
22,949,711 | 22,780,964 | 10,125 | |||||||
Series C |
14,686,698 | 14,686,698 | 25,050 | |||||||
Series D |
9,963,760 | 6,575,832 | 20,000 | |||||||
Total |
56,000,000 | 52,443,325 | $ | 55,975 | ||||||
| |
As of June 30, 2011 | |||||||||
|---|---|---|---|---|---|---|---|---|---|---|
| |
Shares Authorized |
Shares Issued and Outstanding |
Aggregate Liquidation Preference | |||||||
| |
(unaudited) |
|||||||||
Series A |
8,399,831 | 8,399,831 | $ | 800 | ||||||
Series B |
22,949,711 | 22,780,964 | 10,125 | |||||||
Series C |
14,686,698 | 14,686,698 | 25,050 | |||||||
Series D |
6,575,832 | 6,575,832 | 20,000 | |||||||
Series E |
6,618,127 | 6,018,122 | 25,000 | |||||||
Total |
59,230,199 | 58,461,447 | $ | 80,975 | ||||||
Significant terms of Series A, B, C, D and E redeemable convertible preferred stock are as follows:
Conversion Features
Holders of Series A, B, C, D and E redeemable convertible preferred stock have the option to convert each share into one share of common stock at any time. The preferred stock will automatically convert into shares of common stock upon an affirmative vote of more than 60% of the preferred stock voting together or an initial public offering with a share price of not less than $5.40 and with net proceeds of not less than $30.0 million.
Voting Rights
Each share of Series A, B, C, D and E redeemable convertible preferred stock has voting rights equivalent to the number of shares of common stock into which it is convertible. In regards to the selection of the Company's board of directors, the Series A holders will elect two directors, the Series B holders will elect one director, the Series C holders will elect one director and the common stock holders will elect one director. Any remaining directors will be elected by the common and preferred stock holders voting together.
Dividend Rights
The holders of Series A, B, C, D and E redeemable convertible preferred stock are entitled to receive annual noncumulative dividends at a rate of $0.01, $0.04, $0.15, $0.24 and $0.33 per share, respectively, as adjusted for stock splits, stock dividends, reverse stock splits, stock combinations,
F-22
INTERMOLECULAR, INC. AND SUBSIDIARIES
Notes to Consolidated Financial Statements (Continued)
6. Redeemable Convertible Preferred Stock and Stockholders' Deficit (Continued)
reorganizations, and the like, out of any assets available when and if declared by the board of directors. No dividends have been declared to date.
Annual noncumulative cash dividends of $0.01, $0.04, $0.15, $0.24 and $0.33 per share of Series A, B, C, D and E redeemable convertible preferred stock, respectively, multiplied by the number of years that dividends were not declared and paid since issuance, must be paid prior to the payment of any dividends on the common stock, if and when declared by the board of directors.
Liquidation Preferences
In the event of liquidation, dissolution or winding up of the affairs of the Company, the holders of Series A, B, C, D and E redeemable convertible preferred stock are entitled to receive $0.10, $0.44, $1.88, $3.04 and $4.15 per share, respectively, and any declared but unpaid dividends prior to any other distributions. In the event of insufficient assets to pay the holders of Series A, B, C, D and E, the remaining assets will be distributed proportionally to all holders of redeemable convertible preferred stock. Any remaining assets after distribution to the holders of Series A, B, C, D and E redeemable convertible preferred stock will be distributed pro rata among all stockholders on an as converted basis until the holders of the redeemable convertible preferred stock receive a return of three times their original purchase price. Any remaining assets will be distributed pro rata among the common stockholders.
Redemption Rights
Series A, B, C, D and E redeemable convertible preferred stock are redeemable at any time after June 14, 2016 upon the affirmative vote or written consent of the holders of greater than 60% of the then-outstanding shares of redeemable convertible preferred stock (the Redemption Request). Upon receiving a Redemption Request, the Company will redeem these shares from any source of funds legally available on each of the respective Redemption Dates (as defined below) in three equal annual installments of one-third of the outstanding shares of redeemable convertible preferred stock to be redeemed. The redemption date for each annual redemption of shares (the Redemption Date) will be (i) for the first such installment, a date determined by the Company falling not later than 60 days after the date the Company received a Redemption Request and (ii) for the second and third installments, on the first and second anniversary of the first Redemption Date. The shares of preferred stock not redeemed as of a certain Redemption Date will remain outstanding and will be entitled to all the rights and preferences provided to holders of the redeemable convertible preferred stock.
The redemption price of the redeemable convertible preferred stock will be the greater of the original purchase price as adjusted for any stock splits, stock dividends, reverse stock splits, stock combinations, recapitalizations, and similar events, plus any declared but unpaid dividends, or the fair market value of each respective Series as determined by the board of directors with the approval of at least 60% of the directors then serving on the board on the date of Redemption Request. The original purchase price was $800,000, $10.1 million, $25.1 million, $20.0 million and $25.0 million for Series A, B, C, D and E, respectively.
Adoption of Classification and Measurement of Redeemable Securities Accounting Standard
In connection with the Company's decision to file a registration statement with the Securities Exchange Commission for an initial public offering of the Company's common stock, the Company
F-23
INTERMOLECULAR, INC. AND SUBSIDIARIES
Notes to Consolidated Financial Statements (Continued)
6. Redeemable Convertible Preferred Stock and Stockholders' Deficit (Continued)
adopted the provisions of ASC Topic 480-10-S99-3A, Classification and Measurement of Redeemable Securities
The shares contain redemption features that are not solely within the Company's control. Accordingly, all shares of redeemable convertible preferred stock, previously classified in stockholders' (deficit) equity, have been classified as temporary equity rather than as a component of stockholders' (deficit) equity in the Company's consolidated balance sheets for all periods presented.
The carrying value of redeemable convertible preferred stock was recorded at its fair value at the date of issue. In accordance with the standard, the Company has accounted for changes in the redemption value over the period from the date of issuance to the earliest redemption date using the interest method to a value equal to the fair value, as determined by the Company using the most recent round of redeemable convertible preferred stock financing as an estimate for the fair value, of its redeemable convertible preferred stock over the period from the date of issuance to the earliest redemption date on June 14, 2016. As the Company did not have a round of redeemable preferred stock financing around December 31, 2009 or December 31, 2010, the Company determined the fair value by selecting a value that approximated an increase in value on a consistent basis between the Series D round (December 31, 2008) and the Series E round (June 14, 2011). The increases in the redemption value increases the value of the redeemable convertible preferred stock and decreases the additional paid-in capital and accumulated deficit balances. There was no impact of adopting this accounting principle on the consolidated statements of cash flows and the impact on the consolidated statement of operations was an increase in the net loss attributable to common stockholders as a result of the accounting for the change in the redemption value.
Estimated Redemption Values
The redemption values by security that the Company is using to accrete to are as follows (in thousands):
| |
December 31, | June 30, | ||||||||
|---|---|---|---|---|---|---|---|---|---|---|
| |
2009 | 2010 | 2011 | |||||||
Redeemable convertible preferred stock series: |
||||||||||
A |
$ | 28,765 | $ | 33,067 | $ | 34,894 | ||||
B |
78,013 | 89,680 | 94,635 | |||||||
C |
50,295 | 57,816 | 61,010 | |||||||
D |
22,519 | 25,887 | 27,317 | |||||||
E |
— | — | 25,000 | |||||||
In evaluating the fair value of preferred stock and the related preferred stock accretion for the three and six months ended June 30, 2011 the Company considered the potential impact of the appreciation on the fair value of common stock between the June 14, 2011 Series E second closing and June 30, 2011, as well as the convergence of the preferred stock and common stock prices as the likelihood of an IPO increases and determined that no changes in the estimated redemption value was needed.
F-24
INTERMOLECULAR, INC. AND SUBSIDIARIES
Notes to Consolidated Financial Statements (Continued)
6. Redeemable Convertible Preferred Stock and Stockholders' Deficit (Continued)
(b) Common Stock
As of December 31, 2009 and 2010 and June 30, 2011, the Company had reserved shares of common stock, on an as if converted basis, for issuance as follows:
| |
As of December 31, | |
||||||||
|---|---|---|---|---|---|---|---|---|---|---|
| |
As of June 30, 2011 |
|||||||||
| |
2009 | 2010 | ||||||||
| |
|
|
(unaudited) |
|||||||
Issuances under stock option plan |
15,065,146 | 14,891,314 | 16,639,767 | |||||||
Conversion of redeemable convertible preferred stock |
52,443,325 | 52,443,325 | 58,461,447 | |||||||
Issuances upon exercise of warrants |
1,979,985 | 3,624,721 | 4,446,721 | |||||||
|
69,488,456 | 70,959,360 | 79,547,935 | |||||||
7. Warrants
Preferred Stock Warrants
In connection with the loan and security agreement obtained in November 2005, the Company issued a warrant to purchase 168,747 shares of Series B redeemable convertible preferred stock at a price of $0.44 per share. The Series B warrants are exercisable immediately and expire in November 2012. The fair value of the warrant on the date of issuance was $37,000 which is being recognized as interest expense over the term of the loan and security agreement. The fair value of the warrant was determined using the Black-Scholes option-pricing model and is remeasured at each reporting period. As of December 31, 2009, 2010 and June 30, 2011, the Company recorded a warrant liability of $159,000, $215,000 and $670,000 on the consolidated balance sheets. During the years ended December 31, 2008, 2009 and 2010 and the six months ended June 30, 2010 and 2011, the remeasurement of the warrant liability resulted in the recognition of remeasurement gains and losses of $80,000, $42,000, $56,000, $0 and $455,000, respectively, which was recorded as other income (expense), net on the consolidated statement of operations.
The Company determined the fair value of the Series B warrants at the end of each reporting period using the Black-Scholes option-pricing model with the following assumptions:
| |
Years Ended December 31, |
Six Months Ended June 30, |
||||||||||||||
|---|---|---|---|---|---|---|---|---|---|---|---|---|---|---|---|---|
| |
2008 | 2009 | 2010 | 2010 | 2011 | |||||||||||
| |
|
|
|
(unaudited) |
||||||||||||
Contractual term (in years) |
4.0 | 3.0 | 2.0 | 2.5 | 1.5 | |||||||||||
Risk-free interest rate |
1.3 | % | 1.7 | % | 0.6 | % | 0.8 | % | 0.3 | % | ||||||
Expected volatility |
65 | % | 60 | % | 55 | % | 71 | % | 44 | % | ||||||
Expected dividend rate |
0 | % | 0 | % | 0 | % | 0 | % | 0 | % | ||||||
Common Stock Warrants
During the year ended December 31, 2007, the Company issued warrants to purchase 1,635,000 shares of common stock in connection with certain collaboration agreements with exercise prices
F-25
INTERMOLECULAR, INC. AND SUBSIDIARIES
Notes to Consolidated Financial Statements (Continued)
7. Warrants (Continued)
ranging from $0.75 to $1.88 per share and five year terms. Of these warrants, 1,470,000 were granted to a related party and were exercisable immediately while the remaining warrants vest over periods ranging from two to four years. During the years ended December 31, 2008, 2009 and 2010 and the six months ended June 30, 2010 and 2011, the Company recognized expenses related to the issuances and vesting of these warrants in the amount of $43,000, $7,000, $1,000, $1,000 and $0, respectively. As of December 31, 2009 and 2010 and June 30, 2011, 1,631,238 of these warrants to purchase shares of common stock were still outstanding.
During the year ended December 31, 2008, the Company issued warrants to purchase 180,000 shares of common stock for consulting services with an exercise price of $1.02 per share and a 10 year term. These warrants vest over four years. During the years ended December 31, 2008, 2009 and 2010 and the six months ended June 30, 2010 and 2011, the Company recognized expenses related to the issuances and vesting of these warrants in the amount of $41,000, $51,000, $35,000, $21,000 and $27,000 , respectively. As of December 31, 2009 and 2010 and June 30, 2011, these warrants to purchase shares of common stock were still outstanding.
During the year ended December 31, 2010, the Company issued warrants to purchase 1,644,736 shares of common stock in connection with certain collaboration agreements with an exercise price of $3.04 per share and approximately two year terms, of which 822,368 were granted to a related party. These warrants will become exercisable upon election of specified licenses by the holders prior to the expiration of the warrants. These warrants, if they become exercisable, do not contain a net exercise provision and therefore can only be exercised on a cash basis upon surrender of the warrants. Upon a license election by the holders, the Company will record the fair value of these warrants as measured on the date of election against any related revenue derived from these agreements. As of June 30, 2011, the holders have not elected the license option.
During the six months ended June 30, 2011, the Company issued a warrant to purchase 822,000 shares of common stock in connection with a collaboration agreement with an exercise price of $4.15 per share and a term of 18 months. The warrant was exercisable immediately. The warrant does not contain a net exercise provision and therefore can only be exercised on a cash basis upon surrender of the warrants. The fair value of the warrant as measured on the date of grant was $312,000 and was recognized as a reduction of revenue derived from the agreement.
In total, the Company had 1,811,238, 3,455,974 and 4,277,974 outstanding warrants to purchase shares of common stock as of December 31, 2009 and 2010 and June 30, 2011, respectively. Of these outstanding warrants, 1,693,426, 1,742,176 and 2,588,238 were exercisable as of December 31, 2009 and 2010 and June 30, 2011, respectively. During the years ended December 31, 2008, 2009, 2010 and the six months ended June 30, 2010 and 2011, the Company recognized expenses related to the issuances and vesting of these warrants in the amount of $84,000, $58,000, $36,000, $22,000 and $27,000, respectively. Additionally, during the six months ended June 30, 2011, the Company recognized a reduction to revenue in the amount of $312,000 related to the issuance and vesting of a warrant granted to a customer in connection with a collaboration agreement.
8. Stock-Based Compensation
During the year ended December 31, 2004, the Company adopted the 2004 Equity Incentive Plan (the 2004 Plan) which includes both incentive and nonstatutory stock options. As of June 30, 2011, under the 2004 Plan, the Company may grant options to purchase up to 20,514,693 shares of common
F-26
INTERMOLECULAR, INC. AND SUBSIDIARIES
Notes to Consolidated Financial Statements (Continued)
8. Stock-Based Compensation (Continued)
stock to employees, directors and service providers with exercise prices not less than the fair market value of the underlying common stock at date of grant for incentive stock options and not less than 85% of fair market value for nonstatutory options. Options granted to persons who, at the time of the grant, own more than 10% of the voting power of all classes of stock will have exercise prices equal to at least 110% of the fair market value of the underlying common stock. These options generally expire 10 years from the date of grant and are generally exercisable at any time after the date of grant when the shares are vested. Incentive and nonstatutory stock options granted generally vest at a rate of 25% on the first anniversary of the commencement or grant date and 1/48th each month thereafter.
Option activity for the periods presented are as follows:
| |
|
Options Outstanding | |||||||||||||||
|---|---|---|---|---|---|---|---|---|---|---|---|---|---|---|---|---|---|
| |
Shares Available For Grant |
Number of Stock Options Outstanding |
Weighted- Average Exercise Price |
Weighted- Average Remaining Contractual Life (Years) |
Aggregate Intrinsic Value (in thousands) |
||||||||||||
Balance as of January 1, 2008 |
4,998,266 | 10,611,238 | $ | 0.37 | 8.5 | $ | 6,856 | ||||||||||
Granted |
(1,626,000 | ) | 1,626,000 | 1.09 | |||||||||||||
Exercised |
— | (485,508 | ) | 0.36 | 119 | ||||||||||||
Cancelled |
1,129,981 | (1,129,981 | ) | 0.71 | |||||||||||||
Balance as of December 31, 2008 |
4,502,247 | 10,621,749 | 0.45 | 7.7 | 5,989 | ||||||||||||
Granted |
(3,450,500 | ) | 3,450,500 | 1.00 | |||||||||||||
Exercised |
— | (152,600 | ) | 0.09 | 142 | ||||||||||||
Repurchased |
93,750 | — | — | ||||||||||||||
Cancelled |
1,724,775 | (1,724,775 | ) | 0.59 | |||||||||||||
Balance as of December 31, 2009 |
2,870,272 | 12,194,874 | 0.59 | 7.3 | 9,047 | ||||||||||||
Granted |
(3,159,750 | ) | 3,159,750 | 1.38 | |||||||||||||
Exercised |
— | (173,832 | ) | 0.59 | 141 | ||||||||||||
Cancelled |
642,960 | (642,960 | ) | 1.03 | |||||||||||||
Balance as of December 31, 2010 |
353,482 | 14,537,832 | 0.74 | 6.9 | 13,937 | ||||||||||||
Exercisable as of December 31, 2010 |
9,302,319 | $ | 0.49 | 5.9 | $ | 11,375 | |||||||||||
Vested and expected to vest as of December 31, 2010 |
13,339,011 | $ | 0.70 | $ | 13,309 | ||||||||||||
Additional shares authorized (unaudited) |
2,054,970 | — | — | ||||||||||||||
Granted (unaudited) |
(2,500,000 | ) | 2,500,000 | 3.10 | |||||||||||||
Exercised (unaudited) |
— | (306,517 | ) | 0.62 | 833 | ||||||||||||
Cancelled (unaudited) |
327,705 | (327,705 | ) | 1.20 | |||||||||||||
Balance as of June 30, 2011 (unaudited) |
236,157 | 16,403,610 | 1.09 | 6.9 | 54,408 | ||||||||||||
Exercisable as of June 30, 2011 (unaudited) |
10,277,781 | $ | 0.56 | 5.7 | $ | 39,217 | |||||||||||
Vested and expected to vest as of June 30, 2011 (unaudited) |
15,022,393 | $ | 1.02 | $ | 50,882 | ||||||||||||
F-27
INTERMOLECULAR, INC. AND SUBSIDIARIES
Notes to Consolidated Financial Statements (Continued)
8. Stock-Based Compensation (Continued)
The options exercisable as of December 31, 2010 include options that are exercisable prior to vesting. The weighted average grant date fair value of options granted during the years ended December 31, 2008, 2009 and 2010 and the six months ended June 30, 2011 was $0.60, $0.53, $0.74 and $1.77, respectively.
The Company recognized stock-based compensation expense for awards granted to its employees and nonemployees as follows (in thousands):
| |
Years Ended December 31, | Six Months Ended June 30, |
||||||||||||||
|---|---|---|---|---|---|---|---|---|---|---|---|---|---|---|---|---|
| |
2008 | 2009 | 2010 | 2010 | 2011 | |||||||||||
| |
|
|
|
(unaudited) |
||||||||||||
Cost of revenue |
$ | 71 | $ | 134 | $ | 285 | $ | 118 | $ | 233 | ||||||
Research and development |
170 | 222 | 204 | 118 | 191 | |||||||||||
Sales and marketing |
408 | 378 | 422 | 231 | 303 | |||||||||||
General and administrative |
267 | 347 | 453 | 208 | 255 | |||||||||||
Total stock-based compensation |
$ | 916 | $ | 1,081 | $ | 1,364 | $ | 675 | $ | 982 | ||||||
As of December 31, 2009 and 2010 and June 30, 2011, there was $2.5 million, $3.4 million and $5.1 million, respectively, of unrecognized compensation cost related to stock option compensation arrangements which is primarily recognized on a straight-line basis over a weighted average period of 2.6, 2.8 and 3.2 years, respectively. There were no capitalized stock-based compensation costs or recognized stock-based compensation tax benefits during the years ended December 31, 2008, 2009 and 2010 and the six months ended June 30, 2010 and 2011.
Additional information regarding options outstanding as of December 31, 2010 is as follows:
| |
Options Outstanding | Options Exercisable | ||||||||||||||
|---|---|---|---|---|---|---|---|---|---|---|---|---|---|---|---|---|
Exercise Price
|
Options Outstanding |
Weighted-Average Remaining Contractual Life (Years) |
Weighted-Average Exercise Price per Share |
Exercisable | Weighted-Average Exercise Price per Share |
|||||||||||
$0.01 |
440,000 | 4.1 | $ | 0.01 | 440,000 | $ | 0.01 | |||||||||
0.05 |
2,754,792 | 4.5 | 0.05 | 2,754,792 | 0.05 | |||||||||||
0.10 |
1,457,000 | 5.4 | 0.10 | 1,457,000 | 0.10 | |||||||||||
0.75 |
978,000 | 5.9 | 0.75 | 977,530 | 0.75 | |||||||||||
0.83 |
2,002,395 | 6.7 | 0.83 | 1,723,759 | 0.83 | |||||||||||
1.00 |
3,140,645 | 8.2 | 1.00 | 1,388,462 | 1.00 | |||||||||||
1.02 |
714,000 | 7.2 | 1.02 | 497,771 | 1.02 | |||||||||||
1.33 |
2,525,500 | 9.2 | 1.33 | — | — | |||||||||||
1.45 |
109,000 | 7.8 | 1.45 | 63,005 | 1.45 | |||||||||||
1.70 |
416,500 | 10.0 | 1.70 | — | — | |||||||||||
|
14,537,832 | 6.9 | 0.74 | 9,302,319 | 0.49 | |||||||||||
F-28
INTERMOLECULAR, INC. AND SUBSIDIARIES
Notes to Consolidated Financial Statements (Continued)
8. Stock-Based Compensation (Continued)
Additional information regarding options outstanding as of June 30, 2011 is as follows (unaudited):
| |
Options Outstanding | Options Exercisable | ||||||||||||||
|---|---|---|---|---|---|---|---|---|---|---|---|---|---|---|---|---|
Exercise Price
|
Options Outstanding |
Weighted-Average Remaining Contractual Life (Years) |
Weighted-Average Exercise Price per Share |
Exercisable | Weighted-Average Exercise Price per Share |
|||||||||||
$0.01 |
440,000 | 3.6 | $ | 0.01 | 440,000 | $ | 0.01 | |||||||||
0.05 |
2,700,000 | 4.0 | 0.05 | 2,700,000 | 0.05 | |||||||||||
0.10 |
1,442,000 | 4.9 | 0.10 | 1,442,000 | 0.10 | |||||||||||
0.75 |
828,000 | 5.4 | 0.75 | 828,000 | 0.75 | |||||||||||
0.83 |
1,835,187 | 6.2 | 0.83 | 1,801,980 | 0.83 | |||||||||||
1.00 |
3,016,393 | 7.7 | 1.00 | 1,778,495 | 1.00 | |||||||||||
1.02 |
684,000 | 6.7 | 1.02 | 562,855 | 1.02 | |||||||||||
1.33 |
2,488,030 | 8.7 | 1.33 | 636,987 | 1.33 | |||||||||||
1.45 |
89,000 | 7.3 | 1.45 | 62,464 | 1.45 | |||||||||||
1.70 |
413,500 | 9.5 | 1.70 | — | — | |||||||||||
3.10 |
2,467,500 | 9.8 | 3.10 | 25,000 | 3.08 | |||||||||||
|
16,403,610 | 6.9 | 1.09 | 10,277,781 | 0.56 | |||||||||||
Determining Fair Value of Stock Options
The fair value of each grant of stock options was determined by the Company and its board of directors using the methods and assumptions discussed below. Each of these inputs is subjective and generally requires significant judgment to determine.
Valuation Method—The Company estimates the fair value of its stock options using the Black-Scholes option-pricing model.
Expected Term—The expected term represents the period that the stock-based awards are expected to be outstanding. For option grants that are considered to be "plain vanilla," the Company used the simplified method to determine the expected term as provided by the Securities and Exchange Commission. The simplified method calculates the expected term as the average of the time-to-vesting and the contractual life of the options.
Expected Volatility—The expected volatility was based on the historical stock volatilities of several of the Company's publicly listed peers over a period approximately equal to the expected term of the options as the Company did not have a sufficient trading history to use the volatility of its own common stock.
Fair Value of Common Stock—The fair value of the common stock underlying the stock options has historically been determined by the Company's board of directors. Because there has been no public market for the Company's common stock, the board of directors has determined the fair value of the common stock at the time of the option grant by considering a number of objective and subjective factors including valuations of comparable companies, sales of redeemable convertible preferred stock to unrelated third parties, operating and financial performance, lack of liquidity of capital stock and general and industry-specific economic outlook, amongst other factors. The fair value of the underlying
F-29
INTERMOLECULAR, INC. AND SUBSIDIARIES
Notes to Consolidated Financial Statements (Continued)
8. Stock-Based Compensation (Continued)
common stock shall be determined by the board of directors until such time that the Company's common stock is listed on an established stock exchange or national market system.
Risk-Free Interest Rate—The risk-free interest rate is based on the U.S. Treasury yield curve in effect at the time of grant for zero coupon U.S. Treasury notes with maturities approximately equal to the expected term of the options.
Expected Dividend—The expected dividend has been zero as the Company has never paid dividends and does not expect to pay dividends.
Summary of Assumptions—The fair value of the employee stock options were estimated on the grant dates using a Black-Scholes option-pricing model with the following weighted average assumptions:
| |
Years Ended December 31, |
Six Months Ended June 30, |
||||||||||||||
|---|---|---|---|---|---|---|---|---|---|---|---|---|---|---|---|---|
| |
2008 | 2009 | 2010 | 2010 | 2011 | |||||||||||
| |
|
|
|
(unaudited) |
||||||||||||
Expected term (in years) |
6.0 | 6.0 | 6.0 | 6.0 | 6.0 | |||||||||||
Risk-free interest rate |
3.3 | % | 2.5 | % | 2.2 | % | 2.7 | % | 2.4 | % | ||||||
Expected volatility |
55 | % | 55 | % | 55 | % | 55 | % | 57 | % | ||||||
Expected dividend rate |
0 | % | 0 | % | 0 | % | 0 | % | 0 | % | ||||||
9. Net Loss per Share of Common Stock
The following table sets forth the computation of the Company's basic and diluted net loss per share of common stock during the years ended December 31, 2008, 2009 and 2010 and the six months ended June 30, 2010 and 2011 (in thousands, except for share and per share amounts):
| |
Years Ended December 31, | Six Months Ended June 30, |
||||||||||||||
|---|---|---|---|---|---|---|---|---|---|---|---|---|---|---|---|---|
| |
2008 | 2009 | 2010 | 2010 | 2011 | |||||||||||
| |
|
|
|
(unaudited) |
||||||||||||
Net loss attributable to common stockholders |
$ | (14,936 | ) | $ | (14,424 | ) | $ | (15,940 | ) | $ | (9,686 | ) | $ | (10,325 | ) | |
Shares used in computing net loss per share of common stock, basic and diluted |
10,716,462 | 11,023,779 | 11,134,573 | 11,115,486 | 11,296,902 | |||||||||||
Net loss per share of common stock, basic and diluted |
$ | (1.39 | ) | $ | (1.31 | ) | $ | (1.43 | ) | $ | (0.87 | ) | $ | (0.91 | ) | |
F-30
INTERMOLECULAR, INC. AND SUBSIDIARIES
Notes to Consolidated Financial Statements (Continued)
9. Net Loss per Share of Common Stock (Continued)
The following outstanding shares of common stock equivalents were excluded from the computation of diluted net loss per share of common stock for the periods presented because including them would have been antidilutive:
| |
Years Ended December 31, | Six Months Ended June 30, |
||||||||||||||
|---|---|---|---|---|---|---|---|---|---|---|---|---|---|---|---|---|
| |
2008 | 2009 | 2010 | 2010 | 2011 | |||||||||||
| |
|
|
|
(unaudited) |
||||||||||||
Redeemable convertible preferred stock |
52,443,325 | 52,443,325 | 52,443,325 | 52,443,325 | 58,461,447 | |||||||||||
Stock options to purchase common stock |
10,621,749 | 12,194,874 | 14,537,832 | 13,981,041 | 16,403,610 | |||||||||||
Common stock subject to repurchase |
482,709 | 52,084 | — | — | 30,000 | |||||||||||
Common and preferred stock warrants |
1,979,985 | 1,979,985 | 3,624,721 | 3,624,721 | 4,446,721 | |||||||||||
The following table sets forth the computation of the Company's pro forma basic and diluted net loss per share, which are computed to give effect to the conversion of all currently outstanding redeemable convertible preferred stock, as if conversion had occurred at January 1, 2010. The table below further assumes the conversion and subsequent exercise of preferred and certain common stock warrants that expire upon an initial public offering if not exercised (in thousands, except for share and per share amounts):
| |
Year Ended December 31, 2010 |
Six Months Ended June 30, 2011 |
|||||
|---|---|---|---|---|---|---|---|
| |
|
(unaudited) |
|||||
Net loss attributable to common stockholders |
$ | (15,940 | ) | $ | (10,325 | ) | |
Accretion of redeemable convertible preferred stock |
14,162 | 7,095 | |||||
Change in fair value of redeemable convertible preferred stock warrant liabilities |
56 | 455 | |||||
Net loss used in computing pro forma net loss per share of common stock, basic and diluted |
(1,722 | ) | (2,775 | ) | |||
Weighted-average number of shares used in computing net loss per share of common stock, basic and diluted |
11,134,573 | 11,296,902 | |||||
Weighted-average number of pro forma adjustments to reflect assumed conversion of redeemable convertible preferred stock and certain warrants |
54,241,748 | 56,946,398 | |||||
Weighted-average number of shares used in computing pro forma net loss per share of common stock, basic and diluted |
65,376,321 | 68,243,300 | |||||
Pro forma net loss per share of common stock, basic and diluted |
$ | (0.03 | ) | $ | (0.04 | ) | |
F-31
INTERMOLECULAR, INC. AND SUBSIDIARIES
Notes to Consolidated Financial Statements (Continued)
10. Income Taxes
The provision for income taxes consisted of the following (in thousands):
| |
As of December 31, | |||||||||||
|---|---|---|---|---|---|---|---|---|---|---|---|---|
| |
2008 | 2009 | 2010 | |||||||||
Current: |
||||||||||||
U.S. Federal |
$ | — | $ | — | $ | — | ||||||
State |
175 | 4 | 1 | |||||||||
Foreign |
11 | 13 | 18 | |||||||||
Total current |
$ | 186 | $ | 17 | $ | 19 | ||||||
Deferred: |
||||||||||||
U.S. Federal |
$ | — | $ | — | $ | — | ||||||
State |
— | — | — | |||||||||
Foreign |
— | — | — | |||||||||
Total deferred |
— | — | — | |||||||||
Total provision for income taxes |
$ | 186 | $ | 17 | $ | 19 | ||||||
The reconciliation of federal statutory income tax to the Company's provision for income taxes is as follows (in thousands):
| |
As of December 31, | |||||||||
|---|---|---|---|---|---|---|---|---|---|---|
| |
2008 | 2009 | 2010 | |||||||
Expected provision at statutory federal rate |
$ | (3,167 | ) | $ | (1,781 | ) | $ | (616 | ) | |
State tax—net of federal benefit |
116 | 4 | 1 | |||||||
U.S. federal research credit |
(490 | ) | (444 | ) | (626 | ) | ||||
Non deductible expenses |
318 | 399 | 486 | |||||||
Change in statutory tax rate |
— | — | (264 | ) | ||||||
Others |
26 | 93 | 164 | |||||||
Change in valuation allowance |
3,383 | 1,746 | 874 | |||||||
Provision for income taxes |
$ | 186 | $ | 17 | $ | 19 | ||||
As of December 31, 2010, the Company's foreign subsidiaries had accumulated approximately $0.2 million of earnings that have been reinvested in their operations. The Company has not provided U.S. tax on these earnings as the reinvestment is considered permanent in duration.
Deferred income taxes reflect the net tax effects of temporary differences between the carrying amounts of assets and liabilities for financial reporting purposes and the amounts used for income tax
F-32
INTERMOLECULAR, INC. AND SUBSIDIARIES
Notes to Consolidated Financial Statements (Continued)
10. Income Taxes (Continued)
purposes. Significant components of the Company's deferred tax assets and liabilities are as follows (in thousands):
| |
As of December 31, | ||||||||
|---|---|---|---|---|---|---|---|---|---|
| |
2009 | 2010 | |||||||
Deferred tax assets: |
|||||||||
Net operating loss federal and state |
$ | 7,925 | $ | 8,426 | |||||
Research credits |
2,231 | 3,271 | |||||||
Accrued compensation and vacation |
287 | 324 | |||||||
Deferred revenue, other accruals and reserves |
4,027 | 3,705 | |||||||
Stock compensation |
239 | 242 | |||||||
Gross deferred tax assets |
14,709 | 15,968 | |||||||
Valuation allowance |
(13,917 | ) | (15,818 | ) | |||||
Total deferred tax asset |
792 | 150 | |||||||
Deferred tax liabilities: |
|||||||||
Patents |
649 | — | |||||||
Property and equipment |
143 | 150 | |||||||
Total deferred tax liabilities |
792 | 150 | |||||||
Net deferred tax assets |
$ | — | $ | — | |||||
The Company established valuation allowances for U.S. federal and state deferred tax assets. The valuation allowances require an assessment of both positive and negative evidence when determining whether it is more likely than not that deferred tax assets are recoverable. Such assessment is required on a jurisdiction by jurisdiction basis. During the year ended December 31, 2010, the Company continued to maintain the valuation allowances for U.S. federal and state deferred tax assets. The Company intends to maintain a full valuation allowance until sufficient positive evidence exists to support reversal. The valuation allowance for deferred tax assets was $13.9 million and $15.8 million as of December 31, 2009 and 2010, respectively. The increase in the valuation allowance during the years ended December 31, 2009 and 2010 was $1.8 million and $1.9 million, respectively.
As of December 31, 2010, the Company has net operating loss carryforwards for U.S. federal and state income tax purposes of approximately $17.4 million and $18.5 million, respectively, to offset future taxable income. The U.S. federal net operating loss carryforwards will start to expire in 2026 while for state purposes, the net operating loss carryforwards will start to expire in 2018. Utilization of the Company's net operating loss carryforwards and tax credits may be subject to substantial annual limitation due to the ownership change limitations provided by the Internal Revenue Code and similar state provisions. Such an annual limitation could result in the expiration of the net operating loss before utilization. The Company has not determined whether an ownership change has occurred.
In addition, the Company has $2.5 million U.S. federal R&D credit and $2.5 million California R&D credit carryforwards to offset future income tax liabilities. U.S. federal R&D tax credits can be carried forward for 20 years and will start to expire in 2025. California R&D credits can be carried forward indefinitely.
F-33
INTERMOLECULAR, INC. AND SUBSIDIARIES
Notes to Consolidated Financial Statements (Continued)
10. Income Taxes (Continued)
Uncertain Tax Positions
As of December 31, 2010, the total amount of unrecognized tax benefits excluding interest thereon was $1.1 million, none of which would impact the effective tax rate if realized during the year. The Company has not accrued interest and penalties related to the unrecognized tax benefits reflected in the financial statements for the year ended December 31, 2010. Although the timing and outcome of income tax audits is highly uncertain, unrecognized tax benefits are not expected to decrease in the next twelve months.
The following table summarizes the activity related to unrecognized tax benefits (in thousands):
| |
As of December 31, | |||||||||
|---|---|---|---|---|---|---|---|---|---|---|
| |
2008 | 2009 | 2010 | |||||||
Unrecognized benefit—beginning of period |
$ | 222 | $ | 518 | $ | 746 | ||||
Gross increases—prior period tax positions |
— | — | — | |||||||
Gross increases—current period tax positions |
296 | 228 | 321 | |||||||
Unrecognized benefit—end of period |
$ | 518 | $ | 746 | $ | 1,067 | ||||
The Company's U.S. federal, state and local and foreign income tax returns are subject to audit by relevant tax authorities. The Company's income tax reporting periods beginning with tax year ended December 31, 2007 for the U.S., and tax year ended December 31, 2006 for the Company's major state and local jurisdictions remain generally open to audit by relevant tax authorities.
11. Related Party Transactions
The Company entered into a Collaborative Development and License Agreement in March 2005 and an Alliance Agreement in December 2005 with a technology company under which the two companies will work together to conduct research and development and other activities with respect to materials and high throughput technology for use in semiconductor applications. Depending on the output of the research and development, the primary rightholder could be either company. However, the party that is not the primary rightholder will be assigned the right to use the output property. Each party is bearing its own expenses with respect to patents and the patent application process. The Company is required to pay royalties based on a percentage of revenue derived, directly or indirectly, from the use of this technology. The Company is not generating revenue from the other party. In August 2006, the Company received $13.5 million from the other party in exchange for shares of Series C representing 9.8% of the Company's fully diluted shares. In December 2008, the Company received $1.6 million from the other party in exchange for shares of Series D. As of December 31, 2010, the other party's stock holdings represent 9.4% of the Company's fully diluted shares. The other party's chief executive officer, who is a member of their board of directors, is also a director of the Company. During the years ended December 31, 2008, 2009 and 2010 and the six months ended June 30, 2010 and through April 30, 2011, the Company expensed $1.0 million, $1.2 million, $2.0 million, $0.8 million and $0.6 million, respectively, in royalties and had accrued liabilities in the amount of $502,000 and $795,000 due to the other party as of December 31, 2009 and 2010, respectively. During the years ended December 31, 2008, 2009 and 2010 and the six months ended June 30, 2010 and through April 30, 2011, the Company purchased $286,000, $14,000, $6,000, $0 and $0, respectively, of fixed assets, maintenance and consumables from the other party. Effective May 2011
F-34
INTERMOLECULAR, INC. AND SUBSIDIARIES
Notes to Consolidated Financial Statements (Continued)
11. Related Party Transactions (Continued)
this entity is no longer considered a related party due to the change in status of the Company's director and such director's relationship with the other party.
The Company entered into a Collaborative Development and License Agreement in August 2006 and a second Collaborative Development and License Agreement in March 2010 with another related party. Under the agreements, the two companies will work together to conduct research and development and other activities. Depending on the output of the research and development, the primary rightholder will be the Company or the other party. However, if the other party is not the primary rightholder, it will be able to license the developed technology from the Company. The other party's vice chairman of the board of directors is a director of the Company and is also a managing member of a significant shareholder of the Company. As of December 31, 2010 and June 30, 2011, this shareholder held a 12.5% and 11.8% interest, respectively, in the Company on a fully diluted share basis. During the years ended December 31, 2008, 2009 and 2010 and the six months ended June 30, 2010 and 2011, the Company recorded revenue in the amount of $1.7 million, $0, $3.9 million, $1.2 million and $2.6 million, respectively, from these agreements.
In November 2006, the Company entered into an Alliance Agreement with a related party that holds a 7.4% and 8.5% interest in the Company on a fully diluted share basis as of December 31, 2010 and June 30, 2011, respectively. Under the agreement, the two companies will work together to conduct research and development and other activities with respect to materials and high productivity combinatorial technology for use in semiconductor applications. Depending on the output of the research and development, the primary rightholder could be either company. However, the party that is not the primary rightholder will be assigned the right to use the output property. Under the agreement, the other party will pay the Company fees for services and both parties may provide royalties to the other for licensed technology sold to third parties. In July 2007, the Company and the other party entered into a Workflow Purchase Agreement whereby the other party agreed to purchase from the Company a fluids-based workflow including services and licensing of intellectual property. In December 2007, the Company and the other party added an addendum to the Workflow Purchase Agreement. As part of this addendum, the other party increased the number of fluids-based workflows for purchase, contracted with the Company for additional services and provided for a $10.0 million prepayment of minimum royalties. The $10.0 million minimum royalty prepayment is nonrefundable. The minimum royalty prepayment began revenue recognition during the year ended December 31, 2009 and should be fully earned no later than the year ended December 31, 2012. The agreement committed the other party to purchase three additional workflows in addition to the initial workflow order. In December 2008, the Company and the other party added an additional addendum to the Workflow Purchase Agreement and entered into a Dry Workflow Agreement. As part of this 2008 addendum, the third Wet Workflow was canceled and the deposit applied to the Dry Workflow purchase. In March 2009, the Company and the other party entered into a supplement to the Workflow Purchase Agreement which adjusted the timing and delivery of services to be performed. Effective August 2010, the Company and the other party entered into a Modification to the Wets Workflow Purchase Agreement and Dry Workflow Purchase Agreement which further extended and adjusted the timing and services to be performed. During the years ended December 31, 2008, 2009 and 2010 and the six months ended June 30, 2010 and 2011, the Company recorded revenue in the amount of $13.4 million, $16.0 million, $22.1 million, $10.3 million and $7.8 million, respectively, in equipment sales, license fees and service fees and had accounts receivable in the amount of $1.2 million, $461,000 and $447,000 as of December 31, 2009, 2010 and June 30, 2011, respectively, related to these agreements. The Company recorded a deferred revenue balance in the amount of $22.8 million, $13.3 million and $8.2 million
F-35
INTERMOLECULAR, INC. AND SUBSIDIARIES
Notes to Consolidated Financial Statements (Continued)
11. Related Party Transactions (Continued)
related to these agreements as of December 31, 2009, 2010 and June 30, 2011, respectively. The deferred revenue balance includes the unrecognized portion of the prepayment of the $10.0 million minimum royalty, of which $7.5 million and $5.0 million remains as of December 31, 2010 and June 30, 2011, respectively, as well as payments for elements of the workflow purchases.
12. Information about Geographic Areas
Revenue
Revenue by geography is based on the billing address of the customer. The following table sets forth revenue by geographic area (in thousands):
| |
Years Ended December 31, | Six Months Ended June 30, |
||||||||||||||
|---|---|---|---|---|---|---|---|---|---|---|---|---|---|---|---|---|
| |
2008 | 2009 | 2010 | 2010 | 2011 | |||||||||||
| |
|
|
|
(unaudited) |
||||||||||||
United States |
$ | 16,522 | $ | 18,894 | $ | 29,526 | $ | 11,699 | $ | 14,886 | ||||||
Japan |
6,267 | 7,906 | 12,449 | 4,583 | 7,468 | |||||||||||
Taiwan |
90 | — | 489 | — | 1,470 | |||||||||||
Europe |
250 | 110 | 210 | 210 | — | |||||||||||
Total |
$ | 23,129 | $ | 26,910 | $ | 42,674 | $ | 16,492 | $ | 23,824 | ||||||
Long-Lived Assets
Substantially all of the Company's long-lived assets are located in the U.S. An insignificant amount of long-lived assets reside in the Company's foreign subsidiaries and branches in Hong Kong, Japan and Taiwan.
13. Subsequent Events
On July 28, 2011, the Company entered into an agreement with Symyx Technologies, Inc., a related party (Symyx), pursuant to which the Company agreed to use commercially reasonable efforts to allow Symyx to sell in an initial public offering shares of the Company's common stock held by them. Pursuant to the agreement, Symyx agreed to sell such shares and, upon consummation of the initial public offering and such sale, to terminate the Company's future royalty obligations under an existing license agreement to the extent they would have accrued after December 31, 2011. Additionally, upon consummation of the initial public offering and such sale, Symyx would transfer to the Company all patents held by them that relate to combinatorial processing. To the extent the gross proceeds (before deducting underwriting discounts and commissions and offering expenses) to Symyx from the sale of their shares in an initial public offering are less than $67 million, the Company would issue Symyx a secured promissory note that would have a term of 24 months and an interest rate equal to 4%. Such note would be payable in an amount equal to the greater of $500,000 per quarter or the amount of accrued interest, with a balloon payment at maturity, if applicable. Such note would also be pre-payable by the Company at any time without penalty or premium, and would be secured by tangible personal property, excluding intellectual property. In addition, the Company has agreed to reimburse Symyx for 50% of the underwriting discounts and commissions payable by them in connection with this offering.
F-36

PART II
INFORMATION NOT REQUIRED IN PROSPECTUS
Item 13. Other Expenses of Issuance and Distribution
The following table sets forth the fees and expenses, other than underwriting discounts and commissions, payable in connection with the registration of the common stock hereunder. All amounts are estimates except the SEC registration fee, the FINRA filing fee and The Nasdaq Global Market or the New York Stock Exchange listing fee.
| |
Amount to be Paid |
|||
|---|---|---|---|---|
Securities and Exchange Commission registration fee |
$ | 23,220 | ||
FINRA filing fee |
20,500 | |||
NASDAQ Global Market or the New York Stock Exchange listing fee |
* | |||
Symyx transaction expenses |
* | |||
Blue Sky fees and expenses |
* | |||
Printing and engraving expenses |
* | |||
Legal fees and expenses |
* | |||
Accounting fees and expenses |
* | |||
Transfer Agent and Registrar fees |
* | |||
Miscellaneous expenses |
* | |||
Total |
$ | * | ||
- *
- to be filed by amendment.
Item 14. Indemnification of Directors and Officers
Section 145 of the Delaware General Corporation Law provides that a corporation may indemnify its directors and officers from certain expenses in connection with legal proceedings and permits a corporation to include in its charter documents, and in agreements between the corporation and its directors and officers, provisions expanding the scope of indemnification beyond that specifically provided by this section.
The Registrant's restated certificate of incorporation provides for the indemnification of directors to the fullest extent permissible under Delaware law.
The Registrant's amended and restated bylaws provide for the indemnification of officers, directors and third parties acting on the Registrant's behalf if such persons act in good faith and in a manner reasonably believed to be in and not opposed to the Registrant's best interest, and, with respect to any criminal action or proceeding, such indemnified party had no reason to believe his or her conduct was unlawful.
The Registrant is entering into indemnification agreements with each of its directors and executive officers, in addition to the indemnification provisions provided for in its charter documents, and the Registrant intends to enter into indemnification agreements with any new directors and executive officers in the future.
The underwriting agreement (a form of which is filed as Exhibit 1.1 hereto) will provide for indemnification by the underwriters of the Registrant and the Registrant's executive officers and directors, and indemnification of the underwriters by the Registrant, for certain liabilities, including liabilities arising under the Securities Act of 1933, as amended, in connection with certain matters.
II-1
The Registrant intends to purchase and maintain insurance on behalf of any person who is or was a director or officer against any loss arising from any claim asserted against him or her and incurred by him or her in that capacity, subject to certain exclusions and limits of the amount of coverage.
Item 15. Recent Sales of Unregistered Securities
The following sets forth information regarding all unregistered securities sold by the Registrant since January 1, 2008:
- 1.
- On
June 20, 2008, the Registrant issued a warrant to purchase 180,000 shares of its common stock at an exercise price of $1.02 per share to a French
company owned exclusively by one of the Registrant's consultants. One-fourth of the shares subject to the warrant became exercisable on the first anniversary of the date of issuance, with
the remaining shares vesting monthly thereafter such that all shares subject to the warrant may be exercisable by the holder four years after the date of issuance. The vested portion of the warrant
may be exercised at any time prior to the warrant's termination, which in any event would occur, if at all, no later than ten years from the date of issuance.
- 2.
- On
December 16, 2008, the Registrant issued and sold an aggregate of 6,575,832 shares of its Series D preferred stock at a price of $3.04144
per share, for aggregate gross consideration of $19,999,998.49, to seven accredited investors.
- 3.
- On
March 15, 2010, the Registrant issued warrants to purchase an aggregate of 1,644,736 shares of its common stock at an exercise price of $3.04144
per share to Toshiba Corporation and SanDisk Corporation, which may become exercisable pursuant to the terms of that certain Collaborative Development Program Agreement, by and among the Registrant,
Toshiba Corporation and SanDisk Corporation. Upon becoming exercisable, the warrants may be exercised no later than 120 days following the end of the activities conducted by Toshiba, SanDisk
and the Registrant pursuant to the Collaborative Development Program Agreement.
- 4.
- On
March 4, 2011, the Registrant issued and sold an aggregate of 3,610,873 shares of its Series E preferred stock at a price of $4.15412 per
share, for aggregate gross consideration of $14,999,999.78, to seven accredited investors.
- 5.
- On
June 1, 2011, the Registrant issued a warrant to purchase 822,000 shares of its common stock at an exercise price of $4.15412 per share to Advanced
Technology Investment Company LLC. The warrant may be exercised at any time prior to its termination date, which is the eighteen month anniversary of its issue date.
- 6.
- On
June 14, 2011, the Registrant issued and sold an aggregate of 2,407,249 shares of its Series E preferred stock at a price of $4.15412 per
share, for aggregate gross consideration of $10,000,001.21, to one accredited investor.
- 7.
- On
August 25, 2011, the Registrant issued a warrant to purchase 5,000 shares of its common stock at an exercise price of $0.10 per share to The
Enterprise Network. The warrant may be exercised at any time prior to the warrant's termination, which in any event would occur, if at all, no later than eighteen months from the date of issuance.
- 8.
- Between
January 1, 2008 and September 1, 2011, the Registrant granted stock options to purchase 11,024,250 shares of its common stock at
exercise prices ranging from $1.00 to $5.98 per share to a total of 250 employees, consultants and directors under its 2004 Equity Incentive Plan.
- 9.
- Between January 1, 2008 and September 1, 2011, the Registrant issued and sold an aggregate of 1,350,356 shares of its common stock to employees and consultants at prices ranging from $0.01 to $1.33 per share pursuant to the exercise of options granted under its 2004 Equity Incentive Plan.
II-2
The issuance of securities described above in Item 15 paragraphs 2 - 6 was exempt from registration under the Securities Act of 1933, as amended, in reliance on Section 4(2) of the Securities Act of 1933, as amended, and Regulation D promulgated thereunder, as transactions by an issuer not involving any public offering. The purchasers of the securities in these transactions represented that they were accredited investors and that they were acquiring the securities for investment only and not with a view toward the public sale or distribution thereof. Such purchasers received written disclosures that the securities had not been registered under the Securities Act of 1933, as amended, and that any resale must be made pursuant to a registration statement or an available exemption from registration. All purchasers either received adequate financial statement or non-financial statement information about the Registrant or had adequate access, through their relationship with the Registrant, to financial statement or non-financial statement information about the Registrant. The sale of these securities was made without general solicitation or advertising.
The issuance of securities described above in Item 15 paragraphs 1, 7 and 8 was exempt from registration under the Securities Act of 1933, as amended, in reliance on Rule 701, Section 4(2) and Regulation S of the Securities Act of 1933, as amended, pursuant to compensatory benefit plans or agreements approved by the Registrant's board of directors.
All certificates representing the securities issued in these transactions described in this Item 15 included appropriate legends setting forth that the securities had not been offered or sold pursuant to a registration statement and describing the applicable restrictions on transfer of the securities. There were no underwriters employed in connection with any of the transactions set forth in this Item 15.
Item 16. Exhibits and Financial Statement Schedules
- (a)
- Exhibits
| Exhibit No. | Description of Exhibits | ||
|---|---|---|---|
| 1.1 | * | Form of Underwriting Agreement. | |
| 2.1 | Asset Purchase Agreement by and between Intermolecular, Inc. and Symyx Technologies, Inc. dated as of July 28, 2011.(1) | ||
| 3.1 | # | Fifth Restated Certificate of Incorporation of Intermolecular, Inc., currently in effect. | |
| 3.2 | * | Form of Restated Certificate of Incorporation of Intermolecular, Inc., to be in effect immediately prior to the consummation of this offering. | |
| 3.3 | # | Bylaws of Intermolecular, Inc., as amended, currently in effect. | |
| 3.4 | * | Form of Amended and Restated Bylaws of Intermolecular, Inc., to be in effect immediately prior to the consummation of this offering. | |
| 4.1 | * | Specimen Common Stock Certificate. | |
| 4.2 | # | Warrant to purchase shares of common stock issued to Timane S.a.r.l. dated June 20, 2008. | |
| 4.3 | * | Form of warrant to purchase shares of common stock issued to Toshiba Corporation and SanDisk Corporation dated March 15, 2010. | |
| 5.1 | * | Opinion of Latham & Watkins LLP. | |
| 10.1 | # | Fourth Amended and Restated Investor Rights Agreement dated as of March 4, 2011, by and among Intermolecular, Inc. and certain stockholders named therein, as amended by Amendment No. 1 to Fourth Amended and Restated Investor Rights Agreement dated as of June 14, 2011. | |
II-3
| Exhibit No. | Description of Exhibits | ||
|---|---|---|---|
| 10.2 | # | Lease Agreement by and between Intermolecular, Inc. and Novellus Systems, Inc. dated as of May 10, 2010, as amended by the Confirmation of Commencement Date of the Lease Agreement dated as of June 10, 2010. | |
| 10.3 | †# | Collaborative Development Program Agreement by and among SanDisk Corporation, Toshiba Corporation and Intermolecular, Inc. dated March 15, 2010. | |
| 10.4 | †# | Alliance Agreement by and between Intermolecular, Inc. and Advanced Technology Materials, Inc. dated as of November 17, 2006. | |
| 10.5 | †# | Wets Workflow Purchase Agreement by and between Intermolecular, Inc. and Advanced Technology Materials, Inc. dated as of July 13, 2007, as amended by the Addendum to Wets Workflow Purchase Agreement dated as of December 21, 2007, the Amendment to Addendum to Wets Workflow Purchase Agreement dated as of December 16, 2008 and the Supplemental Agreement to the Amendment to the Addendum to Wets Workflow Purchase Agreement dated as of March 16, 2009. | |
| 10.6 | †# | Dry Workflow Purchase Agreement by and between Intermolecular, Inc. and Advanced Technology Materials, Inc. dated as of December 16, 2008. | |
| 10.7 | †# | Modification to the Wets Workflow Purchase Agreement and Dry Workflow Purchase Agreement by and between Intermolecular, Inc. and Advanced Technology Materials, Inc. dated as of August 27, 2010. | |
| 10.8 | †# | Amendment Number 5 to the Wets Workflow Purchase Agreement and Dry Workflow Purchase Agreement by and between Intermolecular, Inc. and Advanced Technology Materials, Inc. dated as of March 3, 2011. | |
| 10.9 | †# | Advanced Memory Development Program Agreement by and between Intermolecular, Inc. and Elpida Memory, Inc. dated as of May 22, 2008, as amended by Exhibit C—Royalty Terms dated as of August 18, 2008, the Supplemental Joint Development Agreement dated as of January 27, 2009, the Amendment to the Supplemental Joint Development Agreement dated as of May 25, 2009 and the Amendment to the Advanced Memory Agreement dated July 29, 2010. | |
| 10.10 | †# | Collaborative Development Program Agreement by and between Intermolecular, Inc. and GLOBALFOUNDRIES Inc. dated as of June 1, 2011. | |
| 10.11 | # | Form of Indemnification Agreement between Intermolecular, Inc. and each of its directors, as currently in effect. | |
| 10.12 | * | Form of Indemnification Agreement between Intermolecular, Inc. and each of its directors, officers and certain employees, to be in effect before the completion of the offering. | |
| 10.13 | a+# | Intermolecular, Inc. 2004 Equity Incentive Plan, as amended. | |
| 10.13 | b+# | Form of Early Exercise Stock Option Agreement under the 2004 Equity Incentive Plan. | |
| 10.13 | c+# | Form of Stock Option Agreement under the 2004 Equity Incentive Plan. | |
| 10.14 | a+* | Intermolecular, Inc. 2011 Equity Incentive Award Plan. | |
| 10.14 | b+* | Form of Stock Option Grant Notice and Stock Option Agreement under the 2011 Equity Incentive Award Plan. | |
| 23.1 | Consent of KPMG LLP, Independent Registered Public Accounting Firm. | ||
| 23.2 | * | Consent of Latham & Watkins LLP (included in Exhibit 5.1). | |
II-4
| Exhibit No. | Description of Exhibits | ||
|---|---|---|---|
| 24.1 | # | Power of Attorney. | |
- *
- To
be filed by amendment.
- +
- Indicates
a management contract or compensatory plan.
- †
- Certain
portions have been omitted pursuant to a confidential treatment request. Omitted information has been filed separately with the SEC.
- #
- Previously
filed.
- (1)
- All exhibits, schedules and similar attachments to this exhibit have been omitted. Copies of such exhibits, schedules and similar attachments will be furnished supplementally to the SEC upon request.
- (b)
- Financial Statement Schedules
Schedules not listed above have been omitted because the information required to be set forth therein is not applicable or is shown in the financial statements or notes thereto.
Insofar as indemnification for liabilities arising under the Securities Act of 1933, as amended, may be permitted to directors, officers and controlling persons of the Registrant pursuant to the foregoing provisions, or otherwise, the Registrant has been advised that in the opinion of the Securities and Exchange Commission such indemnification is against public policy as expressed in the Securities Act of 1933, as amended, and is, therefore, unenforceable. In the event that a claim for indemnification against such liabilities (other than the payment by the Registrant of expenses incurred or paid by a director, officer or controlling person of the Registrant in the successful defense of any action, suit or proceeding) is asserted by such director, officer or controlling person in connection with the securities being registered, the Registrant will, unless in the opinion of its counsel the matter has been settled by controlling precedent, submit to a court of appropriate jurisdiction the question whether such indemnification by it is against public policy as expressed in the Securities Act of 1933, as amended, and will be governed by the final adjudication of such issue.
The undersigned Registrant hereby undertakes that:
(a) The Registrant will provide to the underwriters at the closing, as specified in the underwriting agreement, certificates in such denominations and registered in such names as required by the underwriters to permit prompt delivery to each purchaser.
(b) For purposes of determining any liability under the Securities Act of 1933, as amended, the information omitted from the form of prospectus filed as part of this registration statement in reliance upon Rule 430A and contained in the form of prospectus filed by the Registrant pursuant to Rule 424(b)(1) or (4) or 497(h) under the Securities Act of 1933, as amended, shall be deemed to be part of this registration statement as of the time it was declared effective.
(c) For the purpose of determining any liability under the Securities Act of 1933, as amended, each post-effective amendment that contains a form of prospectus shall be deemed to be a new registration statement relating to the securities offered therein, and the offering of such securities at that time shall be deemed to be the initial bona fide offering thereof.
II-5
Pursuant to the requirements of the Securities Act of 1933, as amended, the Registrant has duly caused this amendment to this Registration Statement on Form S-1 to be signed on its behalf by the undersigned, thereunto duly authorized, in the City of San Jose, State of California, on the 9th day of September, 2011.
| INTERMOLECULAR, INC. | ||||
By: |
/s/ DAVID E. LAZOVSKY David E. Lazovsky President and Chief Executive Officer |
|||
Pursuant to the requirements of the Securities Act of 1933, as amended, this amendment to this Registration Statement has been signed by the following persons in the capacities indicated below on the dates indicated.
Signature
|
Title
|
Date
|
||
|---|---|---|---|---|
| /s/ DAVID E. LAZOVSKY DAVID E. LAZOVSKY |
President, Chief Executive Officer and Director (Principal Executive Officer) | September 9, 2011 | ||
/s/ PETER L. EIDELMAN PETER L. EIDELMAN |
Chief Financial Officer (Principal Financial and Accounting Officer) |
September 9, 2011 |
||
* THOMAS R. BARUCH |
Director |
September 9, 2011 |
||
* MARVIN D. BURKETT |
Director |
September 9, 2011 |
||
* IRWIN FEDERMAN |
Director |
September 9, 2011 |
||
* ISY GOLDWASSER |
Director |
September 9, 2011 |
||
* BRUCE M. MCWILLIAMS |
Director |
September 9, 2011 |
II-6
Signature
|
Title
|
Date
|
||
|---|---|---|---|---|
| * GEORGE M. SCALISE |
Director | September 9, 2011 | ||
* JOHN L. WALECKA |
Director |
September 9, 2011 |
| *By: | /s/ PETER L. EIDELMAN |
|||
| PETER L. EIDELMAN, Attorney-in-Fact |
II-7
| Exhibit No. | Description of Exhibits | ||
|---|---|---|---|
| 1.1 | * | Form of Underwriting Agreement. | |
| 2.1 | Asset Purchase Agreement by and between Intermolecular, Inc. and Symyx Technologies, Inc. dated as of July 28, 2011.(1) | ||
| 3.1 | # | Fifth Restated Certificate of Incorporation of Intermolecular, Inc., currently in effect. | |
| 3.2 | * | Form of Restated Certificate of Incorporation of Intermolecular, Inc., to be in effect immediately prior to the consummation of this offering. | |
| 3.3 | # | Bylaws of Intermolecular, Inc., as amended, currently in effect. | |
| 3.4 | * | Form of Amended and Restated Bylaws of Intermolecular, Inc., to be in effect immediately prior to the consummation of this offering. | |
| 4.1 | * | Specimen Common Stock Certificate. | |
| 4.2 | # | Warrant to purchase shares of common stock issued to Timane S.a.r.l. dated June 20, 2008. | |
| 4.3 | * | Form of warrant to purchase shares of common stock issued to Toshiba Corporation and SanDisk Corporation dated March 15, 2010. | |
| 5.1 | * | Opinion of Latham & Watkins LLP. | |
| 10.1 | # | Fourth Amended and Restated Investor Rights Agreement dated as of March 4, 2011, by and among Intermolecular, Inc. and certain stockholders named therein, as amended by Amendment No. 1 to Fourth Amended and Restated Investor Rights Agreement dated as of June 14, 2011. | |
| 10.2 | # | Lease Agreement by and between Intermolecular, Inc. and Novellus Systems, Inc. dated as of May 10, 2010, as amended by the Confirmation of Commencement Date of the Lease Agreement dated as of June 10, 2010. | |
| 10.3 | †# | Collaborative Development Program Agreement by and among SanDisk Corporation, Toshiba Corporation and Intermolecular, Inc. dated March 15, 2010. | |
| 10.4 | †# | Alliance Agreement by and between Intermolecular, Inc. and Advanced Technology Materials, Inc. dated as of November 17, 2006. | |
| 10.5 | †# | Wets Workflow Purchase Agreement by and between Intermolecular, Inc. and Advanced Technology Materials, Inc. dated as of July 13, 2007, as amended by the Addendum to Wets Workflow Purchase Agreement dated as of December 21, 2007, the Amendment to Addendum to Wets Workflow Purchase Agreement dated as of December 16, 2008 and the Supplemental Agreement to the Amendment to the Addendum to Wets Workflow Purchase Agreement dated as of March 16, 2009. | |
| 10.6 | †# | Dry Workflow Purchase Agreement by and between Intermolecular, Inc. and Advanced Technology Materials, Inc. dated as of December 16, 2008. | |
| 10.7 | †# | Modification to the Wets Workflow Purchase Agreement and Dry Workflow Purchase Agreement by and between Intermolecular, Inc. and Advanced Technology Materials, Inc. dated as of August 27, 2010. | |
| 10.8 | †# | Amendment Number 5 to the Wets Workflow Purchase Agreement and Dry Workflow Purchase Agreement by and between Intermolecular, Inc. and Advanced Technology Materials, Inc. dated as of March 3, 2011. | |
| Exhibit No. | Description of Exhibits | ||
|---|---|---|---|
| 10.9 | †# | Advanced Memory Development Program Agreement by and between Intermolecular, Inc. and Elpida Memory, Inc. dated as of May 22, 2008, as amended by Exhibit C—Royalty Terms dated as of August 18, 2008, the Supplemental Joint Development Agreement dated as of January 27, 2009, the Amendment to the Supplemental Joint Development Agreement dated as of May 25, 2009 and the Amendment to the Advanced Memory Agreement dated July 29, 2010. | |
| 10.10 | †# | Collaborative Development Program Agreement by and between Intermolecular, Inc. and GLOBALFOUNDRIES Inc. dated as of June 1, 2011. | |
| 10.11 | # | Form of Indemnification Agreement between Intermolecular, Inc. and each of its directors, as currently in effect. | |
| 10.12 | * | Form of Indemnification Agreement between Intermolecular, Inc. and each of its directors, officers and certain employees, to be in effect before the completion of the offering. | |
| 10.13a | +# | Intermolecular, Inc. 2004 Equity Incentive Plan, as amended. | |
| 10.13b | +# | Form of Early Exercise Stock Option Agreement under the 2004 Equity Incentive Plan. | |
| 10.13c | +# | Form of Stock Option Agreement under the 2004 Equity Incentive Plan. | |
| 10.14a | +* | Intermolecular, Inc. 2011 Equity Incentive Award Plan. | |
| 10.14b | +* | Form of Stock Option Grant Notice and Stock Option Agreement under the 2011 Equity Incentive Award Plan. | |
| 23.1 | Consent of KPMG LLP, Independent Registered Public Accounting Firm. | ||
| 23.2 | * | Consent of Latham & Watkins LLP (included in Exhibit 5.1). | |
| 24.1 | # | Power of Attorney. | |
- *
- To
be filed by amendment.
- +
- Indicates
a management contract or compensatory plan.
- †
- Certain
portions have been omitted pursuant to a confidential treatment request. Omitted information has been filed separately with the SEC.
- #
- Previously
filed.
- (1)
- All exhibits, schedules and similar attachments to this exhibit have been omitted. Copies of such exhibits, schedules and similar attachments will be furnished supplementally to the SEC upon request.