Attached files
UNITED STATES
SECURITIES AND EXCHANGE COMMISSION
Washington, D.C. 20549
FORM 10-K
(Mark One)
x ANNUAL REPORT PURSUANT TO SECTION 13 OR 15(d) OF THE SECURITIES EXCHANGE ACT OF 1934
For the fiscal year ended June 30, 2011
OR
o TRANSITION REPORT PURSUANT TO SECTION 13 OR 15(d) OF THE SECURITIES EXCHANGE ACT OF 1934
For the transition period from ________ to ________
Commission file number: 1-10768
MEDIWARE INFORMATION SYSTEMS, INC.
(Exact name of registrant as specified in its charter)
|
New York
|
11-2209324
|
|
(State or other jurisdiction of incorporation or organization)
|
(I.R.S. Employer Identification No.)
|
|
11711 West 79th Street
Lenexa, KS
|
66214
|
|
(Address of principal executive offices)
|
(Zip Code)
|
Registrant's telephone number, including area code: (913) 307-1000
Securities registered pursuant to section 12(b) of the Act:
|
Title of each class
|
Name of each exchange on which registered
|
|
|
Common Stock, par value $ .10 per share
|
Nasdaq Capital Market
|
Securities registered pursuant to Section 12(g) of the Act: None
Indicate by check mark if the registrant is a well-known seasoned issuer, as defined in Rule 405 of the Securities Act. Yes o No x
Indicate by check mark if the registrant is not required to file reports pursuant to Section 13 or Section 15(d) of the Act. Yes o No x
Indicate by check mark whether the registrant (1) has filed all reports required to be filed by Section 13 or 15(d) of the Securities Exchange Act of 1934 during the preceding 12 months (or for such shorter period that the registrant was required to file such reports), and (2) has been subject to such filing requirements for the past 90 days. Yes x No o
Indicate by check mark whether the registrant has submitted electronically and posted on its Web site, if any, every Interactive Data File required to be submitted and posted pursuant to Rule 405 of Regulation S-T (§232.405 of this chapter) during the preceding 12 months (or for such shorter period that the registrant was required to submit and post such files). Yes o No o
Indicate by check mark if disclosure of delinquent filers pursuant to Item 405 of Registration S-K is not contained herein, and will not be contained, to the best of registrant's knowledge, in definitive proxy or information statements incorporated by reference in Part III of this Form 10-K or any amendment to this Form 10-K. o
Indicate by check mark whether the registrant is a large accelerated filer, an accelerated filer, a non-accelerated filer, or a smaller reporting company. See the definitions of “large accelerated filer,” “accelerated filer” and “smaller reporting company” in Rule 12b-2 of the Exchange Act.
|
Large accelerated filer
|
o
|
Accelerated Filer
|
o
|
|
Non-accelerated filer
|
o
|
Smaller reporting company
|
x
|
|
(Do not check if a smaller reporting company)
|
|||
Indicate by check mark whether the registrant is a shell company (as defined in Rule 12b-2 of the Exchange Act). Yes o No x
The aggregate market value of the voting stock held by non-affiliates of the registrant, based upon the closing sales price of its common stock on December 31, 2010 as reported on the Nasdaq Capital Market, was approximately $56,825,000.
The number of shares outstanding of the registrant's common stock, as of September 1, 2011, was 8,085,000 shares.
2
DOCUMENTS INCORPORATED BY REFERENCE
The information required for Part III of this Annual Report on Form 10-K is incorporated by reference from the Registrant’s Proxy Statement for its 2011 Annual Meeting of Shareholders to be filed with the Securities and Exchange Commission within 120 days after the end of the Registrant’s fiscal year.
PART I
Item 1. Business.
Overview
Mediware Information Systems, Inc. (including its subsidiaries, “Mediware” or the “Company”) is a New York corporation incorporated in 1970 with its corporate headquarters at 11711 West 79th Street, Lenexa, Kansas. The Company maintains an Internet website at www.mediware.com, at which information filed with or furnished to the Securities Exchange Commission (“SEC”) under the Securities Exchange Act of 1934 (the “Securities Exchange Act”) can be obtained under “Investor Relations” without charge as soon as reasonably practicable after such documents have been filed or furnished with the SEC. The Company may also post at its website additional information important to its shareholders and to potential investors. Information on or linked to the Company website is not incorporated by reference into this Annual Report on Form 10-K. Filings with the SEC can also be obtained at the SEC’s website, www.sec.gov.
Mediware designs, develops and markets software solutions targeting specific processes within healthcare institutions. Software products are sold to hospitals, long-term care and behavioral health facilities and stand alone blood and plasma donation centers and alternate care settings. Mediware also provides software installation and maintenance services and billing and collection services to the home infusion and home/durable medical equipment markets. The Company believes that its competitive advantages include rich product knowledge and a long history of innovation in the areas of medication and blood software products.
Mediware provides its software systems to its customers through installation at customer facilities or on a remotely hosted basis. The software systems typically consist of the Company's proprietary application software, third-party licensed software and third-party hardware. Mediware generally licenses its blood management and biologics management software systems and certain of its medication management software systems to customers on a perpetual basis. Customers that license the software on a perpetual basis typically make up-front payments for the software license and payments for support services on an annual basis. In contrast, Mediware generally provides its blood and plasma center solutions and certain of its medication management software systems and its more recently acquired alternate care products on a monthly subscription or term license basis. These customers pay Mediware an initial start-up fee and a monthly fee for use and support of Mediware’s proprietary software. Mediware’s performance management software is licensed on both a perpetual and subscription basis. Under both payment models, customers may purchase services, including implementation and additional consultation services, for additional fees which are generally billed as incurred. Beginning in fiscal 2010, the Company initiated its “maintenance plus” program through which customers may pay an annual amount for additional services which historically had been paid on an as incurred basis.
Mediware markets its performance management, blood donor and its blood and biologic management products primarily in the United States. The Company markets its medication management solutions in the United States and in the United Kingdom, with different software systems designed for the specific requirements of each market. The Company has operations in the United Kingdom relating to the systems licensed and sold in that market as well as Ireland and South Africa. All other operations are in the United States.
The Impact of Regulation of Healthcare Information Systems Industry
Mediware believes that its customers’ recent capital investment decisions have been, and future decisions will be, impacted by recently enacted federal laws.
Of specific importance to near term investment is the American Recovery and Reinvestment Act (ARRA), which became effective in 2009. This Act includes more than $38 billion of incentives to help healthcare organizations modernize operations through the acquisition and use of information technology solutions. A part of ARRA designated the Health Information Technology for Economic and Clinical Health Act (HITECH) provides for roughly $2 billion in ‘jump start’ funding that the Department of Health and Human Services is to distribute over a two year time frame beginning in 2011. ARRA also includes approximately $17 billion in Medicare and Medicaid incentives targeting the ‘meaningful use’ of health record systems, systems interoperability, and the submission of data related to quality improvement initiatives.
3
The government spending is intended to reduce inefficiencies and improve patient care through the use of technologies. ARRA, and specifically HITECH, increases the pressure on hospitals and care providing institutions to adopt technology. HITECH provides funding for facilities to launch improvement projects associated with the ‘meaningful use’ of key information technologies. Qualifying hospitals can receive payments over a period of approximately four or five years beginning in 2011 based on their use of certified health information technology systems. HITECH also provides financial penalties to hospitals by reducing Medicare reimbursement payments for hospitals that do not comply with certain usage requirements by 2015.
Market Positioning
Competition in the market for clinical information systems is intense, and increased government spending may entice more companies to enter the marketplace. The principal competitive factors are the functionality of the system, its design and capabilities, site references, the demonstrated need, ability to install, process redesign capabilities, reputation, software platform, the potential for enhancements, price, departmental versus enterprise sales and salesmanship. Another key factor is the strategic position the incumbent, or major healthcare information systems vendor, has in the customer site. Different dynamics and competitors, however, affect each of the Company's products and each sale.
Traditional healthcare environments leverage disparate information systems and manual processes throughout the care process. This results in reduced efficiency as well as increased safety risks due to the potential for human error and delayed access to patient information and records. Errors and risks associated with medications, blood or biologics can often result in tragic consequences, a fact that can raise the awareness and priority of Mediware solutions.
The Company’s product strategy is to address targeted clinical areas with “suites” of applications that provide clinicians one data environment for the information relating to the prescribing, preparation, and administration of drug, blood and/or biologics therapies. Mediware’s products manage each step of the therapeutic process in one system environment, including: ordering, fulfillment, administration, and documentation, to provide care providers a ClosedLoop for blood and medication therapies. The process-centric integrated data environments provided by Mediware’s blood, biologic and medication management solutions seamlessly extend the discipline and controls of the pharmacy and blood bank to patient units and other venues where adverse events occur. The Company believes this ClosedLoop process differentiates it from the industry’s catalog and “best of breed” vendors.
Mediware’s products historically addressed only the needs of the acute care hospital market and the blood center market. By adding medication management solutions through an acquisition in November 2008, Mediware expanded its product offerings for the small and medium hospitals, specialty pharmacy and home infusion markets. Following acquisitions in fiscal 2009, 2010 and 2011, the Company has positioned itself to also address the needs of the home infusion, specialty pharmacy, home/durable medical equipment provider and alternate care markets. Mediware believes that its business will be able to take advantage of these markets by leveraging its clinical and product strengths outside of the acute care setting and across alternate care settings.
To focus on the unique needs of the blood center market segment, on July 8, 2008, Mediware announced the launch of Blood Center Technologies. Mediware’s Blood Center Technologies business unit is a customer focused team intended to drive growth as Mediware expands its focus in the blood and plasma donor markets. Through two acquisitions consummated on December 11, 2009, Mediware greatly increased its presence in the alternate care market and subsequently formed the Alternate Care Solutions (ACS) business unit to capitalize on the growing strength of its product offerings in that category. In April 2011 the Company completed another acquisition, further expanding its presence in the alternate care market.
Mediware licenses, implements and supports clinical and performance management information solutions and other services to healthcare facilities. The Company licenses its blood and biologics management solutions to hospitals. Mediware licenses its blood donor recruitment and management solutions to blood donor and plasma donor centers through its Blood Center Technologies business group, formed during its fiscal year ended June 30, 2009. The Company’s medication management solutions are licensed to hospitals, long-term care, specialty pharmacy, home infusion, home/durable medical equipment, alternate care and behavioral health facilities. The Company’s home infusion, specialty pharmacy, home/durable medical equipment, and alternate care products and services are provided through the ACS business group, formed during fiscal 2010. ACS also provides billing and collection services to the home infusion market. The Company licenses performance management software to hospitals, blood and plasma centers and alternate care facilities.
4
By adding a performance management solution to its product offerings through an acquisition in June 2009, Mediware believes that it further strengthened its clinical suite offerings in its existing markets, as well as acquired tools to broaden its customer base to include the broader healthcare market. This performance management software can aggregate information stored in Mediware’s blood, biologics and medication management products for easy reporting and analysis at the departmental level, thereby further strengthening its product offering in its long-standing markets. Mediware has an inventory of active performance management dashboards for blood management and already has several large customers leveraging its performance management software in conjunction with its blood transfusion and donor software. Used to dynamically monitor key blood management parameters such as transfusion appropriateness and inventory, the Company believes adoption will continue to increase with existing customers and that this new capability will be a desirable competitive advantage for its customers. The software can also draw information from disparate systems across a healthcare enterprise beyond Mediware’s historic blood and medication management customers.
Blood and Biologics Management Products
Hospital Transfusion and Donor Products
The Company supplies information and management software systems to hospital blood banks and transfusion centers. Hospitals face pressures to manage blood inventory and improve the safety of the blood supply. Their focus is on reducing errors, improving screening, increasing throughput and cost efficiencies and addressing ongoing personnel shortages. These pressures exist despite pressures across the healthcare industry to reduce costs. Mediware's blood management software systems are intended to help hospitals and blood centers address these issues by reducing costs through automation, including report production, decreased paperwork, and billing. The Company's products are also designed to improve blood supply safety through the use of user-defined truth tables, among other features.
The Company’s flagship blood transfusion product is the HCLL™ transfusion software. Mediware also provides its hospital customers HCLL™ donor software for use in hospital-based donor centers. The HCLL software (HCLL Transfusion and HCLL Donor) addresses blood donor recruitment, blood processing and transfusion activities for hospitals and medical centers. These systems are designed to be user intuitive, scalable, and support product management, resource management, quality control and testing. They include advanced data mining and data management intelligence capabilities, which can be utilized by facilities of all sizes, including, small hospitals, large medical centers, multi-facility enterprises and central transfusion services. HCLL software also can address the needs of hospitals for operating centralized transfusion services, an area that is key to controlling the rising cost of blood products.
The Company is also looking to new products and markets to continue its growth in blood management. In early fiscal year 2008, the Company announced its BloodSafe® suite of products. The BloodSafe suite includes hardware and software which enable healthcare facilities to securely store, monitor, distribute and track blood products from locations removed from the hospital’s physical blood bank. Components of the BloodSafe suite include blood tracking and monitoring software, computer controlled refrigerators, and handheld point of care tools to verify accurate patient identification and document transfusion activities. BloodSafe can be integrated with Mediware’s HCLL software or operate on a stand-alone basis.
Blood Center Technologies
The Company also provides software tools and services to large, complex blood centers for donor targeting, donor recruitment, donation management, unit testing, blood component manufacturing, inventory control, sales and distribution. This is accomplished through a combination of the Company’s 510(k) cleared LifeTrak® software and a set of robust client relationship and recruiting software products and capabilities. The combination of products and capabilities enable the Company to deliver an integrated software solution for blood centers to improve collections and efficiency throughout the entire process from blood donor recruitment to hospital distribution and transfusion. The combination of the clinical capabilities of the LifeTrak software and the effective CRM technologies that enable blood centers to improve the effectiveness of coordinated blood drive campaigns provide a compelling set of solutions to our customers. Mediware has also added additional e-learning content and certification tracking technologies through an acquisition consummated in March 2010.
5
Biologics Products
Hospitals are beginning to face the same pressures to manage biologic product inventory and improve safety by reducing errors, improving screening and increasing throughput and cost efficiencies as they have faced with blood products for years. In June 2008, Mediware released BiologiCare™, the Company’s first generation bone, tissue and cellular product tracking software. The software leverages the HCLL software platform and Mediware’s blood banking expertise to address the important needs of hospitals as they begin to manage bone, tissue, cord blood stem cells and other biologic products. BiologiCare is designed specifically to track and manage transplantable materials in hospitals, surgery centers and other healthcare facilities. The products enable users to document donors, tissue vendors and tissue recipients and to comply with current regulations regarding transplantable materials. With the introduction of BiologiCare, Mediware believes it is positioned to benefit from the emerging biologics market, which includes, among other things, bone, tissue and cord blood stem cells. BiologiCare can be integrated with Mediware’s HCLL software or operate on a stand-alone basis.
The Company continues to concentrate on growing all aspects of its blood management business: hospital transfusion and donor products, biologics products and blood center technology products. In addition to its sale of software, the Company generates revenue from professional services and post-contract support.
The blood and biologics management products are marketed primarily through the Company’s direct sales force. The blood and biologics management products compete primarily with vendors of Laboratory Information Systems (“LIS”) providing a blood bank subsystem as a part of their laboratory product, as well as other companies that market stand-alone blood bank systems. The LIS vendors are much larger companies with greater technical, marketing, financial and other resources than the Company. We believe these competitors include Cerner, McKesson, and Meditech. Mediware believes that stand-alone laboratory or blood bank vendors include Sunquest, Haemonetics and SCC Soft. On the blood donor side of the business, Mediware competes against several of the companies listed above as well as Blood Bank Computer Services Company, MAK and others.
Medication Management Products
The Company supplies medication management solutions to hospitals, mental health facilities, specialty pharmacies, home infusion facilities and other institutions that require the administration and management of medication. The Company’s medication management solutions are designed to help customers improve patient safety while reducing costs and improving clinical documentation. Additionally, the solutions help medical facilities comply with increasing regulatory and governmental requirements.
Hospital Pharmacy and Medication Management Products
The Company’s medication management software product for larger and medium sized hospitals and healthcare institutions is WORx®, a core pharmacy information system designed to manage inpatient and outpatient pharmacy operations. WORx software has features and functions designed to help improve patient safety and manage pharmacy operations effectively. The product's market acceptance encompasses multi-facility healthcare systems, university hospitals and large state behavioral health institutions. In November 2008 Mediware began offering Ascend, a pharmacy solution that meets the needs of small and medium size hospital facilities. The Company currently offers the WORx product line to larger acute care hospitals and state behavioral health facilities, while offering the Ascend product line to the small and medium size hospital markets. WORx, has been certified so that our customers receive the full benefit of the HITECH Act, and Mediware expects that Ascend will be similarly certified in the first quarter of fiscal 2012.
The Company’s MediCOE™ and MediMAR® products are fully integrated with the WORx software and provide a complete ClosedLoop drug therapy management system with a physician order entry module (MediCOE) and nurse point of care administration and bedside documentation module (MediMAR). Through MediCOE software, potential problems can be identified by the clinician at order entry and can be corrected or explained at the point of care. The MediMAR software uses bar code, wireless, handheld, and other technologies to allow caregivers efficient and accurate methods to document patient medication administration and provide nurses additional safety measures at the point of care.
The Company’s MediREC™ product assists in achieving compliance with a Joint Commission mandate, which requires hospitals to document all of a patient’s home medications when a patient is admitted or enters the emergency room, and to reconcile that list with the medications prescribed in the hospital. That process must be repeated each time the patient is transferred within the hospital and again when the patient is discharged.
6
MediMAR, MediCOE and MediREC software products can provide fully integrated medication management solutions and are particularly well suited for large academic medical centers and behavioral health settings that benefit from the robust nature of the software’s functionality.
Selling the Company’s full suite of medication management products (WORx, MediMAR, MediCOE and MediREC) is a complex process involving multiple hospital departments. On the other hand, Ascend requires substantially smaller financial commitments from customers and is priced based on a monthly pricing model. Generally, Ascend, is sold to smaller and medium sized hospitals.
The medication management products are marketed directly through the Company’s sales force and other marketing channels, including reseller agreements with distribution partners and focused sales channels. The Company’s medication management products compete against the products of niche competitors’ and some of the largest providers of healthcare information technology, including Cerner, General Electric, Siemens, NetSmart, Meta, AllScripts and others.
Alternate Care
Mediware’s ACS product offerings currently include: home infusion software, specialty pharmacy software, home medical equipment software, and home healthcare software, as well as billing and collections services that are focused on the alternate care market and home/durable medical equipment.. These offerings are largely the combination of a home infusion offering that Mediware acquired in 2008 and the home infusion, specialty pharmacy and alternate care products and services acquired in December 2009 and April 2011.
The Company’s ACS products compete in a niche market against a myriad of smaller software vendors and niche providers, including FastTrack, Brightree and Definitive Healthcare Solutions, Inc. These companies often have loyal customers, but generally have fewer resources and, the Company believes, less robust products than Mediware. Consequently, Mediware believes it is well-positioned to be very competitive in the alternate care markets. Mediware currently markets products to the alternate care market through its direct sales force.
United Kingdom
The Company's United Kingdom operating business is JAC Computer Services, Ltd. (JAC). JAC markets and provides support for its pharmacy management and electronic prescribing systems throughout the U.K., Ireland and South Africa. JAC’s product offering includes JAC’s Pharmacy Management system and Electronic Prescribing™ module. The prescribing module is a medication management solution complete with physician medication order entry and nursing medication administration. This module allows hospitals to improve patient safety relevant to medication management. The JAC’s Pharmacy Management system product handles medication tracking from ordering and delivery to dispensing.
JAC competes against some of the larger healthcare IT providers in the U.K. as well as smaller niche vendors. Among JAC’s competitors are Ascribe, Cerner, iSoft and CIS Healthcare Ltd. These companies often have loyal customers, but generally are not as well positioned in the marketplace as JAC. Consequently, Mediware believes JAC will continue to perform well. JAC currently markets products primarily through its direct sales force.
Performance Management Products
Through a business acquisition in June 2009, Mediware added the InSight™ software system to its portfolio of products. The software tracks performance metrics to assist healthcare managers to actively manage performance and improve the overall efficiency of their organizations. The InSight system collects data from the disparate information systems across a hospital to create understandable graphical dashboards. The InSight system complements Mediware’s medication and blood and biologics product offerings and Mediware believes that InSight may help differentiate our products from other blood management and medication management systems. The Company is marketing InSight to current customers to help them manage their medication and blood requirements. The InSight system can also be marketed and sold on an enterprise-wide, stand-alone basis.
7
When sold in conjunction with Mediware’s other products, the Company’s InSight products compete against all of the same competitors as our medication management and blood and biologics products. On enterprise sales, the Company expects to compete against products of other small niche vendors, as well as some of the largest providers of healthcare information technology, including Cerner, McKesson, General Electric, Siemens, Allscripts and others who we expect will begin to provide performance management solutions. The Company sells its performance management products through a direct sales force.
Research and Development
Expenditures for software development include amounts paid for both capitalizable and non-capitalizable development projects. Expenditures for software development for fiscal 2011, 2010 and 2009 were $9,621,000, $8,736,000 and $7,771,000, respectively. Of the total expenditures during fiscal 2011, 2010 and 2009, $5,143,000, $3,820,000 and $3,829,000, respectively, were capitalized. The Company plans to continue to commit substantial resources to the development of its products.
Employees
As of June 30, 2011, the Company had 292 full-time employees of which 265 were employed domestically. None of the Company's employees are covered by collective bargaining agreements. The Company believes that its employee relations are good.
The Company also relies on the services of a number of consultants to supplement its employee base. The number of consultants varies from time to time based on the Company's needs and the various stages of its development projects. At June 30, 2011, there were 16 consultants working on various projects.
Seasonality
The Company's operations are generally not subject to seasonal fluctuations.
Segment and Geographic Information
Mediware operates one reporting segment, as further described in Note 12 Segment Information in the Notes to our Consolidated Financial Statements.
|
Geographic Information
|
||||||||||||
|
(Amounts in thousands)
|
||||||||||||
|
2011
|
2010
|
2009
|
||||||||||
|
Revenue
|
||||||||||||
|
United States
|
$ | 48,774 | $ | 41,269 | $ | 34,815 | ||||||
|
United Kingdom
|
6,749 | 6,347 | 5,870 | |||||||||
|
Total
|
$ | 55,523 | $ | 47,616 | $ | 40,685 | ||||||
|
2011
|
2010
|
2009
|
||||||||||
|
Long-lived assets
|
||||||||||||
|
United States
|
$ | 33,654 | $ | 31,833 | $ | 28,024 | ||||||
|
United Kingdom
|
676 | 569 | 538 | |||||||||
|
Total
|
$ | 34,330 | $ | 32,402 | $ | 28,562 | ||||||
The Company believes that the principal risks distinguishing its foreign operations are described in Item 1A. Risk Factors and Item 7A. Quantitative and Qualitative Disclosures about Market Risk.
8
Backlog
At June 30, 2011, the Company had a backlog of $29,474,000, of which $7,365,000 related to contracted software and hardware sales and $22,109,000 related to implementation, training and deferred support and maintenance services. Software sales and services backlog consist of products and services sold under signed contracts, which have not yet been recognized as revenue. At June 30, 2010, the Company had a backlog of $23,754,000, of which $1,817,000 related to contracted software and hardware sales and $21,937,000 related to implementation, training and deferred support and maintenance services. Depending upon the individual contract, the customer may have the ability to cancel the purchase of software and services prior to delivery.
Intellectual Property
Mediware markets its software under names for which it has trademark protection. The Company relies upon a combination of trade secret, copyright laws, license and marketing agreements, and nondisclosure agreements to protect its proprietary information, including the Company’s software. The Company does not currently own any material patents or have any licenses that are material to the products or services that it offers.
Impact of Government Regulation and Private Oversight
The healthcare industry is highly regulated. The industry is subject to state and federal laws and regulations and to oversight by regulatory entities. It is also subject to oversight by peer entities. While some of Mediware’s products are subject to government regulation and private oversight, the effect on Mediware’s customers is even more pronounced. Knowledge of applicable regulation and oversight is therefore critical to Mediware’s business not only because of the compliance required for certain of Mediware’s products but also because it creates opportunities for Mediware to sell products and services to customers to facilitate their compliance.
FDA Regulation of Blood Products
The U.S. Food and Drug Administration (FDA) regulates blood center computer software products as medical devices. The FDA considers software products intended for the following to be medical devices: (i) use in the manufacture of blood and blood components; or (ii) maintenance of data used to evaluate the suitability of donors and the release of blood or blood components for transfusion or further manufacturing. The FDA requires blood tracking application software vendors to submit a 510(k) application for review upon product creation, modification affecting safety and soundness and certain other modifications that are not well defined. Several of Mediware’s blood management products have obtained 510(k) clearance. As a medical device manufacturer, Mediware is required to register with the Center for Biologics Evaluation and Research (CBER), list its medical devices, and submit a pre-market notification or application for pre-market review. In addition, Mediware is required to follow applicable Quality System Regulations of the FDA, which include testing, control and documentation requirements.
The FDA enforces compliance by using recalls, seizures, injunctions, civil fines and criminal prosecutions. Unsatisfactory compliance and the inability to timely remedy any non-compliance could therefore have material adverse consequences. If the FDA expands its scope of regulation to other products, it would be costly to implement the FDA Quality Systems Regulation procedures. Furthermore, any new blood management products or modifications of existing products may not be approved by the FDA, which would diminish the value of the research and development for those products. Mediware dedicates substantial time and resources to comply with guidelines and regulations applicable to its blood management products.
The HITECH Act
The HITECH Act provides financial incentives for hospitals and doctors that are "meaningful users" of electronic health records, which includes use of health information technology systems that are "certified" according to technical standards developed under the supervision of the Secretary of Health and Human Services. Hospitals that use certified health information technology systems may receive significant aggregate payments over a period of approximately four or five years beginning in 2011. These payments may be significant and will provide a strong incentive to many hospitals and doctors to implement certified health information technology systems. The HITECH Act also provides for financial penalties in the form of reduced Medicare reimbursement payments for hospitals and doctors that have not become "meaningful users" of these systems by 2015. Mediware’s hospital pharmacy product, WORx, has been certified so that our customers receive the full benefit of the HITECH Act, and Mediware expects that Ascend will be similarly certified in the first quarter of fiscal 2012. However, HITECH provides for a phased approach to implementation of the “meaningful use” standards, and the Department of Health and Human Services is empowered to revise the standards in the future, which could affect the certification status of our products in later periods. Failure to obtain or maintain certification could adversely affect our ability to sell our pharmacy products in the future and could negatively impact our ability to maintain our current customers that rely on our compliance with such requirements.
9
CCHIT
The U.S. Department of Health & Human Services initiatives have, among other things, led to the creation of the private-sector Certification Commission for Health Information Technology (CCHIT), which is a recognized certification body in the United States for health information technology products. CCHIT is recognized by the Office of the National Coordinator for Health Information Technology (ONC), U.S. Department of Health and Human Services (HHS) as an Authorized Testing and Certification Body (ONC-ATCB). CCHIT inspects products using the Test Procedures and Tools published by the National Institute of Standards and Technology (NIST) of the U.S. Department of Commerce, which include criteria for electronic health record functionality, interoperability, reliability and security. CCHIT provides certifications to those entities whose products have satisfied the criteria and have been used to assess health information technology systems for certification under the HITECH Act. Failing to be aware of the CCHIT certification requirements and complying as appropriate, could have an adverse impact on the Company.
HIPAA
The U.S. Health Insurance Portability and Accountability Act of 1996 (HIPAA) seeks to impose national health data standards on covered entities. The HIPAA standards prescribe, among other things, transaction formats and code sets for electronic health transactions in order to protect individual privacy by limiting the uses and disclosure of individually identifiable health information. HIPAA also requires the implementation of administrative, physical and technological safeguards to ensure the confidentiality, integrity, availability and security of individually identifiable health information in electronic form. Beginning on February 17, 2010, the HITECH provisions of the ARRA broadened the scope of HIPAA by expanding the class of persons that are subject to HIPAA requirements to include service and product providers such as Mediware, providing breach notification requirements, restricting the instances in which personal health data may be disclosed and augmenting the enforcement provisions. In addition, many states have passed or are evaluating local versions of HIPAA. Evolving HIPAA-related laws or regulations could restrict the ability of customers to obtain, use or disseminate patient information. Mediware believes that a violation of the HIPAA requirements could have a material adverse impact on its business. Accordingly, Mediware expends substantial time and resources to address HIPAA compliance.
E-prescription
The use of Mediware’s solutions by physicians for electronic prescribing, electronic routing of prescriptions to pharmacies and dispensing is governed by state and federal law. States have differing prescription format requirements, which we have programmed into our software. In addition, the Department of Health and Human Services/CMS has adopted standards for the transmission of electronic prescriptions. These standards are complex and cover transactions between prescribers and dispensers for prescriptions and electronic eligibility and benefits inquiries and drug formulary and benefit coverage information. Mediware’s efforts to provide software that assists customers to comply with these regulations is costly. If Mediware fails to maintain the compliance of its software solutions, there could be a material impact on its business.
Medicare/Medicaid
Some of Mediware’s medication management products and services assist customers with the submission of claims to payers. The claims are governed by federal and state laws, including regulations relating to Medicare and Medicaid. Mediware’s solutions are capable of electronically transmitting claims for services and items rendered to certain payers for approval and reimbursement. Federal law provides civil liability to any person that knowingly submits a claim to a payer, including, for example, Medicare, Medicaid and private health plans, seeking payment for any services or items that have not been provided to the patient. Federal law may also impose criminal penalties for the submission of false claims intentionally. Federal and state governments and regulatory authorities continue to increase scrutiny over practices involving healthcare fraud affecting healthcare providers whose services are reimbursed. Mediware’s customers are further subject to laws and regulations on fraud and abuse which restrict remuneration and referrals.
10
While Mediware believes that it is in compliance with applicable laws, many of the regulations applicable to our customers and those potentially applicable, are not clear or well-defined and have not been interpreted by the courts. They may be interpreted or applied by a prosecutorial, regulatory or judicial authority in a manner that could broaden their applicability to vendors or require customers to change their business or how they work with Mediware. If such laws and regulations are determined to be applicable to Mediware and if Mediware fails to comply with any applicable laws and regulations, Mediware could be subject to sanctions or liability, including exclusion from government health programs, which could have a material adverse effect on Mediware’s business, results of operations and financial condition.
Internet Privacy
Some of our Blood Center Technologies products rely upon electronic mail and are therefore subject to laws and regulations relating to user privacy and information security. In addition, many states have passed laws requiring notification to users when there is a security breach for personal data. Any failure of Mediware’s products to comply with these laws may subject Mediware to significant liabilities or proceedings by governmental authorities. In addition, the interpretation of user privacy and information security laws is unclear and in a state of flux. Mediware expects to expend additional time and capital in an effort to address these evolving data security and privacy issues. Further, any failure to protect privacy and data could result in a loss of customer or user confidence.
The Joint Commission
The Joint Commission (formerly known as the Joint Commission on Accreditation of Healthcare Organizations), is an independent non-profit organization that provides evaluation and accreditation for healthcare organizations in the United States. The Joint Commission develops standards and protocols that are used to evaluate hospitals. A hospital’s failure to meet Joint Commission standards could result in the loss of Medicare and Medicaid reimbursement revenue. Satisfaction of the Joint Commission standard is a key to success for Mediware’s medication management products.
ISBT
The American Association of Blood Banks (AABB) has adopted a global standard for the labeling of blood products collected and used throughout the United States, called ISBT (International Society of Blood Transfusion) 128, to improve the identification and processing of human blood, tissue and organ products across international borders and disparate health care systems. AABB accredited blood centers and hospital transfusion services are required to implement this standard. Mediware’s LifeTrak and BiologiCare products support ISBT 128. Failure to support further AABB Standards could adversely affect Mediware’s blood and biologics management products and services.
Item 1A. Risk Factors.
This Annual Report on Form 10-K contains forward-looking statements.
This Annual Report on Form 10-K contains forward-looking statements. Statements contained herein that are not statements of historical fact may be deemed to be forward-looking statements within the meaning of Section 21E of the Securities Exchange Act. The words “believes,” “anticipates,” “plans,” “seeks,” “expects,” “intends” and similar expressions identify some of our forward-looking statements. Forward-looking statements are not guarantees of performance or future results and involve risks, uncertainties and assumptions. Factors discussed elsewhere in this Form 10-K could also cause actual results to differ materially. Set forth below are some of the risks and uncertainties that, if they were to occur, could materially adversely affect our business or that could cause our actual results to differ materially from the results contemplated by the forward-looking statements contained in this report and other public statements we make. We undertake no obligation to publicly update or revise any forward-looking statements.
Our future growth depends in large part on customer acceptance of our new products.
Our newly acquired performance management software is InSight; our latest medication management products are HomecareNet, Caretinuum®, Ascend, MediMAR, MediCOE and MediREC, and our newest blood and biologics management products are BiologiCare, BloodSafe and blood and plasma donor center products. We are now targeting our existing software customer base and other potential customers for the sale of these products. There is no assurance that the marketplace will accept our strategy or these products. In addition, the sales for the full suite of medication management products and broader enterprise-wide sales of InSight require broad acceptance throughout the hospital and reflect changes in workflows that create longer sales cycles. In the event that our new products are not accepted in the marketplace, our system sales would suffer, our service revenues for these products would be diminished and our investment in developing, as well as marketing, these products could be impaired.
11
Our strategy includes licensing ClosedLoop products to customers, which requires customer acceptance of our products and strategy.
While we believe that each of our products is positioned to succeed in the market place, there is no assurance that customers will accept our ClosedLoop strategy or accept our products to the extent that we expect. If our customers instead select a single-vendor, enterprise-wide system that automates all functions of the hospital, rather than the specific processes targeted by our products, our sales will decrease.
Our business may be adversely affected by changing technology that may render our products obsolete.
Changing technology will make it necessary for some of our software products to migrate to new software platforms and deployment methodologies in the coming years, which could require significant resources, impact future plans for such products, and adversely affect our ability to sell and develop new and competitive software products. For example, Mediware began offering its full suite of products on a remotely hosted basis in 2011 as software products of other industry participants became available in this manner. In addition, new technology and methodologies not currently in the mainstream could quickly enter the market and disrupt our existing business and customers’ need for our products. We will try to maintain state-of-the-art products, but new technologies in the marketplace could make our technology obsolete and our products unusable or hinder future sales.
We may experience interruption at our data centers or client support facilities.
We offer our customers hosting services for our software offerings. Our hosting services may include the storage of critical patient and administrative data. In addition, we provide support services to our clients through various client support facilities. Failure of generators, impairment of telecommunications lines, or any damage to the buildings, the equipment inside the buildings housing our hosting centers, the client data contained therein or the personnel trained to operate such facilities could disrupt our operations and negatively impact customers who depend on us for data center and system support services. Any interruption in operations at our data centers or client support facilities could damage our reputation, impact our expansion plans, cause us to lose existing clients, hurt our ability to obtain new clients, result in revenue loss, create potential liabilities for our clients and us and increase insurance and other operating costs.
We may not be able to manage or successfully integrate acquired businesses and technologies.
We have recently consummated a strategic acquisition and may pursue additional strategic acquisitions, investments and relationships in the future, and we may not be able to successfully manage our operations if we fail to successfully integrate acquired businesses and technologies, which could adversely affect our operating results.
As part of our business strategy, we may seek and complete strategic business acquisitions that are complementary to our business. On April 11, 2011, we acquired certain assets of CareCentric’s home/durable medical equipment, home health, home infusion and billing and collections business. During the three years ended June 30, 2011, we consummated five other strategic acquisitions. Acquisitions, such as the CareCentric businesses, have inherent risks which may have a material adverse effect on our business, financial condition, operating results or prospects, including, but not limited to, the following:
|
|
•
|
failure to successfully integrate the business and financial operations, services, intellectual property, solutions or personnel of the acquired business
|
|
|
•
|
diversion of management’s attention from other business concerns
|
|
|
•
|
failure to achieve projected synergies and performance targets
|
|
|
•
|
loss of customers or key personnel of the acquired business
|
12
|
|
•
|
possibility that the due diligence process in any such acquisition may not completely identify material issues associated with product quality, product architecture, product development, intellectual property issues, key personnel issues or legal and financial contingencies, and
|
|
|
•
|
a possible write-off of intellectual property and acquired intangible assets.
|
If we fail to successfully integrate the CareCentric businesses or other acquired businesses or fail to implement our business strategies with respect to these acquisitions, we may not be able to achieve projected results or support the amount of consideration paid for such acquired businesses.
Our United Kingdom business is subject to risks that are different from our other businesses.
Approximately 12% of consolidated revenues for the year ended June 30, 2011 are the result of business conducted in the United Kingdom. These foreign operations encounter risks and uncertainties specific to the United Kingdom such as:
|
|
•
|
government spending, including uncertainties relating to the impact of recent changes to and possible cancellation of the Connecting for Health Program
|
|
|
•
|
regulation of our products, customers and employees
|
|
|
•
|
uncertain contract terms, conditions and risks
|
|
|
•
|
trade protection regulation
|
|
|
•
|
taxation
|
|
|
•
|
economic conditions
|
|
|
•
|
customer demands and payment practices and
|
|
|
•
|
changing competitors.
|
Additionally, foreign operations expose us to foreign currency fluctuations that could impact our results of operations and financial condition based on the movements of the applicable foreign currency exchange rates in relation to the U.S. dollar. Mediware has not entered into any derivative financial instrument to manage foreign currency risk and is currently not evaluating the future use of any such financial instruments.
Our proprietary information could be misappropriated, and we may be subjected to costly third party intellectual property claims.
We rely upon a combination of trade secret, copyright and trademark laws, license and marketing agreements, and nondisclosure agreements to protect our proprietary information, including our software. We have not historically filed patent applications covering our software. As a result, we may not be able to protect against the misappropriation of our intellectual property. Furthermore, we could be subject to claims by third parties, including competitors (who hold patents) and creators of open-source code, that we are misappropriating or infringing patents, confidential information or other intellectual property or proprietary rights of others. These claims, even if not meritorious, could require us to:
|
|
•
|
spend significant sums in litigation
|
|
|
•
|
pay damages
|
13
|
|
•
|
develop non-infringing intellectual property and
|
|
|
•
|
acquire costly licenses to the intellectual property that is the subject of asserted infringement.
|
We may be unable to develop non-infringing products or services or obtain a license on commercially reasonable terms, or at all. We may also be required to indemnify our customers if they become subject to third-party claims relating to intellectual property that we license or otherwise provide to them, which could be costly.
Termination of or modifications to third party products and technology incorporated into our product offerings could adversely affect our products or decrease our profitability.
We license or purchase intellectual property and technology such as software, hardware and content from third parties, including some competitors, and incorporate software, hardware, and/or content into or sell it in conjunction with our solutions, devices and services. Some third party material (provided by IBM, Intersystems, FirstDataBank, Haemonetics and others) is critical to the operation and delivery of several of our products. Most of our agreements will expire within one to five years. If upon the expiration of our current agreements, any of the third party suppliers were to change product offerings, terminate support, significantly increase prices or terminate our licenses or supply contracts, we might need to seek alternative suppliers and incur additional internal or external development costs to ensure continued performance of our solutions, devices and services. Such alternatives may not be available on attractive terms, or may not be as widely accepted or as effective as the intellectual property or technology provided by our existing suppliers. Furthermore, adaptation would take time and initial adaptations may be imperfect and/or products may be inoperable or perform poorly as a result. If the cost of licensing, purchasing or maintaining the third party intellectual property or technology significantly increases for any reason (including disputes about licensing terms or the cost of providing the products to our customers), our gross margin levels could significantly decrease. In addition, interruption in functionality of our solutions, devices and services as a result of changes in third party suppliers could adversely affect future sales or result in contract claims that could require Mediware to pay damages.
If we are unable to enhance our relationships with our third party resellers, our ability to market products may be adversely affected.
We currently have important relationships with third party resellers of our products. If we are not able to continue or enhance our current relationships or develop new relationships, our future revenues could decrease.
Hospital networks reduce our sales opportunities and may reduce profitability.
Many hospitals are consolidating and forming (or becoming part of) integrated healthcare delivery networks. The formation of these networks might reduce the number of discrete prospects we may target on a closed-loop basis and could provide more negotiating leverage to our prospective customers. These events could reduce our sales prices, increase the length of our sales cycle and otherwise could negatively affect our revenue and income.
Significant competition may reduce our profit margin.
The market for healthcare information systems is extremely competitive. Our competitors include Siemens AG, McKesson Corporation, Allscripts, Inc., Misys PLC, Haemonetics, SCC Soft Computer, Cerner Corporation and GE Healthcare, each of which offers products that compete with certain of our offerings. Many of our competitors have greater financial, technical, product development, sales and marketing resources. A number of factors determine success or failure in our markets, including:
|
|
•
|
functionality of software products
|
|
|
•
|
quality of client references and the availability of client reference sites
|
|
|
•
|
underlying technical architecture
|
|
|
•
|
financial stability of the software provider
|
14
|
|
•
|
ongoing support of the system and
|
|
|
•
|
the quality and quantity of the sales organization.
|
Our ability to maintain a positive stance in all of the above areas will affect our ability to compete successfully and maintain our profit margin.
We have entered into significant “fixed fee” software development and implementation agreements which rely on estimates.
We have entered into a number of significant “fixed fee” software development and implementation arrangements. Under the terms of these arrangements, we have committed to provide software or services to customers for a “fixed fee,” even if the actual effort required to complete the project is substantially more than anticipated. We use estimates to determine the hours of work and fees to charge to complete these projects. If our estimates are not accurate and our actual costs are more than estimated costs, our operating results would be adversely affected. In addition, in certain arrangements, it may be appropriate for us to recognize revenue using the percentage of completion method of accounting under Generally Accepted Accounting Principles. Using this method, we could determine that contract revenue previously recognized in one or more periods was overstated due to changes in our estimated total costs, work progress evaluations or other factors. If this occurs, revenue recognized in the period in which we make the determination may be reduced by the aggregate amount of the overstatement. Alternatively, depending on the magnitude of the overstatement, we may be required to restate prior period revenues. Consequently, our failure to estimate accurately could cause our revenue and results of operations to fluctuate substantially from period to period.
Government contracting entails unique risks and frequently requires acceptance of less favorable terms.
Mediware is continuing its efforts to license its software to the United States military, behavioral health and other state and federal institutions. Federal and state budget deficits and governmental efforts to decrease spending may reduce governments’ demand for our products and delays in government contract awards. Further, if a federal or state government is subject to a liquidity crisis, it could affect the government’s ability to make payments towards purchased products and services. In addition, contracting with state and other government agencies frequently requires Mediware to accept less favorable contract terms and conditions than may usually be obtained when contracting with private entities, including warranties, indemnities, fixed payment amounts, performance obligations, cancellation rights, contracts with very limited limitation of liability provisions, and requests for equitable adjustment.
Our sales pipeline may not reflect sales that are actually achieved.
We use a “pipeline” system, a common industry practice, to forecast sales and trends in our business. Our management monitors the status of all sales opportunities, such as the date when they estimate that a client will make a purchase decision and the potential dollar amount of the sale. These estimates are aggregated periodically to generate a sales pipeline. We compare this pipeline at various points in time to evaluate trends in our business. This analysis provides guidance in business planning and forecasting, but these pipeline estimates are by their nature speculative. Our pipeline estimates are not necessarily reliable predictors of revenues in a particular quarter or over a longer period of time, partially because of changes in the pipeline and in conversion rates of the pipeline into contracts that can be very difficult to estimate. A negative variation in the expected conversion rate or timing of the pipeline into contracts, or in the pipeline itself, could cause our plan or forecast to be inaccurate and thereby adversely affect business results. For example, a slowdown in information technology spending, adverse economic conditions or a variety of other factors can cause purchasing decisions to be delayed, reduced in amount or cancelled, which would reduce the overall pipeline conversion rate in a particular period of time. Because a substantial portion of our contracts are completed in the latter part of a quarter, we may not be able to adjust our cost structure quickly enough in response to a revenue shortfall resulting from a decrease in our pipeline conversion rate in any given fiscal quarter.
Our ability to generate revenue could suffer if we do not continue to update and improve our existing products and services and develop new ones.
The pace of change in the markets we serve is rapid, and there are frequent new product and service introductions by our competitors and by vendors whose products and services we use in providing our own products and services. If we do not respond successfully to evolving industry standards, our products and services may become obsolete. We must introduce new healthcare information services and technology solutions and improve the functionality of our existing products and services in a timely manner in order to retain existing customers and attract new ones. However, we may not be successful in responding to technological developments and changing customer needs. Technological changes may also result in the offering of competitive products and services at lower prices than we are charging for our products and services, which could result in lost sales and lower margins.
15
Research and development is costly and may not produce successful new products.
Our strategy relies on continuing innovation. We currently intend to continue investing in research and development of new products. However, our investment may not produce marketable product enhancements and new products. Our business, results of operations and financial conditions could be adversely affected if a product or group of products is not accepted in the marketplace. In addition, the cost of developing new healthcare information services and technology solutions is inherently difficult to estimate. Our development and implementation of proposed products and services may take longer than originally expected, require more testing than originally anticipated and require the acquisition of additional personnel and other resources. If we are unable to develop new or updated products and services on a timely basis and implement them without significant disruptions to the existing systems and processes of our customers, we may lose potential sales and harm our relationships with current or potential customers.
Impairment of our goodwill, capitalized software costs or intangible assets would result in impairment charges.
We test our goodwill, capitalized software costs and identifiable intangible assets for impairment at least annually and more often if events and circumstances warrant. The Company evaluates goodwill and intangible assets for impairment by comparing the estimated fair value of the asset to its carrying value, and evaluates capitalized software costs for impairment by comparing the net realizable value of the software product to the carrying value of the capitalized costs. If the carrying value of the asset exceeds its estimated fair value or net realizable value, impairment is deemed to have occurred and the carrying value is written down to fair value or net realizable value. For analyzing goodwill and intangible assets, we use the income approach to estimate fair value, under which an asset’s estimated fair value is determined using a discounted cash flow method, as well as other generally accepted methodologies. Net realizable value for capitalized software costs for each product is determined by subtracting the estimated costs of completing and disposing of the product from the estimated future revenue of the product. Decline in business performance, the failure of a product in the marketplace, the introduction of new technology, adverse outcomes to disputes or legal actions, changes in our projections and underlying assumptions or other factors could cause the fair value of goodwill or an intangible asset or the net realizable value of capitalized software to be revised downward and could result in a non-cash impairment charge which could have a material adverse effect on Mediware’s results of operations and financial condition.
Our success depends upon the recruitment and retention of key personnel and consultants.
To remain competitive in our industries, we must attract, motivate and retain highly skilled managerial, sales, marketing, consulting and technical personnel, including executives, consultants, programmers and systems architects. Competition for such personnel in our industries is intense in both the United States and abroad. Our failure to attract additional qualified personnel to meet our personnel needs could have a material adverse effect on our prospects for long-term growth. Our success is dependent to a significant degree on the continued contributions of key management, sales, marketing, consulting and technical personnel. The unexpected loss of key personnel could have a material adverse impact on our business and results of operations, and could potentially inhibit development and delivery of our solutions, devices and services and market share advances.
New and changing government regulation creates compliance challenges and may increase our costs.
The healthcare industry is highly regulated and is subject to changing political, legislative, regulatory and other influences.
Certain of our products are currently subject to regulation, including those relating to blood management products, electronic prescriptions and electronic communication. Many healthcare laws, including those related to reimbursement by Medicare, Medicaid and other government programs, are complex and their application to specific products and services may not be clear. In particular, many existing healthcare laws and regulations, when enacted, did not anticipate the healthcare information services and technology solutions that we provide. However, these laws and regulations may nonetheless be applied to our products and services in a manner that we may not anticipate. Furthermore, the laws are constantly evolving and we cannot predict the effects of future legislative and regualtory actions.
Certain of our blood management products are subject to FDA review upon their creation, modification affecting safety and soundness and other modifications that are not well defined and are subject to the FDA’s on-going Quality Systems Regulation procedures. In addition, our facilities and Quality System Regulation procedures are subject to FDA inspection from time to time. In August 2011, after an inspection at our Oak Brook, Illinois facility, we received a Form 483 (Notice of Inspectional Observations) listing observations of non-compliance with certain aspects of the FDA's Quality System Regulation. We have responded to the FDA and believe we fully addressed each of the observations raised in the Form 483. There can be no assurance, however, that our actions and responses will be deemed adequate by the FDA or that additional actions will not be required by us.
16
Under HITECH, qualifying hospitals can receive payments over a period of approximately four or five years beginning in 2011, based on their use of certified health information technology systems. Although one of our pharmacy products has received certification under the first stage of HITECH certification standards, and we expect another pharmacy product to receive certification in the first quarter of fiscal 2012, there are two additional HITECH stages for which the standards have not yet been determined. Mediware will need to be able to conform to the new standards as they are developed.
Beginning on February 17, 2010, HITECH broadened the scope of HIPAA by expanding the class of persons that are subject to HIPAA requirements to include service and product providers such as Mediware, providing breach notification requirements, restricting the instances in which personal health data may be disclosed and augmenting the enforcement provisions. In addition, our solutions for physicians concerning electronic prescribing, electronic routing of prescriptions to pharmacies and dispensing are governed by various state and federal “E Prescribing” laws, and our claims submission solutions are subject to different federal laws.
The regulatory regimes to which we are subject, and the evolving nature of the applicable laws, has several important implications for us. First, we have invested resources in conforming our products to the applicable standards and further significant investment will be required as certification standards evolve. Second, new customers often require that our software will be certified according to applicable standards. Our failure to comply could result in costly contract breach and jeopardize our relationships with customers. Third, if for some reason we are not able to comply with applicable standards in a timely fashion after their issuance, our products will be at a severe competitive disadvantage in the market. Finally, if any of our customers fails to satisfy applicable standards, we could become involved in government investigations or legal actions.
Our business is subject to the risk of product-related liabilities.
Our products provide data for use by healthcare providers in patient care settings. Our license agreements generally contain provisions intended to limit our exposure to product-related claims. These provisions, however, may not be enforceable in some jurisdictions or may not adequately limit our exposure. We maintain product liability insurance in an amount that we believe to be adequate for our intended purpose. However, insurance may not cover a claim brought against us. A successful claim brought against us could have a material adverse effect upon our business, results of operations or financial condition.
System errors may delay product acceptance and adversely affect our operations and profitability.
Despite testing, software products as complex as those we offer and use in a wide range of clinical and health information systems settings contain a number of errors or “bugs,” especially early in their product life cycle. Our products are clinical information systems used in patient care settings where a low tolerance for bugs exists. Testing of products is difficult due to the wide range of environments in which the systems are installed. Due to these factors, the discovery of defects or errors could cause:
|
|
•
|
delays in product delivery
|
|
|
•
|
poor client references
|
|
|
•
|
payment disputes
|
|
|
•
|
contract cancellations and/or
|
|
|
•
|
additional expenses and payments to rectify problems.
|
Any of these factors could delay our product sales or have a material adverse effect upon our business, results of operations or financial condition.
Our client agreements typically provide warranties concerning material errors and other matters. Failure of our software to meet these warranties could constitute a material breach under our customer agreements, allowing in many cases the customer to terminate the agreement and possibly obtain a refund and/or damages, or might require us to incur additional expense in order to make the software solution or healthcare device meet these criteria. Our client agreements generally limit our liability arising from such claims but such limits may not be enforceable in certain jurisdictions or circumstances. A successful material claim brought against us, if uninsured or under-insured could materially harm our business, results of operations and financial condition.
Our operating results can fluctuate due to irregular system sales.
Our revenue and results of operations can fluctuate substantially from quarter to quarter. System sales in any fiscal year depend substantially upon our sales performance and customers’ budgeting and buying practices. System sales may fluctuate due to:
17
|
|
•
|
contract activity
|
|
|
•
|
demand for our products and services
|
|
|
•
|
lengthy and complex sales cycles
|
|
|
•
|
customers’ internal budgets for new technology systems, customers’ technical resources to deploy technology and
|
|
|
•
|
customers’ personnel availability.
|
Additionally, our ability to recognize anticipated revenue may be materially affected by the terms of a final contract. Factors that impact contract terms and revenue include the following:
|
|
•
|
systems contracts may include both currently deliverable and non-deliverable software products
|
|
|
•
|
customer needs for services that include significant modifications, customization or complex interfaces that could delay product delivery or acceptance
|
|
|
•
|
customer-specific acceptance criteria and
|
|
|
•
|
payment terms that are long-term or depend upon contingencies.
|
The sales for the medication management ClosedLoop® products involve more hospital departments and longer implementation cycles. This exacerbates many of the foregoing risks.
Our stock price may be volatile due largely as a result of relatively low trading volume.
The trading price of Mediware’s common stock may fluctuate significantly from time to time. Generally, Mediware’s common stock has relatively low trading volume which can cause transactions in a relatively small number of shares to significantly impact the price of the stock.
We have two shareholders who can substantially influence the outcome of all matters voted upon by our shareholders and prevent actions which a shareholder may otherwise view favorably.
Two of our shareholders, Lawrence E. Auriana and Constellation Software Inc. ("Constellation"), reported owning or controlling, together with their affiliates, approximately 30.4% on July 1, 2011 and 21.1% on July 27, 2011, respectively of our outstanding common stock. As a result, if Mr. Auriana and Constellation were to act in concert they would be able to influence substantially all matters requiring shareholder approval, including the election of directors, the approval of significant corporate transactions, such as acquisitions, the ability to block an unsolicited tender offer and any other matter requiring a vote of shareholders. This concentration of ownership could delay, defer or prevent a change in control of Mediware or impede a merger, consolidation, takeover or other business combination which a shareholder, may otherwise view favorably.
Item 1B. Unresolved Staff Comments.
Not applicable.
18
Item 2. Properties.
The Company's corporate headquarters are in leased space located in Lenexa, Kansas. The Company also leases office space in Oak Brook, Illinois; Jacksonville, Florida; Atlanta, Georgia; Cranston, Rhode Island; Pittsburgh, Pennsylvania and Andover, Massachusetts. The Company's United Kingdom operations are headquartered in leased space in Basildon, Essex.
Item 3. Legal Proceedings.
Mediware is from time to time involved in routine litigation incidental to the conduct of its business, including employment disputes and litigation alleging product defects, intellectual property infringements, violations of law and breaches of contract and warranties. Mediware believes that no such routine litigation currently pending against it, if adversely determined, would have a material adverse effect on its consolidated financial position, results of operations or cash flows.
Item 4. Not applicable.
PART II
Item 5. Market for Registrant’s Common Equity, Related Stockholder Matters and Issuer Purchases of Equity Securities.
The Company's common stock is traded on the Nasdaq Capital Market under the symbol “MEDW.”
The following table sets forth the high and low sales prices for the Company's common stock for each quarterly period of the fiscal years ended June 30, 2011 and 2010, as reported by Nasdaq.
|
2011
|
2010
|
|||||||||||||||
|
High
|
Low
|
High
|
Low
|
|||||||||||||
|
First Quarter
|
$ | 10.75 | $ | 8.50 | $ | 7.49 | $ | 4.80 | ||||||||
|
Second Quarter
|
$ | 11.57 | $ | 9.30 | $ | 7.89 | $ | 5.95 | ||||||||
|
Third Quarter
|
$ | 13.53 | $ | 10.61 | $ | 9.47 | $ | 6.62 | ||||||||
|
Fourth Quarter
|
$ | 13.71 | $ | 10.55 | $ | 9.99 | $ | 8.50 | ||||||||
As of September 2, 2011, there were approximately 1,055 shareholders of record of the Company's common stock. To date, the Company has not paid dividends to its shareholders. The Company does not currently intend to pay dividends, but it may review the benefits of paying dividends in the future.
19
Stock Comparison Graph
The following chart compares the cumulative total shareholder return on Mediware's common stock based on the closing bid price of Mediware's common stock for the five years ended June 30, 2011, with the cumulative total returns for the Russell 2000 Index and the Nasdaq Computer & Data Processing Services Stocks Index over the same period. The comparison assumes $100 invested in Mediware's common stock and in each of the foregoing indices and assumes reinvestment of dividends, if any. The stock price performance shown on the chart is not necessarily indicative of future performance.
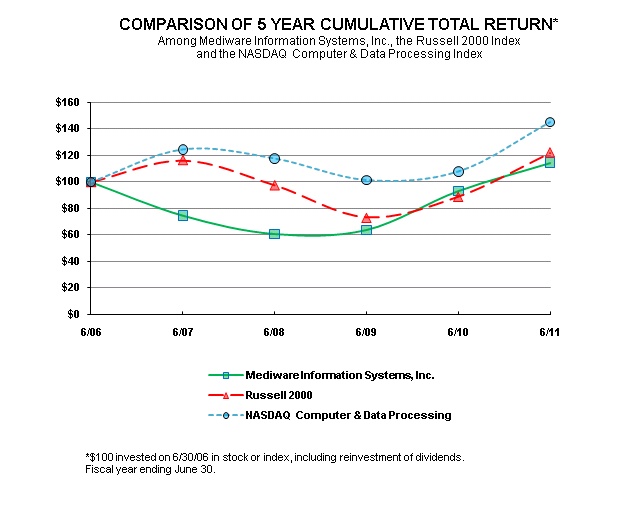
| 6/06 | 6/07 | 6/08 | 6/09 | 6/10 | 6/11 | |||||||||||||||||||
|
Mediware Information Systems, Inc.
|
100.00 | 74.61 | 60.62 | 63.73 | 93.26 | 114.51 | ||||||||||||||||||
|
Russell 2000
|
100.00 | 116.43 | 97.58 | 73.17 | 88.89 | 122.15 | ||||||||||||||||||
|
NASDAQ Computer & Data Processing
|
100.00 | 124.50 | 117.65 | 101.50 | 107.89 | 144.96 |
The stock price performance included in this graph is not necessarily indicative of future stock price performance.
Item 6. Selected Financial Data.
The following table sets forth our selected consolidated financial information. The financial information for the fiscal years ended June 30, 2011, 2010 and 2009 and as of June 30, 2011 and 2010 is derived from audited financial statements that appear elsewhere in this Annual Report on Form 10-K. The financial information for the fiscal years ended June 30, 2008 and 2007, and as of June 30, 2009, 2008 and 2007 is derived from audited financial statements that do not appear in this Annual Report on Form 10-K.
20
You should read the following information in conjunction with our financial statements and notes thereto and the information set forth under “Item 7—Management’s Discussion and Analysis of Financial Condition and Results of Operations.” (All data in the following table is in thousands, except for per share data.)
|
Statements of Operations Data
|
||||||||||||||||||||
|
For the years ended June 30,
|
||||||||||||||||||||
|
2011
|
2010
|
2009
|
2008
|
2007
|
||||||||||||||||
|
Revenue
|
||||||||||||||||||||
|
System sales
|
$ | 14,413 | $ | 10,918 | $ | 10,091 | $ | 11,612 | $ | 15,803 | ||||||||||
|
Services
|
41,110 | 36,698 | 30,594 | 27,825 | 25,389 | |||||||||||||||
|
Total revenue
|
55,523 | 47,616 | 40,685 | 39,437 | 41,192 | |||||||||||||||
|
Cost of sales
|
||||||||||||||||||||
|
Cost of systems (1)
|
3,775 | 3,558 | 3,766 | 3,092 | 2,905 | |||||||||||||||
|
Cost of services (1)
|
14,658 | 12,073 | 10,379 | 9,241 | 8,348 | |||||||||||||||
|
Total cost of sales
|
18,433 | 15,631 | 14,145 | 12,333 | 11,253 | |||||||||||||||
|
Gross profit (1)
|
37,090 | 31,985 | 26,540 | 27,104 | 29,939 | |||||||||||||||
|
Amortization of capitalized software
|
4,586 | 4,966 | 5,843 | 5,737 | 5,427 | |||||||||||||||
|
Software development costs
|
4,478 | 4,916 | 3,942 | 4,174 | 4,062 | |||||||||||||||
|
Selling, general and administrative
|
19,086 | 17,486 | 14,605 | 16,717 | 17,978 | |||||||||||||||
|
Net interest and other expense (income)
|
43 | (41 | ) | (347 | ) | (847 | ) | (1,145 | ) | |||||||||||
|
Income before income taxes
|
8,897 | 4,658 | 2,497 | 1,323 | 3,617 | |||||||||||||||
|
Income tax expense
|
(2,605 | ) | (1,416 | ) | (923 | ) | (595 | ) | (1,291 | ) | ||||||||||
|
Net income
|
$ | 6,292 | $ | 3,242 | $ | 1,574 | $ | 728 | $ | 2,326 | ||||||||||
|
Net income per common share
|
||||||||||||||||||||
|
Basic
|
$ | 0.79 | $ | 0.41 | $ | 0.21 | $ | 0.09 | $ | 0.29 | ||||||||||
|
Diluted
|
$ | 0.77 | $ | 0.41 | $ | 0.20 | $ | 0.09 | $ | 0.28 | ||||||||||
|
Weighted average common shares outstanding
|
||||||||||||||||||||
|
Basic
|
8,012 | 7,838 | 7,651 | 7,961 | 8,122 | |||||||||||||||
|
Diluted
|
8,193 | 7,958 | 7,967 | 8,305 | 8,427 | |||||||||||||||
|
Balance Sheet Data
|
||||||||||||||||||||
|
As of June 30,
|
2011
|
2010
|
2009
|
2008
|
2007
|
|||||||||||||||
|
Cash and cash equivalents
|
$ | 29,987 | $ | 23,340 | $ | 20,865 | $ | 22,741 | $ | 22,789 | ||||||||||
|
Working capital
|
24,745 | 18,726 | 18,273 | 18,995 | 24,334 | |||||||||||||||
|
Total assets
|
86,810 | 71,185 | 62,355 | 60,083 | 60,650 | |||||||||||||||
|
Debt
|
- | - | - | - | 4 | |||||||||||||||
|
Common stock and APIC
|
36,938 | 34,963 | 33,153 | 32,237 | 31,505 | |||||||||||||||
|
Retained Earnings
|
21,971 | 15,679 | 12,437 | 10,863 | 10,413 | |||||||||||||||
|
Total stockholders' equity
|
54,972 | 46,700 | 41,897 | 39,891 | 42,031 | |||||||||||||||
|
(1) Excludes amortization of capitalized software costs.
|
||||||||||||||||||||
21
Item 7. Management's Discussion and Analysis of Financial Condition and Results of Operation.
Executive Overview
Mediware licenses, implements and supports clinical and performance management information solutions and other services to healthcare facilities. We license our blood and biologics management solutions to hospitals. We license blood donor recruitment and management solutions to blood donor and plasma donor centers through our Blood Center Technologies business group, formed during the fiscal year ended June 30, 2009. The Company’s medication management solutions are licensed to hospitals, long-term care, specialty pharmacy, home infusion, home/durable medical equipment, alternate care and behavioral health facilities. Our home infusion, specialty pharmacy, home/durable medical equipment and alternate care products and services are licensed through the Company’s Alternate Care Solutions (ACS) business group, formed during fiscal 2010. ACS also provides billing and collection services to the home infusion market. We license performance management software to hospitals, blood and plasma centers, and alternate care facilities.
We generally license our blood management and biologics management software systems and certain of our medication management software systems to customers on a perpetual basis. The customers that license the software on a perpetual basis typically make up-front payments for the software license and payments for support services on an annual basis. In contrast, we generally provide our blood and plasma center solutions and certain of our medication management software systems and our recently acquired alternate care products on a monthly subscription or term license basis. These customers may pay Mediware an initial start-up fee and a monthly fee for use and support of Mediware’s proprietary software. Customers may purchase services, including implementation, consultation and other ad hoc services, for additional fees which are generally billed as incurred. Beginning in fiscal 2010, we initiated our “maintenance plus” program through which our customers may elect to pay “in advance” on an annual basis for services that had historically been paid on an as-incurred basis. Performance management software is licensed on a perpetual and subscription or tem license basis. We currently anticipate that over time an increased number of our systems (in all product lines) will be licensed on a subscription or term license basis.
During fiscal 2011 Mediware started offering its full suite of products on a remotely hosted basis. The hosting services include installation, upgrades, patches and network configuration and repair as well as remote monitoring and help desk services. We anticipate that remote hosting will make our product offerings more attractive to many of our current and potential customers.
During the fiscal year ended June 30, 2011, Mediware contracted with third parties to provide the LifeTrak®, InSight performance management software, HCLL, KnowledgeTrak and related services to the U.S. Military Health Service (“MHS”). These contracts call for substantial upfront payments to Mediware, many of which were made prior to June 30, 2011. Performance of these projects is expected to extend through fiscal 2012, with some expected to be completed in the first half of the fiscal year. These contracts are being accounted for using the percentage of completion method, which in this case requires us to recognize revenue based upon the ratio of the effort completed during the reporting period compared to our estimate of the total effort required to complete the project.
Blood and Biologics Management Products
Our flagship blood transfusion product is the HCLL transfusion software. We also provide our hospital customers HCLL donor software for use in hospital-based donor centers. In early fiscal year 2008, we announced our new BloodSafe™ suite of products. As of June 30, 2011, BloodSafe is licensed for use at 12 facilities.
In July 2008 we announced the launch of Blood Center Technologies business unit. Blood Center Technologies is intended to drive growth as we expand our focus in the blood donor and plasma market. Blood Center Technologies provides software tools and services to large, complex blood centers for donor targeting, donor recruitment, donation management, unit testing, blood component manufacturing, inventory control, sales and distribution. This is accomplished through a combination of our 510(k) cleared LifeTrak® software and a set of robust CRM and recruiting software products and capabilities. These products and capabilities enable us to deliver an integrated software solution for blood centers to improve collections and efficiency throughout the entire process from blood donor recruitment to hospital distribution. Through an acquisition in March 2010 we added e-learning content and technologies, along with certification tracking tools, to our Blood Center Technologies product offering. We offer this addition, KnowledgeTrak, on a subscription basis.
22
Mediware recently responded to FDA comments received during the agency’s latest Quality Systems Regulation evaluation of our 510((k) cleared software and related processes. Mediware expects to complete the comment process without disrupting its ordinary business operations. However, in connection with the comment resolution process, Mediware expects to notify its customers that, in the future, the HCLL Transfusion software (and perhaps other blood software regulated by the FDA) will need to be updated at least annually in accordance with customer license agreements.
In June 2008, we released BiologiCare™, our first generation bone, tissue and cellular product tracking software. With the introduction of BiologiCare, we believe we are positioned to benefit from the emerging biologics market, which includes, among other things, bone, tissue and cord blood stem cells. BiologiCare can be integrated with our HCLL software or operate on a stand-alone basis. As of June 30, 2011, BiologiCare is licensed for use at three facilities.
In addition to our license of blood and biologics management software, we generate revenue from professional services and post-contract support. These ongoing support contracts have accounted for 43%, 45%, and 38%, respectively, of the total revenue from blood and biologics management operations during the fiscal years ended June 30, 2011, 2010 and 2009.
Medication Management Products
Mediware’s medication management software product for larger and medium sized hospitals and healthcare institutions is WORx. We also offer MediCOE, a physician order entry module, and MediMAR, a nurse point of care administration and bedside documentation module, that are fully integrated with the WORx software. An acquisition in November 2008 expanded our product offering by adding Ascend, a solution that meets the needs of small and medium size hospital, specialty pharmacy and home infusion facilities. To expand our capabilities and address a new industry mandate, we introduced MediREC in March 2007. As of June 30, 2011, MediREC was licensed for use at 13 customer sites.
Selling our full suite of medication management products (WORx, MediMAR, MediCOE and MediREC) is a complex process involving multiple hospital departments. On the other hand, Ascend requires substantially smaller financial commitments from customers and is priced based on a subscription pricing model. Consequently, we anticipate that sales of the Ascend software products will be more consistent and have shorter sales cycles than sales of the full suite of medication management products.
Since Mediware acquired the Ascend product line and business in fiscal 2009, substantially all of the business customers have utilized a precursor pharmacy software product rather than the contemporary Ascend software. During fiscal 2011 we initiated a program to transition customers from the older product to the latest Ascend software platform. As this process takes time, we expect these efforts to continue in fiscal 2012.
We generate revenue from medication management software sales, professional services and post-contract support. Support contracts accounted for 49%, 51%, and 53%, of the total revenue from medication management operations for the 2011, 2010 and 2009 fiscal years, respectively.
Through two acquisitions consummated in December 2009 and an acquisition in April 2011, Mediware greatly increased our presence in the alternate care market and, in fiscal 2010, Mediware formed an Alternate Care Solutions business unit to capitalize on the growing strength of its product offerings. Our product offerings currently include: home infusion software, specialty pharmacy software, home/durable medical equipment software, and home healthcare software, as well as billing and collections services that are focused on the alternate care markets. These offerings are largely the combination of the home infusion offering that Mediware acquired in 2008 and the home infusion, specialty pharmacy and alternate care products acquired in December 2009 and April 2011. Mediware integrated the home/durable medical equipment, home health, home infusion, and billing and collections businesses acquired from CareCentric with its existing Alternate Care Solutions business.
Our United Kingdom operating business is JAC. JAC’s product offering includes Pharmacy Management System and Electronic Prescribing module. The Electronic Prescribing module has been installed in approximately twenty U.K. customer sites as of June 30, 2011. The installed base of the Company’s Pharmacy Management system product includes approximately 50% of the trusts within National Health Service (NHS).
23
Performance Management Products
Through a business acquisition in June 2009, Mediware added the InSight software system to its portfolio of products. The InSight system is a business and clinical intelligence software package used in more than 100 hospitals at June 30, 2011. We generate revenue from InSight software sales, professional services and post-contract support. Support contracts accounted for 59% and 41% of total performance management revenues in the fiscal years ended June 30, 2011 and 2010, respectively.
We have created a focused product strategy to make an entry level version of the Insight performance management software easily accessible and available to the users of our core products. It is our expectation that after using the InSight software, our customers will see the benefit of the product and will expand their use over time.
Industry and Regulation
We believe that our customers’ recent capital investment decisions have been, and future decisions will be, impacted by recently enacted federal laws. Of specific importance to near term investment is ARRA, which became effective in 2009. This Act includes more than $38 billion of incentives to help healthcare organizations modernize operations through the acquisition and use of information technology solutions. HITECH, a part of ARRA, provides roughly $2 billion in ‘jump start’ funding that the Department of Health and Human Services is to distribute over a two year time frame beginning in 2011. ARRA also includes approximately $17 billion in Medicare and Medicaid incentives targeting the ‘meaningful use’ of health record systems, systems interoperability, and the submission of data related to quality improvement initiatives.
The government spending is intended to reduce inefficiencies and improve patient care through the use of technologies. ARRA, and specifically HITECH, increases the pressure on hospitals and care providing institutions to adopt technology. HITECH provides funding for facilities to launch improvement projects associated with key information technologies. Qualifying hospitals can receive payments over a period of approximately four or five years beginning in 2011 based on their use of certified health information technology systems. HITECH also provides financial penalties to hospitals by reducing Medicare reimbursement payments for hospitals that do not comply with certain usage requirements by 2015.
While Mediware does not believe that it has benefited materially from these government initiatives and may see longer sales cycles as a result of the programs, the Company believes that the additional government spending on healthcare information technology and other health reform legislation will stimulate spending across a broad range of healthcare information technology projects. Over time we expect these initiatives to create new opportunities, to expand the use of Mediware solutions and to have a positive impact on the Company. WORx has been certified so that our customers receive the full benefit of the HITECH Act, and Mediware expects that Ascend will be similarly certified in the first quarter of fiscal 2012. If we fail to achieve the appropriate certification standards, the Company could face adverse consequences as its customers look to other certified vendors.
We do not currently expect the Patient Protection and Affordable Care Act, passed in 2010, to have a material impact on our business.
Strategic Relationships and Acquisitions
We seek to develop strategic relationships that are complementary to our core markets and product set, and that provide a greater value proposition to the customer than could be realized without the strategic relationship. Our fiscal 2011 results were positively impacted by our strategic relationship with a company benefiting from HITECH spending.
Our business strategy includes the possibility of growth through acquisitions and other corporate transactions. We consummated one strategic acquisition in fiscal 2011, three strategic acquisitions in fiscal 2010 and two strategic acquisitions in fiscal 2009. We believe that the acquisitions are an effective means to grow our business when existing products experience little growth. We also believe that these acquisitions offer good return on investment. There can be no assurance that we will be able to identify future strategic partners or reach mutually agreeable terms for a transaction if any such partners are identified.
24
Critical Accounting Policies and Estimates
The discussion and analysis of our financial condition and results of operations are based upon our consolidated financial statements, which have been prepared in accordance with accounting principles generally accepted in the United States of America. The preparation of these financial statements requires management to make estimates and judgments that affect the reported amounts of assets, liabilities, revenue and expenses. On an on-going basis, we evaluate these estimates, including those related to revenue recognition, capitalized software costs, goodwill, and stock-based compensation. We base these estimates on historical experience and on various other assumptions that are believed to be reasonable under the circumstances, the results of which form the basis for making judgments about the carrying values of assets and liabilities that are not readily apparent from other sources. Actual results may differ from these estimates under different assumptions or conditions. We believe the following critical accounting policies reflect our more significant estimates and assumptions used in the preparation of the financial statements.
Revenue Recognition
The Company derives revenue from licensing its proprietary applications software and sublicensed software, sale of computer hardware, transaction fees from software use, and the services performed related to the installation, configuration, training, consultation and ongoing support of the software. Software license revenue that is not subscription or tem license-based is generally recognized when evidence of an arrangement exists, delivery has occurred, the fee is fixed or determinable, collectability is probable, vendor-specific objective evidence of the fair value of any undelivered element exists, and no other significant obligations on the part of the Company remain. For its subscription products, Mediware recognizes start-up fee revenue upon completion of the customer installment and configuration services associated with the fee. Monthly subscription fees for software and maintenance are recognized ratably over the subscription period. The Company combines the software and maintenance associated with the subscription fee into a single element for purposes of applying revenue recognition principles, as the Company does not sell software subscriptions or maintenance services on a standalone basis. Revenue from the sale of hardware is generally recognized upon shipment. Fees for installation, training and consultation are recognized as the services are provided. Support and maintenance fees, typically sold on an annual renewal basis, are recognized ratably over the period of the support contract.
The Company considers many factors when applying accounting principles generally accepted in the United States of America related to revenue recognition. These factors include, but are not limited to:
|
|
-
|
contract terms, such as payment terms, delivery dates, and pricing of the various product and service elements of a contract
|
|
|
-
|
availability of products to be delivered
|
|
|
-
|
time period over which services are to be performed
|
|
|
-
|
creditworthiness of the customer
|
|
|
-
|
the complexity of customizations and integrations to the Company’s software required by service contracts
|
|
|
-
|
discounts given for each element of a contract and
|
|
|
-
|
any commitments made as to project milestones
|
Each of the relevant factors is analyzed to determine its impact, individually and collectively with other factors, on the revenue to be recognized. Management is required to make judgments regarding the significance of each factor in applying the revenue recognition standards, as well as whether or not each factor complies with such standards. Misjudgments or errors by management in its evaluation of the factors and the application of the standards, especially with respect to complex or new types of transactions, could have a material adverse affect on the Company’s future revenues and operating results.
If the Company enters into an arrangement with a client requiring significant customization of the software or services that are essential to the functionality of the software, the Company generally recognizes revenue derived from the sale of licensed software, sublicensed software and services over the period the services are performed, in accordance with the accounting guidance for construction-type contracts.
In addition, the Company is recognizing revenues on large, fixed fee contracts entered into in fiscal 2011 on a percentage of completion basis based upon the ratio of the effort completed during the reporting period compared to its estimate of the total effort required to complete the project. Percentage-of-completion is measured based primarily on input measures such as hours incurred to date compared to estimated total hours at completion, with consideration given to output measures, such as contract milestones, when applicable. Significant judgment is required when estimating total hours and progress to completion on these arrangements which determines the amount of revenue we recognize as well as whether a loss is recognized if expected to be incurred upon project completion. The Company is required to recognize the entire anticipated loss immediately as soon as it becomes evident. Revisions to hour and cost estimates are incorporated in the period the amounts are recognized if the results of the period have not been reported; otherwise, the revision of estimates are recognized in the period in which the facts that give rise to the revision become known.
25
Allowance for Doubtful Accounts
The Company maintains an allowance for doubtful accounts based on its estimates of collectability. The Company bases these estimates on historical collections, performance and specific collection issues. If actual bad debts differ from the reserves calculated, the Company records an adjustment to bad debt expense in the period in which the difference occurs. If creditworthiness of the Company’s clients were to weaken or the Company’s collection results relative to historical experience were to decline, it could have a material adverse impact on operating results and cash flows.
Capitalized Software Costs
Capitalized computer software costs consist of certain costs incurred to create and develop computer software products. As such, the Company capitalizes all software production costs incurred upon the establishment of technological feasibility for the product or enhancement, which ceases upon its general release.
Technological feasibility occurs upon the completion of the planning, designing, coding and testing activities that are necessary to establish that the product or enhancement can be produced to meet its design specifications, including its functions, features and technical performance requirements.
The Company amortizes capitalized software development costs for each product and enhancement over the estimated useful life of the product or enhancement, which ranges from five to seven years. These estimates are based on available information, including product life cycles, past history with similar products, the market and anticipated market share for the product and other factors unique to the product.
The Company reports capitalized software costs at the lower of unamortized cost or net realizable value. Net realizable value for capitalized software costs for each product or enhancement is determined by subtracting the estimated costs of completing and disposing of the product from the estimated future revenue of the product. These estimates are based on available information, including product life cycles, past history and market for the products or enhancement, the market share the Company expects to achieve, current and future pricing of the products, the existing customer base, and other factors unique to each product. We test capitalized software costs for impairment at least annually and more often if events and circumstances warrant. If the carrying value exceeds its net realizable value, impairment is deemed to have occurred and the carrying value is written down to net realizable value.
The evaluation of net realizable value is inherently very subjective. However, the Company believes its calculation of net realizable value has historically been accurate in all material respects. Due to the size of our customer base, which generates a recurring support revenue stream, combined with anticipated system sales from our new products, the Company has not historically experienced any significant changes to the net realizable value of our current capitalized software development costs.
Goodwill and Other Intangible Assets
Goodwill and identifiable intangible assets are tested for impairment at least annually or more often if events and circumstances warrant. The Company evaluates goodwill for impairment by comparing the fair value of the Company, a single reporting unit, to its carrying value including goodwill. We use the income approach under which we calculate fair value based on the estimated discounted cash flow method as well as other generally accepted methodologies. Our cash flow assumptions are based on historical and forecasted revenue, operating costs, and other relevant factors. No impairment was indicated as of June 30, 2011. Intangible assets with finite useful lives are amortized over their respective estimated useful lives and reviewed for impairment. As of June 30, 2011, management believes no such impairment has occurred.
Goodwill represents the excess of purchase price and related costs over the value assigned to the net tangible and intangible assets of businesses acquired. Business acquisitions involving goodwill include:
|
|
•
|
Digimedics Corporation (May 1990);
|
|
|
•
|
Informedics, Inc. (September 1998);
|
|
|
•
|
Certain assets of Information Handling Services Group, including its Pharmakon and JAC divisions(June 1996);
|
|
|
•
|
Certain assets of Integrated Marketing Solutions LLC (October 2007);
|
|
|
•
|
Certain assets of Hann’s On Software, Inc (November 2008);
|
26
|
|
•
|
Certain assets of SciHealth, Inc. (June 2009);
|
|
|
•
|
Certain assets of Advantage Reimbursement, Inc. (December 2009);
|
|
|
•
|
Healthcare Automation, Inc. (December 2009); and
|
|
|
•
|
Certain assets of CareCentric, Inc. (April 2011).
|
Goodwill was reduced by the recognition of related income tax benefits.
Stock-Based Compensation
The Company accounts for stock-based compensation in accordance with current accounting guidance. Under fair value recognition provisions, share-based compensation cost is measured at the grant date based on the value of the award. This value is expensed ratably over the vesting period for time-based awards and when the achievement of performance goals is probable in our opinion for performance-based awards. Determining the fair value of share-based awards at the grant date requires judgment; including volatility, expected terms, estimating the amount of share-based awards that are expected to be forfeited, and the likelihood of achieving performance or market conditions if present. If actual results differ significantly from these estimates, stock-based compensation expense and the Company’s results of operations could be materially impacted.
Results of Operations
Fiscal Year Ended June 30, 2011, Compared to Fiscal Year Ended June 30, 2010
Total revenue amounted to $55,523,000 for fiscal 2011 compared to $47,616,000 for fiscal 2010, an increase of $7,907,000 or 17%. The increase is largely due to service revenues associated with the medication management businesses we acquired in December 2009 and April 2011, and also due to system sales for blood and biologics management products. Blood and biologics management products and services recorded total revenue of $21,899,000 during fiscal 2011, representing an increase of $2,571,000 or 13% compared to $19,328,000 in fiscal 2010. Medication management products and services recorded an increase in total revenue of $5,766,000 or 22% to $31,481,000 in fiscal 2011 compared to $25,715,000 in fiscal 2010. The increase is largely a result of the incremental revenue associated with the acquired medication management businesses which contributed to our results for only a portion of fiscal 2010, in addition to the incremental revenue related to the medication management business acquired in April 2011. JAC’s contribution to total revenues of medication management products and services revenue was $6,749,000 during fiscal 2011, representing an increase of $402,000 or 6%, compared to $6,347,000 in fiscal 2010. Performance management products and services recorded total revenues of $1,446,000 in the fiscal 2011 compared to $1,707,000 in fiscal 2010.
System sales revenue, which includes revenue derived from proprietary software, third party software and hardware, totaled $14,413,000 for fiscal 2011, an increase of $3,495,000, or 32%, from $10,918,000 recorded in fiscal 2010. System sales for blood and biologics management products increased to $6,161,000 for fiscal 2011 compared to $4,580,000 for fiscal 2010, a $1,581,000 or 35% increase. The increase was primarily attributable to license fees associated with LifeTrak® and HCLL software purchased by the U.S. Military Health Service (“MHS”), partially offset by fewer BloodSafe™ system sales in fiscal 2011 compared to fiscal 2010. System sales for medication management products increased to $7,855,000 in fiscal 2011 compared to $5,742,000 in fiscal 2010, an increase of $2,113,000 or 37%. This increase reflects incremental revenues associated with the ACS businesses we acquired in December 2009 and April 2011, as well as increased system sales for Ascend. JAC recorded system sales of $2,320,000 in fiscal 2011 compared to $2,285,000 in fiscal 2010. System sales revenue for performance management was $397,000 and $541,000 for fiscal 2011 and 2010, respectively.
Service revenue, which includes post contract support revenues, implementation services, maintenance services, including our “maintenance plus” program, billing and collection services, reimbursable travel costs, and promotional services increased $4,412,000, or 12%, to $41,110,000 in fiscal 2011 compared to $36,698,000 for fiscal 2010. Service revenue for the blood and biologics management products totaled $15,738,000 for fiscal 2011 representing an increase of $990,000, or 7%, compared to $14,748,000 in fiscal 2010. The increase primarily reflects implementation revenue for our LifeTrak® software related to the project with the MHS, partially offset by a decrease in implementation revenue for our HCLL software associated with the sunset of our legacy systems that were completed in fiscal 2010. Service revenue for the medication management products increased $3,653,000, or 18%, to $23,626,000 in fiscal 2011 compared to $19,973,000 for fiscal 2010. This increase is a result of the incremental revenues associated with the ACS businesses we acquired in December 2009 and April 2011 and increased support revenue, partially offset by lower services revenues from the WORx product line. Service revenue for JAC increased $367,000, or 9% to $4,429,000 in fiscal 2011 compared to $4,062,000 in fiscal 2010. Service revenue for performance management products was $1,049,000 and $1,166,000 for fiscal 2011 and 2010, respectively.
27
Cost of systems includes the cost of computer hardware and sublicensed software purchased from computer and software manufacturers by the Company as part of its integrated system offerings. Cost of systems can vary as the mix of revenue varies between high margin proprietary software and lower margin computer hardware and sublicensed software components. Cost of systems increased $217,000, or 6%, to $3,775,000 during fiscal 2011 compared to $3,558,000 in fiscal 2010. The gross margin earned on system sales, excluding amortization of capitalized software costs, was 74% in fiscal 2011 compared to 67% in fiscal 2010. The increase in gross margin is primarily due to an improvement in the mix of higher margin proprietary system sales relative to lower margin third party sales during fiscal 2011 compared to fiscal 2010.
Cost of services relates to ongoing support and maintenance services and implementation services and includes the salaries of client service personnel and direct expenses of the client service departments. Cost of services increased $2,585,000, or 21%, to $14,658,000 during fiscal 2011 as compared to $12,073,000 in fiscal 2010. The increase in cost of services is primarily attributed to incremental costs associated with our recent business acquisitions in medication management. Gross margin on service revenue decreased to 64% in fiscal 2011 from 67% in fiscal 2010.
Amortization of capitalized software decreased $380,000, or 8%, to $4,586,000 in fiscal 2011 compared to $4,966,000 in fiscal 2010. The decrease occurred as past software development efforts became fully amortized. We anticipate that amortization costs will remain largely flat in fiscal 2012 compared to fiscal 2011 provided Mediware’s capitalization and cash expenditures for software development continue at substantially the same rates.
Expenditures for software development include both capitalizable and non-capitalizable development projects. Total expenditures for software development were $9,621,000 in fiscal 2011 compared to $8,736,000 in fiscal 2010, an increase of $885,000, or 10%. This increase is due largely to our efforts in the first three quarters of fiscal 2011 to further expand our product offerings into the blood plasma market. Software development costs expensed during the period decreased $438,000, or 9%, to $4,478,000 in fiscal 2011 compared to $4,916,000 in fiscal 2010. The decrease was due to a shift in the capitalization rate driven by the mix and timing of projects.
Selling, general and administrative (SG&A) expenses include marketing and sales salaries, commissions, travel and advertising expenses and acquired intangibles amortization. Mediware includes within SG&A; bad debt expense; legal, accounting and professional fees; administrative salaries and bonus expenses; utilities, rent, communications and other office expenses; stock-based compensation expenses and other related direct administrative expenses. SG&A expenses increased $1,600,000, or 9%, to $19,086,000 in fiscal 2011 compared to $17,486,000 in fiscal 2010. The increase in SG&A expense is primarily related to an increase in stock-based compensation expense and increased amortization of intangible assets due to the business acquisitions in December 2009 and April 2011. The increase was also due, although to a less significant extent, to changes in facility costs and marketing expenses. As a percentage of revenue, SG&A was 34% and 37% for fiscal 2011 and fiscal 2010, respectively.
Net interest and other expense amounted to $43,000 in fiscal 2011 compared to net interest and other income of $41,000 in fiscal 2010. This change primarily resulted from lower interest rates reducing interest income earned on Mediware’s invested cash, despite higher cash balances.
Income tax expense increased $1,189,000 to $2,605,000 during fiscal 2011 compared to $1,416,000 in fiscal 2010. Income taxes increased primarily as a result of higher operating income in the fiscal 2011 period. Research and development tax credits were taken in the both periods reducing the effective tax rate. During the second quarter of fiscal 2011, the Company recognized tax credits for the full calendar year 2010 as a result of the passage of the Tax Relief, Unemployment Insurance Reauthorization, and Job Creation Act of 2010, which extended research and development credits to calendar years 2010 and 2011. The Company expects its future effective tax rate will trend higher and more closely approximate statutory rates. The Company expects to claim additional credits to the extent that it has allowable qualifying research and development activities.
Net income during fiscal 2011 was $6,292,000, compared to $3,242,000 during fiscal 2010, resulting in an increase of net income of $3,050,000, or 94%. The increase in net income is primarily due to increased software sales, the incremental operating income with the ACS businesses we acquired in December 2009 and April 2011, combined with decreased amortization of capitalized software costs and an increased rate of capitalization of software development expenditures.
Fiscal Year Ended June 30, 2010, Compared to Fiscal Year Ended June 30, 2009
Total revenue amounted to $47,616,000 for fiscal 2010 compared to $40,685,000 for fiscal 2009, an increase of $6,931,000 or 17%. Revenue earned from medication management products and services increased $6,152,000 in fiscal year 2010, including $4,507,000 attributed to ACS products and services arising from two businesses acquired in December 2009. Other contributors to the growth in medication management revenue were the full-year impact of Ascend systems and services from a business acquisition in November 2008, and JAC, which increased total revenue 8% over fiscal 2009. Revenue earned from performance management systems and services was $1,671,000 more in fiscal 2010 than in fiscal 2009, as that business was established through an acquisition in June 2009. The revenue increases in medication management and performance management were partially offset by a decline in blood and biologics management products and services revenue. Blood and biologics management’s fiscal 2010 revenue decreased $884,000, or 4%, from the $20,212,000 recorded during fiscal 2009. We experienced lower HCLL software sales and implementation revenue, though the decline was partially offset by system sales and service revenue attributed to our Blood Center Technologies products, which increased in fiscal 2010 over fiscal 2009.
28
System sales revenue totaled $10,918,000 for fiscal 2010, an increase of $827,000, or 8%, from $10,091,000 recorded in fiscal 2009. System sales for blood and biologics management products decreased from $4,916,000 for fiscal 2009 to $4,580,000 for fiscal 2010, a 7% decrease. Increased subscription sales of our Blood Center Technologies products were offset by declines in HCLL system sales. System sales for the medication management products increased from $5,156,000 in fiscal 2009 to $5,742,000 in fiscal 2010, an increase of $586,000 or 11%. WORx system sales increased due to a large contract entered into during fiscal 2010. The full-year impact of the acquired Ascend product services contributed, as did ACS products and services from businesses acquired in December 2009. JAC system sales declined, though we believe JAC continues to be well-positioned within its market. System sales revenue for performance management was $541,000 for fiscal 2010 compared to $9,000 for fiscal 2009.
Service revenue increased $6,104,000, or 20%, to $36,698,000 in fiscal 2010 compared to $30,594,000 for fiscal 2009. Service revenue for the blood and biologics management products declined $548,000, or 4%, as our customers continued to complete their implementation of our HCLL product. The declines in HCLL services were partially offset by an increase in services for Blood Center Technologies products. Service revenue for the medication management products increased $5,566,000, or 39%, to $19,973,000 in fiscal 2010 compared to $14,407,000 for fiscal 2009. This increase is a result of incremental revenues from businesses acquired in fiscal 2009 and 2010. Service revenue from our core medication management products such as WORx were largely flat to fiscal 2009 as the impact of a mature client base was offset with service revenue derived from a contract with a large behavioral health system. Service revenue for JAC increased in fiscal 2010.
Cost of systems decreased $208,000, or 6%, to $3,558,000 during fiscal 2010 compared to $3,766,000 in fiscal 2009. The gross margin earned on system sales, excluding amortization of capitalized software costs, was 67% in fiscal 2010 compared to 63% in fiscal 2009. The increase in gross margin is primarily due to a decrease in the amount of third party sales relative to the amount of high margin proprietary system sales during fiscal 2010.
Cost of services increased $1,694,000, or 16%, to $12,073,000 during fiscal 2010 as compared to $10,379,000 in fiscal 2009. Cost of services increase is primarily attributed to personnel related to the recently acquired businesses. Gross margin on service revenue increased nominally from 66% in fiscal 2009 to 67% in fiscal 2010. As anticipated, amortization of capitalized software decreased $877,000, or 15%, to $4,966,000 in fiscal 2010 compared to $5,843,000 in fiscal 2009. The decrease occurred as past software development efforts became fully amortized.
Total expenditures for software development were $8,736,000 in fiscal 2010 compared to $7,771,000 in fiscal 2009, an increase of $965,000, or 12%. This increase is primarily a result of higher investment in the blood and biologics management products, development costs associated with recently acquired businesses, and development efforts in support of a medication management client. Software development costs not subject to capitalization increased $974,000, or 25%, to $4,916,000 in fiscal 2010 compared to $3,942,000 in fiscal 2009. The increase was due to higher spending and to a shift in the capitalization rate driven by the mix and timing of projects and the application of the capitalization rules.
SG&A expenses increased $2,881,000, or 20%, from $14,605,000 in fiscal 2009 to $17,486,000 in fiscal 2010. Approximately seventy-five percent of the increase in SG&A expense related to the operations and the acquired intangible amortization of the recently acquired businesses. The remaining increase included an increase in the provision for doubtful accounts and less significant changes in items such as fixed asset depreciation, stock-based compensation expense and employee benefit expense. As a percentage of revenue, SG&A remained relatively constant at 37% and 36% for fiscal 2010 and fiscal 2009, respectively.
Interest and other income, net of interest and other expense, decreased from $347,000 in fiscal 2009 to $41,000 for fiscal 2010. This decrease primarily resulted from a lower in interest rates reducing interest income earned on Mediware’s invested cash and imputed interest expense on contingent consideration owed to certain sellers of recent acquisitions.
Income tax expense increased $493,000, from $923,000 during fiscal 2009 to $1,416,000 in fiscal 2010. The effective tax rate decreased from 37% for fiscal 2009 to 30% in fiscal 2010. The decrease in the effective tax rate is primarily attributable to research and development tax credits taken during fiscal 2010.
29
Net income during fiscal 2010 was $3,242,000, compared to $1,574,000 during fiscal 2009, resulting in an increase of net income of $1,668,000, or 106%. The increase in net income is primarily attributable to revenue from businesses acquired in fiscal 2010 and 2009 and a decrease in capitalized software amortization, and was partially offset by decreased blood and biologics management product and service revenue due to a maturing client base.
Liquidity and Capital Resources at June 30, 2011 and 2010
As of June 30, 2011, Mediware had cash and cash equivalents of $29,987,000 compared to $23,340,000 at June 30, 2010. A portion of the Company’s cash and cash equivalents resides outside of the United States. Repatriation of these funds could be negatively impacted by taxes. Working capital was $24,745,000 and $18,726,000 at June 30, 2011 and June 30, 2010, respectively. Our current ratio was 1.9 at both June 30, 2011 and 2010. Other than deferred tax liabilities, the Company does not have material capital lease obligations, purchase obligations, or long-term liabilities. However, our deferred revenue increased to $20,975,000 at June 30, 2011 compared to $12,715,000 at June 30, 2010 as we increased our collections of cash from customers in advance of providing services largely due to prepayments in connection with the MHS contracts.
Cash provided by operating activities was $14,935,000 during fiscal 2011 compared to $11,801,000 during fiscal 2010. The increase in cash provided by operating activities is primarily due to increased net income and changes in working capital.
Cash used in investing activities was $9,021,000 during fiscal 2011 compared to $10,124,000 during fiscal 2010. The change is primarily attributable to a decrease in payments for the acquisitions, partially offset by increased capitalized software costs. Cash used for acquisitions was $3,584,000 and $6,081,000 for fiscal 2011 and fiscal 2010, respectively.
Cash provided by financing activities was $452,000 during fiscal 2011 compared to $1,095,000 during fiscal 2010. The decrease is primarily attributable to $403,000 less in proceeds received from option exercises in fiscal 2011 compared to fiscal 2010. In addition, during fiscal 2011 there was a repurchase of common stock that an executive surrendered in order to pay taxes due in connection with the vesting of a stock-based compensation award. There were no repurchases of common stock in connection with compensation awards or vesting of restricted stock in fiscal 2010.
We currently use cash flow from operations to fund our capital expenditures and to support our working capital requirements. We expect that future cash requirements will principally be for capital expenditures, working capital requirements, any additional stock repurchases and other strategic initiatives. Exclusive of activities involving any future acquisitions of products or companies that complement or augment our existing line of products or any additional stock repurchases, we believe that our existing cash balances and cash flow from operations will be sufficient to meet our projected capital expenditures, working capital, and other cash requirements at least through the next twelve months.
Off-Balance Sheet Arrangements
The Company has no off-balance sheet arrangements that have or are reasonably likely to have a current or future effect on the Company’s financial condition, changes in financial condition, revenue or expenses, results of operations, liquidity, capital expenditures or capital resources that is material to the Company.
Tabular Disclosure of Contractual Obligations
The Company's contractual obligations at June 30, 2011 for operating leases are as follows (amounts in thousands):
|
Total
|
2012
|
2013
|
2014
|
2015
|
2016
|
After 2016
|
||||||||||||||||||||||
|
Operating Lease Obligations
|
$ | 3,128 | $ | 1,392 | $ | 709 | $ | 283 | $ | 218 | $ | 117 | $ | 409 | ||||||||||||||
The Company does not have any material capital lease obligations, purchase obligations or other long-term liabilities.
30
Recently Issued Accounting Guidance
In June 2011, the Financial Accounting Standards Board (“FASB”) issued Accounting Standards Update No. 2011-05 “Comprehensive Income (Topic 220): Presentation of Comprehensive Income” (“ASU No. 2011-05”). Under ASU No. 2011-5, an entity has the option to present the total of comprehensive income, the components of net income, and the components of other comprehensive income either in a single continuous statement of comprehensive income or in two separate but consecutive statements. In both choices, an entity is required to present each component of net income along with total net income, each component of other comprehensive income along with a total for other comprehensive income, and a total amount for comprehensive income. ASU No. 2011-5 eliminates the option to present the components of other comprehensive income as part of the statement of changes in stockholders’ equity. ASU No. 2011-5 is effective for fiscal years, and interim periods within those years, beginning after December 15, 2011 and effects the presentation of financial statements and thus will have no impact on the Company’s consolidated financial statements.
In December 2010, the FASB issued ASU No. 2010-28, “When to Perform Step 2 of the Goodwill Impairment Test for Reporting Units with Zero or Negative Carrying Amounts” (“ASU 2010-28”). ASU 2010-28 modifies Step 1 of the goodwill impairment test, which requires an entity to compare the fair value of a reporting unit with its carrying amount, including goodwill. For reporting units with zero or negative carrying amounts, an entity is required to perform Step 2 of the goodwill impairment test if it is more likely than not that a goodwill impairment exists. Step 2 requires an entity to compare the fair value of a reporting unit goodwill with the carrying amount of that goodwill. The implied fair value of goodwill is determined by assigning a fair value to all the assets and liabilities of the reporting unit as if the reporting unit had been acquired in a business combination. The adoption of ASU 2010-28, which became effective for the Company on January 1, 2011, did not have a material impact on the Company’s consolidated financial statements.
In December 2010, FASB issued ASU No. 2010-29 “Business Combination (Topic 805): Disclosure of Supplementary Pro Forma Information for Business Combinations” (“ASU No. 2010-29”). ASU no. 2010-29 specifies that if a public entity presents comparative financial statements, the entity should disclose revenue and earnings of the combined entity as though the business combination(s) that occurred during the current year had occurred as of the beginning of the comparable prior annual reporting period only. ASU No. 2010-29 also expands the supplemental pro forma disclosures to include a description of the nature and amount of material, nonrecurring pro forma adjustments directly attributable to the business combination included in the reported pro forma revenue and earnings. ASU No. 2010-29 is effective prospectively for business combinations for which the acquisition date is on or after the beginning of the first annual reporting period beginning on or after December 15, 2010. The adoption of ASU No. 2010-29 is not expected to have a material impact on the Company’s consolidated financial statements.
In October 2009, the FASB issued authoritative guidance on revenue recognition that became effective for the Company beginning July 1, 2010. Under the new guidance on arrangements that include software elements, tangible products that have software components that are essential to the functionality of the tangible product will no longer be within the scope of the software revenue recognition guidance, and software-enabled products will now be subject to other relevant revenue recognition guidance. Additionally, the FASB issued authoritative guidance on revenue arrangements with multiple deliverables that are outside the scope of the software revenue recognition guidance. Under the new guidance, when vendor specific objective evidence or third party evidence for deliverables in an arrangement cannot be determined, a best estimate of the selling price is required to separate deliverables and allocate arrangement consideration using the relative selling price method. The guidance includes new disclosure requirements on how the application of the relative selling price method affects the timing and amount of revenue recognition. The adoption of this new guidance did not have a material impact on the Company’s consolidated financial position and results of operations.
In June 2009, the FASB finalized guidance in determining whether an enterprise has a controlling financial interest in a variable interest entity. This determination identifies the primary beneficiary of a variable interest entity as the enterprise that has both the power to direct the activities of a variable interest entity that most significantly impacts the entity's economic performance, and the obligation to absorb losses or the right to receive benefits of the entity that could potentially be significant to the variable interest entity. This guidance also requires ongoing reassessments of whether an enterprise is the primary beneficiary and eliminates the quantitative approach previously required for determining the primary beneficiary. New provisions of this guidance were effective July 1, 2010. These changes did not have a material impact on the Company's consolidated financial position and results of operations as the Company does not have variable interest entities.
In June 2009, the FASB issued guidance to improve transparency about transfers of financial assets and a transferor's continuing involvement, if any, with transferred financial assets. This guidance removes the concept of a qualifying special-purpose entity and removes the exception from applying previous guidance to variable interest entities that are qualifying special-purpose entities; limits the circumstances in which a transferor derecognizes a portion or component of a financial asset; defines a participating interest; requires a transferor to recognize and initially measure at fair value all assets obtained and liabilities incurred as a result of a transfer accounted for as a sale; and requires enhanced disclosures. This guidance was adopted for the Company beginning July 1, 2010 and did not have an impact on the Company's consolidated financial position and results of operations.
31
Item 7A. Quantitative and Qualitative Disclosures About Market Risk.
Mediware is subject to market risks from foreign currency fluctuations due to the operations of JAC. During the last three years, Mediware has not held derivative instruments or engaged in other hedging transactions to reduce its exposure to such risks.
Operating in international markets involves exposure to the possibility of volatile movements in foreign exchange rates. The currencies in each of the countries in which JAC operates affect:
|
|
•
|
the results of Mediware’s international operations reported in United States dollars; and
|
|
|
•
|
the value of the net assets of JAC reported in United States dollars.
|
These exposures may impact future earnings or cash flows. Revenue from JAC represented approximately 12% of Mediware’s consolidated revenue in fiscal 2011 and 13% of Mediware’s consolidated revenue in fiscal 2010. The economic impact of foreign exchange rate movements is complex because such changes are often linked to variability in real growth, inflation, interest rates, governmental actions and other factors. These changes, if material, could cause Mediware to adjust its financing and operating strategies. Therefore, to isolate the effect of changes in currency does not accurately portray the effect of these other important economic factors. As foreign exchange rates change, translation of the income statements of JAC into U.S. dollars affects year-over-year comparability of operating results. Any foreign currency impact on translating assets and liabilities into dollars is included as a component of stockholders’ equity. Mediware’s revenue for fiscal year 2011 was positively impacted by approximately $364,000 foreign currency movement, primarily due to the weakening of the United States dollar against the British pound.
32
Item 8. Financial Statements and Supplemental Data.
The Financial Statements and Notes required by this Item are included in this Report starting on page 40.
Item 9. Changes in and Disagreements with Accountants on Accounting and Financial Disclosure.
None.
Item 9A. Controls and Procedures.
Evaluation of Disclosure Controls and Procedures
The Company’s management, under the supervision and with the participation of the Company's Chief Executive Officer and Chief Financial Officer, has reviewed and evaluated the effectiveness of the Company’s disclosure controls and procedures as of June 30, 2011. Disclosure controls and procedures are defined in the Securities Exchange Act as controls and other procedures of the Company designed to ensure that information required to be disclosed by the Company in the reports that it files or submits under the Securities Exchange Act is recorded, processed, summarized and reported, within the time periods specified in the SEC’s rules and forms and include controls and procedures designed to ensure that information required to be disclosed by the Company in the reports that it files or submits to the SEC is accumulated and communicated to the Company’s management, including the CEO and CFO, to allow timely decisions regarding required disclosure. Based on its review and evaluation, the Company’s management has concluded that the Company’s disclosure controls and procedures are effective as of June 30, 2011.
Management’s Report on Internal Control Over Financial Reporting
Management is responsible for establishing and maintaining adequate internal control over financial reporting. Internal control over financial reporting is defined in the Securities Exchange Act as a process designed by, or under the supervision of, the Company’s principal executive and principal financial officers, or persons performing similar functions, and effected by the Company’s board of directors, management and other personnel, to provide reasonable assurance regarding the reliability of financial reporting and the preparation of financial statements for external purposes in accordance with generally accepted accounting principles. Internal control over financial reporting includes those policies and procedures that pertain to the maintenance of records that in reasonable detail, accurately and fairly reflect the transactions and dispositions of the assets of the Company, provide reasonable assurance that transactions are recorded as necessary to permit preparation of financial statements in accordance with generally accepted accounting principles, and that receipts and expenditures of the Company are being made only in accordance with authorizations of the Company’s management and directors and provide reasonable assurance regarding prevention or timely detection of unauthorized acquisition, use or disposition of the Company’s assets that could have a material effect on the financial statements.
The Company’s management, under the supervision and with the participation of the Company’s Chief Executive Officer and Chief Financial Officer, carried out an assessment of the effectiveness of the Company’s internal control over financial reporting as of June 30, 2011. The Company’s management based its evaluation on criteria set forth in the framework in Internal Control—Integrated Framework issued by the Committee of Sponsoring Organizations of the Treadway Commission. Based on that assessment, management has concluded that the Company’s internal control over financial reporting was effective as of June 30, 2011.
This Annual Report on Form 10-K does not include an attestation report of the Company’s independent registered public accounting firm regarding internal control over financial reporting as smaller reporting companies are not required to include such report. Management’s report was not subject to attestation by the Company’s independent registered public accounting firm.
33
Changes in Internal Control Over Financial Reporting
During the quarter ended June 30, 2011, there were no changes in the Company’s internal control over financial reporting that have materially affected, or are reasonably likely to materially affect, the Company’s internal control over financial reporting. Mediware believes that a control system, no matter how well designed and operated, cannot provide absolute assurance that the objectives of the control system are met and no evaluation of controls can provide absolute assurance that all control issues and instances of fraud, if any, within any company have been detected.
Item 9B. Other Information.
On September 1, 2011, the Board of Directors of Mediware adopted Amended and Restated By-Laws of the Company. Through this amendment and restatement, Section 8 of Article II of Mediware’s existing By-laws, which section contains advance notice requirements for shareholders to propose director nominees or business to be included on the agenda of a meeting of shareholders, was modified to change the period in which the Corporation must receive notice of such proposal, to expand the information required from any proponent, including information as to derivative positions, investment intentions and information as to co-operating stockholders, and to require a proponent to update required information as it changes. Additional clarifying and procedural changes were made to this section. These amendments are designed to update the By-Law and to conform Mediware’s By-Laws to those adopted by certain other public-reporting corporations. The Amended and Restated By-Laws were effective as of September 1, 2011.
34
PART III
Item 10. Directors and Executive Officers and Corporate Governance.
The information concerning the Company's executive officers required by this item is incorporated by reference to the Company's Proxy Statement.
Item 11. Executive Compensation.
The information required by this item is incorporated by reference to the Company’s Proxy Statement.
Item 12. Security Ownership of Certain Beneficial Owners and Management and Related Stockholder Matters.
The information required by this item is incorporated by reference to the Company’s Proxy Statement.
Item 13. Certain Relationships and Related Transactions and Director Independence.
The information required by this item is incorporated by reference to the Company’s Proxy Statement.
Item 14. Principal Accountant Fees and Services.
The information required by this item is incorporated by reference to the Company’s Proxy Statement.
35
PART IV
Item 15. Exhibits and Financial Statement Schedules.
(a) The following documents are filed as part of this Report:
1. Consolidated Financial Statements:
Report of Independent Registered Public Accounting Firm
Consolidated Balance Sheets at June 30, 2011 and 2010
Consolidated Statements of Operations and Comprehensive Income for the years ended June 30, 2011, 2010, and 2009
Consolidated Statements of Stockholders' Equity for the years ended June 30, 2011, 2010 and 2009
Consolidated Statements of Cash Flows for the years ended June 30, 2011, 2010 and 2009
Notes to Consolidated Financial Statements
Schedule II – Valuation and Qualification Accounts
EXHIBIT INDEX
|
3.1
|
Restated Certificate of Incorporation.
|
Incorporated by reference to Exhibit No. 4 to the Registration Statement on Form S-8, filed on July 3, 1996.
|
|
|
3.2
|
Certificate of Amendment of the Certificate of Incorporation.
|
Incorporated by reference to Exhibit No. 4.2 to the Registration Statement on Form S-8, filed on October 4, 2004.
|
|
|
3.3
|
By-laws
|
||
|
10.1
|
Mediware Information Systems, Inc. 2001 Stock Option Plan.
|
Incorporated by reference to Appendix A in the Proxy Statement on Schedule 14A, filed on December 31, 2001.
|
|
|
10.2
|
Form of 2001 Mediware Information Systems, Inc. Stock Option Plan Stock Option Agreement.
|
Incorporated by reference to Exhibit 10.15 to the Annual Report on Form 10-K, filed on September 2, 2005.
|
|
|
10.3
|
Form of Amendment to 2001 Mediware Information Systems, Inc. Stock Option Plan Stock Option Agreement.
|
Incorporated by reference to Exhibit 10.59 to the Current Report on Form 8-K, filed on March 25, 2005.
|
|
|
10.4
|
Mediware Information Systems, Inc. Amended and Restated 2003 Equity Incentive Plan.
|
Incorporated by reference to Exhibit 10.4 to the Annual Report on Form 10-K, filed on September 8, 2010.
|
|
|
10.5
|
Form 2003 Mediware Information Systems, Inc. Equity Incentive Plan Stock Option Plan Agreement.
|
Incorporated by reference to Exhibit 10.13 to the Annual Report on Form 10-K, filed on September 2, 2005.
|
36
|
10.6
|
Form of Amendment to 2003 Mediware Information Systems, Inc. Equity Incentive Plan Stock Option Agreement.
|
Incorporated by reference to Exhibit 10.58 to the Current Report on Form 8-K, filed on March 25, 2005.
|
|
|
10.7
|
Employment Agreement dated as of April 18, 2003 between Mediware Information Systems, Inc. and Robert Tysall-Blay.
|
Incorporated by reference to Exhibit 10.2 to the Quarterly Report on Form 10-Q, filed on October 25, 2005.
|
|
|
10.8
|
Employment Agreement effective as of September 1, 2009 between Mediware Information Systems, Inc. and Alan Wittmer.
|
Incorporated by reference to Exhibit 10.15 to the Annual Report on Form 10-K, filed on September 9, 2009.
|
|
|
10.9
|
Employment Agreement effective as of January 11, 2010 between Mediware Information Systems, Inc. and Michael Martens.
|
Incorporated by reference to Exhibit 10.1 to the Current Report on Form 8-K, filed on January 12, 2010.
|
|
|
10.10
|
Form of Michael Martens Mediware Information System 2003 Equity Incentive Plan Stock Option Agreement.
|
Incorporated by reference to Exhibit 10.2 to the Current Report on Form 8-K, filed on January 12, 2010.
|
|
|
10.11
|
Employment Agreement dated May 7, 2010 between Mediware Information Systems, Inc. and Thomas K. Mann.
|
Incorporated by reference to Exhibit 10.1 to the Current Report on Form 8-K, filed on May 13, 2010.
|
|
|
10.12
|
Employment Agreement dated May 7, 2010 between Mediware Information Systems, Inc. and John M. Damgaard.
|
Incorporated by reference to Exhibit 10.2 to the Current Report on Form 8-K, filed on May 13, 2010.
|
|
|
10.13
|
Employment Agreement dated May 7, 2010 between Mediware Information Systems, Inc. and Robert C. Weber.
|
Incorporated by reference to Exhibit 10.3 to the Current Report on Form 8-K, filed on May 13, 2010.
|
|
|
10.14
|
Amended and Restated Purchase Agreement dated December 11, 2009 among Mediware Information Systems, Inc., Advantage Reimbursement, LLC, Healthcare Automation, Inc., Kenneth J. Pereira and David A. Belhumeur.
|
Incorporated by reference to Exhibit 10.1 to the Current Report on Form 8-K, filed on December 15, 2009.
|
|
|
10.15
|
Asset Purchase Agreement dated November 24, 2009 among Advantage Reimbursement, LLC, Advantage Reimbursement, Inc., Kenneth J. Pereira and David A. Belhumeur.
|
Incorporated by reference to Exhibit 10.2 to the Current Report on Form 8-K, filed on November 24, 2009.
|
|
|
10.16
|
Form of Indemnification Agreement among Mediware Information Systems, Inc., Advantage Reimbursement, LLC, Healthcare Automation, Inc., Advantage Reimbursement, Inc., Kenneth J. Pereira and David A. Belhumeur.
|
Incorporated by reference to Exhibit 10.3 to the Current Report on Form 8-K, filed on November 24, 2009.
|
|
|
11
|
Mediware Information Systems, Inc. and Subsidiaries Computation of Net Earnings Per Share.
|
||
|
21
|
List of Subsidiaries.
|
||
|
23
|
Consent of EisnerAmper LLP.
|
||
|
31.1
|
Rule 13a-14(a)/15d-14(a) Certification.
|
||
|
31.2
|
Rule 13a-14(a)/15d-14(a) Certification.
|
||
|
32.1
|
Section 1350 Certification.
|
||
|
32.2
|
Section 1350 Certification.
|
37
SIGNATURES
Pursuant to the requirements of Section 13 or 15(d) of the Securities Exchange Act of 1934, the registrant has duly caused this report to be signed on its behalf by the undersigned, thereunto duly authorized.
MEDIWARE INFORMATION SYSTEMS, INC.
|
Date: September 7, 2011
|
BY:
|
/s/ T. KELLY MANN
|
|
T. KELLY MANN
|
||
|
President and Chief Executive Officer
|
Pursuant to the requirements of the Securities Exchange Act of 1934, this report has been signed below by the following persons on behalf of the registrant and in the capacities and on the dates indicated.
|
Signature
|
Title
|
|||
|
/s/ T. KELLY MANN
|
President, Chief Executive Officer & Director
|
September 7, 2011
|
||
|
T. KELLY MANN
|
(Principal Executive Officer)
|
|||
|
/s/ MICHAEL MARTENS
|
Chief Financial Officer
|
September 7, 2011
|
||
|
MICHAEL MARTENS
|
(Principal Accounting Officer)
|
|||
|
/s/ LAWRENCE AURIANA
|
Chairman of the Board
|
September 7, 2011
|
||
|
LAWRENCE AURIANA
|
||||
|
/s/ ROGER CLARK
|
Director
|
September 7, 2011
|
||
|
ROGER CLARK
|
||||
|
/s/ DR. JOHN GORMAN
|
Director
|
September 7, 2011
|
||
|
DR. JOHN GORMAN
|
||||
|
/s/ RICHARD GRECO
|
Director
|
September 7, 2011
|
||
|
THE HONORABLE RICHARD GRECO
|
||||
|
/s/ IRA NORDLICHT
|
Director
|
September 7, 2011
|
||
|
IRA NORDLICHT
|
||||
|
/s/ ROBERT SANVILLE
|
Director
|
September 7, 2011
|
||
|
ROBERT SANVILLE
|
||||
|
/s/ PHILIP COELHO
|
Director
|
September 7, 2011
|
||
|
PHILIP COELHO
|
||||
38
REPORT OF INDEPENDENT REGISTERED PUBLIC ACCOUNTING FIRM
The Board of Directors and Stockholders of
Mediware Information Systems, Inc.
We have audited the accompanying consolidated balance sheets of Mediware Information Systems, Inc. (the “Company”) as of June 30, 2011 and 2010 and the related consolidated statements of operations and comprehensive income, stockholders' equity and cash flows for each of the years in the three-year period ended June 30, 2011. Our audits also included the financial statement schedule listed in the Index at Item 15(a). These consolidated financial statements and schedule are the responsibility of the Company's management. Our responsibility is to express an opinion on these consolidated financial statements and schedule based on our audits.
We conducted our audits in accordance with the standards of the Public Company Accounting Oversight Board (United States). Those standards require that we plan and perform the audit to obtain reasonable assurance about whether the financial statements are free of material misstatement. We were not engaged to perform an audit of the Company’s internal control over financial reporting. Our audits include consideration of internal control over financial reporting as a basis for designing audit procedures that are appropriate in the circumstances, but not for the purpose of expressing an opinion on the effectiveness of the Company’s internal control over financial reporting. Accordingly, we express no such opinion. An audit includes examining, on a test basis, evidence supporting the amounts and disclosures in the consolidated financial statements, assessing the accounting principles used and significant estimates made by management, and evaluating the overall financial statement presentation. We believe that our audits provide a reasonable basis for our opinion.
In our opinion, the financial statements referred to above present fairly, in all material respects, the consolidated financial position of Mediware Information Systems, Inc. as of June 30, 2011 and 2010, and the consolidated results of its operations and its consolidated cash flows for each of the years in the three-year period ended June 30, 2011, in conformity with accounting principles generally accepted in the United States of America. Also, in our opinion, the related financial statement schedule, when considered in relation to the consolidated financial statements taken as a whole, presents fairly, in all material respects, the information set forth therein.
/s/ EisnerAmper LLP
New York, New York
September 6, 2011
39
MEDIWARE INFORMATION SYSTEMS, INC.
CONSOLIDATED BALANCE SHEETS
(in thousands, except share data)
|
June 30,
|
June 30,
|
|||||||
|
2011
|
2010
|
|||||||
|
ASSETS
|
||||||||
|
Current Assets
|
||||||||
|
Cash and cash equivalents
|
$ | 29,987 | $ | 23,340 | ||||
|
Accounts receivable (net of allowance of $1,434 in 2011 and $1,090 in 2010)
|
19,831 | 13,334 | ||||||
|
Inventories
|
408 | 375 | ||||||
|
Deferred income taxes
|
866 | 748 | ||||||
|
Prepaid expenses and other current assets
|
1,302 | 986 | ||||||
|
Total current assets
|
52,394 | 38,783 | ||||||
|
Fixed assets, net
|
1,060 | 1,369 | ||||||
|
Capitalized software costs, net
|
12,909 | 12,352 | ||||||
|
Goodwill, net
|
13,587 | 13,188 | ||||||
|
Other intangible assets, net
|
6,774 | 5,403 | ||||||
|
Other long-term assets
|
86 | 90 | ||||||
|
Total Assets
|
$ | 86,810 | $ | 71,185 | ||||
|
LIABILITIES AND STOCKHOLDERS' EQUITY
|
||||||||
|
Current Liabilities
|
||||||||
|
Accounts payable
|
$ | 1,134 | $ | 1,409 | ||||
|
Deferred revenue
|
20,975 | 12,715 | ||||||
|
Income taxes payable
|
757 | 613 | ||||||
|
Contingent consideration payable
|
- | 1,432 | ||||||
|
Accrued expenses and other current liabilities
|
4,783 | 3,888 | ||||||
|
Total current liabilities
|
27,649 | 20,057 | ||||||
|
Deferred income taxes
|
4,189 | 4,428 | ||||||
|
Total liabilities
|
31,838 | 24,485 | ||||||
|
Commitments and Contingencies (Note 10)
|
||||||||
|
Stockholders' Equity
|
||||||||
|
Common stock, $.10 par value; authorized 25,000,000 shares; 8,693,000 and 8,557,000 shares issued as of June 30, 2011 and 2010, respectively
|
869 | 855 | ||||||
|
Additional paid-in capital
|
36,069 | 34,108 | ||||||
|
Treasury stock, 608,000 and 590,000 shares at June 30, 2011 and 2010, respectively
|
(3,698 | ) | (3,503 | ) | ||||
|
Retained earnings
|
21,971 | 15,679 | ||||||
|
Accumulated other comprehensive loss
|
(239 | ) | (439 | ) | ||||
|
Total stockholders' equity
|
54,972 | 46,700 | ||||||
|
Total Liabilities and Stockholders' Equity
|
$ | 86,810 | $ | 71,185 | ||||
See Notes to Consolidated Financial Statements.
40
MEDIWARE INFORMATION SYSTEMS, INC.
CONSOLIDATED STATEMENTS OF OPERATIONS AND COMPREHENSIVE INCOME
(in thousands, except earnings per share data)
|
For the Years Ended June 30,
|
||||||||||||
|
2011
|
2010
|
2009
|
||||||||||
|
Revenue:
|
||||||||||||
|
System sales
|
$ | 14,413 | $ | 10,918 | $ | 10,091 | ||||||
|
Services
|
41,110 | 36,698 | 30,594 | |||||||||
|
Total revenue
|
55,523 | 47,616 | 40,685 | |||||||||
|
Cost and Expenses:
|
||||||||||||
|
Cost of system sales (1)
|
3,775 | 3,558 | 3,766 | |||||||||
|
Cost of services (1)
|
14,658 | 12,073 | 10,379 | |||||||||
|
Amortization of capitalized software costs
|
4,586 | 4,966 | 5,843 | |||||||||
|
Software development costs
|
4,478 | 4,916 | 3,942 | |||||||||
|
Selling general and administrative
|
19,086 | 17,486 | 14,605 | |||||||||
|
Total costs and expenses
|
46,583 | 42,999 | 38,535 | |||||||||
|
Operating income
|
8,940 | 4,617 | 2,150 | |||||||||
|
Net interest and other (expense) income
|
(43 | ) | 41 | 347 | ||||||||
|
Income before income taxes
|
8,897 | 4,658 | 2,497 | |||||||||
|
Income tax expense
|
(2,605 | ) | (1,416 | ) | (923 | ) | ||||||
|
Net income
|
6,292 | 3,242 | 1,574 | |||||||||
|
Other comprehensive income (loss):
|
||||||||||||
|
Foreign currency translation adjustment
|
200 | (249 | ) | (299 | ) | |||||||
|
Comprehensive income
|
$ | 6,492 | $ | 2,993 | $ | 1,275 | ||||||
|
Net income per Common Share
|
||||||||||||
|
Basic
|
$ | 0.79 | $ | 0.41 | $ | 0.21 | ||||||
|
Diluted
|
$ | 0.77 | $ | 0.41 | $ | 0.20 | ||||||
|
Weighted Average Common Shares Outstanding
|
||||||||||||
|
Basic
|
8,012 | 7,838 | 7,651 | |||||||||
|
Diluted
|
8,193 | 7,958 | 7,967 | |||||||||
(1) Excludes amortization of capitalized software costs
See Notes to Consolidated Financial Statements.
41
MEDIWARE INFORMATION SYSTEMS, INC.
CONSOLIDATED STATEMENTS OF STOCKHOLDERS' EQUITY
For the Years Ended June 30, 2011, 2010 and 2009
(in thousands)
|
Common Stock
|
Additional
Paid-In
Capital
|
Treasury
Stock
|
Retained
Earnings
|
Accumulated Other Comprehensive Income (Loss)
|
Total
|
||||||||||||||||||||||||
|
Shares
|
Amount
|
||||||||||||||||||||||||||||
|
|
Balance at June 30, 2008
|
8,180 | $ | 818 | $ | 31,419 | $ | (3,318 | ) | $ | 10,863 | $ | 109 | $ | 39,891 | ||||||||||||||
|
Exercise of stock options
|
31 | 3 | 91 | 94 | |||||||||||||||||||||||||
|
Repurchase of common stock
|
(185 | ) | (185 | ) | |||||||||||||||||||||||||
|
Stock based compensation expense
|
72 | 7 | 795 | 802 | |||||||||||||||||||||||||
|
Tax benefit related to stock-based compensation
|
20 | 20 | |||||||||||||||||||||||||||
|
Foreign currency translation adjustment
|
(299 | ) | (299 | ) | |||||||||||||||||||||||||
|
Net income
|
1,574 | 1,574 | |||||||||||||||||||||||||||
|
Balance at June 30, 2009
|
8,283 | 828 | 32,325 | (3,503 | ) | 12,437 | (190 | ) | 41,897 | ||||||||||||||||||||
|
Exercise of stock options
|
183 | 18 | 910 | 928 | |||||||||||||||||||||||||
|
Stock based compensation expense
|
91 | 9 | 706 | 715 | |||||||||||||||||||||||||
|
Tax benefit related to stock-based compensation
|
167 | 167 | |||||||||||||||||||||||||||
|
Foreign currency translation adjustment
|
(249 | ) | (249 | ) | |||||||||||||||||||||||||
|
Net income
|
3,242 | 3,242 | |||||||||||||||||||||||||||
|
|
Balance at June 30, 2010
|
8,557 | 855 | 34,108 | (3,503 | ) | 15,679 | (439 | ) | 46,700 | |||||||||||||||||||
|
Exercise of stock options
|
62 | 6 | 519 | 525 | |||||||||||||||||||||||||
|
Issuance of common stock on vesting of restricted shares
|
74 | 8 | (8 | ) | - | ||||||||||||||||||||||||
|
Repurchase of common stock
|
(195 | ) | (195 | ) | |||||||||||||||||||||||||
|
Stock based compensation expense
|
1,328 | 1,328 | |||||||||||||||||||||||||||
|
Tax benefit related to stock-based compensation
|
122 | 122 | |||||||||||||||||||||||||||
|
Foreign currency translation adjustment
|
200 | 200 | |||||||||||||||||||||||||||
|
Net income
|
6,292 | 6,292 | |||||||||||||||||||||||||||
|
Balance at June 30, 2011
|
8,693 | $ | 869 | $ | 36,069 | $ | (3,698 | ) | $ | 21,971 | $ | (239 | ) | $ | 54,972 | ||||||||||||||
See Notes to Consolidated Financial Statements.
42
MEDIWARE INFORMATION SYSTEMS, INC.
CONSOLIDATED STATEMENTS OF CASH FLOWS
(in thousands)
|
For the Years Ended June 30,
|
||||||||||||
|
2011
|
2010
|
2009
|
||||||||||
|
Cash Flows From Operating Activities
|
||||||||||||
|
Net income
|
$ | 6,292 | $ | 3,242 | $ | 1,574 | ||||||
|
Adjustments to reconcile net income, to net cash provided by operating activities:
|
||||||||||||
|
Depreciation and amortization
|
6,514 | 6,697 | 6,953 | |||||||||
|
Loss / (gain) on disposal of fixed assets
|
21 | 11 | (24 | ) | ||||||||
|
Deferred tax provision
|
(126 | ) | (497 | ) | 245 | |||||||
|
Stock based compensation expense
|
1,328 | 715 | 802 | |||||||||
|
Provision for doubtful accounts
|
561 | 583 | 197 | |||||||||
|
Changes in operating assets and liabilities, net of effect of acquisitions:
|
||||||||||||
|
Accounts receivable
|
(5,895 | ) | (1,807 | ) | (1,741 | ) | ||||||
|
Inventories
|
(22 | ) | (180 | ) | (94 | ) | ||||||
|
Prepaid expenses and other assets
|
(219 | ) | 230 | (188 | ) | |||||||
|
Accounts payable, accrued expenses and advances from customers
|
6,481 | 2,807 | 1,011 | |||||||||
|
Net cash provided by operating activities
|
14,935 | 11,801 | 8,735 | |||||||||
|
Cash Flows From Investing Activities
|
||||||||||||
|
Acquisition of fixed assets
|
(294 | ) | (223 | ) | (609 | ) | ||||||
|
Proceeds from disposal of fixed assets
|
- | - | 47 | |||||||||
|
Capitalized software costs
|
(5,143 | ) | (3,820 | ) | (3,829 | ) | ||||||
|
Acquisition of businesses, net of cash acquired
|
(3,584 | ) | (6,081 | ) | (5,570 | ) | ||||||
|
Net cash used in investing activities
|
(9,021 | ) | (10,124 | ) | (9,961 | ) | ||||||
|
Cash Flows From Financing Activities
|
||||||||||||
|
Proceeds from exercise of stock options
|
525 | 928 | 94 | |||||||||
|
Excess tax benefits from exercise of stock options and vesting of restricted stock
|
122 | 167 | 20 | |||||||||
|
Repurchase of common stock
|
(195 | ) | - | (185 | ) | |||||||
|
Net cash provided by (used in) financing activities
|
452 | 1,095 | (71 | ) | ||||||||
|
Foreign currency translation adjustments
|
281 | (297 | ) | (579 | ) | |||||||
|
Net change in cash and cash equivalents
|
6,647 | 2,475 | (1,876 | ) | ||||||||
|
Cash and cash equivalents at beginning of year
|
23,340 | 20,865 | 22,741 | |||||||||
|
Cash and cash equivalents at end of year
|
$ | 29,987 | $ | 23,340 | $ | 20,865 | ||||||
|
Supplemental disclosures of cash flow information:
|
||||||||||||
|
Cash paid during the period for:
|
||||||||||||
|
Income taxes
|
$ | 2,858 | $ | 2,118 | $ | 759 | ||||||
|
Supplemental disclosures of noncash investing and financing activities:
|
||||||||||||
|
Reduction of goodwill recorded for tax benefit of related amortization
|
$ | 232 | $ | 232 | $ | 232 | ||||||
See Notes to Consolidated Financial Statements.
43
MEDIWARE INFORMATION SYSTEMS, INC.
NOTES TO CONSOLIDATED FINANCIAL STATEMENTS
1. THE COMPANY AND A SUMMARY OF SIGNIFICANT ACCOUNTING POLICIES
The Company
Mediware Information Systems, Inc. and subsidiaries (“Mediware” or the “Company”) develops, markets, licenses, implements and supports clinical management and performance management information software systems used primarily by hospitals, long-term care, alternative care and behavioral health facilities and blood and blood plasma centers. The Company's systems are generally designed to automate certain clinical departments of a hospital, namely, the blood bank and pharmacy, to serve blood and plasma centers and other health facilities and to provide performance information to hospital management. A system consists of the Company's proprietary application software, third-party licensed software, computer hardware and implementation services, training and annual software support.
Principles of Consolidation
The accompanying consolidated financial statements include the accounts of Mediware Information Systems, Inc. and its wholly owned subsidiaries, Mediware Blood Management LLC, Mediware Medication Management LLC, Mediware Clinical Management LLC, Mediware Alternate Care Solutions, Inc., Advantage Reimbursement LLC, Digimedics Corporation, Informedics, Inc. and Digimedics Corporation’s wholly owned subsidiary J.A.C. Computer Services, Ltd. (“JAC”). All significant inter-company transactions and balances have been eliminated in consolidation.
Use of Estimates
The preparation of financial statements in conformity with accounting principles generally accepted in the United States of America requires management to make estimates and assumptions that affect the amounts reported in the consolidated financial statements and related notes to financial statements. Actual results could differ from those estimates. The Company’s significant areas of estimation include determining the allowance for uncollectible accounts, valuing certain accrued liabilities and determining whether the carrying value of goodwill and capitalized software development costs is impaired.
Revenue Recognition
The Company derives revenue from licensing its proprietary applications software and sublicensed software, sale of computer hardware, transaction fees from software use, and the services performed related to the installation, configuration, training, consultation and ongoing support of the software. Software license revenue that is not subscription or term license-based is generally recognized when evidence of an arrangement exists, delivery has occurred, the fee is fixed or determinable, collectability is probable, vendor-specific objective evidence of the fair value of any undelivered element exists, and no other significant obligations on the part of the Company remain. For its subscription products, Mediware recognizes start-up fee revenue upon completion of the customer installment and configuration services associated with the fee. Monthly subscription fees for software and maintenance are recognized ratably over the subscription period. The Company combines the software and maintenance associated with the subscription fee into a single element for purposes of applying revenue recognition principles, as the Company does not sell software subscriptions or maintenance services on a standalone basis. Revenue from the sale of hardware is generally recognized upon shipment. Fees for installation, training and consultation are recognized as the services are provided. Support and maintenance fees, typically sold on an annual renewal basis, are recognized ratably over the period of the support contract.
The Company considers many factors when applying accounting principles generally accepted in the United States of America related to revenue recognition. These factors include, but are not limited to:
|
|
-
|
contract terms, such as payment terms, delivery dates, and pricing of the various product and service elements of a contract
|
|
|
-
|
availability of products to be delivered
|
|
|
-
|
time period over which services are to be performed
|
|
|
-
|
creditworthiness of the customer
|
|
|
-
|
the complexity of customizations and integrations to the Company’s software required by service contracts
|
|
|
-
|
discounts given for each element of a contract and
|
|
|
-
|
any commitments made as to project milestones
|
Each of the relevant factors is analyzed to determine its impact, individually and collectively with other factors, on the revenue to be recognized. Management is required to make judgments regarding the significance of each factor in applying the revenue recognition standards, as well as whether or not each factor complies with such standards. Any misjudgment or error by management in its evaluation of the factors and the application of the standards, especially with respect to complex or new types of transactions, could have a material adverse affect on the Company’s future revenues and operating results.
44
If the Company enters into an arrangement with a client requiring significant customization of the software or services that are essential to the functionality of the software, the Company recognizes revenue derived from the sale of licensed software, sublicensed software and services over the period the services are performed, in accordance with the accounting guidance for construction-type contracts.
In addition, the Company is recognizing revenues on large, fixed fee contracts entered into in fiscal 2011 on a percentage of completion basis based upon the ratio of the effort completed during the reporting period compared to its estimate of the total effort required to complete the project. Percentage-of-completion is measured based primarily on input measures such as hours incurred to date compared to estimated total hours at completion, with consideration given to output measures, such as contract milestones, when applicable. Significant judgment is required when estimating total hours and progress to completion on these arrangements which determines the amount of revenue we recognize as well as whether a loss is recognized if expected to be incurred upon project completion. The Company is required to recognize the entire anticipated loss immediately as soon as it becomes evident. Revisions to hour and cost estimates are incorporated in the period the amounts are recognized if the results of the period have not been reported; otherwise, the revision of estimates are recognized in the period in which the facts that give rise to the revision become known.
Advertising Costs
Costs of advertising are expensed as incurred and amounted to $772,000, $685,000 and $655,000 for the years ended June 30, 2011, 2010 and 2009, respectively.
Cash and Cash Equivalents
The Company considers all highly liquid investments purchased with an original maturity of three months or less to be cash equivalents.
Accounts Receivable
The Company extends payment terms to customers who meet pre-established credit requirements. Generally, the Company does not require collateral when trade credit is granted to customers. Accounts receivable represent recorded revenues that have been billed or that are billable by us at future dates under the terms of a contract with a client. Billings and other consideration received on contracts in excess of related revenues recognized are recorded as advances from customers within deferred revenue. Prior to March 31, 2011 the Company offset advances from customers related to ongoing project work from accounts receivable. At June 30, 2011, the Company has included such amounts within deferred revenue. The June 30, 2010 presentation has been reclassified to conform to this presentation. This reclassification had no impact on the Company's condensed consolidated stockholders' equity, net cash provided by operating activities, or Statements of Operations and Comprehensive Income.
Accounts receivable consisted of the following at June 30 (in thousands):
|
2011
|
2010
|
|||||||
|
Billed
|
$ | 16,822 | $ | 10,930 | ||||
|
Unbilled
|
3,009 | 2,404 | ||||||
|
Total accounts receivable
|
$ | 19,831 | $ | 13,334 | ||||
Allowance for Doubtful Accounts
The Company sells its products directly to end-users, generally requiring an up-front payment with the remaining payments due over time. Receivables from customers are generally unsecured. The Company regularly monitors its customer account balances and actively pursues collections on past due balances.
The Company maintains an allowance for doubtful accounts based on historical collections and specific collection issues. If actual bad debts differ from the reserves calculated, the Company records an adjustment to bad debt expense in the period in which the difference occurs. Such adjustment could result in additional charges to the Company’s results of operations.
45
Inventory
Inventory consists primarily of third-party software licenses and computer hardware held for resale. Both are valued at the lower of cost (first-in, first-out or “FIFO”) or market. Cost is determined based on the specific identification method. Inventory consists of the following at June 30 (in thousands):
|
2011
|
2010
|
|||||||
|
Software Licenses
|
$ | 278 | $ | 298 | ||||
|
Computer Hardware
|
130 | 77 | ||||||
| $ | 408 | $ | 375 | |||||
Fixed Assets
Furniture, equipment and leasehold improvements are recorded at cost. Depreciation for furniture and equipment is provided on the straight-line method over their estimated useful lives, which are generally three to five years. Leasehold improvements are amortized over the lesser of their estimated useful lives or the remaining lease period.
Capitalized Software Costs
Capitalized computer software costs consist of expenses incurred in creating and developing computer software products. In accordance with GAAP, once technological feasibility has been established the costs associated with software development are capitalized and subsequently reported at the lower of unamortized cost or net realizable value. Capitalized costs are amortized based on estimated current and future revenue for each product with an annual minimum equal to the straight-line amortization over the estimated economic life of the software, which ranges from five to seven years. Amortization expense for the years ended June 30, 2011, 2010 and 2009 was $4,586,000, $4,966,000 and $5,843,000, respectively. Capitalized software costs consisted of the following activity (in thousands):
|
For the Year Ended June 30,
|
||||||||
|
2011
|
2010
|
|||||||
|
Beginning of year
|
$ | 57,780 | $ | 53,960 | ||||
|
Additions
|
5,143 | 3,820 | ||||||
| 62,923 | 57,780 | |||||||
|
Less accumulated amortization
|
(50,014 | ) | (45,428 | ) | ||||
| $ | 12,909 | $ | 12,352 | |||||
Goodwill and Other Intangible Assets
Accounting guidance requires that goodwill and identifiable intangible assets be tested for impairment at least annually or more often if events and circumstances warrant. The Company evaluates goodwill for impairment by comparing the fair value of the Company, a single reporting unit, to its carrying value including goodwill. To determine fair value in the current evaluation the Company used the income approach under which the Company calculates fair value based on the estimated discounted cash flow method as well as other generally accepted methodologies. The Company’s cash flow assumptions are based on historical and forecasted revenue, operating costs, and other relevant factors. No impairment was indicated by the Company’s analysis as of June 30, 2011. Accounting guidance also requires that intangible assets with finite useful lives be amortized over their respective estimated useful lives and reviewed for impairment. As of June 30, 2011, management believes no such impairment has occurred.
Goodwill represents the excess of purchase price over the fair value of the assets acquired. These business acquisitions include Digimedics Corporation in May 1990, Informedics, Inc. in September 1998, certain assets of Information Handling Services Group, including its Pharmakon and JAC divisions, in June 1996, certain assets of Integrated Marketing Solutions, LLC (“IMS”) in October 2007, certain assets of Hann’s On Software, Inc. (“HOS”) in November 2008, certain assets of SciHealth, Inc. in June 2009, certain assets of Advantage Reimbursement, Inc. (“ARI”) and the stock of Healthcare Automation, Inc. (“HAI”) acquired in December 2009, and certain assets of CareCentric, Inc. acquired in April 2011. Goodwill was reduced by certain income tax benefits amounting to $232,000 for each of the years ending June 30, 2011 and 2010.
Foreign Currency Translations
The functional currency for the Company's JAC subsidiary is the British pound. Assets and liabilities of JAC are translated to U.S. dollars using the exchange rate in effect at the balance sheet date. Results of operations are translated using weighted average exchange rates during the year. The net gain or loss resulting from these foreign currency translations is reported as other comprehensive income or loss in the accompanying consolidated financial statements. The Company recorded a foreign currency translation gain of $200,000 in 2011 and losses of $249,000 and $299,000 in 2010 and 2009, respectively.
46
Income Taxes
Income taxes are accounted for under the asset and liability method in accordance with accounting guidance. Accordingly, the provision for income taxes includes deferred income taxes resulting from items reported in different periods for income tax and financial statement purposes. Deferred tax assets and liabilities represent the expected future tax consequences of the timing differences between the financial statement carrying amounts of existing assets and liabilities and their respective tax bases. Deferred tax assets and liabilities are measured using enacted tax rates in effect at the balance sheet date. The resulting asset or liability is adjusted to reflect enacted changes in the tax law.
Earnings Per Common Share
Basic earnings per share is computed by dividing the income available to common shareholders by the weighted average number of common shares outstanding. Diluted earnings per share include the dilutive effect, if any, from the potential exercise of stock options using the treasury stock method, as well as the dilutive effect from outstanding restricted common stock awards. The weighted average shares outstanding used in the calculations of earnings per share were as follows (in thousands):
|
For the Year Ended June 30,
|
||||||||||||
|
2011
|
2010
|
2009
|
||||||||||
|
Shares outstanding, beginning
|
7,967 | 7,694 | 7,631 | |||||||||
|
Weighted average shares issued
|
60 | 144 | 42 | |||||||||
|
Weighted average shares repurchased
|
(15 | ) | - | (22 | ) | |||||||
|
Weighted average shares outstanding – basic
|
8,012 | 7,838 | 7,651 | |||||||||
|
Effect of dilutive securities
|
181 | 120 | 316 | |||||||||
|
Weighted average shares outstanding – diluted
|
8,193 | 7,958 | 7,967 | |||||||||
Potential common shares not included in the calculation of net income per share, as their effect would be anti-dilutive, are as follows (in thousands):
|
For the Year Ended June 30,
|
||||||||||||
|
2011
|
2010
|
2009
|
||||||||||
|
Stock Options
|
387 | 358 | 784 | |||||||||
Fair Value of Financial Instruments
The carrying values of cash and cash equivalents, accounts receivable, accounts payable and accrued expenses approximate their fair value due to their relatively short term maturity.
Stock-Based Compensation
The Company measures stock-based compensation at the grant date and recognizes compensation expense over the requisite service period.
Comprehensive Income
Total comprehensive income represents the net change in stockholders’ equity during a period from sources other than transactions with stockholders and, as such, includes net income and other specified components. The only component of comprehensive income other than net income for the Company is the change in the cumulative foreign currency translation adjustments recorded in stockholders’ equity.
Recently Issued Accounting Guidance
In June 2011, the Financial Accounting Standards Board (“FASB”) issued Accounting Standards Update No. 2011-05 “Comprehensive Income (Topic 220): Presentation of Comprehensive Income” (“ASU No. 2011-05”). Under ASU No. 2011-5, an entity has the option to present the total of comprehensive income, the components of net income, and the components of other comprehensive income either in a single continuous statement of comprehensive income or in two separate but consecutive statements. In both choices, an entity is required to present each component of net income along with total net income, each component of other comprehensive income along with a total for other comprehensive income, and a total amount for comprehensive income. ASU No. 2011-5 eliminates the option to present the components of other comprehensive income as part of the statement of changes in stockholders’ equity. ASU No. 2011-5 is effective for fiscal years, and interim periods within those years, beginning after December 15, 2011 and effects the presentation of financial statements and thus will have no impact on the Company’s consolidated financial statements.
47
In December 2010, the FASB issued ASU No. 2010-28, “When to Perform Step 2 of the Goodwill Impairment Test for Reporting Units with Zero or Negative Carrying Amounts” (“ASU 2010-28”). ASU 2010-28 modifies Step 1 of the goodwill impairment test, which requires an entity to compare the fair value of a reporting unit with its carrying amount, including goodwill. For reporting units with zero or negative carrying amounts, an entity is required to perform Step 2 of the goodwill impairment test if it is more likely than not that a goodwill impairment exists. Step 2 requires an entity to compare the fair value of a reporting unit goodwill with the carrying amount of that goodwill. The implied fair value of goodwill is determined by assigning a fair value to all the assets and liabilities of the reporting unit as if the reporting unit had been acquired in a business combination. The adoption of ASU 2010-28, which became effective for the Company on January 1, 2011, did not have a material impact on the Company’s consolidated financial statements.
In December 2010, FASB issued ASU No. 2010-29 “Business Combination (Topic 805): Disclosure of Supplementary Pro Forma Information for Business Combinations” (“ASU No. 2010-29”). ASU no. 2010-29 specifies that if a public entity presents comparative financial statements, the entity should disclose revenue and earnings of the combined entity as though the business combination(s) that occurred during the current year had occurred as of the beginning of the comparable prior annual reporting period only. ASU No. 2010-29 also expands the supplemental pro forma disclosures to include a description of the nature and amount of material, nonrecurring pro forma adjustments directly attributable to the business combination included in the reported pro forma revenue and earnings. ASU No. 2010-29 is effective prospectively for business combinations for which the acquisition date is on or after the beginning of the first annual reporting period beginning on or after December 15, 2010. The adoption of ASU No. 2010-29 is not expected to have a material impact on the Company’s consolidated financial statements.
In October 2009, the FASB issued authoritative guidance on revenue recognition that became effective for the Company beginning July 1, 2010. Under the new guidance on arrangements that include software elements, tangible products that have software components that are essential to the functionality of the tangible product will no longer be within the scope of the software revenue recognition guidance, and software-enabled products will now be subject to other relevant revenue recognition guidance. Additionally, the FASB issued authoritative guidance on revenue arrangements with multiple deliverables that are outside the scope of the software revenue recognition guidance. Under the new guidance, when vendor specific objective evidence or third party evidence for deliverables in an arrangement cannot be determined, a best estimate of the selling price is required to separate deliverables and allocate arrangement consideration using the relative selling price method. The guidance includes new disclosure requirements on how the application of the relative selling price method affects the timing and amount of revenue recognition. The adoption of this new guidance did not have a material impact on the Company’s consolidated financial position and results of operations.
In June 2009, the FASB finalized guidance in determining whether an enterprise has a controlling financial interest in a variable interest entity. This determination identifies the primary beneficiary of a variable interest entity as the enterprise that has both the power to direct the activities of a variable interest entity that most significantly impacts the entity's economic performance, and the obligation to absorb losses or the right to receive benefits of the entity that could potentially be significant to the variable interest entity. This guidance also requires ongoing reassessments of whether an enterprise is the primary beneficiary and eliminates the quantitative approach previously required for determining the primary beneficiary. New provisions of this guidance were effective July 1, 2010. These changes did not have a material impact on the Company's consolidated financial position and results of operations as the Company does not have variable interest entities.
In June 2009, the FASB issued guidance to improve transparency about transfers of financial assets and a transferor's continuing involvement, if any, with transferred financial assets. This guidance removes the concept of a qualifying special-purpose entity and removes the exception from applying previous guidance to variable interest entities that are qualifying special-purpose entities; limits the circumstances in which a transferor derecognizes a portion or component of a financial asset; defines a participating interest; requires a transferor to recognize and initially measure at fair value all assets obtained and liabilities incurred as a result of a transfer accounted for as a sale; and requires enhanced disclosures. This guidance was adopted for the Company beginning July 1, 2010 and did not have an impact on the Company's consolidated financial position and results of operations.
48
2. FIXED ASSETS
Fixed assets at cost less accumulated depreciation and amortization are summarized as follows (in thousands):
|
As of June 30,
|
|||||||||
|
2011
|
2010
|
Estimated Useful Life
|
|||||||
|
Computers and office equipment
|
$ | 4,650 | $ | 4,634 |
3-5 Years
|
||||
|
Furniture and fixtures
|
1,273 | 1,034 |
5 Years
|
||||||
|
Leasehold improvements
|
507 | 488 |
5-7 Years
|
||||||
| 6,430 | 6,156 | ||||||||
|
Less accumulated depreciation
|
(5,370 | ) | (4,787 | ) | |||||
| $ | 1,060 | $ | 1,369 | ||||||
Depreciation expense was $592,000, $644,000 and $681,000 in 2011, 2010 and 2009, respectively.
3. DEFERRED REVENUE
Deferred revenue includes unearned revenue related to performance obligations where the Company has collected cash from customers in advance of providing services. It also includes liabilities related to the achievement of billing milestones that are invoiced before some or all of the services are provided.
4. ACQUISITIONS
CareCentric, Inc.
On April 11, 2011, Mediware acquired certain assets of the home medical equipment, home health, home infusion and billing and collections business of CareCentric National LLC ("CareCentric").
The acquisition expands Mediware's already substantial position in the Alternate Care Solutions (ACS) market. The CareCentric business has been integrated with Mediware's existing ACS business line.
The purchase price paid for CareCentric consists of an initial purchase price of $3,000,000, of which $2,084,000 was paid in cash. The purchase price is also subject to a working capital adjustment. As of June 30, 2011, the Company has recorded a working capital adjustment of $916,000 and will record the final working capital adjustment in the first quarter of fiscal 2012. The Company incurred $27,000 of legal, accounting and other professional fees related to this transaction, which were expensed. The results of the CareCentric operations are included in the accompanying financial statements from the date of acquisition. From the date of acquisition through June 30, 2011, CareCentric has contributed $1,620,000 in total revenue which is included in the accompanying financial statements.
The Company has accounted for the CareCentric transaction as a business acquisition under the accounting guidance. The assets acquired and liabilities assumed of CareCentric were recorded as of the acquisition date, at their respective fair values. The preparation of the valuation required the use of significant assumptions and estimates. These estimates were based on assumptions that the Company believes to be reasonable.
The following summarizes the assets acquired and liabilities assumed at the acquisition date, net of cash acquired (in thousands):
|
Purchase Price Allocation
|
||||
|
Intangible assets subject to amortization
|
$ | 2,707 | ||
|
Goodwill
|
631 | |||
|
Accounts receivable
|
1,038 | |||
|
Prepaid expenses and inventory
|
84 | |||
|
Accounts payable
|
(120 | ) | ||
|
Deferred revenue
|
(2,256 | ) | ||
|
Total purchase price
|
$ | 2,084 | ||
49
Details of acquired intangibles and goodwill are as follows (in thousands):
|
Amount Assigned
|
Weighted Average Amortization Period
|
Risk-Adjusted
Discount Rate
Used in Purchase Price
Allocation
|
|||||||
|
Amortizable Intangible Assets
|
|||||||||
|
Purchased technology
|
$
|
1,302
|
5.0 years
|
35.0%
|
|||||
|
Customer relationships
|
997
|
5.0 years
|
35.0%
|
||||||
|
Customer relationships
|
371
|
6.0 years
|
22.5%
|
||||||
|
Customer Backlog
|
26
|
1 month
|
22.5%
|
||||||
|
Tradename
|
11
|
4.0 years
|
35.0%
|
||||||
|
$
|
2,707
|
||||||||
|
Goodwill
|
$
|
631
|
|||||||
The Company valued the purchased technology using the excess earnings method of the income approach. Utilizing this approach, the Company projected revenue and related expenses. These projected income amounts were then reduced by the return on contributory assets and discounted to present value. This method requires the use of certain estimates, including revenue growth rates, technology replacement rates, customer attrition, expenses, contributory asset charges and discount rates. Based on this methodology the Company assigned the value of purchased technology at $1,302,000. The Company will amortize this amount over the estimated useful life of five years.
The Company valued the customer relationships, contracted backlog, and tradename using the excess earnings method of the income approach. Utilizing this approach, the Company projected revenue and related expenses. These projected income amounts were then reduced by the return on contributory assets and discounted to present value. This method requires the use of certain estimates, including revenue growth rates, customer attrition, expenses, contributory asset charges and discount rates.
Goodwill is expected to be deductible for tax purposes.
Proforma information for the acquisition of CareCentric has not been presented as the acquisition is not significant.
Healthcare Automation, Inc.
On December 11, 2009, Mediware acquired all of the common stock of Healthcare Automation, Inc., a Delaware corporation (“HAI”). HAI provides medication management solutions to home infusion, specialty pharmacy and alternate care markets through integrated software solutions that address the complex work flow and patient safety needs of these markets.
Mediware believes the acquisition of HAI will expand its medication management offering by expanding its presence in the home infusion, specialty pharmacy and alternate care markets. The Company plans to continue offering its WORx pharmacy product line to the larger acute care hospitals and behavioral health facilities, and its Ascend pharmacy products to smaller hospitals and pharmacies, while the HAI product line, along with the Ascend home infusion product line will be offered to home infusion, specialty pharmacy and alternate care markets.
Mediware expects that the HAI products will generate revenue by licensing its proprietary software, and by providing professional services and support for the product lines. Generally, HAI customers are charged an initial start-up fee along with monthly fees for the continued use and support of the proprietary software. Software license fees are recognized, when the license is initially executed, subject to the revenue recognition principles for software. Professional services and support revenues are recognized as the services are delivered.
The purchase price paid for HAI consists of an initial purchase price of $3,501,000 in cash, net of $5,000 cash acquired at the closing, plus contingent consideration of $954,000 deposited into the sellers’ escrow account in December 2010 based upon the achievement of certain revenue milestones through December 11, 2010. This amount is disbursable to the sellers of HAI on September 30, 2011, subject to any indemnity claims by Mediware. The Company will receive $22,000 from the seller as part of the final working capital adjustment. The Company estimated the fair value of the contingent consideration at the acquisition date to be $871,000 using a probability-weighted discounted cash flow model. This fair value is based on significant inputs not observable in the markets and thus represents a Level 3 measurement as defined in ASC 820. The Company incurred $40,000 of legal, accounting and other professional fees related to this transaction, which were expensed. The results of the HAI operations are included in the accompanying financial statements from the date of acquisition.
50
The Company has accounted for the HAI transaction as a business acquisition under the accounting guidance. The assets acquired and liabilities assumed of HAI were recorded as of the acquisition date, at their respective fair values. The preparation of the valuation required the use of significant assumptions and estimates. These estimates were based on assumptions that the Company believes to be reasonable.
The following summarizes the assets acquired and liabilities assumed at the acquisition date, net of cash acquired (in thousands):
|
Purchase Price Allocation
|
||||
|
Accounts receivable
|
$
|
743
|
||
|
Prepaid and other current assets
|
79
|
|||
|
Fixed assets
|
14
|
|||
|
Intangible assets subject to amortization
|
2,199
|
|||
|
Goodwill
|
1,860
|
|||
|
Accounts payable
|
(57
|
)
|
||
|
Deferred revenue
|
(240
|
)
|
||
|
Accrued expenses and other current liabilities
|
(226
|
)
|
||
|
Other long term liabilities – contingent consideration
|
(871
|
)
|
||
|
Total purchase price, net of cash acquired
|
$
|
3,501
|
||
Details of acquired intangibles and goodwill are as follows (in thousands):
|
Amount Assigned
|
Weighted Average Amortization Period
|
Risk-Adjusted
Discount Rate
Used in Purchase Price
Allocation
|
|||||||
|
Amortizable Intangible Assets
|
|||||||||
|
Purchased technology
|
$
|
756
|
5.0 years
|
19.1%
|
|||||
|
Customer relationships
|
1,285
|
6.0 years
|
19.1%
|
||||||
|
Customer Backlog
|
158
|
13 months
|
19.1%
|
||||||
|
$
|
2,199
|
||||||||
|
Goodwill
|
$
|
1,860
|
|||||||
The Company valued the purchased technology using the excess earnings method of the income approach. Utilizing this approach, the Company projected revenue and related expenses. These projected income amounts were then reduced by the return on contributory assets and discounted to present value. This method requires the use of certain estimates, including revenue growth rates, technology replacement rates, customer attrition, expenses, contributory asset charges and discount rates. Based on this methodology the Company assigned the value of purchased technology at $756,000. The Company will amortize this amount over the estimated useful life of five years.
The Company valued the customer relationships and contracted backlog using the excess earnings method of the income approach. Utilizing this approach, the Company projected revenue and related expenses. These projected income amounts were then reduced by the return on contributory assets and discounted to present value. This method requires the use of certain estimates, including revenue growth rates, customer attrition, expenses, contributory asset charges and discount rates. Based on this methodology the Company assigned the value of customer relationships at $1,285,000 and contracted backlog at $158,000. The Company will amortize customer relationships over the estimated useful life of six years and the contracted backlog over the estimated useful life of thirteen months.
The Company has made an election under the Internal Revenue code section 338(h)(10). Accordingly, goodwill is expected to be deductible for tax purposes.
51
Proforma information for the acquisition of HAI has not been presented as the acquisition is not significant.
Advantage Reimbursement, Inc.
On December 11, 2009, Mediware, through its newly formed wholly owned subsidiary Advantage Reimbursement, LLC, a Delaware limited liability company (“ARL”), acquired substantially all of the assets of Advantage Reimbursement, Inc., a Massachusetts corporation(“ARI”). ARI was a provider of billing and collection services for home infusion and alternate care enterprises.
The acquisition of ARI expands the scope of services that Mediware can provide to its current and potential home infusion, specialty pharmacy and alternate care customers. The Company believes that over time this business will become an important differentiator that will not only contribute to its ability to make sales of its traditional software products but that will also drive revenue on an independent business.
Mediware expects the ARL services will generate revenue by providing collection and billings services and expertise to Mediware’s home infusion, specialty pharmacy and alternate care customers and to other software providers’ customers as well. Customers are charged a percentage of the third party fees that are collected. The Company records revenue as the third party fees are collected.
The purchase price paid for the assets of ARI consisted of an initial purchase price of $2,061,000 paid in cash at the closing, plus contingent consideration of $546,000 deposited into the sellers’ escrow account in December 2010 based upon the achievement of certain revenue milestones through December 11, 2010. This amount is disbursable to the sellers of ARI’s assets on September 30, 2011, subject to any indemnity claims by Mediware. In addition, the Company will pay $14,000 to the sellers as part of the final working capital adjustment. We estimated the fair value of the contingent consideration at the acquisition date to be $498,000 using a probability-weighted discounted cash flow model. This fair value is based on significant inputs not observable in the markets and thus represents a Level 3 measurement as defined in ASC 820. The Company incurred $21,000 of legal, accounting and other professional fees related to this transaction, which were expensed. The results of the ARI operations are included in the accompanying financial statements from the date of acquisition.
The Company has accounted for the acquisition of ARI as the purchase of a business under the accounting guidance. The assets acquired and liabilities assumed of ARI were recorded as of the acquisition date, at their respective estimated fair values. The preparation of the valuation required the use of significant assumptions and estimates. These estimates were based on assumptions that the Company believes to be reasonable.
The following summarizes the assets acquired and liabilities assumed at the acquisition date (in thousands):
|
Purchase Price
Allocation
|
||||
|
Accounts receivable
|
$
|
522
|
||
|
Prepaid expenses
|
43
|
|||
|
Fixed assets
|
1
|
|||
|
Intangible assets subject to amortization
|
763
|
|||
|
Goodwill
|
1,317
|
|||
|
Accounts payable
|
(8
|
)
|
||
|
Accrued expenses and other liabilities
|
(79
|
)
|
||
|
Contingent consideration other long term liabilities
|
(498
|
)
|
||
|
Total Purchase Price
|
$
|
2,061
|
||
52
Details of acquired intangible assets and goodwill are as follows (in thousands):
|
Amount Assigned
|
Weighted
Average
Amortization
Period
|
Risk-Adjusted
Discount Rate
Used in Purchase Price
Allocation
|
|||||||
|
Amortizable Intangible Assets
|
|||||||||
|
Customer relationships
|
$ | 763 |
6.0 years
|
17.0 | % | ||||
|
Goodwill
|
$ | 1,317 | |||||||
The Company valued the customer relationships using the excess earnings method of the income approach. Utilizing this approach, the Company projected revenue and related expenses. These projected income amounts were then reduced by the return on contributory assets and discounted to present value. This method requires the use of certain estimates, including revenue growth rates, customer attrition, expenses, contributory asset charges and discount rates. Based on this methodology the Company assigned the value of customer relationships at $763,000. The Company will amortize this amount over the estimated useful life of six years.
Goodwill is expected to be deductible for tax purposes.
Proforma information for the acquisition of ARI has not been presented as the acquisition is not significant.
SciHealth, Inc.
On June 19, 2009, Mediware acquired substantially all of the assets of SciHealth, Inc., a Georgia corporation (“SciHealth”). SciHealth developed and marketed InSightTM, a business and clinical intelligences software package used to manage performance metrics. Mediware believes that this product offering will strengthen its clinical suite offerings in its existing medication management and blood and biologics markets, as well as acquired tools to broaden its customer base to include the broader healthcare market.
Mediware expects the SciHealth products to generate revenue by licensing its proprietary software, and by providing professional services and support for the product lines. Generally, customers are charged an initial start-up fee along with monthly fees for the continued use and support of the software. Software license fees are recognized when the license is initially executed, subject to the revenue recognition principles for software. Professional services and support revenues are recognized as the service is delivered.
The purchase price paid for the assets of SciHealth consisted of an initial purchase price of $1,702,000 paid in cash at the closing. During the year ended June 30, 2010, the Company paid an additional $400,000 relating to SciHealth attaining certain contractual milestones, which has been recorded as additional goodwill. The Company incurred $71,000 of legal, accounting and other professional fees related to this transaction, which have been included in goodwill. The Company finalized the purchase price in June 2010. The results of the SciHealth operations are included in the accompanying consolidated financial statements from the date of acquisition.
The Company has accounted for the acquisition of SciHealth as the purchase of a business under the accounting guidance. The assets and liabilities of SciHealth were recorded as of the acquisition date, at their respective fair values. The purchase price allocation is based on the estimated fair value of assets acquired and liabilities assumed. The preparation of the valuation required the use of significant assumptions and estimates. These estimates were based on assumptions that the Company believes to be reasonable.
The following summarizes the final purchase price allocation (in thousands):
|
Purchase Price
Allocation
|
||||
|
Accounts receivable
|
$
|
402
|
||
|
Fixed assets
|
36
|
|||
|
Intangible assets subject to amortization
|
983
|
|||
|
Goodwill (including $400 paid in 2010)
|
996
|
|||
|
Deferred revenue
|
(244
|
)
|
||
|
Total Purchase Price
|
$
|
2,173
|
||
53
The excess of the purchase price over the fair value of net tangible assets acquired was allocated to specific intangible asset categories as follows (in thousands):
|
Amount
Assigned
|
Weighted
Average
Amortization
Period
|
Risk-Adjusted
Discount Rate
Used in Purchase Price
Allocation
|
|||||||
|
Amortizable Intangible Assets
|
|||||||||
|
Purchased technology
|
$ | 232 |
5.0 years
|
20.9 | % | ||||
|
Customer relationships
|
751 |
7.0 years
|
20.9 | % | |||||
| $ | 983 | ||||||||
|
Goodwill
|
$ | 996 | |||||||
The Company valued the purchased technology using the cost to recreate method of the income approach. Utilizing this approach the Company estimated the cost to recreate the software. This method requires the use of certain estimates, including the fully burdened labor rates for software engineers, the amount of time and effort required to recreate the software, income tax rates and discount rates. Based on this methodology the Company assigned the value of purchased technology at $232,000. The Company will amortize this amount over the estimated useful life of five years.
The Company valued the customer relationships using the excess earnings method of the income approach. Utilizing this approach, the Company projected revenue and related expenses. These projected income amounts were then reduced by the return on contributory assets and discounted to present value. This method requires the use of certain estimates, including revenue growth rates, customer attrition, expenses, contributory asset charges and discount rates. Based on this methodology the Company assigned the value of customer relationships at $751,000. The Company will amortize this amount over the estimated useful life of seven years.
Goodwill is expected to be deductible for tax purposes.
Proforma information for the acquisition of SciHealth has not been presented as the acquisition is not significant.
54
5. GOODWILL AND OTHER INTANGIBLE ASSETS
Goodwill
The change in the carrying amount of goodwill during the fiscal year ended June 30, 2011 and 2010 is as follows (in thousands):
|
Carrying amount as of June 30, 2009
|
$ | 9,843 | ||
|
Increase from acquisition of businesses
|
3,577 | |||
|
Tax benefit of amortization
|
(232 | ) | ||
|
Carrying amount as of June 30, 2010
|
$ | 13,188 | ||
|
Increase from acquisition of businesses
|
631 | |||
|
Tax benefit of amortization
|
(232 | ) | ||
|
Carrying amount as of June 30, 2011
|
$ | 13,587 |
Other Intangible Assets
The carrying amount of other intangible assets as of June 30, 2011 is as follows (in thousands):
|
Gross Carrying Amount
|
Accumulated Amortization
|
Net Carrying Amount
|
Weighted Average Remaining Useful Life (in years)
|
|||||||||||||
|
Purchased technology
|
$ | 3,234 | $ | (961 | ) | $ | 2,273 | 3.5 | ||||||||
|
Customer relationships
|
6,251 | (1,763 | ) | 4,488 | 4.3 | |||||||||||
|
Contract backlog
|
184 | (184 | ) | - | - | |||||||||||
|
Non-compete agreements
|
124 | (121 | ) | 3 | - | |||||||||||
|
Tradename
|
11 | (1 | ) | 10 | 3.6 | |||||||||||
| $ | 9,804 | $ | (3,030 | ) | $ | 6,774 | ||||||||||
The carrying amount of our other intangible assets as of June 30, 2010 is as follows (in thousands):
|
Gross Carrying Amount
|
Accumulated Amortization
|
Net Carrying Amount
|
Weighted Average Remaining Useful Life (in years)
|
|||||||||||||
|
Purchased technology
|
$ | 1,932 | $ | (519 | ) | $ | 1,413 | 3.7 | ||||||||
|
Customer relationships
|
4,883 | (932 | ) | 3,951 | 5.1 | |||||||||||
|
Contract backlog
|
158 | (142 | ) | 16 | 0.1 | |||||||||||
|
Non-compete agreements
|
124 | (101 | ) | 23 | 0.3 | |||||||||||
| $ | 7,097 | $ | (1,694 | ) | $ | 5,403 | ||||||||||
55
Amortization expense for other intangible assets amounted to $1,336,000, $1,087,000 and $429,000 for fiscal year 2011, 2010 and 2009, respectively. The following represents the expected amortization in future periods (in thousands):
|
Fiscal Year
|
Expected Amortization
|
|||
|
2012
|
$ | 1,677 | ||
|
2013
|
1,581 | |||
|
2014
|
1,499 | |||
|
2015
|
1,240 | |||
|
2016
|
730 | |||
|
Thereafter
|
47 | |||
| $ | 6,774 | |||
6. ACCRUED EXPENSES AND OTHER CURRENT LIABILITIES
Accrued expenses and other current liabilities consist of the following (in thousands):
|
As of June 30,
|
||||||||
|
2011
|
2010
|
|||||||
|
Payroll, bonus and related benefits
|
$ | 3,513 | $ | 3,078 | ||||
|
Accounting, legal and other professional fees
|
456 | 278 | ||||||
|
Deferred rent
|
113 | 149 | ||||||
|
Other
|
701 | 383 | ||||||
| $ | 4,783 | $ | 3,888 | |||||
7. STOCK BASED COMPENSATION
Stock-based compensation expense amounted to $1,328,000, $715,000 and $802,000 for the years ended June 30, 2011, 2010 and 2009, respectively.
Stock Based Plans
The Company's 2003 Equity Incentive Plan, approved by the shareholders in December 2003, provides additional compensation incentives to encourage high levels of performance and employee retention. Key employees of the Company, directors, and persons who render services to the Company as consultants, advisors or independent contractors are eligible to receive grants under this plan. The number of shares that may be issued under this plan is 2,000,000. Shares may be issued as either incentive stock options, nonqualified stock options, or restricted common stock. Options may be granted for a period of up to ten years. Restricted common stock awards may be subject to vesting restrictions and may be forfeited if certain performance factors are not maintained. The plan provides that a maximum of 1,700,000 shares may be issued as any combination of restricted stock, options and restricted stock unit awards. The additional 300,000 shares of common stock can only be granted as option awards. As of June 30, 2011, there were 800,000 shares available for issuance under this plan.
Restricted Common Stock Awards
During fiscal 2007, the Company entered into agreements to provide long-term incentive compensation opportunities to key employees. Under the terms of these agreements, the Company granted the employees 35,000 restricted shares of common stock (the “Time-Based Shares”). The Time-Based Shares vested over a three-year period based upon the continued employment of the key employee. For the years ended June 30, 2011, 2010 and 2009, the Company recorded compensation expense of $3,000, $10,000, and $10,000, respectively, of compensation expense related to the Time-Based Shares. These amounts include a benefit related to the forfeiture of certain non-vested Time-Based Shares of $9,000 and $23,000 for the years ended June 30, 2010 and 2009, respectively. At June 30, 2011, all compensation expense related to the Time-Based Shares had been recognized.
56
Beginning in fiscal 2007, each member of the Company’s Board of Directors received an annual grant of $10,000 of restricted common stock (the “Director Shares”) as part of their compensation for serving on the Company’s Board of Directors. The number of shares granted was determined based upon the fair market value of the Company’s stock on January 1 of each fiscal year. As a result, a total of 10,000, 10,000, and 15,000 Director Shares were granted to the directors in fiscal 2011, 2010 and 2009, respectively. These shares vested on June 30 each fiscal year based upon the director’s continued service on the Company’s Board of Directors. The Company recorded compensation expense related to these shares of $70,000 in each of the years ended June 30, 2011, 2010 and 2009.
During fiscal 2008, the Company entered into agreements to provide long-term incentive compensation opportunities to certain employees. Under the terms of these agreements, the Company granted the employees 220,000 restricted shares of common stock (the “2008 Enhanced Performance Shares”). The 2008 Enhanced Performance Shares vest partially upon continued employment of the key employees and partially upon the achievement of certain performance goals. For the years ended June 30, 2011, 2010 and 2009, the Company recorded $60,000, $381,000 and $541,000, respectively, of compensation expense related to the 2008 Enhanced Performance Shares. At June 30, 2011, all compensation expense related to the 2008 Enhanced Performance Shares had been recognized.
During fiscal 2010, the Company entered into agreements to provide long-term incentive compensation opportunities to certain employees. Under the terms of these agreements, the Company will grant up to a total of 168,750 restricted shares of common stock (the “2010 Enhanced Performance Shares”) in three tranches. The 2010 Enhanced Performance Shares vest partially upon continued employment of the key employees and partially upon the achievement of certain performance goals. The annual grants are deemed to occur upon the annual establishment of the performance criteria. For the years ended June 30, 2011 and 2010 the Company granted 56,000 and 19,000 2010 Enhanced Performance Shares, respectively and recorded $521,000 and $19,000 of compensation expense, respectively. The Company will continue to assess whether or not the achievement of any performance goals is probable at each reporting period, and will recognize the related expense if and when the performance conditions become probable. At June 30, 2011, all compensation expense related to the first tranche of 2010 Enhanced Performance Shares had been recognized. The second tranche of shares awarded under the 2010 Enhanced Performance Shares may result in compensation expense in future periods of up to $609,000 (including $411,000 related to 37,500 shares granted on July 1, 2011), representing the fair value on the date of the grant less the amount of compensation expense already recorded. Also under the terms of these agreements, the Company will grant up to a total of 56,250 restricted shares of common stock (the “Market Condition Shares”). For the years ended June 30, 2011 and 2010 the Company granted 18,750 and 6,250 of the Market Condition Shares, respectively. The shares awarded as Market Condition Shares vest upon the achievement of certain market condition criteria and the continued employment of the key employees. The annual market condition grants are deemed to occur upon the annual reset of the market condition criteria. For the years ended June 30, 2011 and 2010, the Company recorded $83,000 and $6,000, respectively of compensation expense related to the Market Condition Shares. At June 30, 2011, all compensation expense related to the first tranche of Market Condition Shares had been recognized. The second tranche of shares awarded as Market Condition Shares may result in compensation expense in future periods of up to $79,000 (including $50,000 related to 12,500 shares granted on July 1, 2011), representing the fair value on the date of the grant less the amount of compensation expense already recorded.
57
A summary of the status of the Company’s nonvested restricted common stock as of June 30, 2011, and changes during the year ended June 30, 2011, is presented below (shares amounts in thousands):
|
Market Condition Shares
|
Weighted Average Grant Date Fair Value
|
Time-Based Shares
|
Weighted Average Grant Date Fair Value
|
Director Shares
|
Weighted Average Grant Date Fair Value
|
|||||||||||||||||||
|
Nonvested at June 30, 2010
|
6 | $ | 4.86 | 2 | $ | 5.96 | - | $ | - | |||||||||||||||
|
Granted
|
19 | 4.67 | - | - | 6 | 10.90 | ||||||||||||||||||
|
Canceled or forfeited
|
- | - | - | - | - | - | ||||||||||||||||||
|
Vested
|
- | - | (2 | ) | 5.96 | (6 | ) | 10.90 | ||||||||||||||||
|
Nonvested at June 30, 2011
|
25 | $ | 4.72 | - | $ | - | - | $ | - | |||||||||||||||
|
2008 Enhanced Performance Shares
|
Weighted Average Grant Date Fair Value
|
2010 Enhanced Performance Shares
|
Weighted Average Grant Date Fair Value
|
|||||||||||||||||||||
|
Nonvested at June 30, 2010
|
66 | $ | 6.74 | 19 | $ | 9.12 | ||||||||||||||||||
|
Granted
|
- | - | 56 | 10.09 | ||||||||||||||||||||
|
Canceled or forfeited
|
- | - | - | - | ||||||||||||||||||||
|
Vested
|
(66 | ) | 6.74 | - | - | |||||||||||||||||||
|
Nonvested at June 30, 2011
|
- | $ | - | 75 | $ | 9.84 | ||||||||||||||||||
The fair value of the restricted shares is determined based on the average trading price of the Company’s shares on the grant date, except for the Director Shares which is determined based on the average trading price of the Company’s shares as of January 1 of each year, pursuant to the directors’ compensation plan.
Stock Option Awards
The fair value of stock options is determined at the date of grant and is charged to compensation expense over the vesting period of the options. The fair value of options at date of grant was estimated using the Black-Scholes option pricing model utilizing the following assumptions:
|
For the Year Ended June 30,
|
||||||||||||
|
2011
|
2010
|
2009
|
||||||||||
|
Risk-free interest rates
|
1.1% - 1.7 | % | 1.7% - 2.4 | % | 2.8% - 2.9 | % | ||||||
|
Expected option life in years
|
4 | 2-4 | 2-3 | |||||||||
|
Expected stock price volatility
|
46% - 54 | % | 45% - 66 | % | 51% - 64 | % | ||||||
|
Expected dividend yield
|
-0- | % | -0- | % | -0- | % | ||||||
The risk-free interest rate for periods within the contractual life of the option is based on the U.S. Treasury yield curve in effect at the time of the grant. The Company uses historical data to estimate option exercise and employee and director termination within the valuation model; separate groups of employees and directors that have similar historical exercise behavior are considered separately for valuation purposes. The expected term of options granted represents the period of time that options granted are expected to be outstanding; the range given above results from groups of employees and directors exhibiting different behavior. Expected volatilities are based on historical volatility of the Company’s stock. The Company has not paid any dividends in the past and does not expect to pay any in the near future.
58
The following table sets forth summarized information concerning the Company's stock options as of June 30, 2011 (option amounts in thousands):
|
Options
|
Weighted Average Exercise Price
|
Weighted Average Remaining Contractual Term
|
Aggregate Intrinsic Value
|
|||||||||||||
|
Outstanding at June 30, 2010
|
846 | $ | 8.69 | |||||||||||||
|
Granted
|
120 | 9.46 | ||||||||||||||
|
Exercised
|
(93 | ) | 9.37 | |||||||||||||
|
Forfeited or expired
|
(50 | ) | 8.33 | |||||||||||||
|
Outstanding at June 30, 2011
|
823 | $ | 8.75 | 3.7 | $ | 2,227 | ||||||||||
|
Options exercisable at June 30, 2011
|
449 | $ | 9.25 | 3.6 | $ | 1,080 | ||||||||||
|
Nonvested at June 30, 2011
|
374 | $ | 8.16 | 3.9 | $ | 1,147 | ||||||||||
The exercise price of the options is determined based on the average trading price of the Company’s shares on the grant date.
Cash received from options exercised under all stock-based payment arrangements for the years ended June 30, 2011, 2010 and 2009 was $525,000, $928,000 and $94,0000, respectively. In the year ended June 30, 2011, 34,000 of the shares exercised were cashless exercises. The excess tax benefit realized for the tax deductions related the share-based payment arrangements totaled $122,000 and $167,000 for the years ended June 30, 2011 and 2010, respectively. The aggregate intrinsic value of options exercised during the years ended June 30, 2011, 2010 and 2009 was $182,000, $411,000 and $51,000, respectively.
The weighted average fair value at date of grant for options granted during the years ended June 30, 2011, 2010 and 2009 was $4.12, $2.95 and $1.71 per option, respectively. The Company recorded $591,000, $229,000 and $181,000 of compensation expense for stock options for the years ended June 30, 2011, 2010 and 2009, respectively.
Estimated future stock-based compensation expense relating to stock options is as follows (in thousands):
|
Fiscal Years Ending June 30,
|
Future Stock Option Compensation Expense
|
|||
|
2012
|
$ | 333 | ||
|
2013
|
164 | |||
|
2014
|
65 | |||
|
2015
|
5 | |||
|
Total estimated future stock-based compensation expense
|
$ | 567 | ||
A summary of the status of the Company’s nonvested options as of June 30, 2011 and 2010, and changes during the year ended June 30, 2011, is presented below (share amounts in thousands):
|
Nonvested Options
|
Shares
|
Weighted Average Grant Date Fair Value
|
||||||
|
Nonvested at June 30, 2010
|
399 | $ | 2.77 | |||||
|
Granted
|
120 | $ | 4.12 | |||||
|
Canceled or expired
|
(22 | ) | $ | 3.43 | ||||
|
Vested
|
(123 | ) | $ | 2.61 | ||||
|
Nonvested at June 30, 2011
|
374 | $ | 3.21 | |||||
The total fair value of shares vested during the years ended June 30, 2011, 2010 and 2009 was $494,000, $136,000 and $131,000, respectively.
59
The following table presents information relating to stock options at June 30, 2011 (share amounts in thousands):
|
Options Outstanding
|
Options Exercisable
|
|||||||||||||||||||||
|
Range of Exercise Prices
|
Shares
|
Weighted Average Exercise Price
|
Weighted Average Remaining Life in Years
|
Shares
|
Weighted Average Exercise Price
|
|||||||||||||||||
| $ | 0.00 - $ 4.49 | 10 | $ | 3.89 | 2.4 | 6 | $ | 3.89 | ||||||||||||||
| $ | 4.50 - $ 7.49 | 317 | $ | 6.63 | 4.3 | 180 | $ | 6.72 | ||||||||||||||
| $ | 7.50 - $ 8.99 | 135 | $ | 8.79 | 3.5 | 41 | $ | 8.66 | ||||||||||||||
| $ | 9.00 - $ 10.49 | 224 | $ | 9.59 | 3.5 | 105 | $ | 10.10 | ||||||||||||||
| $ | 10.50 - $11.99 | 20 | $ | 11.19 | 5.0 | - | - | |||||||||||||||
| $ | 12.00 - $13.49 | 87 | $ | 12.56 | 2.7 | 87 | $ | 12.56 | ||||||||||||||
| $ | 13.50 - $14.99 | 30 | $ | 13.73 | 2.6 | 30 | $ | 13.73 | ||||||||||||||
| 823 | 449 | |||||||||||||||||||||
8. INCOME TAXES
Income tax expense is as follows (in thousands):
|
For the Year Ended June 30,
|
||||||||||||
|
2011
|
2010
|
2009
|
||||||||||
|
Current:
|
||||||||||||
|
Federal
|
$ | 1,854 | $ | 1,389 | $ | 395 | ||||||
|
State
|
802 | 472 | 268 | |||||||||
|
Foreign
|
306 | 283 | 246 | |||||||||
|
Total current expense
|
2,962 | 2,144 | 909 | |||||||||
|
Deferred:
|
||||||||||||
|
Federal
|
(294 | ) | (613 | ) | 50 | |||||||
|
State
|
(55 | ) | (115 | ) | (36 | ) | ||||||
|
Foreign
|
(8 | ) | - | - | ||||||||
|
Total deferred expense (benefit)
|
(357 | ) | (728 | ) | 14 | |||||||
|
Total income tax expense
|
$ | 2,605 | $ | 1,416 | $ | 923 | ||||||
The deferred income tax provision does not include $232,000 for each of the years ended June 30, 2011, 2010 and 2009 relating to the income tax benefit realized on goodwill amortized for tax purposes. The deferred income tax provision also does not include an income tax benefit relating to stock-based compensation amounting to $122,000, $167,000 and $20,000 for the years ended June 30, 2011, 2010 and 2009, respectively.
60
Temporary differences between the financial statement carrying amounts and the tax basis of assets and liabilities that give rise to significant portions of deferred income taxes as of June 30 are as follows (in thousands):
|
2011
|
2010
|
|||||||
|
Deferred tax asset:
|
||||||||
|
Net operating loss carryforwards
|
$ | 161 | $ | 215 | ||||
|
Stock-based compensation
|
665 | 408 | ||||||
|
State research and development credit
|
84 | 53 | ||||||
|
Intangibles
|
747 | 411 | ||||||
|
Valuation reserves and accruals deductible in different periods
|
852 | 755 | ||||||
|
Total deferred tax assets
|
2,509 | 1,842 | ||||||
|
Less: valuation allowance
|
(245 | ) | (268 | ) | ||||
| $ | 2,264 | $ | 1,574 | |||||
|
Deferred tax liability:
|
||||||||
|
Fixed Assets
|
$ | (121 | ) | $ | (208 | ) | ||
|
Goodwill
|
(618 | ) | (352 | ) | ||||
|
Software cost capitalization
|
(4,862 | ) | (4,694 | ) | ||||
|
Total deferred tax liabilities
|
(5,601 | ) | (5,254 | ) | ||||
|
Net deferred tax liability
|
$ | (3,337 | ) | $ | (3,680 | ) | ||
|
Presented as follows:
|
||||||||
|
Current asset
|
$ | 852 | $ | 748 | ||||
|
Long-term liability
|
(4,189 | ) | (4,428 | ) | ||||
| $ | (3,337 | ) | $ | (3,680 | ) | |||
Domestic and foreign income before income taxes is (in thousands):
|
For the Year Ended June 30,
|
||||||||||||
|
2011
|
2010
|
2009
|
||||||||||
|
Domestic
|
$ | 7,798 | $ | 3,555 | $ | 1,649 | ||||||
|
Foreign
|
1,099 | 1,103 | 848 | |||||||||
| $ | 8,897 | $ | 4,658 | $ | 2,497 | |||||||
61
The difference between the tax expenses reflected on the financial statements and the amounts calculated using the federal statutory income tax rates are as follows (in thousands):
|
For the Year Ended June 30,
|
||||||||||||
|
2011
|
2010
|
2009
|
||||||||||
|
Federal income tax at statutory rate
|
$ | 3,025 | $ | 1,584 | $ | 849 | ||||||
|
State income tax, net of Federal benefit
|
493 | 236 | 127 | |||||||||
|
Research and development tax credits
|
(369 | ) | (359 | ) | - | |||||||
|
Section 199 manufacturing deduction
|
(277 | ) | - | - | ||||||||
|
Foreign tax rate difference
|
(76 | ) | (92 | ) | (42 | ) | ||||||
|
Write-off of deferred tax assets associated with forfeited vested non-qualified stock options
|
- | 29 | - | |||||||||
|
Other, including non-deductible expenses
|
(191 | ) | 18 | (11 | ) | |||||||
| $ | 2,605 | $ | 1,416 | $ | 923 | |||||||
As of June 30, 2011, the Company has net operating loss carryforwards of approximately $425,000 available to reduce future federal taxable income. This entire amount is subject to limitations in accordance with Section 382 of the Internal Revenue Code of 1986, as amended. Additionally, the net operating loss carryforwards may be subject to further limitations should certain future ownership changes occur. The net operating losses expire in various years through 2015. As of June 30, 2011, the Company has recorded a valuation allowance for the entire amount of any deferred tax assets relating to this net operating loss and certain state tax credits.
At June 30, 2011, U.S. taxes have not been provided on approximately $4,202,000 of undistributed earnings of foreign subsidiaries as these undistributed earnings have been invested or are expected to be permanently invested offshore. If, in the future, these earnings are repatriated to the U.S., or if such earnings are determined to be remitted in the foreseeable future, additional tax provisions would be required. Due to complexities in the tax laws and the assumptions that would have to be made, it is not practicable to estimate the amounts of income taxes that would have to be provided.
In June 2006, the FASB issued guidance related to recognition threshold and measurement attributes for financial statement recognition and measurement of a tax position taken or expected to be taken in a tax return and seeks to reduce the diversity in practice associated with certain aspects of measurement and recognition in accounting for income taxes. The guidance also addresses de-recognition, classification, interest and penalties and accounting in interim periods and requires expanded disclosures with respect to the uncertainty in income taxes. This guidance was effective for the Company on July 1, 2007.
Under this guidance, the Company applied the “more-likely-than-not” recognition threshold to all tax positions, commencing at the adoption date, which resulted in an increase of $278,000 in the liability for unrecognized tax benefits that was accounted for as a decrease to July 1, 2007 retained earnings. Such adjustment was recorded in the fourth quarter of fiscal 2008 based on evaluation of new information which management became aware of during such period. As of the date of adoption and after the impact of recognizing the increase in liability noted above, the Company’s unrecognized tax benefits (before federal benefit) totaled $404,000 at June 30, 2008. As of June 30, 2010, the balance of unrecognized tax benefits was $407,000 and the balance at June 30, 2011 was $514,000 which related to tax positions which, if recognized, would affect the annual effective tax rate. The Company recognizes accrued interest and penalties in income tax expense. Accrued interest and penalties at June 30, 2011 and 2010 amounted to $180,000 and $20,000, respectively.
62
The change in the Company’s unrecognized tax benefits for fiscal years ended June 30, 2010 and 2011 are as follows (in thousands):
|
Balance, June 30, 2009
|
$ | 375 | ||
|
Additions – current period positions
|
122 | |||
|
Reductions
|
(90 | ) | ||
|
Settlements
|
- | |||
|
Balance, June 30, 2010
|
407 | |||
|
Additions – current period positions
|
107 | |||
|
Reductions
|
- | |||
|
Settlements
|
- | |||
|
Balance, June 30, 2011
|
$ | 514 |
The Company files income tax returns in the U.S. federal jurisdiction and various state and foreign jurisdictions. In general, the Company’s filed income tax returns are no longer subject to examination by the respective taxing authorities for years ended before June 30, 2008. However, to the extent utilized, the Company’s net operating loss carryforwards originating in closed years, remain subject to examinations. In January 2009, the Company was notified that the Internal Revenue Service would be examining its fiscal 2007 Federal income tax return. The examination was concluded during the year ended June 30, 2010 and the Company received a no change letter from the Internal Revenue Service.
The change in valuation allowance amounts to a decrease of $23,000 in 2011.
Provision has not been made for U.S. or additional foreign taxes for undistributed earnings of the Company’s U.K. foreign subsidiary as those earning have been and the Company expects that they will continue to be reinvested. Determination of the amount of unrecognized deferred tax liability with respect to such earnings is not practicable. The Company believes that the amount of additional taxes that might be payable on the earnings of its foreign subsidiary, if remitted, would be partially offset by the U.S. foreign tax credits.
9. RETIREMENT PLAN
The Company has a 401(k) Retirement Plan (the “Retirement Plan”), which covers all eligible employees. Participants may contribute up to the maximum allowable per Internal Revenue Service regulations. In addition, the Company may make discretionary contributions to the Retirement Plan, subject to certain limitations. Company contributions to the Retirement Plan were $275,000, $246,000 and $231,000 for the years ended June 30, 2011, 2010 and 2009, respectively.
10. COMMITMENTS AND CONTINGENCIES
(a) Operating Leases
Rental commitments for the remaining terms of non-cancelable leases, which relate to office space, expire at various dates through 2020. Under these leases, minimum commitments are as follows (in thousands):
|
For the Year Ended June 30,
|
||||
|
2012
|
$ | 1,392 | ||
|
2013
|
709 | |||
|
2014
|
283 | |||
|
2015
|
218 | |||
|
2016
|
117 | |||
|
Thereafter
|
409 | |||
| $ | 3,128 | |||
Certain leases provide for additional payments for real estate taxes and insurance and contain escalation clauses related to increases in utilities and services. Rent expense for the years ended June 30, 2011, 2010 and 2009 amounted to $1,396,000, $1,223,000 and $997,000, respectively.
63
(b) Royalties
In September 1990, the Company entered into an agreement to acquire a perpetual license for a computerized information system for hospital operating rooms. Under this agreement, the Company is required to pay royalties of 5% to 15% on sales of this software product. Upon request, the Company is required to assist with a royalty audit.
(c) Earn outs – See Note 4. At June 30, 2011, there were no payments pursuant to earn out agreements pending.
(d) Employment agreements
In May 2010, the Company renewed employment agreements with three key executives which include stock-based compensation that is performance based and granted in annual tranches. Expense related to this stock-based compensation is determined for each tranche based upon the fair value of the shares when performance or market related criteria are determined.
(e) Other Contingencies and Uncertainties
Mediware is from time to time involved in routine litigation incidental to the conduct of its business, including employment disputes and litigation alleging product defects, intellectual property infringements, violations of law and breaches of contract and warranties. Mediware believes that no such routine litigation currently pending against it, if adversely determined, would have a material adverse effect on its consolidated financial position, results of operations or cash flows.
Mediware is working with a longstanding vendor of third-party software to confirm that Mediware has been appropriately invoiced for its use of the vendor’s product. The vendor prices its software licenses on a per-unit basis. The vendor is currently investigating whether it should price the software licensed to Mediware on a basis different than the vendor has invoiced Mediware over the past several years. An estimate of the possible loss or range of loss resulting from an unfavorable outcome, if any, could not be established and no provision has been recorded.
11. TREASURY STOCK
In February 2008, the Board of Directors of the Company authorized Mediware to repurchase up to $4,000,000 of its common stock, at times and prices as the President and Chief Executive Officer or the Chief Financial Officer of the Company shall determine to be appropriate (the “Share Repurchase Program”). In October 2008, the Board of Directors expanded the Share Repurchase Program by $3,318,000, bringing the total amount authorized under the Share Repurchase Program to $7,318,000. The program has no expiration date, and Mediware has no obligation to purchase shares under the Share Repurchase Program.
Pursuant to the program, the Company has repurchased a total of 590,000 shares of common stock at a cost of $3,503,000 under the Share Repurchase Program. No shares were repurchased during the years ended June 30, 2011 or 2010. As of June 30, 2011, the Company is authorized to purchase up to an additional $3,815,000 of common stock under the Share Repurchase Program.
The Company permits a net exercise for certain equity-based awards made to employees and directors. In September 2010, an executive surrendered 18,675 shares of Common Stock with a fair value of $195,000 in order to pay taxes due in connection with the vesting of a stock-based compensation award. This surrender was accounted for as a repurchase of Common Stock.
Shares of common stock repurchased by the Company are recorded at cost as treasury stock and result in a reduction of stockholders' equity in the accompanying consolidated balance sheets. When shares are reissued, the Company will use the weighted average cost method for determining cost. The difference between the cost of the shares and the issuance price is added or deducted from additional paid-in capital.
64
12. SEGMENT INFORMATION
The Company has four distinct product lines: Medication Management systems, Blood and Biologics Management systems, Performance Management systems and Perioperative Management systems. Based on similar economic characteristics, as well as the nature of products, production processes, customers and distribution methods, the Company has aggregated these four product lines into one reporting segment. Revenues by product line are as follows (in thousands):
|
For the Twelve Months Ended
|
||||||||||||
|
June 30,
|
||||||||||||
|
2011
|
2010
|
2009
|
||||||||||
|
Medication Management Systems:
|
||||||||||||
|
System sales
|
$ | 7,855 | $ | 5,742 | $ | 5,156 | ||||||
|
Services
|
19,517 | 17,889 | 14,407 | |||||||||
|
Billing and collections
|
4,109 | 2,084 | - | |||||||||
| 31,481 | 25,715 | 19,563 | ||||||||||
|
Blood and Biologics Management Systems:
|
||||||||||||
|
System sales
|
6,161 | 4,580 | 4,916 | |||||||||
|
Services
|
15,738 | 14,748 | 15,296 | |||||||||
| 21,899 | 19,328 | 20,212 | ||||||||||
|
Performance Management Systems:
|
||||||||||||
|
System sales
|
397 | 541 | 9 | |||||||||
|
Services
|
1,049 | 1,166 | 27 | |||||||||
| 1,446 | 1,707 | 36 | ||||||||||
|
Perioperative Management Systems:
|
||||||||||||
|
System sales
|
- | 55 | 10 | |||||||||
|
Services
|
697 | 811 | 864 | |||||||||
| 697 | 866 | 874 | ||||||||||
|
Total
|
$ | 55,523 | $ | 47,616 | $ | 40,685 | ||||||
Billing and collections revenue is generated from the acquired assets of ARI, and to a lesser extent, certain assets of CareCentric.
65
Selected financial information by geographic area is as follows (in thousands):
|
For the Year Ended June 30,
|
||||||||||||
|
2011
|
2010
|
2009
|
||||||||||
|
Revenue:
|
||||||||||||
|
United States
|
$ | 48,774 | $ | 41,269 | $ | 34,815 | ||||||
|
United Kingdom
|
6,749 | 6,347 | 5,870 | |||||||||
|
Total
|
$ | 55,523 | $ | 47,616 | $ | 40,685 | ||||||
|
Net Income:
|
||||||||||||
|
United States
|
$ | 5,491 | $ | 2,423 | $ | 972 | ||||||
|
United Kingdom
|
801 | 819 | 602 | |||||||||
|
Total
|
$ | 6,292 | $ | 3,242 | $ | 1,574 | ||||||
|
As of June 30,
|
||||||||||||
| 2011 | 2010 | |||||||||||
|
Total Assets:
|
||||||||||||
|
United States
|
$ | 77,815 | $ | 64,226 | ||||||||
|
United Kingdom
|
8,995 | 6,959 | ||||||||||
|
Total
|
$ | 86,810 | $ | 71,185 | ||||||||
13. SELECTED QUARTERLY FINANCIAL DATA (UNAUDITED)
Unaudited quarterly financial data for fiscal 2011 and 2010 is as follows (table in thousands, except per share amounts):
|
Fiscal Year 2011
|
||||||||||||||||
|
First
|
Second
|
Third
|
Fourth
|
|||||||||||||
|
Net sales and service
|
$ | 12,530 | $ | 13,243 | $ | 13,774 | $ | 15,976 | ||||||||
|
Gross profit (1)
|
8,365 | 8,997 | 9,201 | 10,527 | ||||||||||||
|
Net income
|
1,052 | 1,735 | 1,403 | 2,102 | ||||||||||||
|
Net income per share, basic
|
$ | 0.13 | $ | 0.22 | $ | 0.18 | $ | 0.26 | ||||||||
|
Net income per share, diluted
|
$ | 0.13 | $ | 0.21 | $ | 0.17 | $ | 0.25 | ||||||||
|
Fiscal Year 2010
|
||||||||||||||||
|
First
|
Second
|
Third
|
Fourth
|
|||||||||||||
|
Net sales and service
|
$ | 10,744 | $ | 10,816 | $ | 12,806 | $ | 13,250 | ||||||||
|
Gross profit (1)
|
7,391 | 7,187 | 8,513 | 8,894 | ||||||||||||
|
Net income
|
619 | 783 | 891 | 949 | ||||||||||||
|
Net income per share, basic
|
$ | 0.08 | $ | 0.10 | $ | 0.11 | $ | 0.12 | ||||||||
|
Net income per share, diluted
|
$ | 0.08 | $ | 0.10 | $ | 0.11 | $ | 0.12 | ||||||||
(1) Excludes amortization of capitalized software costs
66
14. SUBSEQUENT EVENTS
The Company has performed its subsequent events review through the filing of these financial statements.
MEDIWARE INFORMATION SYSTEMS, INC.
SCHEDULE II - VALUATION AND QUALIFYING ACCOUNTS
(in thousands)
|
Description
|
Balance at Beginning of Period
|
Charged to Costs and Expenses
|
Charged to Other Accounts
|
Deductions
|
Balance at End of Period
|
|||||||||||||||
|
Year ended June 30, 2011 allowance for doubtful accounts
|
$ | 1,090 | $ | 561 | $ | - | $ | (217 | ) | $ | 1,434 | |||||||||
|
Year ended June 30, 2010 allowance for doubtful accounts
|
$ | 754 | $ | 583 | $ | - | $ | (247 | ) | $ | 1,090 | |||||||||
|
Year ended June 30, 2009 allowance for doubtful accounts
|
$ | 748 | $ | 197 | $ | - | $ | (191 | ) | $ | 754 | |||||||||
67