Attached files
| file | filename |
|---|---|
| 8-K - FORM 8-K - MModal Inc. | w84211e8vk.htm |
Exhibit 99.1

| INVESTOR MEETINGS: September 2011 |

| Safe harbor language reconciliation of nongaap measures Information provided and statements contained in this presentation that are not purely historical, such as statements regarding the Company’s 2011 financial and operating performance, are forward-looking statements within the meaning of Section 27A of the Securities Act of 1933, Section 21E of the Securities Exchange Act of 1934 and the Private Securities Litigation Reform Act of 1995. Such forward-looking statements only speak as of the date of this presentation and MedQuist Holdings Inc. assumes no obligation to update the information included in this presentation. Statements made in this presentation that are forward-looking in nature may involve risks and uncertainties. Accordingly, readers are cautioned that any such forward-looking statements are not guarantees of future performance and are subject to certain risks, uncertainties and assumptions that are difficult to predict, including, without limitation, specific factors discussed herein and in other disclosures and public filings made by MedQuist Holdings Inc., including filings with the SEC. Although MedQuist Holdings believes that the expectations reflected in such forward-looking statements are reasonable as of the date made, expectations may prove to have been materially different from the results expressed or implied by such forward-looking statements. In addition to the US GAAP results, MedQuist Holdings has provided certain non-GAAP financial measures in this presentation such as Adjusted EBITDA and Adjusted Net Income Per Share - Adjusted for IPO and Exchange Offer. The tables in the appendix to this presentation include a reconciliation of the historical non-GAAP financial measures to the most directly comparable GAAP financial measures. The Company does not present in the presentation the comparable GAAP financial measure and the related reconciliation for the forward looking non-GAAP financial measures included in this presentation because management cannot predict with sufficient reliability certain contingencies required to estimate the comparable GAAP financial measures. |
| Company mission Delivering innovative solutions that capture the patient's story; facilitating clinical workflow, enabling collaboration and providing insight for improved delivery of care. |

| 4 Company Confidential Passion - about healthcare; results Intensity - in everything we do Value - for the customer Integrity - always do the right thing Company operating principles |
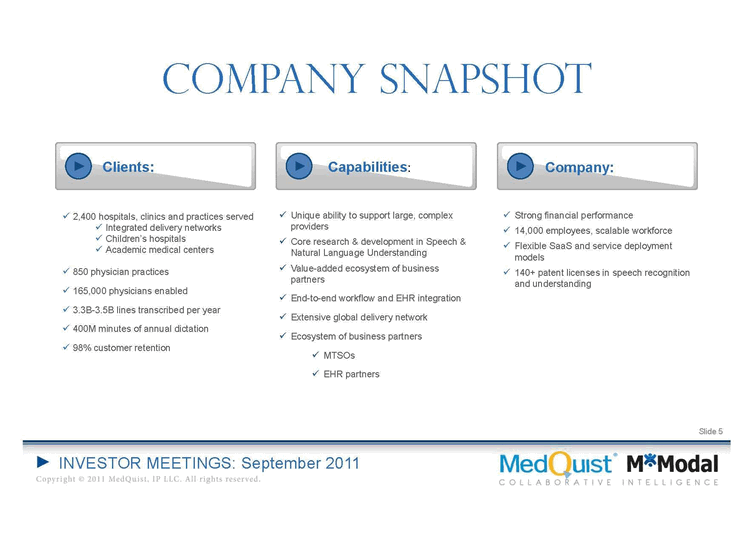
| Company snapshot Clients: Capabilities: Company: 2,400 hospitals, clinics and practices servedIntegrated delivery networksChildren's hospitalsAcademic medical centers850 physician practices165,000 physicians enabled3.3B-3.5B lines transcribed per year400M minutes of annual dictation98% customer retention Unique ability to support large, complex providersCore research & development in Speech & Natural Language UnderstandingValue-added ecosystem of business partnersEnd-to-end workflow and EHR integrationExtensive global delivery networkEcosystem of business partnersMTSOsEHR partners Strong financial performance14,000 employees, scalable workforceFlexible SaaS and service deployment models140+ patent licenses in speech recognition and understanding |

| Arizona UPMC Shadyside * Representative Sample Dynamic Network of Providers |

| The marketplace Trends: Pie 1 MedQuist 7.99999982118607E-02 Nuance 7.00000002980232E-02 Transcend 1.99999995529652E-02 Local / Regional Providers 0.829999983310699 (NASDAQ:TRCR) Increased volume, reduced cost.Consolidation is increasing the size and complexity of transcription requirements.In-house transcription continues to move to outsource providers.Technology-enablement is insufficient to ensure Meaningful Use and support for increased accountability. 2% Local / Regional Providers83% (NASDAQ:NUAN) 7% 8% Total 2010E Outsourced Market of $5.8B (4) 2010E Outsourced Market Share (1) 2010E revenue calculated as annualized run-rate based on quarter ending September 30, 2010, to give effect for full year Spheris revenues (2) Represents FY 2010A (ending September 30, 2010) revenue attributable to healthcare dictation operating segment(3) 2010E revenue calculated as annualized run-rate based on quarter ending September 30, 2010(4) ValueNotes, "The US Medical Transcription Industry", March 2010 (1) (2) (3) |
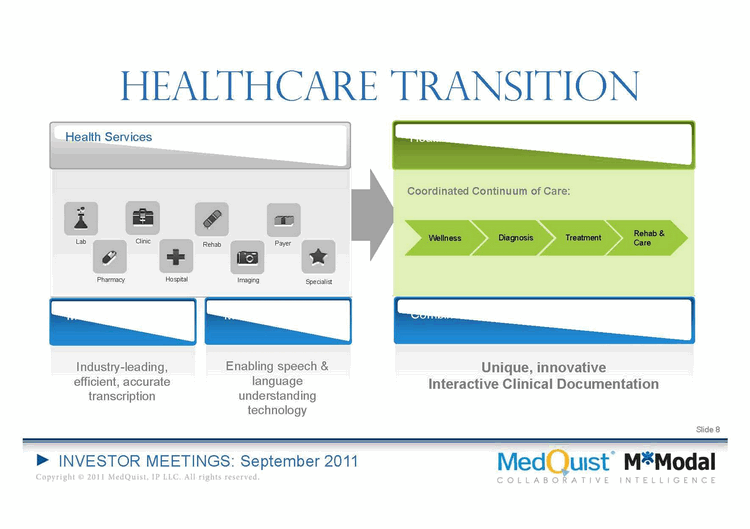
| Healthcare transition Health Management Wellness Diagnosis Treatment Rehab & Care Coordinated Continuum of Care: Needs-basedIntegrated coordinationFee-for-valueOutcomes-focused Fragmented Service Providers: Health Services Lab Payer Imaging Clinic Pharmacy MedQuist Delivered: Industry-leading, efficient, accurate transcription M*Modal Delivered: Enabling speech & language understanding technology |

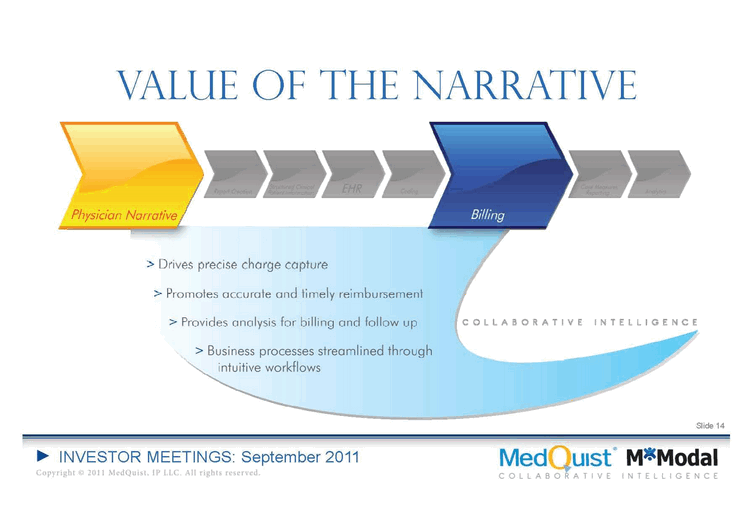
| Value of the narrative Proactively disseminating the information at the critical junctures in your clinical documentation workflow elevates quality and performance across the entire continuum. |

| Value of the narrative |

| Value of the narrative |

| Value of the narrative |

| Value of the narrative |
| Value of the narrative |

| Value of the narrative |

| Value of the narrative |

| Strategic priorities Continued leadership in core transcription businessesWin new business; expand share w/ existing customersContinue to capitalize on industry consolidationExpand ecosystem of partnersCultivate industry leadership (luminaries, academics, specialties)Launch innovative, new products/servicesDevelop/implement brandsDevelop/implement organizational model |

| Financial Overview |

| Financial overview:Key Messages Q2 2011 bottom line results in line with plan for FY 2011Volume, Adjusted EBITDA and Adjusted Net Income Per Fully Diluted Share up year-over-year on stabilization of Spheris book of business resultsAdjusted EBITDA margin and free cash flow generation up significantly over prior yearAcquisition activity accelerates to add new layer of growthM*Modal: gained HSR approval on August 15 and closed on August 18All Type: closed on September 1Market environment continues to play to our strengthsLarge systems are acquisitive - Same-store opportunities Smaller clinical documentation providers struggling to compete - acquisition opportunities are robust |
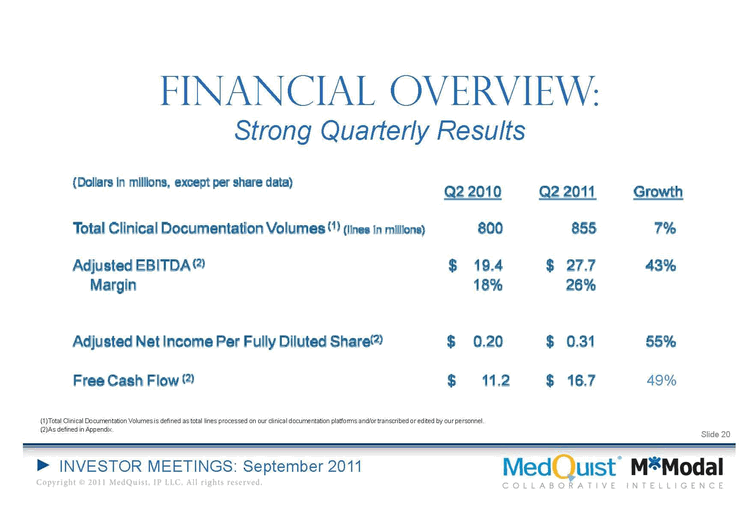
| Financial overview:Strong Quarterly Results Total Clinical Documentation Volumes is defined as total lines processed on our clinical documentation platforms and/or transcribed or edited by our personnel.As defined in Appendix. 49% |

| Financial overview:Key Indicators & Drivers of Q2 2011 Growth Growth in Total Clinical Documentation Volumes (1)855 million lines in Q2 2011 vs. 800 million lines in Q2 2010Up year-over-year on Spheris acquisitionVolumes decreased sequentially by 1% from Q1 2011 Increase in offshore production inventoryCustomer demand accelerating and sizable inventory buildingSize and complexity of work required more conservative conversionsPercentage of total transcription volumes up from Q2 2010Expect to reach goal of 50% offshore production by year endIncrease in editing post-spee ch recognition74% vs. 62% of total transcription volumes in Q2 2010Continues to enhance productivity and significantly reduce direct costs Total Clinical Documentation Volumes is defined as total lines processed on our clinical documentation platforms and/or transcribed or edited by our personnel. |

| Financial overview:Building on Long-Term Track Record Expressed as percentage of Total Clinical Documentation Volumes.As defined in Appendix. |
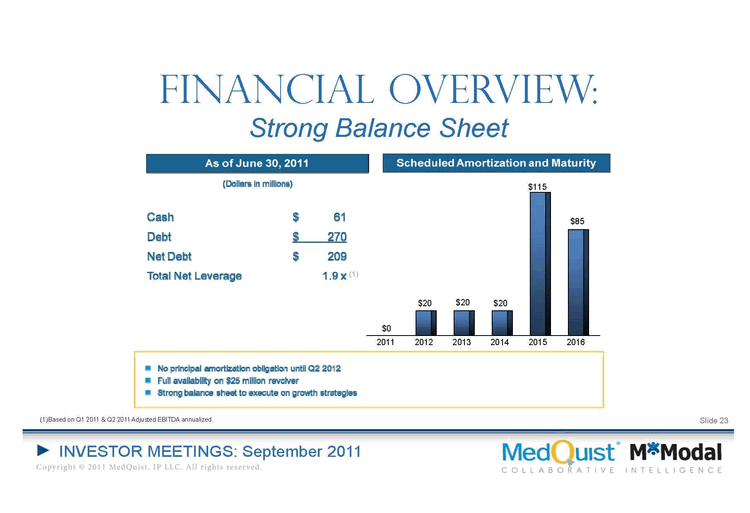
| Financial overview:Strong Balance Sheet 2011 2012 2013 2014 2015 2016 East 0 20 20 20 115 85 Based on Q1 2011 & Q2 2011 Adjusted EBITDA annualized. (1) |
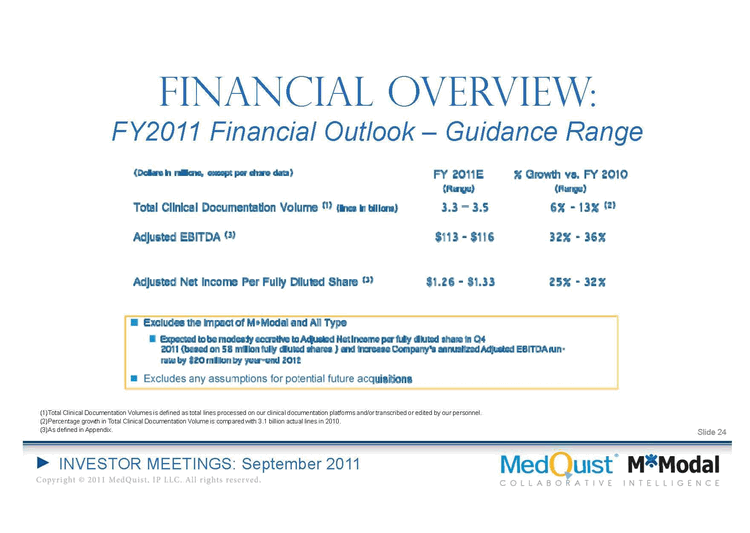
| Financial overview:FY2011 Financial Outlook - Guidance Range Total Clinical Documentation Volumes is defined as total lines processed on our clinical documentation platforms and/or transcribed or edited by our personnel.Percentage growth in Total Clinical Documentation Volume is compared with 3.1 billion actual lines in 2010.As defined in Appendix. |

| Appendix |
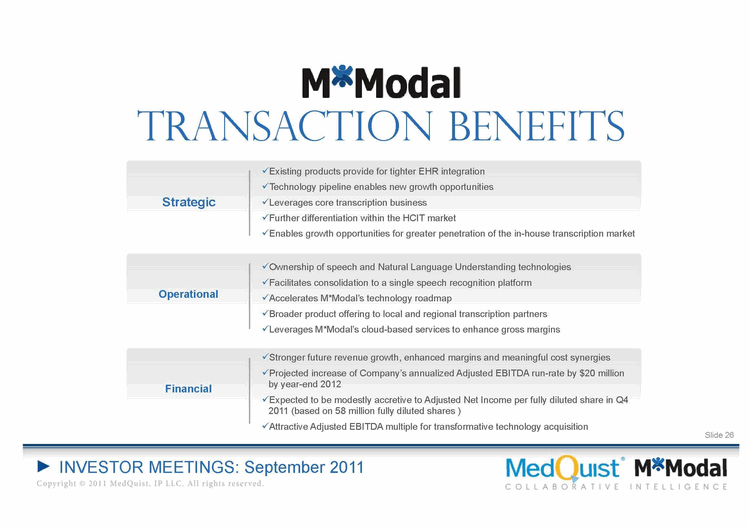
| transaction benefits Stronger future revenue growth, enhanced margins and meaningful cost synergiesProjected increase of Company's annualized Adjusted EBITDA run-rate by $20 million by year-end 2012Expected to be modestly accretive to Adjusted Net Income per fully diluted share in Q4 2011 (based on 58 million fully diluted shares )Attractive Adjusted EBITDA multiple for transformative technology acquisition Existing products provide for tighter EHR integrationTechnology pipeline enables new growth opportunitiesLeverages core transcription businessFurther differentiation within the HCIT marketEnables growth opportunities for greater penetration of the in-house transcription market Strategic Ownership of speech and Natural Language Understanding technologiesFacilitates consolidation to a single speech recognition platformAccelerates M*Modal's technology roadmapBroader product offering to local and regional transcription partnersLeverages M*Modal's cloud-based services to enhance gross margins Operational Financial |

| Transaction summary $48.4 million in cash and 4.1 million shares of common stock at closing$28.8 million in installments paid over 3 yearsCash consideration funded from available cashCredit agreements amended to improve senior and subordinated lender covenants |
| Financial profile Recurring revenue model provides excellent visibility Current revenue run rate of $24 million, including amounts billed to MedQuist Experiencing rapid revenue growth: 57% in 2010 Attractive gross margins support ongoing technology investment Strong operating profit margins: over 30% in 2010 |

| Non-gaap reconciliation |

| Non-gaap reconciliation |

| Non-gaap reconciliation Three Months Ended Three Months Ended June 30, June 30, March 31, 2011 2010 2009 MedQuist Holdings Shares MedQuist Holdings Shares Basic outstanding 49,168 35,078 34,442 Effect of dilutive options 1,391 - - Diluted shares 50,559 35,078 34,442 Proforma impact of fully dilutive stock(1) Proforma impact of fully dilutive stock(1) Basic 1,929 15,775 15,774 Diluted 2,176 16,005 15,774 Proforma Shares Outstanding for IPO and Exchange Offer Proforma Shares Outstanding for IPO and Exchange Offer Basic 51,097 50,853 50,216 Fully Diluted 52,735 51,083 50,216 Share Calculation (In thousands) Fully dilutive shares includes common stock equivalents which consists of stock options, restricted stock issuable to certain key employees, shares issued to former principal stockholders, shares issued in our Initial Public Offering, Private Exchange and Initial Exchange Offer and sharesissuable to remaining noncontrolling shareholders of MedQuist Inc. |

| Non-gaap financial definitions Non-GAAP Financial MeasuresWe have provided the Company's Adjusted EBITDA, a non-GAAP financial measure, on a forward-looking basis in this document. We are unable to present a quantitative reconciliation of this forward-looking non-GAAP financial measures to the most directly comparable forward-looking GAAP financial measure because management cannot predict, with sufficient reliability, contingencies relating to potential changes in tax valuation allowances, potential changes to customer accommodation accruals, potential restructuring impacts, contingencies related to past and future acquisitions, and changes in fair values of our derivative instruments, all of which are difficult to estimate primarily due to dependencies on future events.Adjusted Net IncomeAdjusted Net Income, a non-GAAP financial measure, is defined by the Company as Adjusted EBITDA less amortization expense for capitalized intangible assets (excluding acquired intangibles), less interest expense (net of non-cash interest), and less current tax provision. We measure Adjusted Net Income based on Proforma Shares Outstanding (see below). Management believes that utilization of Adjusted Net Income is an important non-GAAP financial measure of our normalized operating results. Proforma Shares Outstanding For purposes of evaluating our results on per-share metrics, many of our computations utilize proforma share computations. Our measure of proforma shares includes our Basic and Diluted share computations utilized for GAAP purposes, plus our estimate of the impacts of common stock equivalents which consists of stock options, restrictive stock issuable to certain key employees, shares issued to former principal stockholders, shares issued in our Initial Public Offering, Private Exchange and Initial Exchange Offer and shares issuable to remaining noncontrolling shareholders of MedQuist Inc.Free Cash FlowFree Cash Flow, a non-GAAP financial measure, is defined by the Company as Adjusted EBITDA less consolidated interest expense (net of non-cash interest), less capital expenditures (including capitalized software development costs), and less current tax provision. Management believes that utilization of Free Cash Flow is an important non-GAAP measure of the Company's ability to convert operating results into cash. |
| Non-gaap financial definitions Adjusted EBITDAAdjusted EBITDA is a metric used by management to measure operating performance. Adjusted EBITDA is defined as net income (loss) attributable to MedQuist Holdings Inc., as applicable, plus net income attributable to noncontrolling interests, income taxes, interest expense, net, depreciation and amortization, cost (benefit) of legal proceedings, settlements, and accommodations, acquisition and restructuring charges, the effect of the sale of our Patient Financial Services business (discontinued operations), equity in income of affiliated company and share based compensation and other non cash awards. We present Adjusted EBITDA as a supplemental performance measure because we believe it facilitates operating performance comparisons from period to period and company to company by backing out the following: • potential differences caused by variations in capital structures (affecting interest expense, net), tax positions (such as the impact on periods or companies for changes in effective tax rates), the age and book depreciation of fixed assets (affecting depreciation expense);• the impact of non-cash charges; and• the impact of acquisition and integration related charges, restructuring charges, and certain unusual or nonrecurring items. Because Adjusted EBITDA facilitates internal comparisons of operating performance on a more consistent basis, we also use Adjusted EBITDA in measuring our performance relative to that of our competitors. Adjusted EBITDA is not a measurement of our financial performance under GAAP and should not be considered as an alternative to net income, operating income or any other performance measures derived in accordance with GAAP or as an alternative to cash flow from operating activities as measures of our profitability or liquidity. We understand that although Adjusted EBITDA is frequently used by securities analysts, lenders and others in their evaluation of companies, Adjusted EBITDA has limitations as an analytical tool, and you should not consider it in isolation, or as a substitute for analysis of our results as reported under GAAP. Some of these limitations are: • Adjusted EBITDA does not reflect our cash expenditures or future requirements for capital expenditures or contractual commitments;• Adjusted EBITDA does not reflect changes in, or cash requirements for, our working capital needs;• Although depreciation is a non-cash charge, the assets being depreciated will ofte n have to be replaced in the future, and Adjusted EBITDA does not reflect any cash requirements for such replacements; and• Other companies in our industry may calculate Adjusted EBITDA differently than we do, limiting its usefulness as a comparative measure. |
