Attached files
| file | filename |
|---|---|
| 8-K - FORM 8-K - Fortune Brands Home & Security, Inc. | d8k.htm |
 Fortune Brands Home and Security
Investor Presentation
September 2011
Exhibit 99.1 |
 2
Disclaimer
Please note that the information included in this presentation contains
statements relating to future results, which are forward-looking
statements. We caution you that these forward-looking statements
speak only as of the date hereof, and we have no obligation to update
them. Actual results may differ materially from those projected as a
result of certain risks and uncertainties, including the risks described in
our Registration Statement on Form 10, as amended. There can be no
assurance that the spin-off of Fortune Brands Home & Security, Inc. will
be completed as anticipated or at all. |
 3
Distribution Date
Distributing Company
Transaction Overview
Distributed Company
Distributed Securities
Dividend Policy
Fortune Brands, Inc. (NYSE: FO), to be renamed Beam Inc. (NYSE: BEAM) after
distribution Fortune Brands Home & Security, Inc. (NYSE: FBHS)
100% of outstanding shares of Fortune Brands Home & Security common
stock Distribution Ratio
One
share
of
Fortune
Brands
Home
&
Security
common
stock
for
one
share
of Fortune Brands common stock
Recapitalization of
FBHS / Dividend to FO
Initially,
Fortune
Brands
Home
&
Security
does
not
intend
to
pay
a
dividend
on
its
common
stock
Fortune Brands Home & Security has entered into a $1.0 billion of credit
facility and will dividend $500 million to Fortune Brands prior to
spin-off Fortune Brands Home & Security is expected to have
approximately $520 million of debt immediately following spin-off
Record Date
September 20, 2011
October 3, 2011 |
 4
Today’s Presenters
Chris Klein
Chief Executive Officer
Lee Wyatt
Chief Financial Officer |
 5
FBHS has multiple brands that appeal to consumers and the
trade focused in home products, security and storage.
Our Partners
Our Brands |
 6
Our Mission
At Fortune Brands Home & Security, our
Mission is to create products
and services that help fulfill
the dreams of homeowners
and help people feel more secure |
 7
Winning New
Business
Expanding in
Adjacent Categories
and
International Markets
Using Cash Flow
to Maximize
Shareholder Value
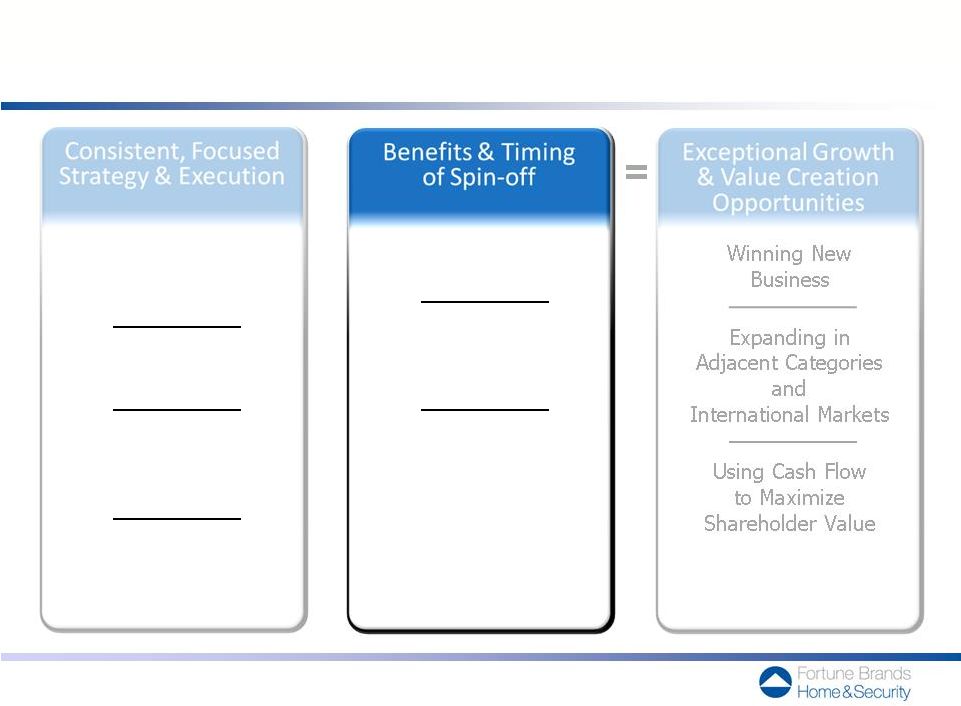
An Outperforming Industry Leader Well-Positioned
to Accelerate Growth and Create Value
Attractive Home
& Security Product
Categories & Positions
Consumer
& Customer Focus
Operational
& Management
Excellence
Demonstrated Ability
to Outperform
the Market
Benefits of
Being Independent
Strong Cash Flow
& Flexible Capital
Structure
Front-end of
Housing Market
Recovery
Consistent, Focused
Strategy & Execution
Benefits & Timing
of Spin-off
Exceptional Growth
& Value Creation
Opportunities |
 8
An Outperforming Industry Leader Well-Positioned
to Accelerate Growth and Create Value
Attractive Home
& Security Product
Categories & Positions
Consumer
& Customer Focus
Operational
& Management
Excellence
Demonstrated Ability
to Outperform
the Market |
 9
FBHS has a strong foundation built on systematic innovation, strong brands,
excellent customer service and balanced channels of distribution. We believe
this foundation can be leveraged to create attractive growth and
returns.
Solid Business Foundation
Strong branding opportunities
–
To consumer and/or to trade
–
Underpins channel strength
Strong
innovation
opportunities
–
Functionality
–
Fashion/finish
–
Material conversion
Excellent customer service
Balance
across
end
markets
–
New Construction and Repair & Remodel
–
Retail and Wholesale
…
and Opportunities
for Leveraged Returns
Operating leverage
—
Scale efficiencies
and global supply chains
Complexity
—
Ability to add value and/or service
Strong channel mix
—
Ability to deliver products/services
across a balance of channels
Growth opportunities
—
Share gains, substantial adjacency
opportunities and potential
add-on acquisitions |
 10
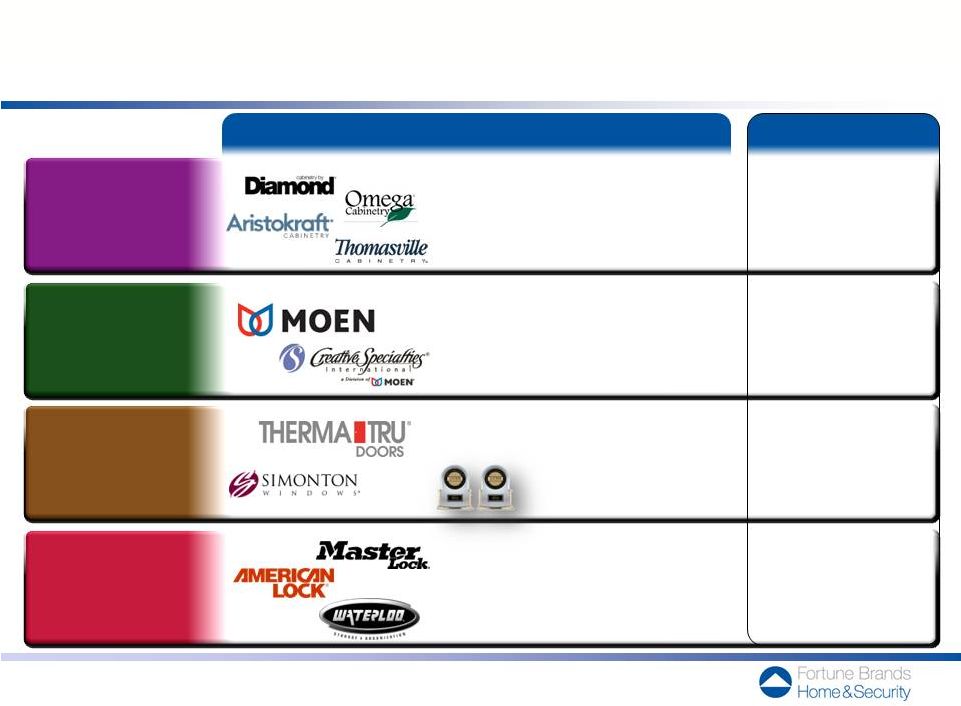
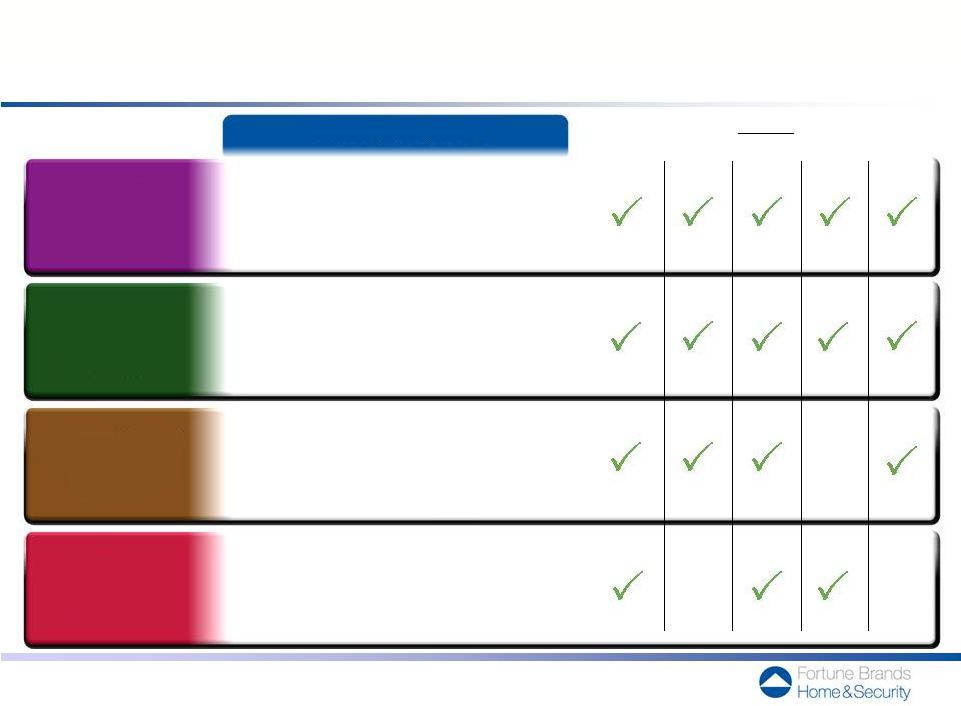
Brand Leadership
Position
Leading Brands and Differentiated Positions in Each Category
Fully integrated platform,
poised to leverage scale
across multiple brands,
channels and price points
Powerful engine
for consistent growth
and profitability
Leaders poised
to leverage the
market recovery
Exceptional brand with
growth potential well
beyond padlocks;
more stable market not
tied to housing cycle
Kitchen & bath
cabinet manufacturer
in North America
Faucet brand
in North America
Fiberglass residential
entry door brand in U.S.
Padlock brand
in North America
#1
#1
#1
#1
Winner of two consumer
and five builder awards
from JD Power
Kitchen
& Bath
Cabinetry
Plumbing
&
Accessories
Advanced Material
Windows & Door
Systems
Security
&
Storage |
 11
Channel Positioning
Deep and Broad Channel Strength
Specialized distribution for
specific channel/customer needs
Broad channel presence across
price points and demographics
Provides distinct value to retail chains
Deep builder relationships
Halo effect on wholesale channel
Global momentum
in key international markets
Exclusive arrangements
with strong two-step distributors
Strong trade brand fosters loyal
distributor/customer relationships
Considerable strength in locksmith channel
Widespread distribution across retail channels
Commercial market / Channel momentum
Home
centers
Dealers
&
Showrooms
Wholesale
2-Step
Other
Retail
Builders
Kitchen
& Bath
Cabinetry
Plumbing
&
Accessories
Advanced Material
Windows & Door
Systems
Security
&
Storage |
 12
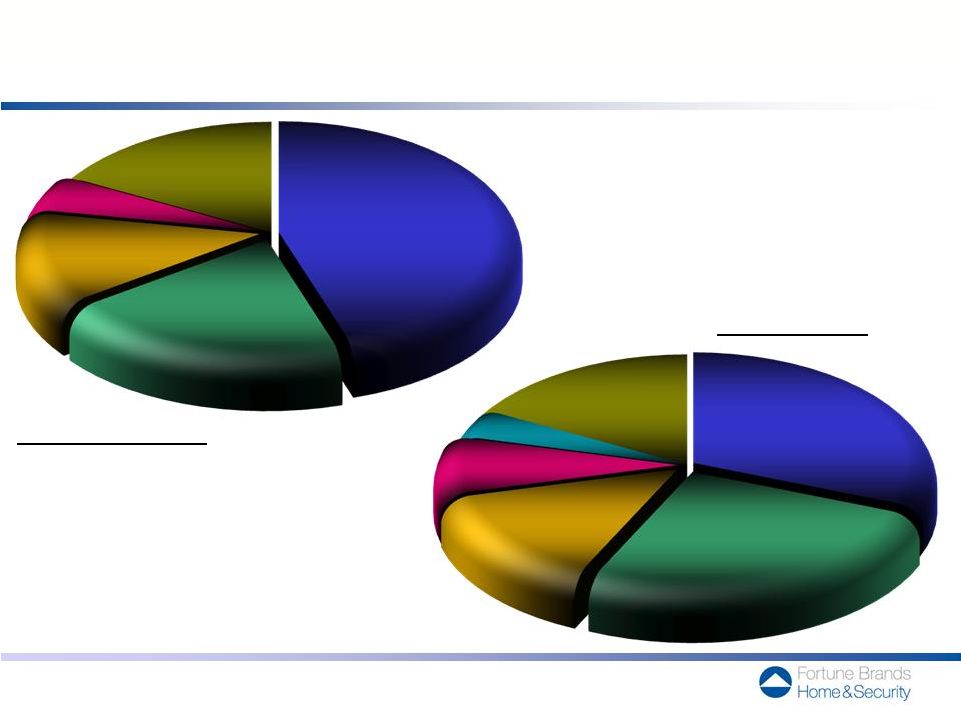
Well-Balanced Business Mix
by
End
Market*
by
Channel*
* Source: Company internal estimates for year ended December 31, 2010
Repair & Remodel
45%
New Construction
20%
Security & Storage
13%
Commercial
5%
International
17%
Wholesale
31%
Home Centers
26%
Dealer
14%
Other Retail 8%
International
17%
Builder Direct
4% |
 13
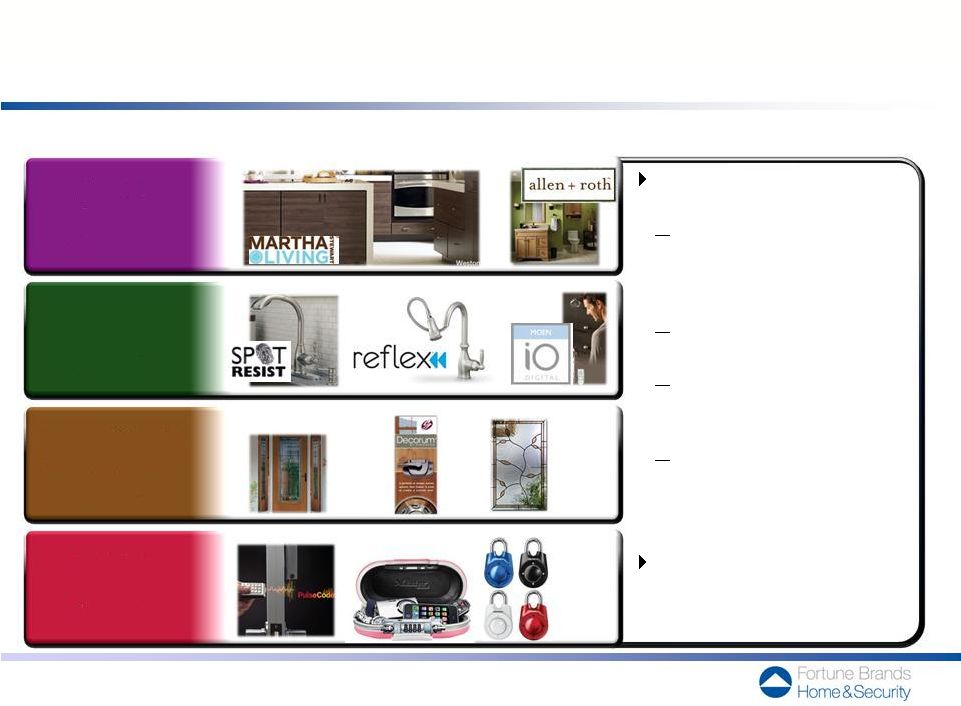
Consumer Driven Innovation has led to Consistently Winning
Profitable New Business
Track
Record
of
Leading
New
Product
Launches
across
all
Business
Segments
Vented Sidelites
New
Glass
Styles
Electronics Storage
Speed
Dial
Padlocks
Adding value for customers
and winning new business
Martha Stewart Living
cabinetry introduced at all
US and Canadian Home Depot
stores in 2010
In-stock cabinetry at Lowe’s
rolling out in 2011
Moen expanding in home
centers and mass retail
with new products
Waterloo rolling out Husky
Garage Organization at all US
Home Depot stores in 2011
23% of 2010 sales came from
products introduced
in the last three years
Kitchen
& Bath
Cabinetry
Plumbing
&
Accessories
Advanced Material
Windows & Door
Systems
Security
&
Storage |
 14
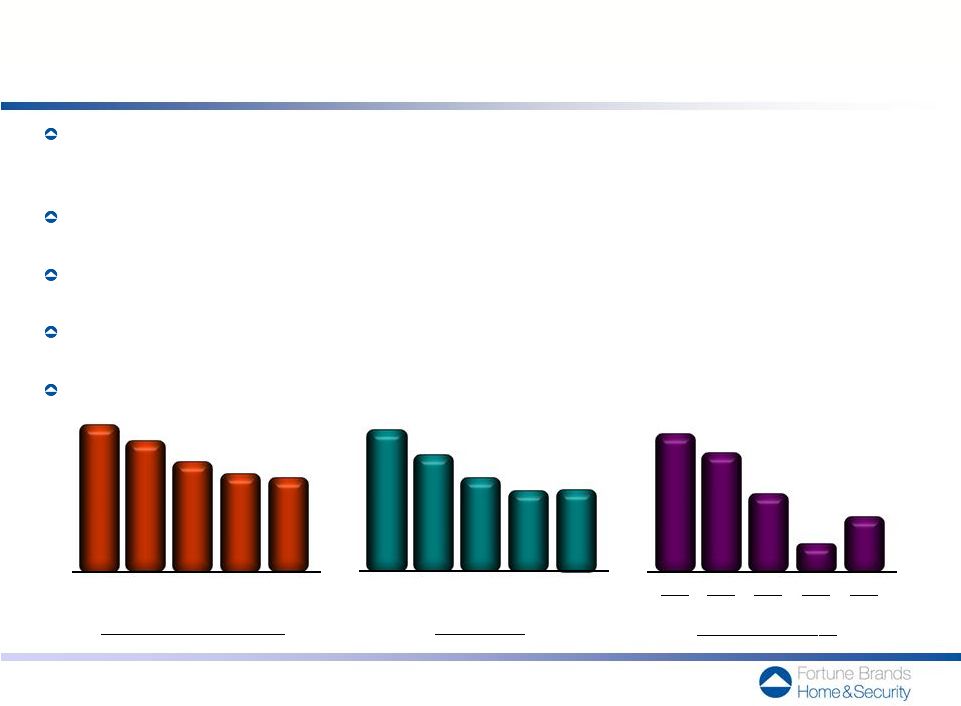
Efficient and Scalable Supply Chain / Infrastructure
Substantially improved cost structures by proactively reducing footprint nearly 40%
between 2006 –
2009 and creating more flexible supply chains
Increased productivity through continuous improvement investments
Maintaining capacity to ramp up with industry-leading service levels and lead
times Well-positioned to accelerate earnings growth as volumes grow
Can support revenue of up to $5B without capital spending above normal levels
Headcount
(000’s)
Operating Margin
Manufacturing Facilities
Sales:
1 -
Adjusted Pro Forma: before Charges / Gains, including incremental standalone
corporate expenses. 2006
2007
2008
2009
2010
2006
2007
2008
2009
2010
2006
2007
2008
2009
2010
$4.7B
$4.6B
$3.8B
$3.0B
$3.2B
27.7
64
56
47
41
40
22.8
18.4
15.8
16.1
14.2%
12.1%
8.0%
2.7%
5.6%
1 |
 15
Proven Management Team Driving Continued Growth
–
Powerful Combination of Operational & Strategic Leadership
Corporate, Stategic & Financial Leadership
Operating Management
Chris Klein
CEO
Lee Wyatt
CFO
8 years
with
Fortune
Brands
including
~
3
years
with
FBHS
and
5+
years
leading
Strategy
&
Corporate
Development
at Fortune Brands; previously a Partner at McKinsey & Co. and EVP at Bank
One Recruited as CFO of FBHS; previously CFO of Hanesbrands and led
spin-off from Sara Lee, CFO at $7B Sonic Automotive and CFO of
Sealy Greg Stoner
President –
MBCI
7 years with FBHS; previously 11 years with Newell Rubbermaid and 9 years with
GE; drove rationalization efforts through the downturn in 2009; managed
MBCI as it became the #1 cabinet manufacturer in North America in
2011 David Lingafelter
President –
Moen
21 years with FBHS; managed transition from engineering-driven
to consumer-driven organization, leading marketing, brand investments
and new product development processes
David Randich
President –
Therma-Tru
Mark Savan
President –
Simonton
4 years with FBHS; previously 24 years with Armstrong; repositioned business
during downturn through channel diversification and restructuring of global
supply chain 11 years with FBHS; previously 6 years with Booz Allen; led
Simonton’s transition from a building products-focused to a
consumer-focused organization John Heppner
President –
Master Lock
& CEO –
FOSS
18 years with FBHS; grew Master Lock market share
while repositioning Waterloo
Kitchen
& Bath
Cabinetry
Plumbing
&
Accessories
Advanced Material
Windows & Door
Systems
Security
&
Storage |
 16
Demonstrated growth that has exceeded the market over extended
period of time and through multiple cycles. Sales performance reflects
both organic growth and acquisitions
includes housing recessions of ‘90-’91, ‘94-’96,
‘00-’01, ‘06-’11 Sales Growth Rate
1989 2011 Projected FBHS
Organic Sales* U.S. Home Products Market
New Construction and
Replace & Remodel
FBHS
GAAP Sales
* Excludes impact from acquisitions and divestitures
4%
9%
~2%
|
 17
An Outperforming Industry Leader Well-Positioned
to Accelerate Growth and Create Value
Attractive Home
& Security Product
Categories & Positions
Consumer
& Customer Focus
Operational
& Management
Excellence
Demonstrated Ability
to Outperform
the Market
Benefits of
Being Independent
Strong Cash Flow
& Flexible Capital
Structure
Front-end of
Housing Market
Recovery
+ |
 18
Benefits of Being Independent
Clearer focus and alignment
on Home & Security priorities enables more nimble response
to growth and capital investment opportunities
Strong balance sheet and flexible capital structure
aligned to the needs of a growth company
Business unit performance
and management incentive
structure more tightly linked to overall company performance
“Pure
play”
equity
may
be
more
attractive
to
investors
who want to participate in the home market recovery |
 19
Opportune Timing of the Spin-off Ahead of Expected
Housing Market Recovery
Long-Term Home Market Drivers
Factors
that
Enable
Recovery
Positive population
and immigration growth
Increased levels of household
formation driven by demographics
Favorable housing affordability
Aging housing stock
(average of 40 years),
particularly homes >12 years
Increasing existing home sales
New
Construction
Repair
&
Remodel
Improvements in the
broader economy
and employment
–
at the local market level
Credit availability
Stability in home prices
Improving consumer
confidence |
 20
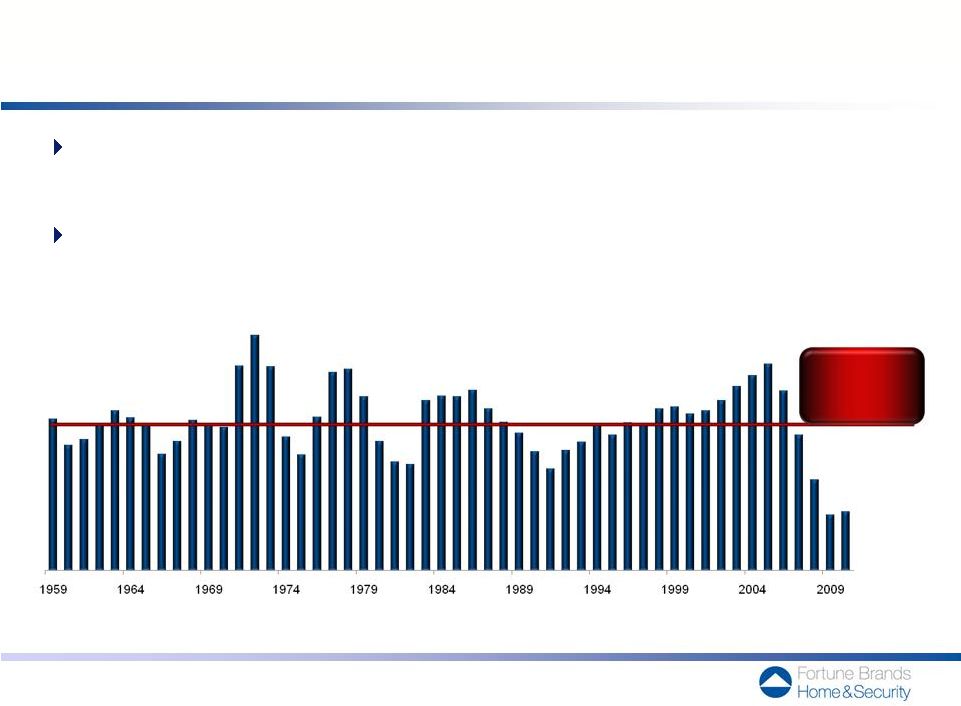
1959 –
2010
average:
1,497,000 starts
Long-Term Market Trends Point Towards
an Eventual Recovery in New Housing Starts
New housing starts are at a historically low level,
with just 587,000 starts in 2010
The long-term average, as well as demographic trends,
suggest a recovery is likely
Annual New Housing Starts
Source: US Census Bureau. Data reflects single and multi-family housing
starts. |
 21
Winning New
Business
Expanding in
Adjacent Categories
and
International Markets
Using Cash Flow
to Maximize
Shareholder Value
An Outperforming Industry Leader Well-Positioned
to Accelerate Growth and Create Value
Attractive Home
& Security Product
Categories & Positions
Consumer
& Customer Focus
Operational
& Management
Excellence
Demonstrated Ability
to Outperform
the Market
Benefits of
Being Independent
Strong Cash Flow
& Flexible Capital
Structure
Front-end of
Housing Market
Recovery
Consistent, Focused
Strategy & Execution
Benefits & Timing
of Spin-off
Exceptional Growth
& Value Creation
Opportunities |
 22
Consumers have a latent need
to maximize functional storage space
MBCI has launched hundreds
of practical functional solutions fitting
many different consumer needs
Physical challenges
Organomics / Ergonomics
Occupying the valuable toe-kick space
High density storage of "Super Cab"
Differentiation is an
aspiration for consumers
By engaging advanced
technology and High-Tech
Materials, we are able to
bring fashionable color to
consumers at an affordable price
Started with the key insight that Consumers want
faucets that are easier to clean and don’t show
water spots or fingerprints
Moen developed an innovative new finish that virtually
eliminates water spotting and finger printing
Moen activated the market using a broad range
of traditional media, on-line techniques and strong
in-store point of purchase support from our partners
The
new
finish
increased
sell
through
by
10%
-
25%
generating significant increases for Moen and our key
partners
Our Systematic, Consumer Driven Innovation Processes Result
in New Products Consumers Love
Purestyle Technologies
Logix Storage & Organization |
 23
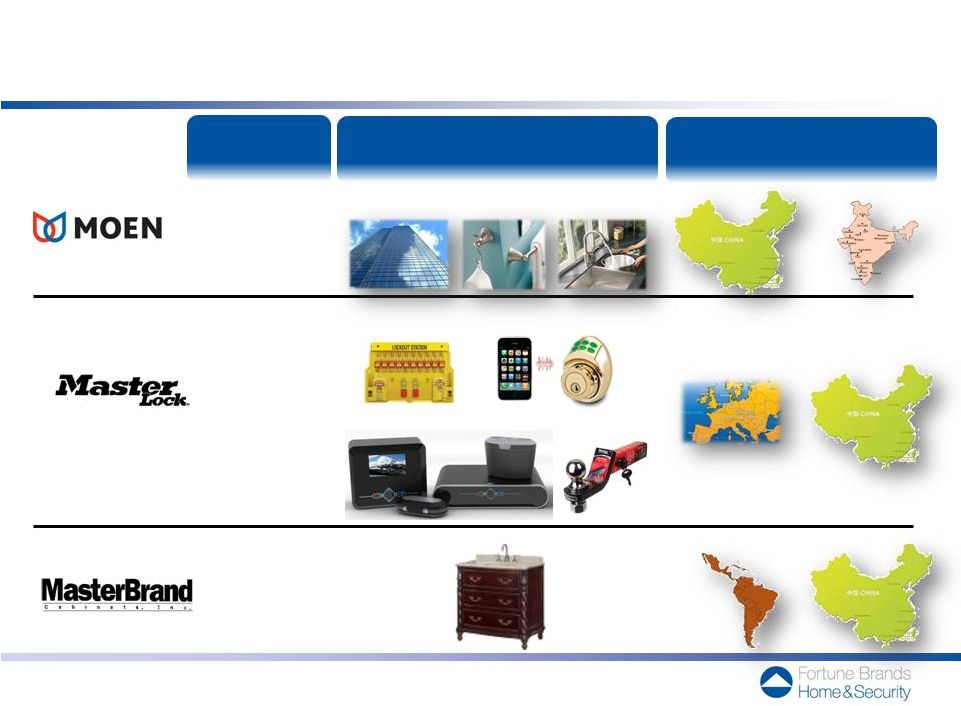
International
Markets
In Addition to Winning New Business, Potential for Expansion
in Adjacent Categories and International Markets
(Examples)
Commercial
China
India
Europe
Automotive
Latin America
Bath
Accessories
Sinks
Commercial
Safety
Electronic Security
Storage Security
Bath Vanities
China
$25B
$25B
$7B
China
Market
Opportunity
Adjacent
Categories
1
2
3
1 – N. America & China Residential & Commercial Fashion Plumbing Market includes fixtures
(bathtub/shower, toilets, sinks, other) and fittings (lavatory, bathtub/shower, kitchen/other
sink, other) ; source – Freedonia, company analysis 2 – North American Security Products (mechanical & electronic access control) and Services;
source – Freedonia, company analysis
3 – US Residential Wood Kitchen and Bath Cabinet Market; source – Freedonia, company
analysis |
 24
We will use Cash Flow to Maximize Shareholder Value
in Multiple Ways
Continue to invest in current businesses
–
products, markets, brands, supply chains
Pay down debt
Pursue accretive acquisitions or return cash to
shareholders
–
share buybacks or dividends |
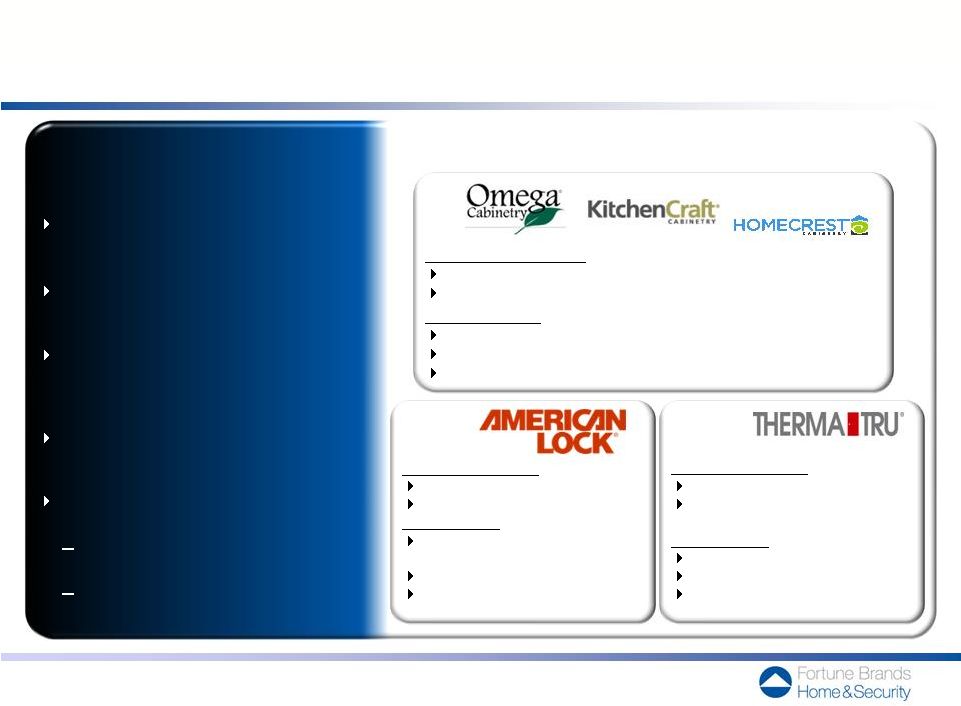 25
Target Criteria
Illustrative Past Acquisitions
Fit within our market
Primary focus
Ability to leverage existing
Good companies to be made
New home & security
Truly differentiated leader
with a capable management team
Clear path for organic growth
Acquisition Opportunities Can Accelerate Growth
in Both Home and Security Markets
What We Acquired:
Strong commercial brand
Heavy-duty commercial products
What We Did:
Leveraged combined strengths to
Maintained market facing teams
Fully integrated supply chain
What We Acquired:
Position in higher-end of dealer channel
Custom kitchen products and capabilities
What We Did:
Leveraged brand across broader dealer channel
Maintained market facing teams
Fully integrated supply chain & back office
What We Acquired:
Strong trade brand
#1 position in U.S. fiberglass
What We Did:
Grew in R&R market
Streamlined supply chain
Increased productivity
solidify #1 padlock share in N.A.
& back office
residential entry doors
attractiveness criteria
on core categories
capabilities, market positions
and structure
great, not turnarounds
categories under two conditions: |
 26
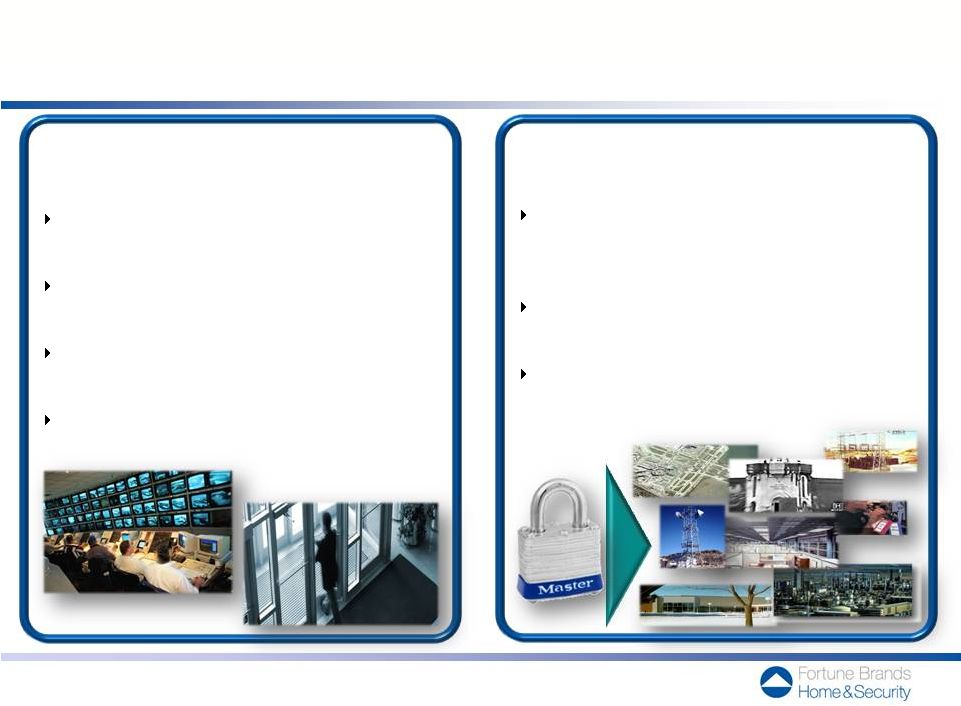
Security Market Offers Attractive Opportunities for Growth
Growing ~$25B North American Security
market
Historically stable demand
in core padlock market segment
Technology is an enabler to solve
security issues that customers value
Exploring opportunities in Electronic
Access control and monitoring
Unparalleled brand and channel
strength, particularly with distributors
and locksmiths
Existing commercial channel market
position
Solution focused innovation to meet
unmet security needs
Master Lock
has Strong Assets to Leverage
The Security Market is Attractive |
 27
FBHS Corporate Governance Structure is consistent with Fortune
Brands but supplemented with additional defenses to protect new
company
Board of Directors
•
Initially 7 members (6 independent from Fortune Brands plus Chris Klein)
•
David Thomas –
non-executive chairman
Auditors
•
External auditors –
PriceWaterhouseCoopers
•
Internal audit function and people transferring from Fortune Brands
Structural Defenses
•
Shareholder
rights
plan
–
one
year
plan
with
a
15%
trigger
•
Other appropriate protections such as classified board, no cumulative
voting, no shareholder right to call for special meetings or remove
directors other than for cause and advance notice of director
nominations |
 28
Confidence in the Fortune Brands Home & Security Opportunity
Strong belief in our strong brands and attractive categories
Well positioned, having restructured early and made substantial
strategic investments in long-term growth
Strong historical performance versus market and demonstrated operating
leverage in 2010, off the 2009 low
Long-term demographics in place to drive eventual housing market recovery
|
 29
While the housing market slump has significantly reduced sales and
profit, we believe the business is positioned to return to previous
levels when the housing market recovers
$ millions
* Adjusted Pro Forma: before Charges / Gains, including incremental standalone
corporate expenses. Net Sales
$4,694
$4,551
$3,759
$3,007
$3,234
% Growth
13%
(3%)
(17%)
(20%)
8%
Operating Income*
$668
$553
$301
$81
$180
% Operating Margin*
14%
12%
8%
3%
6%
EBITDA*
$816
$703
$435
$195
$288
% EBITDA Margin*
17%
15%
12%
6%
9%
Unlevered Free Cash Flow*
$464
$393
$325
$280
$146
Fiscal Year ending December 31
2006
2007
2008
2009
2010
adjusted Pro Forma |
 30
2011 First-half results reflect overall market decline, negative impact of 2010
home buyers credit and commodity inflation, but FBHS continued to invest in the
business and out-perform the market. Second-half expectations assume a
flat market and negative impact of 2010 energy credit, but FBHS expects to
continue to benefit from price increases, invest in the business and out-perform the market
*Assumes second half improvement in consumer confidence and overall
employment. Market
Market declined -
Assuming Market flat* -
FBHS Sales
FBHS grew 2%
We believe FBHS could grow
mid-single digits
Prior Year
New home buyer credit
Energy credit
benefited 2010
benefited 2010
Commodity Inflation
Higher costs;
Higher costs;
price increases initiated
price increases in place
Investment in Business
FBHS continued to invest
FBHS continues to invest
Competitive Promotions
Heavy in cabinets
On-going
Operating Costs
Continued cost reductions
Continuing cost reductions
1
Half
2011
Observations
2
Half
2011
Expectations
st
nd |
 31
Flexible capital structure following spin-off with strong balance sheet and cash
flow to fuel growth opportunities. Bank financing in place with strong bank
leadership group.
1.
Peer leverage metrics per Moody’s.
2.
Peers include Armstrong, Lennox, Masco, Mohawk, Owens Corning, Stanley Black &
Decker and Whirlpool. 3.
Adjusted
Pro
Forma:
before
Charges/
Gains,
including
incremental
standalone
corporate
expenses.
4.
As disclosed in Form 10
$ millions
~3.9x
1.8x
Peer Average
2
Debt-to-Capita
Barclays
Citibank
Credit Suisse
Wells Fargo
JPMorgan
Bank of America
Spin-off Capital Structure:
Term Loans
$350
Revolver ($650 facility)
150
Subsidiary Debt
20
Total Long-Term Debt
$520
Total Debt
520
Liabilities
1,083
Equity
2,107
2010 EBITDA
3
288
2010
Unlevered
Free
Cash
Flow³
146
Assets
$3,710
Balance Sheet Statistics:
(12/31/10 pro forma
4
)
Peer Debt/EBITDA Benchmarking
1
Strong Bank Leadership Group
3
3
20%
~ |
 32
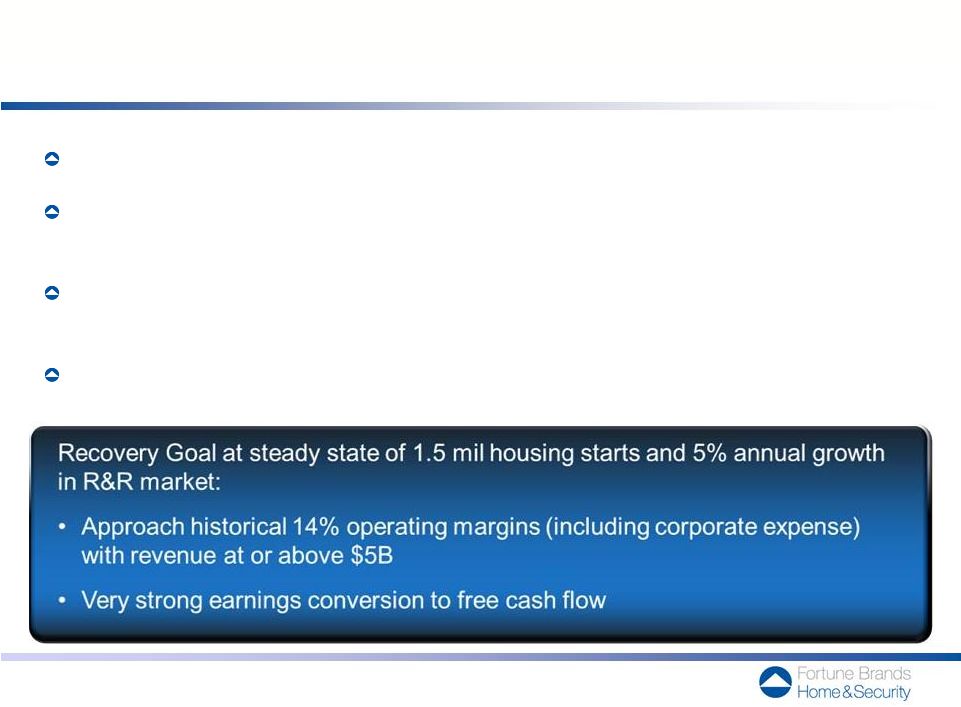
Our success is not dependent on rapid market recovery
for solid returns and cash flow, although returning
to “steady state”
is very attractive
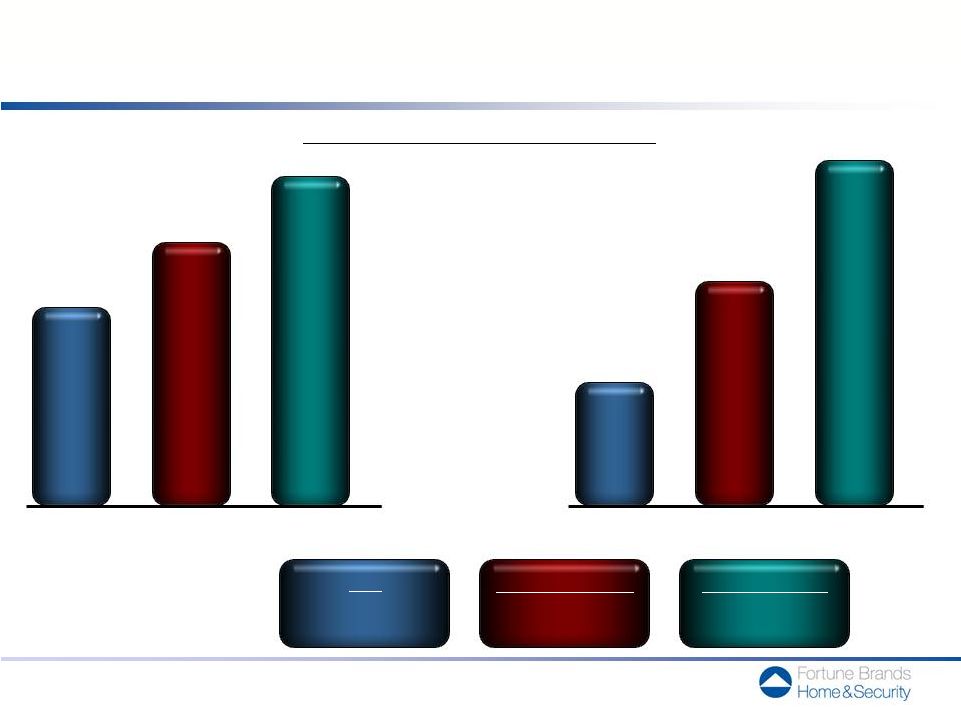
Market Recovery Scenarios
Operating Income
$200
$450
$750
Sales
annual $ in B
$3
$4
$5
EBITDA
annual $ in M
$300
$550
$850
flat
~600,000
~0%
mid-recovery
~1,000,000
~2 –
3%
steady state
~1,500,000
~4 –
6%
Housing Starts
R&R Growth
1
1.
Adjusted Pro Forma: before Charges/ Gains, including incremental standalone corporate expenses. |
 33
Ability to Leverage Our Business Model as the Market Recovers
Efficient supply chains allow us to profitably
serve a wide range of price points
Operations that support up to $5B in sales
without capital spending above normal levels
Industry leading brands can be leveraged
for both organic and acquisition growth
Leadership market positions to introduce new products
Proven management team can drive additional growth
Acquisition and integration experience
Invest in business growth
Fund acquisitions or return cash to shareholders
Brands
/
Market
Position
Supply
Chains
Management
Capital
Structure
and
Cash
Flow |
 Thank You
Any Questions? |
 Appendix |
 36
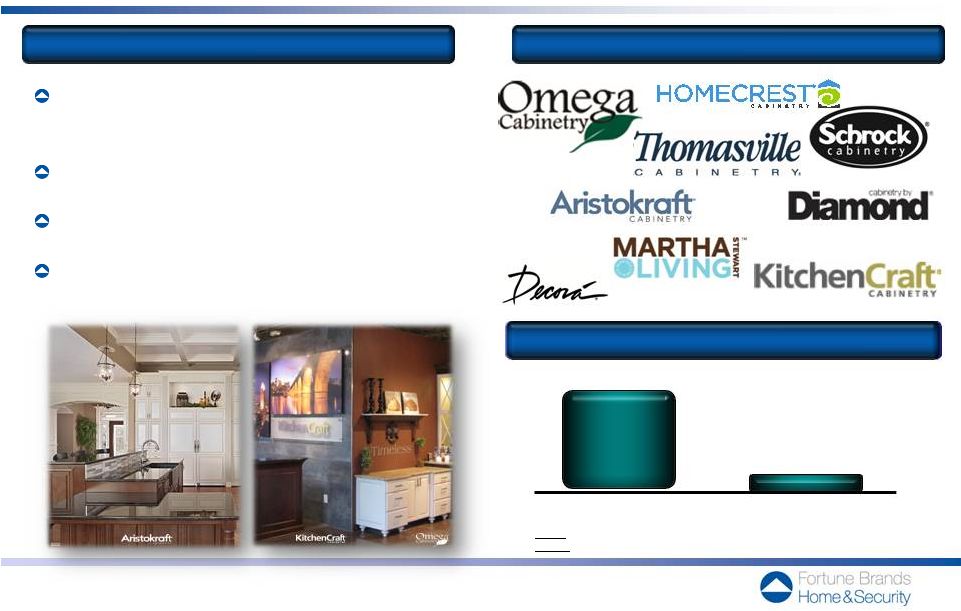
$1,189
Kitchen
&
Bath
Cabinetry
–
Fully
Integrated
Business,
Scalable
and
Poised to Leverage Across Multiple Brands, Channels and Price Points
Key Brands
Market Position Summary
Why We Win
$ millions
Notes:
Market size includes residential wood cabinets sold in US in 2010
Source: Freedonia
Differentiated brands across multiple
channels and price points
Broad participation across channels
Leading design and finish innovation
Leverage global supply chain
with local assembly model
2010 Sales
Market Size |
 37
Plumbing
&
Accessories
–
The
Engine
that
Provides
Consistent
Growth and Profitability
Notes:
Market
size
reflects
global
faucets
and
accessories
as
of
Dec.
2010
Source: Freedonia
$ millions
Key Brands
Market Position Summary
Why We Win
Strong consumer and trade brand
Leading market position
Sustainable and flexible supply chain
Large installed base helps replace / repair
Consistent ability to innovate
$924
2010 Sales
Market Size |
 Advanced Material Windows & Door Systems
–
Ready to Leverage the Market Recovery
Notes:
Market size -
US residential windows and doors in all materials as of Dec. 2010
Source: Freedonia, Ducker, FBHS analysis
$ millions
Key Brands
Market Position Summary
Why We Win
Strong market positions
Trusted trade brands
Restructured to profitably lever
with market recovery
2010 Sales
Market Size
$601
38 |
 39
Security
&
Storage
–
Strong
Brand
with
Growth
Potential
Well
Beyond
Padlocks; More Stable Market not Tied to Housing Cycle
$ millions
Key Brands
Market Position Summary
Why We Win
Large market size and room for growth
Strong brand
Ability to extend across broader
security categories
Strong channel position across retail
and commercial segments
Solution focused innovation
$520
2010 Sales
Market Size
Notes:
Market
size
reflects
North
American
security
market
as of Dec. 2010
Source: Freedonia |
 40
Supply Chain Characteristics
Differentiated and Focused Supply Chains
to Best Serve Our Customers
Customizable designs and cabinet
configurations
Flexible manufacturing facilities
Distributive assembly model
Competitive Advantage
Global supply base / standard platforms
Variable cost model
Reacts quickly to change
in demand & product mix
Vertically integrated / standard platforms
Scale manufacturing drives high
efficiency for doors
Consistent rapid delivery model for windows
Global supply base
Variable cost model
Rapid response customer packaging
and keying capabilities
Reacts quickly to change in demand
& product mix
Serve multiple channels and brands
Can achieve value price points profitably
when winning new business
Significant leverage as market grows
Offer stylish solutions at affordable prices
Ramp-up innovation quickly
Significant leverage as market grows
Can meet unique customer requirement
for retail and commercial
Rapid cycle to get new product to market
Kitchen
& Bath
Cabinetry
Plumbing
&
Accessories
Advanced Material
Windows & Door
Systems
Security
&
Storage |
Appendix
Reconciliation of Non-GAAP Measures to GAAP
| FBHS Net Sales Growth Rate to FBHS Organic Sales Growth |
Page 42 | |||
| Adjusted Pro Forma Operating Income to GAAP Operating Income |
Page 43 | |||
| Adjusted Pro Forma Operating Margin to GAAP Operating Margin |
Page 44 | |||
| Adjusted Pro Forma EBITDA to GAAP Net Income |
Page 45 | |||
| Adjusted Pro Forma EBITDA margin to GAAP Net Income margin |
Page 46 | |||
| Adjusted Pro Forma Unlevered Free Cash Flow to GAAP Cash flow from Operations |
Page 47 | |||
Reconciliation of FBHS Net Sales Growth Rate to FBHS Organic Sales Growth
| Home & Security 1989-2011 Projected CAGR* |
||||
| Net sales growth (GAAP) |
9 | % | ||
| Net impact from acquisitions/divestitures |
(5 | )% | ||
|
|
|
|||
| Organic sales growth |
4 | % | ||
|
|
|
|||
| * | Compounded annual growth rate |
Organic sales growth is the rate of compounded annual net sales growth from 1989 through 2011 projected, excluding the impact of acquisitions and divestitures. Organic sales growth is not a measure derived in accordance with GAAP. Management believes this measure provides useful supplemental information regarding the underlying level of sales growth. This measure may be inconsistent with similar measures presented by other companies.
Page 42
Reconciliation of Adjusted Pro Forma Operating Income to GAAP Operating Income
(in millions)
| 2006 | 2007 | 2008 | 2009 | 2010 | ||||||||||||||||
| Adjusted pro forma operating income |
$ | 668 | $ | 553 | $ | 301 | $ | 81 | $ | 180 | ||||||||||
| Standalone corporate expenses (1) |
20 | 20 | 20 | 20 | 20 | |||||||||||||||
| Restructuring and other charges (2) |
(26 | ) | (93 | ) | (56 | ) | (52 | ) | (12 | ) | ||||||||||
| Asset impairment charges |
— | — | (848 | ) | — | — | ||||||||||||||
|
|
|
|
|
|
|
|
|
|
|
|||||||||||
| GAAP operating income |
$ | 662 | $ | 480 | $ | (583 | ) | $ | 49 | $ | 188 | |||||||||
Adjusted pro forma operating income is operating income derived in accordance with GAAP including estimated incremental standalone corporate expenses and excluding restructuring and other charges, and asset impairment charges.
Adjusted pro forma operating income is a measure not derived in accordance with GAAP. Management uses this measure to determine the returns generated by FBHS and to evaluate and identify cost-reduction initiatives. Management believes this measure provides investors with helpful supplemental information regarding the underlying performance of the company from year to year. This measure may be inconsistent with similar measures presented by other companies.
| (1) | After the separation, the Company estimates it will incur higher expenses of approximately $20 million annually associated with the incremental costs of functioning as an independent standalone public company. |
| (2) | Restructuring charges are costs incurred to implement significant cost reduction initiatives and include workforce reduction costs and asset write-downs; “other charges” represent charges directly related to restructuring initiatives that cannot be reported as restructuring under U.S. GAAP. Such costs may include losses on disposal of inventories, trade receivables allowances from exiting product lines and accelerated depreciation resulting from the closure of facilities. |
Page 43
Reconciliation of Adjusted Pro Forma Operating Margin to GAAP Operating Margin
| 2006 | 2007 | 2008 | 2009 | 2010 | ||||||||||||||||
| Adjusted pro forma operating margin |
14.2 | % | 12.1 | % | 8.0 | % | 2.7 | % | 5.6 | % | ||||||||||
| Standalone corporate expenses (1) |
0.4 | % | 0.4 | % | 0.5 | % | 0.6 | % | 0.6 | % | ||||||||||
| Restructuring and other charges (2) |
(0.5 | )% | (2.0 | )% | (1.5 | )% | (1.7 | )% | (0.4 | )% | ||||||||||
| Asset impairment charges |
— | — | (22.5 | )% | — | — | ||||||||||||||
|
|
|
|
|
|
|
|
|
|
|
|||||||||||
| GAAP Operating Margin |
14.1 | % | 10.5 | % | (15.5 | )% | 1.6 | % | 5.8 | % | ||||||||||
Adjusted pro forma operating margin is operating margin derived in accordance with GAAP including estimated incremental standalone corporate expenses and excluding restructuring and other charges, and asset impairment charges divided by GAAP net sales.
Adjusted pro forma operating margin is a measure not derived in accordance with GAAP. Management uses this measure to determine the returns generated by FBHS and to evaluate and identify cost-reduction initiatives. Management believes this measure provides investors with helpful supplemental information regarding the underlying performance of the company from year to year. This measure may be inconsistent with similar measures presented by other companies.
| (1) | After the separation, the Company estimates it will incur higher expenses of approximately $20 million annually associated with the incremental costs of functioning as an independent standalone public company. |
| (2) | Restructuring charges are costs incurred to implement significant cost reduction initiatives and include workforce reduction costs and asset write-downs; “other charges” represent charges directly related to restructuring initiatives that cannot be reported as restructuring under U.S. GAAP. Such costs may include losses on disposal of inventories, trade receivables allowances from exiting product lines and accelerated depreciation resulting from the closure of facilities. |
Page 44
Reconciliation of Adjusted Pro Forma EBITDA to GAAP Net Income
(in millions)
| 2006 | 2007 | 2008 | 2009 | 2010 | ||||||||||||||||
| Adjusted pro forma EBITDA |
$ | 816 | $ | 703 | $ | 435 | $ | 195 | $ | 288 | ||||||||||
| Depreciation (1) |
(105 | ) | (116 | ) | (108 | ) | (97 | ) | (92 | ) | ||||||||||
| Amortization of intangible assets |
(30 | ) | (35 | ) | (33 | ) | (16 | ) | (16 | ) | ||||||||||
| Restructuring and other charges (2) |
(26 | ) | (93 | ) | (56 | ) | (52 | ) | (12 | ) | ||||||||||
| Asset impairment charges |
— | — | (848 | ) | — | — | ||||||||||||||
| Related party interest expense, net |
(169 | ) | (188 | ) | (127 | ) | (85 | ) | (116 | ) | ||||||||||
| External interest expense |
(1 | ) | (0 | ) | (1 | ) | (0 | ) | (0 | ) | ||||||||||
| Standalone corporate expenses (3) |
20 | 20 | 20 | 20 | 20 | |||||||||||||||
| Income tax (provision) benefit |
(176 | ) | (137 | ) | 77 | (6 | ) | (14 | ) | |||||||||||
|
|
|
|
|
|
|
|
|
|
|
|||||||||||
| Net income (loss) |
$ | 329 | $ | 154 | $ | (641 | ) | $ | (41 | ) | $ | 58 | ||||||||
| Noncontrolling interests |
(1 | ) | (1 | ) | (1 | ) | (1 | ) | (1 | ) | ||||||||||
|
|
|
|
|
|
|
|
|
|
|
|||||||||||
| Net income (loss) attributable to Home & Security |
$ | 328 | $ | 153 | $ | (642 | ) | $ | (42 | ) | $ | 57 | ||||||||
Adjusted pro forma EBITDA is net income (loss) derived in accordance with GAAP including estimated incremental standalone corporate expenses and excluding restructuring and other charges, asset impairment charges, depreciation, amortization of intangible assets, related party interest expense, net, external interest expense, and income taxes.
Adjusted pro forma EBITDA is a measure not derived in accordance with GAAP. Management uses this measure to assess returns generated by FBHS. Management believes this measure provides investors with helpful supplemental information regarding the underlying performance of the company from year to year. This measure may be inconsistent with similar measures presented by other companies.
| (1) | Depreciation excludes accelerated depreciation included in restructuring and other charges. |
| (2) | Restructuring charges are costs incurred to implement significant cost reduction initiatives and include workforce reduction costs and asset write-downs; “other charges” represent charges directly related to restructuring initiatives that cannot be reported as restructuring under U.S. GAAP. Such costs may include losses on disposal of inventories, trade receivables allowances from exiting product lines and accelerated depreciation resulting from the closure of facilities. |
| (3) | After the separation, the Company estimates it will incur higher expenses of approximately $20 million annually associated with the incremental costs of functioning as an independent standalone public company. |
Page 45
Reconciliation of Adjusted Pro Forma EBITDA margin to GAAP Net Income margin
| 2006 | 2007 | 2008 | 2009 | 2010 | ||||||||||||||||
| Adjusted pro forma EBITDA margin |
17 | % | 15 | % | 12 | % | 6 | % | 9 | % | ||||||||||
| Depreciation (1) |
(2 | )% | (3 | )% | (3 | )% | (3 | )% | (3 | )% | ||||||||||
| Amortization of intangible assets |
(1 | )% | (1 | )% | (1 | )% | (0 | )% | (0 | )% | ||||||||||
| Restructuring and other charges (2) |
(0 | )% | (2 | )% | (1 | )% | (2 | )% | (0 | )% | ||||||||||
| Asset impairment charges |
— | — | (23 | )% | 0 | % | 0 | % | ||||||||||||
| Related party interest expense, net |
(3 | )% | (4 | )% | (3 | )% | (3 | )% | (4 | )% | ||||||||||
| External interest expense |
(0 | )% | (0 | )% | (0 | )% | (0 | )% | (0 | )% | ||||||||||
| Standalone corporate expenses (3) |
0 | % | 1 | % | 0 | % | 1 | % | 0 | % | ||||||||||
| Income tax (provision) benefit |
(4 | )% | (3 | )% | 2 | % | (0 | )% | (0 | )% | ||||||||||
|
|
|
|
|
|
|
|
|
|
|
|||||||||||
| GAAP Net income (loss) margin |
7 | % | 3 | % | (17 | )% | (1 | )% | 2 | % | ||||||||||
Adjusted pro forma EBITDA margin is net income (loss) derived in accordance with GAAP including estimated incremental standalone corporate expenses and excluding restructuring and other charges, asset impairment charges, depreciation, amortization of intangible assets, related party interest expense, net, external interest expense, and income taxes divided by GAAP net sales.
Adjusted pro forma EBITDA is a measure not derived in accordance with GAAP. Management uses this measure to assess returns generated by FBHS. Management believes this measure provides investors with helpful supplemental information regarding the underlying performance of the company from year to year. This measure may be inconsistent with similar measures presented by other companies.
| (1) | Depreciation excludes accelerated depreciation included in restructuring and other charges. |
| (2) | Restructuring charges are costs incurred to implement significant cost reduction initiatives and include workforce reduction costs and asset write-downs; “other charges” represent charges directly related to restructuring initiatives that cannot be reported as restructuring under U.S. GAAP. Such costs may include losses on disposal of inventories, trade receivables allowances from exiting product lines and accelerated depreciation resulting from the closure of facilities. |
| (3) | After the separation, the Company estimates it will incur higher expenses of approximately $20 million annually associated with the incremental costs of functioning as an independent standalone public company. |
Page 46
Reconciliation of Adjusted Pro Forma Unlevered Free Cash Flow to GAAP Cash flow from Operations
(in millions)
| 2006 | 2007 | 2008 | 2009 | 2010 | ||||||||||||||||
| Adjusted pro forma unlevered free cash flow |
$ | 464 | $ | 393 | $ | 325 | $ | 280 | $ | 146 | ||||||||||
| Add: |
||||||||||||||||||||
| Capital Expenditures |
128 | 75 | 57 | 43 | 58 | |||||||||||||||
| Standalone corporate expenses, net of tax |
13 | 13 | 13 | 13 | 13 | |||||||||||||||
| Less: |
||||||||||||||||||||
| Proceeds from the disposition of assets |
11 | 20 | 14 | 11 | 3 | |||||||||||||||
| Related party interest expense, net of tax |
110 | 122 | 84 | 56 | 75 | |||||||||||||||
| External interest expense, net of tax |
0 | 0 | 0 | 0 | 0 | |||||||||||||||
|
|
|
|
|
|
|
|
|
|
|
|||||||||||
| Cash flow from operations |
$ | 484 | $ | 339 | $ | 297 | $ | 269 | $ | 139 | ||||||||||
Adjusted pro forma unlevered free cash flow is Cash Flow from Operations (i) less net capital expenditures (capital expenditures less proceeds from the sale of assets including property, plant and equipment) and estimated incremental standalone corporate expenses, net of tax, (ii) plus related party interest expense, net of tax, and external interest expense, net of tax. In computing unlevered free cash flow, net of tax reconciling items assume an income tax rate of 35%. Unlevered free cash flow is a measure not derived in accordance with GAAP. Management believes that Free Cash Flow provides investors with helpful supplemental information about the company's ability to fund internal growth, make acquisitions, repay debt and related interest, pay dividends, and repurchase common stock. This measure may be inconsistent with similar measures presented by other companies.
Page 47