Attached files
XCELMOBILITY, INC.
UNAUDITED PRO FORMA COMBINED FINANCIAL STATEMENTS
Basis of Presentation
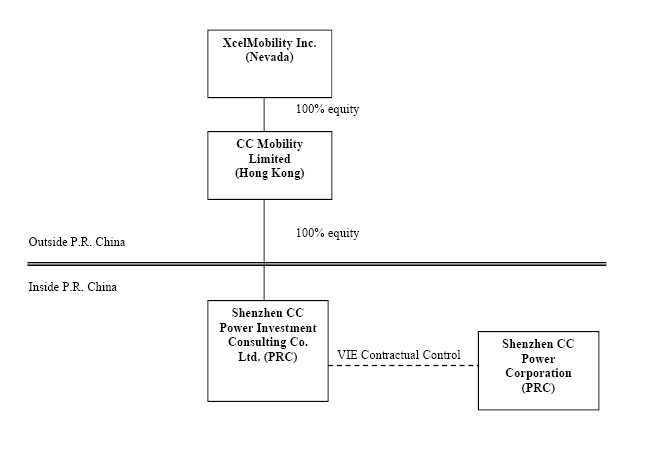
On August 30, 2011 (the “Closing Date”), XcelMobility Inc., a Nevada corporation (the “Company” or “Xcel”), closed a voluntary share exchange transaction with CC Mobility Limited, a company organized under the laws of Hong Kong (“CC Mobility”) and the shareholders of CC Mobility (“Selling Shareholders”) pursuant to a Share Exchange Agreement dated July 5, 2011 (the “Exchange Agreement”) by and among Xcel, CC Mobility, the Selling Shareholders and Shenzhen CC Power Corporation (“CC Power”), a company organized under the laws of the People’ Republic of China (“PRC”).
In accordance with the terms of Exchange Agreement, on the Closing Date, Xcel issued 33,300,000 shares of its common stock to the Selling Shareholders in exchange for 100% of the issued and outstanding capital stock of CC Mobility (the “Exchange Transaction”). As a result of the Exchange Transaction, the Selling Shareholders acquired 50.50% of our issued and outstanding common stock, CC Mobility became our wholly-owned subsidiary, and Xcel acquired the business and operations of CC Mobility and CC Power.
The acquisition will be accounted for as a reverse merger effected by a share exchange, wherein CC Mobility is considered the acquirer for accounting and financial reporting purposes. The Pro forma statements are presented for the three months ended June 30, 2011 and 2010 and year ended March 31, 2011 and 2010.
The unaudited pro forma consolidated statements of operations reflects the results of operations of the company had the merger occurred on the beginning of each of the above reporting periods. The pro forma consolidated statements of operations were prepared as if the transactions were consummated on the beginning of each period presented. These pro forma consolidated statements of operations have been prepared for comparative purposes only and do not purport to be indicative of the results of operations which actually would have resulted had the transaction occurred on the date indicated and are not necessarily indicative of the results that may be expected in the future.
As a result of the Exchange Transaction, the organizational structure of Xcel is as follows:
UNAUDITED PRO FORMA COMBINED FINANCIAL DATA
PRO FORMA BALANCE SHEET AS AT JUNE 30, 2011
| Pro Forma | ||||||||||||||||
| Xcelmobility Inc. | CC Mobility | CC Power | Pro Forma | Consolidated | ||||||||||||
| As of quarter | As of quarter | As of quarter | ||||||||||||||
| ended | ended | ended | Adjustments | |||||||||||||
| June 30, 2011 | June 30, 2011 | June 30, 2011 | ||||||||||||||
| ASSETS | ||||||||||||||||
| Current assets | ||||||||||||||||
| Cash | $ | 32,795 | $ | 100,042 | $ | 48,923 | $ | - | $ | 181,760 | ||||||
| Accounts receivable, net | - | - | 1,136 | - | 1,136 | |||||||||||
| Other receivables, net | - | - | 5,320 | - | 5,320 | |||||||||||
| Prepaid expense | 1,601 | - | - | - | 1,601 | |||||||||||
| Total current assets | 34,396 | 100,042 | 55,379 | - | 189,817 | |||||||||||
| Equity investment in affiliated company | - | - | 35,061 | - | 35,061 | |||||||||||
| Property, plant and equipment, net | - | - | 23,421 | - | 23,421 | |||||||||||
| Total non-current assets | - | - | 58,482 | - | 58,482 | |||||||||||
| TOTAL ASSETS | $ | 34,396 | $ | 100,042 | $ | 113,861 | $ | - | $ | 248,299 | ||||||
| LIABILITIES AND DEFICIT | ||||||||||||||||
| Current liabilities | ||||||||||||||||
| Accounts payable | 6,305 | - | - | - | 6,305 | |||||||||||
| Advance from customers | - | - | 1,392 | - | 1,392 | |||||||||||
| Other payables, accrued expenses and other taxes payable | - | - | 17,903 | 300,000 | D | 317,903 | ||||||||||
| Deferred revenue | - | - | 14,166 | - | 14,166 | |||||||||||
| Due to shareholder | 100 | - | - | (100 | ) | A | - | |||||||||
| Total current liabilities | 6,405 | - | 33,461 | 299,990 | 339,766 | |||||||||||
| Non-current liabilities | ||||||||||||||||
| Convertible promissory note and interest payable on convertible promissory note | 150,000 | 100,000 | - | - | 250,000 | |||||||||||
| Deferred revenue | 1,582 | 342 | 4,366 | - | 5,948 | |||||||||||
| Total non-current liabilities | 151,582 | 100,342 | 4,366 | - | 256,290 |
| Total liabilities | 157,987 | 100,342 | 37,827 | 299,900 | 596,056 | |||||||||||
| Shareholders' deficit | ||||||||||||||||
| Preferred stock, $0.001 par value, 20,000,000 shares authorized; no shares issued and outstanding June 30, 2011 | - | - | - | - | - | |||||||||||
| Common stock, $0.001 par value, 100,000,000 shares authorized as of June 30, 2011 | 77,700 | 129 | - | (17,700 | ) | C | 60,000 | |||||||||
| (129 | ) | E | ||||||||||||||
| Additional paid in capital | (26,700 | ) | - | 345,864 | - | - | ||||||||||
| 100 | A | |||||||||||||||
| (174,591 | ) | B | ||||||||||||||
| 17,700 | C | |||||||||||||||
| 129 | E | 162,373 | ||||||||||||||
| (429 | ) | E | ||||||||||||||
| Accumulated deficit | (174,591 | ) | (429 | ) | (297,337 | ) | 174,591 | B | ||||||||
| (300,000 | ) | D | ||||||||||||||
| 429 | E | (597,337 | ) | |||||||||||||
| Accumulated other comprehensive income | - | - | 27,507 | - | 27,507 | |||||||||||
| Total shareholders' deficit | (123,591 | ) | (300 | ) | 76,034 | (299,900 | ) | (347,457 | ) | |||||||
| TOTAL LIABILITIES AND DEFICIT | $ | 34,396 | $ | 100,042 | $ | 113,861 | $ | - | $ | 248,299 |
Notes to Unaudited Pro Forma Combined Financial Information:
On August 30, 2011, Xcel completed a share exchange agreement, or the Share Exchange Agreement, with CC Mobility and its shareholders, a Hong Kong company, and CC Power. Pursuant to the Share Exchange Agreement, Xcel acquired 100% of the issued and outstanding capital stock of CC Mobility in exchange for 30,300,000 shares of our common stock, par value $0.001 per share, which constituted 50.5% of the issued and outstanding common stock on a fully-diluted basis as of and immediately after the consummation of the transactions contemplated by the Share Exchange Agreement.
Assumptions and Adjustments:
Notes to Pro forma Adjustments
| A |
Adjustment to give effect to the forgiveness of amount due to principal stockholder prior to merger. |
| B |
Adjustment to CC Power's accumulated deficit to reflect the reverse acquisition. |
| C |
Adjustment to give effect to the cancellation of 17,700,000 pre-merger shares of Xcelmobility. |
| D |
Adjustment to give effect to expenses expected to be incurred in connection with the merger transaction |
| E |
Adjustment to CC Mobility's accumulated deficit and common stock to reflect the reverse acquisition |
* Shenzhen CC Power Investment Consulting Co. Ltd was formed in July 2011. Therefore, it is not being consolidated in the pro-forma consolidated balance sheet as of June 30, 2011.
UNAUDITED PRO FORMA COMBINED FINANCIAL DATA
PRO FORMA STATEMENTS OF INCOME AND COMPREHENSIVE INCOME
FOR THE THREE MONTHS ENDED JUNE 30, 2011
| Xcelmobility | Pro Forma | Pro Forma | ||||||||||||||
| Inc. | CC Mobility | CC Power | Adjustments | Consolidated | ||||||||||||
| Three months | Three months | Three months | ||||||||||||||
| ended | ended | ended | ||||||||||||||
| June 30, 2011 | June 30, 2011 | June 30, 2011 | ||||||||||||||
| Revenue | $ | - | $ | - | $ | 4,598 | $ | - | $ | 4,598 | ||||||
| Costs of Goods Sold | - | - | 15,717 | - | 15,717 | |||||||||||
| Gross Profit | - | - | (11,119 | ) | - | (11,119 | ) | |||||||||
| Selling, general and administrative expense | 119,447 | 429 | 12,856 | 300,000 | D | 432,732 | ||||||||||
| Total operating expenses | 119,447 | 429 | 12,856 | 300,000 | 432,732 | |||||||||||
| Interest income | - | - | - | - | - | |||||||||||
| Interest expense | - | - | - | - | - | |||||||||||
| Other income | - | - | 393 | - | 393 | |||||||||||
| Total Other Income (expense) | - | - | 393 | - | 393 | |||||||||||
| Loss Before taxes | (119,447 | ) | (429 | ) | (23,582 | ) | (300,000 | ) | (443,458 | ) | ||||||
| Income tax expense | - | - | - | - | - | |||||||||||
| Loss from continuing operation | (119,447 | ) | (429 | ) | (23,582 | ) | (300,000 | ) | (443,458 | ) | ||||||
| Income from discontinued operation | - | - | 14,048 | - | 14,048 | |||||||||||
| Net Loss | (119,447 | ) | (429 | ) | (9,534 | ) | (300,000 | ) | (429,410 | ) | ||||||
| Net income attributable to non-controlling interest | - | - | 2,058 | - | 2,058 | |||||||||||
| Net loss attributable to CC Power | $ | (119,447 | ) | $ | (429 | ) | $ | (11,592 | ) | $ | (300,000 | ) | $ | (431,468 | ) | |
| Net Loss | $ | (119,447 | ) | $ | (429 | ) | $ | (9,534 | ) | $ | (300,000 | ) | $ | (429,410 | ) | |
| Foreign currency translation adjustment | - | - | 555 | - | 555 | |||||||||||
| Comprehensive income attributable to non-controlling interest | - | - | 5,007 | - | 5,007 | |||||||||||
| Comprehensive Loss | $ | (119,447 | ) | $ | (429 | ) | $ | (3,972 | ) | $ | (300,000 | ) | $ | (423,848 | ) | |
| Basic and diluted earnings (loss) per share: | ||||||||||||||||
| Continuing operation | $ | (0.00 | ) | $ | (0.67 | ) | $ | - | $ | - | $ | (0.01 | ) | |||
| Discontinued operation | - | - | - | - | 0 | |||||||||||
| Basic and diluted net loss per share | $ | (0.00 | ) | $ | (0.67 | ) | $ | - | $ | - | $ | (0.01 | ) | |||
| Weighted average shares outstanding | 77,700,000 | 637 | - | (17,700,000 | ) | C | 60,000,000 | |||||||||
| (637 | ) | E |
PRO FORMA COMBINED FINANCIAL DATA
PRO FORMA STATEMENTS OF INCOME AND COMPREHENSIVE INCOME
FOR THE THREE MONTHS ENDED JUNE 30, 2010
| Xcelmobility | Pro Forma | Pro Forma | |||||||||||
| Inc. | CC Power | Adjustments | Consolidated | ||||||||||
| Three months | Three months | ||||||||||||
| ended | ended | ||||||||||||
| June 30, 2010 | June 30, 2010 | ||||||||||||
| Revenue | $ | - | $ | 36,000 | $ | - | $ | 36,000 | |||||
| Costs of Goods Sold | - | 18,829 | - | 18,829 | |||||||||
| Gross Profit | - | 17,171 | - | 17,171 | |||||||||
| Selling, general and administrative expense | 2,544 | 24,703 | 300,000 | D | 327,247 | ||||||||
| Total operating expenses | 2,544 | 24,703 | 300,000 | 327,247 | |||||||||
| Interest income | - | 64 | - | 64 | |||||||||
| Interest expense | - | (73 | ) | - | (73 | ) | |||||||
| Total Other Income (expense) | - | (9 | ) | - | (9 | ) | |||||||
| Loss Before taxes | (2,544 | ) | (7,541 | ) | (300,000 | ) | (310,085 | ) | |||||
| Income tax expense | - | - | - | - | |||||||||
| Loss from continuing operation | (2,544 | ) | (7,541 | ) | (300,000 | ) | (310,085 | ) | |||||
| Income from discontinued operation | - | 9,914 | - | 9,914 | |||||||||
| Net Income (loss) | (2,544 | ) | 2,373 | (300,000 | ) | (300,171 | ) | ||||||
| Net income attributable to non-controlling interest | - | 3,966 | - | 3,966 | |||||||||
| Net (loss) attributable to CC Power | $ | (2,544 | ) | $ | (1,593 | ) | $ | (300,000 | ) | $ | (304,137 | ) | |
| Net Income (Loss) | $ | (2,544 | ) | $ | 2,373 | $ | (300,000 | ) | $ | (300,171 | ) | ||
| Foreign currency translation adjustment | - | 1,343 | - | 1,343 | |||||||||
| Comprehensive income attributable to non-controlling interest | - | 7,716 | 7,716 | ||||||||||
| Comprehensive Income (Loss) | $ | (2,544 | ) | $ | 11,432 | $ | (300,000 | ) | $ | (291,112 | ) | ||
| Basic and diluted loss per share: | |||||||||||||
| Continuing operation | $ | (0.00 | ) | $ | - | $ | - | $ | (0.01 | ) | |||
| Discontinued operation | - | - | - | 0.00 | |||||||||
| Basic and diluted net loss per share | $ | (0.00 | ) | $ | - | $ | - | $ | (0.01 | ) | |||
| Weighted average shares outstanding | 77,700,000 | - | (17,700,000 | ) | C | 60,000,000 |
UNAUDITED PRO FORMA COMBINED FINANCIAL DATA
PRO FORMA BALANCE SHEET AS AT MARCH 31, 2011
| Xcelmobility Inc. | CC Power | Pro Forma | Pro Forma | ||||||||||
| As of fiscal year | As of fiscal | ||||||||||||
| ended | year ended | Adjustments | Consolidated | ||||||||||
| March 31, 2011 | December 31, 2010 | ||||||||||||
| ASSETS | |||||||||||||
| Current assets | |||||||||||||
| Cash | $ | 2,160 | $ | 46,259 | $ | - | $ | 48,419 | |||||
| Accounts receivable | - | 1,421 | - | 1,421 | |||||||||
| Other receivables, net | - | 21,935 | - | 21,935 | |||||||||
| Inventories | - | 15,381 | - | 15,381 | |||||||||
| Due from shareholder | - | 30,693 | - | 30,693 | |||||||||
| Deferred income taxes | - | 3,559 | - | 3,559 | |||||||||
| Prepaid expense | 1,601 | - | - | 1,601 | |||||||||
| Total current assets | 3,761 | 119,248 | - | 123,009 | |||||||||
| Property, plant and equipment, net | - | 44,408 | - | 44,408 | |||||||||
| Deferred income taxes | - | 14,831 | - | 14,831 | |||||||||
| Total non-current assets | 59,239 | - | 59,239 | ||||||||||
| - | |||||||||||||
| TOTAL ASSETS | $ | 3,761 | $ | 178,487 | $ | - | $ | 182,248 | |||||
| LIABILITIES AND DEFICIT | |||||||||||||
| Current liabilities | |||||||||||||
| Accounts payable | $ | 7,805 | $ | - | $ | - | $ | 7,805 | |||||
| Advance from customers | - | 1,507 | - | 1,507 | |||||||||
| Other payables, accrued expenses and other taxes payable | - | 18,098 | 300,000 | D | 318,098 | ||||||||
| Deferred revenue | - | 33,102 | - | 33,102 | |||||||||
| Due to shareholder | 100 | - | (100 | ) | A | - | |||||||
| Total current liabilities | 7,905 | 52,707 | 299,900 | 360,512 | |||||||||
| Non-current liabilities | |||||||||||||
| Deferred revenue | - | 11,280 | - | 11,280 | |||||||||
| Total non-current liabilities | - | 11,280 | - | 11,280 | |||||||||
| Total liabilities | 7,905 | 63,987 | 299,900 | 371,792 | |||||||||
| Shareholders' deficit | |||||||||||||
| Preferred stock: $0.001 par value; 20,000,000 shares authorized; no shares issued or outstanding | - | - | - | - | |||||||||
| Common stock: $0.001 par value; 100,000,000 shares authorized | 77,700 | - | (17,700 | ) | C | 60,000 | |||||||
| Additional paid in capital | (26,700 | ) | 345,864 | ||||||||||
| 100 | A | ||||||||||||
| (55,144 | ) | B | |||||||||||
| 17,700 | C | 281,820 |
| Accumulated deficit | (55,144 | ) | (296,430 | ) | 55,144 | B | |||||||
| (300,000 | ) | D | (596,430 | ) | |||||||||
| Accumulated other comprehensive income | - | 22,798 | - | 22,798 | |||||||||
| Total shareholders' deficit | (4,144 | ) | 72,232 | (299,900 | ) | (231,812 | ) | ||||||
| Non-controlling interest | - | 42,268 | - | 42,268 | |||||||||
| TOTAL LIABILITIES AND DEFICIT | $ | 3,761 | $ | 178,487 | $ | - | $ | 182,248 |
On August 30, 2011, Xcel completed a share exchange agreement, or the Share Exchange Agreement, with CC Mobility and its shareholders, a Hong Kong company, and CC Power. Pursuant to the Share Exchange Agreement, Xcel acquired 100% of the issued and outstanding capital stock of CC Mobility in exchange for 30,300,000 shares of our common stock, par value $0.001 per share, which constituted 50.5% of the issued and outstanding common stock on a fully-diluted basis as of and immediately after the consummation of the transactions contemplated by the Share Exchange Agreement. `
Assumptions and Adjustments:
Notes to Pro forma Adjustments
A Adjustment to give effect to the forgiveness of amount due to principal stockholder prior to merger.
B Adjustment to accumulated deficit to reflect the reverse acquisition.
C Adjustment to give effect to the cancellation of 17,700,000 pre-merger shares of Xcelmobility.
D Adjustment to give effect to expenses expected to be incurred in connection with the merger transaction.
* Shenzhen CC Power Investment Consulting Co. Ltd was formed in July 2011. Therefore, it is not being consolidated in the pro-forma consolidated balance sheet as of March 31, 2011.
UNAUDITED PRO FORMA COMBINED FINANCIAL DATA
PRO FORMA STATEMENTS OF INCOME AND COMPREHENSIVE INCOME
FOR THE TWELVE MONTHS ENDED MARCH 31, 2011
| Xcelmobility Inc. | CC Power | Pro Forma | Pro Forma | ||||||||||
| For the Twelve Months | For the Twelve | Adjustments | Consolidated | ||||||||||
| ended | Months ended | ||||||||||||
| March 31, 2011 | December 31, 2010 | ||||||||||||
| Revenue | - | 273,948 | - | $ | 273,948 | ||||||||
| Costs of Goods Sold | - | 177,439 | - | 177,439 | |||||||||
| Gross Profit | - | 96.509 | - | 96,509 | |||||||||
| Selling, general and administrative expense | 12,815 | 95,328 | 300,000 | D | 408,143 | ||||||||
| Total expenses | 12,815 | 95,328 | 300,000 | 408,143 | |||||||||
| Interest income | - | 212 | - | 212 | |||||||||
| Other expense | - | (626 | ) | - | (626 | ) | |||||||
| Total Other Income (expense) | - | (414 | ) | - | (414 | ) | |||||||
| Income (loss) Before taxes | (12,815 | ) | 767 | (300,000 | ) | (312,048 | ) | ||||||
| Less: Income tax expense | - | 6,778 | - | 6,778 | |||||||||
| Net loss | (12,815 | ) | (6,011 | ) | (300,000 | ) | (318,826 | ) | |||||
| Net income attributable to non-controlling interest | - | 8,404 | - | 8,404 | |||||||||
| Net loss attributable to CC Power | (12,815 | ) | (14,415 | ) | (300,000 | ) | (327,230 | ) | |||||
| Net Loss | (12,815 | ) | (6,011 | ) | (300,000 | ) | (318,826 | ) | |||||
| Foreign currency translation adjustment | - | 2,631 | - | 2,631 | |||||||||
| Comprehensive income attributable to non-controlling interest | - | 9,605 | - | 9,605 | |||||||||
| Comprehensive Income (Loss) | $ | (12,815 | ) | $ | 6,225 | $ | (300,000 | ) | $ | (306,590 | ) | ||
| Basic and diluted net loss per share | $ | (0.00 | ) | $ | - | $ | - | $ | (0.01 | ) | |||
| Weighted average shares outstanding | 77,700,000 | - | (17,700,000 | ) | C | 60,000,000 |
UNAUDITED PRO FORMA COMBINED FINANCIAL DATA
PRO FORMA STATEMENTS OF INCOME AND COMPREHENSIVE INCOME
FOR THE TWELVE MONTHS ENDED MARCH 31, 2010
| Xcelmobility | Pro Forma | Pro Forma | |||||||||||
| Inc. | CC Power | Adjustments | Consolidated | ||||||||||
| For the | For the Twelve | ||||||||||||
| Twelve | Months ended | ||||||||||||
| Months ended | |||||||||||||
| March 31, | December 31, | ||||||||||||
| 2010 | 2009 | ||||||||||||
| Revenue | $ | - | $ | 224,038 | $ | - | $ | 224,038 | |||||
| Costs of Goods Sold | - | 184,747 | - | 184,747 | |||||||||
| Gross Profit | - | 39,291 | - | 39,291 | |||||||||
| Selling, general and administrative expense | 32,722 | 200,306 | 300,000 | D | 533,028 | ||||||||
| Total expenses | 32,722 | 200,306 | 300,000 | 533,028 | |||||||||
| Interest income | - | 373 | - | 373 | |||||||||
| Other expense | - | (337 | ) | - | (337 | ) | |||||||
| Total Other Income (expense) | - | 36 | - | 36 | |||||||||
| Loss Before taxes | (32,722 | ) | (160,979 | ) | (300,000 | ) | (493,701 | ) | |||||
| Less: Income tax expense | - | 933 | - | 933 | |||||||||
| Net loss | (32,722 | ) | (161,912 | ) | (300,000 | ) | (494,634 | ) | |||||
| Net income attributable to non-controlling interest | - | 1,210 | - | 1,210 | |||||||||
| Net loss attributable to CC Power | (32,722 | ) | (163,122 | ) | (300,000 | ) | (495,844 | ) | |||||
| Net Loss | (32,722 | ) | (161,912 | ) | (300,000 | ) | (494,634 | ) | |||||
| Foreign currency translation adjustment | 225 | - | 225 | ||||||||||
| Comprehensive income attributable to non-controlling interest | - | 1,245 | - | 1,245 | |||||||||
| Comprehensive Income (Loss) | $ | (32,722 | ) | $ | (160,442 | ) | $ | (300,000 | ) | $ | (493,164 | ) | |
| Basic and diluted net loss per share | $ | (0.00 | ) | $ | - | $ | - | $ | (0.00 | ) | |||
| Weighted average shares outstanding | 77,700,000 | - | (17,700,000 | ) | C | 60,000,000 |