Attached files
| file | filename |
|---|---|
| 8-K - FORM 8-K - TRANSATLANTIC HOLDINGS INC | y92534e8vk.htm |
| Investor Presentation September 2011 |
| Cautionary Note Regarding Forward-Looking Statements This presentation contains forward-looking statements that involve a number of risks and uncertainties. Statements that are not historical facts, including statements about our beliefs and expectations, are forward-looking statements. Such statements involve risks and uncertainties, which may cause actual results to differ materially from those set forth in these statements. For example, these forward-looking statements could be affected by the occurrence of any event, change or other circumstances that could give rise to the termination of the merger agreement with Allied World; the inability to obtain Transatlantic’s or Allied World’s stockholder approval or the failure to satisfy other conditions to completion of the proposed merger with Allied World, including receipt of regulatory approvals; risks that the proposed merger disrupts current plans and operations; risks that the unsolicited Validus exchange offer and/or National Indemnity proposal disrupts current plans and operations, including the proposed merger; the ability to retain key personnel; the ability to recognize the benefits of the proposed merger; the amount of the costs, fees, expenses and charges related to the proposed merger, the Validus exchange offer and the National Indemnity proposal; pricing and policy term trends; increased competition; the impact of acts of terrorism and acts of war; greater frequency or severity of unpredictable catastrophic events; negative rating agency actions; the adequacy of loss reserves; changes in regulations or tax laws; changes in the availability, cost or quality of reinsurance or retrocessional coverage; adverse general economic conditions; and judicial, legislative, political and other governmental developments, as well as management’s response to these factors; and other risks detailed in the “Cautionary Statement Regarding Forward-Looking Information,” “Risk Factors” and other sections of Transatlantic’s Form 10-K and other filings with the Securities and Exchange Commission. You are cautioned not to place undue reliance on these forward-looking statements, which speak only as of the date on which they are made. Transatlantic is under no obligation (and expressly disclaims any such obligation) to update or revise any forward-looking statement that may be made from time to time, whether as a result of new information, future developments or otherwise, except as required by law. Additional Information about the Proposed Merger with Allied World and Where to Find It This communication relates to a proposed merger between Transatlantic and Allied World. In connection with the proposed merger, Allied World has filed with the U.S. Securities and Exchange Commission (the “SEC”), and the SEC declared effective on August 18, 2011, a registration statement on Form S-4, which includes Transatlantic’s proxy statement as part of the joint proxy statement/prospectus, that provides details of the proposed merger and the attendant benefits and risks. This communication is not a substitute for the joint proxy statement/prospectus or any other document that Transatlantic or Allied World may file with the SEC or send to their stockholders in connection with the proposed merger. Investors and security holders are urged to read the joint proxy statement/prospectus, and all other relevant documents filed with the SEC or sent to stockholders as they become available because they will contain important information about the proposed merger. All documents, when filed, will be available free of charge at the SEC’s website (www.sec.gov). You may also obtain these documents by contacting Transatlantic’s Investor Relations department at Transatlantic Holdings, Inc., 80 Pine Street, New York, New York 10005, or via e-mail at investor_relations@transre.com; or by contacting Allied World’s Corp orate Secretary, attn.: Wesley D. Dupont, at Allied World Assurance Company Holdings, AG, Lindenstrasse 8, 6340 Baar, Zug, Switzerland, or via e-mail at secretary@awac.com. This communication does not constitute an offer to sell or the solicitation of an offer to buy any securities or a solicitation of any vote or approval. Additional Information About the Validus Exchange Offer This communication is neither an offer to purchase nor the solicitation of an offer to sell any securities. In response to the exchange offer commenced by Validus, Transatlantic has filed a Solicitation/Recommendation Statement on Schedule 14D-9 with the SEC. Investors and security holders are urged to read the Solicitation/Recommendation Statement on Schedule 14D-9 because it contains important information about the Validus Exchange Offer. All documents, when filed, will be available free of charge at the SEC’s website (www.sec.gov). You may also obtain these documents by contacting Transatlantic’s Investor Relations department at Transatlantic Holdings, Inc., 80 Pine Street, New York, New York 10005, or via e-mail at investor_relations@transre.com. Participants in the Solicitation Transatlantic, Allied World and their respective directors and executive officers may be deemed to be participants in any solicitation of proxies in connection with the proposed merger. Information about Transatlantic’s directors and executive officers is available in Transatlantic’s proxy statement dated April 8, 2011 for its 2011 Annual Meeting of Stockholders and Transatlantic’s proxy statement related to the proposed merger, which was filed with the SEC on August 19, 2011. Information about Allied World’s directors and executive officers is available in Allied World’s proxy statement dated March 17, 2011 for its 2011 Annual Meeting of Shareholders and the joint proxy statement/prospectus related to the proposed merger, which |
| was filed with the SEC on August 19, 2011. Additional information regarding the participants in the proxy solicitation and a description of their direct and indirect interests, by security holdings or otherwise, to the extent applicable, will be contained in the other relevant materials to be filed with the SEC regarding the merger when they become available. Investors should read the joint proxy statement/prospectus carefully before making any voting or investment decisions. Third Party Sourced Information Certain information included in this presentation has been sourced from third parties. Transatlantic does not make any representation regarding the accuracy, completeness or timeliness of such third party information. Permission to quote third party sources neither sought nor obtained. |
| Key Discussion Issues / Questions Our assessment of current industry dynamics and their impact on Transatlantic How did we assess our strategic alternatives? Why did we pursue the Allied World merger? How did we assess other proposals? Validus proposal National Indemnity proposal Why we believe the Allied World transaction delivers superior value to Transatlantic stockholders 1 |
| I: Current Industry Dynamics and Their Impact on Transatlantic |
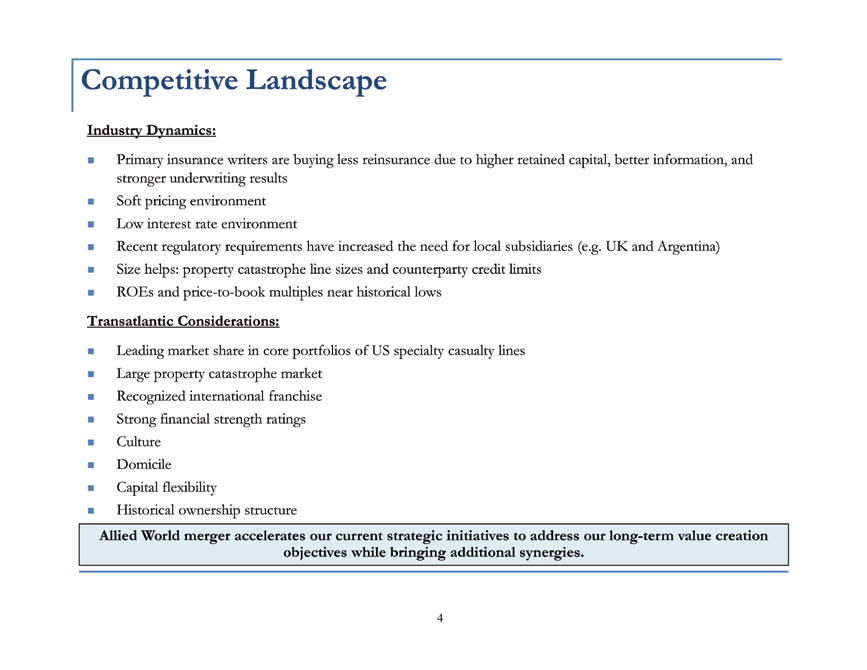
| NAUTILUS2011\Presentation\8h ISS\ISS Presentation 101_sending.pptx Competitive Landscape Industry Dynamics: Primary insurance writers are buying less reinsurance due to higher retained capital, better information, and stronger underwriting results Soft pricing environment Low interest rate environment Recent regulatory requirements have increased the need for local subsidiaries (e.g. UK and Argentina) Size helps: property catastrophe line sizes and counterparty credit limits ROEs and price-to-book multiples near historical lows Transatlantic Considerations: Leading market share in core portfolios of US specialty casualty lines Large property catastrophe market Recognized international franchise Strong financial strength ratings Culture Domicile Capital flexibility Historical ownership structure Allied World merger accelerates our current strategic initiatives to address our long-term value creation objectives while bringing additional synergies. |
| Competitive Landscape Industry Dynamics: Primary insurance writers are buying less reinsurance due to higher retained capital, better information, and stronger underwriting results Soft pricing environment Low interest rate environment Recent regulatory requirements have increased the need for local subsidiaries (e.g. UK and Argentina) Size helps: property catastrophe line sizes and counterparty credit limits ROEs and price-to-book multiples near historical lows Transatlantic Considerations: Leading market share in core portfolios of US specialty casualty lines Strong financial strength ratings Culture Domicile Capital flexibility Historical ownership structure Allied World merger accelerates our current strategic initiatives to address our long-term value creation objectives while bringing additional synergies. |
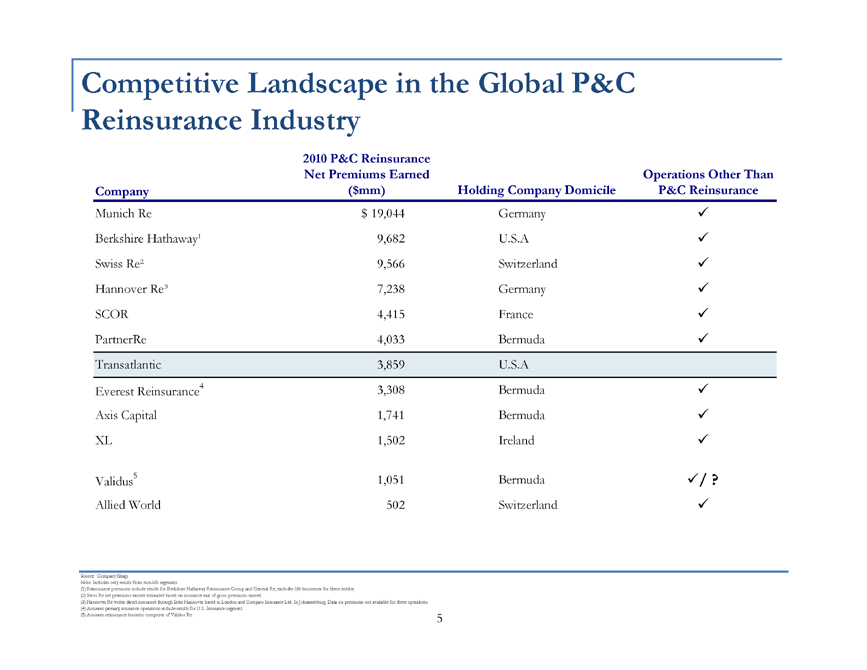
| Competitive Landscape in the Global P&C Reinsurance Industry 2010 P&C Reinsurance Net Premiums Earned Operations Other Than Company ($mm) Holding Company Domicile P&C Reinsurance Munich Re $19,044 Germany Berkshire Hathaway 1 9,682 U.S.A Swiss Re 2 9,566 Switzerland Hannover Re 3 7,238 Germany SCOR 4,415 France PartnerRe 4,033 Bermuda Transatlantic 3,859 U.S.A Everest Reinsurance4 3,308 Bermuda Axis Capital 1,741 Bermuda XL 1,502 Ireland Validus5 1,051 Bermuda / ? Allied World 502 Switzerland Source: Company filings Note: Includes only results from non-life segments. (1) Reinsurance premiums include results for Berkshire Hathaway Reinsurance Group and General Re; excludes life businesses for these entities. (2) Swiss Re net premiums earned estimated based on insurance mix of gross premiums earned. (3) Hannover Re writes direct insurance through Inter Hannover based in London and Compass Insurance Ltd. In Johannesburg. Data on premiums not available for these operations. (4) Assumes primary insurance operations include results for U.S. Insurance segment. (5) Assumes reinsurance business comprises of Validus Re. 5 |
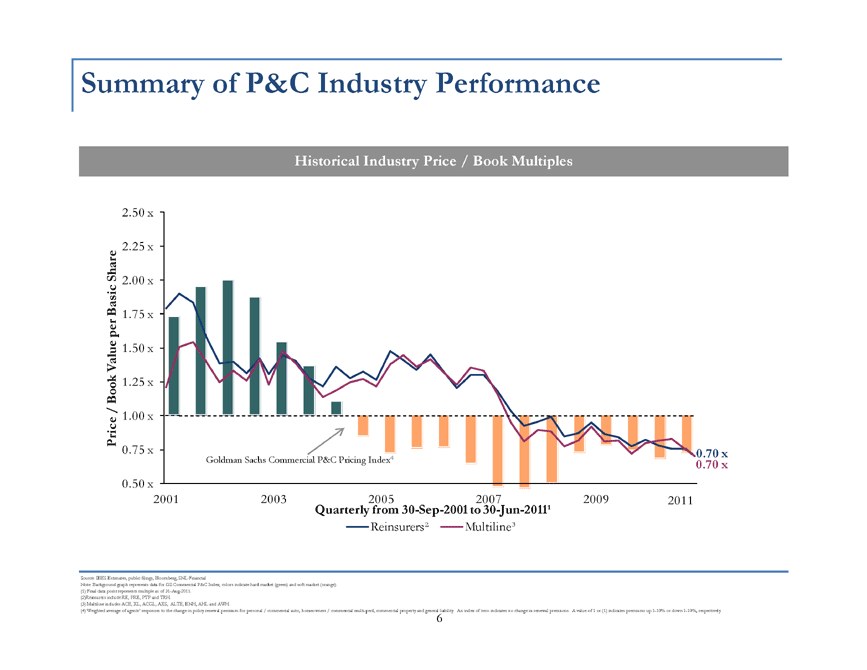
| Summary of P&C Industry Performance Historical Industry Price / Book Multiples 2.50 x Share 2.25 x c 2.00 x Basi 1.75 x per Value 1.50 x Book 1.25 x / Price 1.00 x 0.75 x 0.70 x Goldman Sachs Commercial P&C Pricing Index4 0.70 x 0.50 x 2001 2003 2005 2007 2009 2011 Quarterly from 30-Sep-2001 to 30-Jun-2011 1 Reinsurers 2 Multiline 3 Source: IBES Estimates, public filings, Bloomberg, SNL Financial Note: Background graph represents data for GS Commercial P&C Index; colors indicate hard market (green) and soft market (orange). (1) Final data point represents multiple as of 31-Aug-2011. (2)Reinsurers include RE, PRE, PTP and TRH. (3) Multiline includes ACE, XL, ACGL, AXS, ALTE, ENH, AHL and AWH. (4) Weighted average of agents’ responses to the change in policy renewal premium for personal / commercial auto, homeowners / commercial multi-peril, commercial property and general liability. An index of zero indicates no change in renewal premiums. A value of 1 or (1) indicates premiums up 1-10% or down 1-10%, respectively. 6 |
| Third Party Assessment of Transatlantic “Management is debating the merits of building out a primary insurance business and knows it will require capital and potential M&A to achieve critical scale in a timely fashion.” Morgan Stanley, 30-Nov-2010 “We’ve argued (since AIG sold its majority ownership in TRH back in 2009) that as the lone remaining public / independent on-shore (US) reinsurers, TRH should look for strategic options including getting offshore (to Bermuda or another “tax-advantaged” jurisdiction).” Dowling, 12-Jun-2011 |
| II: How Did We Assess Our Strategic Alternatives? |
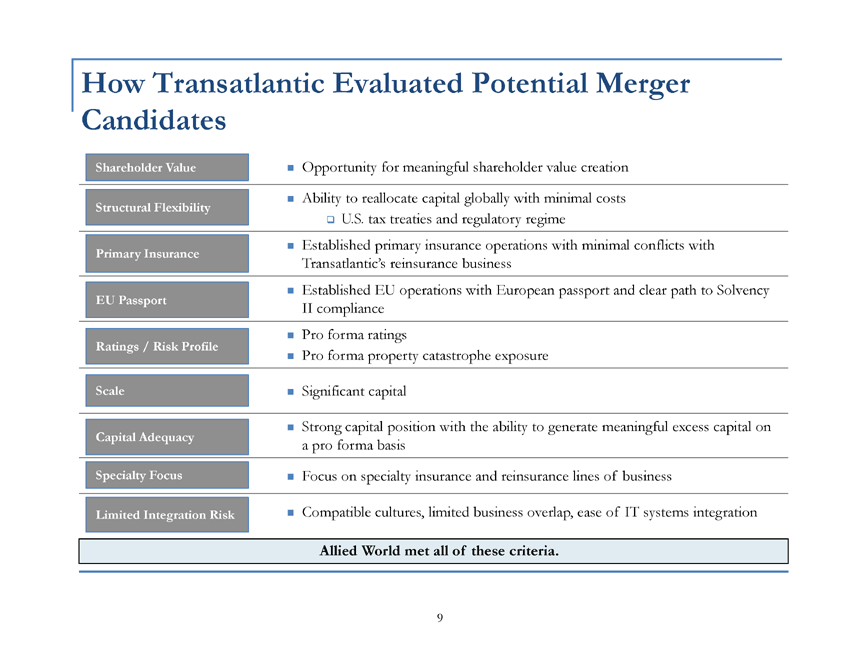
| How Transatlantic Evaluated Potential Merger Candidates Shareholder Value Opportunity for meaningful shareholder value creation Ability to reallocate capital globally with minimal costs Structural Flexibility U.S. tax treaties and regulatory regime Established primary insurance operations with minimal conflicts with Primary Insurance Transatlantic’s reinsurance business Established EU operations with European passport and clear path to Solvency EU Passport II compliance Ratings / Risk Profile Pro forma ratings Pro forma property catastrophe exposure Scale Significant capital Strong capital position with the ability to generate meaningful excess capital on Capital Adequacy a pro forma basis Specialty Focus Focus on specialty insurance and reinsurance lines of business Limited Integration Risk Compatible cultures, limited business overlap, ease of IT systems integration Allied World met all of these criteria. |
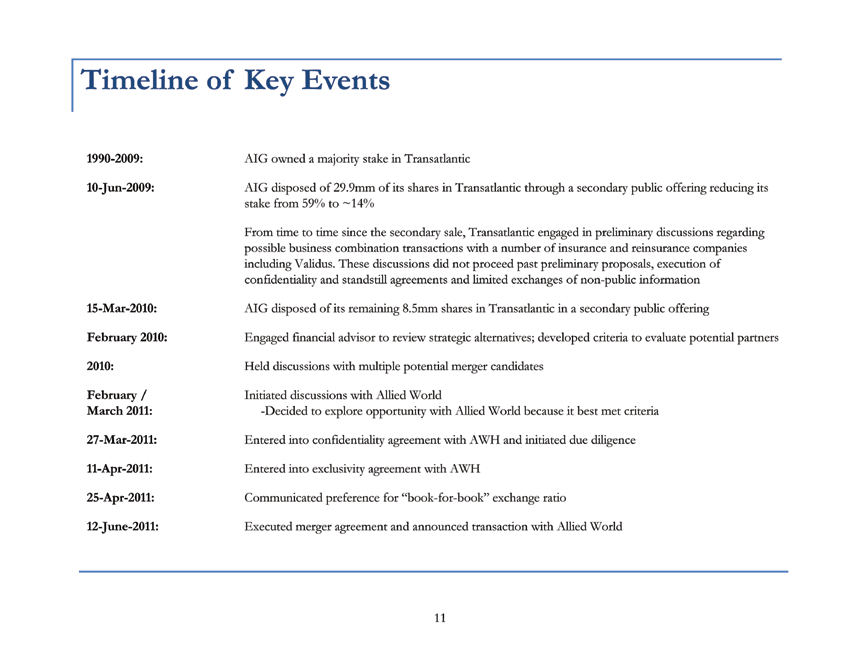
| How Transatlantic Evaluated Potential Merger Candidates Shareholder Value Opportunity for meaningful shareholder value creation Ability to reallocate capital globally with minimal costs Structural Flexibility U.S. tax treaties and regulatory regime Established primary insurance operations with minimal conflicts with Primary Insurance Transatlantic’s reinsurance business Established EU operations with European passport and clear path to Solvency EU Passport II compliance Ratings / Risk Profile Pro forma ratings Pro forma property catastrophe exposure Scale Significant capital Strong capital position with the ability to generate meaningful excess capital on Capital Adequacy a pro forma basis Specialty Focus Focus on specialty insurance and reinsurance lines of business Limited Integration Risk Compatible cultures, limited business overlap, ease of IT systems integration Allied World met all of these criteria. |
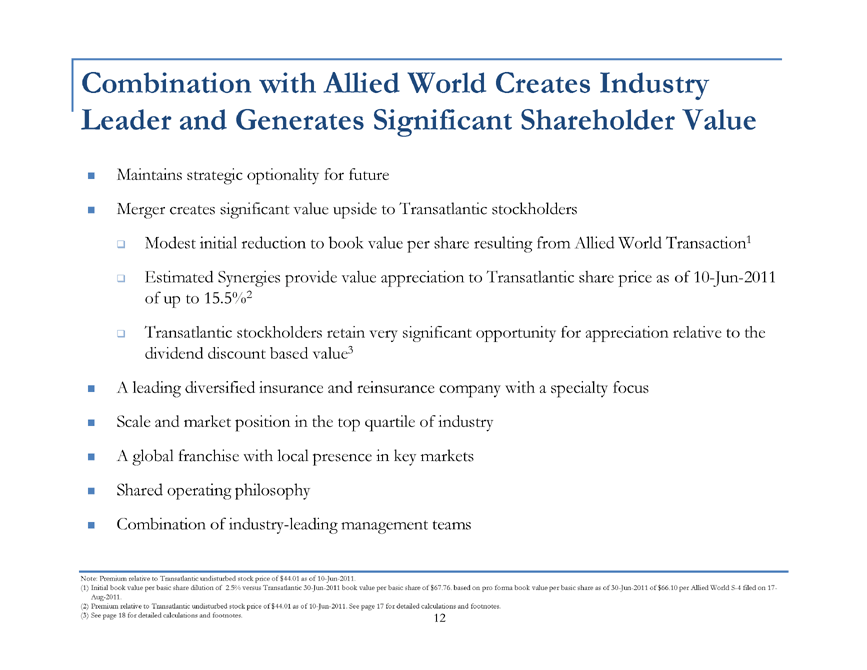
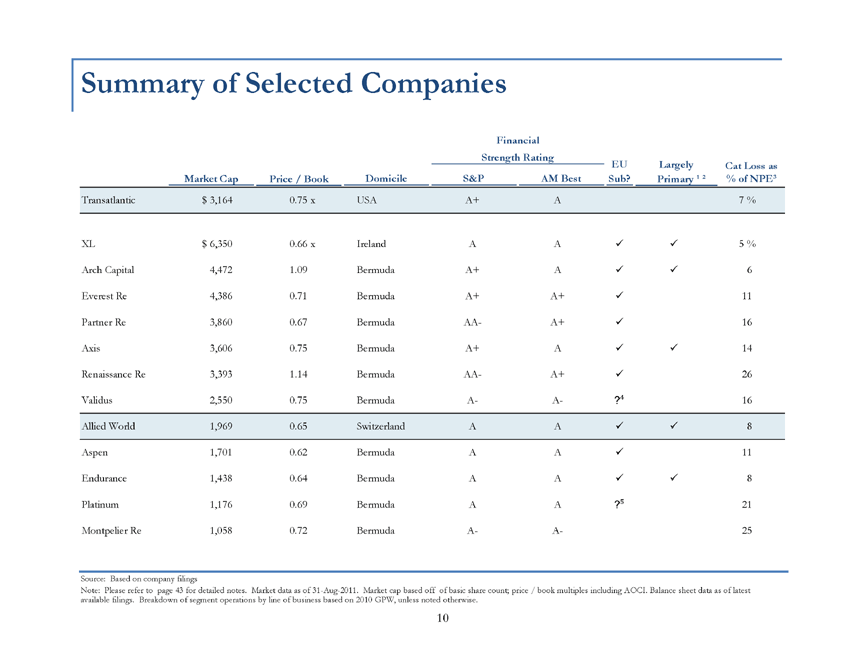
| Summary of Selected Companies Financial Strength Rating EU Largely Cat Loss as Market Cap Price / Book Domicile S&P AM Best Sub? Primary 1 2 % of NPE 3 Transatlantic $3,164 0.75 x USA A+ A 7 % XL $6,350 0.66 x Ireland A A 5% Arch Capital 4,472 1.09 Bermuda A+ A 6 Everest Re 4,386 0.71 Bermuda A+ A+ 11 Partner Re 3,860 0.67 Bermuda AA- A+ 16 Axis 3,606 0.75 Bermuda A+ A 14 Renaissance Re 3,393 1.14 Bermuda AA- A+ 26 Validus 2,550 0.75 Bermuda A- A- ? 16 Allied World 1,969 0.65 Switzerland A A 8 Aspen 1,701 0.62 Bermuda A A 11 Endurance 1,438 0.64 Bermuda A A 8 Platinum 1,176 0.69 Bermuda A A ? 21 Montpelier Re 1,058 0.72 Bermuda A- A- 25 Source: Based on company filings Note: Please refer to page 43 for detailed notes. Market data as of 31-Aug-2011. Market cap based off of basic share count; price / book multiples including AOCI. Balance sheet data as of latest available filings. Breakdown of segment operations by line of business based on 2010 GPW, unless noted otherwise. |
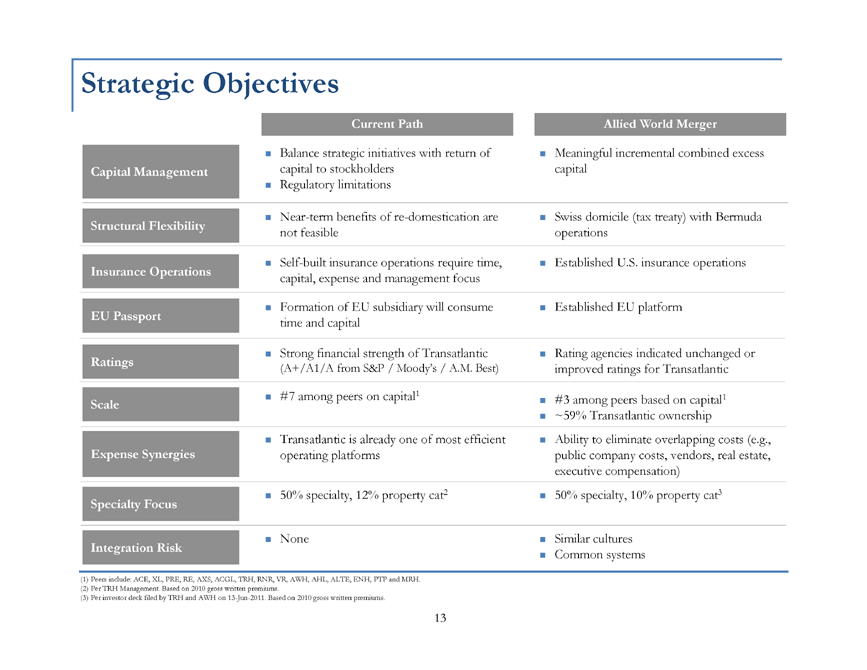
| Timeline of Key Events 1990-2009: AIG owned a majority stake in Transatlantic 10-Jun-2009: AIG disposed of 29.9mm of its shares in Transatlantic through a secondary public offering reducing its stake from 59% to ~14% From time to time since the secondary sale, Transatlantic engaged in preliminary discussions regarding possible business combination transactions with a number of insurance and reinsurance companies including Validus. These discussions did not proceed past preliminary proposals, execution of confidentiality and standstill agreements and limited exchanges of non-public information 15-Mar-2010: AIG disposed of its remaining 8.5mm shares in Transatlantic in a secondary public offering February 2010: Engaged financial advisor to review strategic alternatives; developed criteria to evaluate potential partners 2010: Held discussions with multiple potential merger candidates February / Initiated discussions with Allied World March 2011: -Decided to explore opportunity with Allied World because it best met criteria 27-Mar-2011: Entered into confidentiality agreement with AWH and initiated due diligence 11-Apr-2011: Entered into exclusivity agreement with AWH 25-Apr-2011: Communicated preference for “book-for-book” exchange ratio 12-June-2011: Executed merger agreement and announced transaction with Allied World |
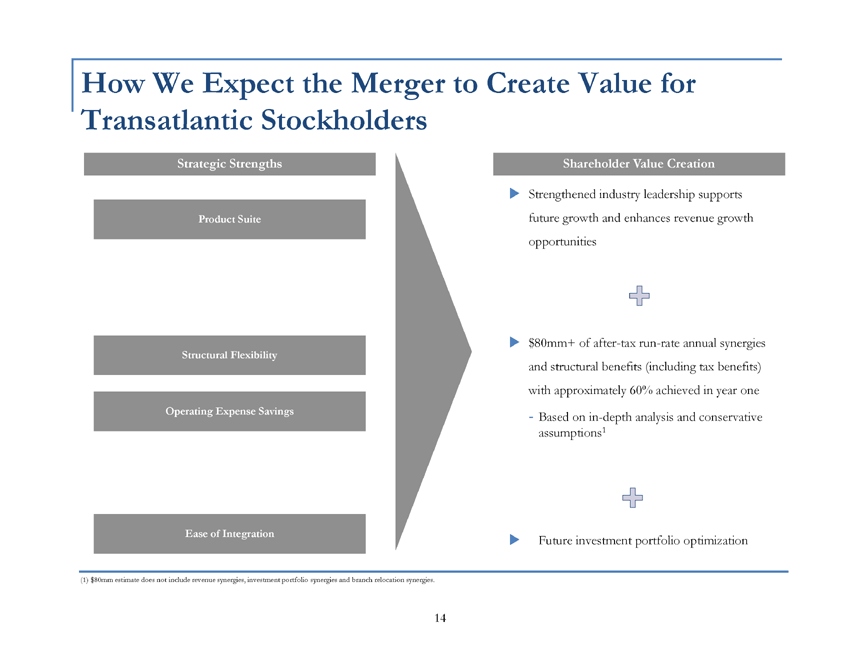
| Strategic Objectives Current Path Allied World Merger Balance strategic initiatives with return of Meaningful incremental combined excess Capital Management capital to stockholders capital Regulatory limitations Near-term benefits of re-domestication are Swiss domicile (tax treaty) with Bermuda Structural Flexibility not feasible operations Self-built insurance operations require time, Established U.S. insurance operations Insurance Operations capital, expense and management focus Formation of EU subsidiary will consume Established EU platform EU Passport time and capital Strong financial strength of Transatlantic Rating agencies indicated unchanged or Ratings (A+/A1/A from S&P / Moody’s / A.M. Best) improved ratings for Transatlantic #7 among peers on capital1 1 #3 among peers based on capital Scale Transatlantic ~59% ownership Transatlantic is already one of most efficient Ability to eliminate overlapping costs (e.g., Expense Synergies operating platforms public company costs, vendors, real estate, executive compensation) 2 3 50% specialty, 12% property cat 50% specialty, 10% property cat Specialty Focus None Similar cultures Integration Risk Common systems (1) Peers include: ACE, XL, PRE, RE, AXS, ACGL, TRH, RNR, VR, AWH, AHL, ALTE, ENH, PTP and MRH. (2) Per TRH Management. Based on 2010 gross written premiums. (3) Per investor deck filed by TRH and AWH on 13-Jun-2011. Based on 2010 gross written premiums. 13 |
| How We Expect the Merger to Create Value for Transatlantic Stockholders Strategic Strengths Shareholder Value Creation Strengthened industry leadership supports Product Suite future growth and enhances revenue growth opportunities $80mm+ of after-tax run-rate annual synergies Structural Flexibility and structural benefits (including tax benefits) with approximately 60% achieved in year one Operating Expense Savings — Based on in-depth analysis and conservative assumptions1 Ease of Integration Future investment portfolio optimization (1) $80mm estimate does not include revenue synergies, investment portfolio synergies and branch relocation synergies. |
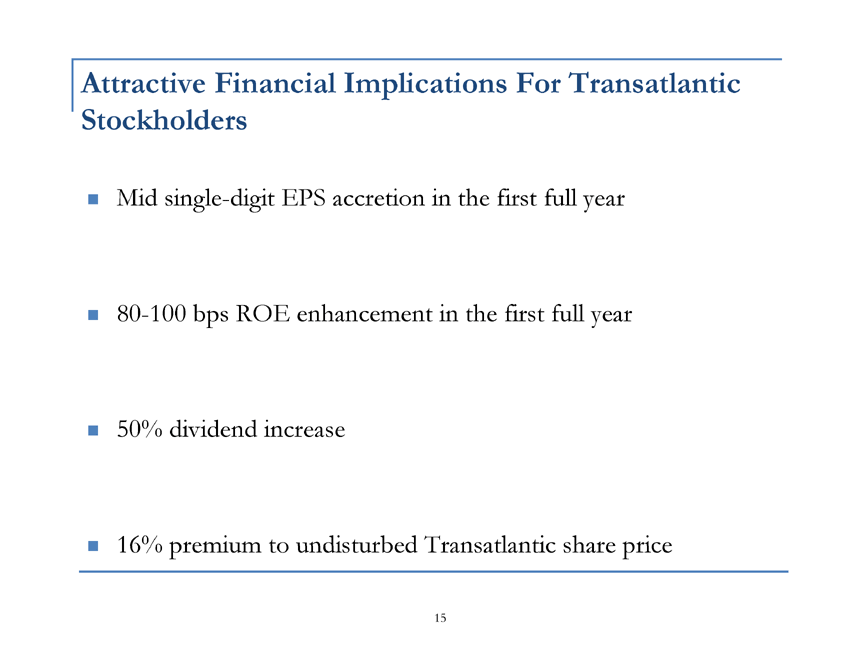
| Attractive Financial Implications For Transatlantic Stockholders Mid single-digit EPS accretion in the first full year 80-100 bps ROE enhancement in the first full year 50% dividend increase 16% premium to undisturbed Transatlantic share price |
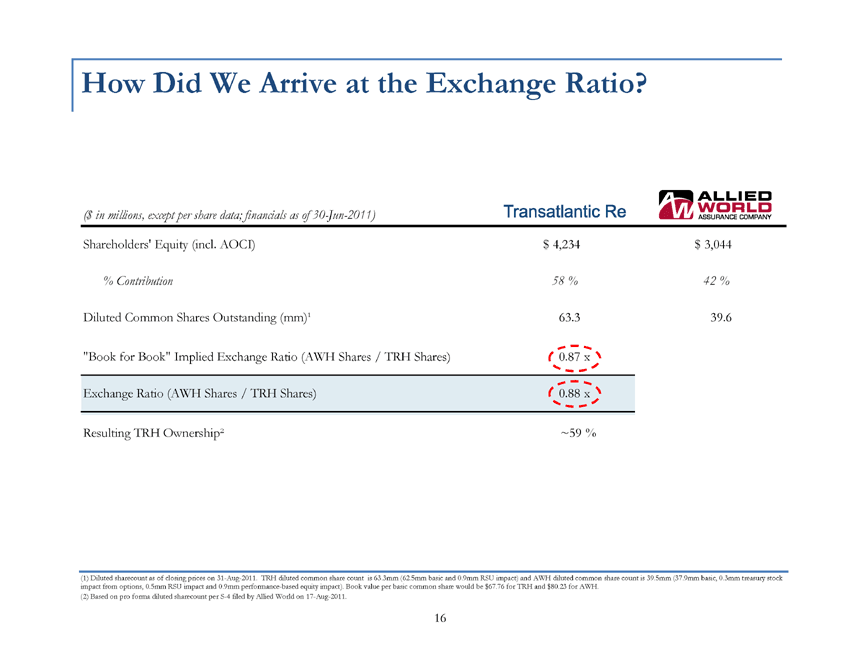
| How Did We Arrive at the Exchange Ratio? ($ in millions, except per share data; financials as of 30-Jun-2011) Shareholders’ Equity (incl. AOCI) $4,234 $3,044% Contribution 58% 42% Diluted Common Shares Outstanding (mm)1 63.3 39.6 “Book for Book” Implied Exchange Ratio (AWH Shares / TRH Shares) 0.87 x Exchange Ratio (AWH Shares / TRH Shares) 0.88 x Resulting TRH Ownership 2 ~59% (1) Diluted sharecount as of closing prices on 31-Aug-2011. TRH diluted common share count is 63.3mm (62.5mm basic and 0.9mm RSU impact) and AWH diluted common share count is 39.5mm (37.9mm basic, 0.3mm treasury stock impact from options, 0.5mm RSU impact and 0.9mm performance-based equity impact). Book value per basic common share would be $67.76 for TRH and $80.23 for AWH. (2) Based on pro forma diluted sharecount per S-4 filed by Allied World on 17-Aug-2011. |
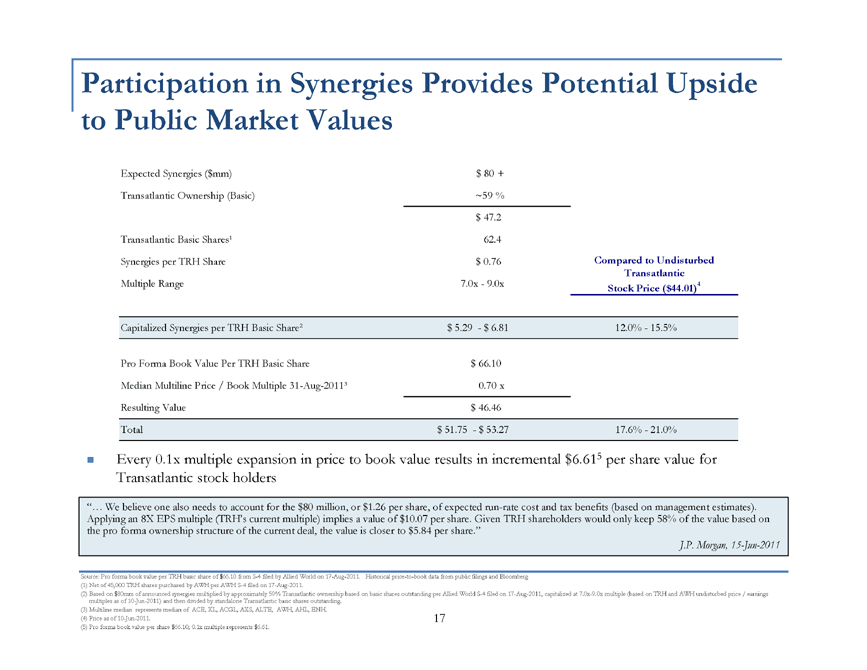
| Participation in Synergies Provides Potential Upside to Public Market Values Expected Synergies ($mm) $80 + Transatlantic Ownership (Basic) ~59% $47.2 Transatlantic Basic Shares 1 62.4 Synergies per TRH Share $0.76 Compared to Undisturbed Transatlantic Multiple Range 7.0x — 9.0x Stock Price ($44.01)4 Capitalized Synergies per TRH Basic Share 2 $5.29 — $6.81 12.0% — 15.5% Pro Forma Book Value Per TRH Basic Share $66.10 Median Multiline Price / Book Multiple 31-Aug-2011 3 0.70 x Resulting Value $46.46 Total $51.75 — $53.27 17.6% — 21.0% Every 0.1x multiple expansion in price to book value results in incremental $6.615 per share value for Transatlantic stock holders “... We believe one also needs to account for the $80 million, or $1.26 per share, of expected run-rate cost and tax benefits (based on management estimates). Applying an 8X EPS multiple (TRH’s current multiple) implies a value of $10.07 per share. Given TRH shareholders would only keep 58% of the value based on the pro forma ownership structure of the current deal, the value is closer to $5.84 per share.” J.P. Morgan, 15-Jun-2011 Source: Pro forma book value per TRH basic share of $66.10 from S-4 filed by Allied World on 17-Aug-2011. Historical price-to-book data from public filings and Bloomberg (1) Net of 45,000 TRH shares purchased by AWH per AWH S-4 filed on 17-Aug-2011. (2) Based on $80mm of announced synergies multiplied by approximately 59% Transatlantic ownership based on basic shares outstanding per Allied World S-4 filed on 17-Aug-2011, capitalized at 7.0x-9.0x multiple (based on TRH and AWH undisturbed price / earnings multiples as of 10-Jun-2011) and then divided by standalone Transatlantic basic shares outstanding. (3) Multiline median represents median of ACE, XL, ACGL, AXS, ALTE, AWH, AHL, ENH. (4) Price as of 10-Jun-2011. 17 (5) Pro forma book value per share $66.10; 0.1x multiple represents $6.61. |
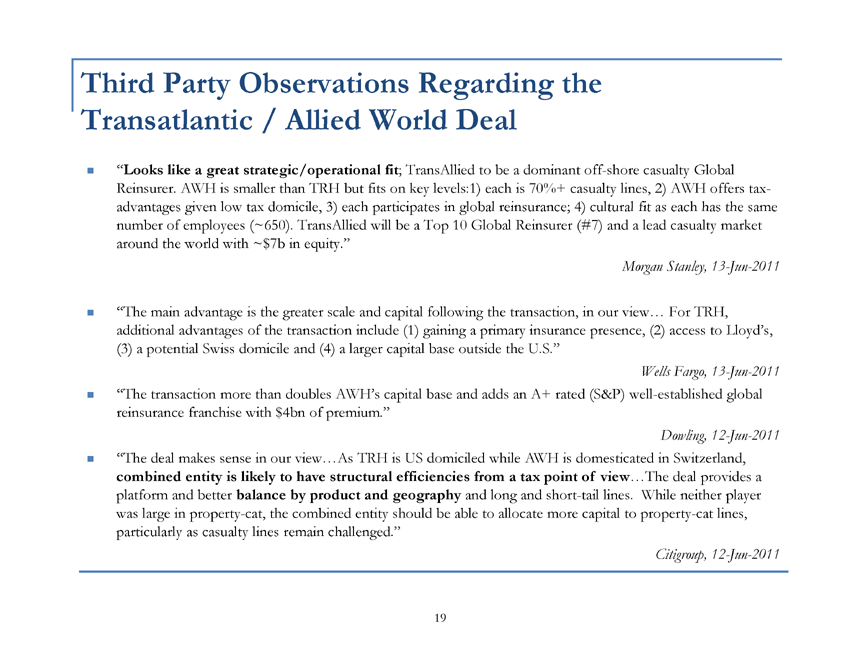
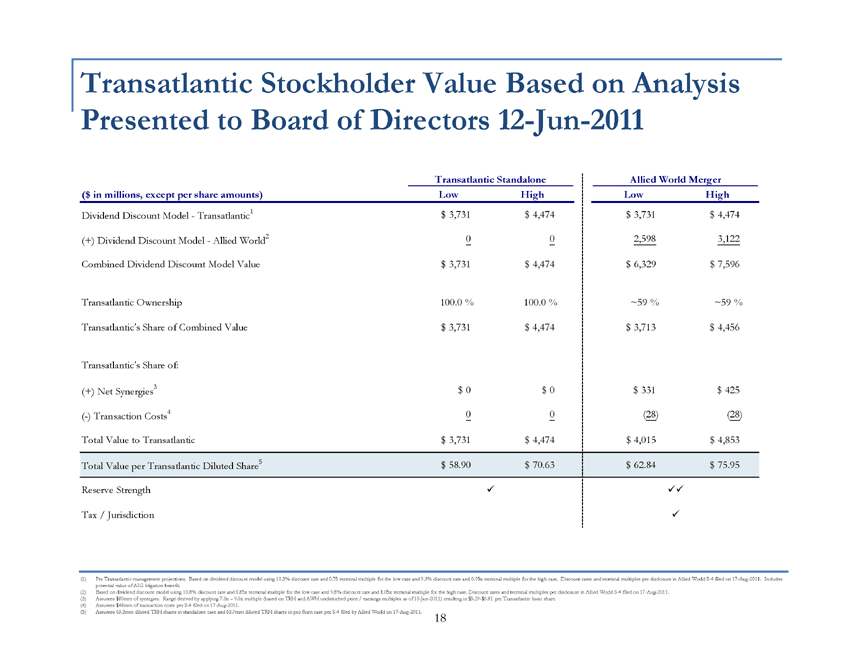
| Transatlantic Stockholder Value Based on Analysis Presented to Board of Directors 12-Jun-2011 Transatlantic Standalone Allied World Merger ($ in millions, except per share amounts) Low High Low High Dividend Discount Model — Transatlantic1 $3,731 $4,474 $3,731 $4,474 (+) Dividend Discount Model — Allied World2 0 0 2,598 3,122 Combined Dividend Discount Model Value $3,731 $4,474 $6,329 $7,596 Transatlantic Ownership 100.0% 100.0% ~59% ~59% Transatlantic’s Share of Combined Value $3,731 $4,474 $3,713 $4,456 Transatlantic’s Share of: (+) Net Synergies3 $0 $0 $331 $425 (-) Transaction Costs4 0 0 (28) (28) Total Value to Transatlantic $3,731 $4,474 $4,015 $4,853 Total Value per Transatlantic Diluted Share5 $58.90 $70.63 $62.84 $75.95 Reserve Strength Tax / Jurisdiction (1) Per Transatlantic management projections. Based on dividend discount model using 10.3% discount rate and 0.75 terminal multiple for the low case and 9.3% discount rate and 0.95x terminal multiple for the high case. Discount rates and terminal multiples per disclosure in Allied World S-4 filed on 17-Aug-2011. Includes potential value of AIG litigation benefit. (2) Based on dividend discount model using 10.8% discount rate and 0.85x terminal multiple for the low case and 9.8% discount rate and 1.05x terminal multiple for the high case. Discount rates and terminal multiples per disclosure in Allied World S-4 filed on 17-Aug-2011. (3) Assumes $80mm of synergies. Range derived by applying 7.0x — 9.0x multiple (based on TRH and AWH undisturbed price / earnings multiples as of 10-Jun-2011) resulting in $5.29-$6.81 per Transatlantic basic share. (4) Assumes $48mm of transaction costs per S-4 filed on 17-Aug-2011. (5) Assumes 63.3mm diluted TRH shares in standalone case and 63.9mm diluted TRH shares in pro form case per S-4 filed by Allied World on 17-Aug-2011. 18 |
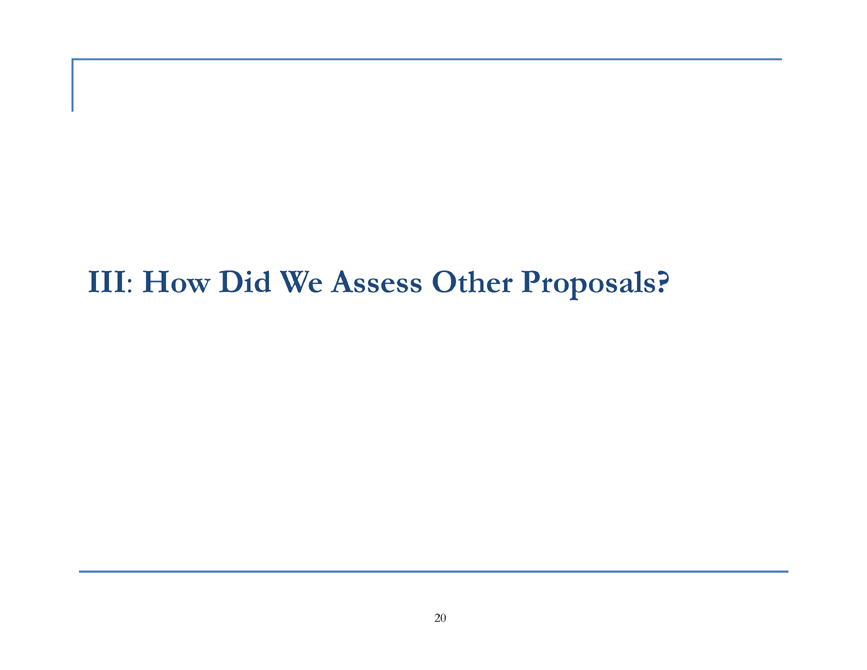
| Third Party Observations Regarding the Transatlantic / Allied World Deal “Looks like a great strategic/operational fit; TransAllied to be a dominant off-shore casualty Global Reinsurer. AWH is smaller than TRH but fits on key levels:1) each is 70%+ casualty lines, 2) AWH offers tax-advantages given low tax domicile, 3) each participates in global reinsurance; 4) cultural fit as each has the same number of employees (~650). TransAllied will be a Top 10 Global Reinsurer (#7) and a lead casualty market around the world with ~$7b in equity.” Morgan Stanley, 13-Jun-2011 “The main advantage is the greater scale and capital following the transaction, in our view... For TRH, additional advantages of the transaction include (1) gaining a primary insurance presence, (2) access to Lloyd’s, (3) a potential Swiss domicile and (4) a larger capital base outside the U.S.” Wells Fargo, 13-Jun-2011 “The transaction more than doubles AWH’s capital base and adds an A+ rated (S&P) well-established global reinsurance franchise with $4bn of premium.” Dowling, 12-Jun-2011 “The deal makes sense in our view...As TRH is US domiciled while AWH is domesticated in Switzerland, combined entity is likely to have structural efficiencies from a tax point of view...The deal provides a platform and better balance by product and geography and long and short-tail lines. While neither player was large in property-cat, the combined entity should be able to allocate more capital to property-cat lines, particularly as casualty lines remain challenged.” Citigroup, 12-Jun-2011 |
| III: How Did We Assess Other Proposals? |
| A: Validus Proposal |
| Summary of Validus Proposal 1.5564 Validus shares per each Transatlantic share Mechanics of Proposal $8.00 cash per Transatlantic share Transatlantic Ownership Approximately 48% Transatlantic board found that Validus proposal is reasonably likely to lead to a superior proposal and provided Validus opportunity to conduct diligence Need to sign confidentiality agreement to initiate discussions Validus refuses to sign confidentiality agreement with the standstill provision, despite Delaware court findings and Progress and Timing another party having signed the confidentiality agreement Need to conduct due diligence / reverse due diligence Risk profile assessment Synergies analysis No certainty of transaction completion with Validus |
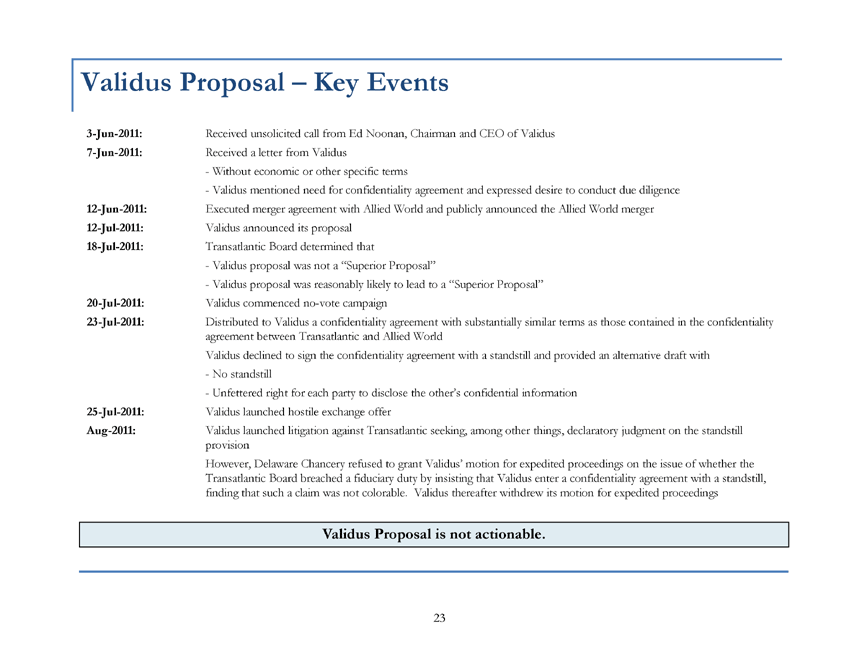
| Validus Proposal — Key Events 3-Jun-2011: Received unsolicited call from Ed Noonan, Chairman and CEO of Validus 7-Jun-2011: Received a letter from Validus — Without economic or other specific terms — Validus mentioned need for confidentiality agreement and expressed desire to conduct due diligence 12-Jun-2011: Executed merger agreement with Allied World and publicly announced the Allied World merger 12-Jul-2011: Validus announced its proposal 18-Jul-2011: Transatlantic Board determined that — Validus proposal was not a “Superior Proposal” — Validus proposal was reasonably likely to lead to a “Superior Proposal” 20-Jul-2011: Validus commenced no-vote campaign 23-Jul-2011: Distributed to Validus a confidentiality agreement with substantially similar terms as those contained in the confidentiality agreement between Transatlantic and Allied World Validus declined to sign the confidentiality agreement with a standstill and provided an alternative draft with — No standstill — Unfettered right for each party to disclose the other’s confidential information 25-Jul-2011: Validus launched hostile exchange offer Aug-2011: Validus launched litigation against Transatlantic seeking, among other things, declaratory judgment on the standstill provision However, Delaware Chancery refused to grant Validus’ motion for expedited proceedings on the issue of whether the Transatlantic Board breached a fiduciary duty by insisting that Validus enter a confidentiality agreement with a standstill, finding that such a claim was not colorable. Validus thereafter withdrew its motion for expedited proceedings Validus Proposal is not actionable. |
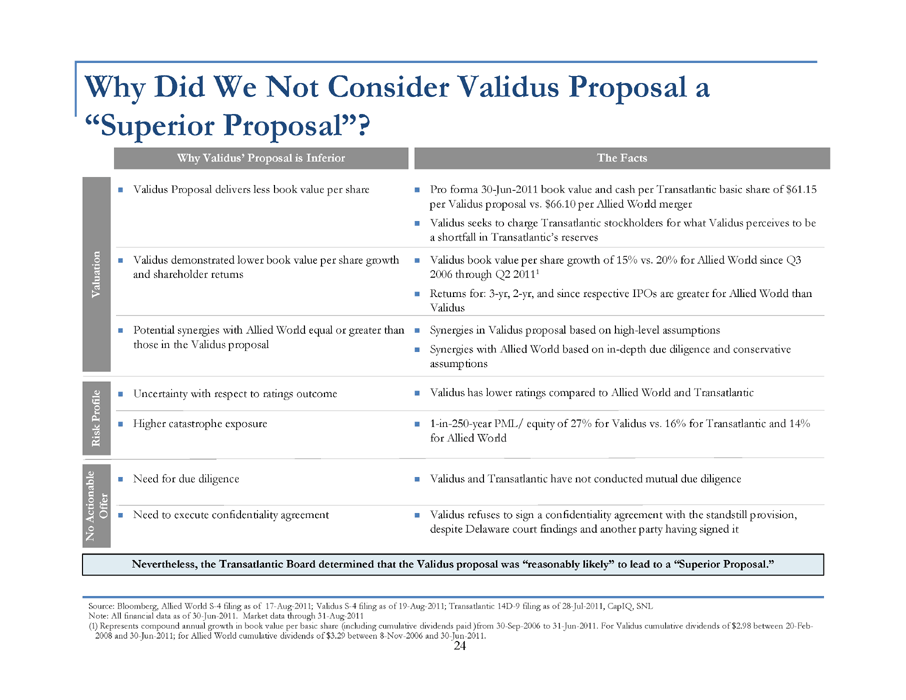
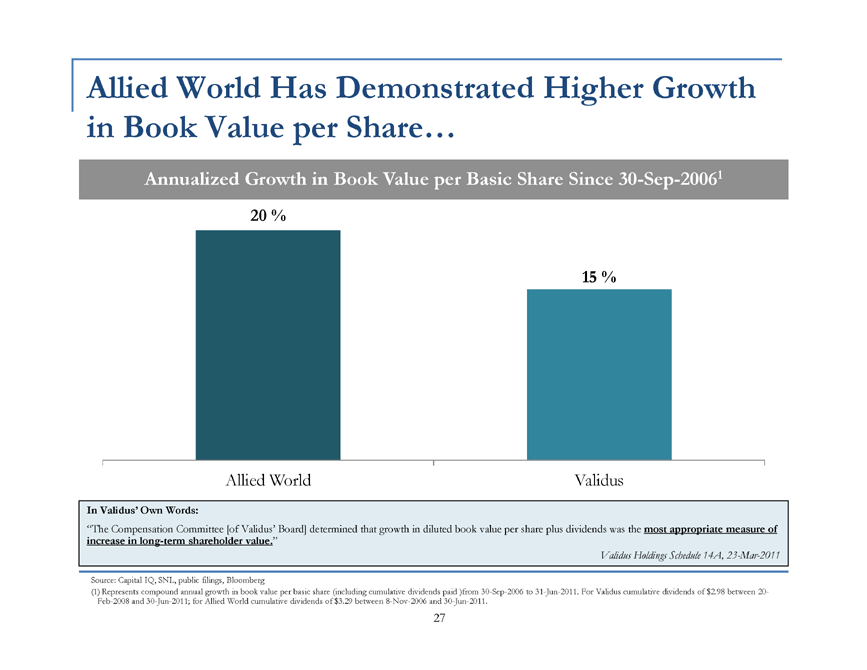
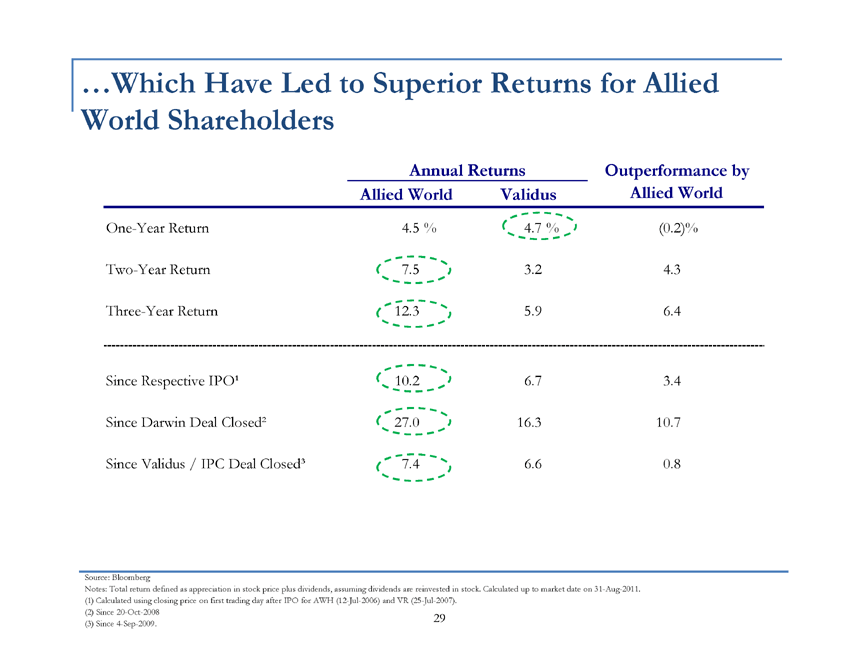
| Why Did We Not Consider Validus Proposal a “Superior Proposal”? Why Validus’ Proposal is Inferior The Facts Validus Proposal delivers less book value per share Pro forma 30-Jun-2011 book value and cash per Transatlantic basic share of $61.15 per Validus proposal vs. $66.10 per Allied World merger Validus seeks to charge Transatlantic stockholders for what Validus perceives to be a shortfall in Transatlantic’s reserves Validus demonstrated lower book value per share growth Validus book value per share growth of 15% vs. 20% for Allied World since Q3 and shareholder returns 2006 through Q2 20111 Valuation Returns for: 3-yr, 2-yr, and since respective IPOs are greater for Allied World than Validus Potential synergies with Allied World equal or greater than Synergies in Validus proposal based on high-level assumptions those in the Validus proposal with Allied World based on Synergies in-depth due diligence and conservative assumptions Profile Uncertainty with respect to ratings outcome Validus has lower ratings compared to Allied World and Transatlantic Higher catastrophe exposure 1-in-250-year PML/ equity of 27% for Validus vs. 16% for Transatlantic and 14% Risk for Allied World le Need for due diligence Validus and Transatlantic have not conducted mutual due diligence Actionab Offer Need to execute confidentiality agreement Validus refuses to sign a confidentiality agreement with the standstill provision, No despite Delaware court findings and another party having signed it Nevertheless, the Transatlantic Board determined that the Validus proposal was “reasonably likely” to lead to a “Superior Proposal.” Source: Bloomberg, Allied World S-4 filing as of 17-Aug-2011; Validus S-4 filing as of 19-Aug-2011; Transatlantic 14D-9 filing as of 28-Jul-2011, CapIQ, SNL Note: All financial data as of 30-Jun-2011. Market data through 31-Aug-2011 (1) Represents compound annual growth in book value per basic share (including cumulative dividends paid )from 30-Sep-2006 to 31-Jun-2011. For Validus cumulative dividends of $2.98 between 20-Feb-2008 and 30-Jun-2011; for Allied World cumulative dividends of $3.29 between 8-Nov-2006 and 30-Jun 24-2011. |
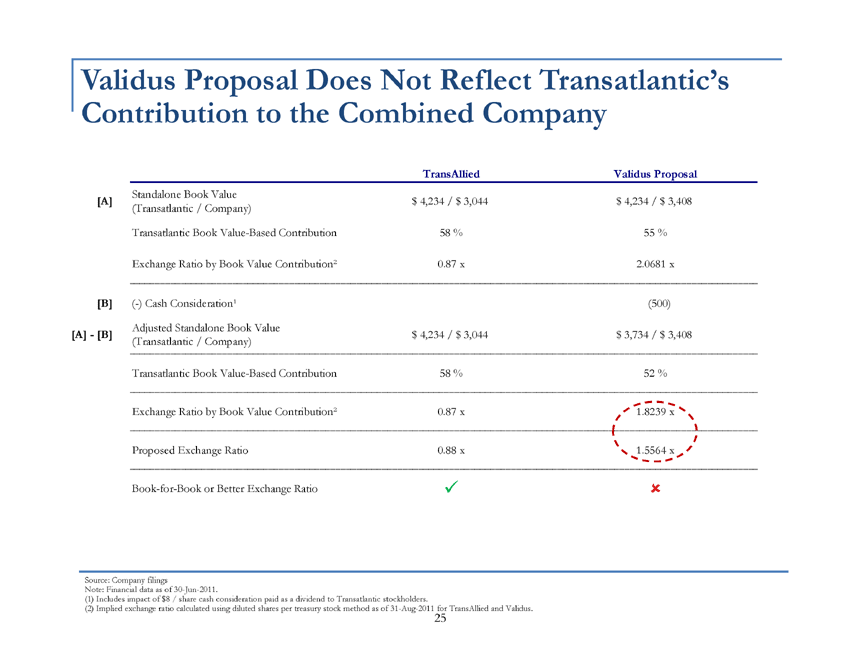
| Validus Proposal Does Not Reflect Transatlantic’s Contribution to the Combined Company TransAllied Validus Proposal Standalone Book Value [A] $4,234 / $3,044 $4,234 / $3,408 (Transatlantic / Company) Transatlantic Book Value-Based Contribution 58% 55% Exchange Ratio by Book Value Contribution 2 0.87 x 2.0681 x [B] (-) Cash Consideration 1 (500) Adjusted Standalone Book Value [A] — [B] $4,234 / $3,044 $3,734 / $3,408 (Transatlantic / Company) Transatlantic Book Value-Based Contribution 58% 52% Exchange Ratio by Book Value Contribution 2 0.87 x 1.8239 x Proposed Exchange Ratio 0.88 x 1.5564 x Book-for-Book or Better Exchange Ratio Source: Company filings Note: Financial data as of 30-Jun-2011. (1) Includes impact of $8 / share cash consideration paid as a dividend to Transatlantic stockholders. (2) Implied exchange ratio calculated using diluted shares per treasury stock method as of 31-Aug-201125 for TransAllied and Validus. |
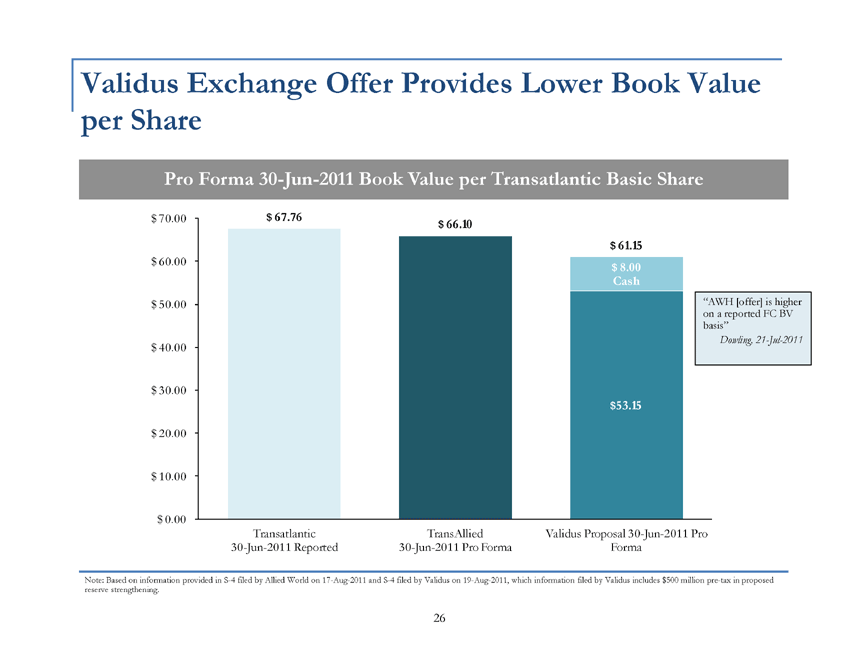
| Validus Exchange Offer Provides Lower Book Value per Share Pro Forma 30-Jun-2011 Book Value per Transatlantic Basic Share $70.00 $67.76 $66.10 $61.15 $60.00 $8.00 Cash $50.00 “AWH [offer] is higher on a reported FC BV basis” Dowling, 21-Jul-2011 $40.00 $30.00 $53.15 $20.00 $10.00 $0.00 Transatlantic TransAllied Validus Proposal 30-Jun-2011 Pro 30-Jun-2011 Reported 30-Jun-2011 Pro Forma Forma Note: Based on information provided in S-4 filed by Allied World on 17-Aug-2011 and S-4 filed by Validus on 19-Aug-2011, which information filed by Validus includes $500 million pre-tax in proposed reserve strengthening. 26 |
| Allied World Has Demonstrated Higher Growth in Book Value per Share... Annualized Growth in Book Value per Basic Share Since 30-Sep-20061 20% 15% Allied World Validus In Validus’ Own Words: “The Compensation Committee [of Validus’ Board] determined that growth in diluted book value per share plus dividends was the most appropriate measure of increase in long-term shareholder value.” Validus Holdings Schedule 14A, 23-Mar-2011 Source: Capital IQ, SNL, public filings, Bloomberg (1) Represents compound annual growth in book value per basic share (including cumulative dividends paid )from 30-Sep-2006 to 31-Jun-2011. For Validus cumulative dividends of $2.98 between 20-Feb-2008 and 30-Jun-2011; for Allied World cumulative dividends of $3.29 between 8-Nov-2006 and 30-Jun-2011. 27 |
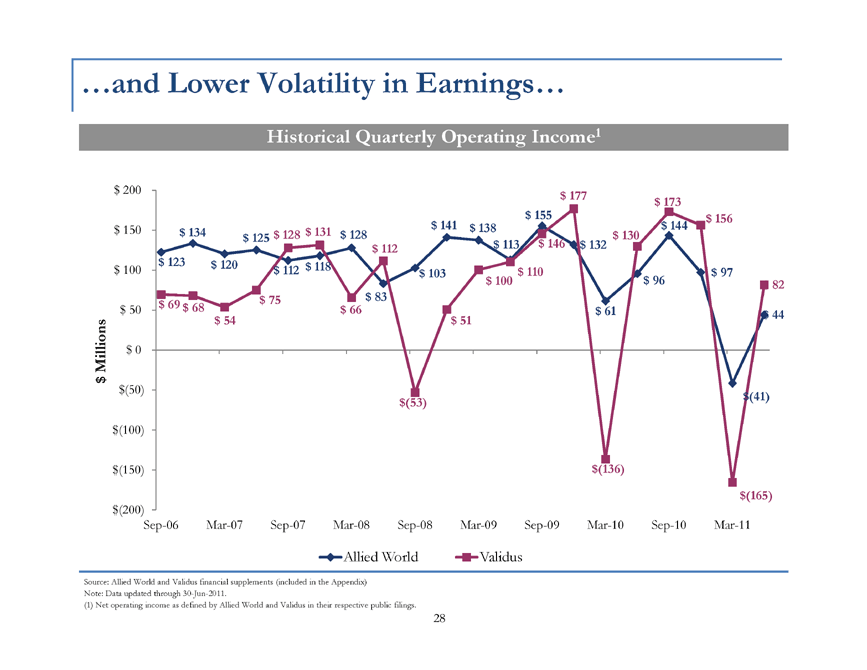
| ...and Lower Volatility in Earnings... Historical Quarterly Operating Income1 $200 $177 $173 $155 $156 $150 $141 $138 $144 $134 $128 $131 $128 $130 $125 $146 $112 $113 $132 $123 $120 $118 $100 $112 $103 $110 $97 $100 $96 $82 $75 $83 $50 $69 $68 $66 $61 $44 $54 $51 Millions $0 $ $(50) $(41) $(53) $(100) $(150) $(136) $(165) $(200) Sep-06 Mar-07 Sep-07 Mar-08 Sep-08 Mar-09 Sep-09 Mar-10 Sep-10 Mar-11 Allied World Validus Source: Allied World and Validus financial supplements (included in the Appendix) Note: Data updated through 30-Jun-2011. (1) Net operating income as defined by Allied World and Validus in their respective public filings. 28 |
| ...Which Have Led to Superior Returns for Allied World Shareholders Annual Returns Outperformance by Allied World Validus Allied World One-Year Return 4.5% 4.7% (0.2)% Two-Year Return 7.5 3.2 4.3 Three-Year Return 12.3 5.9 6.4 Since Respective IPO 1 10.2 6.7 3.4 Since Darwin Deal Closed 2 27.0 16.3 10.7 Since Validus / IPC Deal Closed 3 7.4 6.6 0.8 Source: Bloomberg Notes: Total return defined as appreciation in stock price plus dividends, assuming dividends are reinvested in stock. Calculated up to market date on 31-Aug-2011. (1) Calculated using closing price on first trading day after IPO for AWH (12-Jul-2006) and VR (25-Jul-2007). (2) Since 20-Oct-2008 29 (3) Since 4-Sep-2009. |
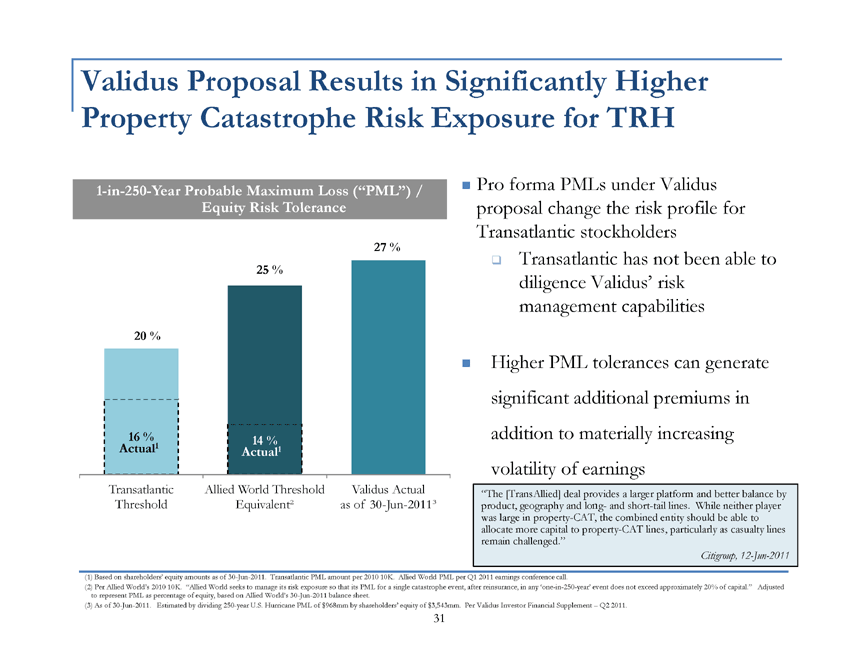
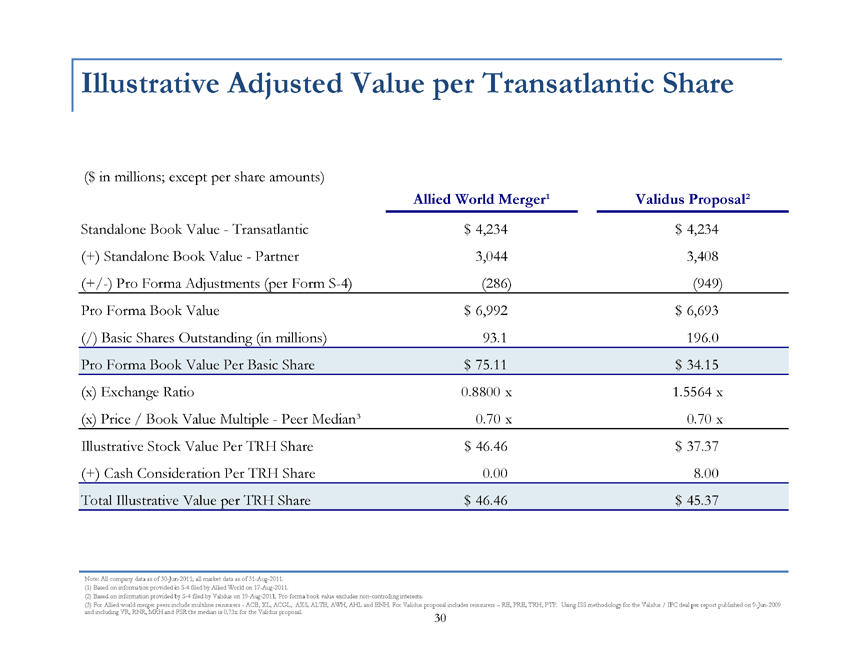
| Illustrative Adjusted Value per Transatlantic Share ($ in millions; except per share amounts) Allied World Merger 1 Validus Proposal 2 Standalone Book Value — Transatlantic $4,234 $4,234 (+) Standalone Book Value — Partner 3,044 3,408 (+/-) Pro Forma Adjustments (per Form S-4) (286) (949) Pro Forma Book Value $6,992 $6,693 (/) Basic Shares Outstanding (in millions) 93.1 196.0 Pro Forma Book Value Per Basic Share $75.11 $34.15 (x) Exchange Ratio 0.8800 x 1.5564 x (x) Price / Book Value Multiple — Peer Median 3 0.70 x 0.70 x Illustrative Stock Value Per TRH Share $46.46 $37.37 (+) Cash Consideration Per TRH Share 0.00 8.00 Total Illustrative Value per TRH Share $46.46 $45.37 Note: All company data as of 30-Jun-2011; all market data as of 31-Aug-2011. (1) Based on information provided in S-4 filed by Allied World on 17-Aug-2011. (2) Based on information provided by S-4 filed by Validus on 19-Aug-2011. Pro forma book value excludes non-controlling interests. (3) For Allied world merger peers include multiline reinsurers — ACE, XL, ACGL, AXS, ALTE, AWH, AHL and ENH. For Validus proposal includes reinsurers — RE, PRE, TRH, PTP. Using ISS methodology for the Validus / IPC deal per report published on 9-Jun-2009 and including VR, RNR, MRH and FSR the median is 0.73x for the Validus proposal. 30 long |
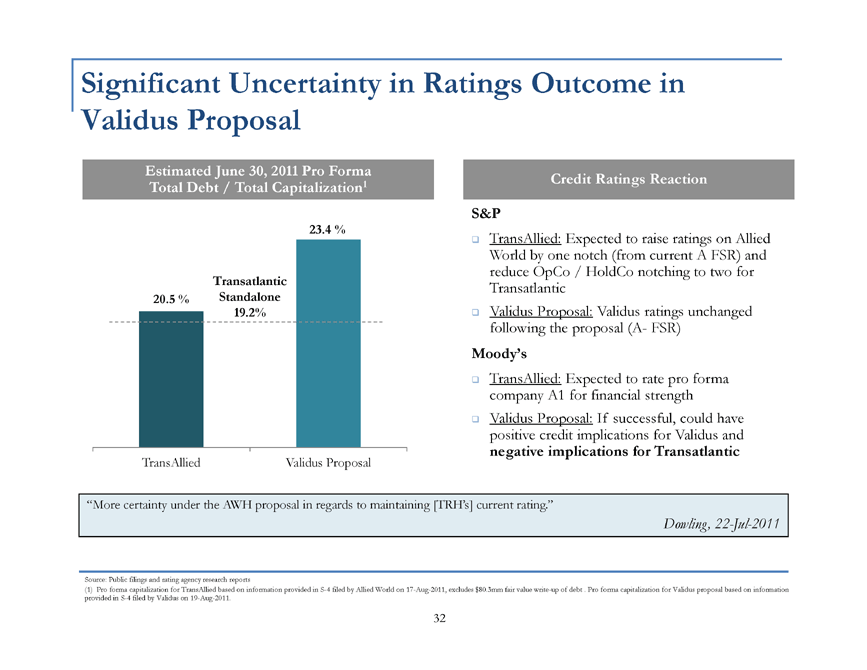
| Validus Proposal Results in Significantly Higher Property Catastrophe Risk Exposure for TRH 1-in-250-Year Probable Maximum Loss (“PML”) / Pro forma PMLs under Validus Equity Risk Tolerance proposal change the risk profile for Transatlantic stockholders 27% Transatlantic has not been able to 25% diligence Validus’ risk management capabilities 20% Higher PML tolerances can generate significant additional premiums in 16% 14% addition to materially increasing Actual1 Actual1 volatility of earnings Transatlantic Allied World Threshold Validus Actual “The [TransAllied] deal provides a larger platform and better balance by Threshold Equivalent 2 as of 30-Jun-2011 3 product, geography and log- and short-tail lines. While neither player was large in property-CAT, the combined entity should be able to allocate more capital to property-CAT lines, particularly as casualty lines remain challenged.” Citigroup, 12-Jun-2011 (1) Based on shareholders’ equity amounts as of 30-Jun-2011. Transatlantic PML amount per 2010 10K. Allied World PML per Q1 2011 earnings conference call. (2) Per Allied World’s 2010 10K. “Allied World seeks to manage its risk exposure so that its PML for a single catastrophe event, after reinsurance, in any ‘one-in-250-year’ event does not exceed approximately 20% of capital.” Adjusted to represent PML as percentage of equity, based on Allied World’s 30-Jun-2011 balance sheet. (3) As of 30-Jun-2011. Estimated by dividing 250-year U.S. Hurricane PML of $968mm by shareholders’ equity of $3,543mm. Per Validus Investor Financial Supplement — Q2 2011. 31 |
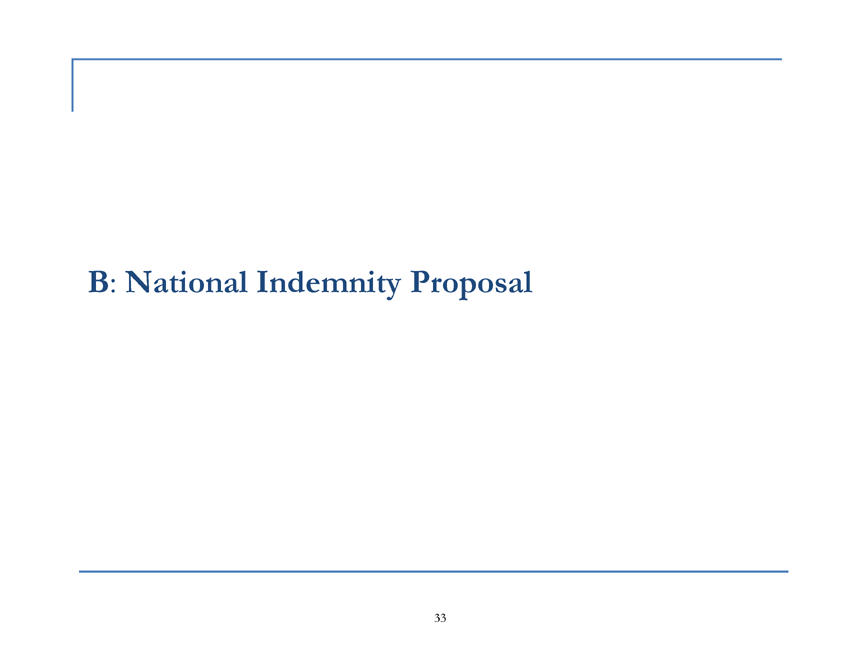
| Significant Uncertainty in Ratings Outcome in Validus Proposal Estimated June 30, 2011 Pro Forma 1 Credit Ratings Reaction Total Debt / Total Capitalization S&P 23.4% TransAllied: Expected to raise ratings on Allied World by one notch (from current A FSR) and reduce OpCo / HoldCo notching to two for Transatlantic Transatlantic 20.5% Standalone 19.2% Validus Proposal: Validus ratings unchanged following the proposal (A- FSR) Moody’s TransAllied: Expected to rate pro forma company A1 for financial strength Validus Proposal: If successful, could have positive credit implications for Validus and TransAllied Validus Proposal negative implications for Transatlantic “More certainty under the AWH proposal in regards to maintaining [TRH’s] current rating.” Dowling, 22-Jul-2011 Source: Public filings and rating agency research reports (1) Pro forma capitalization for TransAllied based on information provided in S-4 filed by Allied World on 17-Aug-2011, excludes $80.3mm fair value write-up of debt . Pro forma capitalization for Validus proposal based on information provided in S-4 filed by Validus on 19-Aug-2011. 32 |
| B: National Indemnity Proposal |
| Summary of National Indemnity Offer All Cash Proposal Transatlantic pro forma ownership of 0% No participation in upside Signed confidentiality agreement |
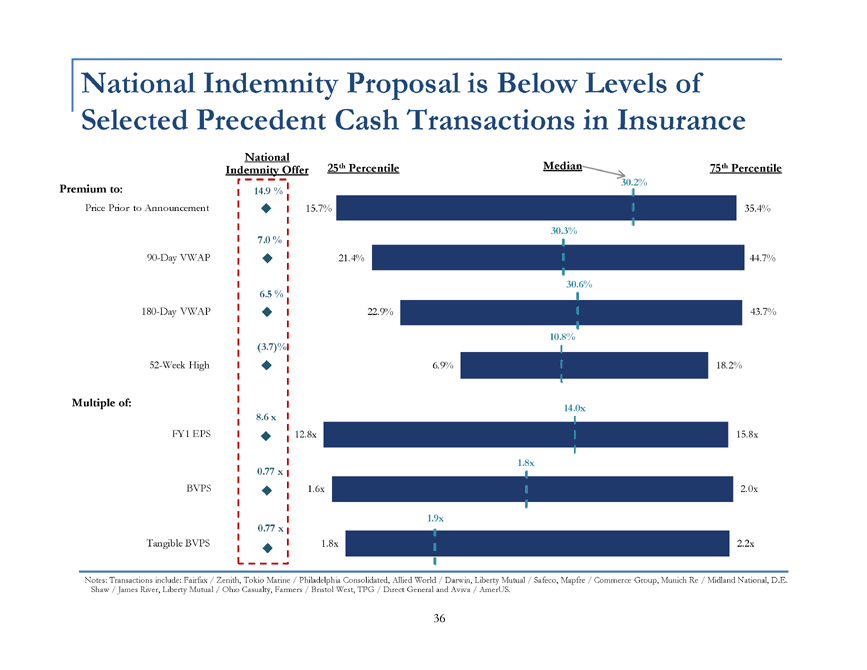
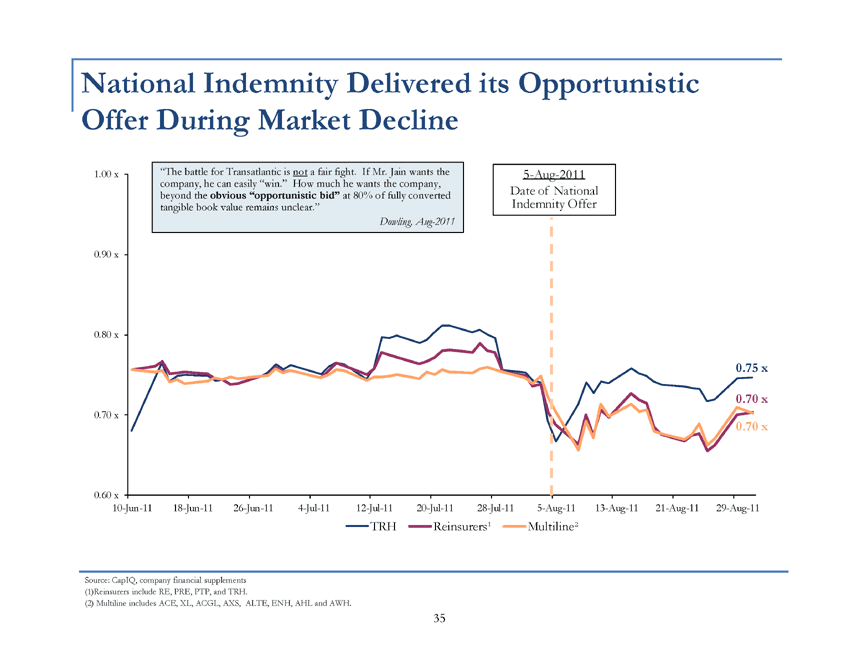
| National Indemnity Delivered its Opportunistic Offer During Market Decline 1.00 x “The battle for Transatlantic is not a fair fight. If Mr. Jain wants the 5-Aug-2011 company, he can easily “win.” How much he wants the company, beyond the obvious “opportunistic bid” at 80% of fully converted Date of National tangible book value remains unclear.” Indemnity Offer Dowling, Aug-2011 0.90 x 0.80 x 0.75 x 0.70 x 0.70 x 0.70 x 0.60 x 10-Jun-11 18-Jun-11 26-Jun-11 4-Jul-11 12-Jul-11 20-Jul-11 28-Jul-11 5-Aug-11 13-Aug-11 21-Aug-11 29-Aug-11 TRH Reinsurers 1 Multiline 2 Source: CapIQ, company financial supplements (1)Reinsurers include RE, PRE, PTP, and TRH. (2) Multiline includes ACE, XL, ACGL, AXS, ALTE, ENH, AHL and AWH. 35 |
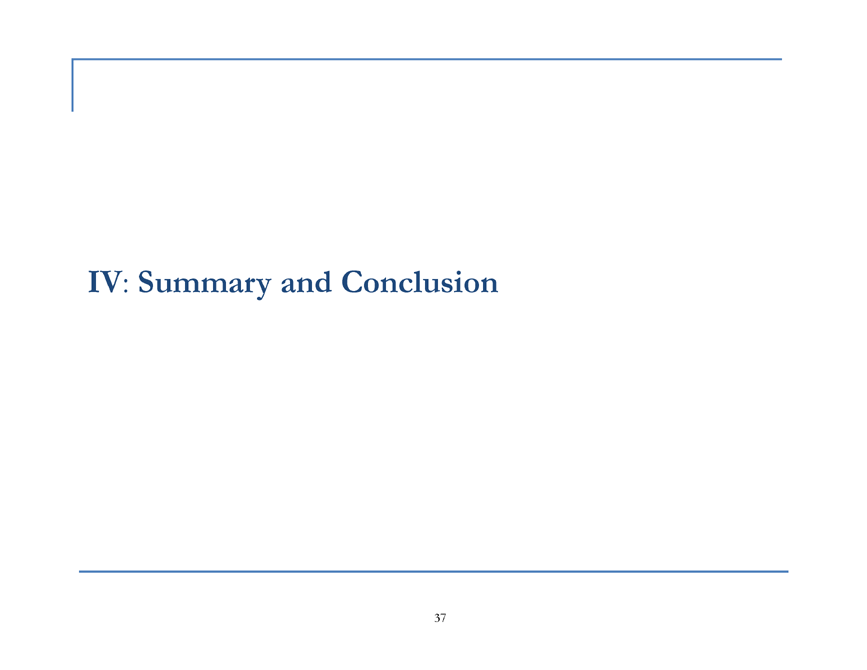
| National Indemnity Proposal is Below Levels of Selected Precedent Cash Transactions in Insurance National Indemnity Offer 25th Percentile Median 75th Percentile 30.2% Premium to: 14.9% Price Prior to Announcement 15.7% 35.4% 7.0% 30.3% 90-Day VWAP 21.4% 44.7% 6.5% 30.6% 180-Day VWAP 22.9% 43.7% 10.8% (3.7)% 52-Week High 6.9% 18.2% Multiple of: 8.6 x 14.0x FY1 EPS 12.8x 15.8x 0.77 x 1.8x BVPS 1.6x 2.0x 1.9x 0.77 x Tangible BVPS 1.8x 2.2x Notes: Transactions include: Fairfax / Zenith, Tokio Marine / Philadelphia Consolidated, Allied World / Darwin, Liberty Mutual / Safeco, Mapfre / Commerce Group, Munich Re / Midland National, D.E. Shaw / James River, Liberty Mutual / Ohio Casualty, Farmers / Bristol West, TPG / Direct General and Aviva / AmerUS. 36 |
| IV: Summary and Conclusion |
| Why We Believe the Allied World Transaction Delivers Superior Value to Transatlantic Stockholders Maintains strategic optionality for future Merger creates significant value upside to Transatlantic stockholders A leading diversified insurance and reinsurance company with a specialty focus Scale and market position in the top quartile of industry A global franchise with local presence in key markets Shared operating philosophy Combination of industry-leading management teams The Transatlantic board has considered all proposals fairly and the Delaware court confirms the validity of its approach We believe that the Allied World deal offers better value creation opportunities, a strengthened and diversified franchise and more potential upside for Transatlantic stockholders than any alternative available, while addressing many of Transatlantic’s current strategic objectives. |
| Appendix pp A: Reconciliation of Non-GAAP Measures1 (1) This presentation includes certain financial measures that are not calculated under standards or rules that comprise U.S. GAAP. Such measures are referred to as non-GAAP. Non-GAAP measures may be defined or calculated differently by other companies. We believe that these measures are important to investors and other interested parties. These measures should not be viewed as a substitute for those determined in accordance with U.S. GAAP. This Appendix A sets forth a reconciliation of the non-GAAP measures to the most comparable U.S. GAAP measures. 39 |
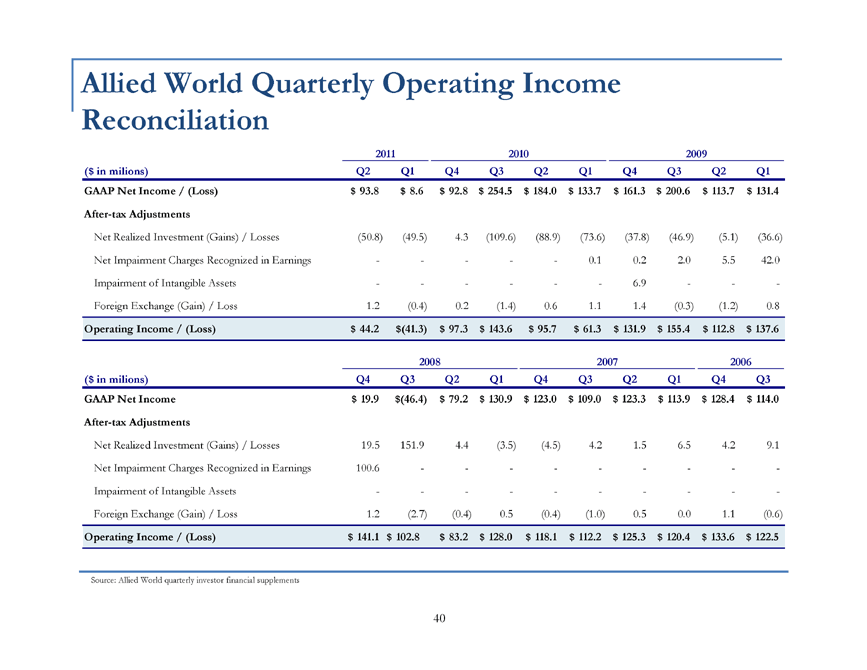
| Allied World Quarterly Operating Income Reconciliation 2011 2010 2009 ($ in milions) Q2 Q1 Q4 Q3 Q2 Q1 Q4 Q3 Q2 Q1 GAAP Net Income / (Loss) $93.8 $8.6 $92.8 $254.5 $184.0 $133.7 $161.3 $200.6 $113.7 $131.4 After-tax Adjustments Net Realized Investment (Gains) / Losses (50.8) (49.5) 4.3 (109.6) (88.9) (73.6) (37.8) (46.9) (5.1) (36.6) Net Impairment Charges Recognized in Earnings — - - — - 0.1 0.2 2.0 5.5 42.0 Impairment of Intangible Assets — - — - — - 6.9 — - -Foreign Exchange (Gain) / Loss 1.2 (0.4) 0.2 (1.4) 0.6 1.1 1.4 (0.3) (1.2) 0.8 Operating Income / (Loss) $44.2 $(41.3) $97.3 $143.6 $95.7 $61.3 $131.9 $155.4 $112.8 $137.6 2008 2007 2006 ($ in milions) Q4 Q3 Q2 Q1 Q4 Q3 Q2 Q1 Q4 Q3 GAAP Net Income $19.9 $(46.4) $79.2 $130.9 $123.0 $109.0 $123.3 $113.9 $128.4 $114.0 After-tax Adjustments Net Realized Investment (Gains) / Losses 19.5 151.9 4.4 (3.5) (4.5) 4.2 1.5 6.5 4.2 9.1 Net Impairment Charges Recognized in Earnings 100.6 — - — - — - — - -Impairment of Intangible Assets — - — - — - — - — -Foreign Exchange (Gain) / Loss 1.2 (2.7) (0.4) 0.5 (0.4) (1.0) 0.5 0.0 1.1 (0.6) Operating Income / (Loss) $141.1 $102.8 $83.2 $128.0 $118.1 $112.2 $125.3 $120.4 $133.6 $122.5 Source: Allied World quarterly investor financial supplements |

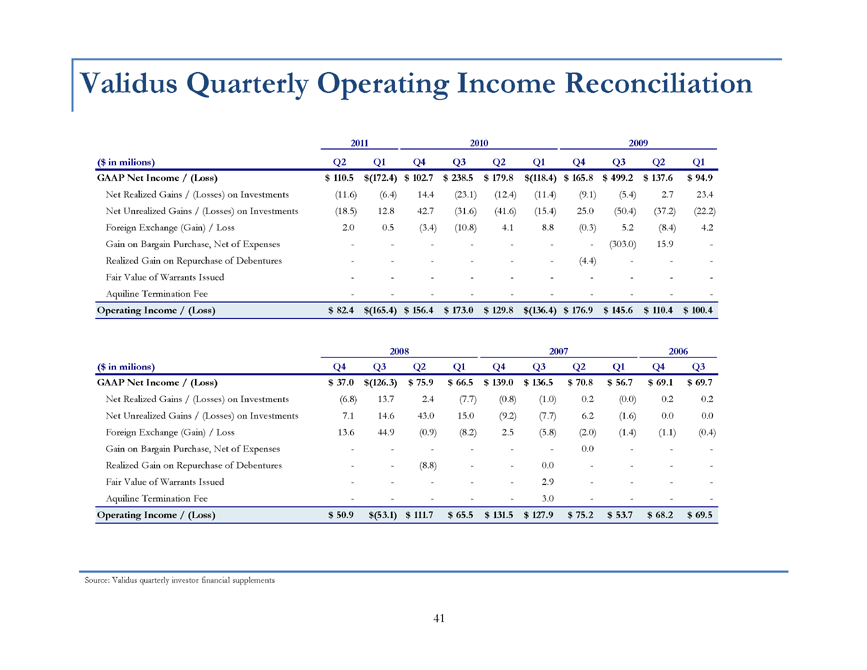
| Validus Quarterly Operating Income Reconciliation 2011 2010 2009 ($ in milions) Q2 Q1 Q4 Q3 Q2 Q1 Q4 Q3 Q2 Q1 GAAP Net Income / (Loss) $110.5 $(172.4) $102.7 $238.5 $179.8 $(118.4) $165.8 $499.2 $137.6 $94.9 Net Realized Gains / (Losses) on Investments (11.6) (6.4) 14.4 (23.1) (12.4) (11.4) (9.1) (5.4) 2.7 23.4 Net Unrealized Gains / (Losses) on Investments (18.5) 12.8 42.7 (31.6) (41.6) (15.4) 25.0 (50.4) (37.2) (22.2) Foreign Exchange (Gain) / Loss 2.0 0.5 (3.4) (10.8) 4.1 8.8 (0.3) 5.2 (8.4) 4.2 Gain on Bargain Purchase, Net of Expenses — - — - — - — (303.0) 15.9 -Realized Gain on Repurchase of Debentures — - — - — - (4.4) — - -Fair Value of Warrants Issued — - — - — - — - - -Aquiline Termination Fee — - — - — - — - — - Operating Income / (Loss) $82.4 $(165.4) $156.4 $173.0 $129.8 $(136.4) $176.9 $145.6 $110.4 $100.4 2008 2007 2006 ($ in milions) Q4 Q3 Q2 Q1 Q4 Q3 Q2 Q1 Q4 Q3 GAAP Net Income / (Loss) $37.0 $(126.3) $75.9 $66.5 $139.0 $136.5 $70.8 $56.7 $69.1 $69.7 Net Realized Gains / (Losses) on Investments (6.8) 13.7 2.4 (7.7) (0.8) (1.0) 0.2 (0.0) 0.2 0.2 Net Unrealized Gains / (Losses) on Investments 7.1 14.6 43.0 15.0 (9.2) (7.7) 6.2 (1.6) 0.0 0.0 Foreign Exchange (Gain) / Loss 13.6 44.9 (0.9) (8.2) 2.5 (5.8) (2.0) (1.4) (1.1) (0.4) Gain on Bargain Purchase, Net of Expenses — - — - — - 0.0 — - -Realized Gain on Repurchase of Debentures - - (8.8) — - 0.0 — - — -Fair Value of Warrants Issued — - — - — 2.9 — - — -Aquiline Termination Fee - — - — - 3.0 — - — - Operating Income / (Loss) $50.9 $(53.1) $111.7 $65.5 $131.5 $127.9 $75.2 $53.7 $68.2 $69.5 Source: Validus quarterly investor financial supplements |
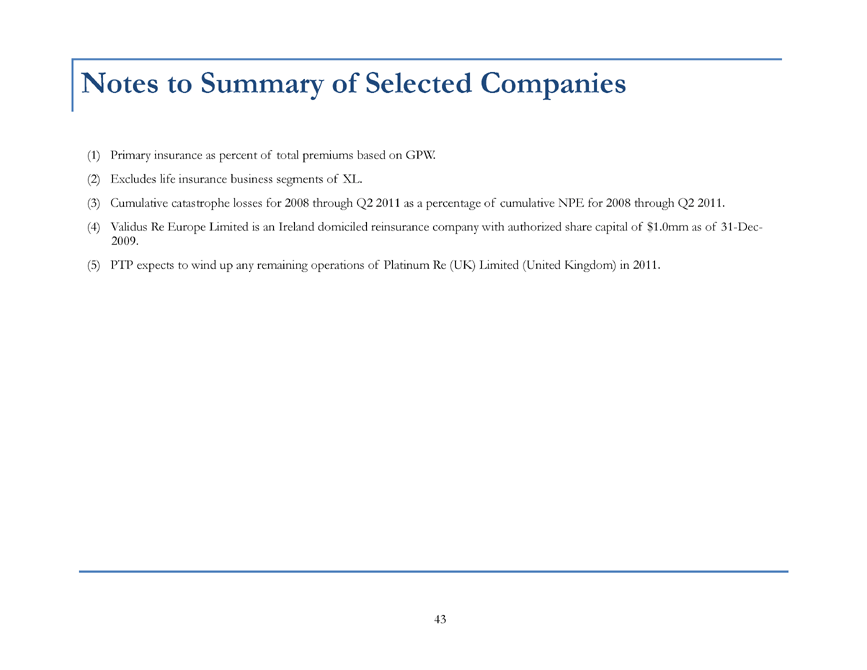
| Appendix pp B: Other Materials Notes to Summary of Selected Companies (1) Primary insurance as percent of total premiums based on GPW. (2) Excludes life insurance business segments of XL. (3) Cumulative catastrophe losses for 2008 through Q2 2011 as a percentage of cumulative NPE for 2008 through Q2 2011. (4) Validus Re Europe Limited is an Ireland domiciled reinsurance company with authorized share capital of $1.0mm as of 31-Dec-2009. (5) PTP expects to wind up any remaining operations of Platinum Re (UK) Limited (United Kingdom) in 2011. |
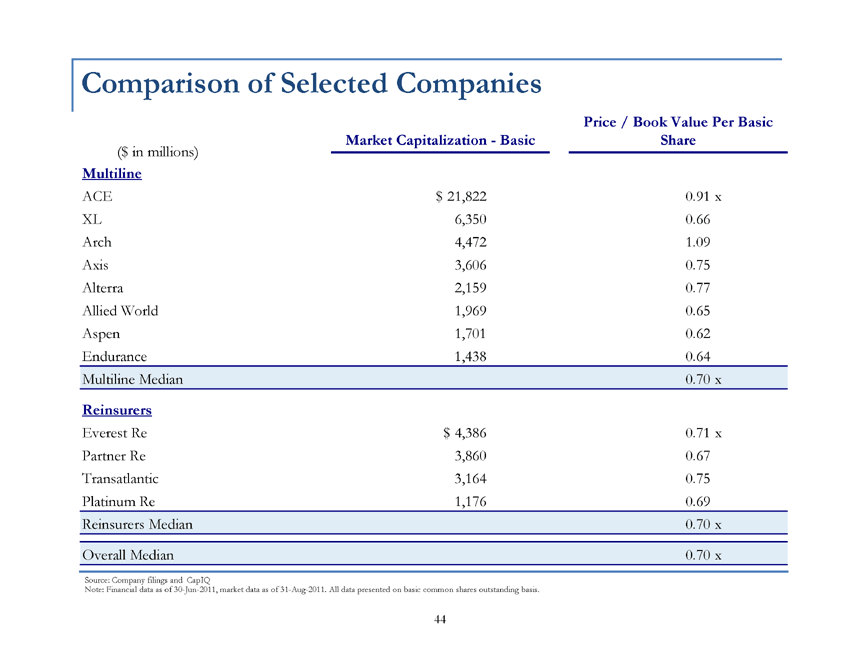
| Comparison of Selected Companies Price / Book Value Per Basic Market Capitalization — Basic Share ($ in millions) Multiline ACE $21,822 0.91 x XL 6,350 0.66 Arch 4,472 1.09 Axis 3,606 0.75 Alterra 2,159 0.77 Allied World 1,969 0.65 Aspen 1,701 0.62 Endurance 1,438 0.64 Multiline Median 0.70 x Reinsurers Everest Re $4,386 0.71 x Partner Re 3,860 0.67 Transatlantic 3,164 0.75 Platinum Re 1,176 0.69 Reinsurers Median 0.70 x Overall Median 0.70 x Source: Company filings and CapIQ Note: Financial data as of 30-Jun-2011, market data as of 31-Aug-2011. All data presented on basic common shares outstanding basis. |
