Attached files
| file | filename |
|---|---|
| 8-K - FORM 8-K - ALTERRA CAPITAL HOLDINGS Ltd | d8k.htm |
| EX-10.1 - SEPARATION AGREEMENT - ALTERRA CAPITAL HOLDINGS Ltd | dex101.htm |
 Investor Presentation
Quarter Ended June 30, 2011
Exhibit 99.1 |
 2
This presentation may include forward-looking statements that reflect
Alterra’s current views with respect to future events and
financial
performance.
Statements
that
include
the
words
“expect,”
“intend,”
“plan,”
“believe,”
“project,”
“anticipate,”
“will,”
“may”
and similar statements of a future or forward-looking nature identify
forward-looking statements. All forward- looking statements address
matters that involve risks and uncertainties. Accordingly, there are important factors that
could cause actual results to differ materially from those indicated in such
statements and you should not place undue reliance on any such statements.
These factors include, but are not limited to, the following: (1) the
adequacy of loss and benefit reserves and the need to adjust such reserves
as claims develop over time; (2) the failure of any of the loss limitation methods employed; (3) the
effect of cyclical trends, including with respect to demand and pricing in the
insurance and reinsurance markets; (4) changes in general economic
conditions, including changes in capital and credit markets; (5) any lowering or loss of
financial ratings; (6) the occurrence of natural or man-made catastrophic
events with a frequency or severity exceeding expectations; (7) actions by
competitors, including consolidation; (8) the effects of emerging claims and coverage issues;
(9) the loss of business provided to Alterra by its major brokers; (10) the effect
on Alterra’s investment portfolio of changing financial market
conditions, including inflation, interest rates, liquidity and other factors; (11) tax and regulatory
changes and conditions; (12) retention of key personnel; and (13) the integration
of new business ventures Alterra may enter into; and (14) management’s
response to any of the aforementioned factors. The foregoing review of
important factors should not be construed as exhaustive and should be read in conjunction with
the other cautionary statements that are included herein and elsewhere, including
the Risk Factors included in Alterra’s most recent reports on Form
10-K and Form 10-Q and other documents on file with the Securities and Exchange
Commission. Any forward-looking statements made in this presentation are
qualified by these cautionary statements, and there can be no assurance that
the actual results or developments anticipated by Alterra will be realized or, even if
substantially realized, that they will have the expected consequences to, or
effects on, Alterra or its business or operations. Alterra undertakes no
obligation to update publicly or revise any forward-looking statement, whether as a
result of new information, future developments or otherwise.
Cautionary Note Regarding Forward-Looking Statements
|
 3
Alterra’s Franchise is Well Positioned For Success
Global underwriter of specialty insurance and reinsurance
Multiple
operating
platforms
-
Bermuda, Ireland, United
States, Lloyd's, Latin America
Strong franchise positions across multiple specialty
classes of business
Opportunistic and disciplined underwriting strategy
Strong culture of risk management
Analytical and quantitative underwriting orientation
5 year average combined ratio (including cats) of 87.7%
Liquid balance sheet with conservative reserving track record
Shareholders’
equity ~ $2.8 billion at 6/30/11
Low operating and financial leverage
Proven track record of active capital management
H1 repurchases of $142.2 million
Returned $559 million or ~18% of pro forma 12/31/09
shareholders'
equity
(1)
in 2010 through dividends and
share repurchases
Raised quarterly dividend by 17% in August 2011 to $0.14
per share
Rated
“A”
(Excellent)
by
AM
Best
(2)
____________________
(1)
Shareholders' equity of Max Capital and Harbor Point on a combined pro forma
basis. (2)
AM Best ratings reflect the agency’s opinion of our financial strength, operating
performance and ability to meet our obligations. The ratings are not evaluations
directed toward the protection of investors in securities of Alterra.
H1 2011 GPW |
 4
2010
2011
2010
2011
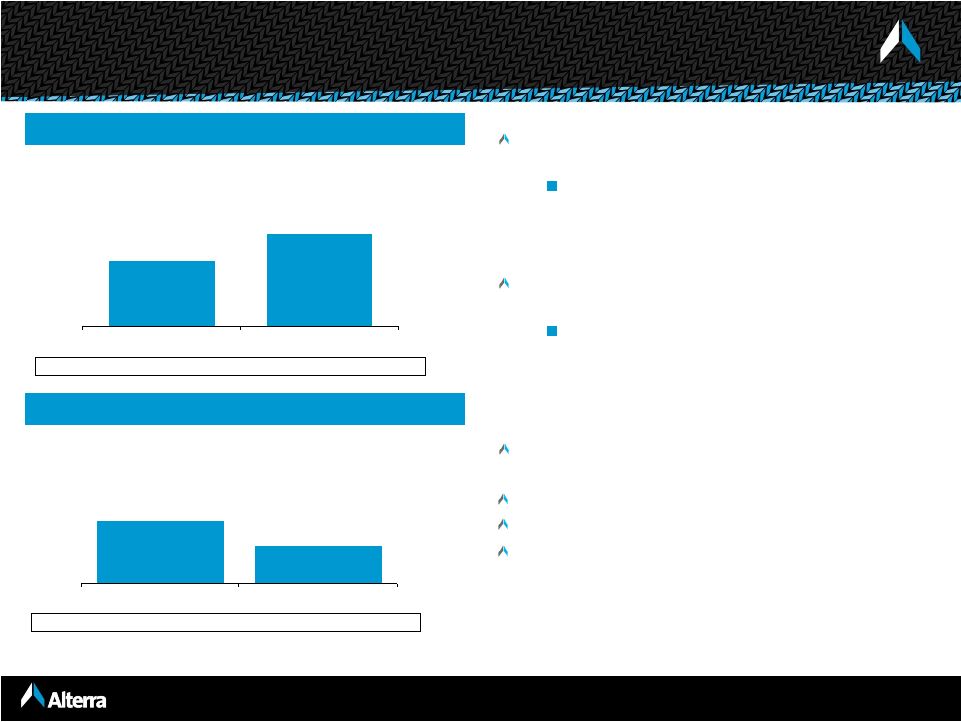
Second Quarter 2011 Results
Second quarter 2011 net operating diluted
EPS of $0.37 per share
Decrease from 2010 due to high
catastrophe losses and increased
outstanding shares from Harbor Point
merger
P&C gross premiums written grew 41.4% to
$563.0 million (18.3% on a pro forma basis)
Driven by the inclusion of Harbor Point,
new reinsurance business
opportunities, new business in Latin
America, and expansion of business at
Lloyd’s and U.S. Specialty
Net investment income up 12.0% to $59.7
million
Combined ratio of 93.7%
Catastrophe losses of $49.6 million
Diluted book value per share of $25.98 at
6/30/11
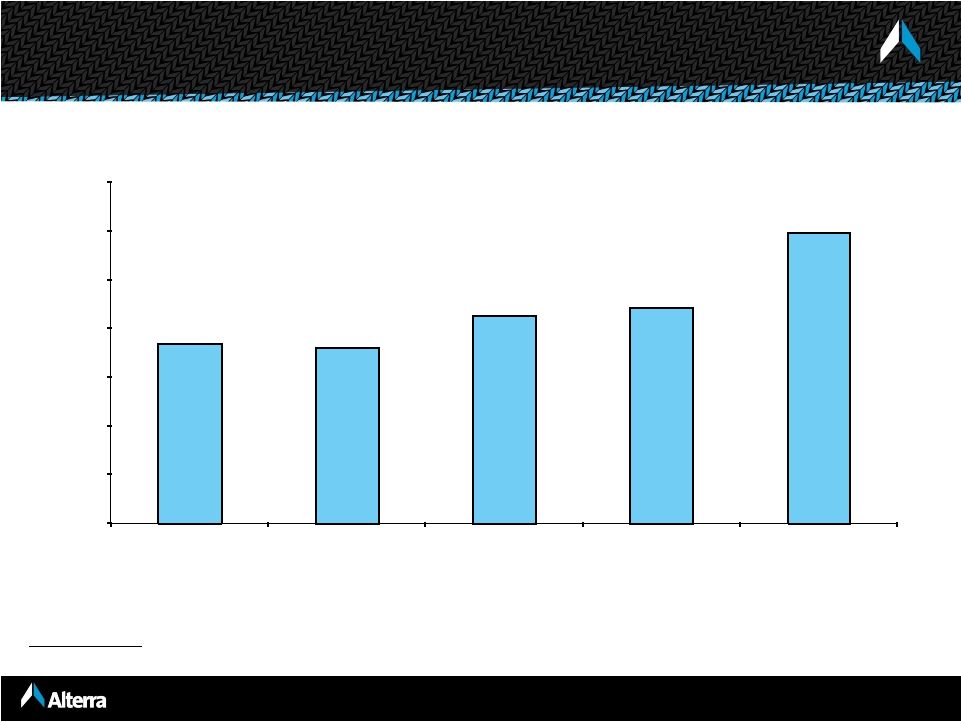
P&C GPW
(41.4% increase)
Operating
Diluted EPS
Strong Growth in Gross Premiums Written…
…Operating EPS Impacted By Catastrophe Losses
Operating ROE
10.1%
5.7%
Combined ratio
83.3%
93.7%
$0.64
2010
2011
$0.37 |
 5
Market on the Cusp of Change . . .
First half global industry cat losses estimated ~ $70 billion
Market is stressed by historic low returns on invested assets
Cash flow levels are deteriorating
Industry reserve redundancies are diminishing
Share repurchase activity slowed due to high cat losses
Property cat underwriting markets improving
Casualty lines showing flat to modest improvement
Pricing poised to further positively move with the next catalyst
Alterra is positioned to be a beneficiary of improving market conditions globally
__________________
As of June 30, 2011 |
 6
Pricing Mixed But Gradually Improving Globally
__________________
As of June 30, 2011
Results on Alterra’s renewal book
•
Excess liability rates up 1-3%
•
Professional lines D&O down near 20%, E&O up 8-10%. EPL down
6-8% •
Property rates are flat to up 10% in the US and flat to up 15% on International
business •
Aviation rate declines range from 5-10% with aerospace on the high end
•
Auto rates are up 3-5%
•
General
casualty
rates
are
flat
to
down
5%
but
showing
signs
of
hardening
•
Professional liability rates are down 5-10%
•
Medical malpractice declines are 4-6%
•
US property rate increases of 11-13%
•
International rates up 50% for Japan Earthquake, 45% in Australia, and over 200%
in New Zealand •
Property treaty rates up 4-6%
•
Casualty treaty rates up 3-5%
•
Financial institution rates are down 3-5%
•
A&H rates are down 1-2%
•
Latin America remains competitive with rates flat
•
Brokerage property and casualty rates are flat
•
Professional liability rates are up 3-5%
•
Marine rates are up 2-4% on average and 5-10% on accounts with cat
exposure Insurance
Reinsurance
US Specialty
Lloyd’s |
 7
2004
Insurance
Property
2003
Insurance
Excess Liability
Professional Liability
2005
Reinsurance
Property / Property Cat
Harbor Point formed
2006
Insurance
Aviation
2008
Lloyd's Insurance
Financial Institutions
Prof. Indemnity
Lloyd's Reinsurance
Accident / Health
Property
2007
U.S. E&S Insurance
Property
Inland Marine
U.S. Casualty
Reinsurance
Multi Peril Crop
Experienced &
highly quantitative
underwriting teams
Lead underwriters average over 20 years in the
business
High percentage of employees hold
professional designations
2009
Lloyd's
Casualty (non U.S.)
A&H Insurance
U.S. Specialty
Professional Liability
Latin America Reinsurance
2002
Traditional Re
Workers' Comp
Medical Malpractice
GL / PL
Aviation
Identifying & Recruiting "Franchise Players" Has Been
Instrumental In Our Success
2010
Alterra formed
by the merger of Max
Capital and Harbor Point
2011
Lloyd’s
Property Direct &
Facultative
U.S. Specialty
Excess Casualty |
 8
Reinsurance
Insurance
Lloyd’s
U.S. Specialty Insurance
Major Classes
–
Agriculture
–
Auto
–
Aviation
–
Credit, surety and political risk
–
General casualty
–
Life and annuity
–
Marine and energy
–
Medical malpractice
–
Professional liability
–
Property
–
Whole account
–
Workers’ comp
–
Aviation
–
Excess liability
–
Professional liability
–
Property
–
Accident & health Insurance
–
Aviation
–
Financial institutions
–
International casualty treaty
–
Marine and cargo
–
Personal accident treaty
–
Professional liability
–
Property treaty
–
Property direct and facultative
–
Surety
–
Excess liability
–
General liability
–
Marine
–
Professional liability
–
Property
Operating
Regions
–
Australia
–
Canada
–
European Union
–
Japan
–
Latin America
–
New Zealand
–
United States
–
European Union
–
United States
–
Denmark
–
Japan
–
Latin America
–
United Kingdom
–
United States
Offices
–
Bermuda
–
Bogotá
–
Buenos Aires
–
Dublin
–
London
–
New Jersey
–
Bermuda
–
Dublin
–
Hamburg
–
New York
–
Sebastopol, CA
–
Zurich
–
Copenhagen
–
Leeds
–
London
–
Rio de Janeiro
–
Tokyo
–
Atlanta
–
Chicago
–
Dallas
–
New York
–
Philadelphia
–
Richmond
–
San Francisco
Local Knowledge —
Global Reach |
 9
____________________
Note:
Pro forma gross premium written (“GPW”) represents the combined GPW of Max Capital
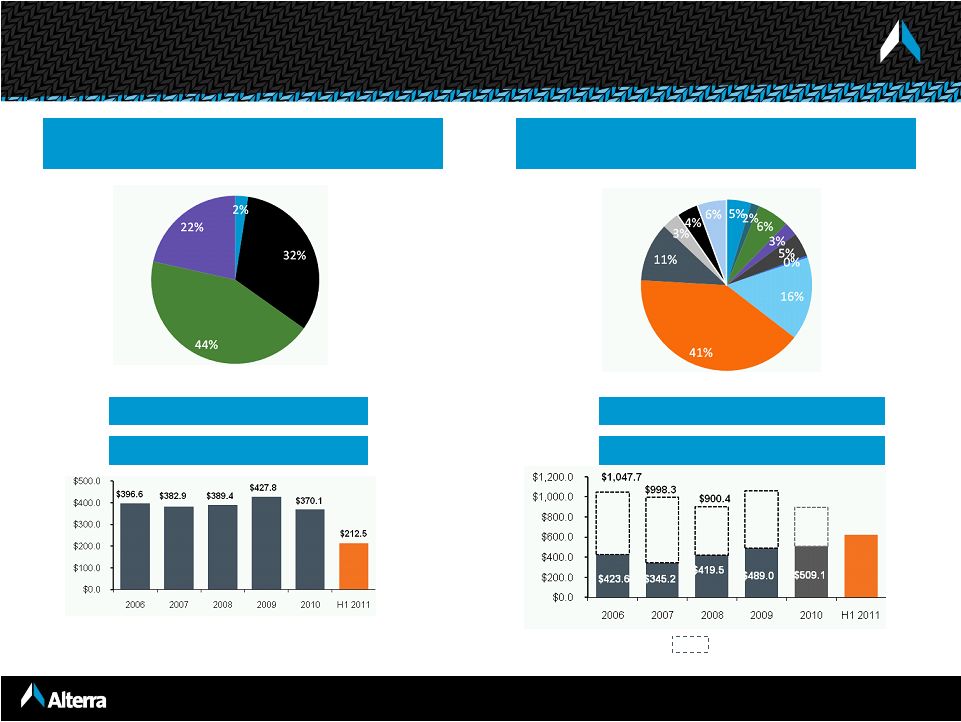
and Harbor Point net of intercompany eliminations of GPW. Insurance
(17.9% of H1 2011 P&C GPW)
Reinsurance
(52.4% of H1 2011 P&C GPW)
Professional
Liability
Property
Excess
Liability
Aviation
General Casualty
Property
Aviation
Workers Comp.
Professional Liability
Other
Med. Mal.
Marine & Energy
Agriculture
H1 2011 GPW: $212.5 million
= pro forma
Auto
$1,060.4
$623.8
Alterra Has a Strong Market Position in Specialty Classes …
Credit/ Surety
Whole Account
H1 2011 GPW: $623.8 million
2010 GPW: $370.1 million
2010 Pro forma GPW: $892.4 million
$892.4 |
 10
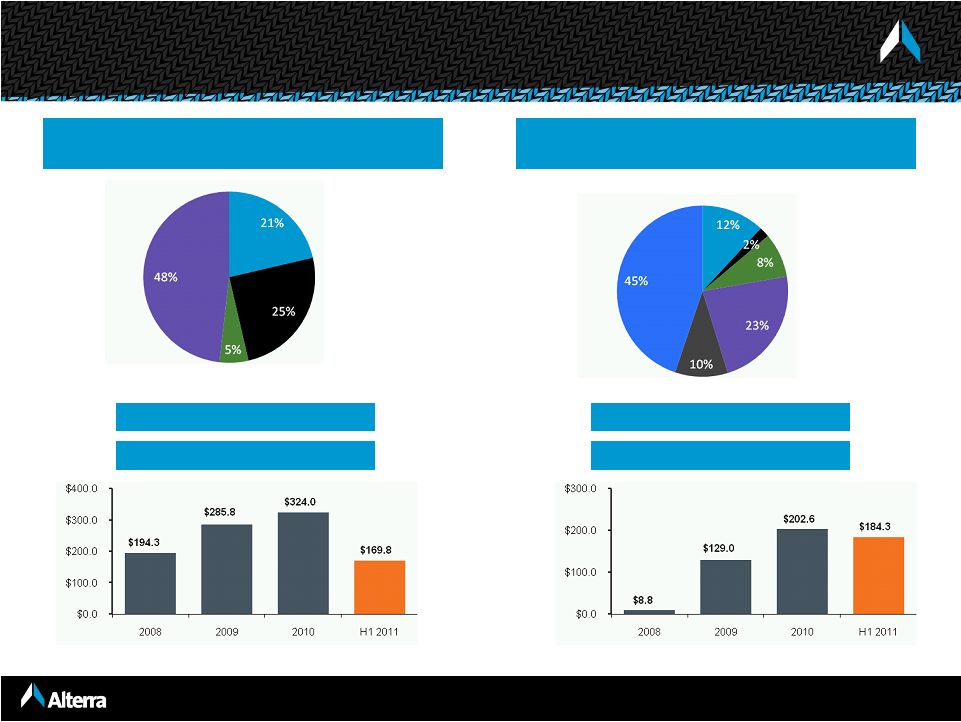
U.S. Specialty
(14.3% of H1 2011 P&C GPW)
Alterra at Lloyd’s
(15.5% of H1 2011 P&C GPW)
…With an Attractive Position in the U.S. Market and Lloyd’s
Professional
Liability
Property
Marine
General
Liability
Property
Aviation
Fin. Institutions
Prof. Liability
Accident & Health
2010 GPW: $324.0 million
2010 GPW: $202.6 million
H1 2011 GPW: $169.8 million
H1 2011 GPW: $184.3 million
Int’l Casualty |
 11
Long-Tail
Short-Tail
North America
Europe
Other
Credit/ Surety and
Other Short-Tail
Agriculture
Marine & Energy
Property
Aviation
Auto
Professional
Liability
Medical Malpractice
General Casualty
Workers’
Comp
Whole Account
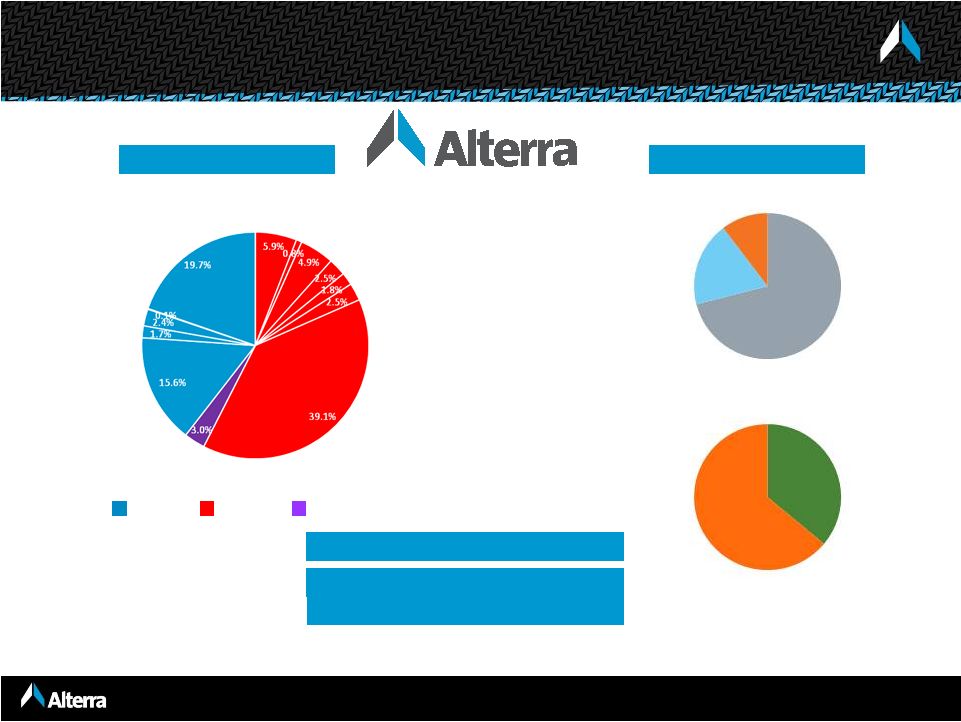
Reinsurance
(2)
Insurance
Mixed
2010 GPW = $1,410.7 million
____________________
(1) Pro forma as if Harbor Point merger occurred on January 1, 2010.
(2) Includes Reinsurance segment, Life & Annuity reinsurance and
reinsurance written through Lloyd’s platform .
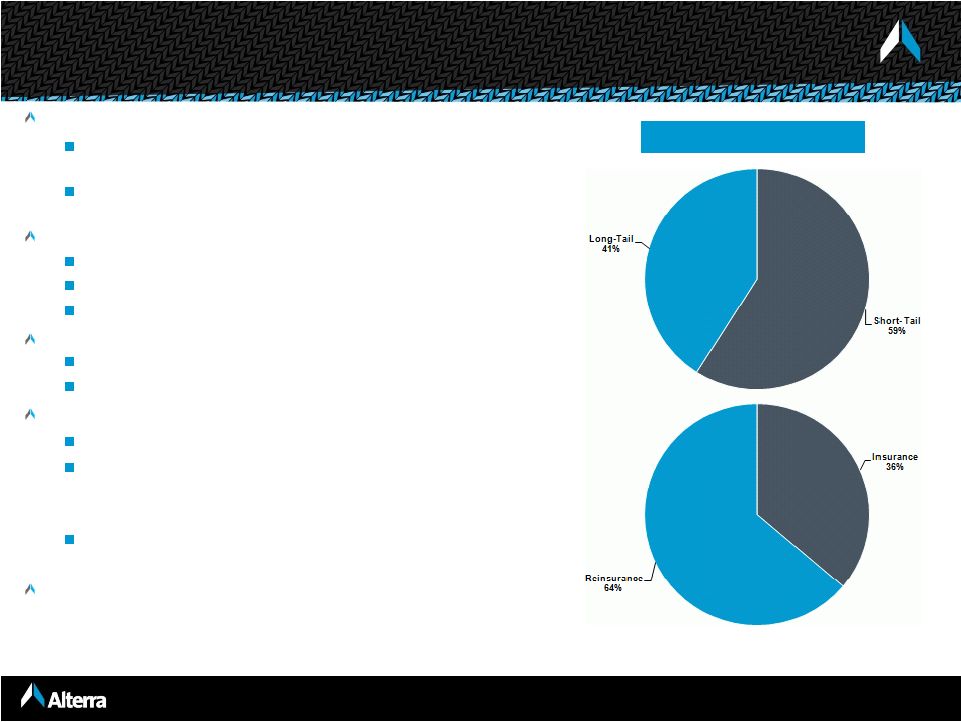
Diversified and Balanced Business Mix
Global Platform
Line of Business
2010
pro
forma
GPW
=
$1,794.1
million
(1)
Accident & Health
Life & Annuity
H1 2011 GPW = $1,190.4 million
10%
19%
71%
36%
64% |
 12
85%
104%
85%
76%
84%
75%
77%
96%
109%
161%
103%
94%
101%
96%
96%
124%
0%
25%
50%
75%
100%
125%
150%
2005
2006
2007
2008
2009
2010
H1'11
Average
Source: Company filings.
Diversified reinsurers include RE, AXS, ACGL, TRH, PRE, AWH, ENH, AHL, PTP, AGII, ALTE and ORH
for historical years . Property focused reinsurers include RNR, VR, MRH, FSR and IPCR for historical years.
Diversified Reinsurers
Property Focused Reinsurers
Median
116%
84%
82%
95%
84%
91%
124%
96%
Alterra
106%
86%
88%
92%
88%
86%
104%
93%
Diversified Platforms Generate More Consistent Margins
Alterra has performed well within its diversified peer group with less volatility
than property focused reinsurers Median
201%
55%
61%
89%
66%
84%
143%
100%
Alterra has had one of
the lowest combined
ratios of its peer group
300%
69%
113%
45%
45%
56%
50%
33%
140%
0%
25%
50%
75%
100%
125%
150%
252%
60%
73%
92%
75%
118%
174%
102%
2005
2006
2007
2008
2009
2010
H1'11
Average
300% |
 13
Our strategy is to diversify our book of business so that property cat
is one of many parts of our business
Results demonstrate that we adequately manage our risk exposure
Our reserving process has been tested by large, recent loss events
including:
2011 Australian floods, New Zealand earthquake, Japanese
earthquake and tsunami, US spring storms
2010 Chilean earthquake, New Zealand earthquake
2008 Hurricanes Ike/Gustav
Superior Risk Management Skills
Alterra’s
losses
as
a
%
of
equity
are
consistently
below
our
peer
group
average
and
there
have
not
been
meaningful
adjustments
to
loss
estimates |
 14
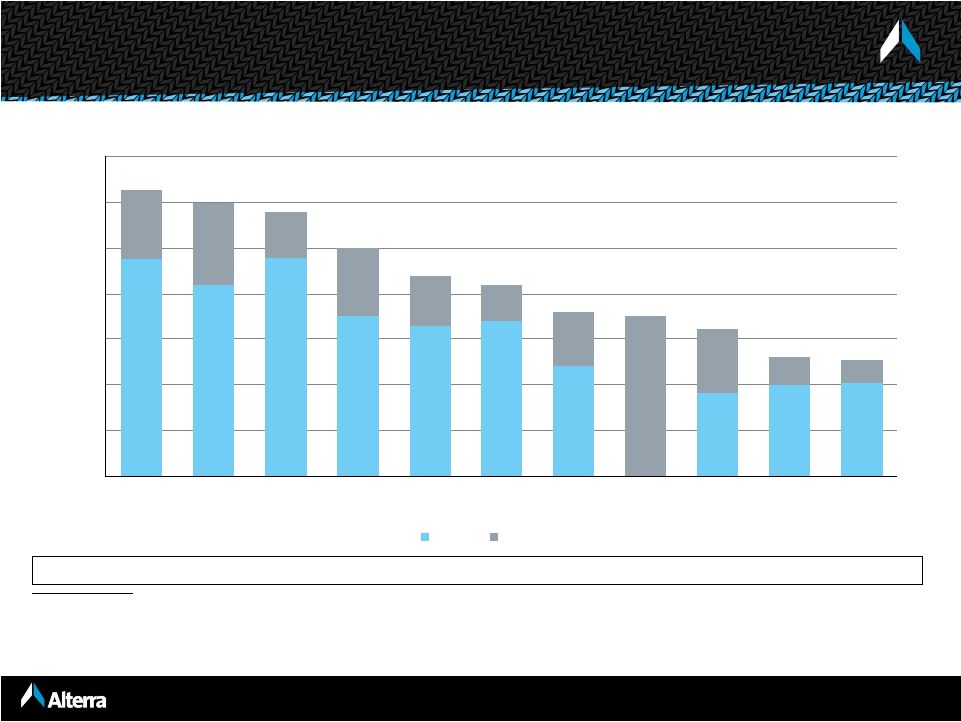
Peer PML’s as a Percent of Common Equity
Note: RNR, MRH and PRE do not disclose their PMLs for either 1-in-100 year events or
1-in-250 year events. (1)
1-in-100 PML and 1-in-250 for U.S. hurricane is $835 mm and $1,103 mm,
respectively. Maximum zonal aggregate is $1.9 billion for U.S. hurricane and California earthquake.
(2)
Self-imposed limit of 25% of total capital.
(3)
1-in-100 PML for U.S. hurricane is $1,085 mm based on an industry loss modeled at $121
billion. 1-in-250 for U.S. hurricane is $1,459 mm based on an industry loss modeled at $195 billion.
(4)
Tri-county Florida is the largest zonal exposure. Northeast wind was $733 mm.
Self-imposed limit of 25% of common equity. (5)
1-in-100 PML for U.S. wind is $309 mm. 1-in-250 for U.S. quake is $287
mm, and 1-in-250 for U.S. wind of $390 mm. Historically, 1-in-100 was approximately 12% of total capital.
C&S ($B): $3.5
$2.7
1.1
$3.1
$5.1
$1.9
$2.9
$4.2
$4.3
$3.1
$6.3
0%
5%
10%
15%
20%
25%
30%
35%
VR (1)
ENH (2)
FSR
AHL
AXS (3)
PTP
ALTE
ACGL (4)
TRH
AWH (5)
RE
PML’s as a Percentage of December 31, 2010 Capital and Surplus
1 in 100
1 in 250 |
 15
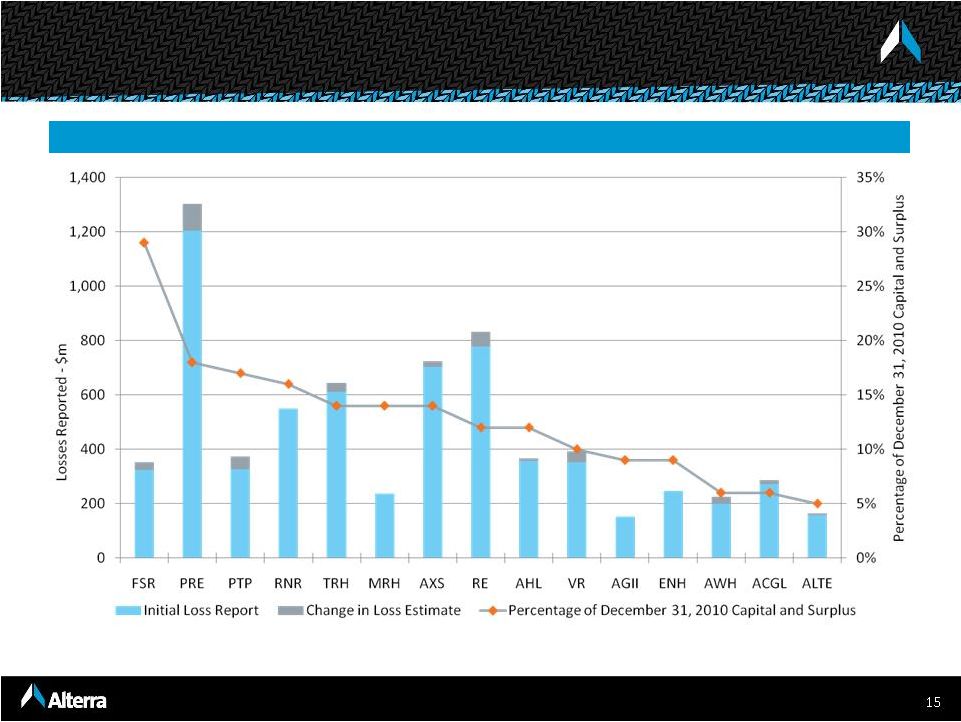
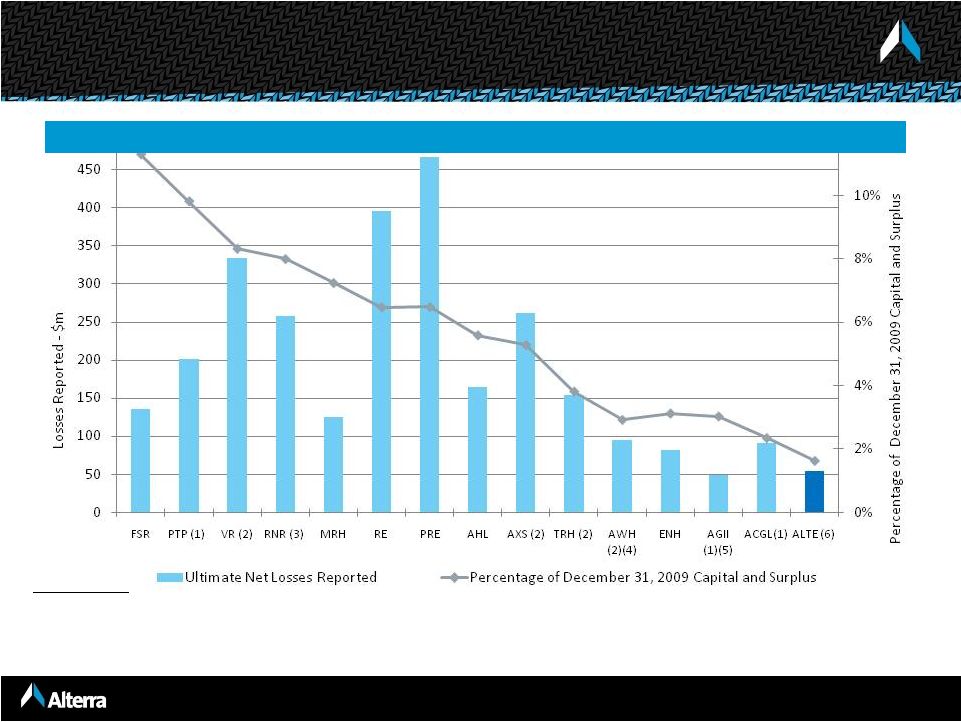
2011 –
First Half Catastrophe Losses
Alterra’s H1 Losses are Below the Peer Group Averages
__________________
Source: Company reports and SNL Financial as reported to June 30, 2011
|
 16
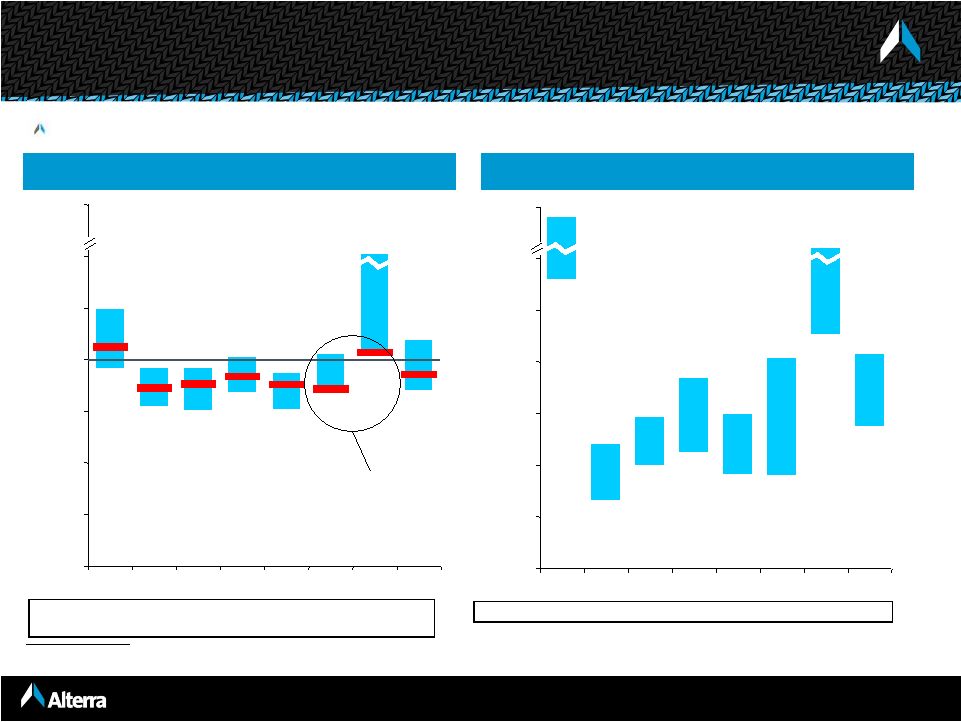
2010 –
Chilean Earthquake / Windstorm Xynthia/
September New Zealand Earthquake
Alterra’s
2010 Losses Are Below Peer Group Averages
Source: Company filings and press releases; losses are generally disclosed net of tax
and net of reinstatement premiums.
(1)
Q2 net losses reflect Q1 estimates plus reported development, if any. (2)
Q2 net losses reflect only losses from the Chilean earthquake. Initial losses
include the Chilean earthquake and Windstorm Xynthia.
(3)
Initial loss estimate reflects 50% to 90% of Reuters consensus net operating earnings
prior to the earthquake, based on disclosure that net income would remain positive for the quarter.
(4)
Initial estimates based on Chile and Xynthia, ultimate losses include the Chilean,
Haitian, and Baja earthquakes, Xynthia and the Australian hailstorms. Based on international catastrophe losses being two-thirds of total catastrophe losses as
disclosed in the earnings conference call.
(5)
Initial estimate is as of the first quarter conference call. Both initial and
revised estimates reflect only the Chilean earthquake.
(6)
Pro forma; includes losses from Harbor Point and Max Capital prior to the merger.
Expressed as a percentage of combined 12/31/09 equity prior to the special dividend. |
 17
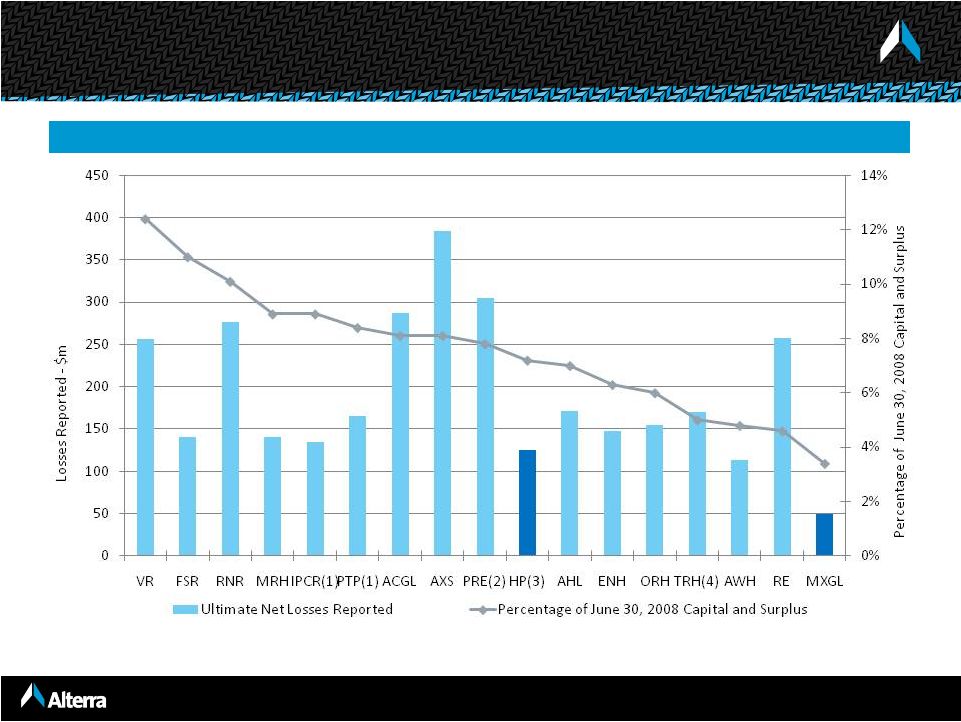
2008 –
Hurricanes Ike / Gustav
On a Pro-forma Basis Alterra’s 2008 Losses Are Below Peer Group
Averages ____________________
Source: Company filings, as of 12/31/08. Losses are generally disclosed net of reinstatement
premiums. (1)
Equity includes preferred, which subsequently converted to common.
(2)
Results reflect Ike only.
(3)
Equity includes preferred, which subsequently converted to common.
(4)
TRH does not disclose specific losses but did lose "$169.7 million principally relating to
Hurricane Ike." |
 18
Florida wind
1 in 100 year event -
$289 million net loss
California earthquake
1 in 250 year event -
$440 million net loss
Europe wind
1 in 100 year event -
$153 million net loss
PML’s In-force as of July 1, 2011
____________________
Note: Based on RMS 10.0 |
 19
June
30,
2011
PML
target
of
20%
of
beginning
shareholders’
equity
for
a
1:250
year event
Absorbed RMS 11.0 within our basic target
Lower end of stated ranges versus our peer group
Track
record
of
opportunistically
expanding
at
inflection
points
in
the
cycle
Flexibility to adjust cat aggregates as pricing improves
Increasing
our
risk
appetite
by
5%
would
equate
to
approximately
$150 million of
PML
The 20% PML target is an internal target that can be adjusted based on market
opportunity
Multiple tools to optimize performance in a harder market include:
Ability to expand underwriting capacity through New Point IV
Retain more and cede less business to reinsurers
Low financial and operating leverage provides flexibility
Positioned To Capitalize on Higher Reinsurance Rates
Alterra Expects To Benefit As Harder Market Conditions Emerge
|
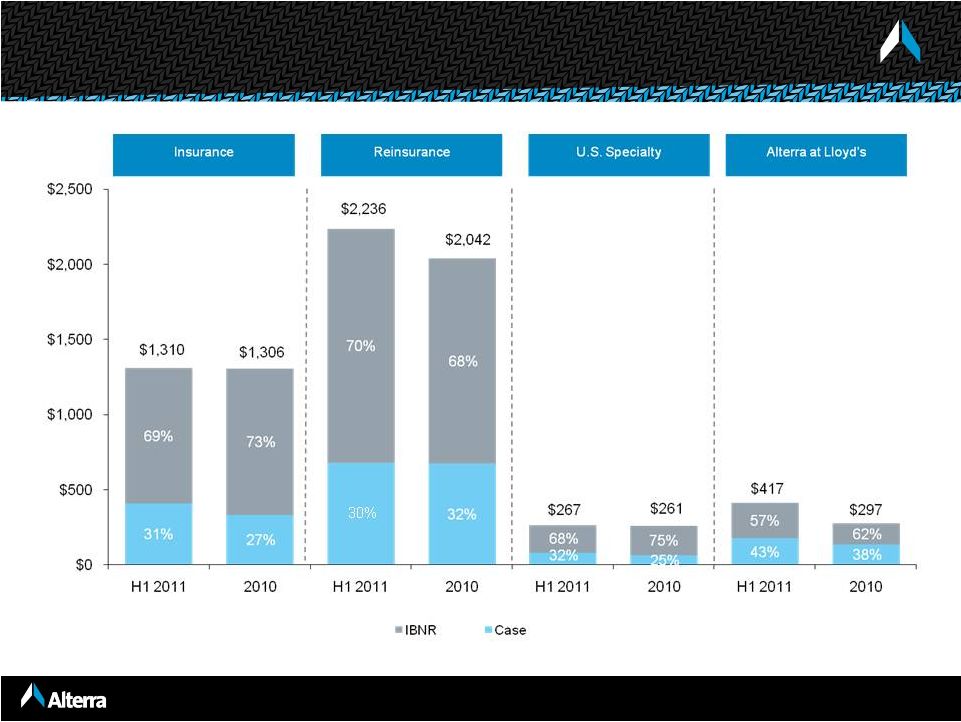 20
Reserves for Loss and Loss Expenses
____________________
Note: As of 6/30/2011 and 12/31/2010; includes the results of Harbor Point from
May 12, 2010, the closing date of the merger. ($ in millions)
30% |
 21
Favorable Reserve
Development
$5.9
$45.1
$90.8
$77.2
$105.5
Development as a
% of Net Reserves
0.3%
2.5%
4.1%
3.4%
3.4%
Reserve Development
Net Loss Reserves
($ in millions)
$1,840
$1,796
$2,128
$2,213
$2,985
0
500
1,000
1,500
2,000
2,500
3,000
3,500
2006
2007
2008
2009
2010
Note: As of year-end 2010; reserve development and net reserves prior to May 12,
2010 are for Max Capital only. Reserve development excludes changes in reserves resulting
from changes in premium estimates on prior years’ contracts. |
 22
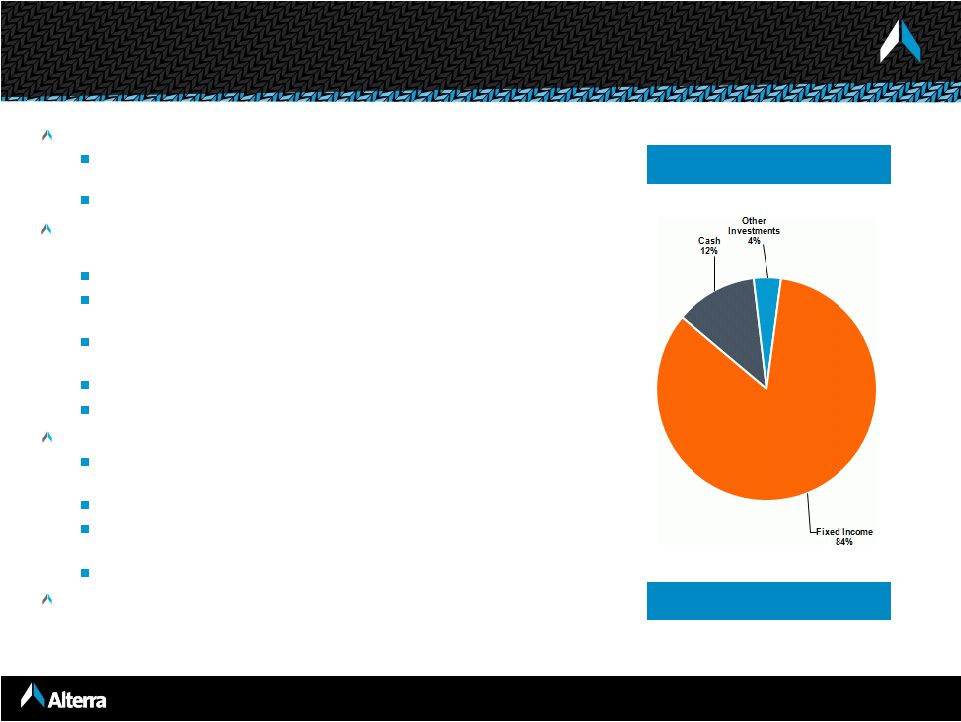
High Quality, Liquid Investment Portfolio
As of June 30, 2011
Alterra maintains a high quality, liquid portfolio
95.6% of portfolio in fixed income/cash, which consists of highly
rated securities
Assets are generally matched to liabilities
Cycle
management
extends
to
investments
–
H1 posture was
defensive
Cash balance $987.1 million or 12.4% of portfolio
Average fixed income duration of approximately 4.1 years, including
cash
62.9% of the cash and fixed maturities portfolio is held in cash,
government
/
agency-backed
securities
and
“AAA”
securities
69.0%
of
fixed
income
portfolio
rated
“AA”
or
better
Hedge fund investments are marked-to-market
Minimal exposure to selected asset classes
CMBS
of
$383.9
million
(4.8%
of
portfolio)
–
average
rating
of
AA+/Aa1
ABS of $204.6 million (2.6% of portfolio)
RMBS
of
$1,159.9
million
(14.6%
of
portfolio)
–
96.7%
agency-
backed
No CDO’s, CLO’s, SIV’s or other highly structured securities
Less than $7.5 million of OTTI losses over the last ten
quarters
Carrying Value $8.0 billion
June 30, 2011 |
 23
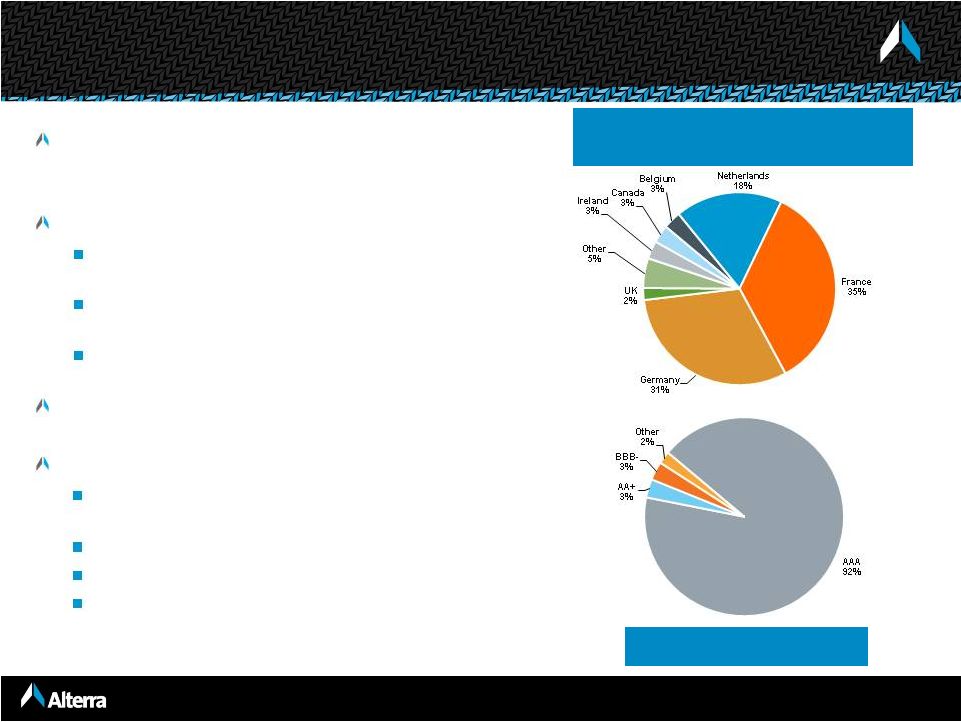
Foreign Sovereign Exposure
As of June 30, 2011
Foreign sovereign debt represents $784.7
million or 9.8% of the $8.0 billion investment
portfolio
By country:
$277.5 million, or 3.5% of total portfolio in
France
$243.1 million, or 3.0% of total portfolio in
Germany
$140.8 million, or 1.8% of total portfolio in the
Netherlands
$616.4 million or 78.6% of foreign sovereigns
are in our held to maturity portfolio
Highly rated portfolio
91.5% of foreign sovereign securities are rated
AAA
3.1% are rated AA+
0.5% are rated AA
3.1% are rated BBB-
Fair Value $784.7 million
Geographic and Ratings Split of Foreign
Sovereign Debt |
 24
____________________
Note:
Primary price / diluted book value multiple as of 8/29/11.
Well Positioned to Build Shareholder Value
Franchise positions in attractive specialty markets
Established operating platforms provide global access to business
Diversified business portfolio across casualty and property lines
Opportunistic
approach
–
nimble
and responsive to market trends
High-quality, liquid investment portfolio
Invested asset leverage intended to drive more consistent returns
Balance sheet strength with low leverage / financial flexibility
Attractive
entry
point
–
price / diluted book value of 0.78x |
 25
Appendices |
 26
June 30,
December 31,
2011
2010
Cash & Fixed Maturities
7,603
$
7,483
$
Other Investments
350
378
Premium Receivables
870
589
Losses Recoverable
1,059
956
Other Assets
615
511
Total Assets
10,497
$
9,917
$
Property & Casualty Losses
4,230
$
3,906
$
Life & Annuity Benefits
1,318
1,276
Deposit
Liabilities 147
148
Funds Withheld
123
121
Unearned Premium
1,203
905
Senior Notes
440
440
Other Liabilities
243
203
Total Liabilites
7,704
$
6,999
$
Shareholders' Equity
2,793
2,918
10,497
$
9,917
$
Strong Balance Sheet
($ in millions)
(1)
Results for the year ended December 31, 2010 include results from Harbor Point
following the close of the merger on May 12, 2010. |
 27
YTD Results Comparison
($ in millions)
Six months ended
(1)
Pro forma six months ended
(2)
June 30,
June 30,
June 30,
2011
2010
2010
Gross Premiums Written
1,192
$
770
$
1,153
$
Net Premiums Earned
729
488
706
Net Investment Income
117
102
126
Net Realized and Unrealized (Losses) Gains on Investments
(25)
(8)
-
Other Than Temporary Impairment Charges
(1)
(1)
(1)
Other Income
2
-
1
Total Revenues
822
581
832
Total Losses, Expenses & Taxes
836
441
702
Net (Loss) Income
(14)
$
140
$
130
$
Net Operating Income
15
$
99
$
Property & Casualty Underwriting
Loss Ratio
70.9%
58.6%
Expense Ratio
32.6%
27.6%
Combined Ratio
103.5%
86.2%
(1)
Results for the six months ended June 30, 2010 do not include results from Harbor Point prior to the
merger on May 12, 2010.
(2)
Pro forma information is provided for informational purposes only to present a summary of the combined
results of operations assuming the merger with Harbor Point had occurred on January 1,
2010. The pro forma information assumes the elimination of intercompany transactions and the amortization of certain acquisition accounting fair value
adjustments. The pro forma information does not necessarily represent results that would have occurred
if the merger had taken place on January 1, 2010, nor is it necessarily indicative of the
future results.
|
 28
Six months ended June 30, 2011
($ in millions)
Differences in table due to rounding.
(1)
Property and Casualty only.
Diversified Operating Platform
Life &
Property & Casualty
Annuity
Corporate
Consolidated
Alterra at
Insurance
Reinsurance
U.S. Specialty
Lloyd's
Total
Reinsurance
Gross premiums written
$212.5
$623.8
$169.8
$184.3
$1,190.4
$1.4
-
$
$1,191.8
Reinsurance premiums ceded
(99.2)
(65.6)
(61.0)
(48.1)
(273.9)
(0.1)
-
(274.0)
Net premiums written
$113.3
$558.2
$108.9
$136.2
$916.5
$1.2
-
$
$917.8
Earned premiums
196.2
459.1
147.0
128.5
930.9
1.4
-
932.3
Earned premiums ceded
(89.1)
(32.5)
(46.6)
(35.1)
(203.3)
(0.1)
-
203.4
Net premiums earned
$107.2
$426.6
$100.4
$93.4
$727.6
$1.2
-
$
$728.8
Net losses and loss expenses
($63.7)
($312.5)
($64.1)
($75.3)
($515.5)
-
$
-
$
($515.5)
Claims and policy benefits
-
-
-
-
-
(30.3)
-
(30.3)
Acquisition costs
0.2
(93.5)
(17.7)
(24.0)
(135.0)
(0.3)
-
(135.3)
General and administrative expenses
(18.7)
(46.2)
(18.7)
(19.3)
(102.8)
(0.4)
-
(103.3)
Other income
1.0
0.5
-
0.4
1.9
-
-
1.9
Underwriting income (loss)
$26.0
($25.0)
($0.1)
($24.8)
($23.9)
n/a
$0.0
n/a
Net investment income
$24.9
$92.5
$117.4
Net realized and unrealized gains (losses) on investments
1.5
(26.1)
(24.6)
Net impairment losses recognized in earnings
(1.4)
(1.4)
Corporate other income
0.1
0.1
Interest expense
(19.1)
(19.1)
Net foreign exchange gains
(2.2)
(2.2)
Corporate general and administrative expenses
(37.6)
(37.6)
Income (loss) before taxes
($3.4)
$6.2
($21.1)
Loss ratio
59.4%
73.2%
63.8%
80.6%
70.9%
Acquisition cost ratio
-0.2%
21.9%
17.6%
25.7%
18.6%
General and administrative expense ratio
17.4%
10.8%
18.6%
20.6%
14.1%
Combined ratio
(1)
76.7%
106.0%
100.1%
126.9%
103.5% |