Attached files
| file | filename |
|---|---|
| 8-K - FORM 8-K - DUNKIN' BRANDS GROUP, INC. | d8k.htm |
 Dunkin’
Brands Group, Inc.
Brands Group, Inc.
August 2011
August 2011
Exhibit 99.1 |
 Confidential information: Copying, dissemination or distribution of this
information is strictly prohibited. Forward-looking statements
Certain
information
contained
in
this
presentation,
particularly
information
regarding
future
economic
performance, finances, and expectations and objectives of management constitutes
forward-looking statements. Forward-looking statements can be
identified by the fact that they do not relate strictly to historical
or
current
facts
and
are
generally
contain
words
such
as
“believes,”
“expects,”
“may,”
“will,”
“should,”
“seeks,”
“approximately,”
“intends,”
“plans,”
“estimates”
or “anticipates”
or similar expressions.
Our forward-looking statements are subject to risks and uncertainties such as
the ongoing level of profitability of our franchisees and licensees, prices
and availability of coffee and other raw materials, our substantial
indebtedness, changes in the quick service restaurant industry, ability or inability to meet our
growth projections as well as other risks described more fully in our filings with
the Securities and Exchange Commission. These risks and uncertainties
may cause actual results to differ materially from those projected or
implied by the forward-looking statement. Forward-looking statements
are based on current expectations and assumptions and currently available
data
and
are
neither
predictions
nor
guarantees
of
future
events
or
performance.
You
should
not
place
undue reliance on forward-looking statements, which speak only as of the date
hereof. We do not undertake to update or revise any
forward-looking statements after they are made, whether as a result of
new
information,
future
events,
or
otherwise,
except
as
required
by
applicable
law.
Regulation G
This presentation contains certain non-GAAP measures which are provided to
assist in an understanding of the Dunkin’
Brands Group, Inc. business and its performance.
These measures should always
be
considered in conjunction with the appropriate GAAP measure.
Reconciliations of non-GAAP amounts to
the relevant GAAP amount are provided as an attachment to these slides.
2 |
 Confidential information: Copying, dissemination or distribution of this
information is strictly prohibited. Strong platform for continued growth
Our key business strengths
Strong and established brands with leading market positions
Two strong and highly recognized global brands that generated LTM
franchisee-reported sales of $7.9 bn
(1)
Strong comp store sales trajectory
Significant opportunities to grow brands globally
Over 16,000 global locations with significant opportunity for domestic and
international growth Invested during downturn to position ourselves for
growth Franchised business model provides platform for growth
Nearly 100% franchised business model generates high margins with low capex
requirements, driving cash flow generation
Store-level
economics
generates
franchisee
demand
for
additional
restaurants
3
1. Last twelve months (“LTM”) ending June 25, 2011
Highly experienced, aligned and motivated management team with franchise “operating”
philosophy |
 Confidential information: Copying, dissemination or distribution of this
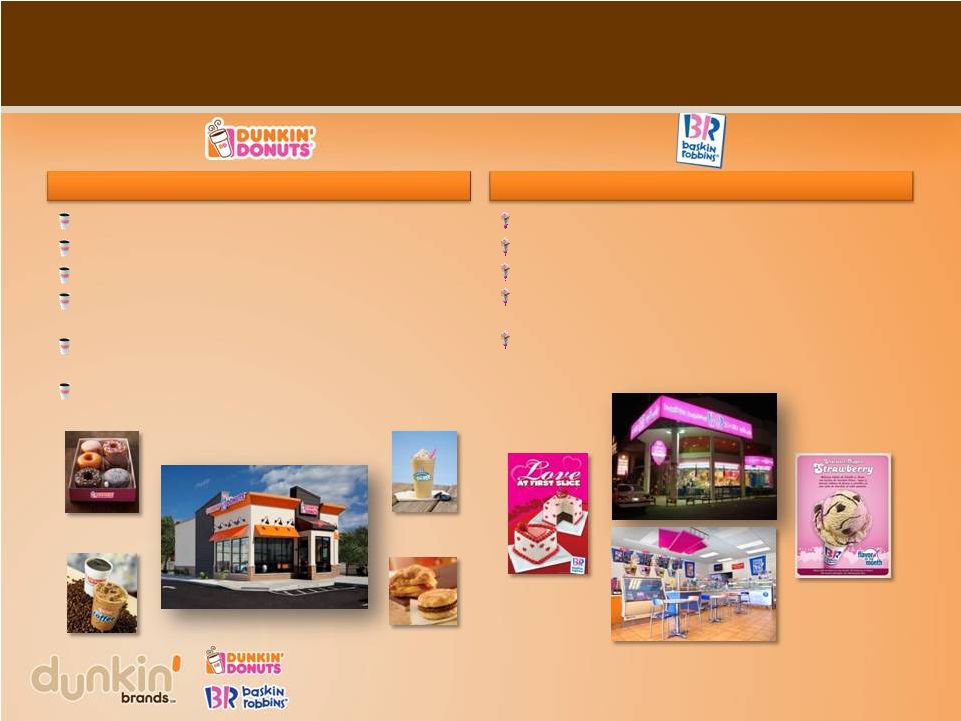
information is strictly prohibited. Two leading global brands
each with over 60 years of heritage
Source:
NPD Group/CREST for year ending February 2011; Omnibus Awareness Study, July
2010; Brand Keys
4
Over 95% aided brand awareness in U.S.
#1 in QSR customer loyalty for 5 straight years
1 bn+ cups of coffee sold in the U.S. annually
#1 position in Hot/Regular/Flavored/Decaf Coffee,
Iced Coffee, Donuts, Bagels and Muffins
Over 50% share of New England coffee servings and
morning meal traffic
36 U.S. states and in 31 other countries
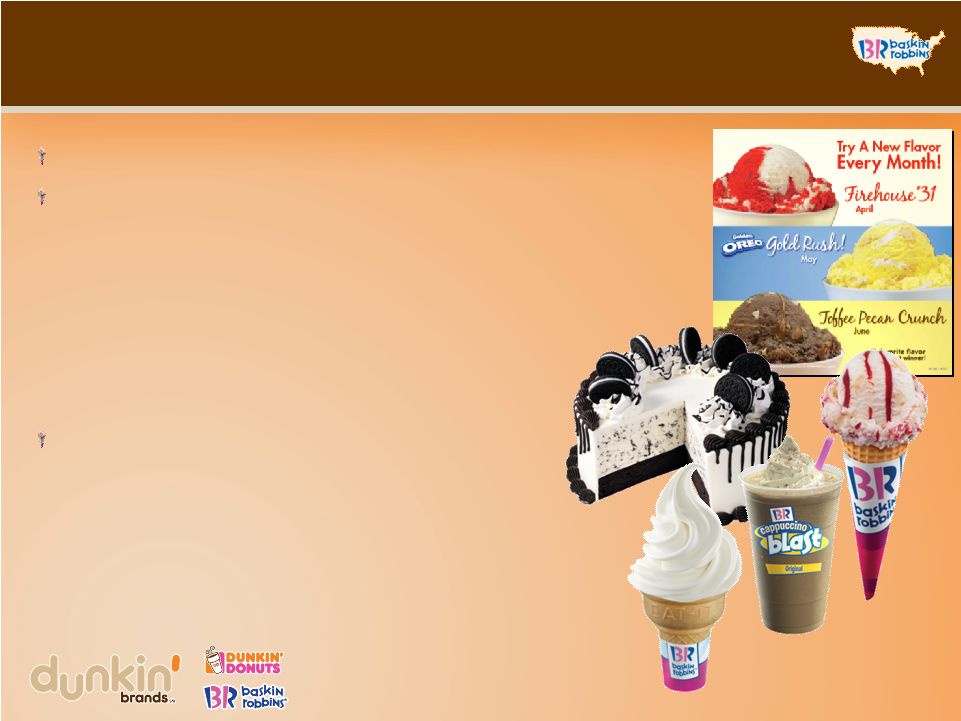
1,000+ ice cream flavors
95% aided brand awareness in U.S
#1 hard serve ice cream position in U.S.
#1 market share positions in Fast Food Ice Cream
category in Japan and South Korea in 2010
45 U.S. states and in 46 other countries
America Runs on Dunkin’
®
More Flavors, More Fun™ |
 Confidential information: Copying, dissemination or distribution of this
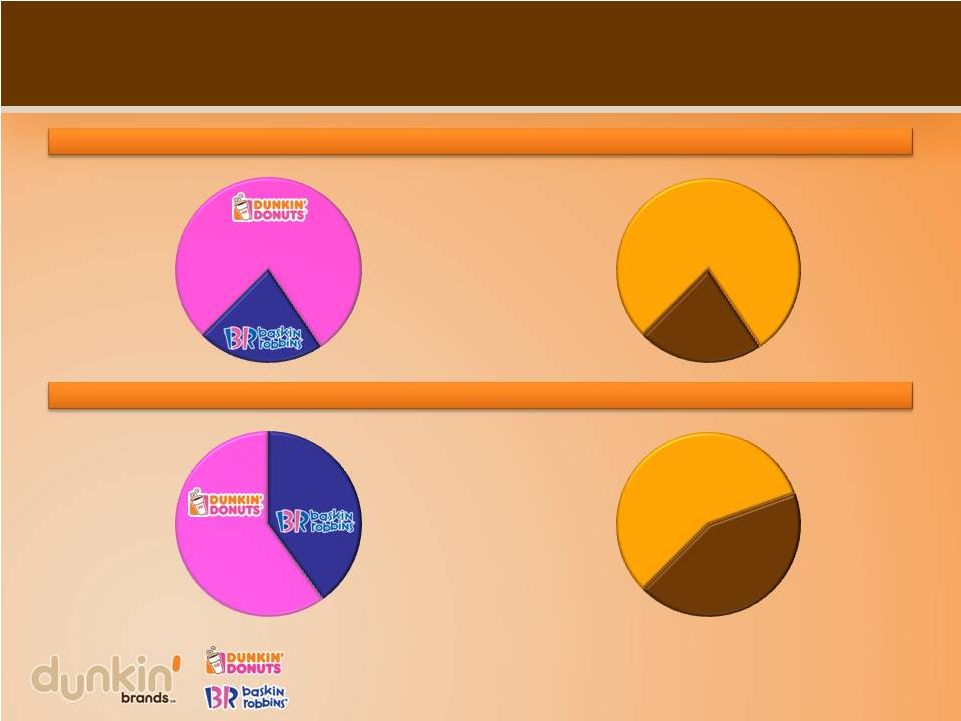
information is strictly prohibited. LTM Franchisee-Reported Sales
1
U.S.
$6.0 bn
(77%)
Intl
$1.8bn
(23%)
$6.2bn
(78%)
$1.7bn
(22%)
Global Points of Distribution
2
9,867
(60%)
6,560
(40%)
U.S.
9,348
(57%)
Intl
7,079
(43%)
Substantial global platform across both brands
5
1. Last twelve months (“LTM”) ending June 25, 2011
2. Data through Q2 2011 |
 Confidential information: Copying, dissemination or distribution of this
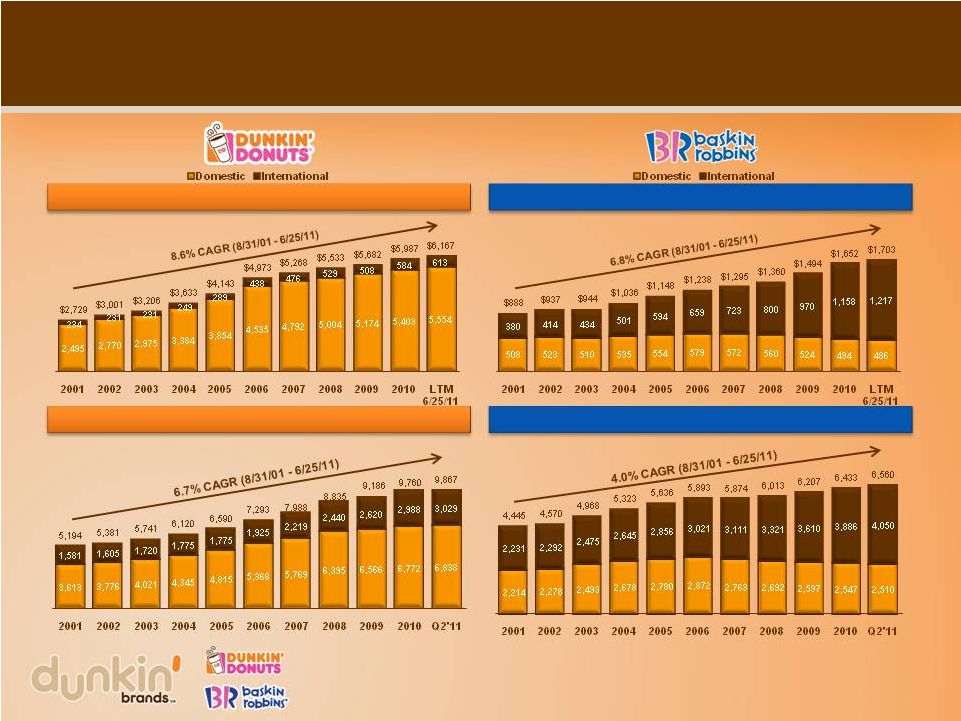
information is strictly prohibited. 6
Note: Fiscal year-end changed from August to December starting in 2006. POD
represents a single store or kiosk; combo stores count as one POD for each
brand. Franchisee-reported sales ($mm)
Franchisee-reported sales ($mm)
PODs
PODs
Confidential information: Copying, dissemination or distribution of this
information is strictly prohibited. Consistent track record of growth
|
 Confidential information: Copying, dissemination or distribution of this
information is strictly prohibited. 7
Highly experienced management team
Name
Title
Past experience
Nigel Travis
Chief Executive Officer, Dunkin’
Brands and President, Dunkin’
Donuts U.S.
President
&
Chief
Executive
Officer
of
Papa
John’s,
President
&
Chief
Operating
Officer
of
Blockbuster
and
SVP Burger King
Neil Moses
Chief Financial Officer
Executive
Vice
President
/
Chief
Financial
Officer
of
Parametric
Technology
Corporation
John Costello
Chief Global Marketing & Innovation
Officer
Executive Vice President of Merchandising and Marketing at Home Depot, Senior
Executive Vice President of Sears, Senior Vice President of Marketing &
Sales at Pepsi-Cola USA and Chief Global Marketing Officer of
Yahoo!
Paul Twohig
Chief Operating Officer, Dunkin’
Donuts U.S.
Senior
Vice
President
of
Starbucks;
Executive
Vice
President
and
Chief
Operating
Officer
of
Panera
Bread
Company
John Dawson
Chief Development Officer, U.S.
Vice President of Worldwide Restaurant Development for McDonald’s
Corporation Neal Yanofsky
President, International
President of Panera Bread Company
Bill Mitchell
Senior Vice President & Brand
Officer, Baskin-Robbins U.S.
President of Global Operations for Papa John’s
Richard Emmett
Senior Vice President & General
Counsel
Former Executive Vice President and Chief Legal Officer of Quiznos, Senior Vice
President and General Counsel of Papa Johns
Christine Deputy
Senior Vice President, Chief Human
Resources Officer
Vice President of Asia Pacific Human Resources for Starbucks
Karen Raskopf
Senior Vice President, Chief
Communications Officer
Senior Vice President of Corporate Communications for 7-Eleven and
Blockbuster Dan Sheehan
Chief Information Officer
Senior Vice President/Chief Information Officer for ADVO
Srinivas Kumar
President & Chief Operating Officer,
Baskin-Robbins International
General Manager of Galadari (largest Baskin-Robbins licensee worldwide)
Tony Pavese
Chief Operating Officer, Dunkin’
Donuts International
Chief Operating Officer for Popeye’s International
|
 Confidential information: Copying, dissemination or distribution of this
information is strictly prohibited. 8
Our growth strategy |
 Focused growth strategies across each segment
8% of 2010 revenue
73% of 2010 revenue
19% of 2010 revenue
Increase comparable
store sales and
profitability in DD U.S.
Continue DD U.S.
contiguous store
expansion
Increase comparable
store sales growth of BR
U.S.
Drive accelerated
international growth
across both brands
Confidential information: Copying, dissemination or distribution of this
information is strictly prohibited. 9 |
 Confidential information: Copying, dissemination or distribution of this
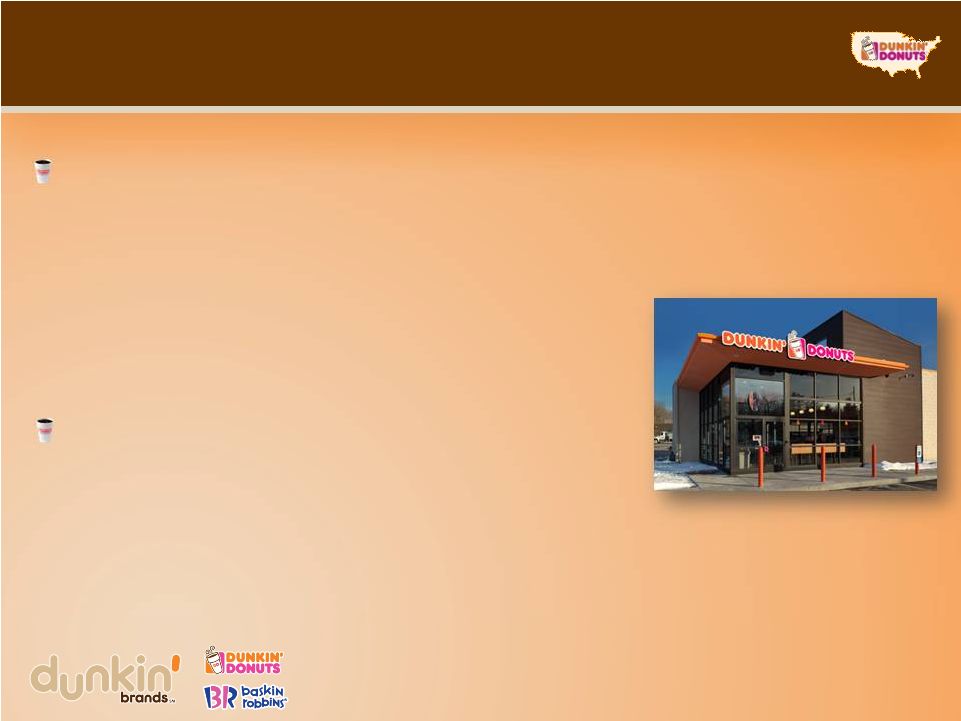
information is strictly prohibited. 10
Dunkin’
Donuts U.S. strategy
Drive comparable store sales and profitability
•
Successful product innovation record with strong pipeline
•
Differentiated brand platform with high-impact marketing
•
Operations-focused culture driving improved in-store
experience
Accelerate profitable and contiguous POD growth
•
Among one of the industry-leading expansion track records
•
Significant opportunity across U.S. |
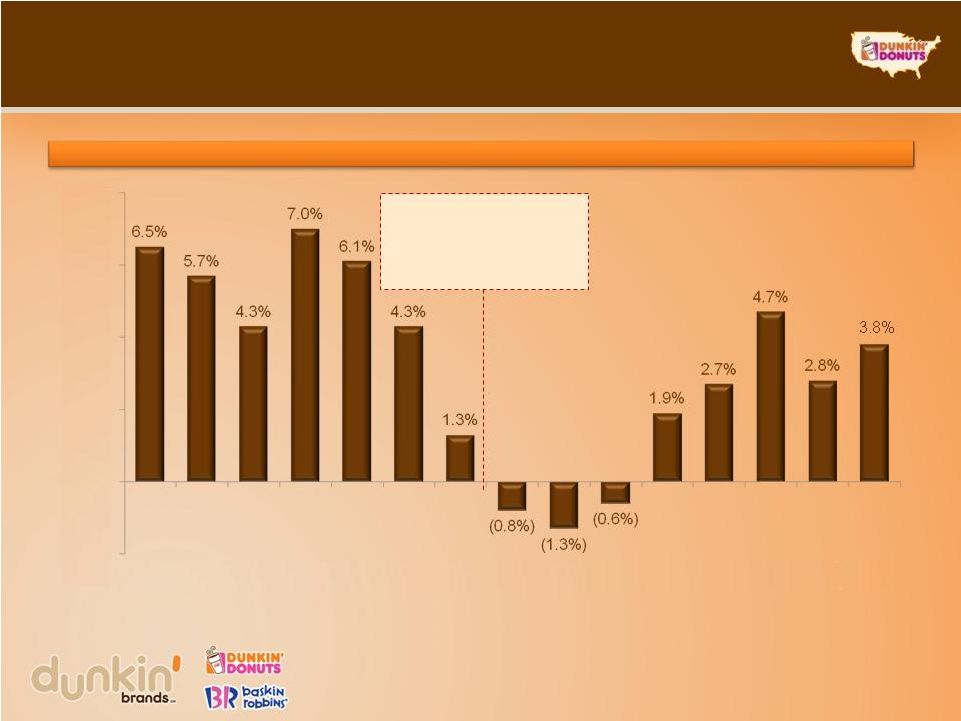 11
Strong comp growth momentum
Resilient comp performance throughout economic cycles
Note: Fiscal year-end changed from August to December starting in 2006
45 consecutive
quarters of
comparable store
sales growth
Confidential information: Copying, dissemination or distribution of this information is strictly
prohibited. 2001
2002
2003
2004
2005
2006
2007
2008
2009
1Q10
2Q10
3Q10
4Q10
1Q11
2Q11
(2.0%)
0.0%
2.0%
4.0%
6.0%
8.0%
Dunkin’
Donuts U.S. comparable store sales growth |
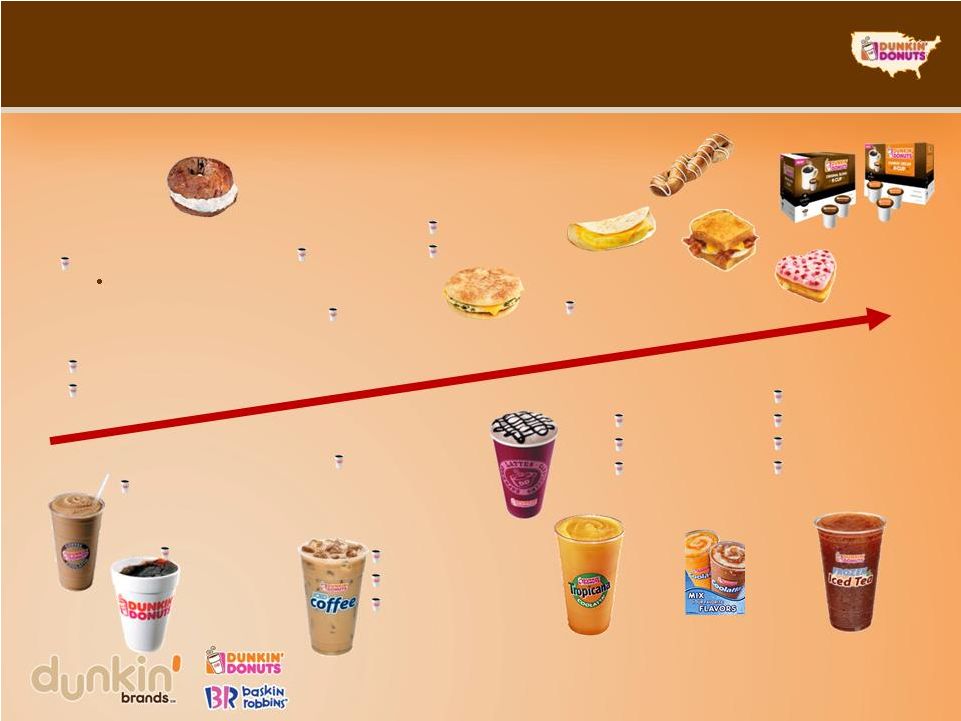 Confidential information: Copying, dissemination or distribution of this
information is strictly prohibited. 12
Powerful track record of product innovation
1995
1996
1998
Fruit Coolatta
®
2000
Dunkaccino
®
Hot chocolate
2001
Vanilla Chai
2003
2004
2005
Turbo Ice
®
Tropicana
®
Coolatta
®
9 iced coffee and hot
coffee flavors
2008
DD Smart
®
Flatbreads
2010
2009
Wake-Up Wrap
®
2011
Big n’
Toasty
Shaped donuts
Dunkin’
K-Cups
Frozen Iced Tea
Hot
espresso
platform
Iced lattes
Bagel
twists
Coolatta
®
mixology
PM
snacks
Hazelnut and
French Vanilla
Coffee
excellence
Breakfast
sandwiches
Bagels |
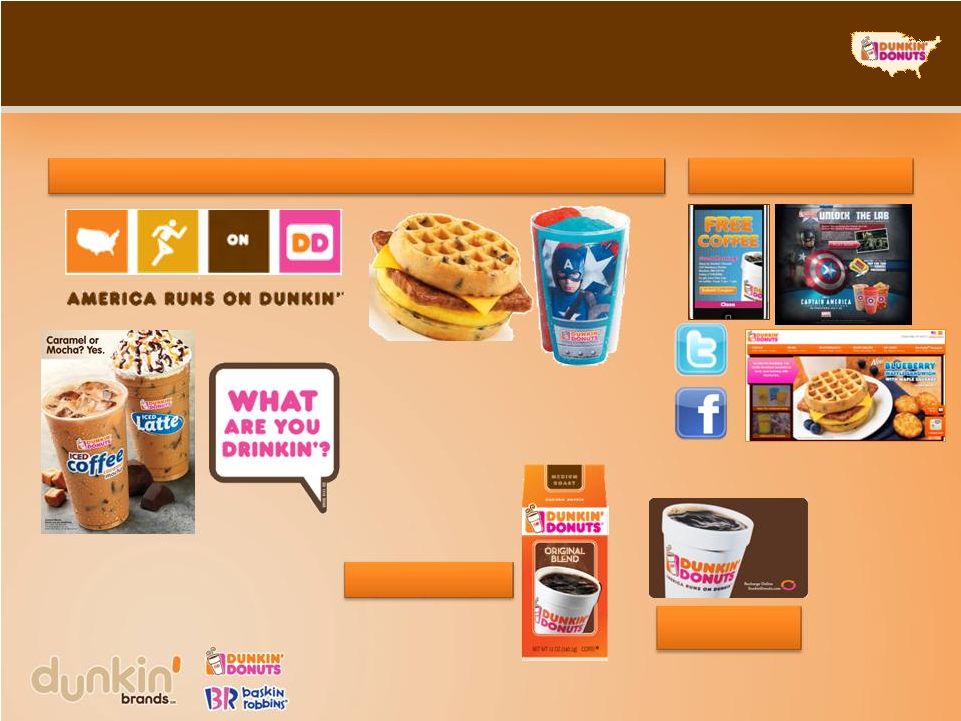 High
impact marketing with broad reach 13
Strong heritage in traditional media
Growing interactive, internet
and social media
Produce news “buzz”
from Limited Time
Offerings
TV, Radio, Print, PR, POP,
Local Marketing
Strong grocery
coffee business
Growing loyalty
program
Confidential information: Copying, dissemination or distribution of this
information is strictly prohibited. |
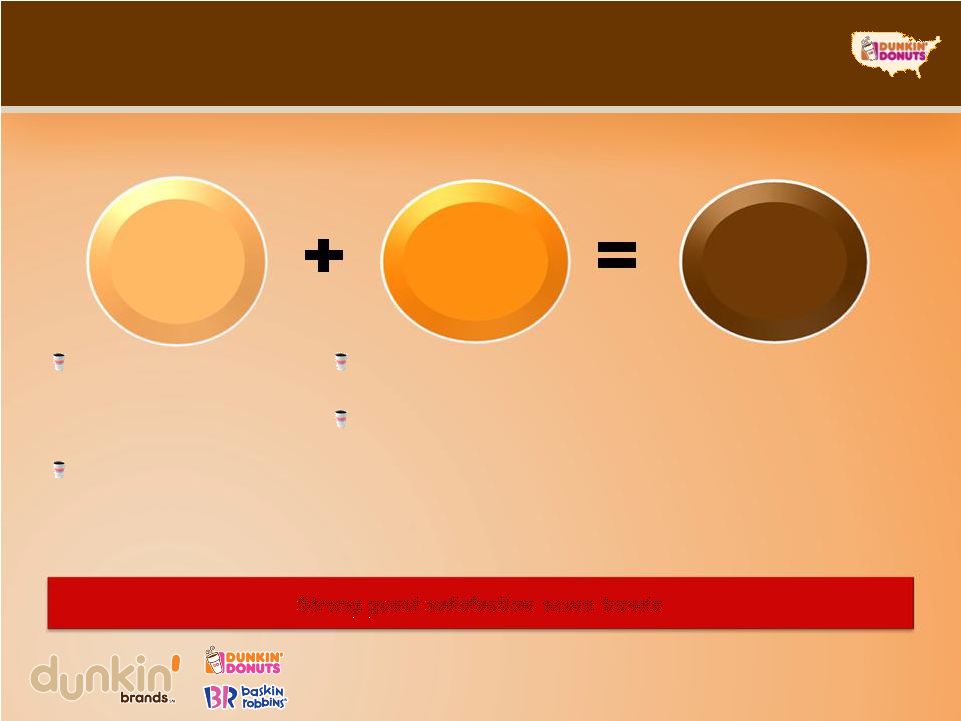 Confidential information: Copying, dissemination or distribution of this
information is strictly prohibited. 14
Intense focus on restaurant level
operational support
Clearly defined store
standards
Strong remodel program
Strong support to
franchisees and
restaurant managers with
training and marketing
Effective systems for
back-office management
People &
systems
Great guest
experience
Profitable
topline sales
Strong guest satisfaction score trends |
 Confidential information: Copying, dissemination or distribution of this
information is strictly prohibited. 15
Our U.S. development opportunity |
 Confidential information: Copying, dissemination or distribution of this
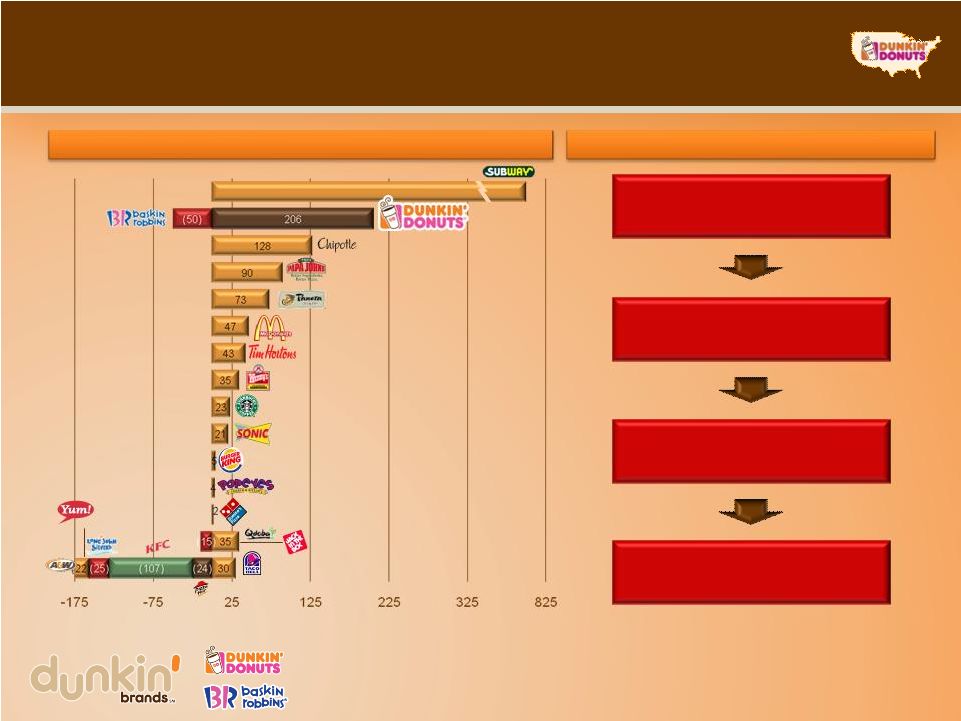
information is strictly prohibited. 16
An industry leader in U.S. development
Disciplined development process
Attracting and selecting quality
franchisees
Rigorous market planning
and site selection
An industry leader in U.S.
development
Phased market
development
2010 net U.S. store development
Source:
SEC
filings
and
Dunkin’
Brands
-148
+20
806 |
 Confidential information: Copying, dissemination or distribution of this
information is strictly prohibited. 17
Platform to drive accelerated development pace
Tremendous potential for
contiguous growth
•
200+ million in untapped population
New store pipeline momentum
•
50% increase in 2010 over 2009
Expanding lender base
Constant focus on unit economics
•
Approximately 23% reduction in
build-out cost for end-cap drive-thru
locations in the last three years
•
Over $220mm reduction in supply
chain costs between 2008 and Q1
2011
Store-level
economics
–
traditional
stores
Average initial capex
(1)
$474,000
Average unit volumes
(1)
$855,000
Sales to capital ratio
1.8x
1. 2010 cohort of new traditional stores, excludes gas & convenience
90%+ of new development in
2010 from existing franchisees
Unit economics generate new
franchisee demand |
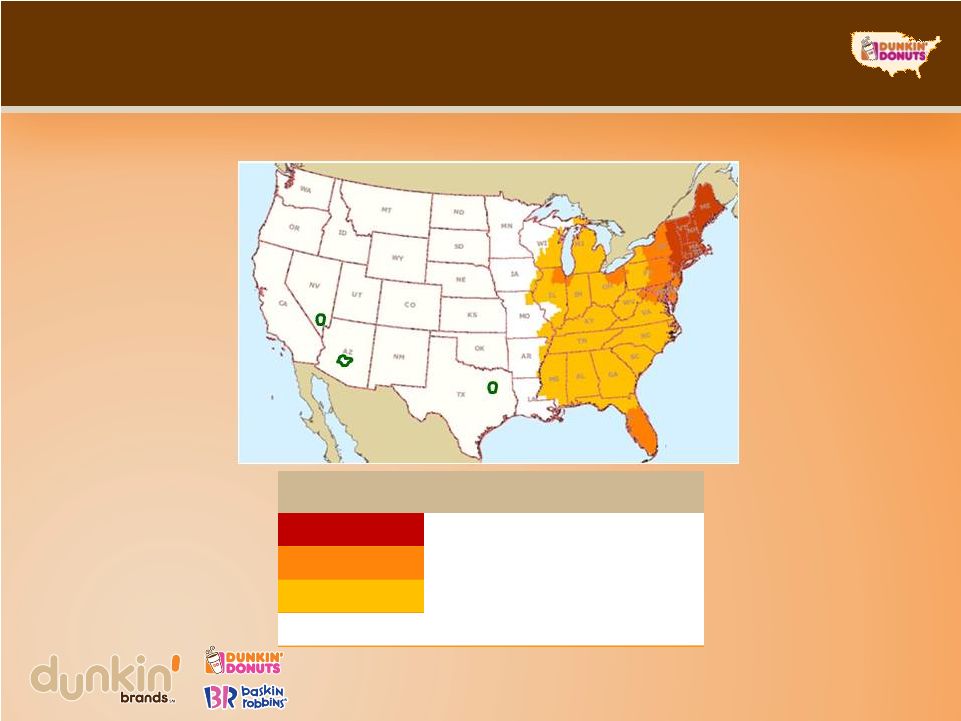 Confidential information: Copying, dissemination or distribution of this
information is strictly prohibited. Region
Population
(mm)
Stores
(1)
Penetration
Core
36.0
3,720
1:9,700
Eastern Established
53.8
2,151
1:25,000
Eastern Emerging
88.7
792
1:112,100
West
130.0
109
1:1,193,000
18
Significant opportunity for profitable growth
1. As of 12/25/2010 |
 Confidential information: Copying, dissemination or distribution of this
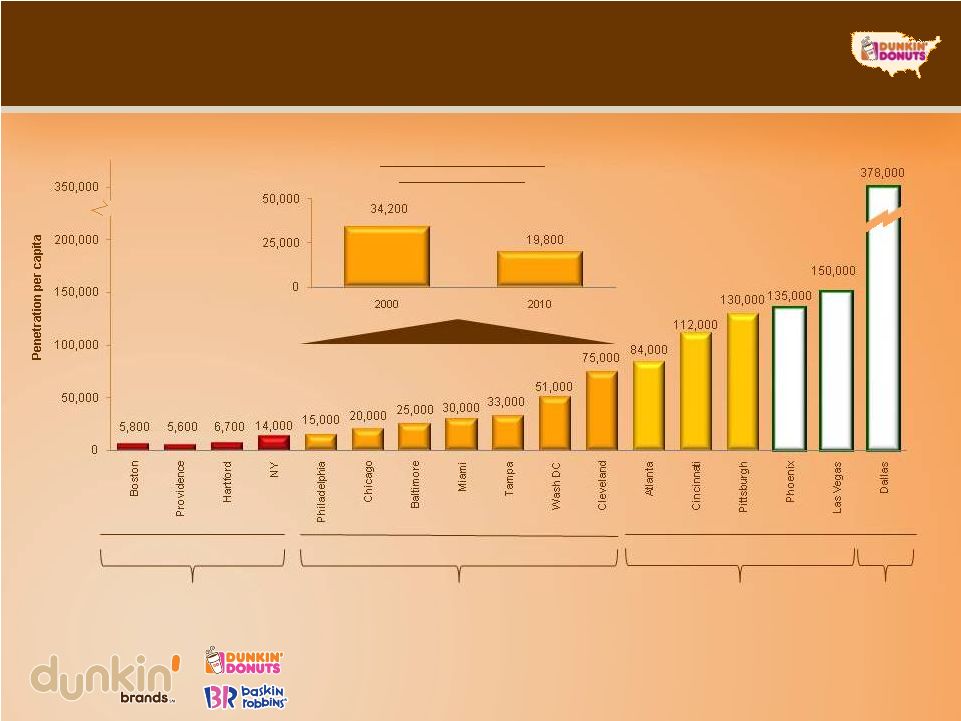
information is strictly prohibited. 19
Proven ability to increase penetration
in Established markets
Core
Established
Emerging
33%
2010 net new
open (% of total)
(1)
36%
28%
West
3%
1. Represents entire region, not select DMAs
Total penetration of select
established markets |
 Confidential information: Copying, dissemination or distribution of this
information is strictly prohibited. 20
Significant long-term expansion opportunity
~15,000
6,772
DD pro forma penetration
1:9,200
1:20,000
1:23,000
1:25,000
1:20,000
~5,109
~3,792
2,151
~2,701
3,720
~3,920
~200
~550
~3,000
5,000
2010
Core
Established
Emerging
West
Long
-
term
Core
Established
Emerging
West
109
792
~
Dunkin’
Donuts U.S. bridge to long-term goal (existing stores + new net
development) |
 Confidential information: Copying, dissemination or distribution of this
information is strictly prohibited. 21
Our international growth opportunity |
 Confidential information: Copying, dissemination or distribution of this
information is strictly prohibited. History of successful international
growth particularly in Asia Dunkin’
Brands is among the largest U.S. QSR companies overseas
by unit count
Renewed focus on strengthening international segments under new
leadership
Emphasis on improving penetration in existing markets, given strong
concept acceptance
Leverage brands’
strengths to grow in markets with significant potential
•
Baskin-Robbins has close-to-universal product appeal
•
Dunkin’
Donuts’
platform allows for localization and flexibility
Drive accelerated international growth
for both brands
22
2007
–
2010
International
Growth
13% International SWS CAGR
9% International POD CAGR |
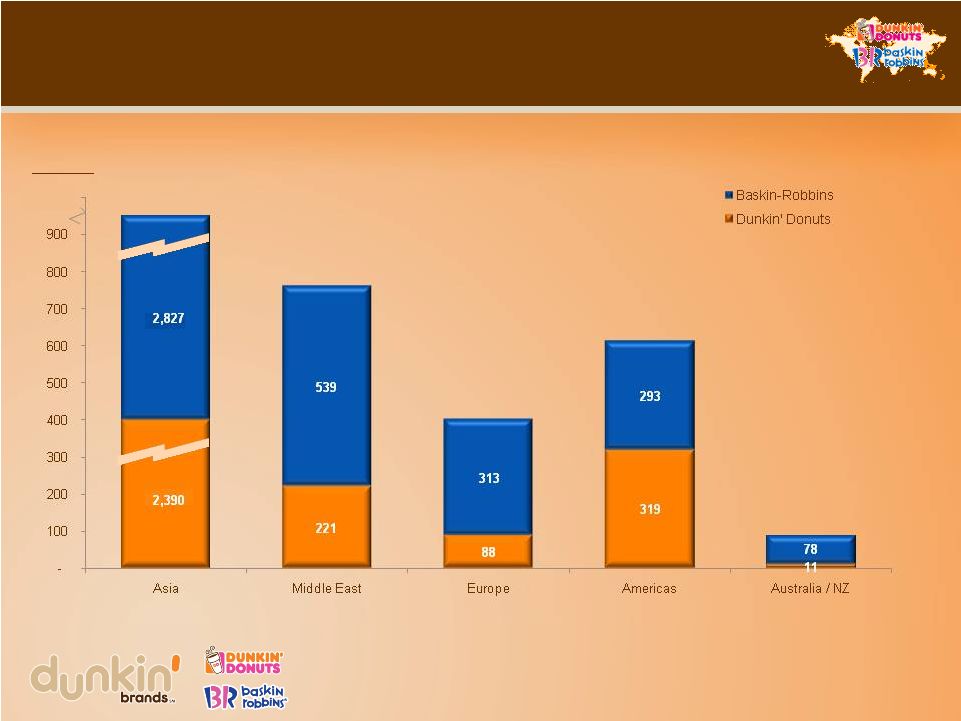 Confidential information: Copying, dissemination or distribution of this
information is strictly prohibited. Note:
Unit count as of Q2 2011
Both brands have strong international
presence with significant growth potential
23
Store count:
6,000
5,217
401
324
89
760 |
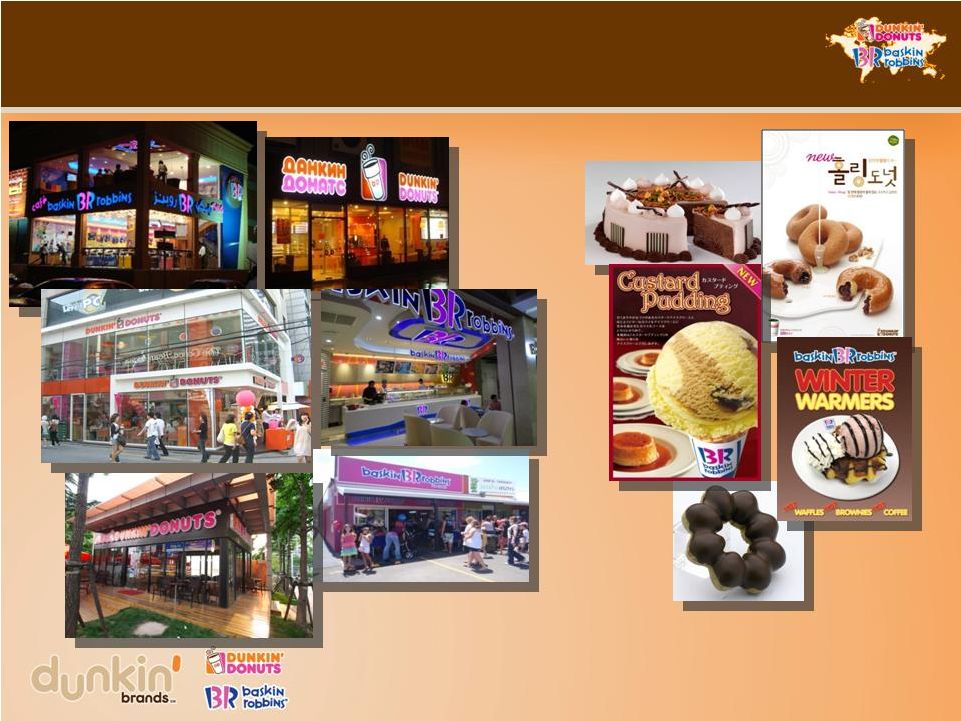 24
Dynamic and differentiated international brands
Confidential information: Copying, dissemination or distribution of this
information is strictly prohibited. |
 Confidential information: Copying, dissemination or distribution of this
information is strictly prohibited. Drive growth in established markets
(Japan, Korea and Middle East)
Accelerate China growth for both brands
Build-out emerging markets (Russia and Latin America)
Launch Dunkin’
Donuts in India
450 –
500 planned 2011 net openings
Focused international growth priorities
25 |
 Confidential information: Copying, dissemination or distribution of this
information is strictly prohibited. 26
Continue to re-energize Baskin-Robbins U.S.
Leveraging 65-year heritage and 95% aided brand awareness
Implementing focused strategic plan aimed at improving comp sales
•
Sharpening brand differentiation
•
Improving operations and marketing
•
Optimizing supply chain to increase franchisee profitability
•
Introducing standardized retail technology
•
Accelerating store transfer program
Early results are encouraging
•
Reached an all-time high in overall guest satisfaction
•
Increased franchisee engagement
•
Improving comp sales trend |
 Confidential information: Copying, dissemination or distribution of this
information is strictly prohibited. 27
Financial highlights |
 28
Our unique investor proposition
Asset-lite model / low capex requirements
•
Restaurant buildout costs borne by franchisees
•
Franchisee-owned
DD
supply
chain
network
Less affected by store-level costs (i.e. commodities)
than most QSRs
•
Revenues driven off franchisee topline sales
•
Collaboration with franchisees to maximize
restaurant profitability
Proven ability to drive comp store sales growth
Accelerating POD development
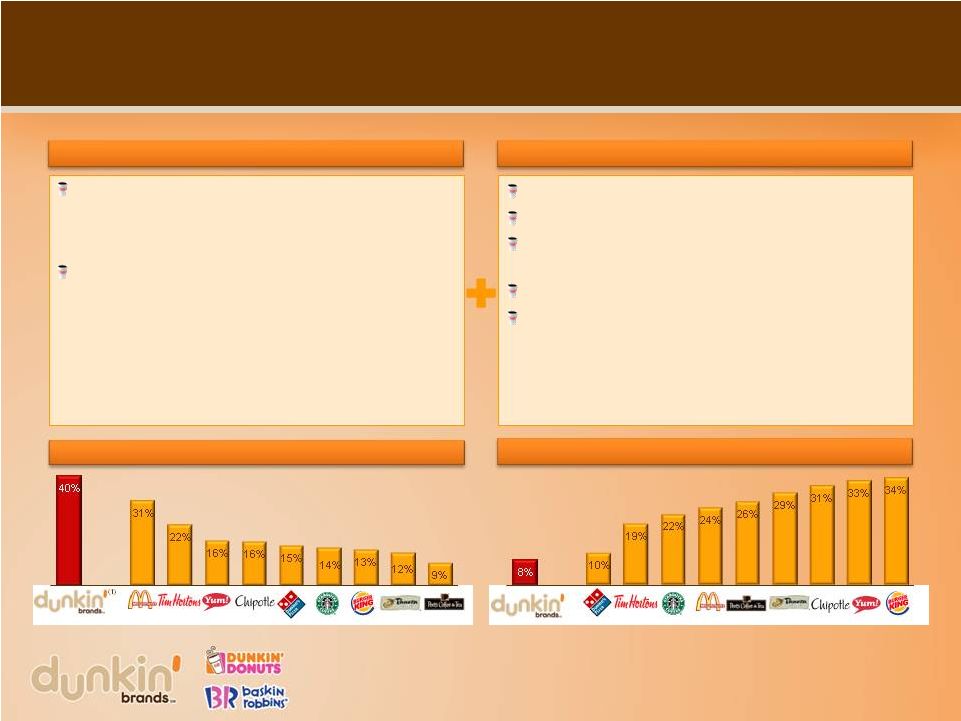
Leverageable cost structure with industry-leading
operating margins
Ability to further leverage G&A
Cash flow generation and deleveraging
1.
Represents operating income before amortization and impairment
Attractive business model
Long-term growth opportunity
FY 2010 operating income margin
2010 capex vs. peers (% of EBITDA)
Confidential information: Copying, dissemination or distribution of this
information is strictly prohibited. |
 Confidential information: Copying, dissemination or distribution of this
information is strictly prohibited. Pro Forma capital structure
29
($mm)
Actual
6/25/11
Pro forma
IPO
6/25/11
Cash and Cash Equivalents
(1)
$146
$129
Revolving Credit Facility
0
0
Term Loan B
(2)
1,497
1,497
Capital leases
5
5
Total Secured Debt
$1,502
$1,502
Senior Unsecured Notes
(2)
375
0
Total Debt
$1,877
$1,502
Total Secured Net Debt
(3)
/ Adjusted EBITDA
(4)
4.9x
4.9x
Total Net Debt
(3)
/ Adjusted EBITDA
(4)
6.2x
4.9x
Adjusted EBITDA
(4)
/ Interest Expense
(5)
2.4x
4.5x
1.
Amount includes cash held for advertising funds or reserved for gift
card/certificate programs 2.
Debt balances exclude original issue discount
3.
Total debt is net of original issue discount and excludes cash held or reserved for
gift card/gift certificate programs of $59mm 4.
Adjusted EBITDA reflects LTM 6/25/2011 Credit Agreement EBITDA of $289.2mm
5.
Actual interest expense is $120.5mm (representing annualized interest
post-November 2010 refinancing, as per the Credit Agreement), and $64.8mm for pro forma IPO
Pro Forma capital structure at 6/25/2011 |
 30
Long-term earnings model
Strong, predictable revenue growth
•
U.S. consolidated comps in the
2–4% range
•
Total net unit development of
approximately 3–5% with
opportunity to accelerate
Highly leverageable cost structure
•
Drives margin expansion of
150–200 bps per year
Strong free cash flow
•
Facilitates earnings growth through
deleveraging or shareholder payout
6–8% revenue growth
10–12% operating income
(excl. intangibles
amortization) growth
15%+ EPS (excl. intangibles
amortization) growth
Drivers
Long-term targets
Confidential information: Copying, dissemination or distribution of this
information is strictly prohibited. |
 Confidential information: Copying, dissemination or distribution of this
information is strictly prohibited. Strong platform for continued growth
Our key business strengths
Strong and established brands with leading market positions
Two strong and highly recognized global brands that generated LTM
franchisee-reported sales of $7.9 bn
(1)
Strong comp store sales trajectory
Significant opportunities to grow brands globally
Over 16,000 global locations with significant opportunity for domestic and
international growth Invested during downturn to position ourselves for
growth Franchised business model provides platform for growth
Nearly 100% franchised business model generates high margins with low capex
requirements, driving cash flow generation
Store-level
economics
generates
franchisee
demand
for
additional
restaurants
31
1. Last twelve months (“LTM”) ending June 25, 2011
Highly experienced, aligned and motivated management team with franchise “operating”
philosophy |
 Confidential information: Copying, dissemination or distribution of this
information is strictly prohibited. 32 |
 Confidential information: Copying, dissemination or distribution of this
information is strictly prohibited. 33
Attachment –
Non-GAAP Reconciliation
Fiscal Year 2010
($ in mm)
As Percentage of
Total Revenue
Operating income
$193.5
33.5%
Adjustments:
Amortization of intangible assets
32.5
5.6%
Impairment charges
7.1
1.2%
Adjusted operating income
$233.1
40.4%
Adjusted operating income is reconciled to operating income for fiscal year 2010 as
follows: |