Attached files
| file | filename |
|---|---|
| 8-K - FORM 8-K - Vantage Drilling CO | d8k.htm |
 Pareto Securities
Oil & Offshore Conference 2011
August 31, 2011
Exhibit 99.1 |
 Some of the statements in this presentation constitute forward-looking
statements. Forward-looking statements relate to
expectations,
beliefs,
projections,
future
plans
and
strategies,
anticipated
events
or
trends
and
similar
expressions
concerning matters that are not historical facts. The forward looking
statements contained in this presentation involve risks and uncertainties as
well as statements as to: •
our limited operating history;
•
availability of investment opportunities;
•
general volatility of the market price of our securities;
•
changes in our business strategy;
•
our ability to consummate an appropriate investment opportunity within given time
constraints; •
availability of qualified personnel;
•
changes in our industry, interest rates, the debt securities markets or the
general economy; •
changes in governmental, tax and environmental regulations and similar
matters; •
changes in generally accepted accounting principles by standard-setting
bodies; and •
the degree and nature of our competition.
The forward-looking statements are based on our beliefs, assumptions and
expectations of our future performance, taking into account all information
currently available to us. These beliefs, assumptions and expectations can change as a result
of many possible events or factors, not all of which are known to us or are within
our control. If a change occurs, our business, financial condition,
liquidity and results of operations may vary materially from those expressed in our forward-
looking statements.
Forward-Looking Statements
2 |
 Symbol:
VTG (NYSE AMEX)
Location:
HQ
–
Houston;
Operations
–
Singapore;
Marketing
–
Dubai
Market Cap:
$366.2 million
Book Value:
$713.8 million
Enterprise Value:
$1.52 billion
Employees:
> 700
Contract Backlog:
$3.0 billion, including rigs under management
Owned Fleet:
4 Ultra-Premium Jackups
1 Ultra-Deepwater Drillship
1 Ultra-Deepwater Drillship under construction
Managed Fleet:
4 Ultra-Deepwater Drillships under construction
Corporate Overview
3 |
 Platinum
Explorer
commenced
operations
with
ONGC
on
December
29,
2010,
and
achieves
impressive utilization –
First
6
months
of
operation
–
91%
efficiency
June
2011
–
99.77%
July
2011
–
93.5%
Construction Management Agreements with Aker Drilling for two drillships under construction at
DSME High-specification jackup market experiencing upward momentum in rates with continued
high utilization
Recent Developments
4
Expanded deepwater fleet with order of newbuild drillship Tungsten Explorer for Q2 2013
delivery. Raised ~ $240.0 million with “tack-on” bond offering to refinance term loan and fund
drillship down payment.
November 15, 2010 - Took delivery of Platinum Explorer – on-time, on
budget
Awarded high-profile jackup contract for ultra-HPHT work in Malaysia @ $187,000 per day
(inclusive of reimbursed upgrades); 14-21 month duration Awarded 18 month contract for Emerald Driller in Thailand. |
 •
Capable of operating in water depths up to 12,000 ft
•
Total vertical drilling depth of 40,000 ft
•
Variable deck load of 20,000 tons
•
Hull measurement of 781 ft long by 137 ft wide
•
DP3 dynamic positioning system
•
1250 short ton hook load, including 9000 hp drawworks
•
Offline pipe handling
•
Trip saver system
•
Accommodations for 200 personnel
•
Delivery Q2 2013
Tungsten Explorer
5 |
 Premium
high-specification drilling units, including four jackup rigs and three drillships
Vantage’s modern rigs are capable of drilling to deeper depths and possess enhanced operational
efficiency and technical capabilities, resulting in higher utilization, dayrates and
margins Total
costs
of
owned
fleet
of
four
jackups
and
the
Platinum
Explorer
drillship
of
approximately
$1.7 billion
Premium Fleet
Successful
track
record
of
managing,
constructing,
marketing
and
operating
offshore
drilling
units
In-house team of engineers and construction personnel overseeing complex construction
projects All jackups delivered on budget and on time
Jackup fleet has experienced approx. 99% of productive time for Vantage’s first 31 months in
operation Level of efficiency is exceptional for newly-constructed jackup rigs upon
commencement of operations Proven Operational
Track
Record
Significant cash flow visibility
Owned fleet contract backlog of approximately $1.2 billion and managed fleet contract backlog of
approximately $1.8 billion
Owned
fleet
counterparties
include
Total,
Pearl
Energy,
Bowleven,
Foxtrot
International,
Phu
Quy
(1)
,
Salamander,
PTT,
Petronas
Carigali
and
ONGC
Managed deepwater rigs counterparties include Petrobras
Significant
Contract Coverage
with
High Quality
Counterparties
(1)
PVEP Phu Quy Petroleum Operating Co. Ltd. is a joint venture interest between PetroVietnam Exploration
Production Corp. and Total E&P Vietnam. Company Highlights
6 |
 Construction
management arrangements for four ultra-deepwater drillships, DragonQuest, Dalian
Developer, Aker Drilling 1 & 2
Management of DragonQuest once in service
Approximately $12.0 to $15.0 million per year for the duration of the contract
Management team with extensive experience; average of 28 years in the drilling industry
Includes international and domestic public company experience with industry-leading peers
involving numerous acquisitions and debt and equity financings
Experienced operating personnel
Construction
Supervision and
Management
Arrangements
Experienced
Management and
Operational Team
Company Highlights (Cont’d)
7 |
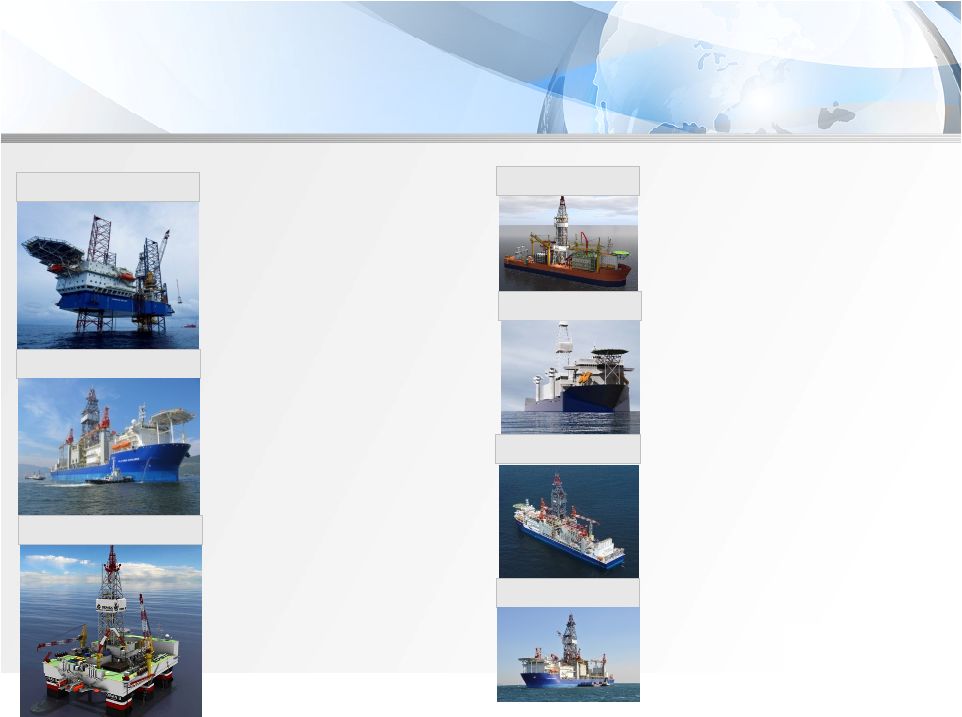 Completed Projects
4 BMC 375 Jackups
Platinum Explorer
Current Projects
Dalian Developer
Dragonquest
Aker Drillships 1&2
SeaDragon 1 & 2
Delivered On-Time, On Budget
November 2010
Restructured construction project
with Vantage designed remediation
plan and implemented project
controls. Project completed for
customer as rigs sold to competitor.
•
Project 99% complete
•
2
nd
Successful
newbuild
at
DSME
•
Hired by Financial Institution to provide
shipyard oversight following bid process
•
Largest drillship in the world currently
under construction
•
Vessel will include oil storage and multi-
purpose capabilities
•
Hired by peer drilling company to
manage shipyard oversight
•
Leverages our strong relationship and
extensive experience with DSME
Tungsten Explorer
•
Company owned newbuild project
•
Leverages shipyard experience
•
Favorable costs and delivery schedule
Singapore Operations and Technical Support –
Track Record of Excellence
8
•
Emerald Driller – December 2008
•
Sapphire Driller – July 2009
•
Aquamarine Driller – September 2009
•
Topaz Driller – December 2009
All Delivered On-Time, On Budget – |
     Vantage
Offices Owned Rigs
Managed Rigs
Contract: Petrobras
DragonQuest
U.S. GOM
Contract: ONGC
Platinum Explorer
India
Houston
Singapore
Dubai
Contract: PTT
Emerald Driller
Thailand
Aquamarine Driller
Contract: Salamander
Vietnam
Contract: Petronas
Carigaili
Malaysia
Topaz Driller
Contract: Phu Quy
(1)
Vietnam
Contract: Total
Malaysia
Country of Operation
(1)
PVEP Phu Quy Petroleum Operating Co. Ltd. is a joint venture interest between
PetroVietnam Exploration Production Corp. and Total E&P Vietnam. Sapphire
Driller Contract: Eurail
Cameroon
Contract: Foxtrot
Ivory Coast
Worldwide Operations
9 |
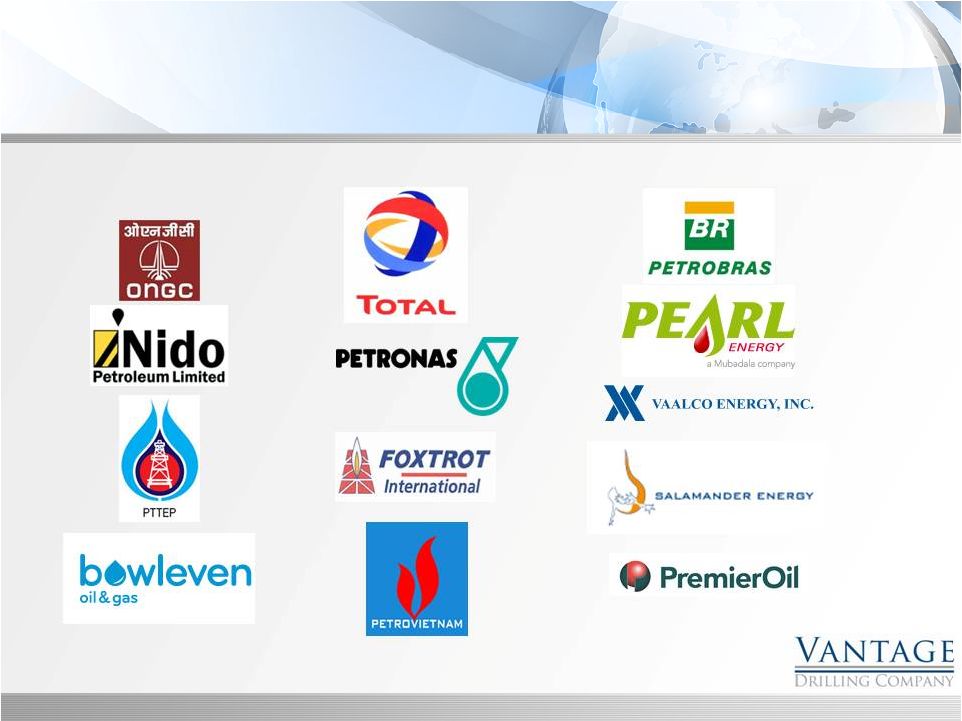 Strong Customer Relationships
Key Customers
10 |
 World class assets achieving world class performance –
–
Fleet productive time approximately 99% since inception
–
High-specification jackup fleet meeting today’s challenges:
•
Faster drilling times
•
Faster moving times
•
Increased volumes of consumable liquids and
drilling fluids
•
Reduced boat runs and non-productive time
•
Improved pipe handling and offline capability
•
Fast preloading time for all tanks
•
75’
x 30’
cantilever reach substantially greater
than the industry average
•
Pipe decks allow increased storage capacity
•
Premium drilling package:
•
3 x 2200HP mud pumps
•
Integrated diverter system
•
18 ¾
BOP handling system and 4 rams
•
High-capacity, high efficiency –
5 x CAT 3516 B
Diesel engines
Emerald Driller
Sapphire Driller
Aquamarine Driller
Strong Financial Performance
Jackup Fleet
11 |
  2 years at $171,000
Ownership
2010
2011
2012
Rig
%
Q1
Q2
Q3
Q4
Q1
Q2
Q3
Q4
Q1
Q2
Q3
Q4
Jackups
Emerald Driller
100%
2 yrs. at $171K
$132K
18 mos. at $130K
Sapphire Driller
100%
10 mos. at $115.5K
4 mos. at $120K
1 yr at $120K
Aquamarine Driller
100%
5 mos. at $154.2K
10 mos. at $120K
(2)
$124K
2 wells at $137K
1 year + 1 year option
Topaz Driller
100%
10 mos. at $107.2K
14 mos. At $187K (including upgrade & mob.)
Drillships
Platinum Explorer
100%
5 yrs. at $590.5K
DragonQuest
Managed
8 yrs. at $551.3K
(3)
Construction
Commissioning/
Working
Operating
Option
Letter
Management
Mobilization/
(Owned Rigs)
(Management
Contract
of
Contract
Shipyard
Contract)
Intent
Fleet Status –
Average
Drilling
Revenue/Day
(1)
12
Average
drilling
revenue
per
day
is
based
on
the
total
estimated
revenue
divided
by
the
minimum
number
of
days
committed
in
a
contract.
Unless
otherwise
noted,
the
total
revenue
includes
any
mobilization
and
demobilization fees and other contractual revenues associated with the drilling
services. The
contract
is
for
drilling
two
wells
plus
extended
well
tests.
Estimated
drilling
time
is
one
month
per
well
and
extended
well
tests
could
range
from
a
few
months
to
up
to
one
year
per
well.
The
first
extended
well
tests period has been contracted through April 2011.
The drilling revenue per day includes the achievement of the 12.5 % bonus
opportunity, but excludes mobilization revenues and revenue escalations included in the contract.
(1)
(2)
(3) |
 •
Premium jackups (350’
+ IC rigs)
and ultra-deepwater floater have
historically maintained
significantly higher utilization
levels, particularly during
downturns in the energy industry
–
A higher utilization level in the
international drilling market
continues to reflect a more stable
rig supply and demand
environment than the Gulf of
Mexico
–
Operators are willing to pay a
substantial dayrate premium for
high-specification rigs
Global Jackup Utilization
International vs. GOM Jackup Utilization
Source: Riglogix; ODS-PetroData.
Historical Floater Dayrates ($Thousands)
Historical Floater Utilization
Premium Asset Advantage
13
–
Operators demand newer, higher
specification rigs due to superior
operating performance, resulting in
lower maintenance downtimes,
improved safety and higher
efficiency |
 •
Capabilities
and
age
–
The
current
worldwide
fleet
is
comprised
mostly
of
older,
inefficient
rigs
–
27% of today’s jackups are mat-supported and/or have less than 200ft of
water depth capability –
70% of today’s jackups are 25 years or older
–
As of February 2011 a total of 134 rigs were either ready stacked, cold stacked, or
in an accommodation mode without contract –
How many will not return to service?
•
Setting
up
cyclical
recovery
–
Reduction
in
the
overall
fleet
should
result
in
pricing
power
and
high
utilization
levels early on during the recovery
•
Age
is
a
factor
–
Demand
is
increasing
for
high-specification
jackups.
Many
customers
are
implementing age
restrictions and new high-specification characteristics
Source: ODS-Petrodata
Global Jackup Fleet Distribution
Age
Rigs
%
%
300+
200-299
<200
25 years or older
331
69%
61%
150
126
55
5 to 24 years
52
11%
10%
48
3
1
0 to 4 years
94
20%
17%
84
4
6
477
100%
282
133
62
2011 Deliveries
15
3%
13
2
0
2012 Deliveries
22
4%
19
3
0
2013 Deliveries
30
6%
29
1
0
544
100%
343
139
62
Age of Jackup Fleet
Water Depth (feet)
Profile of Global Jackup Fleet
14 |
 Ultra-Deepwater Rig Supply is Increasing Significantly
Deepwater Exploration is a Young, Rapidly Growing Market
Demand is Likely to Exceed Rig Supply Despite Newbuilds
Source: ODS-Petrodata, DnB NOR
Global Deepwater Market
15 |
 Balance Sheet
($Millions)
Financial Overview
16
December 31,
June 30,
2010
2011
Cash and cash equivalents
120.4
$
114.5
$
Restricted cash
29.0
6.2
Trade receivables
50.2
86.5
Inventory
19.8
22.2
Prepaid expenses and other current assets
11.5
7.3
230.9
236.7
Property and equipment, net
1,718.1
1,803.4
Investment in joint venture
-
-
Other assets
54.2
58.7
2,003.2
$
2,098.8
$
Accounts payable and accrued liabilities
107.5
$
126.6
$
Short-term debt
8.6
3.4
Current maturities of long-term debt
-
-
116.1
130.0
Long–term debt
1,103.5
1,242.5
Other long term liabilities
13.5
12.4
Shareholders' Equity
Paid-in capital
854.8
857.3
Retained Earnings
(84.7)
(143.4)
Accumulated other comprehensive loss
-
-
Total shareholders’
equity
770.2
713.8
2,003.2
$
2,098.8
$
Outstanding shares
289.7
290.7
Book value per share
2.66
$
2.46
$
|
 •
No near-term maturities provides
flexibility
•
Excess cash flow offers
opportunity; alternatively we can
buy bonds in the market with
excess cash
•
First call option February 2013
Debt Repayment
17 |
 Run-Rate Financial Potential of Vantage Owned Assets
($Millions, except dayrates)
(1)
Calculations of rig-level EBITDA incorporate management's assumption of 90%
utilization/efficiency of jackups, which reflects industry standard productive times on high-specification jackups.
Utilization/efficiency of drillship assumed to be 97%, which management believes is
a reasonable assumption for a newbuild vessel in its first full year of operations. Rig-level EBITDA
attributable to jackups reflects direct operating expense assumption based on
Vantage’s jackups that operated for the full first quarter of 2011.
(2)
EBITDA
/
Total
debt
includes
the
“tack-on”
bond
issuance
in
Q2
2011
Illustrative Range of Run-Rate Financial Potential
•
Strong cash flow backlog to cover
debt service
•
Leveraged to upturn in high-
specification jackup market
Financial Overview
18 |
 EBITDA
Low
6.5x
Today’s
Peer Avg.
8.5
Historical
Peer Avg.
11.6x
$250 million
$1.72
$3.44
$6.11
$300 million
$2.84
$4.90
$8.10
$350 million
$3.96
$6.36
$10.10
Implied Values –
EV/EBITDA
Source: Jefferies
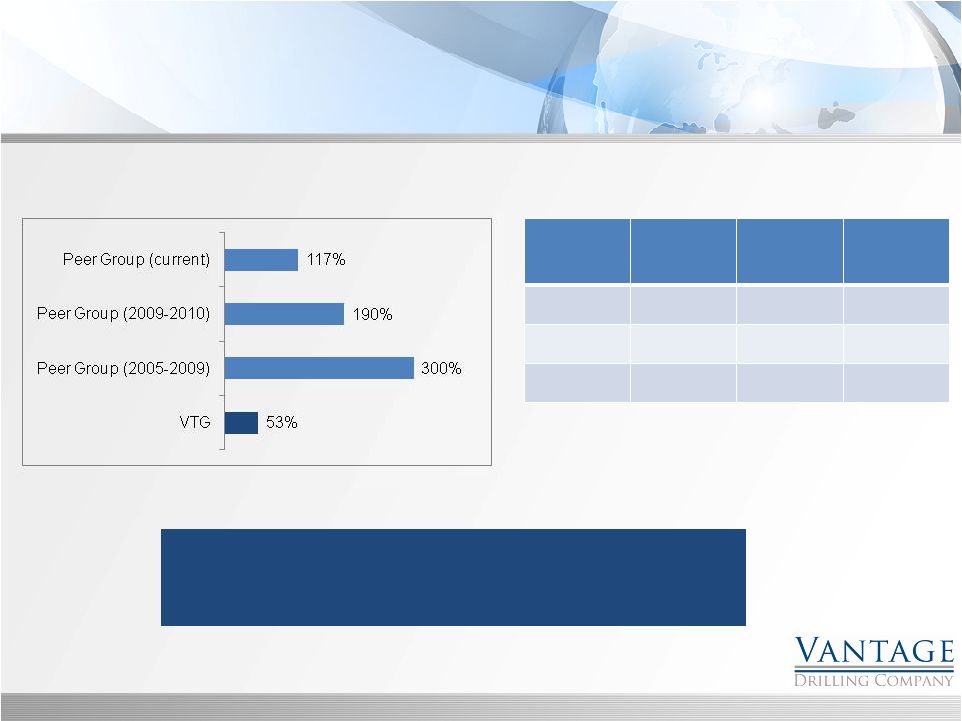
Price to Book Value
Key Drivers Near Term –
•
Achieve high productive time on Platinum Explorer
•
Improving dayrate contract fixtures on jackups
19
Significant Upside Valuation Potential |
 Historical Financial Information
($ Millions)
Financial Overview
20
$14.3
$22.2
$36.4
$38.6
$58.3
$68.4
$66.9
$84.9
$124.6
$120.9
$6.4
$9.5
$14.2
$5.0
$25.3
$24.6
$21.3
$16.9
$42.8
$48.2
$0.0
$20.0
$40.0
$60.0
$80.0
$100.0
$120.0
$140.0
3/31/2009
6/30/2009
9/30/2009
12/31/2009
3/31/2010
6/30/2010
9/30/2010
12/31/2010
3/31/2011
6/30/2011
Quarter Ended
Revenue
Adjusted EBITDA |
 Reconciliation of Net Income (Loss) to Adjusted EBITDA
($Millions)
Appendix
21
6/30/2009
9/30/2009
12/31/2009
3/31/2010
6/30/2010
9/30/2010
12/31/2010
3/31/2011
6/30/2011
Net income (loss)
4.0
$
6.8
$
(4.3)
$
6.0
$
(7.0)
$
(33.6)
$
(13.0)
$
(18.7)
$
(40.1)
$
Interest expense, net
1.3
1.9
4.2
8.0
13.3
13.9
14.1
41.5
39.3
Income tax provision (benefit)
0.9
1.1
(0.6)
2.3
8.4
2.8
5.5
2.9
7.8
Depreciation
2.1
3.2
4.3
7.5
8.4
8.8
8.8
16.1
16.0
Loss on debt extinguishment
-
-
-
-
-
24.0
-
-
25.2
Loss on acquisition of subsidiary
-
-
-
-
-
3.8
-
-
-
EBITDA
8.3
$
13.0
$
3.6
$
23.8
$
23.1
$
19.7
$
15.4
$
41.9
$
48.2
$
Share-based compensation expense
1.2
1.2
1.4
1.5
1.5
1.6
1.5
0.9
1.5
Adjusted EBITDA
9.5
$
14.2
$
5.0
$
25.3
$
24.6
$
21.3
$
16.9
$
42.8
$
49.7
$
Fiscal Quarter Ended, |