Attached files
| file | filename |
|---|---|
| EX-32.2 - EXHIBIT 32.2 - QUALSTAR CORP | ex32-2.htm |
| EX-32.1 - EXHIBIT 32.1 - QUALSTAR CORP | ex32-1.htm |
| EX-23.1 - EXHIBIT 23.1 - QUALSTAR CORP | ex23-1.htm |
| EX-31.2 - EXHIBIT 31.2 - QUALSTAR CORP | ex31-2.htm |
| EX-31.1 - EXHIBIT 31.1 - QUALSTAR CORP | ex31-1.htm |
SECURITIES AND EXCHANGE COMMISSION
Washington, D.C. 20549
FORM 10-K
|
þ
|
ANNUAL REPORT PURSUANT TO SECTION 13 OR 15(d) OF THE SECURITIES EXCHANGE ACT OF 1934
|
FOR THE FISCAL YEAR ENDED JUNE 30, 2011
OR
|
o
|
TRANSITION REPORT PURSUANT TO SECTION 13 OR 15(d) OF THE SECURITIES EXCHANGE ACT OF 1934
|
FOR THE TRANSITION PERIOD FROM TO
_______________
COMMISSION FILE NUMBER 000-30083
QUALSTAR CORPORATION
|
CALIFORNIA
|
95-3927330
|
|
(STATE OF INCORPORATION)
|
(I.R.S. ID NO.)
|
3990-B HERITAGE OAK COURT, SIMI VALLEY, CA 93063
(805) 583-7744
Securities registered pursuant to Section 12(b) of the Act:
|
Title of Each Class:
|
Name of Each Exchange on Which Registered:
|
|
Common Stock
|
The NASDAQ Stock Market LLC
|
Securities registered pursuant to Section 12(g) of the Act:
None
Indicate by check mark whether the registrant is well-known seasoned issuer, as defined in Rule 405 of the Securities Act of 1933. Yes o No þ
Indicate by check mark whether the registrant is not required to file reports required to be filed by Section 13 or 15(d) of the Securities Exchange Act of 1934. Yes o No þ
Indicate by check mark whether the registrant (1) has filed all reports required to be filed by Section 13 or 15(d) of the Securities Exchange Act of 1934 during the preceding 12 months (or for such shorter period that the registrant was required to file such reports); and (2) has been subject to such filing requirements for the past 90 days. Yes þ No o
Indicate by check mark whether the registrant has submitted electronically and posted on its website, if any, every Interactive Data File required to be submitted and posted pursuant to Rule 405 of Regulation S-T (§232.405 of this chapter) during the preceding 12 months (or for such shorter period that the registrant was required to submit and post such files). Yes o No o
Indicate by check mark if disclosure of delinquent filers pursuant to Item 405 of Regulation S-K is not contained herein, and will not be contained, to the best of registrant’s knowledge, in definitive proxy or information statements incorporated by reference in Part III of this Form 10-K or any amendment to this Form 10-K. o
Indicate by check mark whether the registrant is a large accelerated filer, an accelerated filer, a non-accelerated filer, or a smaller reporting company. See definitions of “accelerated filer,” “large accelerated filer” and “smaller reporting company” in Rule 12b-2 of the Exchange Act. (Check one):
Large accelerated filer o Accelerated filer o Non-accelerated filer q Smaller reporting company þ
Indicate by check mark whether the registrant is a shell company (as defined in Exchange Act Rule 12b-2). Yes o No þ
As of December 31, 2010 (the last business day of the registrant’s most recently completed second fiscal quarter), the aggregate market value of the common equity held by non-affiliates of the registrant was approximately $14,550,000 based on the closing sales price as reported on the NASDAQ Stock Market. As of August 8, 2011, there were 12,253,117 shares of common stock without par value outstanding.
DOCUMENTS INCORPORATED BY REFERENCE
Portions of registrant’s definitive proxy statement for its annual meeting of shareholders to be held in 2012 are incorporated by reference into Part III of this Form 10-K.
QUALSTAR CORPORATION
FORM 10-K
FOR THE FISCAL YEAR ENDED JUNE 30, 2011
INDEX
|
PART I
|
||
|
Item 1.
|
Business
|
4
|
|
Executive Officers of the Registrant
|
13
|
|
|
Item 1A.
|
Risk Factors
|
13
|
|
Item 1B.
|
Unresolved Staff Comments
|
21
|
|
Item 2.
|
Properties
|
21
|
|
Item 3.
|
Legal Proceedings
|
21
|
|
Item 4.
|
[Reserved]
|
21
|
|
PART II
|
||
|
Item 5.
|
Market for Registrant’s Common Equity, Related Stockholder Matters, and Issuer Purchases of Equity Securities
|
22
|
|
Item 6.
|
Selected Financial Data
|
23
|
|
Item 7.
|
Management’s Discussion and Analysis of Financial Condition and Results of Operations
|
25
|
|
Item 7A.
|
Quantitative and Qualitative Disclosures about Market Risk
|
31
|
|
Item 8.
|
Financial Statements and Supplementary Data
|
31
|
|
Item 9.
|
Changes in and Disagreements with Accountants on Accounting and Financial Disclosure
|
50
|
|
Item 9A(T).
|
Controls and Procedures
|
50
|
|
Item 9B.
|
Other Information
|
50
|
|
PART III
|
||
|
Item 10.
|
Directors, Executive Officers and Corporate Governance
|
51
|
|
Item 11.
|
Executive Compensation
|
51
|
|
Item 12.
|
Security Ownership of Certain Beneficial Owners and Management and Related Stockholder Matters
|
51
|
|
Item 13.
|
Certain Relationships and Related Transactions, and Director Independence
|
51
|
|
Item 14.
|
Principal Accountant Fees and Services
|
51
|
|
PART IV
|
||
|
Item 15.
|
Exhibits and Financial Statement Schedules
|
52
|
|
Signatures
|
53
|
|
|
Exhibit Index
|
54
|
2
FORWARD-LOOKING STATEMENTS
This Annual Report on Form 10-K contains forward-looking statements within the meaning of Section 27A of the Securities Act of 1933 and Section 21E of the Securities Exchange Act of 1934. Forward-looking statements inherently are subject to risks and uncertainties, some of which we cannot predict or quantify. Our actual results may differ materially from the results projected in the forward-looking statements. Factors that might cause such a difference include, but are not limited to, those discussed in “ITEM 1A — Risk Factors,” and in “ITEM 7 — Management’s Discussion and Analysis of Financial Condition and Results of Operations.” You generally can identify forward-looking statements by the use of forward-looking terminology such as “believes,” “may,” “will,” “expects,” “intends,” “estimates,” “anticipates,” “plans,” “seeks,” or “continues,” or the negative thereof or variations thereon or similar terminology. Forward-looking statements also include the assumptions underlying or relating to any such statements. Forward-looking statements contained within this document represent a good-faith assessment of Qualstar’s future performance for which management believes there is a reasonable basis. Qualstar disclaims any obligation to update the forward looking statements contained herein, except as may be required by law.
3
PART I
ITEM 1. BUSINESS
INTRODUCTION
We design, develop, manufacture and sell automated magnetic tape libraries used to store, retrieve and manage electronic data primarily in network computing environments. Tape libraries consist of cartridge tape drives, tape cartridges and robotics to move the cartridges from their storage locations to the tape drives under software control. Our tape libraries provide data storage solutions for organizations requiring backup, recovery and archival storage of critical data. Our products are compatible with commonly used operating systems, including UNIX, Windows, and Linux. Our tape libraries are also compatible with a wide range of storage management software packages, such as those supplied by CA Technologies, EMC, IBM, Symantec, CommVault Systems and Quest Software.
We sell our tape libraries worldwide, primarily to value added resellers. These customers typically integrate our tape libraries with software from third party vendors and related hardware such as servers and network components to provide complete storage solutions, which are then sold to end users. We configure our libraries based on each customer’s individual requirements, with a normal delivery time of one to five working days. This rapid fulfillment of customer orders allows our resellers to minimize their inventory levels and allows us to compete effectively with our competitors that use other distribution channels.
We also design, manufacture and sell high efficiency open-frame switching power supplies. Our power supplies are used to convert common alternating current (AC) line voltages found in buildings to direct current (DC) voltages that are needed internally to operate most electronic equipment. We also manufacture and sell a series of DC-to-DC power supplies that convert one DC voltage to another DC voltage.
We entered the power supply business in 2002, when we purchased the assets of N2Power, Incorporated. Power supplies provided by our N2Power division are utilized within most of our tape library products as well as sold to original equipment manufacturers and contract manufacturers for incorporation into their products. N2Power products are sold under the N2Power brand name as well as under a private label brand name through independent sales representatives and distributors.
Tape libraries and power supplies comprise Qualstar’s two operating segments. Revenues from our tape library segment represented approximately 53.8% of our revenues for fiscal 2011, approximately 62.1% of our revenues for fiscal 2010, and approximately 69.0% of revenues for fiscal 2009. Revenues from our power supply segment represented approximately 46.2% of our revenues for fiscal 2011, approximately 37.9% of our revenues for fiscal 2010, and approximately 31.0% of revenues for fiscal 2009.
Qualstar was incorporated in California in 1984.
DATA STORAGE INDUSTRY BACKGROUND
Storing, managing and protecting data has become critical to the operation of many enterprises and governments as the world economy becomes increasingly information dependent. The data storage industry is reacting in response to the increase in the amount of data that is generated and that must be preserved. The amount of data has been increasing due to the growth in the number of computers, the number, size and complexity of computer networks and software applications, and the emergence of new applications. In addition, businesses continue to generate increasing amounts of traditional business information with respect to their products, customers and financial data. This increase in data stimulates increases in the demand for data storage and the management of this data.
FACTORS DRIVING GROWTH IN DATA STORAGE
|
|
•
|
Increased demand from Internet businesses. The growth in the Internet has created businesses that depend on the creation, access to and archival storage of data. We believe this demand will continue to grow as individuals and businesses increase their reliance on the Internet for communications and commerce.
|
|
|
•
|
Growth in new types of data. New types of data are also fueling the growth in data storage. For example, graphics, audio, video and medical images, and multi-media uses such as video archiving, require far greater storage capacity than text and financial data.
|
4
|
|
•
|
Recognition of the critical importance of data. Corporate databases contain useful information about customer records, order patterns and other factors that can be analyzed and transformed into a valuable asset and a competitive advantage. The ability to efficiently store, manage and protect this information is important to the success of many businesses. The usefulness of past and present data is further enhanced by sophisticated data mining software applications that can analyze large databases.
|
|
|
•
|
Need for disaster protection. Companies recognize that loss of data may threaten their survival. Natural disasters, as well as overt and covert actions targeted at individual companies or classes of users, can destroy data, threatening a company’s very existence. Systematic replication and secure off-site storage of this data is recognized as an important defense against catastrophic loss. Tape libraries are a key technology in most corporate disaster protection plans.
|
|
|
•
|
Compliance with regulatory requirements for records retention. Many businesses must deal with regulatory requirements from various governmental agencies that require businesses to retain data for specific periods of time. The regulations that have received the most visibility in the United States include HIPAA requirements covering medical records; and Rule 17a under the Securities Exchange Act of 1934, regarding recordkeeping requirements for the securities industry. These regulations and others are projected to sustain the demand for long-term storage. This requirement to retain records is not unique to the United States, but is global in nature.
|
|
|
•
|
Growth in network computing applications and data. The use of computer networks has shifted critical information and applications to network servers to allow more people to gain access to stored data. As the speed of network computing has increased, numerous new applications have become feasible that generate progressively more data. Organizations are increasingly aware of the need to protect this data, as networks become a mission-critical element of many operations.
|
|
|
•
|
Decrease in the costs of storing data. The costs of data storage have decreased with advances in technology and improved manufacturing processes. We expect these costs to continue to decrease. The decrease in the cost of data storage encourages the storage of more data and makes it more cost effective to simply add more storage capacity than to remove old data, which in the past may have been purged periodically due to cost constraints.
|
|
|
• Electrical efficiency of tape-based data storage. Data stored on tape requires considerably less electrical energy as compared to data stored on rotating disks. As energy costs increase, we believe that the electrical efficiency will become a more important factor in the selection of storage methods.
|
TYPES OF DATA STORAGE
Current non-volatile storage solutions are based primarily on two technologies: magnetic disk and magnetic tape. These technologies represent a compromise among a variety of competing factors including capacity, cost, speed, portability and data reliability. Magnetic tapes are removable, which allows them to be transported easily to an off-site location for security or protection from physical harm. Magnetic disks provide faster access to stored data and generally are used when speed is important. Less frequently used data is often migrated from magnetic disk to tape. Tape libraries provide an online solution, where less frequently used data files are stored on tape at substantially lower cost compared to disk while still providing online access.
TAPE LIBRARIES AND APPLICATIONS
Tape libraries automate the tape loading process, eliminate errors induced by human operators, and enhance security compared to tapes that must be retrieved and loaded manually. Tape libraries can also be operated from remote locations around the clock, thus, eliminating the need for an operator. Automated tape libraries are a key component in a company’s overall storage solution and data protection strategy when large amounts of data are involved.
Tape drives and tape media are the two key components of tape libraries. The cost per unit of data capacity of tape drives and tape media continue to decline with advances in technology. As prices decline, new applications for automated storage become justified, further increasing the number of applications that can benefit from the use of tape libraries. We believe that continued technological improvements in tape drives and tape media will continue to reduce overall storage costs in the future.
Current and emerging applications for tape libraries include:
|
|
•
|
Automated backup. Backup is the creation of a duplicate copy of current data for the purpose of recovering the data in the event the original is lost or damaged. An automated tape library, in conjunction with storage management software, can backup network data at any time without human intervention. A library with multiple tape drives can backup data using all of its drives simultaneously, thus significantly speeding up the recording process. Backup tapes can be removed from the library and stored in an off-site location for protection against a loss of the primary site.
|
5
|
|
•
|
Archiving. Archiving is the storage of data for historical purposes. When information is stored on tape, automated tape libraries, under application control, can catalog tapes for future retrieval and prevent unauthorized removal or corruption of data by using password or key lock protection. Archival tapes provide a historic record for use in fraud detection, audit, legal and other processes. Tape libraries are also used for archiving due to benefits offered by the tape medium, such as long-term data integrity, resistance to environmental contamination, ease of relocation and low cost.
|
|
|
•
|
Data Encryption. Recent generations of tape drives have incorporated built-in data encryption features that make the date unrecoverable without a 256 bit key (number) being provided to the tape drive along with the request. Three basic methods of encryption key management exist: the backup/recovery software can mange the keys and direct the drive to encrypt/decrypt via the normal command/data interface; the tape library can invoke encryption, manage, and supply the key to the drive via the drive’s serial interface; or an external key manager can supply keys to the tape drive driver in various host operating systems, which directs the drive to perform encryption and decryption via the interface. The end result is a flexible system providing considerable improvement in data security for tapes in transit or tapes stored in a remote location.
|
|
|
•
|
Image management. Storage-intensive applications such as satellite mapping and medical image management systems utilize tape libraries because of the cost advantage over traditional storage methods. X-ray images or MRI results, for instance, must frequently be kept on file for years. Storing a digitized image in a tape library costs considerably less than storing a film copy, and can be retrieved years later with the click of a mouse.
|
DISTRIBUTION OF TAPE LIBRARY PRODUCTS
The requirements for storage solutions vary depending on the size of an enterprise, the type of data generated and the amount of data to be stored. With the increased dependence on stored data, most organizations, regardless of their size, have a heightened need for storage solutions that integrate devices such as tape drives, tape libraries and storage management software. Those organizations with sufficient in-house information technology resources can rely on their internal infrastructure and expertise to design purchase and implement their own storage solutions. These organizations may elect to purchase equipment from distributors or directly from the original equipment manufacturers. Many organizations, however, do not have sufficient in-house resources but have the same need for data storage solutions. These organizations often look to value added resellers to design, supply and install their storage solutions.
Value added resellers develop and install storage solutions for enterprises that face complex storage needs but lack the in-house capability of designing and implementing the proper solution or have chosen to outsource these functions for other reasons. Typically, the value added reseller will select among a variety of different hardware technologies and software options, as well as provide installation and other services, to deliver a complete storage solution to the end user. Value added resellers require rapid turnaround of orders, custom configuration of tape libraries, drop shipment to their customer’s site and marketing and technical support.
OUR TAPE LIBRARY SOLUTIONS
We offer storage solutions that respond to the growing data management challenges facing businesses today, while addressing the unique needs of value added resellers.
We believe that high reliability is important to the end users of our products due to the critical nature of the data that is being stored, shorter time periods available for the back-up operations, and the operation of backup systems during hours when personnel may not be available to respond to problems. To address these concerns, we emphasize quality and reliability in the design, manufacturing and testing of our products, which reduce the potential for product failures and results in products that require little maintenance.
The technology utilized in automated tape libraries is continuously evolving due to advances in data recording methods, component cost reductions, advances in semiconductor and microprocessor technologies, and a general trend toward miniaturization in the electronics industry. This changing technology requires that we continuously develop and market new products to prevent our product lines from becoming obsolete.
Our tape libraries are compatible with over 40 third-party storage management software packages, including those supplied by CA Technologies, EMC, IBM, Symantec, CommVault and Quest Software. Storage management software enables network administrators to allocate the use of storage resources among user groups or tasks, to manage data from a central location, and to retrieve, transfer and backup data in multiple locations. We believe that storage management software is a crucial component of any automated storage installation, and lack of compatibility is a significant barrier to entry for new tape library competitors. To ensure compatibility, our engineers work with independent software vendors during the product development cycles. We do not need access to their software code to design our products. We maintain relationships with them by making tape libraries available so they can qualify their software to work with our tape libraries and by evaluating their software for compatibility with our tape libraries. We also support our relationships with them by keeping them informed about current and anticipated changes to our products.
6
STRATEGY
Tape Libraries
Our goal is to enhance our position as a supplier of automated tape libraries and to increase our market share in each of the product categories in which we compete. To achieve this goal, we intend to:
|
|
•
|
Focus our development efforts on higher margin product categories. In 2006 we began shipments of a newly developed library system referred to as the XLS family of products. The XLS expands the breadth of our product line into the enterprise-computing environment where tape capacities may range into the tens of thousands of tapes. We intend to continue to build on this product category with future product releases and enhancements in order to pursue this market segment where the potential margins are higher than we have traditionally enjoyed.
|
|
|
•
|
Focus on the value added reseller channel. We sell our products primarily through selected value added resellers who have a strong market presence, have demonstrated the ability to work directly with end users, and who maintain relationships with major vendors of storage management software. Because we market our products through this channel, we have implemented a variety of programs to support and enhance our relationships with our reseller partners. These programs are designed to benefit the reseller and increase the likelihood of selling our products. We intend to maintain our marketing presence in support of this channel. We conduct business with our value added resellers on an individual purchase order basis and no long-term purchase commitments are involved.
|
We believe that our experience, efficiency and control over the development and manufacture of new products are key factors in the successful execution of our strategy. We design our tape libraries with a high percentage of common parts, use quality components and minimize the number of moving parts. We utilize proprietary techniques in the design, production and testing of our libraries in order to simplify the manufacturing process and reduce our costs. We manufacture all of our tape automation products at a single facility and we control our inventory to provide rapid delivery to our customers. These steps allow us to design and efficiently bring to market new products in response to changing technology.
Power Supplies
Our strategy for the power supply business is to selectively pursue market opportunities where we can command a premium price for high-efficiency products rather than becoming a commodity supplier. As electronic devices continue to shrink in size, many designers must consider our high-density, high-efficiency approach. Our power supply products are made to our design and specifications by contract manufacturers in China.
PRODUCTS
Tape Libraries
We offer a number of tape library families, each capable of incorporating one or more tape drives, as summarized in the following table:
|
Product Family
|
Tape Drive
Technology
|
Range of Tape
Cartridges
|
Maximum Capacity
in Terabytes (1)
|
||||
|
TLS-8000
|
LTO
|
22 to 66
|
99 | ||||
|
RLS-8000
|
LTO
|
16 to 114
|
171 | ||||
|
XLS Series
|
LTO
|
160 to 9,639
|
14,500 | ||||
(1)A Terabyte is one million megabytes, or one thousand gigabytes. The table shows native capacity and excludes gains from data compression, which can increase capacity by more than 100%.
Our tape library families include a number of models that differ in storage capacity, price and features. Our libraries are installed in network computing environments ranging from small departmental networks to enterprise-wide networks supporting hundreds of users.
Our tape libraries generally contain one or more tape drives and from sixteen to thousands of tapes. We design our tape libraries for continuous, unattended operation. Multiple tape drives allow simultaneous access to different data files by different users on the network and increase the rate at which data can move on to, out of, or within the network. A library with multiple tape drives can back up data using multiple drives simultaneously, significantly speeding up the recording process. In our libraries, some tape cartridges are stored in removable magazines, allowing for easy bulk removal of the tapes. Our libraries also offer features such as barcode readers to scan cartridge labels and input/output ports for importing and exporting tapes under system control. Most of our library models are expandable in the field by increasing the number of tape storage positions. This feature provides the end user with the ability to increase data capacity as storage requirements grow.
7
We continue to develop and release new libraries to expand our product offerings to meet the changing demands of the marketplace. In addition, we continue to enhance and improve our existing products to maintain our competitive position.
Some of our tape libraries incorporate a number of specialized features that we believe improve reliability, serviceability and performance, including:
|
|
•
|
Rapid tape drive replacement. We design our libraries so that a tape drive can be replaced quickly without special tools. This feature minimizes the off-line time required when a tape drive must be replaced, and frequently avoids the high cost and delays of a service call.
|
|
|
•
|
Fibre Channel connectivity. We offer a Fibre Channel connection on all of our models for connection to Storage Area Networks and other high performance applications.
|
|
|
•
|
Closed-loop servo control. Our tape libraries use digital closed-loop servo systems to control robotic motion and to provide precise tape handling. This yields motion that is smooth, repeatable and highly reliable.
|
|
|
•
|
Brushless motors. Motors are a key component in any robotic system. We use only brushless electric motors in our tape libraries. Brushless motors provide longer life and less electrical noise compared to conventional brush-type motors.
|
|
|
•
|
Remote management. Many larger companies with global back-up requirements or disaster management programs require tape libraries that can be located off-site in various regions, but that must be administered from a single location. With our remote library manager, customers can put libraries anywhere in the world and manage them from a single administrative hub using a standard web browser.
|
Our RLS series of tape libraries are designed to fit efficiently in equipment racks and provide back-up capacity in as little as five standard rack height units, or a total of 8.75 inches of rack space. In addition, the RLS and XLS series are designed to support redundant power supplies, dual power line inputs and hot-swappable tape drives.
Our TLS series of tape libraries are designed to be freestanding units for applications where an equipment rack may not be available or where the library is purchased after the original installation and rack space may not be available.
Our XLS series of tape libraries is designed to be expandable from 160 to 9,639 tapes and is focused on the needs of large enterprises. The XLS product is feature rich and is intended to provide the customer with a highly reliable enterprise-class solution.
We also sell ancillary products related to our tape libraries, such as tape media, tape magazines, cables, bar code labels and internal equipment racks.
Power Supplies
In addition to tape libraries, we design and sell high efficiency, open frame switching power supplies. These power supplies are used to convert AC line voltage to DC as well as DC to DC for use in a wide variety of electronic equipment such as telecommunications equipment, servers, routers, switches, lighting and gaming devices.
Our power supplies are sold under the N2Power brand. We have specialized in units that are less than 1.5 inches high and that are optimized for high efficiency operation. The high efficiency allows the units to be operated in confined spaces without over-heating. These products are manufactured for us in China and sold to original equipment manufacturers (OEM) and contract manufacturers as well as to distributors.
8
We believe that as worldwide energy concerns and energy costs rise, our high efficiency approach will become more important. Additionally, these power supplies are utilized within most of our tape library products. We have developed a line of power supply products that deliver up to twice the power in half the space relative to competitors’ products. Manufacturers of servers, routers, switches, telecom gear, and other process-based equipment continuously pursue smaller, more powerful, and more efficient power sources for their equipment to remain competitive.
Each power supply undergoes a complete functional test and a multi hour burn-in to insure that every unit meets our stringent quality requirements. We believe our high efficiency design reduces loads on both power generating stations and air-conditioning systems. We offer standard models as well as unique custom-made variations on standard units as required by our OEM customers.
SALES AND MARKETING
Our international sales are currently directed from our corporate offices in Simi Valley, California. All of our international sales are denominated in U.S. dollars. Revenues from customers outside of North America were approximately $6.6 million, or 36.1% of revenues for fiscal 2011, $5.1 million, or 33.4% of revenues for fiscal 2010, and $4.7 million, or 26.4% of revenues for fiscal 2009.
Our sales are spread across a broad customer base. Two customers accounted for 13.8% and 11.9% of revenues in fiscal 2011. One customer accounted for 11.3% of revenues in fiscal 2010 and 12.5% of revenues in fiscal 2009.
Sales – Tape Libraries
We sell our tape library products primarily through value added resellers. We strive to develop relationships with resellers who have expertise in storage management applications, have established relationships with end users and the experience to understand and satisfy their customers’ storage systems requirements.
We believe that by selling directly to value added resellers, we have an advantage over competitors who will often sell directly to end users, thereby competing with their resellers. Some of the advantages of our strategy include the following:
|
|
•
|
Higher profit margins. Focusing on this channel, we achieve economies that result in higher profit margins to be shared by both the reseller and us.
|
|
|
•
|
Custom configurations. We offer custom configurations of our tape library products, such as private branding and non-standard options, on very short notice.
|
|
|
•
|
Channel conflicts avoided. We refer substantially all end user inquiries to our reseller partners. Frequently, our sales force will make end user visits with resellers to help close a pending sale.
|
|
|
•
|
Rapid delivery. We generally ship a product within one to five working days of confirming an order, rivaling the delivery time of competitors that use distributors to bring products to market.
|
Sales – Power Supplies
We sell our power supplies through a combination of outside sales representatives, who call primarily on large original equipment manufacturer customers and distributors, who fulfill smaller orders to satisfy small original equipment manufacturer customers and system builders. We drop ship a portion of our power supplies directly from our contract manufacturers to our customer’s contract manufacturers. Our in house sales and engineering teams are involved in the sales process starting from the initial customer contact to assure that the special needs and product modifications frequently required by original equipment manufacturer customers are satisfied.
Marketing – Tape Libraries
We support our tape library sales efforts with a variety of marketing programs designed to generate brand awareness, attract and retain qualified value added resellers and inform end users of the advantages of our products. We provide our resellers with a full range of marketing materials, including product specifications, sales literature, software connectivity information, product application notes and maintenance training.
9
We train our resellers to sell our products and to answer customers’ questions. We advertise and participate in trade shows. We display our products under the Qualstar brand name at some trade shows and participate in other trade shows in partnership with our principal suppliers and resellers. We support our marketing and customer support initiatives with websites that feature comprehensive marketing and product information. We conduct sales and technical training classes for our resellers. We also conduct various promotional activities for resellers such as cooperative advertising.
Marketing – Power Supplies
We support our power supply sales efforts by directly assisting our distributors and representatives with a variety of marketing tools aimed at individual projects. These activities include the use of print advertising, advertising on the Internet, trade shows, public relations, email and direct mailings. We support our marketing with websites that feature marketing and product technical information, product specifications and sales literature.
CUSTOMER SERVICE AND TECHNICAL SUPPORT
We believe that providing strong customer service and technical support is an important aspect of our business. Our customer service and technical support efforts consist of the following components:
Tape Libraries
|
|
•
|
Technical support. Our technical support personnel are available twenty-four hours per day. Technical support personnel are available to all customers at no charge by telephone and e-mail to answer questions and solve problems relating to our products. Our technical support personnel are trained in all aspects of our products. Our support staff is located at our headquarters in Simi Valley, California. We sell service contracts for on-site service of our tape libraries, which are primarily fulfilled by IBM Corporation in the United States and Canada and by Eastman Kodak S.A.R.L. in Europe.
|
|
|
•
|
Installation services. Our technical support personnel provide assistance to our resellers by traveling to the end user’s location to assist the reseller or end user with setup and installation on many of our larger library systems, such as the XLS series of products.
|
|
|
•
|
Training. We offer a training program on product setup and maintenance for end users, value added resellers, customer service and technical support personnel. We conduct training classes at our headquarters or remotely as required.
|
|
|
•
|
Warranty. We provide a three year advanced replacement warranty on all XLS, RLS and TLS models that includes replacement of components, or if necessary, complete libraries. XLS libraries sold in North America also include one year of onsite service. Customers may purchase extended advance replacement service coverage and on-site service if they are located in the United States, Canada and many countries within Europe. |
|
|
•
|
Sales engineering. Our engineers provide pre-sales support to our resellers, and post-sales support if necessary. Engineers typically become involved in more complex problem-solving situations involving interactions between our products, third-party software, network server hardware and the network operating systems. Engineers work with resellers and end users over the telephone and at an end user site as required.
|
Power Supplies
|
|
•
|
Technical support. Our technical support personnel are available during our business hours, Monday through Friday. Technical and engineering support personnel are available to all customers at no charge by telephone and e-mail to answer questions and solve problems relating to our products. Our technical support personnel are trained in all aspects of our products. Our support staff is located at our headquarters in Simi Valley, California.
|
|
|
•
|
Warranty. We provide a three year warranty on all power supplies that includes repair or if necessary, replacement of the power supply.
|
|
|
•
|
Sales engineering. Our engineers provide both pre and post-sales support to our representatives, distributors and customers. Engineers work with our customers over the telephone and at a customer site as required.
|
10
|
|
MANUFACTURING AND SUPPLIERS
|
|
|
Tape Libraries
|
We manufacture all of our tape libraries at our facility in Simi Valley, California. We operate our manufacturing on a single shift. However, if required, we have the ability to add additional shifts to increase our capacity.
To respond rapidly to orders, we build our tape libraries, perform full testing and then place the tape libraries in a holding area until an order is received. Once an order is confirmed, we remove the unit from the holding area, install tape drives and configure the unit to meet the specific requirements of the order, retest and then ship.
The manufacturing cycle to bring our libraries to a finished state is approximately five working days for our TLS and RLS libraries and approximately 30 working days for our XLS libraries. We believe that this process represents an effective way to control our inventory levels while maintaining the ability to fill specific orders in short lead times. We coordinate inventory planning and management with suppliers to match our production to market demand. Once we confirm an order, we generally ship the product within one to five working days. We believe this response time gives us a competitive edge. Because we fill the majority of our orders as they are received, our backlog generally is small and is not indicative of future revenues.
We carefully select our suppliers based on their ability to provide quality parts that meet our specifications. Inventory planning and management is coordinated with suppliers to match our production needs. We maintain an inventory of components that are off-the-shelf and others that are designed to our specifications.
IBM is our primary tape drive supplier. Tape drives are available only from a limited number of suppliers. Some of our suppliers compete with us by selling their own tape libraries. Any disruption in supplies of tape drives could delay shipments of our products.
Power Supplies
Our power supply products are made to our specifications by contract manufacturers in China. These manufacturers have been carefully selected based on their manufacturing capacity, quality controls and process controls. We also perform quality control testing on our products in our Simi Valley facility, where we maintain an inventory of power supplies for rapid order fulfillment.
COMPETITION
Tape Libraries
The market for automated tape libraries is competitive and characterized by changing technology. Our principal competitors in this market segment include Oracle Corporation, Quantum Corporation, Overland Storage, Inc., and SpectraLogic Corporation.
Key competitive factors include product features, reliability, durability, scalability and price. Barriers to entry in tape automation are relatively high. The markets for our products are characterized by significant price competition and we anticipate that our products will continue to face price pressure. We believe our tape libraries compete favorably overall with respect to many of these factors.
Power Supplies
Our power supply products compete in a number of markets focused on the needs of OEM and contract manufacturers. We have concentrated on supplying units that provide high electrical and high space efficiency as measured in watts out versus watts in, as well in watts of output per cubic inch. Our competitors in this market segment include TDK Lambda, Digital Power, Emerson XP Power and Power-One.
Key competitive factors include product features, small size, density, reliability, and efficiency. There are currently approximately 30 manufacturers that our products compete directly with in regards to power range, size, efficiency and price. Although we will continue to face price pressure and barriers to entry in progressively higher tier markets, we believe our power supplies compare well against such competitors.
RESEARCH AND DEVELOPMENT
Our research and development expenses were approximately $2.7 million in fiscal 2011, $3.2 million in fiscal 2010, and $3.3 million in fiscal 2009.
11
Tape Libraries
Our tape library research and development team consists of engineers who have data storage and related industry experience. We have developed over 46 separate tape library models for eleven different tape formats since entering the tape library business in 1995.
Our tape library product development efforts rely on the integration of multiple engineering disciplines to generate products that meet market needs in a competitive and timely fashion. Successful development of automated tape libraries requires the integration of mechanical design, electronic design, packaging, and firmware design into a single product. Product success also relies on the engineering group’s thorough knowledge of tape drive technology. Our engineers work closely with the tape drive manufacturers during the drive qualification cycle to assure that reliable tape library and tape drive combinations are brought to market. The design architecture of our tape libraries makes use of common parts across each product family, allowing us to develop and introduce new products quickly.
We also develop new products as we identify emerging market needs. Our sales, marketing, product development and engineering groups identify products to fulfill customer and marketplace needs. Our research and development group concentrates on leveraging previous engineering investments into new products. We leverage our electro-mechanical and electronic hardware technology from previous products into next generation designs.
Power Supplies
Our power supply development team continues to develop new power supply models and families in response to input from our customers. N2Power product development takes place at our corporate headquarters in Simi Valley, California.
The product development cycle involves circuit design, printed circuit board layouts, prototype testing, firmware development, safety agency and compliance testing and test equipment development. Environmental and compliance testing of our power supplies is conducted to assure that our products meet the environmental requirements of the market. Product testing is a substantial portion of our overall product development cost.
INTELLECTUAL PROPERTY
We rely on copyright protection of our firmware, as well as patent protection for some of our designs and products. We also rely on a combination of trademark, trade secret and other intellectual property laws to protect our proprietary rights. However, we do not believe our intellectual property provides significant protection from competition. We believe that, because of the rapid pace of technological change in the tape storage and power supply industries, patent, copyright, trademark and trade secret protection are less significant than factors such as market responsiveness, knowledge, ability and the experience of our personnel as well as timely new product introductions.
We enter into Employee Proprietary Information and Inventions Agreements with all employees and consultants to protect our technology and designs. However, we do not believe that such protection can preclude competitors from developing substantially equivalent products.
EMPLOYEES
As of June 30, 2011, we had 70 employees, including 22 in operations and manufacturing, 18 in research and development, 7 in customer service and technical support, 8 in sales and marketing, and 15 in administration and finance. We also employ a small number of temporary employees and consultants as needed. We are not a party to any collective bargaining agreement or other similar agreement. We believe that we have a good relationship with our employees.
AVAILABILITY OF SEC FILINGS
We file annual, quarterly and special reports, proxy statements and other information with the Securities and Exchange Commission. You can read our SEC filings over the Internet at the SEC’s website at http://www.sec.gov. We also make our SEC filings available free of charge through our Internet website as soon as reasonably practicable after we electronically file them with, or furnish them to, the SEC. Our website addresses are www.qualstar.com, www.n2power.com and www.topojojo.com. The reference to our website addresses does not constitute incorporation by reference into this report of the information contained at those sites.
12
EXECUTIVE OFFICERS OF THE REGISTRANT
Executive Officers
Officers are elected by and serve at the discretion of the board of directors. The executive officers of Qualstar as of August 31, 2011 are:
|
Name
|
Age
|
Position
|
|
William J. Gervais
|
68
|
Chief Executive Officer, President and Director
|
|
Nidhi H. Andalon
|
48
|
Vice President, Chief Financial Officer and Corporate Secretary
|
|
Robert K. Covey
|
64
|
Vice President of Marketing
|
|
Randy Johnson
|
53
|
Vice President and General Manager of N2Power division
|
Background
William J. Gervais is a founder of Qualstar and has been our President and a director since our inception in 1984, and was elected Chief Executive Officer in January 2000. From 1984 until January 2000, Mr. Gervais also served as our Chief Financial Officer. From 1981 until 1984, Mr. Gervais was President of Northridge Design Associates, Inc., an engineering consulting firm. Mr. Gervais was a co-founder, and served as Engineering Manager from 1976 until 1981, of Micropolis Corporation. Mr. Gervais earned a B.S. degree in Mechanical Engineering from California State Polytechnic University, Pomona in 1967.
Nidhi H. Andalon has been our Chief Financial Officer since January 2009. She was appointed Vice President on March 25, 2010 and Corporate Secretary on March 24, 2011. Ms. Andalon joined Qualstar’s finance department in January 2003 as a senior accountant, and was promoted to Assistant Controller in June 2004 and to Controller in October 2005. From 1996 to 1999, Ms. Andalon held the position of Assistant Treasurer for Underwriters Reinsurance Company. From 1993 to 1996, Ms. Andalon was employed by Ernst & Young, LLP, where she worked as a senior auditor and senior tax consultant. Ms. Andalon graduated with a B.B.A degree from the University of Michigan in 1984 and has been a Certified Public Accountant in the State of California since 1996.
Robert K. Covey has been our Vice President of Marketing since 1994. From 1986 to 1993 Mr. Covey was regional manager of ATG Cygnet, an optical disk library firm. From 1982 to 1985, Mr. Covey served as national sales manager at Micropolis Corporation, a former disk drive manufacturer. Mr. Covey attended Butler University and Bentley College from 1965 to 1968.
Randy Johnson has been our Vice President and General Manager of our N2Power division since March 25, 2010. Mr. Johnson joined Qualstar in 2002 as Business Unit Manager for our N2Power division. From 2000 to 2002, Mr. Johnson held the position of Vice President and Business Unit Manager for Flightware Ltd., a business solutions software company. From 1983 to 2000, Mr. Johnson was employed by Integrated Business Computers, a business computer manufacturer, where he held the position of Vice President of Sales and Marketing. Mr. Johnson graduated with a B.A. degree in Business and Political Science from Westmont College in 1980, and earned his M.B.A in Technology Management from the University of Phoenix in 1999.
ITEM 1A. RISK FACTORS
This Annual Report on Form 10-K contains forward-looking statements, as described at page 3 of this report under the caption “Forward-Looking Statements.” We believe that the risks described below are the most important factors that may cause our actual future results of operations to differ materially from the results projected in the forward-looking statements.
RISKS RELATED TO OUR BUSINESS
The principal risks applicable to our business in general are described below. Specific risks applicable to our tape library and power supply operating segments are described in the following subsections of Item 1A.
We have a limited number of executives. The loss of any single executive or the failure to hire and integrate capable new executives could harm our business.
13
The success of our business is tied closely to the managerial, engineering and business acumen of our existing executives. William J. Gervais, our President, has been largely responsible for the development of most of our tape libraries, has overseen our operations, and established and maintained our strategic relationships. We expect that he will continue these efforts for the foreseeable future. Our future success will also depend on our ability to attract, retain and motivate key executives and other key personnel, many of whom have been instrumental in developing new technologies and strategic plans. We may not be able to retain our existing personnel or attract additional qualified personnel in the future. However, our current dependence on a limited number of executives and other key personnel, for whom replacements may be difficult to find, entails a risk that we may not be able to supervise and manage our ongoing operations.
Our research and development spending may not yield results that justify the costs incurred.
In recent fiscal years we have spent substantial amounts for research and development. Our products and markets are technologically advanced and rapidly evolving, and we cannot be assured that these efforts will successfully provide us with new or upgraded products that will be competitive. If these programs are not successful, our investment in research and development will not yield corresponding benefits to us.
Our customers have the right to return our products in certain circumstances. An excessive number of returns may reduce our revenue or profitability.
Our customers have 30 days from the date of purchase to return products that do not conform to specifications or an end user’s requirements. We may otherwise allow product returns if we think that doing so maximizes the effectiveness of our sales channels and promotes our reputation for quality and service. Although we estimate and reserve for potential returns in our reported financial results, actual returns could exceed our estimates. If the number of returns exceeds our estimates, our financial results could be adversely impacted for the periods during which returns are made.
We may spend money pursuing sales that do not occur when anticipated or at all.
Original equipment manufacturer customers typically conduct significant evaluation, testing, implementation and acceptance procedures before they begin to market and sell new products. This evaluation process is lengthy and may range from six months to one year or more. This process is complex and may require significant sales, marketing, engineering and management resources on our part. The process becomes more complex as we simultaneously qualify our products with multiple customers or pursue large orders with a single customer. As a result, we may expend resources to develop customer relationships before we recognize any revenue from these relationships, if at all.
We sell a significant portion of our products to customers located outside the United States. Currency fluctuations and increased costs associated with international sales could make our products unaffordable in foreign markets, which would reduce our revenue or profitability.
Revenues from customers outside of North America were approximately 36.1% of revenue for fiscal 2011, 33.4% of revenue for fiscal 2010 and 26.4% of revenues for fiscal 2009. We believe that international sales will continue to represent a significant portion of our revenues. Our international sales subject us to a number of risks, including:
|
|
•
|
political and economic instability may reduce demand for our products, our ability to market our products in foreign countries, or our ability to obtain key components from suppliers;
|
|
|
•
|
although we denominate our international sales in U.S. dollars, currency fluctuations could make our products unaffordable to foreign purchasers or more expensive compared to those of foreign manufacturers;
|
|
|
•
|
restrictions on the export or import of technology may reduce or eliminate our ability to sell in certain markets;
|
|
|
•
|
greater difficulty of administering business overseas may increase the costs of foreign sales and support;
|
|
|
•
|
foreign governments may impose tariffs, quotas and taxes on our products; and
|
|
|
•
|
longer payment cycles typically associated with international sales and potential difficulties in collecting accounts receivable may reduce the profitability of foreign sales.
|
These risks may increase our costs of doing business internationally and reduce our revenue or profitability.
14
A failure to develop and maintain proprietary technology may negatively affect our business.
We rely on copyright protection of electronic circuits and our firmware, as well as patent protection for some of our designs and products. We also rely on a combination of trademark, trade secret, and other intellectual property laws and various contract rights to protect our proprietary rights. However, we do not believe our intellectual property rights provide significant protection from competition. As a consequence, these rights may not preclude competitors from developing products that are substantially equivalent or superior to our products. In addition, many aspects of our products are not subject to intellectual property protection and therefore can be reproduced by others.
Intellectual property infringement claims brought against us could be time consuming and expensive to defend.
In recent years, there has been a significant amount of litigation in the United States involving patents and other intellectual property rights. Qualstar is not currently directly involved in any intellectual property litigation or proceedings. In the future, we may become subject to claims or inquiries regarding our alleged unauthorized use of a third party’s intellectual property. An adverse outcome in litigation could force us to do one or more of the following:
|
|
•
|
stop selling, incorporating or using our products or services that use the challenged intellectual property;
|
|
|
•
|
subject us to significant liabilities to third parties;
|
|
|
•
|
obtain from the owners of the infringed intellectual property right a license to sell or use the relevant technology, which license may not be available on reasonable terms, or at all; or
|
|
|
•
|
redesign those products or services that use the infringed technology, which redesign may be either economically or technologically infeasible.
|
Whether or not an intellectual property litigation claim is valid, the cost of responding to it, in terms of legal fees and expenses and the diversion of management resources, could harm our business.
Our warranty reserves may not adequately cover our warranty obligations.
We have established reserves for the estimated liability associated with our product warranties. However, we could experience unforeseen circumstances where these or future reserves may not adequately cover our warranty obligations.
Our revenues and operating results may fluctuate unexpectedly from quarter to quarter, which may cause our stock price to decline.
Our quarterly revenues and operating results have fluctuated in the past, and are likely to vary significantly in the future due to several factors, including:
|
|
•
|
general economic conditions affecting spending for information technology;
|
|
|
•
|
increased competition and pricing pressures;
|
|
|
•
|
reductions in the size, delays in the timing, or cancellation of significant customer orders;
|
|
|
•
|
shifts in product or distribution channel mix;
|
|
|
•
|
the timing of the introduction or enhancement of products by us, our original equipment manufacturer customers or our competitors;
|
|
|
•
|
expansions or reductions in our relationships with distributors, value added reseller or original equipment manufacturer customers;
|
|
|
•
|
financial difficulties affecting our distributors, value added reseller or original equipment manufacturer customers that render them unable to pay amounts owed to us;
|
|
|
•
|
market acceptance of new and enhanced versions of our products;
|
15
|
|
•
|
new product developments by storage device manufacturers, such as disk drives, that could render our products less cost effective or less competitive;
|
|
|
•
|
the rates of growth or decline in the data storage market and the various segments within it;
|
|
|
•
|
timing and levels of our operating expenses;
|
|
|
•
|
availability of key components and performance of key suppliers; and
|
|
|
•
|
emerging new technologies such as “cloud” computing which could change the nature of or need for tape libraries.
|
We believe that period-to-period comparisons of our operating results may not necessarily be reliable indicators of our future performance. It is likely that in some future period our operating results will not meet your expectations or those of public market analysts.
Any unanticipated change in revenues or operating results is likely to cause our stock price to fluctuate since such changes reflect new information available to investors and analysts. New information may cause investors and analysts to revalue our stock and this, in the aggregate, may cause fluctuations in our stock price.
Our officers and directors could implement corporate actions that are not in the perceived best interests of our shareholders as a whole.
Our executive officers and directors own beneficially, in the aggregate, approximately 29.7% of our outstanding common stock as of June 30, 2011. As a result, these shareholders will be able to exercise significant control over all matters requiring shareholder approval, including the election of directors and approval of significant corporate transactions, which could delay or prevent someone from acquiring or merging with us. The interests of our officers and directors, when acting in their capacity as shareholders, may lead them to:
|
|
•
|
vote for the election of directors who agree with the incumbent officers’ or directors’ preferred corporate policy; or
|
|
|
•
|
oppose or support significant corporate transactions when these transactions further their interests as incumbent officers or directors, even if these interests diverge from their interests as shareholders per se and thus from the interests of other shareholders.
|
Some provisions of our charter documents may make takeover attempts difficult, which could depress the price of our stock and inhibit your ability to receive a premium price for your shares.
Our board of directors has the authority, without any action by the shareholders, to issue up to 5,000,000 shares of preferred stock and to fix the rights and preferences of such shares. In addition, our articles of incorporation and bylaws contain provisions that eliminate cumulative voting in the election of directors and require shareholders to give advance notice if they wish to nominate directors or submit proposals for shareholder approval. These provisions may have the effect of delaying, deferring or preventing a change in control, may discourage bids for our common stock at a premium over its market price and may adversely affect the market price, and the voting and other rights of the holders of our common stock.
Trading in our stock has been limited and our stock price has been volatile. Consequently, it may be difficult to sell your shares.
There has been very little trading in shares of our stock and some days it may not trade at all. This, as well as the factors listed below, has caused the price of our stock to be volatile. Consequently, it may be difficult to sell your shares of our stock at the price you paid for them or at a price equal to that quoted on The Nasdaq Stock Market. Factors that may cause our stock price to fluctuate in the future include:
|
|
•
|
quarterly variations in operating results, especially if they differ from our previously announced forecasts or forecasts made by analysts;
|
|
|
•
|
changes in or cancellation of our dividend payment policy;
|
|
|
•
|
our announcements of anticipated future revenues or operating results;
|
16
|
|
•
|
announcements concerning us, our competitors, our customers, or our industry;
|
|
|
•
|
the introduction of new technology or products by us or our competitors;
|
|
|
•
|
comments regarding us and the data storage market made by industry analysts or on Internet bulletin boards;
|
|
|
•
|
changes in earnings estimates by analysts or changes in accounting policies;
|
|
|
•
|
changes in product pricing policies by us or our competitors; and
|
|
|
•
|
changes in general economic conditions.
|
In addition, stock markets have experienced extreme price and volume volatility in recent years. This volatility has had a substantial effect on the market prices of securities of many smaller public companies for reasons frequently unrelated or disproportionate to the operating performance of the specific companies. These market fluctuations may adversely affect the market price of our common stock.
RISKS RELATED TO OUR TAPE LIBRARY BUSINESS
The principal risks applicable specifically to our tape library operating segment are described below.
Our principal competitors devote greater financial resources to developing, marketing and selling automated tape libraries. Consequently, we may be unable to maintain or increase our market share.
We face significant competition in developing and selling automated tape libraries. Rapid and ongoing changes in technology and product standards could quickly render our products less competitive, or even obsolete. We have significantly fewer financial, technical, manufacturing, marketing and other resources than many of our competitors and these limited resources may harm our business in many ways. For example, in the past several years our competitors have:
|
|
•
|
acquired other tape library companies;
|
|
|
•
|
increased the geographic scope of their market;
|
|
|
•
|
offered a wider range of tape library products; and
|
|
|
•
|
developed and acquired proprietary software and disk based products that operate in conjunction with their products and the products of their competitors.
|
In the future, our competitors may leverage their greater resources to:
|
|
•
|
develop, manufacture and market products that are less expensive or technologically superior to our products;
|
|
|
•
|
attend more trade shows and spend more on advertising and marketing;
|
|
|
•
|
reach a wider array of potential customers through a broader range of distribution channels;
|
|
|
•
|
respond more quickly to new or changing technologies, customer requirements and standards; or
|
|
|
•
|
reduce prices in order to preserve or gain market share.
|
We believe competitive pressures are likely to continue. We cannot guarantee that our resources will be sufficient to address this competition or that we will manage costs and adopt strategies capable of effectively utilizing our resources. If we are unable to respond to competitive pressures successfully, our prices and profit margins may fall and our market share may decrease.
17
Our lack of significant tape library segment order backlog makes it difficult to forecast future revenues and operating results.
We normally ship library products within a few days after orders are confirmed. Consequently, we do not have significant order backlog and a large portion of our revenues in each quarter result from orders we received during that quarter. Because backlog can be an important indicator of future revenues, our lack of backlog makes it more difficult to forecast our future revenues. Since our operating expenses are relatively fixed in the short term, unexpected fluctuations in revenues could negatively impact our quarterly operating results.
Our suppliers could reduce shipments of tape drives. If this occurs, we would be forced to curtail production, our revenues could fall and our market share could decline.
Automated tape libraries and related products, such as tape drives, represented approximately 36.3% of our revenues for fiscal 2011, 40.1% of our revenues for fiscal 2010, and 49.3% of our revenues for fiscal 2009. We depend on a limited number of third-party manufacturers to supply us with the tape drives that we incorporate into our automated tape libraries. Some tape drive manufacturers, including IBM Corporation, compete with us by also selling tape libraries. There can be no assurance that other tape drive manufacturers will not also begin to manufacture or sell libraries.
In the past, some of these suppliers have been unable to meet demand for their products and have allocated their limited supply among customers. If suppliers limit our supply of tape drives, we may be forced to delay or cancel shipments of our tape libraries. The major supplier risks we face are the following:
|
|
•
|
The LTO standard was developed by an industry consortium consisting of IBM, Hewlett Packard and Quantum Corporation. All three drive suppliers also sell automated tape libraries that utilize LTO tape drives and compete with our products. Therefore, even if we receive adequate allocation, it may be at a price that renders our products uncompetitive.
|
|
•
|
Our other suppliers have in the past been, and may in the future be, unable to meet our demand, including our needs for timely delivery, adequate quantity and high quality. We do not have long-term supply contracts with any of our significant suppliers. The partial or complete loss of any of our suppliers could result in lost revenue, added costs and production delays or could otherwise harm our business and customer relationships.
|
Our revenues could decline if we fail to execute our distribution strategy successfully.
We distribute and sell our automated tape libraries through value added resellers and intend to continue this strategy for the foreseeable future. Value added resellers integrate our tape libraries with products of other manufacturers and sell the combined products to their own customers. We currently devote, and intend to continue to devote, significant resources to develop and maintain these relationships. A failure to initiate, manage and expand our relationships with value added resellers could limit our ability to grow or sustain our current level of revenues.
Our focus on the distribution of our products through value added resellers poses the following risks:
|
|
•
|
we may reach fewer customers because we depend on value added resellers to market to end users and these value added resellers might fail to market effectively or fail to devote sufficient or effective sales, marketing and technical support to the sales of our products;
|
|
|
•
|
we may lose sales because many of our value added resellers sell products that compete with our products. These value added resellers may reduce their marketing efforts for our products in favor of products manufactured by our competitors;
|
|
|
•
|
our costs may increase as value added resellers generally require a higher level of customer support than do original equipment manufacturers; and
|
|
|
•
|
as the market for tape libraries matures, we expect that tape libraries designed for small and medium size businesses will not require the level of sales, marketing and technical support traditionally provided by value added resellers and, consequently, tape libraries for these customers will be increasingly sold through distribution channels rather than through value added resellers.
|
We do not have any exclusive agreements with our value added resellers, who purchase our products on an individual purchase order basis. If we lose important value added resellers or if they reduce their focus on our products or if we are unable to obtain additional value added resellers, our business could suffer.
18
We rely on tape technology for over half of our revenues. Our business will be harmed if demand for storage solutions using tape technology declines or fails to develop as we expect.
We will continue to be subject to the risk of a decrease in revenues if demand for tape-based storage products declines or if rising prices make it more difficult to sell them. If products incorporating other technologies gain comparable or superior market acceptance and competitive price advantage, our business, financial condition and operating results could be adversely and materially affected unless we successfully develop and market products incorporating the new technology.
If we fail to develop and introduce new products on a timely and cost-effective basis, or if our products do not contain the features required by the marketplace, we will eventually lose market share and sales to more innovative competitors.
The market for our products is characterized by changing technology and evolving industry standards. The future success of Qualstar will depend on our ability to anticipate changes in technology, to develop new and enhanced products on a timely and cost-effective basis, and to introduce, manufacture and achieve market acceptance of these new and enhanced products. In particular, our success will depend on increased market acceptance of our XLS family of automated tape libraries.
Development schedules for high technology products are inherently subject to uncertainty and there can be no assurance we will be able to meet our product development schedules or that our development costs will be within budgeted amounts. If the products or product enhancements developed are not deliverable due to technical problems, quality issues or component shortages, or if such products or product enhancements are not accepted by the marketplace or are unreliable, then our business, financial condition and results of operations may be materially adversely affected.
The introduction of new storage technologies or the adoption of an industry standard different than our current product standards could render our existing products obsolete.
We depend upon independent software vendors to provide storage management software that makes our tape libraries functional.
The utility of an automated tape library depends upon the storage management software, which supports the library and integrates it into the user’s computing environment to provide a complete storage solution. We do not develop and have no control over the development of this storage management software. Instead we rely on third party independent software vendors to develop and support this software. Accordingly, the continued development and future growth of the market for our products will depend partly upon the success of software vendors to meet the overall data storage and management needs of tape library purchasers and our ability to maintain relationships with these firms. We maintain relationships with them by:
|
|
•
|
supplying tape libraries so they can qualify their software to work with our tape libraries;
|
|
|
•
|
evaluating their software for compatibility with our tape libraries; and
|
|
|
•
|
keeping them informed as to current and contemplated changes to our products.
|
We may have to expend significant amounts of time and money defending or settling product liability claims arising from failures of our tape libraries.
Because our tape library customers use our products to store and backup their important data, we face potential liability if our products fail to perform. Although we maintain general liability insurance, our insurance may not cover potential claims of this type or may not be adequate to indemnify us for all liability that may be imposed. Any imposition of liability that is not covered by insurance or that exceeds our insurance coverage could reduce our profitability or cause us to discontinue operations.
Undetected flaws could increase our costs, reduce our revenues and divert resources from our core business needs.
Our tape libraries are complex. Despite our efforts to revise and update our manufacturing and test processes to address engineering and component changes, we may not be able to control and eliminate manufacturing flaws adequately. These flaws may include undetected software or hardware defects associated with:
|
|
•
|
a newly introduced product;
|
|
|
•
|
a new version of an existing product; or
|
19
|
|
•
|
a product that has been integrated into a network storage solution with the products of other vendors.
|
The variety of contexts in which errors may arise may make it difficult to identify the source of a problem. These problems may:
|
|
•
|
cause us to incur significant warranty, repair and replacement costs;
|
|
|
•
|
divert the attention of our engineering personnel from our product development efforts;
|
|
|
•
|
cause significant customer relations problems; or
|
|
|
•
|
damage our reputation.
|
To address these risks, we frequently revise and update manufacturing and test procedures to address engineering and component changes to our products. If we fail to adequately monitor, develop and implement appropriate test and manufacturing processes we could experience a rate of product failure that results in substantial shipment delays, repair or replacement costs or damage to our reputation. Product flaws may also consume our limited engineering resources and interrupt our development efforts. Significant product failures would increase our costs and result in the loss of future sales and be harmful to our business.
RISKS RELATED TO OUR POWER SUPPLY BUSINESS
The principal risks applicable specifically to our power supply operating segment are described below.
We primarily depend on two contract manufacturers for our power supplies. Loss of a supplier could harm our business.
The primary suppliers of our N2Power power supplies are located in China. If a manufacturer should be unable to deliver products to us on a timely basis or at all, our power supply business could be adversely affected. Though we have many years of favorable experience with these suppliers, there can be no assurance that circumstances might not change and compel one or both of these suppliers to curtail or terminate deliveries to us.
Long manufacturing lead times and parts shortages could result in delayed or lost sales, or excess inventory.
The use of contract manufacturers to manufacture our power supplies typically requires that we place production orders several months in advance of our expected need for the products. This requires that we accurately anticipate our product needs in order to be able to fulfill orders from our customers on a timely basis. If we are too conservative in our projected needs, we may not have sufficient inventory to sell to our customers, resulting in delayed or lost sales. If we are too optimistic in our projected needs, we may order too much product inventory, some of which may become obsolete before we find a customer for it. We have in the past, experienced shortages of some parts needed to manufacture our power supplies. This shortage of parts has increased lead-times and may do so in the future.
Price erosion may have a material adverse effect on our margins and profitability.
The majority of the power supply manufactures that we compete with have substantially more resources and more models available than we do. Additionally the power supply business is generally characterized by intense competition. There can be no assurances that a competitor will not choose to use its resources to under price our products in the market, thereby adversely affecting our revenues or margins.
Our principal competitors devote greater financial resources to developing, marketing and selling automated power supplies. Consequently, we may be unable to maintain or increase our market share.
We face significant competition in developing and selling power supplies. Rapid and ongoing changes in technology and product standards could quickly render our products less competitive, or even obsolete. We have significantly fewer financial, technical, manufacturing, marketing and other resources than many of our competitors and these limited resources may harm our business in many ways.
Undetected flaws could increase our costs, reduce our revenues and divert resources from our core business needs.
Despite our efforts to revise and update our manufacturing and test processes to address engineering and component changes, we may not be able to control and eliminate manufacturing flaws adequately. To address these risks, we frequently revise and update manufacturing and test procedures to address engineering and component changes to our products.
20
If we fail to adequately monitor, develop and implement appropriate test and manufacturing processes we could experience a rate of product failure that results in substantial shipment delays, repair or replacement costs or damage to our reputation. Product flaws may also consume our limited engineering resources and interrupt our development efforts. Significant product failures would increase our costs and result in the loss of future sales and be harmful to our business.
ITEM 1B. UNRESOLVED STAFF COMMENTS
None.
ITEM 2. PROPERTIES
Our headquarters, located in Simi Valley, California, consists of a single building containing approximately 57,000 square feet housing our manufacturing, sales and marketing, finance and administration and approximately two thirds of our engineering staff. Our lease on this facility expires in December 2015. Rent on this facility is $40,000 per month with a step-up of 3% annually.
We also lease approximately 4,300 square feet of office space in Boulder, Colorado, that houses our Advanced Development Group. Our lease on this facility expires in May 2012. Rent on this facility is $4,850 per month, with a step-up of 3% annually.
ITEM 3. LEGAL PROCEEDINGS
We are from time to time involved in various lawsuits and legal proceedings that arise in the ordinary course of business. At this time, we are not aware of any pending or threatened litigation against us that we expect will have a material adverse effect on our business, financial condition, and liquidity or operating results. Legal claims are inherently uncertain, however. We cannot assure you that we will not be adversely affected in the future by legal proceedings.
ITEM 4. RESERVED
21
PART II
ITEM 5. MARKET FOR REGISTRANT’S COMMON EQUITY, RELATED STOCKHOLDER MATTERS, AND
ISSUER PURCHASES OF EQUITY SECURITIES
Market Information
Qualstar’s common stock is traded on The NASDAQ Stock Market (NASDAQ Symbol — QBAK). The following table sets forth the high and low closing sale prices of our common stock as reported by NASDAQ, during the periods indicated:
|
Period
|
Date Range
|
High
|
Low
|
||||||
|
Fiscal 2011:
|
|||||||||
|
First Quarter
|
July 1 — September, 30, 2010
|
$ | 1.92 | $ | 1.40 | ||||
|
Second Quarter
|
October 1 — December 31, 2010
|
$ | 1.84 | $ | 1.54 | ||||
|
Third Quarter
|
January 1 — March 31, 2011
|
$ | 2.00 | $ | 1.65 | ||||
|
Fourth Quarter
|
April 1 — June 30, 2011
|
$ | 1.94 | $ | 1.68 | ||||
|
Fiscal 2010:
|
|||||||||
|
First Quarter
|
July 1 — September, 30, 2009
|
$ | 2.90 | $ | 1.87 | ||||
|
Second Quarter
|
October 1 — December 31, 2009
|
$ | 2.32 | $ | 1.65 | ||||
|
Third Quarter
|
January 1 — March 31, 2010
|
$ | 2.31 | $ | 1.82 | ||||
|
Fourth Quarter
|
April 1 — June 30, 2010
|
$ | 2.02 | $ | 1.54 | ||||
Holders
There were approximately 36 owners of record of Qualstar’s common stock as of August 8, 2011.
Dividend Policy
In fiscal year 2010 our Board of Directors declared the following cash dividends:
|
Declaration Date
|
Record Date
|
Payment Date
|
Dividend
per Share
|
Total Amount
|
||||||
|
Fiscal 2010:
|
||||||||||
|
August 28, 2009
|
September 18, 2009
|
September 28, 2009
|
$ | 0.06 | $ | 735,187.02 | ||||
|
November 4, 2009
|
December 1, 2009
|
December 10, 2009
|
$ | 0.06 | $ | 735,187.02 | ||||
No dividends were declared in fiscal year 2011. Any future determination to pay dividends will be at the discretion of the Company’s Board of Directors and will depend upon, among many other factors, the Company’s results of operations, financial condition, capital requirements and any contractual restrictions.
Recent Sales of Unregistered Securities
None
Purchases of Equity Securities by the Issuer and Affiliated Purchasers
None
Performance Graph
The following graph compares the total cumulative return to our shareholders on shares of Qualstar’s common stock during the five year period from July 1, 2006 through June 30, 2011, with the cumulative total returns of the Nasdaq Stock Market Composite Index and the Nasdaq Computer Manufacturers’ Index. The graph assumes that the value of the investment in Qualstar’s common stock and each index was $100.00 on July 1, 2006.
22
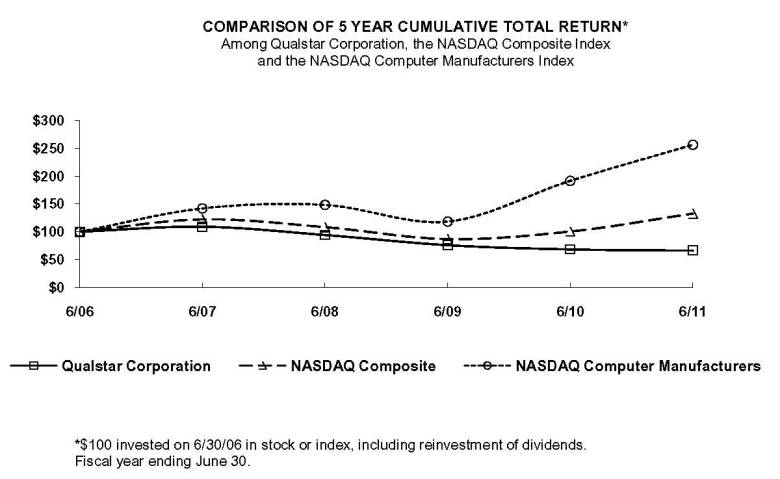
|
6/06
|
6/07
|
6/08
|
6/09
|
6/10
|
6/11
|
|
|
Qualstar Corporation
|
100.00
|
108.96
|
94.16
|
76.01
|
68.45
|
66.25
|
|
NASDAQ Composite
|
100.00
|
122.33
|
108.31
|
86.75
|
100.42
|
132.75
|
|
NASDAQ Computer Manufacturers
|
100.00
|
141.92
|
148.21
|
118.40
|
191.45
|
256.33
|
ADDITIONAL EQUITY COMPENSATION PLAN INFORMATION
The following table provides additional information regarding Qualstar’s equity compensation plans as of June 30, 2011:
|
Plan category
|
Number of securities to be issued upon exercise
of outstanding options,
warrants and rights
|
Weighted-average
exercise price
of outstanding options,
warrants and rights
|
Number of securities
remaining available
for future issuance
under equity
compensation plans
(excluding securities
reflected in column (a))
|
|||||||||
|
(a)(1)
|
(b)(1)
|
(c)(2)
|
||||||||||
|
Equity compensation plans approved by security holders
|
533,000 | $ | 3.80 | 500,000 | ||||||||
|
Equity compensation plans not approved by security holders
|
— | — | — | |||||||||
|
Totals
|
533,000 | $ | 3.80 | 500,000 | ||||||||
|
|
(1)
|
Includes shares subject to stock options granted under the 1998 Stock Incentive Plan as of June 30, 2011. The 1998 Stock Incentive Plan expired in 2008 and no further options may be granted under that plan.
|
|
|
(2)
|
Includes shares available for additional option grants under the 2008 Stock Incentive Plan as of June 30, 2011.
|
ITEM 6. SELECTED FINANCIAL DATA
The following selected financial data is qualified in its entirety by and should be read in conjunction with “Management’s Discussion and Analysis of Financial Condition and Results of Operations” and the financial statements and notes thereto included elsewhere in this 10-K. Our historical financial results are not necessarily indicative of results to be expected for any future period.
23
|
|
Years Ended June 30,
|
|||||||||||||||||||
|
|
2011
|
2010
|
2009
|
2008
|
2007
|
|||||||||||||||
|
(In thousands, except per share amounts)
|
||||||||||||||||||||
|
Statements of Operations Data:
|
||||||||||||||||||||
|
Net revenues
|
$ | 18,302 | $ | 15,270 | $ | 17,892 | $ | 21,464 | $ | 20,612 | ||||||||||
|
Cost of goods sold
|
11,573 | 10,626 | 12,190 | 14,043 | 14,092 | |||||||||||||||
|
Gross profit
|
6,729 | 4,644 | 5,702 | 7,421 | 6,520 | |||||||||||||||
|
Operating expenses:
|
||||||||||||||||||||
|
Research and development
|
2,744 | 3,150 | 3,254 | 3,100 | 3,136 | |||||||||||||||
|
Sales and marketing
|
2,327 | 2,294 | 2,767 | 3,184 | 3,110 | |||||||||||||||
|
General and administrative
|
2,534 | 2,632 | 3,155 | 3,390 | 3,168 | |||||||||||||||
|
Total operating expenses
|
7,605 | 8,076 | 9,176 | 9,674 | 9,414 | |||||||||||||||
|
Loss from operations
|
(876 | ) | (3,432 | ) | (3,474 | ) | (2,253 | ) | (2,894 | ) | ||||||||||
|
Investment income
|
191 | 311 | 918 | 1,517 | 1,477 | |||||||||||||||
|
Loss before income taxes
|
(685 | ) | (3,121 | ) | (2,556 | ) | (736 | ) | (1,417 | ) | ||||||||||
|
(Benefit) provision for income taxes
|
(5 | ) | - | 3 | 17 | 30 | ||||||||||||||
|
Net loss
|
$ | (680 | ) | $ | (3,121 | ) | $ | (2,559 | ) | $ | (753 | ) | $ | (1,447 | ) | |||||
|
Loss per share:
|
||||||||||||||||||||
|
Basic and Diluted
|
$ | (0.06 | ) | $ | (0.25 | ) | $ | (0.21 | ) | $ | (0.06 | ) | $ | (0.12 | ) | |||||
|
Shares used to compute loss per share:
|
||||||||||||||||||||
|
Basic and Diluted
|
12,253 | 12,253 | 12,253 | 12,253 | 12,253 | |||||||||||||||
|
|
Years Ended June 30,
|
|||||||||||||||||||
|
|
2011
|
2010
|
2009
|
2008
|
2007
|
|||||||||||||||
|
(In thousands)
|
||||||||||||||||||||
|
Balance Sheet Data:
|
||||||||||||||||||||
|
Cash and cash equivalents
|
$ | 4,970 | $ | 2,234 | $ | 3,749 | $ | 6,744 | $ | 7,697 | ||||||||||
|
Marketable securities
|
17,694 | 22,030 | 23,912 | 25,794 | 25,568 | |||||||||||||||
|
Working capital
|
21,940 | 19,569 | 27,081 | 23,883 | 25,152 | |||||||||||||||
|
Total assets
|
31,935 | 32,521 | 36,592 | 42,657 | 44,063 | |||||||||||||||
|
Shareholders’ equity
|
29,180 | 29,847 | 34,510 | 39,121 | 41,841 | |||||||||||||||
24
ITEM 7. MANAGEMENT’S DISCUSSION AND ANALYSIS OF FINANCIAL CONDITION AND RESULTS
OF OPERATIONS
The following discussion and analysis should be read in conjunction with our financial statements and notes thereto.
OVERVIEW
We design, develop, manufacture and sell automated magnetic tape libraries used to store, retrieve and manage electronic data primarily in network computing environments. We currently offer tape libraries utilizing the LTO tape drive technology.
Many enterprises now routinely manage very large databases, in addition to storing information on local desktop computers. This, coupled with the growth in the amount of data from new sources and applications, is increasing the need for managing and storing data efficiently. We have developed tape libraries spanning a range of prices, capacity and performance. We expect our products to continue to evolve in the future in response to emerging tape technologies and changing customer preferences.
We have developed a network of value added resellers who specialize in delivering complete storage solutions to end-users. End users of our products range from small businesses requiring simple automated backup solutions to large organizations needing complex storage management solutions. We assist our customers with marketing, sales and technical support.
Our international sales efforts are currently directed from our corporate offices in Simi Valley, California. All of our international sales are denominated in U.S. dollars. Net revenues from customers outside of North America were approximately $6.6 million, or 36.1% of revenues for fiscal 2011, $5.1 million, or 33.4% of revenues for fiscal 2010, and $4.7 million, or 26.4% of revenues for fiscal 2009.
We also design, develop and sell high-efficiency open-frame switching power supplies used in telecommunications equipment, servers, routers, switches, RAIDs, high-efficiency lighting and similar applications. Our power supplies are sold under the N2Power brand name through independent sales representatives and distributors. The primary customers are original equipment manufacturers and contract manufacturers. We also utilize these power supplies in our tape libraries.
Net revenues include revenues from the sale of tape libraries, tape drives, tape cartridges, ancillary products, and power supplies. Ancillary revenues include spare parts, service, repair, and on-site service agreements net of the cost of any third party service contracts. Revenues from our tape library segment represented approximately 53.8% of revenues in fiscal 2011, 62.1% of revenues in fiscal 2010, and approximately 69.0% of revenues in fiscal 2009. Revenues from our power supply segment represented approximately 46.2% of revenues in fiscal 2011, approximately 37.9% of revenues in fiscal 2010, and approximately 31.0% of revenues in fiscal 2009.
Gross margins depend on several factors, including the cost of manufacturing, product mix and the level of competition. Larger tape libraries generally provide higher gross margins than do smaller tape libraries.
Research and development activities include the design and development of new products, as well as enhancements to existing products.
CRITICAL ACCOUNTING POLICIES AND ESTIMATES
Our discussion and analysis of our financial condition and results of operations is based upon our financial statements, which have been prepared in accordance with accounting principals generally accepted in the United States. The preparation of these financial statements requires us to make estimates and judgments that affect the reported amounts of assets, liabilities, revenues and expenses and related disclosure of contingent assets and liabilities. On an on-going basis, we evaluate our estimates, including those related to customer promotional offers, sales returns, bad debts, inventories, warranty costs, investments, and income taxes. We base our estimates on historical experience and on various other assumptions that are believed to be reasonable under the circumstances, the results of which form the basis for making judgments about the carrying values of assets and liabilities that are not readily apparent from other sources. Actual results may differ from these estimates under different assumptions or conditions.
We believe the following critical accounting policies affect our more significant judgments and estimates used in the preparation of our financial statements.
25
Revenue Recognition
Revenue is recognized in accordance with Accounting Standards Codification (“ASC”) 605, “Revenue Recognition,” when persuasive evidence of an arrangement exists, transfer of title has occurred, the prices is fixed or readily determinable, and collectability is reasonable assured. Title and risk of loss transfer to the customer when the product leaves our dock in Simi Valley, California, or another shipping location designated by us. In general, these customers are allowed to return the product, free of penalty, within thirty days of shipment, if the product does not meet the end user’s requirements.
We record an allowance for estimated sales returns based on past experience and current knowledge of our customer base. Our experience has been such that only a very small percentage of products are returned. Should our experience change, however, we may require additional allowances for sales returns.
Marketable Securities
Marketable securities consist primarily of high-quality U.S. corporate securities and U.S. federal government debt securities. Our marketable securities portfolio consists of short-term securities with original maturities of greater than three months from the date of purchase and remaining maturities of less than one year and long-term securities with original maturities of greater than one year and less than five years. Marketable securities are classified as available for sale and are recorded at fair value using the specific identification method; unrealized gains and losses are reflected in other comprehensive income until realized; realized gains and losses are included in earnings when the underlying securities are sold and are derived using the specific identification method for determining the cost of securities sold. If the credit ratings of the security issuers deteriorate or if normal market conditions do not return in the near future, we may be required to reduce the value of our investments through an impairment charge and reflect them as long-term investments.
Fair Value of Financial Instruments
We adopted ASC 820, “Fair Value Measurements and Disclosures” on July 1, 2008 for all financial assets and liabilities and nonfinancial assets and liabilities that are recognized or disclosed at fair value in the financial statements on a recurring basis (at least annually). ASC 820 defines fair value, establishes a framework for measuring fair value, and expands disclosures about fair value measurements.
ASC 820 defines fair value as the price that would be received upon sale of an asset or paid upon transfer of a liability in an orderly transaction between market participants at the measurement date and in the principal or most advantageous market for that asset or liability. The fair value should be calculated based on assumptions that market participants would use in pricing the asset or
liability, not on assumptions specific to the entity. In addition, the fair value of liabilities should include consideration of non-performance risk including our own credit risk.
In addition to defining fair value, ASC 820 expands the disclosure requirements around fair value and establishes a fair value hierarchy for valuation inputs. The hierarchy prioritizes the inputs into three levels based on the extent to which inputs used in
measuring fair value is observable in the market. Each fair value measurement is reported in one of the three levels that are determined by the lowest level input that is significant to the fair value measurement in its entirety. These levels are:
|
•
|
Level 1 – inputs are based upon unadjusted quoted prices for identical instruments traded in active markets. |
|
•
|
Level 2 – inputs are based upon quoted prices for similar instruments in active markets, quoted prices for identical or similar instruments in markets that are not active, and model-based valuation techniques for which all significant assumptions are observable in the market or can be corroborated by observable market data for substantially the full term of the assets or liabilities.
|
|
•
|
Level 3 – inputs are generally unobservable and typically reflect management’s estimates of assumptions that market participants would use in pricing the asset or liability. The fair values are therefore determined using model-based techniques that include option pricing models, discounted cash flow models, and similar techniques.
|
In general, and where applicable, we use quoted prices in active markets for identical assets to determine fair value. This pricing methodology applies to our Level 1 investments such as U.S. treasuries and agency securities and exchange-traded mutual funds. If quoted prices in active markets for identical assets are not available to determine fair value, then we use quoted prices for similar assets or inputs other than the quoted prices that are observable either directly or indirectly. These investments are included in Level 2 and consist primarily of corporate bonds, mortgage-backed securities, and certain agency securities. While we own certain mortgage-backed fixed income securities, our portfolio as of June 30, 2011 does not contain direct exposure to sub prime mortgages or structured vehicles that derive their value from sub prime collateral. Our mortgage-backed securities are collateralized by prime residential mortgages and carry a 100% principal and interest guarantee, primarily from Federal National Mortgage Association and Federal Home Loan Mortgage Corporation. Our asset-backed securities are senior tranches in regard to priority of principal repayment and are collateralized by predominantly prime-rated receivables on consumer credit card, automobile loan and utility rate reduction securities.
26
Allowance for Doubtful Accounts
We estimate our allowance for doubtful accounts based on an assessment of the collectability of specific accounts and the overall condition of accounts receivable. In evaluating the adequacy of the allowance for doubtful accounts, we analyze specific trade receivables, historical bad debts, customer credits, customer credit-worthiness and changes in customers’ payment terms and patterns. If the financial condition of our customers were to deteriorate, resulting in an impairment of their ability to make additional payments, then we may need to make additional allowances. Likewise, if we determine that we could realize more of our receivables in the future than previously estimated, we would adjust the allowance to increase income in the period we made this determination.
Inventory Valuation
We record inventories at the lower of cost or market value. We assess the value of our inventories periodically based upon numerous factors including expected product or material demand, current market conditions, technological obsolescence, current cost and net realizable value. If necessary, we write down our inventory for estimated obsolescence, potential shrinkage, or unmarketable inventory equal to the difference between the cost of inventory and the estimated market value based upon assumptions about future demand and market conditions. If technology changes more rapidly than expected, or market conditions become less favorable than those projected by management, additional inventory write-downs may be required.
Warranty Obligations
We provide for the estimated cost of product warranties at the time revenue is recognized. We engage in extensive product quality programs and processes, including active monitoring and evaluation of product failure rates, material usage and estimation of service delivery costs incurred in correcting a product failure. However, should actual product failure rates, material usage, or service delivery costs differ from our estimates, revisions to the estimated warranty liability would be required. Historically our warranty costs have not been significant.
Share-Based Compensation
Share-based compensation is accounted for in accordance with ASC 718, “Compensation – Stock Compensation.” We use the Black-Scholes option-pricing model to determine fair value of the award at the date of grant and recognize compensation expense over the vesting period. The inputs we use for the model require the use of judgment, estimates and assumptions regarding the expected volatility of the stock, the expected term the average employee will hold the option prior to the date of exercise, expected future dividends, and the amount of share-based awards that are expected to be forfeited. Changes in these inputs and assumptions could occur and actual results could differ from these estimates, and our results of operations could be materially impacted.
Accounting for Income Taxes
We estimate our tax liability based on current tax laws in the statutory jurisdictions in which we operate in accordance with ASC 740, “Income Taxes.” These estimates include judgments about deferred tax assets and liabilities resulting from temporary differences between assets and liabilities recognized for financial reporting purposes and such amounts recognized for tax purposes, as well as about the realization of deferred tax assets. We may recognize the tax benefit from an uncertain tax position only if it is more likely than not that the tax position will be sustained upon examination by the taxing authorities, based on the technical merits of the position. The tax benefits recognized in the financial statements from such a position should be measured based on the largest benefit that has a greater than 50% likelihood of being realized upon ultimate settlement. ASC 740 also provides guidance on derecognition of income tax assets and liabilities, classification of current and deferred income tax assets and liabilities, accounting for interest and penalties associated with tax positions, and income tax disclosures.
We maintain a valuation allowance to reduce our deferred tax assets due to the uncertainty surrounding the timing of realizing the benefits of net deferred tax assets in future years. We have considered future taxable income and ongoing prudent and feasible tax planning strategies in assessing the need for such a valuation allowance. In the event we were to determine that we would be able to realize all or part of our net deferred tax asset in the future, the valuation allowance would be decreased accordingly.
27
We may periodically undergo examinations by the federal and state regulatory authorities and the Internal Revenue Service. We may be assessed additional taxes and or penalties contingent on the outcome of these examinations. Our previous examinations have not resulted in any unfavorable or significant assessments.
We have net operating losses, capital losses, research and development credit and other carryforwards for tax purposes of $20.8 million at June 30, 2011 which expire between fiscal years 2013 and 2029, except for the state research and development credit, which has no limit on the carryforward period.
RESULTS OF OPERATIONS
The following table reflects, as a percentage of net revenues, statements of operations data for the periods indicated:
|
|
Years Ended June 30,
|
|||||||||||
|
|
2011
|
2010
|
2009
|
|||||||||
|
Net revenues
|
100.0 | % | 100.0 | % | 100.0 | % | ||||||
|
Cost of goods sold
|
63.2 | 69.6 | 68.1 | |||||||||
|
Gross margin
|
36.8 | 30.4 | 31.9 | |||||||||
|
Operating expenses:
|
||||||||||||
|
Research and development
|
15.0 | 20.6 | 18.2 | |||||||||
|
Sales and marketing
|
12.7 | 15.0 | 15.5 | |||||||||
|
General and administrative
|
13.8 | 17.2 | 17.6 | |||||||||
|
Loss from operations
|
(4.7 | ) | (22.4 | ) | (19.4 | ) | ||||||
|
Investment income
|
1.0 | 2.0 | 5.1 | |||||||||
|
Loss before provision for income taxes
|
(3.7 | ) | (20.4 | ) | (14.3 | ) | ||||||
|
Provision for income taxes
|
0.0 | 0.0 | 0.0 | |||||||||
| (3.7 | )% | (20.4 | )% | (14.3 | )% | |||||||
We have two operating segments for financial disclosure purposes: tape libraries and power supplies, as discussed in Footnote 11 to our financial statements. The following table summarizes our revenue by major product line and by operating segment:
|
|
Years Ended June 30,
|
|||||||||||
|
|
2011
|
2010
|
2009
|
|||||||||
|
Tape Library revenues:
|
||||||||||||
|
TLS
|
6.3 | % | 13.0 | % | 22.3 | % | ||||||
|
RLS
|
7.7 | % | 5.5 | % | 6.8 | % | ||||||
|
XLS
|
20.2 | % | 16.0 | % | 8.3 | % | ||||||
| 34.2 | % | 34.5 | % | 37.4 | % | |||||||
|
Other library revenues:
|
||||||||||||
|
Service
|
14.5 | % | 18.8 | % | 15.3 | % | ||||||
|
Media
|
2.1 | % | 5.6 | % | 11.9 | % | ||||||
|
Upgrades, Spares
|
3.0 | % | 3.2 | % | 4.4 | % | ||||||
|
Total library revenues
|
53.8 | % | 62.1 | % | 69.0 | % | ||||||
|
Power Supply revenues
|
46.2 | % | 37.9 | % | 31.0 | % | ||||||
| 100.0 | % | 100.0 | % | 100.0 | % | |||||||
Fiscal 2011 Compared to Fiscal 2010
Net Revenues. Net revenues were $18.3 million in fiscal 2011 as compared to $15.3 million in fiscal 2010. The increase of approximately $3.0 million, or 19.9% is attributed primarily to an increase of $0.3 million in sales of tape libraries and $2.7 million in sales of power supplies.
Tape Library Segment
Revenues attributed to our tape library segment were $9.8 million, or 53.8% of revenues in fiscal 2011, as compared to $9.5 million, or 62.1% of revenues in fiscal 2010. This increase in tape library revenues was due primarily to higher sales of our tape library products in the RLS and XLS product lines, partially offset by decreased revenues from our TLS product line, in conjunction with decreased sales of tape media and service revenue. We expect sales from our RLS product line to increase in fiscal 2012 as the RLS 8500 series generation of our tape library product line gains market acceptance.
28
Power Supply Segment
Revenues attributed to our power supply segment were $8.5 million, or 46.2% of revenues, in fiscal 2011 as compared to $5.8 million, or 37.9% of revenues, in fiscal 2010. The increase of $2.7 million, or 46.2%, was due to increased sales to original equipment manufacturers and distributors of an expanded power supply product line. We expect continued growth as a percentage of total sales in our power supply revenues during fiscal 2012.
Gross Profit. Gross profit was $6.7 million in fiscal 2011 as compared to $4.6 million in fiscal 2010. The increase of approximately $2.1 million, or 44.7%, is attributed to an increase in revenues, change in product mix, a decrease in inventory reserves, and higher absorption of labor and overhead.
Research and Development. Research and development expenses were $2.7 million in fiscal 2011, as compared to $3.2 million in fiscal 2010. The decrease of approximately $0.5 million, or 12.9%, is attributed primarily to decreases in compensation expense related to headcount reductions and prototype material expenses.
Sales and Marketing. Sales and marketing expenses were $2.3 million in fiscal 2011, comparable with $2.3 million in fiscal 2010.
General and Administrative. General and administrative expenses were $2.5 million in fiscal 2011 as compared to $2.6 million in fiscal 2010. The decrease of approximately $0.1 million, or 4.3%, is primarily due to decreases in compensation expense related to headcount reductions and accounting and investor relations expenses.
Investment Income. Investment income was $0.2 million in fiscal 2011, compared to $0.3 million in fiscal 2010. The decrease of approximately $0.1 million is attributed to lower rates in the current economic environment and a $1.6 million decrease in the principal balance of our cash, cash equivalents and marketable securities.
Benefit for Income Taxes. Benefit for income taxes was $5,000 in fiscal 2011.
Fiscal 2010 Compared to Fiscal 2009
Net Revenues. Net revenues were $15.3 million in fiscal 2010 as compared to $17.9 million in fiscal 2009. The decrease of approximately $2.6 million, or 14.7% is attributed primarily to a decrease of $2.8 million in sales of tape libraries, partially offset by an increase of $0.2 million in sales of power supplies.
Tape Library Segment
Revenues attributed to our tape library segment were $9.5 million, or 62.1% of revenues in fiscal 2010, as compared $12.3 million, or 69.0% of revenues in fiscal 2009. This decline in tape library revenues was due primarily to lower sales of our tape library products in the TLS and RLS product lines, partially offset by increased revenues from our XLS product line, in conjunction with decreased sales of tape media and miscellaneous products.
Power Supply Segment
Revenues attributed to our power supply segment were $5.8 million, or 37.9% of revenues, in fiscal 2010 as compared to $5.6 million, or 31.0% of revenues, in fiscal 2009. The increase of $0.2 million, or 4.2%, was due to increased sales to original equipment manufacturers and distributors of an expanded power supply product line.
Gross Profit. Gross profit was $4.6 million in fiscal 2010 as compared to $5.7 million in fiscal 2009. The decrease of approximately $1.0 million, or 18.6%, is attributed to a decrease in revenues, change in product mix, an increase in inventory adjustments and reserve, and lower absorption of labor and overhead.
Research and Development. Research and development expenses were $3.2 million in fiscal 2010, comparable with $3.3 million in fiscal 2009.
Sales and Marketing. Sales and marketing expenses were $2.3 million in fiscal 2010 as compared to $2.8 million in fiscal 2009. The decrease of approximately $0.5 million, or 17.1%, is attributed primarily to decreases in commissions, travel and entertainment, advertising and promotion expenses and compensation related to headcount reduction expenses.
General and Administrative. General and administrative expenses were $2.6 million in fiscal 2010 as compared to $3.2 million in fiscal 2009. The decrease of approximately $0.5 million, or 16.6%, is primarily due to a decrease in compensation expense related to headcount reductions, and reductions in investor relations, accounting and audit expenses.
29
Investment Income. Investment income was $0.3 million in fiscal 2010, compared to $0.9 million in fiscal 2009. The decrease of approximately $0.6 million is attributed to lower rates in the current economic environment and a $3.4 million decrease in the principal balance of our cash, cash equivalents and marketable securities.
Provision for Income Taxes. Provision for income taxes was $3,000 in fiscal 2009.
LIQUIDITY AND CAPITAL RESOURCES
Cash used in operating activities was $1.5 million in fiscal 2011, $1.7 million in fiscal 2010 and $2.0 million in fiscal 2009. Cash used in operating activities in fiscal 2011 relates primarily to our net loss for the year and an increase in accounts receivable and inventories, partially offset by an increase in accounts payable. Cash used in operating activities in fiscal 2010 relates primarily to our net loss for the year and an increase in accounts receivable, partially offset by a decrease in inventories and an increase in accounts payable. Cash used in operating activities in fiscal 2009 relates primarily to our net loss for the year and a decrease in accounts payable and other accrued liabilities, partially offset by a decrease in receivables and inventories.
Cash provided by investing activities was $4.2 million in fiscal 2011, $1.7 million in fiscal 2010 and $2.0 million in fiscal 2009. Cash provided by investing activities in all three fiscal years relates primarily to proceeds from the sale of marketable securities, partially offset by purchases of marketable securities.
Cash was not used in financing activities in fiscal 2011. Cash used in financing activities was $1.5 million in fiscal 2010 and $2.9 million for fiscal 2009. Cash used in financing activities in fiscal 2010 and 2009 relates to cash dividends declared on shares of our common stock.
As of June 30, 2011, we had $5.0 million in cash and cash equivalents and $17.7 million in marketable securities. We believe that our existing cash and cash equivalents and funds available from the sale of our marketable securities will be sufficient to fund our working capital and capital expenditure needs for at least the next 12 months. We may utilize cash to invest in businesses, products or technologies that we believe are strategic. We periodically evaluate other companies and technologies for possible investment by us. In addition, we have made and may in the future make investments in companies with whom we have identified potential synergies. However, we have no present commitments or agreements with respect to any material acquisition of other businesses or technologies.
SUMMARY OF CONTRACTUAL OBLIGATIONS AND COMMITMENTS
The following is a summary of our future payments due under contractual obligations as of June 30, 2011:
|
Year Ended June 30
|
Operating
Leases
|
Purchase
Obligations
|
Total
|
|||||||||
|
(In thousands)
|
||||||||||||
|
2012
|
539 | $ | 3,930 | 4,469 | ||||||||
|
2013
|
503 | — | 503 | |||||||||
|
2014
|
518 | — | 518 | |||||||||
|
2015
|
534 | — | 534 | |||||||||
|
2016
|
273 | — | 273 | |||||||||
| $ | 2,367 | $ | 3,930 | $ | 6,297 | |||||||
Purchase obligations in the table above represent the value of open purchase orders as of June 30, 2011. We believe that some of these obligations could be canceled for payment of a nominal penalty or no penalty; however, the amount of open purchase orders that could be canceled under such terms is difficult to quantify.
OFF-BALANCE SHEET ARRANGEMENTS
We do not have any off-balance sheet arrangements.
30
ITEM 7A. QUALITATIVE AND QUANTITATIVE DISCLOSURES ABOUT MARKET RISK
We are exposed to foreign currency and interest rate risks. Our financial results could be affected by changes in foreign currency exchange rates or weak economic conditions in foreign markets. As all sales are currently made in U.S. dollars, a strengthening of the dollar could make our products less competitive in foreign markets. Our interest income is sensitive to changes in the general level of U.S. interest rates, particularly since the majority of our investments are in shorter duration fixed income securities. We have no outstanding debt nor do we utilize derivative financial instruments. Therefore, no quantitative tabular disclosures are required.
ITEM 8. FINANCIAL STATEMENTS AND SUPPLEMENTARY DATA
|
|
Page
|
|
(1) Financial Statements
|
|
|
Report of Independent Registered Public Accounting Firm (SingerLewak LLP)
|
32
|
|
Balance Sheets
|
33
|
|
Statements of Operations
|
34
|
|
Statements of Shareholders’ Equity
|
35
|
|
Statements of Cash Flows
|
36
|
|
Notes to Financial Statements
|
37
|
31
Report of Independent Registered Public Accounting Firm
To the Board of Directors and Shareholders of Qualstar Corporation
We have audited the accompanying balance sheets of Qualstar Corporation (the “Company”) as of June 30, 2011 and 2010, and the related statements of operations, shareholders' equity, and cash flows for each of the three years in the period ended June 30, 2011. These financial statements are the responsibility of the Company's management. Our responsibility is to express an opinion on these financial statements based on our audits.
We conducted our audits in accordance with the standards of the Public Company Accounting Oversight Board (United States). Those standards require that we plan and perform the audit to obtain reasonable assurance about whether the financial statements are free of material misstatement. The Company is not required to have, nor were we engaged to perform an audit of its internal control over financial reporting. Our audit included consideration of internal control over financial reporting as a basis for designing audit procedures that are appropriate in the circumstances, but not for the purpose of expressing an opinion on the effectiveness of the Company’s internal control over financial reporting. Accordingly, we express no such opinion. An audit also includes examining, on a test basis, evidence supporting the amounts and disclosures in the financial statements, assessing the accounting principles used and significant estimates made by management, as well as evaluating the overall financial statement presentation. We believe that our audits provide a reasonable basis for our opinion.
In our opinion, the financial statements referred to above present fairly, in all material respects, the financial position of Qualstar Corporation as of June 30, 2011 and 2010, and the results of their operations and their cash flows for the years then ended in conformity with U.S. generally accepted accounting principles.
/s/ SingerLewak LLP
Los Angeles, California
August 31, 2011
32
QUALSTAR CORPORATION
BALANCE SHEETS
(In thousands)
|
|
June 30,
|
|||||||
|
|
2011
|
2010
|
||||||
|
ASSETS
|
||||||||
|
Current assets:
|
||||||||
|
Cash and cash equivalents
|
$ | 4,970 | $ | 2,234 | ||||
|
Marketable securities, short-term
|
10,713 | 12,033 | ||||||
|
Accounts receivable, net of allowance for doubtful accounts of $180 at
June 30, 2011 and $113 at June 30, 2010
|
3,005 | 2,829 | ||||||
|
Inventories, net
|
5,673 | 4,823 | ||||||
|
Prepaid expenses and other current assets
|
312 | 299 | ||||||
|
Total current assets
|
24,673 | 22,218 | ||||||
|
Property and equipment, net
|
232 | 260 | ||||||
|
Marketable securities, long-term
|
6,981 | 9,997 | ||||||
|
Other assets
|
49 | 46 | ||||||
|
Total assets
|
$ | 31,935 | $ | 32,521 | ||||
|
LIABILITIES AND SHAREHOLDERS’ EQUITY
|
||||||||
|
Current liabilities:
|
||||||||
|
Accounts payable
|
$ | 1,293 | $ | 1,225 | ||||
|
Accrued payroll and related liabilities
|
495 | 521 | ||||||
|
Other accrued liabilities
|
945 | 903 | ||||||
|
Total current liabilities
|
2,733 | 2,649 | ||||||
|
Other long-term liabilities
|
22 | 25 | ||||||
|
Commitments and contingencies
|
||||||||
|
Shareholders’ equity:
|
||||||||
|
Preferred stock, no par value; 5,000 shares authorized; no shares issued
|
— | — | ||||||
|
Common stock, no par value; 50,000 shares authorized, 12,253 shares issued
and outstanding as of June 30, 2011 and June 30, 2010
|
18,869 | 18,830 | ||||||
|
Accumulated other comprehensive income
|
38 | 64 | ||||||
|
Retained earnings
|
10,273 | 10,953 | ||||||
|
Total shareholders’ equity
|
29,180 | 29,847 | ||||||
|
Total liabilities and shareholders’ equity
|
$ | 31,935 | $ | 32,521 | ||||
See accompanying notes
33
QUALSTAR CORPORATION
STATEMENTS OF OPERATIONS
(In thousands, except per share amounts)
|
|
Year Ended June 30,
|
|||||||||||
|
|
2011
|
2010
|
2009
|
|||||||||
|
Net revenues
|
$ | 18,302 | $ | 15,270 | $ | 17,892 | ||||||
|
Cost of goods sold
|
11,573 | 10,626 | 12,190 | |||||||||
|
Gross profit
|
6,729 | 4,643 | 5,702 | |||||||||
|
Operating expenses:
|
||||||||||||
|
Research and development
|
2,744 | 3,150 | 3,254 | |||||||||
|
Sales and marketing
|
2,327 | 2,294 | 2,767 | |||||||||
|
General and administrative
|
2,534 | 2,632 | 3,155 | |||||||||
|
Total operating expenses
|
7,605 | 8,076 | 9,176 | |||||||||
|
Loss from operations
|
(876 | ) | (3,433 | ) | (3,474 | ) | ||||||
|
Investment income
|
191 | 311 | 918 | |||||||||
|
Loss before income taxes
|
(685 | ) | (3,121 | ) | (2,556 | ) | ||||||
|
(Benefit) provision for income taxes
|
(5 | ) | - | 3 | ||||||||
|
Net loss
|
$ | (680 | ) | $ | (3,121 | ) | $ | (2,559 | ) | |||
|
Loss per share:
|
||||||||||||
|
Basic and Diluted
|
$ | (0.06 | ) | $ | (0.25 | ) | $ | (0.21 | ) | |||
|
Shares used to compute loss per share:
|
||||||||||||
|
Basic and Diluted
|
12,253 | 12,253 | 12,253 | |||||||||
|
Cash dividends declared per common share
|
$ | 0.00 | $ | 0.12 | $ | 0.18 | ||||||
See accompanying notes
34
QUALSTAR CORPORATION
STATEMENTS OF SHAREHOLDERS’ EQUITY
(In thousands)
|
Accumulated
|
||||||||||||||||||||
|
Other
Comprehensive
|
||||||||||||||||||||
|
Common Stock
|
Income
|
Retained
|
||||||||||||||||||
|
Shares
|
Amount
|
(Loss)
|
Earnings
|
Total
|
||||||||||||||||
|
Balances at June 30, 2009
|
12,253 | $ | 18,798 | $ | 168 | $ | 15,544 | $ | 34,510 | |||||||||||
|
Stock based compensation
|
— | 32 | — | — | 32 | |||||||||||||||
|
Cash dividend on common shares
|
— | — | — | (1,470 | ) | (1,470 | ) | |||||||||||||
|
Comprehensive loss:
|
||||||||||||||||||||
|
Net loss
|
— | — | — | (3,121 | ) | (3,121 | ) | |||||||||||||
|
Change in unrealized loss on investments
|
— | — | (104 | ) | — | (104 | ) | |||||||||||||
|
Comprehensive loss
|
(3,225 | ) | ||||||||||||||||||
|
Balances at June 30, 2010
|
12,253 | $ | 18,830 | $ | 64 | $ | 10,953 | $ | 29,847 | |||||||||||
|
Stock based compensation
|
— | 39 | — | — | 39 | |||||||||||||||
|
Comprehensive loss:
|
||||||||||||||||||||
|
Net loss
|
— | — | — | (680 | ) | (680 | ) | |||||||||||||
|
Change in unrealized loss on investments
|
— | — | (26 | ) | — | (26 | ) | |||||||||||||
|
Comprehensive loss
|
(706 | ) | ||||||||||||||||||
|
Balances at June 30, 2011
|
12,253 | $ | 18,869 | $ | 38 | $ | 10,273 | $ | 29,180 | |||||||||||
See accompanying notes
35
QUALSTAR CORPORATION
STATEMENTS OF CASH FLOWS
(In thousands)
|
|
Year Ended June 30,
|
|||||||||||
|
|
2011
|
2010
|
2009
|
|||||||||
|
OPERATING ACTIVITIES:
|
||||||||||||
|
Net loss
|
$ | (680 | ) | $ | (3,121 | ) | $ | (2,559 | ) | |||
|
Adjustments to reconcile net loss to net cash (used in) provided by operating activities:
|
||||||||||||
|
Depreciation and amortization
|
129 | 172 | 228 | |||||||||
|
Provision for bad debts and returns, net
|
67 | 25 | 38 | |||||||||
|
Provision for inventory reserve
|
49 | 280 | 70 | |||||||||
|
Stock based compensation
|
39 | 32 | 93 | |||||||||
|
Loss (gain) on sale of securities
|
18 | 4 | (98 | ) | ||||||||
|
Changes in operating assets and liabilities:
|
||||||||||||
|
Accounts receivable
|
(243 | ) | (549 | ) | 619 | |||||||
|
Inventories
|
(898 | ) | 718 | 217 | ||||||||
|
Prepaid expenses and other assets
|
(20 | ) | 89 | 83 | ||||||||
|
Accounts payable
|
68 | 576 | (548 | ) | ||||||||
|
Accrued payroll and related liabilities
|
(26 | ) | 15 | (13 | ) | |||||||
|
Other accrued liabilities
|
42 | 11 | (150 | ) | ||||||||
|
Net cash used in operating activities
|
(1,455 | ) | (1,748 | ) | (2,032 | ) | ||||||
|
INVESTING ACTIVITIES:
|
||||||||||||
|
Purchases of equipment
|
(101 | ) | (71 | ) | (63 | ) | ||||||
|
Purchases of marketable securities
|
(10,443 | ) | (16,765 | ) | (30,201 | ) | ||||||
|
Proceeds from the sale of marketable securities
|
14,735 | 18,539 | 32,241 | |||||||||
|
Net cash provided by investing activities
|
4,191 | 1,703 | 1,977 | |||||||||
|
FINANCING ACTIVITIES:
|
||||||||||||
|
Cash dividends on common shares
|
- | (1,470 | ) | (2,940 | ) | |||||||
|
Net cash used in financing activities
|
- | (1,470 | ) | (2,940 | ) | |||||||
|
NET INCREASE (DECREASE) IN CASH AND CASH EQUIVALENTS
|
2,736 | (1,515 | ) | (2,995 | ) | |||||||
|
CASH AND CASH EQUIVALENTS, BEGINNING OF PERIOD
|
2,234 | 3,749 | 6,744 | |||||||||
|
CASH AND CASH EQUIVALENTS, END OF PERIOD
|
$ | 4,970 | $ | 2,234 | $ | 3,749 | ||||||
|
SUPPLEMENTAL CASH FLOW DISCLOSURES:
|
||||||||||||
|
Income taxes paid
|
$ | 12 | $ | 12 | $ | 11 | ||||||
See accompanying notes
36
QUALSTAR CORPORATION
NOTES TO FINANCIAL STATEMENTS
Note 1 – Accounting Policies
Business
Qualstar Corporation (“Qualstar”) was incorporated in California in 1984 to develop and manufacture IBM compatible 9-track reel-to-reel tape drives for the personal computer and workstation marketplaces. Commencing in 1995, Qualstar focused its efforts on designing, developing, manufacturing and selling automated magnetic tape libraries used to store, retrieve and manage electronic data primarily in the network computing environment. Tape libraries consist of cartridge tape drives, tape cartridges and robotics to move the tape cartridges from their storage locations to the tape drives under software control. Qualstar’s libraries provide storage solutions for organizations requiring backup, recovery, and archival storage of critical electronic information. Qualstar’s tape libraries are compatible with commonly used operating systems, including UNIX, Windows and Linux and a wide range of storage management software. Qualstar currently offers tape libraries utilizing the LTO tape drive technology.
In July 2002, Qualstar purchased the assets of N2Power, Incorporated, a supplier of ultra small high efficiency open frame switching power supplies. Power supplies are sold with the N2Power brand name as well as under a private label brand name to original equipment manufacturers.
Accounting Principles
The financial statements and accompanying notes are prepared in accordance with generally accepted accounting principles (“GAAP”) in the United States of America.
Principles of Consolidation
The Company’s wholly owned subsidiary, Qualstar Sales and Service Corporation, was liquidated and dissolved pursuant to a plan of dissolution which was adopted by the Company on June 30, 2009. Pursuant to the plan of dissolution, all assets of Qualstar Sales and Service Corporation were distributed to the Company, and all liabilities of Qualstar Sales and Service Corporation were assumed by the Company, effective June 30, 2009.
Estimates and Assumptions
Preparing financial statements requires management to make estimates and assumptions that affect the reported amounts of assets, liabilities, revenue, and expenses. Examples include estimates of loss contingencies, product life cycles and inventory obsolescence, bad debts, sales returns, stock-based compensation forfeiture rates; the potential outcome of future tax consequences of events that have been recognized in our financial statements or tax returns; and determining when investment impairments are other-than-temporary. Actual results and outcomes may differ from management’s estimates and assumptions.
Revenue Recognition
Revenue is recognized when persuasive evidence of an arrangement exists, delivery has occurred, the fee is fixed or determinable, and collectability is reasonably assured (less estimated returns, for which provisions are made at the time of sale) in accordance with Accounting Standards Codification (“ASC”) 605, “Revenue Recognition.” The provision for estimated returns is made based on known claims and estimates of additional returns based on historical data. Revenues from technical support services and other services are recognized at the time the services are performed. Revenues from service contracts entered into with third party service providers are recognized at the time of sale, net of costs.
Cash and Cash Equivalents
Qualstar classifies as cash equivalents only cash and those investments that are highly liquid, interest earning investments with maturity of three months or less from the date of purchase.
37
Marketable Securities
Marketable securities consist primarily of high-quality U.S. corporate securities and U.S. federal government debt securities. Our marketable securities portfolio consists of short-term securities with original maturities of greater than three months from the date of purchase and remaining maturities of less than one year and longer term securities with original maturities of greater than one year and less than five years. Marketable securities are classified as available for sale and are recorded at fair value using the specific identification method; unrealized gains and losses are reflected in other comprehensive income until realized; realized gains and losses are included in earnings when the underlying securities are sold and are derived using the specific identification method for determining the cost of securities sold. An $18,000 loss and a $4,000 loss from the sale of marketable securities were recorded in fiscal years 2011 and 2010, respectively. A $98,000 gain from the sale of marketable securities was recorded in fiscal year 2009. All of Qualstar’s marketable securities were classified as available-for-sale at June 30, 2011, 2010 and 2009.
The Company reviews its marketable securities for any potential investment impairments in accordance with ASC 320, “Investments – Debt and Equity Securities,” in order to determine if an impairment exists and if so, the classification of the impairment as “temporary” or “other-than-temporary.” A temporary impairment charge results in an unrealized loss being recorded in the other comprehensive income (loss) component of shareholders’ equity. An other-than-temporary impairment charge is recorded as a realized loss in the Statement of Operations and reduces net income (loss) for the applicable accounting period. The differentiating factors between temporary and other-than-temporary impairment are primarily the length of time and the extent to which the market value has been less than cost, the financial condition and near-term prospects of the issuer and the intent and ability of the Company to retain its investment in the issuer for a period of time sufficient to allow for any anticipated recovery in market value.
The Company does not believe any unrealized losses represent an other-than-temporary impairment based on our evaluation of available evidence as of June 30, 2011. We believe that our existing cash and short-term investments, and our expected operating cash flows will be sufficient to fund our working capital requirements, capital expenditures and other obligations for the foreseeable future and will not affect our ability to execute our current business plans. If the credit ratings of the security issuers deteriorate or if normal market conditions do not return in the near future, we may be required to reduce the value of our investments through an impairment charge and reflect them as long-term investments.
Concentration of Credit Risk, Other Concentration Risks and Significant Customers
Qualstar sells its products primarily through value added resellers located worldwide. Ongoing credit evaluations of customers’ financial condition are performed by Qualstar, and generally, collateral is not required. Potential uncollectible accounts have been provided for in the financial statements.
We are exposed to foreign currency and interest rate risks. Our interest income is sensitive to changes in the general level of U.S. interest rates, particularly since the majority of our investments are in shorter duration fixed income securities. We have no outstanding debt nor do we utilize auction rate securities or derivative financial instruments in our investment portfolio.
Our financial results could be affected by changes in foreign currency exchange rates or weak economic conditions in foreign markets. As all sales are currently made in U.S. dollars, a strengthening of the dollar could make our products less competitive in foreign markets. Sales outside of North America represented approximately 36.1% of net revenues in fiscal 2011, 33.4% of net revenues in fiscal 2010, and 26.4% of net revenues in fiscal 2009.
Revenues from Qualstar’s two largest customers totaled approximately 13.8% and 11.9% of revenues for the year ended June 30, 2011. Revenues from Qualstar’s largest customer totaled 11.3% of revenues for the year ended June 30, 2010 and 12.5% for the year ended June 30, 2009. At June 30, 2011, the two largest customers’ accounts receivable, net of specific allowance, totaled approximately 9.0% and 8.0% of net accounts receivable. At June 30, 2010, the largest customer’s accounts receivable, net of specific allowance, totaled approximately 10.1% of net accounts receivable. At June 30, 2009, the largest customer’s accounts receivable, net of specific allowances, totaled approximately 19.0% of net accounts receivable.
Suppliers
The primary suppliers of our power supplies segment, N2Power, are located in China. If a manufacturer should be unable to deliver products to us in a timely basis or at all, our power supply business could be adversely affected. Though we have many years of favorable experience with these suppliers, there can be no assurance that circumstances might not change and compel a supplier to curtail or terminate deliveries to us.
38
Allowance for Doubtful Accounts
The allowance for doubtful accounts reflects our best estimate of probable losses inherent in the accounts receivable balance. We determine the allowance based on known troubled accounts, historical experience, and other currently available evidence. Activity in the allowance for doubtful accounts was as follows (in thousands):
|
Description
|
Balance at
Beginning of
Period
|
Charged
to Costs
and
Expenses
|
Charged
to Other
Accounts
|
Deductions (1)
|
Balance at
End of
Period
|
|||||||||||||||
|
Year Ended June 30, 2011
|
$ | 113 | $ | 67 | $ | — | $ | — | $ | 180 | ||||||||||
|
Year Ended June 30, 2010
|
$ | 85 | $ | 25 | $ | — | $ | 3 | $ | 113 | ||||||||||
|
Year Ended June 30, 2009
|
$ | 82 | $ | 38 | $ | — | $ | (35 | ) | $ | 85 | |||||||||
|
(1)
|
Uncollectible accounts written off, net of recoveries.
|
Inventories
Inventories are stated at the lower of cost (first-in, first-out basis) or market. Cost includes materials, labor, and manufacturing overhead related to the purchase and production of inventories. We regularly review inventory quantities on hand, future purchase commitments with our suppliers, and the estimated utility of our inventory. If our review indicates a reduction in utility below carrying value, we reduce our inventory to a new cost basis.
Property and Equipment
Property and equipment are recorded at cost. Depreciation expense is computed using the straight-line method. Leasehold improvements are amortized over the shorter of the estimated useful life of the asset or the term of the lease. Estimated useful lives are as follows:
|
Machinery and equipment
|
5-7 years
|
|
Furniture and fixtures
|
5-7 years
|
|
Computer equipment
|
3-5 years
|
Expenditures for normal maintenance and repair are charged to expense as incurred, and improvements are capitalized. Upon the sale or retirement of property or equipment, the asset cost and related accumulated depreciation are removed from the respective accounts and any gain or loss is included in the results of operations.
Long-Lived Assets
Qualstar reviews the impairment of long-lived assets whenever events or changes in circumstances indicate the carrying amount of any asset may not be recoverable, in accordance with ASC 360, “Property, Plant and Equipment.” An impairment loss would be recognized when the estimated undiscounted future cash flows expected to result from the use of the asset and its eventual disposition is less than the carrying amount. If impairment is indicated, the amount of the loss to be recorded is based upon an estimate of the difference between the carrying amount and the fair value of the asset. Fair value is based upon discounted cash flows expected to result from the use of the asset and its eventual disposition and other valuation methods. There were no impairment losses of long-lived assets recognized during the periods presented.
Shipping and Handling Costs
Qualstar records all charges for outbound shipping and handling as revenue. All inbound shipping and fulfillment costs are classified as costs of goods sold.
Warranty Obligations
We provide a three year advanced replacement warranty on all XLS, RLS and TLS models that includes replacement of components, or if necessary, complete libraries. XLS libraries sold in North America also include one year of onsite service. Customers may purchase extended advance replacement service coverage and on-site service if they are located in the United States, Canada and most countries within Europe.
39
We provide a three year warranty on all power supplies that includes repair or if necessary, replacement of the power supply.
A provision for costs related to warranty expense is recorded when revenue is recognized, which is estimated based on historical warranty costs incurred. Customers may purchase extended advance replacement service coverage and on-site service if they are located in the United States, Canada and most countries within Europe.
Activity in the liability for product warranty (included in other accrued liabilities) for the periods presented are as follows (in thousands):
|
June 30,
|
||||||||
|
|
2011
|
2010
|
||||||
|
Beginning balance
|
$ | 156 | $ | 167 | ||||
|
Cost of warranty claims
|
(79 | ) | (65 | ) | ||||
|
Accruals for product warranties
|
121 | 54 | ||||||
|
Ending balance
|
$ | 198 | $ | 156 | ||||
Research and Development
All research and development costs are charged to expense as incurred. These costs consist primarily of engineering salaries, benefits, outside consultant fees, purchased parts and supplies directly involved in the design and development of new products, and facilities and other internal costs.
Advertising
Advertising and promotion expenses include costs associated with direct and indirect marketing, trade shows and public relations. Qualstar expenses all costs of advertising and promotion as incurred. Advertising and promotion expenses for the years ended June 30, 2011, 2010 and 2009 were approximately $321,000, $342,000, and $501,000, respectively.
Fair Value of Financial Instruments
We adopted ASC 820, “Fair Value Measurements and Disclosures” on July 1, 2008 for all financial assets and liabilities and nonfinancial assets and liabilities that are recognized or disclosed at fair value in the financial statements on a recurring basis (at least annually). ASC 820 defines fair value, establishes a framework for measuring fair value, and expands disclosures about fair value measurements.
ASC 820 defines fair value as the price that would be received upon sale of an asset or paid upon transfer of a liability in an orderly transaction between market participants at the measurement date and in the principal or most advantageous market for that asset or liability. The fair value should be calculated based on assumptions that market participants would use in pricing the asset or
liability, not on assumptions specific to the entity. In addition, the fair value of liabilities should include consideration of non-performance risk including our own credit risk.
In addition to defining fair value, ASC 820 expands the disclosure requirements around fair value and establishes a fair value hierarchy for valuation inputs. The hierarchy prioritizes the inputs into three levels based on the extent to which inputs used in
measuring fair value is observable in the market. Each fair value measurement is reported in one of the three levels that are determined by the lowest level input that is significant to the fair value measurement in its entirety. These levels are:
|
•
|
Level 1 – inputs are based upon unadjusted quoted prices for identical instruments traded in active markets.
|
|
•
|
Level 2 – inputs are based upon quoted prices for similar instruments in active markets, quoted prices for identical or similar instruments in markets that are not active, and model-based valuation techniques for which all significant assumptions are observable in the market or can be corroborated by observable market data for substantially the full term of the assets or liabilities.
|
|
•
|
Level 3 – inputs are generally unobservable and typically reflect management’s estimates of assumptions that market participants would use in pricing the asset or liability. The fair values are therefore determined using model-based techniques that include option pricing models, discounted cash flow models, and similar techniques.
|
40
In general, and where applicable, we use quoted prices in active markets for identical assets to determine fair value. This pricing methodology applies to our Level 1 investments such as U.S. treasuries and agency securities and exchange-traded mutual funds. If quoted prices in active markets for identical assets are not available to determine fair value, then we use quoted prices for similar assets or inputs other than the quoted prices that are observable either directly or indirectly. These investments are included in Level 2 and consist primarily of corporate bonds, mortgage-backed securities, and certain agency securities. While we own certain mortgage-backed fixed income securities, our portfolio as of June 30, 2011 does not contain direct exposure to sub prime mortgages or structured vehicles that derive their value from sub prime collateral. Our mortgage-backed securities are collateralized by prime residential mortgages and carry a 100% principal and interest guarantee, primarily from Federal National Mortgage Association and Federal Home Loan Mortgage Corporation. Our asset-backed securities are senior tranches in regard to priority of principal repayment and are collateralized by predominantly prime-rated receivables on consumer credit card, automobile loan and utility rate reduction securities.
Assets and Liabilities Measured at Fair Value on a Recurring Basis
The following table presents our assets and liabilities measured at fair value on a recurring basis at June 30, 2011 (in thousands):
|
June 30, 2011
|
Level 1
|
Level 2
|
Total
|
|||||||||
|
Assets
|
||||||||||||
|
Cash
|
$ | 865 | $ | – | $ | 865 | ||||||
|
Cash Equivalents
|
4,105 | – | 4,105 | |||||||||
|
U.S. government and agency securities
|
2,549 | 6,156 | 8,705 | |||||||||
|
Asset backed securities
|
– | 2,970 | 2,970 | |||||||||
|
Mortgage-backed securities
|
– | 2,833 | 2,833 | |||||||||
|
Corporate bonds
|
– | 3,185 | 3,185 | |||||||||
|
Total
|
$ | 7,519 | $ | 15,144 | $ | 22,663 | ||||||
|
June 30, 2010
|
Level 1
|
Level 2
|
Total
|
|||||||||
|
Assets
|
||||||||||||
|
Cash
|
$ | 737 | $ | – | $ | 737 | ||||||
|
Cash Equivalents
|
997 | – | 997 | |||||||||
|
Money Market Mutual fund
|
500 | – | 500 | |||||||||
|
U.S. government and agency securities
|
9,546 | 7,260 | 16,806 | |||||||||
|
Asset backed securities
|
– | 2,233 | 2,233 | |||||||||
|
Mortgage-backed securities
|
– | 637 | 637 | |||||||||
|
Corporate bonds
|
– | 2,354 | 2,354 | |||||||||
|
Total
|
$ | 11,780 | $ | 12,484 | $ | 24,264 | ||||||
The carrying amounts reported in the balance sheets for cash and cash equivalents, short-term marketable securities, accounts receivable and accounts payable approximate their fair values due to the short term nature of these financial instruments.
Share-Based Compensation
We account for share-based compensation in accordance with ASC 718, “Compensation – Stock Compensation.” In accordance with the provisions of ASC 718, share-based compensation cost is measured at the grant date based on fair value of the award and is recognized as expense over the applicable vesting period of the stock award (generally four years) using the straight-line method.
Income Taxes
Income taxes are accounted for using the liability method in accordance with ASC 740, “Income Taxes.” Under this method, deferred tax liabilities and assets are recognized for the expected future tax consequences of temporary differences between the financial statement and tax bases of assets and liabilities, and for the expected future tax benefit to be derived from tax credits and loss carryforwards. Current income tax expense or benefit represents the amount of income taxes expected to be payable or refundable for the current year. A valuation allowance is established when, in the opinion of management, it is more likely than not that some portion or all of the deferred tax assets will not be realized.
41
Comprehensive Income (Loss)
Comprehensive income (loss) includes unrealized gains and losses on debt and equity securities classified as available-for-sale and included as a component of shareholders’ equity.
Loss per Share
Basic earnings (loss) per share have been computed by dividing net loss by the weighted average number of common shares outstanding. Diluted earnings (loss) per share has been computed by dividing net loss by the weighted average common shares outstanding plus dilutive securities or other contracts to issue common stock as if these securities were exercised or converted to common stock.
The following table sets forth the calculation for basic and diluted loss per share for the periods indicated:
|
|
Year Ended June 30,
|
|||||||||||
|
|
2011
|
2010
|
2009
|
|||||||||
|
(In thousands)
|
||||||||||||
|
Loss:
|
||||||||||||
|
Net loss
|
$ | (680 | ) | $ | (3,121 | ) | $ | (2,559 | ) | |||
|
Shares:
|
||||||||||||
|
Weighted average shares for basic and diluted loss per share
|
12,253 | 12,253 | 12,253 | |||||||||
|
Loss per share
|
(0.06 | ) | (0.25 | ) | (0.21 | ) | ||||||
Shares issuable under stock options of 533,000, 573,000 and 623,000 for the years ended June 30, 2010, 2009 and 2008, respectively, have been excluded from the computation of diluted loss per share as the effect would be antidilutive.
Reclassifications
Certain prior year amounts have been reclassified to conform to the current year presentation.
Note 2 – Marketable Securities
The following table summarizes marketable securities by security type at June 30, 2011, and June 30, 2010, respectively (in thousands):
|
June 30, 2011
|
Amortized
Cost
|
Unrealized
Gain
|
Unrealized
Loss
|
Fair
Value
|
||||||||||||
|
US Treasury obligations and direct obligations of U.S. Government agencies
|
$ | 8,684 | $ | 21 | $ | — | $ | 8,705 | ||||||||
|
Government Sponsored Enterprise collateralized mortgage obligations
|
2,826 | 8 | (1 | ) | 2,833 | |||||||||||
|
Asset backed securities
|
2,964 | 6 | — | 2,970 | ||||||||||||
|
Corporate bonds
|
3,181 | 5 | — | 3,186 | ||||||||||||
|
Total
|
$ | 17,655 | $ | 40 | $ | (1 | ) | $ | 17,694 | |||||||
|
June 30, 2010
|
Amortized
Cost
|
Unrealized
Gain
|
Unrealized
Loss
|
Fair
Value
|
||||||||||||
|
US Treasury obligations and direct obligations of U.S. Government agencies
|
$ | 16,743 | $ | 63 | $ | — | $ | 16,806 | ||||||||
|
Government Sponsored Enterprise collateralized mortgage obligations
|
635 | 2 | — | 637 | ||||||||||||
|
Asset backed securities
|
2,229 | 4 | — | 2,233 | ||||||||||||
|
Corporate bonds
|
2,359 | — | (5 | ) | 2,354 | |||||||||||
|
Total
|
$ | 21,966 | $ | 69 | $ | (5 | ) | $ | 22,030 | |||||||
The following tables show the gross unrealized losses and fair value of the Company’s investments with unrealized losses that are not deemed to be other-than-temporarily impaired, aggregated by investment category and length of time that individual securities have been in a continuous unrealized loss position at June 30, 2011 and at June 30, 2010.
42
|
Less Than 12 Months
|
12 Months or Greater
|
Total
|
||||||||||||||||||||||
|
June 30, 2011
|
Fair
Value
|
Unrealized
Loss
|
Fair
Value
|
Unrealized
Loss
|
Fair
Value
|
Unrealized
Loss
|
||||||||||||||||||
|
(In thousands)
|
||||||||||||||||||||||||
|
Government Sponsored Enterprise
collateralized mortgage obligations
|
187 | (1 | ) | 2,646 | — | 2,833 | (1 | ) | ||||||||||||||||
|
Total
|
$ | 187 | $ | (1 | ) | $ | 2,646 | $ | — | $ | 2,833 | $ | (1 | ) | ||||||||||
| Less Than 12 Months | 12 Months or Greater |
Total
|
||||||||||||||||||||||
|
June 30, 2010
|
Fair
Value
|
Unrealized
Loss
|
Fair
Value
|
Unrealized
Loss
|
Fair
Value
|
Unrealized
Loss
|
||||||||||||||||||
|
(In thousands)
|
||||||||||||||||||||||||
|
Corporate bonds
|
1,070 | (3 | ) | 1,284 | (2 | ) | 2,354 | (5 | ) | |||||||||||||||
|
Total
|
$ | 1,070 | $ | (3 | ) | $ | 1,284 | $ | (2 | ) | $ | 2,354 | $ | (5 | ) | |||||||||
The following tables summarize the contractual maturities of the Company’s fixed maturity securities and GSE collateralized mortgage obligations based on cash flows (in thousands):
|
|
June 30,
|
|||||||
|
|
2011
|
2010
|
||||||
|
Less than 90 days
|
$ | — | $ | — | ||||
|
Less than one year
|
10,713 | 12,033 | ||||||
|
Due in one to five years
|
6,981 | 9,997 | ||||||
| $ | 17,694 | $ | 22,030 | |||||
Note 3 – Inventories
Inventories consist of the following:
|
|
June 30,
|
|||||||
|
|
2011
|
2010
|
||||||
|
(In thousands)
|
||||||||
|
Raw materials
|
$ | 4,312 | $ | 4,164 | ||||
|
Finished goods
|
1,804 | 1,250 | ||||||
|
Subtotal
|
6,116 | 5,414 | ||||||
|
Less: Inventory reserve
|
(443 | ) | (591 | ) | ||||
| $ | 5,673 | $ | 4,823 | |||||
Note 4 – Property and Equipment
The components of property and equipment are as follows:
|
|
June 30,
|
|||||||
|
|
2011
|
2010
|
||||||
|
(In thousands)
|
||||||||
|
Leasehold improvements
|
$ | 566 | $ | 566 | ||||
|
Furniture and fixtures
|
879 | 899 | ||||||
|
Machinery and equipment
|
2,198 | 2,282 | ||||||
| 3,643 | 3,747 | |||||||
|
Less accumulated depreciation and amortization
|
(3,411 | ) | (3,487 | ) | ||||
| $ | 232 | $ | 260 | |||||
Note 5 – Accrued Payroll and Related Liabilities
The components of accrued payroll and related liabilities are as follows:
|
|
June 30,
|
|||||||
|
|
2011
|
2010
|
||||||
|
(In thousands)
|
||||||||
|
Accrued salaries and payroll taxes
|
$ | 260 | $ | 270 | ||||
|
Accrued vacation
|
207 | 232 | ||||||
|
Accrued other
|
28 | 19 | ||||||
| $ | 495 | $ | 521 | |||||
43
Note 6 – Other Accrued Liabilities
The components of other liabilities are as follows:
|
|
June 30,
|
|||||||
|
|
2011
|
2010
|
||||||
|
(In thousands)
|
||||||||
|
Accrued audit
|
$ | 111 | $ | 110 | ||||
|
Accrued service contracts
|
277 | 294 | ||||||
|
Accrued step rent
|
152 | 147 | ||||||
|
Accrued warranty
|
198 | 156 | ||||||
|
Deferred revenue
|
65 | 83 | ||||||
|
Other accrued liabilities
|
142 | 113 | ||||||
| $ | 945 | $ | 903 | |||||
Note 7 – Income Taxes
The (benefit from) provision for income taxes is comprised of the following:
|
|
Year Ended June 30,
|
|||||||||||
|
|
2011
|
2010
|
2009
|
|||||||||
|
(In thousands)
|
||||||||||||
|
Current:
|
||||||||||||
|
Federal
|
$ | (2 | ) | $ | — | $ | — | |||||
|
State
|
(3 | ) | — | 3 | ||||||||
| (5 | ) | — | 3 | |||||||||
|
Deferred:
|
||||||||||||
|
Federal
|
— | — | — | |||||||||
|
State
|
— | — | — | |||||||||
| — | — | — | ||||||||||
| $ | (5 | ) | $ | — | $ | 3 | ||||||
The following is a reconciliation of the statutory federal income tax rate to Qualstar’s effective income tax rate:
|
|
Year Ended June 30,
|
|||||||||||
|
|
2011
|
2010
|
2009
|
|||||||||
|
Statutory federal income tax benefit
|
(34.0 | )% | (34.0 | )% | (34.0 | )% | ||||||
|
State income taxes, net of federal income tax benefit
|
(3.8 | ) | (1.4 | ) | (3.8 | ) | ||||||
|
Research and development credits
|
(13.8 | ) | (3.0 | ) | (5.4 | ) | ||||||
|
Valuation allowance
|
59.4 | 27.0 | 49.5 | |||||||||
|
Other
|
(8.6 | ) | 11.4 | (6.2 | ) | |||||||
| 0.8 | % | 0.0 | % | 0.1 | % | |||||||
The tax effect of temporary differences resulted in deferred income tax assets (liabilities) as follows:
|
|
June 30,
|
|||||||||||
|
|
2011
|
2010
|
2009
|
|||||||||
|
Deferred tax assets:
|
(In thousands)
|
|||||||||||
|
Net operating loss carryforwards
|
$ | 4,119 | $ | 3,861 | $ | 2,587 | ||||||
|
Capital loss and other credit carryforwards
|
21 | 20 | 465 | |||||||||
|
Research and development credit carryforwards
|
1,148 | 994 | 900 | |||||||||
|
Allowance for bad debts and returns
|
78 | 53 | 38 | |||||||||
|
Inventory reserves
|
168 | 224 | 317 | |||||||||
|
Capitalized inventory costs
|
16 | 24 | 29 | |||||||||
|
Marketable securities
|
— | (24 | ) | (65 | ) | |||||||
|
Other accruals
|
514 | 507 | 530 | |||||||||
|
Total gross deferred tax assets
|
6,064 | 5,659 | 4,801 | |||||||||
|
Less valuation allowance on deferred tax assets
|
(6,034 | ) | (5,620 | ) | (4,735 | ) | ||||||
|
Net deferred tax assets
|
30 | 39 | 66 | |||||||||
|
Deferred tax liabilities:
|
||||||||||||
|
Marketable securities
|
(15 | ) | — | — | ||||||||
|
Depreciation and other
|
(15 | ) | (39 | ) | (66 | ) | ||||||
|
Total deferred tax liabilities
|
(30 | ) | (39 | ) | (66 | ) | ||||||
|
Net deferred taxes
|
$ | — | $ | — | $ | — | ||||||
44
The Company records a valuation allowance against its net deferred income tax assets in accordance with ASC 740 “Income Taxes” when in management’s judgment, it is more likely than not that the deferred income tax assets will not be realized in the foreseeable future. For the fiscal years ended June 30, 2011. 2010, and 2009, the Company placed a valuation allowance on net deferred tax assets. The Company has net operating loss carryforwards for federal income tax purposes of approximately $10.7 million as of June 30, 2011, $10.1 million as of June 30, 2010 and $6.7 million as of June 30, 2009. The Company has net operating loss carryforwards for state income tax purposes of approximately $8.4 million as of June 30, 2011, $8.1 million as of June 30, 2010 and $5.8 million as of June 30, 2009. The Company had research and development and other credits for tax purposes of $1.7 million as of June 30, 2011, $1.5 million as of June 30, 2010 and $1.3 million at June 30, 2009. If not utilized, the federal net operating loss and other tax credit carryforwards will expire beginning in 2025. If not utilized, the state net operating loss carryforward will expire beginning in 2013. The state research and development credit has no limit on the carryforward period.
In accordance with ASC 740, the Company recognized an increase of approximately $36,000 in liability for uncertain tax positions that were accounted for as a reduction to the July 1, 2007 balance of retained earnings. The following table summarizes the activity related to the Company’s uncertain tax positions (in thousands):
| June 30, | ||||||||||||
| 2011 | 2010 | 2009 | ||||||||||
|
Balance at July 1
|
$ | 25 | $ | 34 | $ | 46 | ||||||
|
Increases related to tax positions taken in prior year
|
9 | 1 | 3 | |||||||||
|
Decreases due to lapse of statute of limitations
|
(10 | ) | (8 | ) | (13 | ) | ||||||
|
Related interest and penalties, net of federal tax benefit
|
(3 | ) | (2 | ) | (2 | ) | ||||||
|
Balance at June 30
|
$ | 21 | $ | 25 | $ | 34 | ||||||
While the Company expects that the amount of its uncertain tax positions will change in the next twelve months, the Company does not expect this change to have a significant impact on its results of operations or financial position. In addition, future changes in the unrecognized tax benefit will have no impact on the Company’s effective tax rate due to the existence of the valuation allowance.
The Company’s policy is to include interest and penalties on uncertain tax positions in income tax expense, but is not significant at June 30, 2011. The Company files its tax returns by the laws of the jurisdictions in which it operates. The Company’s federal tax returns after 2007 and California tax returns after 2006 are still subject to examination. Various state jurisdictions tax years remain open to examination as well, though the Company believes any additional assessment will be immaterial to its financial statements.
Note 8 – Preferred Stock
Qualstar’s capital structure allows for the Board of Directors to authorize 5,000,000 shares of preferred stock. The Board of Directors has authority to fix the rights, preferences, privileges and restrictions, including voting rights, of these shares of preferred stock without any future vote or action by the shareholders. At June 30, 2011 and 2010, there were no outstanding shares of preferred stock.
Note 9 – Share Based Stock Option Plans
The Company has two share-based compensation plans as described below. During fiscal 2011, 2010 and 2009, the Company recorded share-based compensation associated with outstanding stock option grants of approximately $39,000, $32,000 and $93,000, respectively. No income tax benefit was recognized in the income statement for share-based arrangements in any period presented.
Qualstar adopted the1998 Stock Incentive Plan, (the “1998 Plan”) under which incentive and nonqualified stock options could be granted for an aggregate of no more than 1,215,000 shares of common stock. Under the terms of the 1998 Plan, options could be issued at an exercise price of not less than 100% of the fair market value of common stock on the date of grant. These option awards typically vest based on 4 years of continuous service at a rate of 25% per year and terminate as specified in each option agreement, but terminate no later than ten years after the date of grant. The 1998 Plan expired in 2008 and no additional options may be granted under that plan. However, options previously granted under the 1998 Plan will continue under their terms.
Qualstar adopted the 2008 Stock Incentive Plan (the “2008 Plan”) under which incentive and nonqualified stock options may be granted for an aggregate of no more than 500,000 shares of common stock. Under the terms of the 2008 Plan, options may be issued at an exercise price of not less than 100% of the fair market value of common stock on the date of grant. These option awards typically vest based on 4 years of continuous service at a rate of 25% per year and terminate as specified in each option agreement, but terminate no later than ten years after the date of grant. No options have been granted under the 2008 Plan as of June 30, 2011.
45
The fair value of each option award is estimated on the date of grant using the Black-Scholes option valuation model that uses the assumptions noted in the following table. Expected volatilities are based on the historical volatility of the Company’s stock. The Company uses historical data to estimate option exercise and employee termination in determining forfeiture rates and evaluates separate groups of employees by functional area that have similar historical exercise behavior. The expected term of options granted is estimated based on the vesting term of the award, historical employee exercise behavior, expected volatility of the Company’s stock and an employee’s average length of service. The risk-free interest rate used in this model correlates to a U.S. constant rate Treasury security with a contractual life that approximates the expected term of the option award. Weighted-average numbers have been used below as indicated. There were no option grants under either plan during fiscal years 2011, 2010 and 2009.
The following table summarizes all stock option activity (in thousands, except per share amounts):
|
Options
|
Shares
|
Weighted
Average
Exercise Price
per Share
|
Weighted
Average
Remaining
Contractual
Term
|
Aggregate
Intrinsic
Value
|
||||||||||||
|
Outstanding at June 30, 2010
|
573 | $ | 4.10 | 4.29 | $ | — | ||||||||||
|
Granted
|
— | — | ||||||||||||||
|
Exercised
|
— | — | ||||||||||||||
|
Forfeited or expired
|
(40 | ) | — | |||||||||||||
|
Outstanding at June 30, 2011
|
533 | $ | 3.80 | 3.51 | $ | — | ||||||||||
|
Exercisable at June 30, 2011
|
524 | $ | 3.82 | 3.45 | $ | — | ||||||||||
No options were granted during fiscal years 2011, 2010 and 2009.
At June 30, 2011, there was $3,587 of total unrecognized compensation cost related to nonvested share-based compensation awards granted under the 1998 Plan. The cost is expected to be recognized over a weighted-average period of 0.8 years. The total fair value of shares vested for fiscal years 2011, 2010 and 2009 was $14,000, $58,000 and $93,000, respectively.
Note 10 – Commitments
Qualstar’s lease agreement for its facility located in Simi Valley, California, expires in December 2015. Rent on this facility is $40,000 per month with a step-up of 3% annually. The Company provides for rent expense on a straight-line basis over the lease term.
Qualstar’s lease agreement for its facility located in Boulder, Colorado, expires in May of 2012. Rent on this facility is $4,850 per month, with a step-up of approximately 3% annually. The Company provides for rent expense on a straight-line basis over the lease term.
Future minimum lease payments under these leases are as follows:
|
Year Ending June 30,
|
Minimum Lease Payment
|
|||
|
(in thousands)
|
||||
|
2012
|
539 | |||
|
2013
|
503 | |||
|
2014
|
518 | |||
|
2015
|
534 | |||
|
2016
|
273 | |||
| $ | 2,367 | |||
Rent expense (including equipment rental) for the years ended June 30, 2011, 2010, and 2009, was $625,000, $665,000, and $660,000, respectively.
Note 11 – Segment Information
Based on the provisions of ASC 280, “Segment Reporting,” and the manner in which the Chief Operating Decision Maker analyzes the business, Qualstar has determined that it has two separate operating segments.
46
Segment revenue, loss before income taxes and total assets were as follows:
|
Year Ended June 30
|
||||||||||||
|
2011
|
2010
|
2009
|
||||||||||
|
Revenue
|
(in thousands)
|
|||||||||||
| Tape Libraries: | ||||||||||||
|
Product
|
$ | 7,195 | $ | 6,608 | $ | 9,613 | ||||||
|
Service
|
2,652 | 2,879 | 2,728 | |||||||||
|
Total Tape Libraries
|
9,847 | 9,487 | 12,341 | |||||||||
|
Power Supplies
|
8,455 | 5,783 | 5,551 | |||||||||
|
Total Revenue
|
$ | 18,302 | $ | 15,270 | $ | 17,892 | ||||||
|
|
Year Ended June 30
|
|||||||||||
|
|
2011
|
2010
|
2009
|
|||||||||
|
Income (Loss) before Taxes
|
(in thousands)
|
|||||||||||
|
Tape Libraries
|
$ | (1,624 | ) | $ | (3,219 | ) | $ | (2,636 | ) | |||
|
Power Supplies
|
944 | 98 | 80 | |||||||||
|
Total Loss before Income Taxes
|
$ | (680 | ) | $ | (3,121 | ) | $ | (2,556 | ) | |||
|
|
Year Ended June 30
|
|||||||
|
|
2011
|
2010
|
||||||
|
Total Assets
|
(in thousands)
|
|||||||
|
Tape Libraries
|
$ | 30,599 | $ | 32,418 | ||||
|
Power Supplies
|
1,336 | 103 | ||||||
|
Total Assets
|
$ | 31,935 | $ | 32,521 | ||||
|
June 30,
|
||||||||
|
2011
|
2010
|
|||||||
|
Property and Equipment
|
(in thousands)
|
|||||||
|
Tape Libraries:
|
||||||||
|
Gross fixed assets
|
3,189 | 3,353 | ||||||
|
Less: accumulated depreciation and amortization
|
(3,083 | ) | (3,221 | ) | ||||
|
Net Library fixed assets
|
$ | 106 | $ | 132 | ||||
|
Power Supplies:
|
||||||||
|
Gross fixed assets
|
454 | 394 | ||||||
|
Less: accumulated depreciation and amortization
|
(328 | ) | (266 | ) | ||||
|
Net Power Supply fixed assets
|
$ | 126 | $ | 128 | ||||
In its operation of the business, management reviews certain financial information, including segmented internal profit and loss statements prepared on a basis consistent with U.S. GAAP. Our two segments are Tape Libraries and Power Supplies. The two segments discussed in this analysis are presented in the way we internally managed and monitored performance for the years ended June 30, 2011, 2010, and 2009. Allocations for internal resources were made for the years ended June 30, 2011, 2010, and 2009. The power supplies segment tracks certain assets separately, and all others are recorded in the tape library segment for internal reporting presentations. Cash was not segregated between the two segments, but retained by the library segment through the third quarter of fiscal 2009. Cash was segregated between the two segments commencing in the fourth quarter of fiscal 2009.
The types of products and services provided by each segment are summarized below:
Tape Libraries — We design, develop, manufacture and sell automated magnetic tape libraries used to store, retrieve and manage electronic data primarily in network computing environments. Tape libraries consist of cartridge tape drives, tape cartridges and robotics to move the cartridges from their storage locations to the tape drives under software control. Our tape libraries provide data storage solutions for organizations requiring backup, recovery and archival storage of critical data.
Power Supplies — We design, manufacture, and sell small, open frame, high efficiency switching power supplies. These power supplies are used to convert AC line voltage to DC voltages, or DC voltages to other DC voltages for use in a wide variety of electronic equipment such as telecommunications equipment, machine tools, routers, switches, wireless systems and gaming devices.
Geographic Information
Information regarding revenues attributable to the Qualstar’s primary geographic operating regions is as follows:
47
|
|
Year Ended June 30,
|
|||||||||||
|
|
2011
|
2010
|
2009
|
|||||||||
| (In thousands) | ||||||||||||
|
Revenues:
|
||||||||||||
|
North America
|
$ | 11,700 | $ | 10,176 | $ | 13,166 | ||||||
|
Europe
|
3,200 | 2,483 | 2,718 | |||||||||
|
Asia Pacific
|
3,127 | 1,981 | 1,527 | |||||||||
|
Other
|
275 | 630 | 481 | |||||||||
| $ | 18,302 | $ | 15,270 | $ | 17,892 | |||||||
|
Year Ended June 30,
|
||||||||||||
|
|
2011
|
2010
|
2009
|
|||||||||
| (In thousands) | ||||||||||||
|
Tape Library Revenue:
|
||||||||||||
|
North America
|
$ | 7,595 | $ | 7,204 | $ | 9,992 | ||||||
|
Europe
|
1,874 | 1,622 | 1,838 | |||||||||
|
Asia Pacific
|
103 | 31 | 37 | |||||||||
|
Other
|
275 | 630 | 474 | |||||||||
| $ | 9,847 | $ | 9,487 | $ | 12,341 | |||||||
|
Year Ended June 30,
|
||||||||||||
|
|
2011
|
2010
|
2009
|
|||||||||
| (In thousands) | ||||||||||||
|
Power Supply Revenue:
|
||||||||||||
|
North America
|
$ | 4,105 | $ | 2,972 | $ | 3,185 | ||||||
|
Europe
|
1,326 | 861 | 877 | |||||||||
|
Asia Pacific
|
3,024 | 1,950 | 1489 | |||||||||
|
Other
|
— | — | — | |||||||||
| $ | 8,455 | $ | 5,783 | $ | 5,551 | |||||||
The geographic classification of revenues is based upon the location to which the product is shipped. Qualstar does not have any significant long-lived assets outside of the United States.
Note 12 – Legal Proceedings
The Company is from time to time involved in various lawsuits and legal proceedings that arise in the ordinary course of business. At this time, management is not aware of any pending or threatened litigation against the Company that we expect will have a material adverse effect on our business, financial condition, liquidity or operating results. Legal claims are inherently uncertain, however. There can be no assurance that the Company will not be adversely affected in the future by legal proceedings.
Note 13 – Benefit Plans
Qualstar has a voluntary deferred compensation plan (the Plan) qualifying for treatment under Internal Revenue Code Section 401(k). All employees are eligible to participate in the Plan following three months of service of employment and may contribute up to 100% of their compensation on a pre-tax basis, not to exceed the annual IRS maximum. Qualstar, at the discretion of management, may make matching contributions in an amount equal to 25% of the first 6% of compensation contributed by eligible participants. Qualstar suspended the discretionary matching contribution effective August 2009. Qualstar’s contributions under the Plan totaled $54,000 and $46,000 for the years ended June 30, 2010 and 2009, respectively.
Note 14 – Related Party Transactions
Qualstar’s outside counsel is a member of its board of directors. During the years ended June 30, 2011, 2010, and 2009 Qualstar paid $86,000, $107,000, and $88,000, respectively to the law firm in which the director is a shareholder for general business purposes.
48
Note 15 – Recent Accounting Pronouncements
Recently Adopted Accounting Pronouncements
On July 1, 2010 we adopted the authoritative guidance that requires revised evaluations of whether entities represent variable interest entities, ongoing assessments of control over such entities, and additional disclosures for variable interests. Adoption of the new guidance did not have a material impact on our financial statements.
On July 1, 2010 we adopted the authoritative guidance issued by the FASB on arrangements that include software elements. Under this new guidance, tangible products that have software components that are essential to the functionality of the tangible product will no longer be within the scope of the software revenue recognition guidance, and software-enabled products will now be subject to other relevant revenue recognition guidance. Additionally, the FASB issued authoritative guidance, Accounting Standards Update (“ASU”) 2009-13 on revenue arrangements with multiple deliverables that are outside the scope of the software revenue recognition guidance. Under the new guidance, when vendor specific objective evidence or third party evidence for deliverables in an arrangement cannot be determined, a best estimate of the selling price is required to separate deliverables and allocate arrangement consideration using the relative selling price method. The new guidance includes new disclosure requirements on how the application of the relative selling price method affects the timing and amount of revenue recognition. We believe adoption of this new guidance will not have a material impact on our financial statements.
In January 2010, the FASB issued an ASU 2010-06, to amend the disclosure requirements related to recurring and nonrecurring fair value measurements. The guidance requires new disclosures on the transfers of assets and liabilities between Level 1 (quoted prices in active market for identical assets or liabilities) and Level 2 (significant other observable inputs) of the fair value measurement hierarchy, including the reasons and the timing of the transfers. Additionally, the guidance requires a roll forward of activities on purchases, sales, issuance, and settlements of the assets and liabilities measured using significant unobservable inputs (Level 3 fair value measurements). The guidance became effective for us with the reporting period beginning January 1, 2010, except for the disclosure on the roll forward activities for Level 3 fair value measurements, which will become effective for us with the reporting period beginning July 1, 2011. Other than requiring additional disclosures, adoption of this new guidance did not have a material impact on our financial statements.
Recent Accounting Pronouncements Not Yet Adopted
In June 2011, the FASB issued ASU 2011-05 guidance on presentation of comprehensive income. The new guidance eliminates the current option to report other comprehensive income and its components in the statement of changes in equity. Instead, an entity will be required to present either a continuous statement of net income and other comprehensive income or in two separate but consecutive statements. The new guidance will be effective for us beginning July 1, 2012 and will have presentation changes only.
In May 2011, the FASB issued ASU 2011-04 guidance to amend the accounting and disclosure requirements on fair value measurements. The new guidance limits the highest-and-best-use measure to nonfinancial assets, permits certain financial assets and liabilities with offsetting positions in market or counterparty credit risks to be measured at a net basis, and provides guidance on the applicability of premiums and discounts. Additionally, the new guidance expands the disclosures on Level 3 inputs by requiring quantitative disclosure of the unobservable inputs and assumptions, as well as description of the valuation processes and the sensitivity of the fair value to changes in unobservable inputs. The new guidance will be effective for us beginning January 1, 2012. Other than requiring additional disclosures, we do not anticipate material impacts on our financial statements upon adoption.
Note 16 – Quarterly Results of Operations (Unaudited)
|
|
Three Months Ended
|
|||||||||||||||
|
|
June 30,
|
March 31,
|
December 31,
|
September 30,
|
||||||||||||
|
(In thousands, except per share amounts)
|
||||||||||||||||
|
Fiscal 2011:
|
||||||||||||||||
|
Net sales
|
$ | 4,707 | $ | 4,247 | $ | 4,107 | $ | 5,241 | ||||||||
|
Gross profit
|
1,629 | 1,371 | 1,617 | 2,112 | ||||||||||||
|
Net (loss) income
|
$ | (37 | ) | $ | (514 | ) | $ | (296 | ) | $ | 167 | |||||
|
Net (loss) income per share:
|
||||||||||||||||
|
Basic and diluted
|
$ | (0.00 | ) | $ | (0.04 | ) | $ | (0.02 | ) | $ | 0.01 | |||||
|
Fiscal 2010:
|
||||||||||||||||
|
Net sales
|
$ | 3,991 | $ | 4,003 | $ | 3,597 | $ | 3,679 | ||||||||
|
Gross profit
|
1,281 | 1,206 | 1,194 | 963 | ||||||||||||
|
Net loss
|
$ | (575 | ) | $ | (797 | ) | $ | (798 | ) | $ | (951 | ) | ||||
|
Net loss per share:
|
||||||||||||||||
|
Basic and diluted
|
$ | (0.05 | ) | $ | (0.07 | ) | $ | (0.07 | ) | $ | (0.08 | ) | ||||
Note 17 - Subsequent Event
The Company has performed an evaluation of subsequent events.
49
ITEM 9. CHANGES IN AND DISAGREEMENTS WITH ACCOUNTANTS ON ACCOUNTING AND FINANCIAL DISCLOSURE
None.
ITEM 9A(T). CONTROLS AND PROCEDURES
Evaluation of Disclosure Controls and Procedures
We carried out an evaluation, under the supervision and with the participation of our management, including our Chief Executive Officer and Chief Financial Officer, of the effectiveness of the design and operation of Qualstar’s disclosure controls and procedures as of June 30, 2011, pursuant to Rule 13a-15 under the Securities Exchange Act of 1934. Based upon that evaluation, our Chief Executive Officer and Chief Financial Officer concluded that our disclosure controls and procedures are effective to ensure that information required to be disclosed by us in reports that we file or submit under the Exchange Act is recorded, processed, summarized and reported within the time periods specified in the Commission’s rules and forms, and to ensure that the information required to be disclosed by us in reports that we file or submit under the Exchange Act is accumulated and communicated to our management, including our Chief Executive Officer and Chief Financial Officer, as appropriate, to allow timely decisions regarding required disclosure.
Changes in Internal Control over financial reporting
We did not make any changes in our internal control over financial reporting during the fiscal fourth quarter ended June 30, 2011 that materially affected, or are reasonably likely to materially affect, our internal control over financial reporting.
Management’s Report on Internal Control over Financial Reporting
Our management is responsible for establishing and maintaining adequate internal control over financial reporting. Our internal control over financial reporting is a process designed to provide reasonable assurance regarding the reliability of financial reporting and the preparation of financial statements for external purposes in accordance with generally accepted accounting principles. Because of its inherent limitations, internal control over financial reporting may not prevent or detect misstatements. Also, projections of any evaluation of effectiveness to future periods are subject to the risk that controls may become inadequate because of changes in conditions, or that the degree of compliance with the policies or procedures may deteriorate. Our management assessed the effectiveness of our internal control over financial reporting as of June 30, 2011. In making this assessment, it used the criteria set forth by the Committee of Sponsoring Organizations of the Treadway Commission (COSO) in Internal Control – Integrated Framework. Based on our assessment, we have concluded that, as of June 30, 2011, our internal control over financial reporting was effective based on those criteria.
This Annual Report on Form 10-K does not include an attestation report of the Company’s registered public accounting firm regarding internal control over financial reporting. Management’s report was not subject to attestation by the Company’s registered public accounting firm pursuant to the rules of the Securities and Exchange Commission that permit the Company to provide only management’s report in this Annual report on Form 10-K.
ITEM 9B. OTHER INFORMATION
None.
50
PART III
The information called for by Items 10, 11, 12, 13 and 14 of Part III of Form 10-K (except information as to Qualstar’s executive officers, which is included under Part I, Item 1 of this Report) will be included in Qualstar’s Proxy Statement to be filed with the Securities and Exchange Commission within 120 days after the close of its fiscal year ended June 30, 2011, and is hereby incorporated by reference to such Proxy Statement.
ITEM 10. DIRECTORS, EXECUTIVE OFFICERS AND CORPORATE GOVERNANCE
A list of our executive officers and biographical information appears in Part I, Item 1 of this report. Information about our Directors may be found under the caption “Election of Directors” of our Proxy Statement (the “Proxy Statement”). That information is incorporated herein by reference.
Additional information in response to this item is incorporated herein by reference to our proxy statement to be filed within 120 days after our fiscal year ended June 30, 2011.
ITEM 11. EXECUTIVE COMPENSATION
Information in response to this item is incorporated by reference to our proxy statement to be filed within 120 days of our fiscal year ended June 30, 2011.
ITEM 12. SECURITY OWNERSHIP OF CERTAIN BENEFICIAL OWNERS AND MANAGEMENT AND RELATED STOCKHOLDER MATTERS
Information in response to this item is incorporated by reference to our proxy statement to be filed within 120 days of our fiscal year ended June 30, 2011.
ITEM 13. CERTAIN RELATIONSHIPS AND RELATED TRANSACTIONS, AND DIRECTOR INDEPENDENCE
Information in response to this item is incorporated by reference to our proxy statement to be filed within 120 days of our fiscal year ended June 30, 2011.
ITEM 14. PRINCIPAL ACCOUNTANT FEES AND SERVICES
Information in response to this item is incorporated by reference to our proxy statement to be filed within 120 days of our fiscal year ended June 30, 2011.
51
PART IV
ITEM 15. EXHIBITS AND FINANCIAL STATEMENT SCHEDULES
(a) The financial statements are set forth under Item 8 of this Annual Report on Form 10-K.
All other schedules have been omitted since the required information is not present in amounts sufficient to require submission of the schedule, or because the required information is included in the financial statements or notes thereto.
(b) Exhibits:
|
Exhibit
No.
|
Description
|
|
|
3.1(1)
|
Restated Articles of Incorporation.
|
|
|
3.2(4)
|
Bylaws, as amended and restated as of March 24, 2011.
|
|
|
10.1(1)*
|
1998 Stock Incentive Plan, as amended and restated.
|
|
|
10.2(1)
|
Form of Indemnification Agreement.
|
|
|
10.3(2)
|
Lease agreement between Strategic Performance Fund-II, Inc. and Qualstar Corporation, dated September 20, 2000.
|
|
|
10.4(6)
|
Amendment to Lease agreement between Strategic Performance Fund-II, Inc. and Qualstar Corporation, dated June 30, 2009.
|
|
|
10.5(5)*
|
2008 Stock Incentive Plan
|
|
|
14.1(3)
|
Code of Business Conduct and Ethics
|
|
|
23.1
|
Consent of Independent Registered Public Accounting Firm (SingerLewak LLP).
|
|
|
31.1
|
Certification of Principal Executive Officer pursuant to Section 302 of the Sarbanes-Oxley Act of 2002.
|
|
|
31.2
|
Certification of Principal Financial Officer pursuant to Section 302 of the Sarbanes-Oxley Act of 2002.
|
|
|
32.1
|
Certification of Principal Executive Officer pursuant to Section 906 of the Sarbanes-Oxley Act of 2002.
|
|
|
32.2
|
Certification of Principal Financial Officer pursuant to Section 906 of the Sarbanes-Oxley Act of 2002.
|
____________
|
(1)
|
Incorporated by reference to the designated exhibits to Qualstar’s registration statement on Form S-1 (Commission File No. 333-96009), declared effective by the Commission on June 22, 2000.
|
|
(2)
|
Incorporated by reference to the designated exhibit to Qualstar’s Report on Form 10-Q for the fiscal quarter ended September 30, 2000.
|
|
(3)
|
Incorporated by reference to the designated exhibit to Qualstar’s Report on Form 10-K for the fiscal year ended June 30, 2004.
|
|
(4)
|
Incorporated by reference to Exhibit 3.1 to Qualstar’s Report on Form 8-K dated March 24, 2011.
|
|
(5)
|
Incorporated by reference to Exhibit 10.1 to Qualstar’s Report on Form 10-Q/A for the fiscal quarter ended March 31, 2009.
|
|
(6)
|
Incorporated by reference to Exhibit 10.4 to Qualstar’s Report on Form 10-K for the fiscal year ended June 30, 2009.
|
|
*
|
Each of these exhibits constitutes a management contract, compensatory plan or arrangement required to be filed as an exhibit to this report pursuant to Item 15(b) of this report.
|
52
SIGNATURES
Pursuant to the requirements of Section 13 or 15(d) of the Securities Exchange Act of 1934, the registrant has duly caused this report to be signed on its behalf by the undersigned thereunto duly authorized.
|
QUALSTAR CORPORATION
|
|||
|
Date: August 31, 2011
|
By:
|
/s/ WILLIAM J. GERVAIS | |
| William J. Gervais | |||
| Chief Executive Officer and President | |||
Pursuant to the requirements of the Securities Exchange Act of 1934, the following persons on behalf of the registrant and in the capacities and on the dates indicated have signed this report below.
|
Signature
|
Title
|
Date
|
|
/s/ WILLIAM J. GERVAIS
|
Chief Executive Officer,
|
August 31, 2011
|
|
William J. Gervais
|
President and Director
|
|
|
(Principal executive officer)
|
||
|
/s/ NIDHI H. ANDALON
|
Vice President, CFO and Corporate
|
August 31, 2011
|
|
Nidhi H. Andalon
|
Secretary
|
|
|
(Principal financial officer)
|
||
|
/s/ RICHARD A. NELSON
|
Director
|
August 31, 2011
|
|
Richard A. Nelson
|
||
|
/s/ CARL W. GROMADA
|
Director
|
August 31, 2011
|
|
Carl W. Gromada
|
||
|
/s/ STANLEY W. CORKER
|
Director
|
August 31, 2011
|
|
Stanley W. Corker
|
||
|
/s/ ROBERT E. RICH
|
Director
|
August 31, 2011
|
|
Robert E. Rich
|
||
|
/s/ ROBERT A. MEYER
|
Director
|
August 31, 2011
|
|
Robert A. Meyer
|
||
|
|
||
|
/s/ LAWRENCE D. FIRESTONE
|
Director
|
August 31, 2011
|
|
Lawrence D. Firestone
|
53
EXHIBIT INDEX
|
Exhibit
No.
|
Description
|
|
|
3.1(1)
|
Restated Articles of Incorporation.
|
|
|
3.2(4)
|
Bylaws, as amended and restated as of March 24, 2011.
|
|
|
10.1(1)*
|
1998 Stock Incentive Plan, as amended and restated.
|
|
|
10.2(1)
|
Form of Indemnification Agreement.
|
|
|
10.3(2)
|
Lease agreement between Strategic Performance Fund-II, Inc. and Qualstar Corporation, dated September 20, 2000.
|
|
|
10.4(6)
|
Amendment to Lease agreement between Strategic Performance Fund-II, Inc. and Qualstar Corporation, dated June 30, 2009.
|
|
|
10.5(5)*
|
2008 Stock Incentive Plan
|
|
|
14.1(3)
|
Code of Business Conduct and Ethics
|
|
|
23.1
|
Consent of Independent Registered Public Accounting Firm (SingerLewak LLP).
|
|
|
31.1
|
Certification of Principal Executive Officer pursuant to Section 302 of the Sarbanes-Oxley Act of 2002.
|
|
|
31.2
|
Certification of Principal Financial Officer pursuant to Section 302 of the Sarbanes-Oxley Act of 2002.
|
|
|
32.1
|
Certification of Principal Executive Officer pursuant to Section 906 of the Sarbanes-Oxley Act of 2002.
|
|
|
32.2
|
Certification of Principal Financial Officer pursuant to Section 906 of the Sarbanes-Oxley Act of 2002.
|
____________
|
(1)
|
Incorporated by reference to the designated exhibits to Qualstar’s registration statement on Form S-1 (Commission File No. 333-96009), declared effective by the Commission on June 22, 2000.
|
|
(2)
|
Incorporated by reference to the designated exhibit to Qualstar’s Report on Form 10-Q for the fiscal quarter ended September 30, 2000.
|
|
(3)
|
Incorporated by reference to the designated exhibit to Qualstar’s Report on Form 10-K for the fiscal year ended June 30, 2004.
|
|
(4)
|
Incorporated by reference to Exhibit 3.1 to Qualstar’s Report on Form 8-K dated March 24, 2011.
|
|
(5)
|
Incorporated by reference to Exhibit 10.1 to Qualstar’s Report on Form 10-Q/A for the fiscal quarter ended March 31, 2009.
|
|
(6)
|
Incorporated by reference to Exhibit 10.4 to Qualstar’s report on Form 10-K for the fiscal year ended June 30, 2009.
|
|
*
|
Each of these exhibits constitutes a management contract, compensatory plan or arrangement required to be filed as an exhibit to this report pursuant to Item 15(b) of this report.
|
54