Attached files
| file | filename |
|---|---|
| 8-K - FORM 8-K - Transocean Ltd. | d8k.htm |
| EX-99.2 - PRESS RELEASE - Transocean Ltd. | dex992.htm |
| EX-99.1 - PRESS RELEASE - Transocean Ltd. | dex991.htm |
 Transocean
Ltd. August-September 2011
Exhibit 99.3 |
 2
Legal Disclaimer
Legal Disclaimer
The statements described in this presentation that are not historical facts are
forward-looking statements within the meaning of Section 27A of the Securities Act
of 1933 and Section 21E of the Securities Exchange Act of 1934. Forward-looking
statements which could be made include, but are not limited to, statements involving
prospects for the company, expected revenues, capital expenditures, costs and results
of operations and contingencies and other factors discussed in the company's most
recent Form 10-K for the year ended December 31, 2010 and in the company's other filings
with the SEC,
which
are
available
free
of
charge
on
the
SEC's
website
at
www.sec.gov.
Should
one
or
more
of
these risks or uncertainties materialize, or should underlying assumptions prove incorrect,
actual results may
vary
materially
from
those
indicated.
All
subsequent
written
and
oral
forward-looking
statements
attributable to the company or to persons acting on our behalf are expressly qualified in
their entirety by reference to these risks and uncertainties. You should not place
undue reliance on forward-looking statements. Each forward-looking statement
speaks only as of the date of the particular statement, and we undertake no obligation
to publicly update or revise any forward-looking statements. All non-GAAP
financial measure reconciliations to the most comparative GAAP measure are displayed in
quantitative schedules
on
the
company’s
web
site
at
www.deepwater.com.
This presentation does not constitute an offer to sell, or a solicitation of an offer
to buy, any securities, and it does not constitute an offering prospectus within the
meaning of article 652a or article 1156 of the
Swiss
Code
of
Obligations
or
a
listing
prospectus
within
the
meaning
of
the
listing
rules
of
the
SIX
Swiss Exchange. Investors must rely on their own evaluation of Transocean Ltd. and its
securities, including the merits and risks involved. Nothing contained herein is, or
shall be relied on as, a promise or representation as to the future performance of
Transocean Ltd. |
 3
Transocean is the Industry Leader
Transocean is the Industry Leader
•
World’s largest offshore contract driller
–
Largest fleet in all asset classes
–
Operate in all markets worldwide
–
Significant relationships across the
customer spectrum
•
Positioned to lead
–
Premier position in ultra-deepwater
market segment
–
Size and technical capabilities create
reinvestment opportunities |
 4
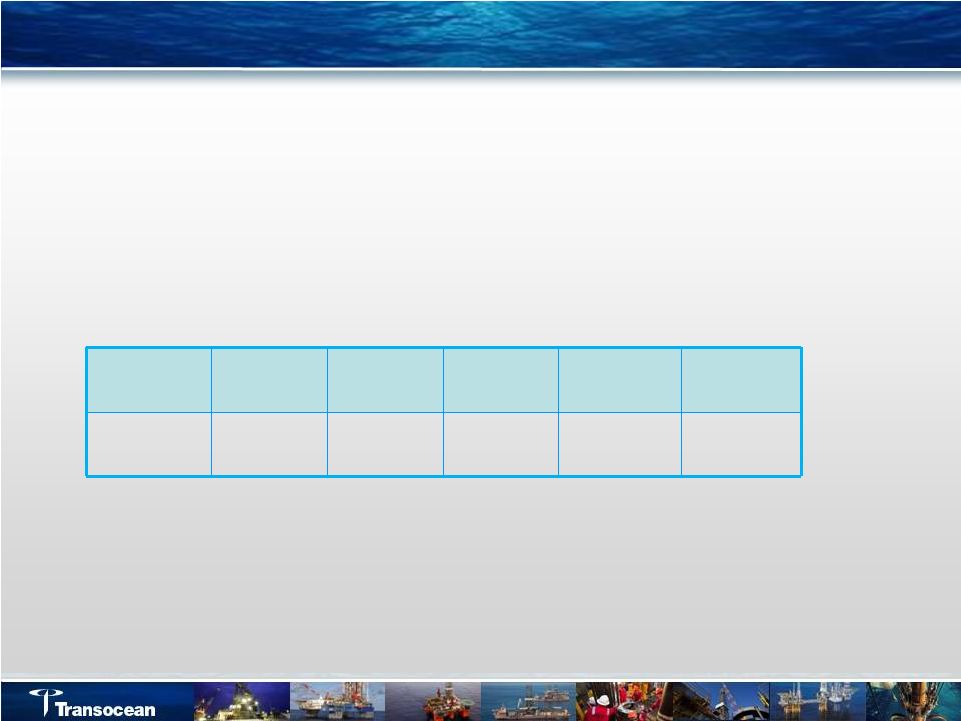
Key Investment Highlights
Key Investment Highlights
•
Industry leader committed to customers, employees, and shareholders
•
Visibility and stability due to solid backlog
•
Financial flexibility
•
Improving our fleet in accordance with strategy
•
Leveraged to global opportunities in an improving market
•
Committed to returning excess cash
–
Dividends
Standard
Jackups
High-Spec
Jackups
Midwater
Deepwater
Ultra-
Deepwater
Percent on
Contract
(1)
55%
89%
75%
72%
100% |
 Strategy to Lead
in Offshore Resource Development Strategy to Lead in Offshore Resource Development
Transocean
5 |
 6
Commitment to Drive Shareholder Value
Commitment to Drive Shareholder Value
Return Cash
to
Shareholders
Capital
Investment
Debt
Reduction
Margin
Improvement |
 7
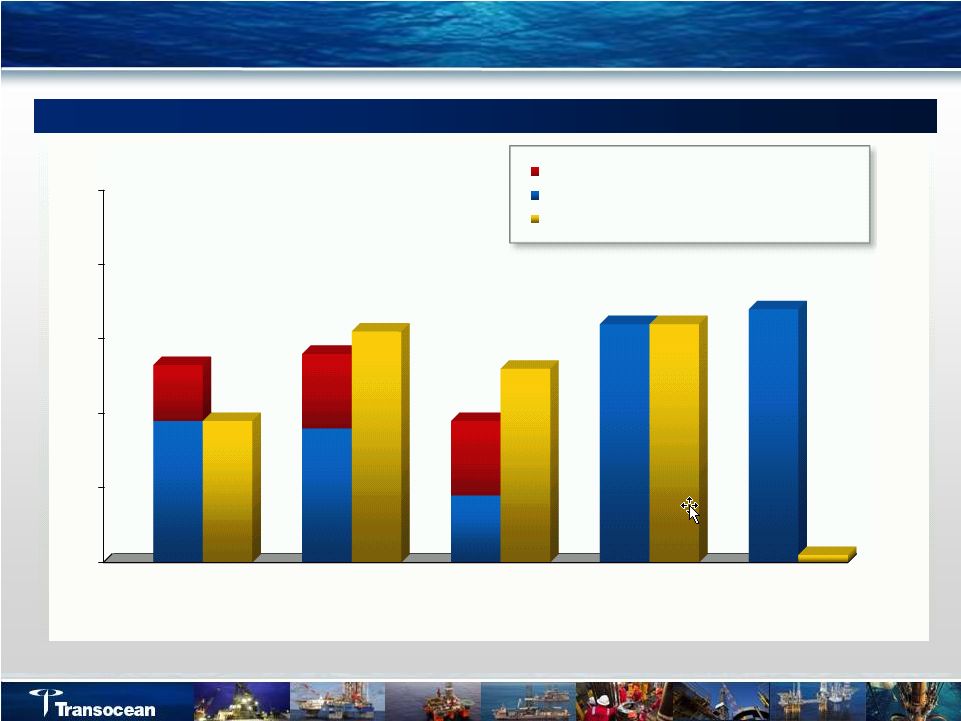
Largest Worldwide Rig Fleet
Largest Worldwide Rig Fleet
(5)
RIG
141
(2)
77
(3)
74
41
41
(4)
Pro forma
Aker Drilling
0
20
40
60
80
100
120
140
160
ESV
NE
DO
SDRL
Rigs Under Construction
Ultra-
Deepwater Floaters
Deepwater Floaters
Midwater Floaters
Jackups |
 8
Diversified Revenue Source
Diversified Revenue Source
By Asset Class
(5)
By Customer
YTD June 2011 Revenues -
$4.5 billion
(1)
33%
36%
31%
Integrated
NOC
Independent
41%
14%
23%
12%
7%
3%
Ultra-Deepwater
Deepwater
Midwater
Jackups
ADTI
Other |
 Strong Backlog
Creates Visibility Strong Backlog Creates Visibility
Total Contract Revenue Backlog -
$23.6 billion
(6)
4.1
(US$ billions)
7.6
5.2
3.8
2.9
0.0
1.0
2.0
3.0
4.0
5.0
6.0
7.0
8.0
2011
Remaining
2012
2013
2014
2015
-20
0.8
1.2
0.6
1.2
0.8
0.7
0.3
2.2
4.6
3.6
1.9
3.0
Ultra
-Deepwater Floaters
Deepwater Floaters
Midwater Floaters
Jackups
9 |
 10
Substantial Free Cash Flow Backlog
Substantial Free Cash Flow Backlog
Total Free Cash Flow Backlog of $10.9 billion
(7)
(US$ billions)
2011
Remaining
2012
2013
2014-2019
2020-2038
0.0
1.0
2.0
3.0
4.0
5.0
1.9
1.9
1.8
0.9
3.2
0.75
1.0
1.0
Estimated Dividend Distribution
Scheduled Debt Maturities (Face Value)
Forecasted Free Cash Flow Backlog
3.2
3.4
2.6
1.9
3.1 |
 11
Fleet Management: Create Opportunities & Drive Returns
Fleet Management: Create Opportunities & Drive Returns
2009
1.
Core
2.
Solid performers
3.
Non-core
Future
•Acquire, build,
divest and/or spin-off
•Maintain tax
efficiency for future acquisitions & divestitures
1.
Ultra-deepwater
2.
Harsh Environment
3.
High-spec Jackups
4.
High quality floaters and jackups
11
•Core, strategic
asset portfolio •Assessed and segmented fleet |
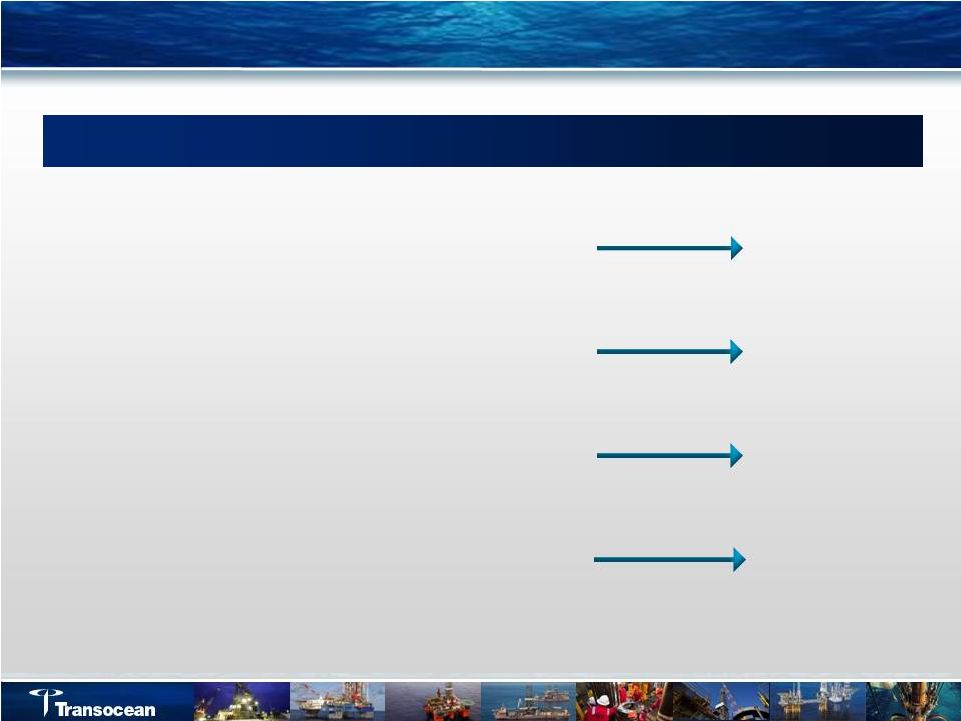 12
Newbuild Philosophy Drives Investment Decisions
Newbuild Philosophy Drives Investment Decisions
Does RIG have a suitable unit available?
Provide
Upgrade
Can a unit be upgraded?
Is an acquisition available?
Buy
Build
(To Initial Contract)
Is a newbuild appropriate?
Customer Requirements as a Starting Point |
 13
Aker Drilling -
Acquisition Details
Aker Drilling -
Acquisition Details
Shareholder
Value
Financing
Strategic
Impact
•
Cash offer for 100% of the shares for NOK 26.50 per share
•
Contributes approximately $1 billion in backlog
•
Expected to be immediately accretive to RIG’s earnings
•
$1.4 billion cash component financed with:
•
Existing cash
•
Current debt facility
•
RIG assumes Aker Drilling net debt of $0.8 billion
(8)
•
Ultimately adds four high specification drilling rigs
•
Immediately enhances our position in Norway as well as
HDHE capabilities
•
Two semisubmersibles on long-term contracts |
 14
•
Demand increasing
•
Continued demand growth is required to:
–
Absorb uncontracted newbuilds
–
Bring more idle jackups back to work
–
Increase dayrates for standard units
Jackup Market More Active And Evolving
Jackup Market More Active And Evolving
Jackup Type
Standard
High Spec
Utilization
Increasing
Increasing
Tendering Pace
Increasing
Increasing
Contract Term
Stable
Increasing
Dayrates
Increasing
Increasing
Key Market Drivers
Current Market Overview
Transocean Fleet
(2)
-
60
Global Fleet
(9)
-
354
1
23
15 available
through 1H12
36
18
33
48
255
Contracted
Stacked
Idle
Other |
 Midwater Market
Activity Improving •
No influx of newbuilds
•
Demand increasing 2H11
•
Active areas include North Sea, India, & Southeast Asia
•
Deepwater moored units may be threat in 2011
•
Short-term contract durations
•
Dayrates improving
•
Tendering activity accelerating
•
Stacked rigs likely to remain stacked, except in UK
Key Market Drivers
Current Market Overview
Transocean Fleet
(2)
-
28
Global Fleet
(9)
-
87
10 available
through 1H12
15
Contracted
Stacked
Idle
Other |
 Deepwater Demand
Still Slow to Respond •
Tightening ultra-deepwater and improving midwater
•
Demand increasing 2H11
•
Dayrates remain stable
•
Moored / lower spec units seeing some idle time
•
Utilization improving
Key Market Drivers
Current Market Overview
Transocean Fleet
(2)
-
18
Global Fleet
(9)
-
56
3 available
through 1H12
16
Contracted
Stacked
Idle
Other
5
13
10
4
3
39 |
 Deepwater
Opportunities Deepwater Opportunities
•
Brazil: Tendering 2+ units
•
Egypt: 2 units required
•
Australia: 3 units required
•
Angola: 2 units required
17
Egypt
Angola
Brazil
Australia |
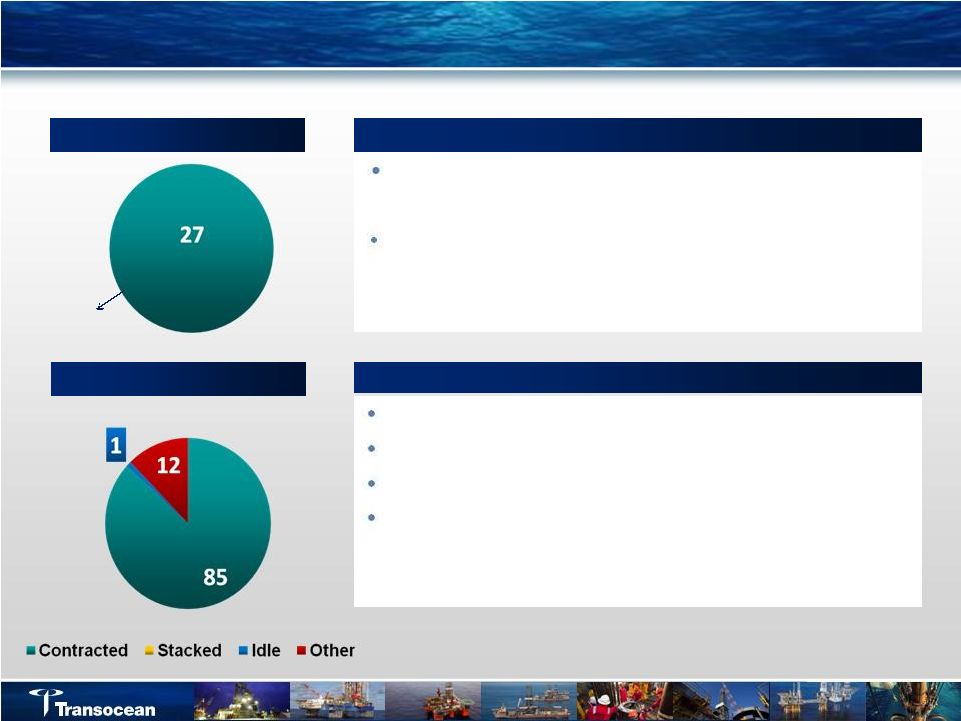 Ultra-Deepwater Strengthening
Market almost sold out in 2011
–
Petrobras has contracted four units
–
Lack of availability increases opportunity for
deepwater fleet
Market utilization over 95%
Tendering pace accelerating
Dayrates improving
Short-term availability decreasing
Key Market Drivers
Current Market Overview
Transocean Fleet
(2)
-
27
Global Fleet
(9)
-
98
1 available
through 1H12
18
Demand increasing 2H11 |
 Ultra-Deepwater Opportunities
•
India: 4 units required for 3 year terms
•
Southeast Asia: Several short term tenders
•
Nigeria: 2+ units for term work
•
UK: Strong demand for summer season
•
Norway: Undersupplied –
Customers urgent to contract
•
Australia: 1+ unit
India
Southeast Asia
Australia
Nigeria
North Sea
UK
19 |
 Long-Term
Ultra-Deepwater Outlook is Positive Long-Term Ultra-Deepwater Outlook is
Positive Philippines
India
China
Indonesia
Australia
Mozambique / Tanzania
Black Sea / Turkey
Israel
Gabon
Cote d’Ivoire
Ghana
Liberia
Sierra Leona
Brazil
USGOM
Mexico
20 |
 21
Macondo Update
Macondo Update
•
RIG internal investigation report issued on June 22, 2011
–
Concluded the incident was the result of interrelated well design,
construction, and temporary abandonment decisions that compromised the
integrity of the well
•
BOEMRE/USCG final reports expected soon
•
Continued confidence in indemnity
–
Broad indemnity in BP-Deepwater Horizon drilling contract
–
BP’s failure to honor the indemnity obligations would significantly
alter the
E&P –
Oilfield Services operating model |
 22
Key Investment Highlights -
Recap
Key Investment Highlights -
Recap
•
Industry leader committed to customers, employees, and shareholders
•
Visibility and stability due to solid backlog
•
Financial flexibility
•
Improving our fleet in accordance with strategy
•
Leveraged to global opportunities in an improving market
•
Committed to returning excess cash
–
Dividends
Standard
Jackups
High-Spec
Jackups
Midwater
Deepwater
Ultra-
Deepwater
Percent on
Contract
(1)
55%
89%
75%
72%
100% |
 Transocean
Ltd. August-September 2011 |
 24
Footnotes
Footnotes
(1)
Amounts have been restated to reflect the impact of discontinued operations.
(2)
Per Fleet Status Report issued July 13, 2011 & Fleet Update Summary issued August 17,
2011. Floaters classifications are by water depth as described in the Fleet Status
Report. Harsh Environment Floaters are included in the appropriate water depth classification. “Jackups”
includes High-Specification Jackups and Standard Jackups. Rig count is 134, plus 4
newbuilds, less one “other” rigs (one drilling barge). Rigs Under
Construction are inclusive of rigs to be accepted by the customer subsequent to August 17, 2011. “Idle” and “Stacked” rig
classifications are as described in the Fleet Status Report.
(3)
Excludes submersible rigs.
(4)
Excludes tender rigs.
(5)
“Jackups” includes High-Specification Jackups and Standard Jackups.
(6)
Calculated by multiplying the contracted operating dayrate by the firm contract period for
2011 and future periods as of the Fleet Status Report issued July 13, 2011. Firm
commitments are represented by signed drilling contracts or, in some cases, by other definitive
agreements awaiting contract execution. Our contract backlog is calculated by
multiplying the full contractual operating dayrate by the number of days remaining in
the firm contract period, excluding revenues for mobilization, demobilization and contract preparation or
other incentive provisions, which are not expected to be significant to our contract drilling
revenues. The contractual operating dayrate may be higher than the actual
dayrate we receive or we may receive other dayrates included in the contract, such as a waiting-on-weather
rate, repair rate, standby rate or force majeure rate. The contractual operating
dayrate may also be higher than the actual dayrate we receive because of a number of
factors, including rig downtime or suspension of operations. In certain contracts, the dayrate may be
reduced to zero if, for example, repairs extend beyond a stated period of time.
(7)
“Free Cash Flow Backlog” is defined as revenue backlog, plus firm mobilization revenue for contracts not started, less the following: operating
expenditures, overhead costs (except general and administrative costs), firm mobilization costs, cash income taxes, and firm
capital expenditures based on current contract backlog from the company’s Fleet Status
Report as of July 13, 2011. Includes the cash balance as of June 30, 2011. In
preparing the scheduled maturities of our debt, presented as of June 30, 2011 for future periods, we
assumed the noteholders exercise their options to require us to repurchase the 1.50% Series B
and 1.50% Series C Convertible Senior Notes in December 2011 and 2012, respectively.
(8)
“Net debt” is defined as the aggregate carrying amount of debt, net of (a) cash
and cash equivalents and (b) cash balances that are designated as security for certain
debt instruments. At June 30, 2011, Aker’s aggregate carrying amount of debt was $2.0 billion.
(9)
Data from ODS-Petrodata as of August 22, 2011. Analysis by Transocean. Includes
competitive rigs which have completed construction on or before August 22, 2011.
Jackups are defined as independent cantilever. “Other” includes, but is not limited to, rigs which are not under
contract and are en route, in port, in shipyard, out of service, undergoing acceptance
testing, or on standby. (10)
This presentation is unaudited.
|