Attached files
| file | filename |
|---|---|
| EX-21.1 - EX-21.1 - OSI SYSTEMS INC | a2205374zex-21_1.htm |
| EX-31.2 - EX-31.2 - OSI SYSTEMS INC | a2205374zex-31_2.htm |
| EX-31.1 - EX-31.1 - OSI SYSTEMS INC | a2205374zex-31_1.htm |
| EX-23.1 - EX-23.1 - OSI SYSTEMS INC | a2205374zex-23_1.htm |
| EX-32.1 - EX-32.1 - OSI SYSTEMS INC | a2205374zex-32_1.htm |
| EX-32.2 - EX-32.2 - OSI SYSTEMS INC | a2205374zex-32_2.htm |
Use these links to rapidly review the document
TABLE OF CONTENTS
OSI SYSTEMS, INC. INDEX TO CONSOLIDATED FINANCIAL STATEMENTS
UNITED STATES
SECURITIES AND EXCHANGE COMMISSION
Washington, D.C. 20549
FORM 10-K
| (Mark One) | ||
ý |
ANNUAL REPORT PURSUANT TO SECTION 13 OR 15(D) OF THE SECURITIES EXCHANGE ACT OF 1934 |
|
For the fiscal year ended June 30, 2011 |
||
OR |
||
o |
TRANSITION REPORT PURSUANT TO SECTION 13 OR 15(D) OF THE SECURITIES EXCHANGE ACT OF 1934 |
|
For the transition period from to |
||
Commission File Number 0-23125
OSI SYSTEMS, INC.
(Exact name of Registrant as specified in its charter)
| Delaware (State or Other Jurisdiction of Incorporation or Organization) |
33-0238801 (I.R.S. Employer Identification No.) |
|
12525 Chadron Avenue, Hawthorne, California (Address of Principal Executive Offices) |
90250 (Zip Code) |
Registrant's Telephone Number, Including Area Code: (310) 978-0516
Securities registered pursuant to Section 12(b) of the Act:
Common Stock, $0.001 par value
(Title of Class)
Securities registered pursuant to Section 12(g) of the Act: None
Indicate by check mark if the registrant is a well-known seasoned issuer, as defined in Rule 405 of the Securities Act. Yes: o No ý
Indicate by check mark if the registrant is not required to file reports pursuant to Section 13 or Section 15(d) of the Act. Yes: o No ý
Indicate by check mark whether the registrant (1) has filed all reports required to be filed by Section 13 or 15(d) of the Securities Exchange Act of 1934 during the preceding 12 months (or for such shorter period that the registrant was required to file such reports), and (2) has been subject to such filing requirements for the past 90 days. Yes: ý No o
Indicate by check mark whether the registrant has submitted electronically and posted on its corporate Website, if any, every Interactive Data File required to be submitted and posted pursuant to Rule 405 of Regulation S-T during the preceding 12 months (or such shorter period that the registrant was required to submit and post such files). Yes: o No o
Indicate by check mark if disclosure of delinquent filers pursuant to Item 405 of Regulation S-K is not contained herein, and will not be contained, to the best of the registrant's knowledge, in definitive proxy or information statements incorporated by reference in Part III of this Form 10-K or any amendment to this Form 10-K. o
Indicate by check mark whether the registrant is a large accelerated filer, an accelerated filer, a non-accelerated filer or a smaller reporting company. See definitions of "large accelerated filer," "accelerated filer" and "smaller reporting company" in Rule 12b-2 of the Exchange Act.
Large accelerated filer o Accelerated filer ý Non-accelerated filer o Smaller reporting company o
Indicate by check mark whether the registrant is a shell company (as defined in Rule 12b-2 of the Exchange Act). Yes: o No ý
The aggregate market value of the registrant's voting and non-voting Common Stock held by non-affiliates computed by reference to the price at which the Common Stock was last sold on December 31, 2010, the last business day of the registrant's most recently completed second fiscal quarter, was $660,307,272.
The number of shares outstanding of the registrant's Common Stock as of August 23, 2011 was 19,601,979.
DOCUMENTS INCORPORATED BY REFERENCE
Portions of the definitive Proxy Statement relating to the 2011 Annual Meeting of Stockholders (to be filed subsequently) are incorporated by reference into Part III.
Forward Looking Statements
This report contains "forward-looking statements" within the meaning of the Private Securities Litigation Reform Act of 1995, Section 27A of the Securities Act of 1933, as amended and Section 21E of the Securities Exchange Act of 1934, as amended. Forward-looking statements relate to expectations concerning matters that are not historical facts. Words such as "project," "believe," "anticipate," "plan," "expect," "intend," "may," "should," "will," "would," and similar words and expressions are intended to identify forward-looking statements. We believe that the expectations reflected in the forward-looking statements are reasonable, but those expectations may not prove to be correct. Important factors that could cause our actual results to differ materially from those expectations are disclosed in this report, including, without limitation, those described in Part I, Item 1, "Business," Part I, Item 1A, "Risk Factors" and Part II, Item 7, "Management's Discussion and Analysis of Financial Condition and Results of Operations" as well as elsewhere in this report and other documents previously filed or hereafter filed by us from time to time with the Securities and Exchange Commission. Such factors, of course, do not include all factors that might affect our business and financial condition. Although we believe that the assumptions upon which our forward-looking statements are based are reasonable, such assumptions could prove to be inaccurate and actual results could differ materially from those expressed in or implied by the forward-looking statements. All forward-looking statements contained in this report are qualified in their entirety by this statement. We undertake no obligation other than as may be required under securities laws to publicly update or revise any forward-looking statements, whether as a result of new information, future events or otherwise.
General
OSI Systems, Inc., together with its subsidiaries, is a vertically integrated designer and manufacturer of specialized electronic systems and components for critical applications. We sell our products and provide related services in diversified markets, including homeland security, healthcare, defense and aerospace. Our company was originally incorporated in 1987 in California. In March 2010, we reincorporated our company in the State of Delaware. Our principal office is located at 12525 Chadron Avenue, Hawthorne, California 90250.
We have three operating divisions: (a) Security, providing security and inspection systems, turn-key security screening solutions and related services; (b) Healthcare, providing patient monitoring, diagnostic cardiology and anesthesia systems; and (c) Optoelectronics and Manufacturing, providing specialized electronic components for the Security and Healthcare divisions, as well as for applications in the defense and aerospace markets, among others.
Through our Security division, we design, manufacture, market and service security and inspection systems under the "Rapiscan Systems" trade name. Rapiscan Systems products fall into four categories—baggage and parcel inspection; cargo and vehicle inspection; hold (checked) baggage screening; and people screening. They are used to search for weapons, explosives, drugs and other contraband as well as for the safe, accurate and efficient verification of cargo manifests for the purpose of assessing duties and monitoring the export and import of controlled materials. We also provide turn-key security screening solutions under the "S2" trade name, which can include the construction, staffing and long-term operation of security screening checkpoints for our customers.
Through our Healthcare division, we design, manufacture, market and service patient monitoring, diagnostic cardiology and anesthesia delivery and ventilation systems worldwide to end users primarily under the "Spacelabs" trade name. These products are used by care providers in critical care, emergency and perioperative areas within hospitals as well as physicians' offices, medical clinics and ambulatory surgery centers.
Through our Optoelectronics and Manufacturing division, we design, manufacture and market optoelectronic devices and provide electronics manufacturing services worldwide for use in a broad range of applications, including aerospace and defense electronics, security and inspection systems, medical imaging and diagnostic devices, computed tomography (CT) products, telecommunications equipment, industrial automation systems,
automotive diagnostic tools and renewable energy technologies. We sell our optoelectronic devices under the "OSI Optoelectronics" trade name and perform our electronics manufacturing services under the "OSI Electronics" trade name. We provide our optoelectronic devices and electronics manufacturing services to original equipment manufacturers, as well as to our own Security and Healthcare divisions.
In fiscal 2011, revenues from the Security division amounted to $294.7 million, or approximately 45% of our revenues; revenues from the Healthcare division amounted to $215 million, or approximately 33% of our revenues; and third-party revenues from the Optoelectronics and Manufacturing division amounted to $146.4 million, or approximately 22% of revenues. Additional financial information concerning reporting segments and geographic areas is available in our Consolidated Financial Statements, Note 14.
Industry Overview
We sell our security and inspection systems and patient monitoring, diagnostic cardiology and anesthesia systems primarily to end-users, while we design and manufacture our optoelectronic devices and value-added subsystems primarily for original equipment manufacturers.
Security. A variety of technologies are currently used worldwide in security and inspection applications, including transmission and backscatter X-ray, computed tomography, metal detection, trace detection, gamma-ray and neutron analysis. We believe that the market for security and inspection products will continue to be affected by the threat of terrorist incidents and by new government mandates and appropriations for security and inspection products in the United States and internationally.
As a result of the September 11, 2001 terrorist attacks on the World Trade Center and subsequent attacks in other locations worldwide, security and inspection products have increasingly been used at a wide range of facilities other than airports, such as border crossings, railway stations, seaports, cruise line terminals, freight forwarding operations, sporting venues, government and military installations and nuclear facilities. Congress passed the Aviation and Transportation Security Act and integrated many U.S. security-related agencies, including the Federal Aviation Administration, into the U.S. Department of Homeland Security. Under its directive from Congress, the U.S. Department of Homeland Security has since undertaken numerous initiatives to prevent terrorists from entering the country, hijacking airliners, and obtaining and trafficking in weapons of mass destruction and their components, to secure sensitive U.S. technologies and to identify and screen high-risk cargo before it is loaded onto airlines and ships, among others. These initiatives, known, for example, as the Strategic Border Initiative, the Customs-Trade Partnership Against Terrorism and the U.S. Customs and Border Protection Container Security Initiative, have resulted in an increased demand for security and inspection products.
Certain of the government sponsored initiatives in the United States, such as the U.S. Customs and Border Protection Container Security Initiative and the Customs-Trade Partnership Against Terrorism, have also stimulated security programs in other areas of the world because the U.S. initiatives call on other nations to bolster their port security strategies, including acquiring or improving their security and inspection equipment and screening operations. The international market for non-intrusive inspection equipment and related services, therefore, continues to expand as countries that ship goods directly to the United States participate in such programs and as they choose to procure and operate equipment in order to secure their own borders, transportation networks, facilities and other venues.
Congress also passed legislation that calls for the inspection of international maritime cargo destined for the United States, domestic civil aviation cargo, and for radiological and nuclear threats in cargo entering the United States. Certain of our cargo and vehicle inspection systems are already being used internationally and by the U.S. government to comply with these standards.
2
Following recommendations outlined in the "9/11 Commission Report," issued by the National Commission on Terrorist Attacks Upon the United States, the U.S. Department of Homeland Security now requires the screening of all cargo carried on passenger airlines in the United States. Several of our hold (checked) baggage and cargo screening systems have been approved by the U.S. Department of Homeland Security for this purpose and are being procured and used by freight forwarders, airlines, transportation companies and other businesses to fulfill their compliance requirements.
Following an attempted bombing on an airline flight destined for Detroit, Michigan on Christmas Day 2009, during which a passenger tried to detonate explosives concealed beneath his clothing, the U.S. Government initiated the widespread deployment of advanced imaging technology systems (body-scanners)—such as our Secure 1000 system—to U.S. airport checkpoints. These systems are used to detect both metallic and non-metallic threat objects concealed in or under clothing. This incident also prompted foreign governments to initiate similar deployments at other airports across the world.
Furthermore, the U.S. Department of Homeland Security's Science and Technology Directorate has recently supported the development of new security inspection technologies and products. Our Security division participates in a number of such research and development efforts, including projects to develop new technologies for radiation and nuclear materials detection, aviation screening and suicide bomber detection. The Science and Technology Directorate has also initiated programs for the development of technologies capable of protecting highways, railways and waterways from terrorist attack.
In addition, the U.S. Department of Defense has invested heavily in technologies and services that screen would-be attackers before they are able to harm U.S. and allied forces. These technologies include products that can screen personnel, vehicles and other containers for the presence of explosives, improvised explosive devices (IEDs), weapons and other contraband.
Similar initiatives and new regulations promulgated by international organizations such as the European Union have resulted in a growing worldwide demand for airline, cargo, port and border inspection technologies. For example, the European Union has issued uniform performance standards for systems that screen baggage and people at aviation checkpoints and air cargo, as well as new directives related specifically to maritime security, among others.
As a result of these and other changes, sales of our security and inspection products have grown as compared to pre-September 11, 2001 levels. Major projects recently installed or currently underway include installations at airports, ports and border crossings, government and military facilities and other locations in the United States and throughout the world. These projects contain various inspection product offerings. We anticipate that there may be growing demand from governments and commercial enterprises for increasingly sophisticated, turn-key, security screening solutions.
Healthcare. Healthcare has been, and we believe will continue to be, a growing sector throughout much of the world. Many developing countries in Asia and Latin America are expected to continue to build healthcare infrastructure to serve expanding middle class populations. In developed countries, including the United States and Europe, an aging population is expected to fuel growth for many years.
Many factors such as a nursing shortage in the United States and Europe, stricter government requirements affecting staffing and accountability as well as shrinking reimbursements from health insurance organizations are forcing healthcare providers to do more with less. Our Healthcare division designs, manufactures and markets products that respond to these economic forces by helping hospitals reduce costs while maintaining or improving the quality of care their physicians and nurses are able to deliver.
3
We are a global manufacturer and distributor of patient monitoring, cardiac diagnostic and clinical networking solutions for use primarily in hospitals. We design, manufacture and market patient monitoring solutions for critical, emergency and perioperative care areas of the hospital, wired and wireless networks, and ambulatory blood pressure monitors, all aimed at providing caregivers with timely patient information. Our cardiac diagnostic systems include Holter recorders and analyzers, ambulatory blood pressure, ECG, stress event data management systems and related software and services. By making critical patient information more readily accessible both inside and outside the hospital, delays in decision-making can be reduced, length of stay can be shortened and treatment errors can be minimized.
We are also a global manufacturer and distributor of anesthesia delivery systems, ventilators and vaporizers. We sell these products primarily to hospitals for use in operating rooms and anesthesia induction areas as well as in magnetic resonance imaging (MRI) facilities. We also sell subsystems and components, such as anesthesia vaporizers and ventilators to pharmaceutical companies and other manufacturers of anesthesia delivery systems.
Optoelectronics and Manufacturing. Our optoelectronic devices are used in a wide variety of applications for diversified markets including the aerospace and defense, avionics, medical imaging and diagnostic, renewable energy, biochemistry analysis, pharmaceutical, nanotechnology, telecommunications, construction and homeland security markets. Medical applications for our devices include diagnostic and imaging products, computed tomography (CT) scanners, patient monitoring equipment, optometry instrumentation, and glucose monitors. Aerospace and defense applications for our devices include satellite navigation sensors, laser guided munitions systems, range finders, weapons simulation systems, computer peripherals and other applications that require the conversion of optical signals into electronic signals. Homeland security applications for our devices include X-ray based and other detection systems. Our optoelectronic devices and value-added subsystems are also used in a wide variety of measurement control, monitoring and industrial applications and are key components in telecommunications technologies. We also offer electronics manufacturing services to our optoelectronics customers, as well as to our Security and Healthcare divisions. We offer full turn-key and box-build manufacturing services, in which we provide product design and development, supply chain management, and production manufacturing services.
We believe that continued advances in technology and reductions in the cost of key components of optoelectronic systems, including computer processing power and memory, have broadened the market by enabling the use of optoelectronic devices in a greater number of applications. In addition, we see a trend among original equipment manufacturers to increasingly outsource the design and manufacture of optoelectronic devices as well as value-added subsystems to fully-integrated, independent manufacturers, like us, who may have greater specialization, broader expertise and the flexibility to respond in shorter time periods than they can accomplish in-house. We believe that our level of vertical integration, substantial engineering resources, expertise in the use and application of optoelectronic technology and low-cost international manufacturing operations enable us to compete effectively in the market for optoelectronic devices and for electronics manufacturing services.
We have also penetrated several related markets that depend on our optoelectronic technologies and electronics manufacturing capabilities. For example, we sell a series of high-speed photodetectors for use in fiber optic systems such as gigabit ethernet, fiber channel and other telecommunication and data communication applications. Through system engineering and product development, we also develop, manufacture and sell laser-based remote sensing devices that are used to detect and classify vehicles in toll and traffic management systems.
Growth Strategy
We believe that one of our primary competitive strengths is our expertise in the cost-effective design and manufacture of specialized electronic systems and components for critical applications. As a result, we have leveraged, and intend to continue to leverage, such expertise and capacity to gain price, performance and agility advantages over our competitors in the security, healthcare and optoelectronics fields, and to translate such
4
advantages into profitable growth in those fields. At the same time, we continually seek to identify new markets in which our core expertise and capacity will provide us with competitive advantages. Key elements of this strategy include:
Capitalizing on Global Reach. We operate from locations throughout the world. We view our international operations as providing an important strategic advantage over competitors. First, international manufacturing facilities allow us to take advantage of competitive labor rates and favorable tax regulations in order to be a low cost producer. Second, our international offices strengthen our sales and marketing efforts and our ability to service and repair our systems by providing direct access to growing markets and to our existing international customer base. Third, multiple manufacturing locations allow us to reduce delivery times to our global customer base. In the future, we intend to continue to enhance our international manufacturing and sales capabilities.
Capitalizing on Vertical Integration. Our vertical integration provides several advantages in each of our divisions. These advantages include reduced manufacturing and delivery times, lower costs due to our access to competitive international labor markets, direct sourcing of raw materials and quality control. We also believe that we offer significant added value to our customers by providing a full range of vertically-integrated services including component design and customization, subsystem concept design and application engineering, product prototyping and development, efficient pre-production and short-run and high volume manufacturing. We believe that our vertical integration differentiates us from many of our competitors and provides value to our customers who can rely on us to be an integrated supplier. We intend to continue to leverage our vertically integrated services to create greater value for our customers in the design and manufacture of our products.
Capitalizing on the Growing Market for Security and Inspection Systems. Attentiveness to terrorist and other security threats may continue to drive growth in the market for security and inspection systems, not only in transportation security, but also at ports and border crossings, government installations, military facilities and public event venues. The trend toward increased screening of goods entering and departing from ports has resulted and may continue to result in growth in the market for cargo inspection systems and turn-key security screening services that are capable of screening shipping containers for contraband and assisting customs officials in the verification of shipping manifests. Package and cargo screening by freight forwarders, airlines and air cargo companies represents a growing sector, as new regulations in the U.S. and Europe require such screening in certain circumstances. We intend to expand our sales and marketing efforts both domestically and internationally, to capitalize on opportunities to replace, service and upgrade existing security installations, and to offer turn-key security screening solutions in which we may construct, staff and/or operate on a long-term basis security screening checkpoints for our customers. Finally, we also intend to continue to develop new security and inspection technologies, such as our proprietary real time tomography products, and to enhance our current product and services offerings through internal research and development and selective acquisitions.
Improving and Complementing Existing Medical Technologies. We develop and market patient monitoring systems, diagnostic cardiology products, anesthesia delivery systems, ventilators and vaporizers. We are able to market and sell many of our product offerings through shared sales channels and distribution networks. Our efforts to develop new products and improve our existing medical technologies are focused on the needs of care providers and their patients. By making decision-critical patient information available to clinicians at the bedside, throughout a hospital, or even away from the hospital, our products reduce time demands on physicians and nurses, enabling more rapid treatment decisions and improved patient care. Our efforts to improve existing diagnostic cardiology and anesthesia delivery technologies will also continue to concentrate on providing products that are flexible and intuitive to use so that clinicians can deliver accurate, precise, reliable and cost-effective care.
Selectively Entering New Markets. We intend to continue to selectively enter new markets that complement our existing capabilities in the design, development and manufacture of specialized electronic systems and components for critical applications such as security inspection and patient monitoring, diagnostic cardiology and anesthesia systems. We believe that by manufacturing products that rely on our existing technological capabilities,
5
we will leverage our integrated design and manufacturing infrastructure to capture greater margins and build a larger presence in new markets that present attractive competitive dynamics. We intend to achieve this strategy through internal growth and through selective acquisitions.
Acquiring New Technologies and Companies. Our success depends in part on our ability to continually enhance and broaden our product offerings in response to changing technologies, customer demands and competitive pressures. We have developed expertise in our various lines of business and other areas through internal research and development efforts as well as through selective acquisitions. As a vertically integrated designer and manufacturer of specialized electronic systems and components for critical applications, we have consistently looked for acquisition opportunities to broaden our technological expertise and capabilities, lower our manufacturing costs and facilitate our entry into new markets.
Products and Technology
We design, develop, manufacture and sell products ranging from security and inspection systems to patient monitoring, diagnostic cardiology and anesthesia systems to discrete optoelectronic devices and value-added subsystems.
Security and Inspection Systems. We design, manufacture and market security and inspection systems worldwide to end users under the "Rapiscan Systems" trade name. Rapiscan Systems products are used to inspect baggage, cargo, people, vehicles and other objects for weapons, explosives, drugs and other contraband. These systems are also used for the safe, accurate and efficient verification of cargo manifests for the purpose of assessing duties and monitoring the export and import of controlled materials. Rapiscan Systems products fall into four categories: baggage and parcel inspection, cargo and vehicle inspection, hold (checked) baggage screening and people screening. We also offer turn-key security screening services under the "S2" trade name, including the staffing and operation of security screening checkpoints.
As a result of the terrorist attacks of September 11, 2001, and subsequent attacks in other locations worldwide, security and inspection products have increasingly been used at a wide range of facilities other than airports, such as border crossings, railway stations, seaports, cruise line terminals, freight forwarding operations, government and military installations and nuclear facilities. As a result of the additional markets, we have diversified our sales channels for security and inspection products.
Many of our security and inspection systems include dual- or multi-energy X-ray technology with computer software enhanced imaging technology to facilitate the detection of materials such as explosives, weapons, narcotics, currency or other contraband. While all X-ray systems produce a two-dimensional image of the contents of the inspected object, the dual-energy X-ray systems also measure the X-ray absorption of the inspected object's contents at two X-ray energies to determine the atomic number, mass and other characteristics of the object's contents. The various organic and inorganic substances in the inspected object appear to operators of the inspection systems in various colors and this visual information can be used to identify and differentiate the inspected materials. We have developed a dual-view X-ray technology, now available on many of our systems, that allows operators to examine objects from two orthogonal positions simultaneously, thereby reducing the need for re-scanning of objects and improving the operator's ability to detect threats. Our baggage and parcel inspection, cargo and vehicle inspection and hold baggage screening inspection systems range in size from compact tabletop systems to large systems comprising entire buildings in which trucks, shipping containers or pallets are inspected. Many of our inspection systems are also designed to be upgradeable to respond to new customer requirements as they emerge or change.
Our cargo and vehicle inspection applications, in which cars, trucks, shipping containers, pallets and other large objects can be inspected, are designed in various configurations, including fixed-site, gantry, relocatable, portal and mobile systems. These products are primarily used to verify the contents of cars, trucks or cargo
6
containers and to detect the presence of contraband, including narcotics, weapons, explosives, and other smuggled items. They offer significant improvements over past methods of cargo screening, such as manual searches, as our cargo systems are faster, more thorough and do not subject the cargo to pilferage. Entire shipping containers or trucks containing densely packed goods can be screened rapidly.
Many of our cargo and vehicle inspection systems utilize X-ray or gamma-ray beams, in conjunction with digital imaging equipment, to non-intrusively inspect objects and present images to an inspector, showing shapes, sizes, locations and relative densities of the contents. Many of these systems have been built to meet specific customer inspection requirements. Other cargo and vehicle inspection products non-intrusively detect chemical signatures indicating the presence of explosives and other contraband through the use of pulsed fast neutron and thermal neutron technologies. These technologies permit the operator to inspect cargo, vehicles and containers based on the distinctive chemical composition of explosives, drugs or other contraband.
Our Security division is the only competitor in the market offering X-ray, gamma-ray and neutron-based material specific technologies. In addition, we are the only competitor that offers inspection systems at energy levels ranging from 200 KeV (Kilo electron Volts), to 1 MeV, 4.5 MeV, 6 MeV and 9MeV (Mega electron Volts). As a result, we believe that we offer the broadest technology platform in the cargo and vehicle inspection systems industry. This broad platform also permits us to offer customers hybrid solutions utilizing two or more of the technologies together, thereby optimizing flexibility, performance and cost to meet the customer's unique application requirements.
Our Security division also offers hold (checked) baggage screening systems that are utilized by airports, freight forwarders, and other parties responsible for screening baggage and cargo before it is placed in the cargo hold of airplanes. Certain of our currently available systems utilize multiple, dual-energy X-ray beams to provide high-quality images and to enable detection algorithms that assist operators in the detection of explosives. Other systems utilize a very large number of distributed X-ray emitters that rapidly capture approximately 1,000 views of a bag and then utilize sophisticated software to reconstruct high resolution images. These systems are designed to meet the high-speed screening and analysis demands of our customers. They can be operated in stand-alone mode, where a single operator views the images produced by a single system, or can be networked, allowing operators stationed at a remote computer terminal to monitor multiple systems.
Our Security division also offers people screening products, such as a line of "Metor" brand walk-through metal detection products for use at security checkpoints at airports, amusement parks, banks, courthouses, government buildings, sports arenas and other venues, and the Secure 1000 personnel screener, which uses extremely low dose backscatter X-ray imaging to detect contraband and weapons concealed underneath clothing and hair. The Secure 1000 provides enhanced screening when compared to metal detectors as it displays anomalies caused by very small amounts of metal as well as non-metallic items. As a result, the Secure 1000 can simultaneously assist in the location and detection of conventional metal weapons, as well as ceramic knives, explosives, illicit drugs, precious metals, cameras, recording devices and other contraband or security threats.
7
The following table sets forth certain information related to the standard security and inspection products that we currently offer. We do, however, also customize our standard products to suit specific applications and customer requirements.
PRODUCT LINE
|
PRODUCT NAME / PRODUCT FAMILY |
TECHNOLOGY
|
MARKET SEGMENT
|
|||
|---|---|---|---|---|---|---|
Baggage and Parcel Inspection |
Rapiscan 600 series X-ray systems |
Single and dual-energy X-ray | Checkpoint inspection at airports, prisons, border crossings, government buildings, postal facilities for mail screening | |||
Cargo and Vehicle Inspection |
Rapiscan Eagle Rapiscan VEDS Rapiscan GaRDS |
High energy X-ray Thermal neutron analysis Gamma ray |
Cargo and vehicle inspection at airports, border crossings and sea ports | |||
Hold Baggage Screening |
Rapiscan MVXR 5000 Rapiscan RTT |
Multi-view, dual energy X-ray Computed Tomography |
Baggage inspection at airports and freight forwarding facilities | |||
People Screening |
Metor series metal detectors Rapiscan Secure 1000 |
Electromagnetic induction Backscatter X-ray |
Checkpoint inspection at airports, border crossings, stadiums, prisons and government facilities | |||
Patient Monitoring, Diagnostic Cardiology and Anesthesia Systems. Our Healthcare businesses design, manufacture and market their products worldwide to end users primarily under the "Spacelabs" trade name.
Spacelabs products include patient monitors for use in perioperative, critical care and emergency care environments with neonatal, pediatric and adult patients. Our patient monitoring systems comprise monitors and central nursing stations connected via hardwired or wireless networks, as well as stand-alone monitors where the patient data can be transported physically from one monitor to another as the patient is moved. This ensures that hospital staff can access patient data where and when it is required. In addition, these products are designed with an "open architecture" to interact with hospital information systems. Many of these products allow clinicians to view and control various software applications on the patient monitor's display, eliminating the need for separate computer terminals in the patient's room. Attending nurses can check laboratory results and other reports, enter orders, review protocols and complete medical charting at the patient's bedside.
For electrocardiograph monitoring or multiparameter monitoring of ambulatory patients, we offer a digital telemetry system. The system operates in government-protected bands, not used for private land mobile radio, business radio services or broadcast analog and digital television. Our Ultraview digital telemetry solution comprises a lightweight and compact transmitter that enables monitoring of heart rate, ST segment, arrhythmia and continuous SpO2 (pulse oximetry) monitoring.
In 2010, we launched the Ultraview DM3 dual-mode vital signs monitor. The Ultraview DM3 may function as either a spot check monitor or continuous function monitor, and provides caregivers with a dual-mode solution for accurately and efficiently measuring vital signs on adult and pediatric patients. We also introduced the Ultraview SL2900 Dual Display monitor. The Ultraview SL2900 is designed to support the clinical requirements of the highest acuity environments. Dual displays allow a dedicated, full-screen view of real-time physiologic waveforms and alarms, plus an independent, full-screen presentation of charting and clinical applications.
In April 2011, we introduced the XPREZZON patient monitor. It incorporates a high-resolution display to provide crisp and visually rich patient information that can be accessed with a single touch, all designed to enhance patient care and ease of use. XPREZZON is the first patient monitor sensitive to a patient's need for a good night's
8
rest. It dims the display in low ambient light. It also delivers patient information to mobile devices, allowing clinicians to monitor their patients anywhere they have mobile access.
Our Healthcare division also develops cardiac diagnostic systems, including Holter analyzers and recorders. Our Pathfinder and Impresario lines of Holter analyzers offer users interactive control with advanced diagnostic parameters. Our evo Holter recorders provide low cost of ownership through, for example, the elimination of disposable batteries, memory cards with no moving parts to maintain and other advances. Our Lifecard CF Aria recorders are worn by patients for up to seven days in order to capture heart arrhythmias that may occur in a patient only a few times per week. Patients that may be experiencing even less frequent heart arrhythmias wear our CardioCall product, which stays with the patient over several weeks and transmits its findings over the phone to a receiving station in the hospital.
In February 2011, we introduced the Pathfinder SL, a Holter analysis solution that delivers innovative technology, rapid analysis and enhanced accuracy in the exploration of a patient's cardiac condition. Pathfinder SL offers a significant new advancement in the capability of Holter analyzers by providing full analysis for up to a full seven days of continuous recording, in one analysis process and one report.
We are also a leading supplier of ambulatory blood pressure monitors which are routinely used in many European countries, clinical research organizations and are increasingly being used in the United States. Many physicians are using ambulatory blood pressure monitoring to detect "white coat" hypertension, a condition in which people experience elevated blood pressure in the doctor's office, but not in their daily lives. Ambulatory blood pressure monitoring is also used to adjust drug therapies for hypertensive patients. Ambulatory blood pressure monitoring helps improve diagnostic accuracy and minimize the associated costs of treatment
In February 2011, we introduced Sentinel Cardiology Information Management System 8, the latest version of our Sentinel product, which integrates data from Spacelabs-branded products into a central database that can be accessed by care providers and medical facility administrators. The Sentinel therefore provides enhanced workflow and efficiencies by centralizing recordings and reports into an enterprise wide system.
Our anesthesia delivery and ventilation group designs and manufactures anesthesia delivery systems, anesthesia vaporizers and ventilators. Our BleaseSirius, BleaseFocus, and BleaseGenius anesthesia delivery systems provide flexible anesthesia solutions for operating room environments, anesthesia induction areas, day surgery centers, magnetic resonance imaging facilities and other locations where the administration of anesthesia is required. Our BleaseDatum anesthesia vaporizers and Blease 700/900 anesthesia ventilators are also designed to be compatible with the anesthesia delivery systems of several other manufacturers.
Recently, we added several new ventilation capabilities to our existing product line in order to provide clinicians with enhanced control over the delivery of ventilation and the ability to more finely tune their requirements to a surgical procedure and to the individual patient. For example, the BleaseSirius Electronic Flow Meter gives the physician the ability to view information electronically rather than relying on traditional glass flow tubes, and provides data transfer to electronic patient medical record systems.
9
The following table sets forth a description of the more significant healthcare products that we currently offer:
PRODUCT LINE
|
PRODUCT NAME / PRODUCT FAMILY |
MARKET SEGMENT
|
||
|---|---|---|---|---|
Patient Monitoring and Connectivity |
Xprezzon Ultraview SL Intesys Clinical Suite G2 ICS Xprezz élance |
All hospital care areas; outpatient surgery centers; and physician offices | ||
Diagnostic Cardiology |
Ambulatory blood pressure monitors Impresario Pathfinder CardioCall Lifecard evo CardioExpress ECG machines CardioDirect Stress Testing Systems Sentinel Cardiology Data Management |
All hospital cardiology care areas and physician offices | ||
Anesthesia Delivery and Ventilation |
Blease 700 and 900 series ventilators BleaseSirius BleaseSirius EFM BleaseDatum Vaporizer BleaseFocus BleaseGenius |
Ambulatory surgery centers and operating rooms | ||
Optoelectronic Devices and Manufacturing Services. Optoelectronic devices generally consist of both active and passive components. Active components sense light of varying wavelengths and convert the light detected into electronic signals, whereas passive components amplify, separate or reflect light. The active components we manufacture consist of silicon, gallium arsenide and indium gallium arsenide photodetectors and light sources. Passive components include lenses, prisms, filters, mirrors and other precision optical products that are used by us in the manufacture of our optoelectronic products or are sold to others for use in telescopes, laser printers, copiers, microscopes and other detection and vision equipment. The devices we manufacture are both standard products and products customized for specific applications and are offered either as components or as subsystems. For example, we have developed two-dimensional back-illuminated detector technology for security, medical and industrial computed tomography (CT) applications. This technology overcomes the limitations of conventional detectors by providing finer detector pitch density. This is used in high-resolution multi-slice CT scanners and other applications requiring improved image resolution. Our optoelectronic products and services are provided primarily under the "OSI Optoelectronics" trade name.
In addition to the manufacture of standard and original equipment manufacturer products, we also specialize in designing and manufacturing customized value-added subsystems for use in a wide range of products and equipment. An optoelectronic subsystem typically consists of one or more optoelectronic devices that are combined with other electronic components and packaging for use in an end product. The composition of a subsystem can range from a simple assembly of various optoelectronic devices that are incorporated into other subsystems (for example, a printed circuit board containing our optoelectronic devices) to complete end-products (for example, pulse oximetry equipment).
We also provide electronics design and manufacturing services both in North America and in the Asia Pacific region with enhanced, RoHS-compliant, printed circuit board and cable and harness assemblies and box-build manufacturing services utilizing state-of-the-art automated surface mount technology lines. We offer electronics manufacturing services for data and signal processing, amplifier and processor boards for medical equipment, musical tuning and studio hardware, motor controls, power supplies, and several other industrial applications that
10
do not utilize optoelectronic devices. Our electronics manufacturing services are provided primarily under the "OSI Electronics" trade name.
We develop, manufacture and sell laser-based remote sensing devices that are used to detect and classify vehicles in toll and traffic management systems under the "OSI Laserscan" trade name and blood pressure cuffs and unifusors for drug delivery applications under the "Statcorp Medical" trade name. During fiscal 2011, our optoelectronics and manufacturing division also began offering solid-state laser products for aerospace, defense, telecommunication and medical applications under the "OSI LaserDiode" trade name.
Markets, Customers and Applications
Security and Inspection Products. Most security and inspection products were developed in response to civilian airline hijackings. Consequently, a significant portion of our security and inspection products have been and continue to be sold for use at airports. However, our security and inspection products are also used for security purposes at locations in addition to airports, such as border crossings, shipping ports, military and other government installations, freight forwarding facilities, high-profile locations such as Buckingham Palace, the Kremlin and the Vatican and for high-profile events such as the Olympic Games and World Cup Finals. Furthermore, as terrorist attacks continue to occur, overall transportation and travel industry demands have increased, resulting in heightened attention for our security and inspection products. We also provide turn-key security screening solutions, which can include the construction, staffing and long-term operation of security screening locations for our customers.
Our customers include, among many others, the U.S. Transportation Security Administration, U.S. Customs and Border Protection, U.S. Department of Defense and Federal Bureau of Prisons, in the United States, as well as Her Majesty's Revenue and Customs and Manchester Airport Group in the United Kingdom, Chek Lap Kok Airport in Hong Kong, Ben Gurion International Airport in Israel, the Malaysian Airport Board in Malaysia and the Port Authority of San Juan, Puerto Rico.
Patient Monitoring, Diagnostic Cardiology and Anesthesia Systems. Our patient monitoring, diagnostic cardiology and anesthesia systems are manufactured and distributed globally for use in critical care, emergency and perioperative areas within hospitals as well as physicians' offices, medical clinics and ambulatory surgery centers. We also provide wired and wireless networks and clinical information access solutions, ambulatory blood pressure monitors and medical data services.
We have sold these products to organizations such as Eisenhower Medical Center in Rancho Mirage, California, Spartanburg Regional Medical Center in Spartanburg, South Carolina, LSU Medical Center in Shreveport, Louisiana, Schüchtermannklinik in Germany, LKW Villach in Austria and Universitätsspital Zürich in Switzerland, among many other organizations, including Premier, Inc., a hospital and healthcare system alliance with approximately 1,500 affiliated hospitals and other healthcare sites.
Optoelectronic Devices and Electronics Manufacturing Services. Our optoelectronic devices and the electronics we manufacture are used in a broad range of products by a variety of customers. For example, they are utilized by customers in the following market segments: aerospace and avionics; analytical and medical imaging; healthcare; telecommunications; homeland security; military defense; office automation; toll and traffic management; and automotive diagnostic systems. Major customers in these segments include ITT Corporation, Raytheon, Honeywell, FLIR Systems, Gilardoni, Bayer, Covidien, Smiths Medical, Conmed Corporation, Inogen, Beckman Coulter, JDS Uniphase, SCM, Lockheed Martin, United Technologies, Northrop Grumman, Wincor, Digi-Key Corporation and Bosch (Vetronix), among others.
11
Marketing, Sales and Service
We market and sell our security and inspection products and turn-key security screening solutions worldwide through a direct sales and marketing staff located in North America, Europe, Asia and Australia, in addition to an expansive global network of independent distributors. This sales staff is supported by a service organization located primarily in North America, Europe and Asia, as well as a global network of independent distributors. We also support these sales and customer relations efforts by providing operator training, computerized training and testing equipment, in-country service support, software upgrades and service training for customer technicians.
We market and sell our patient monitoring, diagnostic cardiology and anesthesia systems worldwide through a direct sales and marketing staff located in North America, Europe and Asia, in addition to a global network of independent distributors. We also support these sales and customer service efforts by providing operator in-service training, software updates and upgrades and service training for customer biomedical staff and distributors.
We market and sell our optoelectronic devices and value-added manufacturing services, through both a direct sales and marketing staff located in North America, Europe and Asia, and indirectly through a global network of independent sales representatives and distributors. Our sales staff is supported by an applications engineering group whose members are available to provide technical support, which includes designing applications, providing custom tooling and process integration and developing products that meet customer defined specifications.
We consider our maintenance service operations to be an important element of our business. After the expiration of our standard product warranty periods, we are sometimes engaged by our customers to provide maintenance services for our security and inspection products through annual maintenance contracts. In addition, we believe that our expertise in installing, maintaining and operating our security inspection products is an important factor for customers that are considering engaging us to provide turn-key security screening solutions. We provide a variety of service and support options for our patient monitoring, diagnostic cardiology and anesthesia systems customers, ranging from complete on-site repair and maintenance service and telephone support to parts exchange programs for customers with the internal expertise to perform a portion of their own service needs. We believe that our international maintenance service capabilities allow us to be competitive in selling our security and inspection systems as well as our patient monitoring, diagnostic cardiology and anesthesia systems. Furthermore, we believe that as the installed base of both our security and inspection systems and patient monitoring, diagnostic cardiology and anesthesia systems increases, revenues generated from such annual maintenance service contracts and from the sale of replacement parts will increase.
Research and Development
Our security and inspection systems are primarily designed at our facilities in the United States and internationally in Finland, Malaysia, India and the United Kingdom. These products include mechanical, electrical, analog electronic, digital electronic and software subsystems, which are all designed by us. In addition to product design, we provide system integration services to integrate our products into turn-key systems at the customer site. We support cooperative research projects with government agencies and provide contract research for government agencies.
Our patient monitoring, diagnostic cardiology and anesthesia systems are primarily designed at our facilities in the United States and internationally in China, India and the United Kingdom. Such systems include mechanical, electrical, digital electronic and software subsystems, all of which are designed by us. We are also currently involved, both in the United States and internationally, in several research projects aimed at improving our medical systems and at expanding our current product line.
We design and manufacture optoelectronic devices and we provide electronics manufacturing services primarily in our facilities in the United States and internationally in India, Indonesia, Malaysia and Singapore. We engineer and manufacture subsystems to solve the specific application needs of our original equipment
12
manufacturer customers. In addition, we offer entire subsystem design and manufacturing solutions. We consider our engineering personnel to be an important extension of our core sales and marketing efforts.
In addition to close collaboration with our customers in the design and development of our current products, we maintain an active program for the development and introduction of new products, enhancements and improvements to our existing products, including the implementation of new applications of our technology. We seek to further enhance our research and development program and consider such program to be an important element of our business and operations. As of June 30, 2011, we engaged approximately 428 full-time engineers, technicians and support staff. Our research and development expenses were $36.9 million in fiscal 2009, $38.6 million in fiscal 2010 and $45.4 million in fiscal 2011. We intend to continue to invest in our research and development efforts in the future.
Manufacturing and Materials
We currently manufacture our security and inspection systems domestically in California, Mississippi and North Carolina, and internationally in Malaysia and the United Kingdom. We currently manufacture our patient monitoring, diagnostic cardiology and anesthesia systems domestically in Washington and internationally in China. We currently manufacture our optoelectronic devices and provide electronics manufacturing services domestically in California, Massachusetts, Mississippi, New Jersey and Florida, and internationally in Mexico, India, Indonesia, Malaysia, and Singapore. Most of our high volume, labor intensive manufacturing and assembly activities are performed at our facilities in India, Indonesia and Malaysia. Since most of our customers are located in the United States, Europe and Asia, our ability to manufacture products in these markets and provide follow-on service from offices located in these regions is an important component of our global strategy.
Our global manufacturing organization has expertise in optoelectronic, microelectronic and integrated electronics for commercial, medical, aerospace and defense industry applications. Our manufacturing includes silicon wafer processing and fabrication, optoelectronic device assembly and screening, thin and thick film microelectronic hybrid assemblies, surface mounted and thru-hole printed circuit board electronic assemblies and electronics services, including complete turn-key and box-build manufacturing. We outsource certain manufacturing operations, including certain sheet metal fabrication and plastic components. The manufacturing process for components and subsystems consists of manual tasks performed by skilled technicians as well as automated tasks.
The principal raw materials and subcomponents used in producing our security and inspection systems consist of X-ray generators, linear accelerators, radioactive isotopes, neutron generators, detectors, data acquisition and computer systems, conveyance systems and miscellaneous mechanical and electrical components. A large portion of the optoelectronic devices, subsystems and circuit card assemblies used in our inspection and detection systems are manufactured in-house. The metal enclosures used in our baggage and parcel inspection systems are also manufactured in-house, while the X-ray generators, linear accelerators, radioactive isotopes, neutron generators and conveyance systems used in our cargo and vehicle inspection systems are purchased from unaffiliated third party providers.
The principal raw materials and subcomponents used in producing our patient monitoring, diagnostic cardiology and anesthesia systems consist of printed circuit boards, housings, mechanical assemblies, pneumatic devices, cables, filters and packaging materials. We purchase certain devices, including computers, peripheral accessories and remote displays from unaffiliated third party providers.
The principal raw materials and subcomponents used in producing our optoelectronic devices and electronic subsystems consist of silicon wafers, electronic components, light emitting diodes, scintillation crystals, passive optical components, printed circuit boards, and packaging materials. The silicon-based optoelectronic devices
13
manufactured by us are critical components in most of our products and subsystems. We purchase silicon wafers and other electronic components from unaffiliated third party providers.
For cost, quality control and efficiency reasons, at times we purchase raw materials and subcomponents only from single vendors with whom we have ongoing relationships. We do, however, qualify second sources for most of our raw materials and critical components. We purchase the materials pursuant to purchase orders placed from time to time in the ordinary course of business. Although to date none of our divisions has experienced any significant shortages or material delays in obtaining any of its raw materials or subcomponents, it is possible that they may face such shortages or delays in one or more materials in the future.
Patents, Trademarks, Tradenames and Licenses
Trademarks and Tradenames. We have used, registered and applied to register certain trademarks and service marks to distinguish our products, technologies and services from those of our competitors in the United States and in foreign countries. We enforce our trademark, service mark and trade name rights in the United States and abroad.
Patents. We hold a number of U.S. and foreign patents relating to various aspects of our security and inspection products, patient monitoring, diagnostic cardiology and anesthesia systems and optoelectronic devices and subsystems. Our current patents will expire at various times between 2011 and 2030. However, it remains possible that pending patent applications or other applications that may be filed may not result in issued patents. In addition, issued patents may not survive challenges to their validity. Although we believe that our patents have value, our patents, or any additional patents that may be issued in the future, may not be able to provide meaningful protection from competition.
Licenses. Our Security, Healthcare and Optoelectronics and Manufacturing divisions have each entered into a variety of license arrangements under which they are permitted to manufacture, market, and/or sell a limited number of the products that we offer and/or to service various types of software, data, equipment, components and enhancements to our own proprietary technology.
We believe that our trademarks and tradenames, patents and licenses are important to our business. The loss of some of our trademarks, patents or licenses might have a negative impact on our financial results and operations. However, we operate in a competitive environment with a known customer base and rely mainly on providing our customers with quality products and services to ensure continuing business. Thus, with the exception of the loss of either the Spacelabs® or Rapiscan® trademarks, the impact of the loss of any single trademark, patent or license would not likely have a material adverse effect on our business. We consider the Spacelabs® trademark an important asset and have registered it in approximately forty countries. In addition, we have instituted a similar registration program for the Rapiscan® trademark.
Regulation of Medical Products
The patient monitoring, diagnostic cardiology and anesthesia systems we manufacture and market are subject to regulation by numerous government agencies, principally the U.S. Food and Drug Administration (FDA) and by certain state and foreign authorities. They are also subject to various U.S. and foreign electrical safety standards.
The FDA has broad regulatory powers with respect to pre-clinical and clinical testing of new medical products and the designing, manufacturing, marketing and advertising of medical products. It requires that all medical devices introduced into the market be preceded either by a pre-market notification clearance order under section 510(k) of the Food, Drug and Cosmetic Act, or an approved pre-market approval application. A 510(k) pre-market notification clearance order indicates that the FDA agrees with an applicant's determination that the product for which clearance has been sought is substantially equivalent to another legally marketed medical device.
14
The clearance of a pre-market approval application, on the other hand, indicates that the FDA has determined that the device has been proven, through the submission of clinical trial data and manufacturing quality assurance information, to be safe and effective for its labeled indications. The process of obtaining 510(k) clearance typically takes between three and six months, but can take substantially longer. The pre-market approval application review process, on the other hand, can last more than a year. To date, all of the patient monitoring, diagnostic cardiology and anesthesia systems we manufacture and sell in the United States have required only 510(k) pre-market notification clearance.
Such regulatory approvals, when granted, may entail limitations on the indicated uses for which a product may be marketed, and such product approvals, once granted, may be withdrawn if problems occur after initial marketing. Manufacturers of FDA-regulated products are subject to pervasive and continuing governmental regulation, including extensive recordkeeping requirements and reporting of adverse experiences associated with product manufacture and use. Compliance with these requirements is costly, and failure to comply can result in, among other things, fines, total or partial suspension of production, product recalls, failure of the FDA to review pending marketing clearances or approval applications, withdrawal of marketing clearances or approvals or even criminal prosecution.
We are also subject to regulation in the foreign countries in which we manufacture and market our patient monitoring, diagnostic cardiology and anesthesia systems. For example, the commercialization of medical devices in the European Union is regulated under a system that presently requires all medical devices sold in the European Union to bear the CE mark—an international symbol of adherence to quality assurance standards. Our manufacturing facilities in Hawthorne, California; Issaquah, Washington; and Suzhou in China are all certified to the International Organization for Standardization's ISO 13485 standard for medical device quality management systems. Our Hawthorne, California and Issaquah, Washington facilities are also certified to the requirements of Annex II, section 3 of the Directive 93/42 1EEC on Medical Devices, which allows them to self-certify that manufactured products can bear the CE mark.
We believe we are in compliance with all applicable federal, state and foreign regulations regarding the manufacture and sale of our patient monitoring, diagnostic cardiology and anesthesia delivery systems except to an extent that would not have a material adverse effect on our business, financial condition or results of operations. Such regulations and their enforcement do, however, constantly change, and we cannot predict what effect, if any, such changes may have on our businesses in the future.
Environmental Regulations
We are subject to various federal, state and local environmental laws, ordinances and regulations relating to the use, storage, handling and disposal of certain hazardous substances and wastes used or generated in the manufacturing and assembly of our products. Under such laws, we may become liable for the costs of removal or remediation of certain hazardous substances that have been released on or in our facilities or that have been disposed of off-site as waste. Such laws may impose liability without regard to whether we knew of, or caused, the release of such hazardous substances. We have conducted Phase I environmental site assessments for each of our properties in the United States at which we manufacture products. The purpose of each such report is to identify, as of the date of such report, potential areas of environmental concern related to past and present activities or from nearby operations. In certain cases, we have conducted further environmental assessments consisting of soil and groundwater testing and other investigations deemed appropriate by independent environmental consultants. We believe that, except to an extent that would not have a material adverse effect on our business, financial condition or results of operations, we are currently in compliance with all environmental regulations in connection with our manufacturing operations, and that we have obtained all environmental permits necessary to conduct our business. The amount of hazardous substances and wastes produced and generated by us may increase in the future depending on changes in our operations. Any failure by us to comply with present or future regulations could subject us to the imposition of substantial fines, suspension of production, alteration of manufacturing process or
15
cessation of operations, any of which could have a material adverse effect on our business, financial condition and results of operations.
During one investigation, we discovered soil and groundwater contamination at our Hawthorne, California facility. We filed the requisite reports concerning this problem with the appropriate environmental authorities in fiscal 2001. We have not yet received any response to such reports, and no agency action or litigation is presently pending or threatened. We also have notified the prior owners of the facility and the present owners and tenants of adjacent properties concerning the problem and have requested from such parties agreements to toll of the statute of limitations for actions against such parties with respect to the contamination. Our site was previously used by other companies for semiconductor manufacturing similar to that presently conducted on the site by us, and it is not presently known who is responsible for the contamination or, if required, the remediation. The groundwater contamination is a known regional problem, not limited to our premises or our immediate surroundings.
Competition
The markets in which we operate are highly competitive and characterized by evolving customer needs and rapid technological change. We compete with a number of other manufacturers, some of which have significantly greater financial, technical and marketing resources than we have. In addition, these competitors may have the ability to respond more quickly to new or emerging technologies, adapt more quickly to changes in customer requirements, have stronger customer relationships, have greater name recognition and may devote greater resources to the development, promotion and sale of their products than we do. As a result, we may not be able to compete successfully against designers and manufacturers of specialized electronic systems and components, broadly speaking, or more specifically within the markets for security and inspection systems, patient monitoring, diagnostic cardiology and anesthesia systems, or optoelectronic devices. Future competitive pressures may materially and adversely affect our business, financial conditions and results of operations.
In the security and inspection market, competition is based primarily on factors such as product performance, functionality and quality, the overall cost effectiveness of the system, prior customer relationships, technological capabilities of the products, price, local market presence and breadth of sales and service organization. We believe that our principal competitors in the market for security and inspection products are Smiths Detection; L-3 Communications—Security and Detection Systems division; American Science and Engineering; Morpho Detection; SAIC; CEIA and Nuctech. Competition could result in price reductions, reduced margins and loss of market share. Additionally, although our competitors each offer products in competition with one or more of our products, our ability to supply a variety of system types means that we offer among the widest array of solutions available from a single supplier. This variety of technologies also permits us to offer unique hybrid systems to our customers that utilize two or more of these technologies, thereby optimizing flexibility, performance and cost to meet the customer's unique application requirements.
In the patient monitoring, diagnostic cardiology and anesthesia systems delivery market, competition is also based on a variety of factors including product performance, functionality, value and breadth of sales and service organization. We believe that our principal competitors in the market for patient monitoring, diagnostic cardiology and anesthesia systems are Philips Medical; GE Healthcare; Mindray Medical, Cardiac Science; Mortara Instrument; Dräger Medical; Nihon Kohden; Penlon and Maquet. Competition could result in price reductions, reduced margins and loss of our market share. We believe that our patient monitoring products are easier to use than the products of many of our competitors because we offer a consistent user interface throughout many of our product lines. Finally, while some of our competitors are also beginning to introduce portal technology, which allows remote access to data from the bedside monitor, central station or other point of care, we believe that our competing technologies are superior in bringing instant access to labs, radiology and charting at the point of care. Although we have established relationships with a number of large hospitals, we may not be able to successfully compete in the future with existing competitors or with new entrants.
16
In the markets in which we compete to provide optoelectronic devices and electronics manufacturing services, competition is based primarily on such factors as expertise in the design and development of optoelectronic devices, product quality, timeliness of delivery, price, customer technical support and on the ability to provide fully integrated services from application development and design through production. We believe that our major competitors in the optoelectronic device market are Excelitas Technologies, Hamamatsu and First Sensor. Because we specialize in custom subsystems requiring a high degree of engineering expertise, we believe that we generally do not compete to any significant degree with any other large United States, European or Asian manufacturers of standard optoelectronic components. Competition in the extensive electronic manufacturing services market ranges from multinational corporations with sales in excess of several billions of dollars, to large regional competitors and to small local assembly companies. In our experience, the original equipment manufacturers to whom we provide such services prefer to engage companies that offer both local and lower-cost off-shore facilities. As a result, our primary domestic competition for these services is located in Southern California and in New England, where our U.S. facilities are also located. Such competition includes CTS; Stellar Microelectronics; Senior Systems Technology; Celestica and Benchmark Electronics, among others. In addition, our high-volume, low-cost contract manufacturing locations in Southeast Asia compete with other manufacturers in the same region.
Backlog
We measure our backlog as orders for which purchase orders or contracts have been signed, but which have not yet been shipped and for which revenues have not yet been recognized.
We ship most of our baggage and parcel inspection, hold (checked) baggage screening, people screening, patient monitoring, diagnostic cardiology and anesthesia systems and optoelectronic devices and value-added subsystems within one to several months after receiving an order. However, such shipments may be delayed for a variety of reasons, including any special design or requirements of the customer. In addition, large orders of security and inspection products typically require greater lead-times.
Certain of our cargo and vehicle inspection and hold (checked) baggage screening systems may require several months lead-time. We have experienced some significant shipping delays associated with our cargo and vehicle inspection systems. Such delays can occur for many reasons, including: (i) additional time necessary to conduct inspections at the factory before shipment; (ii) a customer's need to engage in time-consuming special site preparation to accommodate the system, over which we have no control or responsibility; (iii) additional fine tuning of such systems once they are installed; (iv) design or specification changes by the customer; and (v) delays originating from other contractors on the project.
As of June 30, 2011, our consolidated backlog totaled approximately $304 million, compared to approximately $240 million as of June 30, 2010 and approximately $203 million at June 30, 2009. Sales orders underlying our backlog are firm orders; although, from time to time we may agree to permit a customer to cancel an order or an order may be cancelled for other reasons. Variations in the size of orders, product mix, or delivery requirements, among other factors, may result in substantial fluctuations in backlog from period to period. Backlog as of any particular date should not be relied upon as indicative of our revenues for any future period and cannot be considered a meaningful indicator of our performance on an annual or quarterly basis.
Employees
As of June 30, 2011, we employed approximately 3,700 people, of whom 2,042 were employed in manufacturing, 428 were employed in engineering or research and development, 387 were employed in administration, 370 were employed in sales and marketing and 467 were employed in service capacities. Of the total employees, approximately 1,465 were employed in the Americas, 1,847 were employed in Asia and 382 were employed in Europe. Many of our employees in Europe have statutory collective bargaining rights. We have never experienced a work stoppage or strike, and management believes that its relations with employees are good.
17
Available Information
We are subject to the informational requirements of the Securities Exchange Act of 1934, as amended. Therefore, we file periodic reports, proxy statements and other information with the Securities and Exchange Commission. Such reports, proxy statements and other information may be obtained by visiting the Public Reference Room of the Securities and Exchange Commission at 100 F Street, N.E., Washington, D.C. 20549 or by calling the Securities and Exchange Commission at 1-800-SEC-0330. In addition, the Securities and Exchange Commission maintains an Internet website (http://www.sec.gov) that contains reports, proxy statements and other information that issuers are required to file electronically.
Our Internet address is: http://www.osi-systems.com. We make available, free-of-charge through our Internet website, our annual report on Form 10-K, quarterly reports on Form 10-Q, current reports on Form 8-K, amendments to those reports filed or furnished pursuant to Section 13(a) or 15(d) of the Securities Exchange Act of 1934, as amended and reports filed pursuant to Section 16 of the Securities Exchange Act of 1934, as amended. We do so as soon as reasonably practicable after electronically filing such material with, or furnishing it to, the Securities and Exchange Commission.
We encourage you to carefully consider all of the following risk factors when making investment decisions regarding our company. If any of the following risks materialize, our business, financial condition and operating results could be materially adversely affected.
Fluctuations in our operating results may cause our stock price to decline.
Given the nature of the markets in which we participate, it is difficult to reliably predict future revenues and profitability. Changes in competitive, market and economic conditions may cause us to adjust our operations. A high proportion of our costs are fixed, due in part to our significant sales, research and development and manufacturing costs. Thus, small declines in revenue could disproportionately affect our operating results. Factors that may affect our operating results and the market price of our Common Stock include:
- •
- demand for and market acceptance of our products;
- •
- competitive pressures resulting in lower selling prices;
- •
- adverse changes in the level of economic activity in regions in which we do business;
- •
- low or fluctuating levels of political stability in regions in which we do business;
- •
- adverse changes in industries, such as semiconductors and electronics, on which we are particularly dependent;
- •
- changes in the portions of our revenue represented by various products and customers;
- •
- delays or problems in the introduction of new products;
- •
- announcements or introductions of new products, services or technological innovations by our competitors;
- •
- variations in our product mix;
- •
- timing and amount of our expenditures in anticipation of future sales;
- •
- availability of equity and credit markets to provide our customers with funding to make equipment purchases;
- •
- exchange rate fluctuations;
- •
- increased costs of raw materials or supplies;
18
- •
- changes in the volume or timing of product orders;
- •
- timing of completion of acceptance testing of some of our products;
- •
- changes in regulatory requirements;
- •
- natural disasters; and
- •
- changes in general economic factors.
Unfavorable currency exchange rate fluctuations could adversely affect our profitability.
Our international sales and our operations in foreign countries expose us to risks associated with fluctuating currency values and exchange rates. Gains and losses on the conversion of accounts receivable, accounts payable and other monetary assets and liabilities to U.S. dollars may contribute to fluctuations in our results of operations. In addition, increases or decreases in the value of the U.S. dollar relative to other currencies could have an adverse effect on our results of operations.
We face aggressive competition in many areas of business. If we do not compete effectively, our business will be harmed.
We encounter aggressive competition from numerous competitors in many areas of our business. In the security and inspection and patient monitoring, diagnostic cardiology and anesthesia systems markets, competition is based primarily on such factors as product performance, functionality and quality, cost, prior customer relationships, technological capabilities of the product, price, certification by government authorities, local market presence and breadth of sales and service organization. In the optoelectronic devices and electronics manufacturing markets, competition is based primarily on factors such as expertise in the design and development of optoelectronic devices, product quality, timeliness of delivery, price, customer technical support and on the ability to provide fully-integrated services from application development and design through volume subsystem production. We may not be able to compete effectively with all of our competitors. To remain competitive, we must develop new products and enhance our existing products and services in a timely manner. We anticipate that we may have to adjust the prices of many of our products to stay competitive. In addition, new competitors may emerge and entire product lines or service offerings may be threatened by new technologies or market trends that reduce the value of these product lines or service offerings.
The September 11, 2001 terrorist attacks, subsequent attacks in other locations worldwide and the creation of the U.S. Department of Homeland Security have increased financial expectations that may not materialize.
The September 11, 2001 terrorist attacks, subsequent attacks in other locations worldwide and the creation of the U.S. Department of Homeland Security have created increased interest in our security and inspection systems. However, we are not certain whether the level of demand will continue to be as high as it is now. We do not know what solutions will continue to be adopted by the U.S. Department of Homeland Security, the U.S. Department of Defense, and similar agencies in other countries and whether our products will be a part of those solutions. Additionally, should our products be considered as a part of the future security solutions, it is unclear what the level may be and how quickly funding to purchase our products may be made available. These factors may adversely impact us and create unpredictability in revenues and operating results.
19
If operators of, or algorithms installed in, our security and inspection systems fail to detect weapons, explosives or other devices that are used to commit a terrorist act, we could be exposed to product and professional liability and related claims for which we may not have adequate insurance coverage.
Our business exposes us to potential product liability risks that are inherent in the development, manufacturing, sale and service of security and inspection systems as well as in the provision of training to our customers in the use and operation of such systems. Our customers use our security and inspection systems to help them detect items that could be used in performing terrorist acts or other crimes. Some of our security and inspection systems require that an operator interpret an image of suspicious items within a bag, parcel, container or other vessel. Others signal to the operator that further investigation is required. In either case, the training, reliability and competence of the customer's operator are crucial to the detection of suspicious items.
Security inspection systems that signal to the operator that further investigation is required are sometimes referred to in the security industry as "automatic" detection systems. Such systems utilize software algorithms (often designed to meet government requirements) to interpret data produced by the system and to signal to the operator when a dangerous object may be present. Such algorithms are probabilistic in nature and are also subject to significant technical limitations. Nevertheless, if such a system were to fail to signal to an operator when an explosive or other contraband was in fact present, resulting in significant damage, we could become the subject of significant product liability claims.
Furthermore, security inspection by technological means is always circumstance and application-specific. In addition, our security and inspection systems are not designed to work under all circumstances. We test the reliability of our security and inspection systems during both their development and manufacturing phases. We also perform such tests if we are requested to perform installation, warranty or post-warranty servicing. However, our security inspection systems are advanced mechanical and electronic devices and therefore can malfunction.
We also offer turn-key security screening solutions under which we perform certain of the security screening tasks that have historically been performed by our customers. Such tasks include: design, layout and construction of the security checkpoint where the inspection equipment is located; selection of the security equipment to be used at the checkpoint; selection, training and management of the personnel operating the checkpoint; operation of the security screening equipment itself; interpretation of the images and other signals produced by the security screening equipment; maintenance and security of the checkpoint as well as other related services. Such projects expose us to certain professional liability risks that are inherent in performing security inspection services (in live checkpoint environments and over extended periods of time) for the purpose of assisting our customers in the detection of contraband items, including items that could be used in performing terrorist acts or other crimes. Although we utilize operational and other procedures, many of which are designed to our customers' specifications and requirements, intended to limit the risk of failure, if a contraband item were to pass through the checkpoint and be used to perform a terrorist act or other crime, we could become the subject of significant professional liability claims.
In addition, there are also many other factors beyond our control that could lead to liability claims should an act of terrorism occur. The 1993 World Trade Center bombing, the September 11, 2001 attacks, subsequent attacks in other locations worldwide and the potential for future attacks, have caused commercial insurance for such threats to become extremely difficult to obtain. It is very likely that, should we be found liable following a major act of terrorism, the insurance we currently have in place would not fully cover the claims for damages.
The Support Anti-terrorism by Fostering Effective Technologies Act of 2002 (SAFETY Act), which provides important legal liability protections for providers of qualified anti-terrorism technologies, may not shield us against all legal claims we may face following an act of terrorism.
The SAFETY Act provides important legal liability protections for providers of qualified anti-terrorism products and services. Under the SAFETY Act, providers, such as our Security division, may apply to the U.S.
20
Department of Homeland Security for coverage. If granted, they receive certain legal protections against product liability, professional liability and certain other claims that could arise following an act of terrorism.
We have applied to the U.S. Department of Homeland Security and, to date, have been successful in achieving coverage for many of the products and services offered by our Security division. However, we do not enjoy coverage (or the highest level of coverage) for every product line, model number and service offering that our Security division provides. In addition, the terms of the SAFETY Act coverage decisions awarded to us by the U.S. Department of Homeland Security contain conditions and requirements that we may not (or may not be able to) continue to satisfy in the future.
In the future, if we fail to maintain the coverages that we currently enjoy or fail to timely apply for coverage for new products and services as we introduce them, or if the U.S. Department of Homeland Security limits the scope of any coverage previously awarded to us, denies us coverage or continued coverage for a particular product, product line or service offering, or delays in making decisions about whether to grant us coverage, we may become exposed to legal claims that the SAFETY Act was otherwise designed to prevent.
The SAFETY Act was not designed to shield providers of qualified anti-terrorism products and services from all types of claims that may arise from acts of terrorism, including from many types of claims lodged in courts outside of the United States or acts of terrorism that occur outside of the United States. This too could leave us exposed to significant legal claims and litigation defense costs despite the SAFETY Act awards we have received.
Our patient monitoring, diagnostic cardiology and anesthesia systems could give rise to product liability claims and product recall events that could materially and adversely affect our financial condition and results of operations.
The development, manufacturing and sale of medical devices, expose us to significant risk of product liability claims, product recalls and, sometimes, product failure claims. We face an inherent business risk of financial exposure to product liability claims if the use of our medical devices results in personal injury or death. Substantial product liability litigation currently exists within the medical device industry. Some of our patient monitoring, diagnostic cardiology and anesthesia systems businesses are, from time to time, subject to product liability claims and/or product recalls. Future product liability claims and/or product recall costs may exceed the limits of our insurance coverages or such insurance may not continue to be available to us on commercially reasonable terms, or at all. In addition, a significant product liability claim or product recall could significantly damage our reputation for producing safe, reliable and effective products, making it more difficult for us to market and sell our products in the future. Consequently, a product liability claim, product recall or other claim could have a material adverse effect on our business, financial condition, operating results and cash flows.
If we are unable to sustain high quality processes for the manufacture and delivery of goods and services, our reputation could be harmed, our competitive advantage could erode and we could incur significant costs.
Quality is extremely important to us and our customers due in part to the serious consequences of product failure. Our quality certifications are critical both to the marketing success of our goods and services and to the satisfaction of both regulatory and contractual requirements under which we sell many of our products. If we fail to meet these standards or other standards required in our industries, we could lose customers and market share, our revenue could decline and we could face significant costs and other liabilities.
The loss of certain of our customers could have a negative effect on our reputation.
We sell many of our products to prominent, well-respected institutions, including agencies and departments of the U.S. Government, state and local governments, foreign governments, renowned hospitals and hospital networks, and large military-defense and space-industry contractors. Many of these larger customers spend considerable
21
resources testing and evaluating our products and our design and manufacturing processes and services. Some of our smaller customers know this and rely on this as indication of the high-quality and reliability of our products and services. As a result, part of our reputation and success depends on our ability to continue to sell to larger institutions that are known for demanding high standards of excellence. The loss or termination of a contract by such an institution, even if for reasons unrelated to the quality of our products or services, could therefore have a more wide-spread and potentially material adverse effect on our business, financial condition and results of operations.
Our revenues are dependent on orders of security and inspection systems, turn-key security screening solutions and patient monitoring, diagnostic cardiology and anesthesia systems, which may have lengthy and unpredictable sales cycles.
Sales of security and inspection systems and turn-key security screening solutions often depend upon the decision of governmental agencies to upgrade or expand existing airports, border crossing inspection sites, seaport inspection sites, military facilities and other security installations. In the case of turn-key security screening solutions, the commencement of screening operations may be dependent on the approval, by a government agency, of the protocols and procedures that our personnel are to follow during the performance of their activities. Sales outside of the United States of our patient monitoring, diagnostic cardiology and anesthesia systems depend in significant part on the decision of governmental agencies to build new medical facilities or to expand or update existing medical facilities. Accordingly, a significant portion of our sales of security and inspection systems, turn-key security screening solutions and our patient monitoring, diagnostic cardiology and anesthesia systems is often subject to delays associated with the lengthy approval processes. During these approval periods, we expend significant financial and management resources in anticipation of future revenues that may not occur. If we fail to receive such revenues after expending such resources, such failure could have a material adverse effect on our business, financial condition and results of operations.
Current economic conditions, including the slow pace of recovery from recession in the United States and other parts of the world, as well as further disruptions in the financial markets could result in substantial declines in our revenues, earnings, cash flows and financial condition.
The worldwide economic slowdown has and could continue to adversely affect our businesses and our profitability. If economic growth continues to remain slow, many customers may continue to delay purchases or reduce purchase quantities. This could result in the continued reduction in sales of certain of our products, slower adoption of both new technologies and upgrades to existing technologies and could also result in increased price competition. Continued market disruptions and broader economic downturns also increase our exposure to losses from bad debts. Among other effects we have seen during the slowdown, some of our customers, such as hospitals and healthcare systems in the United States, who rely on the credit for access to capital, have and may continue to delay purchases of our products and services until the credit markets recover. If economic or other factors cause financial institutions to fail, we could lose current or potential customers. We cannot predict when the world's credit markets will recover and therefore when this period of delayed and diminished purchasing will end. A prolonged delay could have a material adverse effect on our business, financial condition and results of operations. In addition, if the current turmoil in the credit markets continues, the variable interest rates payable under our credit facilities could be adversely affected or it could be more difficult to obtain or renew such facilities in the future. Any or all of these factors, as well as other consequences of the current economic conditions which cannot currently be anticipated, could have a material adverse effect on our revenues, earnings and cash flows and otherwise adversely affect our financial condition.
22
If we do not introduce new products in a timely manner, our products could become obsolete and our operating results would suffer.
We sell many of our products in industries characterized by rapid technological changes, frequent new product and service introductions and evolving industry standards and customer needs. Without the timely introduction of new products and enhancements, our products could become technologically obsolete over time, in which case our revenue and operating results would suffer. The success of our new product offerings will depend upon several factors, including our ability to:
- •
- accurately anticipate customer needs;
- •
- innovate and develop new technologies and applications;
- •
- successfully commercialize new technologies in a timely manner;
- •
- price our products competitively and manufacture and deliver our products in sufficient volumes and on time; and
- •
- differentiate our offerings from our competitors' offerings.
Some of our products are used by our customers to develop, test and manufacture their products. We therefore must anticipate industry trends and develop products in advance of the commercialization of our customers' products. In developing any new product, we may be required to make a substantial investment before we can determine the commercial viability of the new product. If we fail to accurately foresee our customers' needs and future activities, we may invest heavily in research and development of products that do not lead to significant revenues.
Interruptions in our ability to purchase raw materials and subcomponents may adversely affect our profitability.
We purchase raw materials and certain subcomponents from third parties. Standard purchase order terms are as long as one year at fixed costs, but we do not have guaranteed long-term supply arrangements with our suppliers. In addition, for certain raw materials and subcomponents that we use there are a limited number of potential suppliers that we have qualified or that we are currently able to qualify. Consequently, some of the key raw materials and subcomponents that we use are currently available to us only from a single vendor. The reliance on a single qualified vendor could result delays in delivering products or increases in the cost of manufacturing the affected products. Any material interruption in our ability to purchase necessary raw materials or subcomponents could adversely affect our ability to fulfill customer orders and therefore could ultimately have a material adverse effect on our business, financial condition and results of operations.
Delays by the construction firms we engage may interfere with our ability to complete projects on time.
Purchasers of our security and inspection systems and turn-key security screening solutions sometimes require, as a part of our contract, the construction of the facilities that will house our systems and/or operations. Some of these construction projects are significant in size and complexity. We engage qualified construction firms to perform this work. However, if such firms experience delays, if they perform sub-standard work or if we fail to properly monitor the quality of their work or the timeliness of their progress, we may not be able to complete our construction projects on time. In any such circumstance, we could face the imposition of delay penalties and breach of contract claims by our customer. In addition, we could be forced to incur significant expenses to rectify the problems caused by the construction firm. Any material delay caused by our construction firm subcontractors could therefore ultimately have a material adverse effect on our business, financial condition and results of operations.
23
We may not be able to successfully implement our acquisitions and investment strategies, integrate acquired businesses into our existing business or make acquired businesses profitable.
One of our strategies is to supplement our internal growth by acquiring and investing in businesses and technologies that complement or augment our existing product lines. This growth has placed, and may continue to place, significant demands on our management, working capital and financial resources. We may be unable to identify or complete promising acquisitions for many reasons, including:
- •
- competition among buyers;
- •
- the need for regulatory approvals, including antitrust approvals; and
- •
- the high valuations of businesses.
Some of the businesses we may seek to acquire or invest in may be marginally profitable or unprofitable. For these businesses to achieve acceptable levels of profitability, we must improve their management, operations, products and market penetration. We may not be successful in this regard and we may encounter other difficulties in integrating acquired businesses into our existing operations.
To finance our acquisitions, we may have to raise additional funds, through either public or private financings. We may be unable to obtain such funds or may be able to do so only on unfavorable terms.
Our acquisition and alliance activities could disrupt our ongoing business.
We intend to continue to make investments in companies, products and technologies, either through acquisitions, investments or alliances. Acquisition and alliance activities often involve risks, including:
- •
- difficulty in assimilating the acquired operations and employees and realizing synergies expected to result from the
acquisition;
- •
- difficulty in managing product co-development activities with our alliance partners;
- •
- difficulty in retaining the key employees of the acquired operation;
- •
- disruption of our ongoing business;
- •
- inability to successfully integrate the acquired technologies and operations into our businesses and maintain uniform
standards, controls, policies and procedures; and
- •
- lacking the experience necessary to enter into new product or technology markets successfully.
Integrating acquired businesses has been and will continue to be complex, time consuming and expensive, and can negatively impact the effectiveness of our internal control over financial reporting. The use of debt to fund acquisitions or for other related purposes increases our interest expense and leverage. If we issue equity securities as consideration in an acquisition, current stockholders' percentage ownership and earnings per share may be diluted. As a result of these and other risks, we cannot be certain that our previous or future acquisitions will be successful and will not materially adversely affect the conduct, operating results or financial condition of our business.
Acquisition and alliance activities by our competitors could disrupt our ongoing business.
From time to time, our competitors acquire or enter into exclusive arrangements with companies with whom we do business or may do business in the future. Reductions in the number of partners with whom we may do business in a particular context may reduce our ability to enter into critical alliances on attractive terms or at all, and the termination of an existing alliance by a business partner may disrupt our operations.
24
Our ability to successfully adapt to ongoing organizational changes could impact our business results.
We have executed a number of significant business and organizational changes to rationalize our overall cost structure. These changes have included and may continue to include the implementation of cost-cutting measures and the consolidation of facilities. We expect these types of changes may continue from time to time in the future as we uncover additional opportunities to streamline our operations. Successfully managing these changes is critical to our productivity improvement and business success. If we are unable to successfully manage these changes, while continuing to invest in business growth, our financial results could be adversely impacted.
Economic, political and other risks associated with international sales and operations could adversely affect our sales.
In fiscal 2009, revenues from shipments made to customers outside of the United States accounted for approximately 44% of our revenues. They were 43% in fiscal 2010 and 47% in fiscal 2011. Of the revenues generated during fiscal 2011 from shipments made to customers outside of the United States, 29% represented sales made by subsidiaries based in the United States to foreign customers, and the balance represented sales generated by foreign subsidiaries. Since we sell certain of our products worldwide, our businesses are subject to risks associated with doing business internationally. We anticipate that revenues from international operations will continue to represent a substantial portion of our total revenue. In addition, many of our manufacturing facilities, and therefore employees, suppliers, real property, capital equipment, cash and other assets are located outside the United States. Accordingly, our future results could be harmed by a variety of factors, including:
- •
- changes in foreign currency exchange rates;
- •
- changes in a country's or region's political or economic conditions, particularly in developing or emerging markets;
- •
- longer payment cycles of foreign customers and difficulty of collecting receivables in foreign jurisdictions;
- •
- trade protection measures and import or export licensing requirements;
- •
- differing legal and court systems;
- •
- differing tax laws and changes in those laws;
- •
- difficulty in staffing and managing widespread operations;
- •
- difficulty in managing distributors and sales agents and their compliance with applicable laws;
- •
- differing labor laws and changes in those laws;
- •
- differing protection of intellectual property and changes in that protection; and
- •
- differing regulatory requirements and changes in those requirements.
Our competitors may seek to challenge the intellectual property rights on which our products are based.
As we introduce any new and potentially promising product, companies possessing competing technologies may be motivated to assert infringement claims in order to delay or diminish potential sales and challenge our right to market such product. In addition, we may find it necessary to initiate litigation in order to protect our patent or other intellectual property rights. Under either circumstance, we may incur significant expenses. In addition, claims of third parties against us could result in awards of substantial damages or court orders that could effectively prevent us from making, using or selling our products in the United States or abroad.
25
Our ongoing success is dependent upon the continued availability of certain key employees.
We are dependent in our operations on the continued availability of the services of our employees, many of whom are individually key to our current and future success, and the availability of new employees to implement our growth plans. In particular, we are dependent upon the services of Deepak Chopra, our Chairman of the Board of Directors, President and Chief Executive Officer. The market for skilled employees is highly competitive, especially for employees in technical fields. While our compensation programs are intended to attract and retain the employees required for it to be successful, ultimately, we may not be able to retain the services of all of our key employees or a sufficient number to execute on our plans. In addition, we may not be able to continue to attract new employees as required.
Substantial government regulation in the United States and abroad may restrict our ability to sell our patient monitoring, diagnostic cardiology and anesthesia systems.
The FDA and comparable regulatory authorities in foreign countries extensively and rigorously regulate our patient monitoring, diagnostic cardiology and anesthesia systems, including related development activities and manufacturing processes. In the United States, the FDA regulates the introduction of medical devices as well as the manufacturing, labeling and record-keeping procedures for such products. We are required to:
- •
- obtain clearance before we can market and sell medical devices;
- •
- satisfy content requirements applicable to our labeling, sales and promotional materials;
- •
- comply with manufacturing and reporting requirements; and
- •
- undergo rigorous inspections.
Our future products may not obtain FDA clearance on a timely basis, or at all. Our patient monitoring, diagnostic cardiology and anesthesia systems must also comply with the laws and regulations of foreign countries in which we develop, manufacture and market such products. In general, the extent and complexity of medical device regulation is increasing worldwide. This trend is likely to continue and the cost and time required to obtain marketing clearance in any given country may increase as a result. Our products may not obtain any necessary foreign clearances on a timely basis, or at all.
Once any of our patient monitoring, diagnostic cardiology and anesthesia systems is cleared for sale, regulatory authorities may still limit the use of such product, prevent its sale or manufacture or require a recall or withdrawal of such product from the marketplace. Following initial clearance from regulatory authorities, we continue to be subject to extensive regulatory requirements. Government authorities can withdraw marketing clearance due to our failure to comply with regulatory standards or due to the occurrence of unforeseen problems following initial clearance. Ongoing regulatory requirements are wide-ranging and govern, among other things:
- •
- annual inspections to retain a CE mark for sale of products in the European Union;
- •
- product manufacturing;
- •
- supplier substitution;
- •
- product changes;
- •
- process modifications;
- •
- medical device reporting; and
- •
- product sales and distribution.
26
Broad-based legislation addressing the affordability and availability medical services in the United States may reduce the amount of funding available to hospitals for purchases of patient monitoring, diagnostic cardiology and anesthesia systems.
The U.S. Congress has recently enacted new healthcare legislation, including the Children's Health Insurance Reauthorization Act, the American Recovery and Reinvestment Act and the Affordable Care Act. The effects of this legislation are likely to be far-reaching as they require extensive revision to the current health insurance system in the United States. This legislation will significantly affect the ways in which doctors, hospitals, healthcare systems and health insurance companies are compensated for the services they provide. However, it is not clear at this time whether and to what extent these changes may impact the ability of hospitals and hospital networks to purchase the patient monitoring, diagnostic cardiology and anesthesia systems that we sell or if it will alter market-based incentives that hospitals and hospital networks currently face to continually improve, upgrade and expand their use of such equipment. While this legislation could adversely affect us, at this time we cannot predict the extent of any impact on our business or results of operations.
We are subject to various environmental regulations which may impose liability on us whether or not we knew of or caused the release of hazardous substances on or in our facilities.
We are subject to various foreign and U.S. federal, state and local environmental laws, ordinances and regulations relating to the use, storage, handling and disposal of certain hazardous substances and wastes used or generated in the manufacturing and assembly of our products. Under such laws, we may become liable for the costs of removal or remediation of certain hazardous substances or wastes that have been or are being disposed of offsite as wastes or that have been or are being released on or in our facilities. Such laws may impose liability without regard to whether we knew of or caused the release of such hazardous substances or wastes. Any failure by us to comply with present or future regulations could subject us to the imposition of substantial fines, suspension of production, alteration of manufacturing processes, or cessation of operations, any of which could have a material adverse effect on our business, financial condition and results of operations.
We may be exposed to potential risks relating to our internal controls over financial reporting and our ability to have our independent registered public accounting firm attest to these controls.
As directed by the Sarbanes-Oxley Act of 2002, the Securities and Exchange Commission adopted rules requiring public companies to include in their annual reports an assessment of the effectiveness of the company's internal controls over financial reporting. In addition, the independent registered public accounting firm auditing a public company's financial statements must attest to and report on the operating effectiveness of the company's internal controls over financial reporting. We evaluate our internal controls over financial reporting in order to allow our management to report on, and our independent registered public accounting firm to attest to, our internal controls.
We expect to continue to expend significant resources in complying with the documentation and testing procedures required by the Sarbanes-Oxley Act of 2002. However, there will remain an ongoing risk that we will not comply with all of its requirements.
If our independent registered public accounting firm differs from us in its interpretation of the requirements imposed on us by the Sarbanes-Oxley Act of 2002, or if it is not satisfied with our internal controls over financial reporting or with the level at which such controls are documented, operated or reviewed, we may be delayed in filing reports with the Securities and Exchange Commission, our independent registered public accounting firm may decline to attest to our management's assessment or it may issue an adverse report. In addition, if our independent registered public accounting firm is unable to rely on our internal controls over financial reporting in connection with its audit of our financial statements and if it is unable to devise alternative procedures in order to satisfy itself as to the material accuracy of our financial statements and related disclosures, it is possible that we could receive a qualified or adverse audit opinion in connection with those financial statements.
27
Accordingly, in the future we may not receive a favorable report from our independent registered public accounting firm regarding our internal controls over financial reporting and the operating effectiveness of our internal controls over financial reporting. If we identify material weaknesses in our internal controls over financial reporting that we cannot remediate in a timely manner or if we receive an adverse report from our independent registered public accounting firm with respect to our internal controls over financial reporting, investors and others may lose confidence in the reliability of our financial statements and the market for our Common Stock could be adversely affected.
A failure of a key information technology system, process or site could have a material adverse impact on our ability to conduct business.
We rely extensively on information technology systems to interact with our employees and our customers. These interactions include, but are not limited to, ordering and managing materials from suppliers, converting materials to finished products, shipping product to customers, processing transactions, summarizing and reporting results of operations, complying with regulatory, legal and tax requirements, and other processes necessary to manage our business. If our systems are damaged or cease to function properly due to any number of causes, ranging from the failures of third-party services provider, to catastrophic events, to power outages, to security breaches, and our business continuity plans do not effectively compensate on a timely basis, we may suffer interruptions in our ability to manage operations which may adversely impact our results of operations and/or financial condition.
We receive significant amounts of research and development funding for our security and inspection systems from government grants and contracts, but we may not continue to receive comparable levels of funding in the future.
The U.S. government currently plays an important role in funding the development of certain of our security and inspection systems and sponsoring their deployment at airports, ports, military installations and border crossings. However, in the future, additional research and development funds from the government may not be available to us. If the government fails to continue to sponsor our technologies we may have to expend more resources on product development or cease development of certain technologies, which could adversely affect our business. In addition, any future grants to our competitors may improve their ability to develop and market competing products and cause our customers to delay purchase decisions, which could harm our ability to market our products.
Our credit facility contains provisions that could restrict our ability to finance our future operations or engage in other business activities that may be in our interest.
Our credit facility contains a number of significant covenants that, among other things, limit our ability to:
- •
- dispose of assets;
- •
- incur certain additional indebtedness;
- •
- repay certain indebtedness;
- •
- create liens on assets;
- •
- pay dividends on our Common Stock;
- •
- make certain investments, loans and advances;
- •
- repurchase or redeem capital stock;
- •
- make certain capital expenditures;
- •
- engage in acquisitions, mergers or consolidations; and
- •
- engage in certain transactions with subsidiaries and affiliates.
28
These covenants could limit our ability to plan for or react to market conditions, finance our operations, engage in strategic acquisitions or disposals or meet our capital needs or could otherwise restrict our activities or business plans. Our ability to comply with these covenants may be affected by events beyond our control. In addition, our credit facility also requires us to maintain compliance with certain financial ratios. Our inability to comply with the required financial ratios or covenants could result in an event of default under our credit facility. A default, if not cured or waived, may permit acceleration of our indebtedness. In addition, our lenders could terminate their commitments to make further extensions of credit under our credit facility. If our indebtedness is accelerated, we cannot be certain that we will have sufficient funds to pay the accelerated indebtedness or that we will have the ability to refinance accelerated indebtedness on terms favorable to us or at all.
Changes in our tax rates could affect our future financial results.
Our future effective tax rates could be favorably or unfavorably affected by changes in the valuation of our deferred tax assets and liabilities, or by changes in tax laws or their interpretation. In addition, we are subject to the examination of our income tax returns by the Internal Revenue Service and other tax authorities. We regularly assess the likelihood of adverse outcomes resulting from these examinations to determine the adequacy of our provision for income taxes. There can be no assurance that the outcomes from these examinations will not have an adverse effect on our operating results and financial condition.
In March 2010, significant reforms to the healthcare system were adopted as law in the United States. The law includes provisions that, among other things, reduce or limit Medicare reimbursement, require all individuals to have health insurance (with limited exceptions) and impose increased taxes. Specifically, the law requires the medical device industry to subsidize healthcare reform in the form of an excise tax on United States sales of most medical devices beginning in 2013. The excise tax will increase the Company's operating expenses. While the new law could reduce medical procedure volumes, lower reimbursement for the Company's products, and impact the demand for the Company's products or the prices at which the Company sells its products, at this time we cannot predict the extent of any impact on our business or results of operations.
Our Certificate of Incorporation and other agreements contain provisions that could discourage a takeover.
Our Certificate of Incorporation authorizes our Board of Directors to issue up to 10,000,000 shares of Preferred Stock in one or more series, to fix the rights, preferences, privileges and restrictions granted to or imposed upon any wholly unissued shares of Preferred Stock, to fix the number of shares constituting any such series and to fix the designation of any such series, without further vote or action by stockholders. The terms of any series of Preferred Stock, which may include economic rights senior to our Common Stock and special voting rights, could adversely affect the rights of the holders of our Common Stock and thereby reduce the value of our Common Stock. We have no present plans to issue shares of Preferred Stock. The issuance of Preferred Stock, coupled with the concentration of ownership in the directors and executive officers, could discourage certain types of transactions involving an actual or potential change in control of our company, including transactions in which the holders of Common Stock might otherwise receive a premium for their shares over then current prices, otherwise dilute the rights of holders of Common Stock and may limit the ability of such stockholders to cause or approve transactions which they may deem to be in their best interests, all of which could have a material adverse effect on the market price of our Common Stock.
Our Certificate of Incorporation limit the liability of our directors, which may limit the remedies we or our stockholders have available.
Our Certificate of Incorporation provides that, pursuant to the Delaware General Corporation Law, the liability of our directors for monetary damages shall be eliminated to the fullest extent permissible under Delaware law, as that law exists currently and as it may be amended in the future. This is intended to eliminate the personal liability
29
of a director for monetary damages in an action brought by us, or in our right for breach of a director's duties to us or our stockholders and may limit the remedies available to us or our stockholders. Under Delaware law, this provision does not apply to eliminate or limit a director's monetary liabilities for: (i) breaches of the director's duty of loyalty to us or our stockholders; (ii) acts or omissions not in good faith or which involve intentional misconduct or knowing violations of law; (iii) the unlawful payment of dividends or unlawful stock repurchases or redemptions under Section 174 of the Delaware General Corporation Law or (iv) transactions in which the director received an improper personal benefit. Additionally, under Delaware law, this provision does not limit a director's liability for the violation of, or otherwise relieve us or our directors from complying with, federal or state securities laws, nor does it limit the availability of non-monetary remedies such as injunctive relief or rescission for a violation of federal or state securities laws.
ITEM 1B. UNRESOLVED STAFF COMMENTS
None.
As of June 30, 2011, we owned four facilities. The following table lists these facilities:
Location
|
Description of Facility | Approximate Square Footage |
||||
|---|---|---|---|---|---|---|
Hawthorne, California |
Corporate headquarters and administrative, manufacturing, engineering, sales and marketing and service for our Optoelectronics and Manufacturing division | 88,000 | ||||
Surrey, England |
Manufacturing, engineering, sales and marketing and service for our Security and Healthcare divisions |
59,000 |
||||
Batam, Indonesia (1) |
Manufacturing for our Optoelectronics and Manufacturing division |
59,000 |
||||
Ocean Springs, Mississippi |
Manufacturing, engineering, sales and marketing and service for our Security and Optoelectronics and Manufacturing divisions |
19,000 |
||||
- (1)
- In addition to this facility, our operations in Batam, Indonesia also include a 21,000 square foot facility and a 13,000 square foot facility that we lease. Both such leases expire in 2012.
30
As of June 30, 2011, we leased all of our other facilities. The following table lists the principal (i.e., facilities greater than 50,000 square feet) physical properties that we lease:
Location
|
Description of Facility | Approximate Square Footage |
Expiration | ||||||
|---|---|---|---|---|---|---|---|---|---|
Camarillo, California |
Manufacturing, engineering, sales and marketing and service for our Optoelectronics and Manufacturing division | 60,000 | 2015 | ||||||
Sunnyvale, California |
Manufacturing, engineering, sales and marketing and service for our Security division |
62,500 |
2012 |
||||||
Torrance, California |
Manufacturing, engineering, sales and marketing and service for our Security division |
91,900 |
2017 |
||||||
Issaquah, Washington (1) |
Manufacturing, engineering, sales and marketing and service for our Healthcare division |
202,600 |
2014 |
||||||
Suzhou, China |
Manufacturing, engineering, sales and marketing and service for our Healthcare division |
53,000 |
2012 |
||||||
Hyderabad, India (2) |
Manufacturing and engineering for our Security, Healthcare and Optoelectronics and Manufacturing divisions |
94,300 |
2013 |
||||||
Johor Bahru, Malaysia |
Manufacturing, engineering, sales and service for our Security division |
87,100 |
2012 |
||||||
Johor Bahru, Malaysia (3) |
Manufacturing, engineering, sales and service for our Optoelectronics and Manufacturing division |
76,000 |
2011 |
||||||
Stoke on Trent, United Kingdom |
Manufacturing, engineering, sales, marketing and service for our Security division |
65,000 |
2020 |
||||||
- (1)
- The lease of the 202,600 square foot facility in Issaquah, Washington is composed of two leases at the same facility. One lease covers a 107,000 square foot building and the other covers a 95,600 square foot building. Both leases expire in December 2014.
- (2)
- The lease of the 94,300 square foot facility in Hyderabad, India comprises nine leases, ranging in size between 1,100 square feet and 19,800 square feet, at the same or nearby facilities. Seven of these leases expire in 2013 and two expire in 2016.
- (3)
- The lease of the 76,000 square foot facility in Johor Bahru, Malaysia expires in December 2011. At such time, we expect to vacate this facility and move into a new, 82,000 square foot facility, also in Johor Bahru, Malaysia.
We believe that our facilities are in good condition and are adequate to support our operations for the foreseeable future. We currently anticipate that we will be able to renew the leases that are scheduled to expire in the next few years on terms that are substantially the same as or better than those currently in effect. However, even if we were not able to renew one or more of the leases, we believe that suitable substitute space is available to relocate any of the facilities. Accordingly, we do not believe that our failure to renew any of the leases that are scheduled to expire in the next few years will have a material adverse effect on our operations.
31
We are involved in various claims and legal proceedings arising out of the ordinary course of business. In our opinion after consultation with legal counsel, the ultimate disposition of such proceedings will not likely have a material adverse effect on our financial position, future results of operations or cash flows. In accordance with accounting standards related to contingencies, we have not accrued for loss contingencies relating to such matters because we believe that, although unfavorable outcomes in the proceedings may be possible, they are not considered by management to be probable or reasonably estimable. If one or more of these matters are resolved in a manner adverse to us, the impact on our results of operations, financial position and/or liquidity could be material.
32
ITEM 5. MARKET FOR REGISTRANT'S COMMON EQUITY, RELATED STOCKHOLDER MATTERS AND ISSUER PURCHASES OF EQUITY SECURITIES
Stock Market and Other Information
Our Common Stock is traded on The NASDAQ Global Market under the symbol "OSIS."
The following table sets forth the high and low sale prices of a share of our Common Stock as reported by The NASDAQ Global Market on a quarterly basis for fiscal 2010 and 2011. The prices shown reflect inter-dealer prices, without retail markup, markdown or commission and may not necessarily represent actual transactions.
2010:
|
High | Low | |||||
|---|---|---|---|---|---|---|---|
Quarter ended September 30, 2009 |
$ | 21.23 | $ | 16.31 | |||
Quarter ended December 31, 2009 |
$ | 28.49 | $ | 17.03 | |||
Quarter ended March 31, 2010 |
$ | 32.58 | $ | 25.21 | |||
Quarter ended June 30, 2010 |
$ | 30.43 | $ | 22.80 | |||
2011:
|
High | Low | |||||
|---|---|---|---|---|---|---|---|
Quarter ended September 30, 2010 |
$ | 36.70 | $ | 25.26 | |||
Quarter ended December 31, 2010 |
$ | 38.98 | $ | 32.65 | |||
Quarter ended March 31, 2011 |
$ | 39.99 | $ | 33.33 | |||
Quarter ended June 30, 2011 |
$ | 43.18 | $ | 34.08 | |||
As of August 23, 2011, there were approximately 75 holders of record of our Common Stock. This number does not include beneficial owners holding shares through nominees or in "street" name.
Dividend Policy
We have not paid any cash dividends since the consummation of our initial public offering in 1997 and we do not currently intend to pay any cash dividends in the foreseeable future. Our Board of Directors will determine the payment of future cash dividends, if any. Certain of our current bank credit facilities restrict the payment of cash dividends and future borrowings may contain similar restrictions.
Issuer Purchases of Equity Securities
Our Board of Directors authorized a stock repurchase program for the repurchase of up to 3 million shares of our Common Stock. During the twelve months ended June 30, 2010, we did not repurchase any shares under this program. During the 12 months ended June 30, 2011, we repurchased 58,396 shares under this program. As of June 30, 2011, 652,809 shares were available for additional repurchase under the program. Upon repurchase, the shares were restored to the status of authorized but unissued and we recorded them as a reduction in the number of shares of Common Stock issued and outstanding in our Consolidated Financial Statements.
33
Equity Compensation Plans
The following table provides information concerning our equity compensation plans as of June 30, 2011.
Plan category
|
Number of securities to be issued upon exercise of outstanding options, warrants and rights |
Weighted-average exercise price of outstanding options, warrants and rights |
Number of securities remaining available for future issuance under equity compensation plans (excluding securities reflected in column (a)) |
|||||||||
|---|---|---|---|---|---|---|---|---|---|---|---|---|
| |
(a) |
(b) |
(c) |
|||||||||
Equity compensation plans approved by security holders (1)(2) |
930,912 | 18.45 | 1,533,000 | |||||||||
Equity participation plans not approved by security holders |
— | N/A | — | |||||||||
Total |
930,912 | 18.45 | 1,533,000 | |||||||||
- (1)
- Includes shares of our Common Stock issuable upon exercise of options under our 2006 Equity Participation Plan.
- (2)
- Of the 524,017 securities remaining available for future issuance under our 2006 Equity Participation Plan, 777,421 shares are available to be issued as restricted stock.
34
Performance Graph
The graph below compares the cumulative total stockholder return for the period beginning on the market close on the last trading day before the beginning our fifth preceding fiscal year through and including the end of our last completed fiscal year, with (a) The NASDAQ Composite Index and (b) a peer group of publicly-traded issuers with which we have generally competed.
The peer group includes the following companies: American Science & Engineering (AMEX Symbol: ASE) and Analogic Corporation (NASDAQ Symbol: ALOG).
The graph assumes that $100.00 was invested on June 30, 2006 in (a) our Common Stock, (b) The NASDAQ Global Market Index and (c) the companies comprising the peer group described above (weighted according to each respective issuer's stock market capitalization at the beginning of each period for which a return is indicated). The graph assumes that all dividends were reinvested. Historical stock price performance is not necessarily indicative of future stock price performance.
Comparison of 5 Year Cumulative Total Return
Assumes Initial Investment of $100
June 2006 through June 2011
Among OSI Systems, Inc.
The NASDAQ Composite Index And A Peer Group
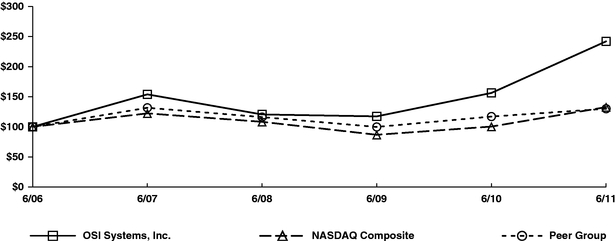
The following table provides the same information in tabular form as of June 30:
| |
2006 | 2007 | 2008 | 2009 | 2010 | 2011 | |||||||||||||
|---|---|---|---|---|---|---|---|---|---|---|---|---|---|---|---|---|---|---|---|
OSI Systems, Inc. |
100.00 | 153.91 | 120.54 | 117.33 | 156.27 | 241.98 | |||||||||||||
The NASDAQ Composite Index |
100.00 | 122.33 | 108.31 | 86.75 | 100.42 | 132.75 | |||||||||||||
Peer Group |
100.00 | 131.63 | 116.14 | 99.77 | 117.03 | 130.03 | |||||||||||||
35
ITEM 6. SELECTED FINANCIAL DATA
The following table sets forth our selected consolidated financial data as of and for each of the five fiscal years ended June 30, 2011, and is derived from our Consolidated Financial Statements. The Consolidated Financial Statements as of June 30, 2010 and 2011, and for each of the years in the three-year period ended June 30, 2011, are included elsewhere in this report. The following data should be read in conjunction with "Management's Discussion and Analysis of Financial Condition and Results of Operations" and the Consolidated Financial Statements and Notes thereto included elsewhere in this report.
| |
Year Ended June 30, | |||||||||||||||||
|---|---|---|---|---|---|---|---|---|---|---|---|---|---|---|---|---|---|---|
| |
2007 | 2008 | 2009 | 2010 | 2011 | |||||||||||||
| |
(in thousands, except earnings per share data) |
|||||||||||||||||
Consolidated Statements of Operations Data (1): |
||||||||||||||||||
Revenues |
$ | 532,284 | $ | 623,088 | $ | 590,361 | $ | 595,111 | $ | 656,100 | ||||||||
Cost of goods sold |
354,067 | 404,049 | 388,910 | 377,077 | 416,834 | |||||||||||||
Gross profit |
178,217 | 219,039 | 201,451 | 218,034 | 239,266 | |||||||||||||
Operating expenses: |
||||||||||||||||||
Selling, general and administrative |
151,031 | 150,082 | 137,985 | 139,830 | 142,633 | |||||||||||||
Research and development |
44,446 | 45,361 | 36,862 | 38,577 | 45,448 | |||||||||||||
Restructuring and other charges |
26,071 | 4,688 | 7,123 | 2,859 | 3,424 | |||||||||||||
Total operating expenses |
221,548 | 200,131 | 181,970 | 181,266 | 191,505 | |||||||||||||
Income (loss) from operations |
(43,331 | ) | 18,908 | 19,481 | 36,768 | 47,761 | ||||||||||||
Interest expense and other income, net |
(11,697 | ) | 4,469 | 2,936 | 1,772 | 1,026 | ||||||||||||
Income (loss) before income taxes |
(31,634 | ) | 14,439 | 16,545 | 34,996 | 46,735 | ||||||||||||
Provision (benefit) for income taxes |
(12,876 | ) | 579 | 5,393 | 11,439 | 13,313 | ||||||||||||
Net income (loss) |
$ | (18,758 | ) | $ | 13,860 | $ | 11,152 | $ | 23,557 | $ | 33,422 | |||||||
Net income (loss) available to common stockholders—diluted |
$ | (18,815 | ) | $ | 13,860 | $ | 11,152 | $ | 23,557 | $ | 33,422 | |||||||
Basic earnings (loss) per common share |
$ | (1.11 | ) | $ | 0.80 | $ | 0.64 | $ | 1.32 | $ | 1.77 | |||||||
Diluted earnings (loss) per common share |
$ | (1.12 | ) | $ | 0.78 | $ | 0.63 | $ | 1.28 | $ | 1.71 | |||||||
Weighted average shares outstanding—diluted |
16,844 | 17,735 | 17,596 | 18,389 | 19,548 | |||||||||||||
| |
Year Ended June 30, | |||||||||||||||
|---|---|---|---|---|---|---|---|---|---|---|---|---|---|---|---|---|
| |
2007 | 2008 | 2009 | 2010 | 2011 | |||||||||||
| |
(in thousands) |
|||||||||||||||
Consolidated Balance Sheet Data (1): |
||||||||||||||||
Cash and cash equivalents |
$ | 15,980 | $ | 18,232 | $ | 25,172 | $ | 51,989 | $ | 55,619 | ||||||
Working capital |
158,741 | 194,958 | 187,608 | 204,607 | 244,305 | |||||||||||
Total assets |
451,483 | 507,641 | 474,828 | 513,114 | 584,916 | |||||||||||
Long-term debt |
25,709 | 49,091 | 39,803 | 23,366 | 2,756 | |||||||||||
Total debt |
48,228 | 74,341 | 52,360 | 36,109 | 2,977 | |||||||||||
Total stockholders' equity |
247,212 | 278,021 | 276,000 | 313,710 | 384,800 | |||||||||||
- (1)
- Results of operations for fiscal years 2007 through 2011, and our financial position as of June 30, 2007, 2008, 2009, 2010 and 2011 incorporate the effect of several acquisitions.
36
ITEM 7. MANAGEMENT'S DISCUSSION AND ANALYSIS OF FINANCIAL CONDITION AND RESULTS OF OPERATIONS
Overview
We are a vertically integrated designer and manufacturer of specialized electronic systems and components for critical applications. We sell our products in diversified markets, including homeland security, healthcare, defense and aerospace. We have three operating divisions: (a) Security, providing security and inspection systems, turn-key security screening solutions and related services; (b) Healthcare, providing patient monitoring, diagnostic cardiology and anesthesia systems; and (c) Optoelectronics and Manufacturing, providing specialized electronic components for affiliated end-products divisions, as well as for applications in the defense and aerospace markets, among others.
Security Division. Through our Security division, we design, manufacture and market security and inspection systems worldwide for sale primarily to U.S. and foreign government agencies, and provide turn-key security screening solutions. These products and services are used to inspect baggage, cargo, vehicles and other objects for weapons, explosives, drugs and other contraband as well as to screen people. Revenues from our Security division accounted for 45% of our total consolidated revenues for fiscal 2011.
Healthcare Division. Through our Healthcare division, we design, manufacture and market patient monitoring, diagnostic cardiology and anesthesia systems worldwide for sale primarily to hospitals and medical centers. Our products monitor patients in critical, emergency and perioperative care areas of the hospital and provide such information, through wired and wireless networks, to physicians and nurses who may be at the patient's bedside, in another area of the hospital or even outside the hospital. Revenues from our Healthcare division accounted for 33% of our total consolidated revenues for fiscal 2011.
Optoelectronics and Manufacturing Division. Through our Optoelectronics and Manufacturing division, we design, manufacture and market optoelectronic devices and provide electronics manufacturing services worldwide for use in a broad range of applications, including aerospace and defense electronics, security and inspection systems, medical imaging and diagnostics, computed tomography (CT), telecommunications, office automation, computer peripherals, industrial automation, automotive diagnostic systems and renewable energy. We also provide our optoelectronic devices and value-added manufacturing services to our own Security and Healthcare divisions. Revenues from our Optoelectronics and Manufacturing division accounted for approximately 22% of our total consolidated revenues for fiscal 2011.
Consolidated Results
Fiscal 2011 Compared with Fiscal 2010. We reported consolidated operating profit of $47.8 million for fiscal 2011, a 30% improvement over the $36.8 million operating profit reported for fiscal 2010. This improved profitability was driven primarily by a $21.3 million improvement in gross profit as a result of a 10% increase in sales. This increase in gross profit was partially offset by a $2.8 million, or 2%, increase in selling, general and administrative (SG&A) and by a $6.9 million, or 18%, increase in research and development (R&D) expenses in support of new product development.
Fiscal 2010 Compared with Fiscal 2009. We reported consolidated operating profit of $36.8 million for fiscal 2010, an 89% improvement over the $19.5 million operating profit reported for fiscal 2009. This improved profitability was driven primarily by a $16.5 million improvement in gross profit as a result of product mix, operational efficiencies gained in our supply chain and ongoing restructuring and cost-cutting initiatives that we undertook during the previous three fiscal years as well as to a reduction in non-recurring restructuring and other charges of $4.3 million to $2.9 million in fiscal 2010 from $7.1 million incurred in fiscal 2009. These improvements in operating profitability were partially offset by a $3.6 million increase in selling, general and administrative (SG&A) and research and development (R&D) expenses.
37
Acquisitions. Historically, an active acquisition program has been an important element of our corporate strategy. Over the past three years, each of our acquisitions has not been considered materially significant, either individually or in the aggregate. We continue to believe that an active acquisition program supports our long-term strategic goals and we intend to look to acquisitions to strengthen our competitive position, expand our customer base and augment our considerable research and development programs. Through such efforts we aim to accelerate innovation, improve earnings and increase overall shareholder value.
Critical Accounting Policies and Estimates
The following discussion and analysis of our financial condition and results of operations is based on our Consolidated Financial Statements, which have been prepared in conformity with accounting principles generally accepted in the United States. Our preparation of these Consolidated Financial Statements requires us to make judgments and estimates that affect the reported amounts of assets and liabilities, disclosure of contingent assets and liabilities at the date of the financial statements and the reported amounts of revenues and expenses during the reporting period. We base our estimates on historical experience and on various other assumptions that we believe to be reasonable under the circumstances. As a result, actual results may differ from such estimates. Our senior management has reviewed these critical accounting policies and related disclosures with the Audit Committee of our Board of Directors. The following summarizes our critical accounting policies and significant estimates used in preparing our Consolidated Financial Statements:
Revenue Recognition. We recognize revenue upon shipment of products when title and risk of loss passes, and when terms are fixed and collection is probable. In cases where product installation services are essential to the functionality of the equipment, we defer the portion of revenue for the sale attributable to installation until we have completed the installation. When terms of sale include subjective customer acceptance criteria, we defer revenue until we have achieved the acceptance criteria. Concurrent with the shipment of a product, we accrue estimated product return reserves and warranty expenses. Critical judgments made by management related to revenue recognition include the determination of whether or not customer acceptance criteria are perfunctory or inconsequential. The determination of whether or not the customer acceptance terms are perfunctory or inconsequential impacts the amount and timing of the revenue that we recognize. Critical judgments also include estimates of warranty reserves, which are established based on historical experience and knowledge of the product.
We recognize revenues from separate service maintenance contracts ratably over the term of the contracts. For other services, we recognize service revenues as we perform the services. Deferred revenue for services arises from advance payments received from customers for services not yet performed. We record billed shipping and handling fees as revenue and the associated costs as cost of goods sold.
Allowance for Doubtful Accounts. The allowance for doubtful accounts involves estimates based on management's judgment, review of individual receivables and analysis of historical bad debts. We monitor collections and payments from our customers and we maintain allowances for doubtful accounts for estimated losses resulting from the inability of our customers to make required payments. We also assess current economic trends that might impact the level of credit losses in the future. If the financial condition of our customers were to deteriorate, resulting in an impairment of their ability to make payments, additional allowances could be required.
Inventory. Inventory is stated at the lower of cost or market. Cost is determined on the first-in, first-out method. We write down inventory for slow-moving and obsolete inventory based on assessments of future demands, market conditions and customers who may be experiencing financial difficulties. If these factors were to become less favorable than those projected, additional inventory write-downs could be required.
Income Taxes. Our annual tax rate is based on our income, statutory tax rates and tax planning opportunities available to us in the various jurisdictions in which we operate. Tax laws are complex and subject to different interpretations by the taxpayer and respective governmental taxing authorities. Significant judgment is required in
38
determining our tax expense and in evaluating our tax positions including evaluating uncertainties. We review our tax positions quarterly and adjust the balances as new information becomes available.
Deferred income tax assets represent amounts available to reduce income taxes payable on taxable income in future years. Such assets arise because of temporary differences between the financial reporting and tax bases of assets and liabilities, as well as from net operating loss and tax credit carryforwards. We evaluate the recoverability of these future tax deductions by assessing the adequacy of future expected taxable income from all sources, including reversal of taxable temporary differences, forecasted operating earnings and available tax planning strategies. These sources of income inherently rely on estimates. To provide insight, we use our historical experience and our short and long-range business forecasts. We believe it is more likely than not that a portion of the deferred income tax assets may expire unused and therefore have established a valuation allowance against them. Although realization is not assured for the remaining deferred income tax assets, we believe it is more likely than not that the deferred tax assets will be fully recoverable within the applicable statutory expiration periods. However, deferred tax assets could be reduced in the near term if our estimates of taxable income are significantly reduced or available tax planning strategies are no longer viable.
Business Combinations. Under the acquisition method of accounting, we allocate the fair value of the consideration paid for the businesses to the tangible and identifiable intangible assets acquired and liabilities assumed based on their estimated fair values. We record the excess of purchase price over the aggregate fair values as goodwill. We engage third-party appraisal firms to assist us in determining the fair values of assets acquired and liabilities assumed. These valuations require us to make significant estimates and assumptions, especially with respect to intangible assets and the fair value of contingent payment obligations. Critical estimates in valuing purchased technology, customer lists and other identifiable intangible assets include future cash flows that we expect to generate from the acquired assets. If the subsequent actual results and updated projections of the underlying business activity change compared with the assumptions and projections used to develop these values, we could experience impairment charges. In addition, we have estimated the economic lives of certain acquired assets and these lives are used to calculate depreciation and amortization expense. If our estimates of the economic lives change, depreciation or amortization expenses could be accelerated or slowed.
Impairment of Long-Lived Assets. We test goodwill for impairment at the reporting unit level at least annually and more frequently upon the occurrence of certain events. For purposes of testing for goodwill impairment, we have determined that we have three reporting units for goodwill impairment review purposes, consisting of our Security division, our Healthcare division and our Optoelectronics and Manufacturing division. We test goodwill for impairment annually during the second fiscal quarter using a two-step process. First, we determine if the carrying amount of any of the reporting units exceeds its fair value. The fair value of the reporting units is calculated using the income approach and the market approach. Under the income approach, the fair value of the reporting units is calculated by estimating the present value of associated future cash flows. Under the market approach, the fair value is calculated using the guideline public company method and the mergers and acquisitions method. We performed this annual impairment test for goodwill during the second quarter of fiscal 2011 and concluded that there was no impairment of goodwill.
We evaluate long-lived assets, with finite lives, for impairment whenever events or changes in circumstances indicate that the carrying value of an asset may not be recoverable. Impairment is considered to exist if the total estimated future cash flows on an undiscounted basis are less than the carrying amount of the assets. If impairment does exist, we measure the impairment loss and record it based on discounted estimated future cash flows. In estimating future cash flows, we group assets at the lowest level for which there are identifiable cash flows that are largely independent of cash flows from other asset groups. Our estimate of future cash flows is based upon, among other things, certain assumptions about expected future operating performance, growth rates and other factors.
Although we believe the assumptions and estimates we have made in the past have been reasonable and appropriate, different assumptions and estimates could materially impact our reported financial results. More
39
conservative estimates of the anticipated future benefits from these businesses could result in impairment charges, which would decrease net income and result in lower asset values on our balance sheet.
Stock-Based Compensation Expense. We account for stock-based compensation using fair value recognition provisions. Thus, we record stock-based compensation as a charge to earnings net of the estimated impact of forfeited awards. As such, we recognize stock-based compensation cost only for those stock-based awards that are estimated to ultimately vest over their requisite vesting period, based on the vesting provisions of the individual grants.
The process of estimating the fair value of stock-based compensation awards and recognizing stock-based compensation cost over their requisite vesting period involves significant assumptions and judgments. We estimate the fair value of stock option awards on the date of grant using the Black-Scholes option-valuation model which requires that we make certain assumptions regarding: (i) the expected volatility in the market price of our Common Stock; (ii) dividend yield; (iii) risk-free interest rates; and (iv) the period of time employees are expected to hold the award prior to exercise. We estimate the fair value of restricted stock awards on the date of the grant using the market price of our Common Stock on that date. In addition, we are required to estimate the expected impact of forfeited awards and recognize stock-based compensation cost only for those awards expected to vest. If actual forfeiture rates differ materially from our estimates, stock-based compensation expense could differ significantly from the amounts we have recorded in the current period. We periodically review actual forfeiture experience and revise our estimates, as necessary. We recognize the cumulative effect on current and prior periods of a change in the estimated forfeiture rate as compensation cost in earnings in the period of the revision. As a result, if we revise our assumptions and estimates, our stock-based compensation expense could change materially in the future. See Note 8 (Stock-based Compensation) to the Consolidated Financial Statements for a further discussion of stock-based compensation.
Legal and Other Contingencies. We are subject to various claims and legal proceedings. Each fiscal quarter, we review the status of each significant legal dispute to which we are a party and assess our potential financial exposure, if any. If the potential financial exposure from any claim or legal proceeding is considered probable and the amount can be reasonably estimated, we record a liability and an expense for the estimated loss. Significant judgment is required in both the determination of probability and the determination as to whether an exposure is reasonably estimable. Because of uncertainties related to these matters, accruals are based only on the best information available at the time. As additional information becomes available, we reassess the potential liability related to our pending claims and litigation and revise our estimates accordingly. Such revisions in the estimates of the potential liabilities could have a material impact on our results of operations and financial position.
Net Revenues
The table below and the discussion that follows are based upon the way we analyze our business. See Note 14 to the Consolidated Financial Statements for additional information about business segments.
| |
2009 | % of Net Sales |
2010 | % of Net Sales |
2011 | % of Net Sales |
2009-2010 % Change |
2010-2011 % Change |
|||||||||||||||||||
|---|---|---|---|---|---|---|---|---|---|---|---|---|---|---|---|---|---|---|---|---|---|---|---|---|---|---|---|
| |
(Dollars in millions) |
||||||||||||||||||||||||||
Security |
$ | 240.9 | 41 | % | $ | 251.5 | 42 | % | $ | 294.7 | 45 | % | 4 | % | 17 | % | |||||||||||
Healthcare |
214.3 | 36 | % | 206.6 | 35 | % | 215.0 | 33 | % | (4 | )% | 4 | % | ||||||||||||||
Optoelectronics / Manufacturing |
181.1 | 31 | % | 171.2 | 29 | % | 192.9 | 29 | % | (5 | )% | 13 | % | ||||||||||||||
Elimination of Intersegment Revenue |
(45.9 | ) | (8 | )% | (34.2 | ) | (6 | )% | (46.5 | ) | (7 | )% | (25 | )% | 36 | % | |||||||||||
Total Sales |
$ | 590.4 | $ | 595.1 | $ | 656.1 | 1 | % | 10 | % | |||||||||||||||||
Fiscal 2011 Compared with Fiscal 2010. Net revenues for fiscal 2011 increased $61.0 million, or 10%, to $656.1 million from $595.1 million for fiscal 2010.
40
Revenues for the Security division for fiscal 2011 increased $43.2 million, or 17%, to $294.7 million, from $251.5 million for fiscal 2010. The increase was attributable to a $30.5 million, or 15%, increase in equipment sales, primarily driven by a $23.4 million increase in baggage and parcel inspection, people screening and hold baggage screening products and a $3.1 million increase in revenues from our cargo inspection products. In addition, service revenues increased by $12.0 million, or 24%, due to the growing installed base of products from which we derive service revenue as warranty periods expire.
Revenues for the Healthcare division for fiscal 2011 increased $8.4 million, or 4%, to $215.0 million, from $206.6 million for fiscal 2010. The increase was primarily attributable to a $7.8 million, or 5%, increase in our patient monitoring product line sales with increases in all regions.
Revenues for the Optoelectronics and Manufacturing division for fiscal 2011 increased $21.7 million, or 13%, to $192.9 million from $171.2 million for fiscal 2010. This increase was primarily driven by an increase in commercial optoelectronics sales, which increased by $27.4 million, or 41%, both to external customers and through intersegment sales, primarily to our Security division. These increases were partially offset by a reduction of $4.7 million in contract manufacturing sales, mainly driven by the winding down of a large defense-industry related contract, which we anticipated. The Optoelectronics and Manufacturing division recorded intersegment sales of $46.5 million, compared to $34.2 million in the comparable prior-year period. This increase in intersegment sales is consistent with the growth of our Security and Healthcare divisions during the period. Such intersegment sales are eliminated in consolidation.
Fiscal 2010 Compared with Fiscal 2009. Net revenues for fiscal 2010 increased $4.7 million, or 1%, to $595.1 million from $590.4 million for fiscal 2009.
Revenues for the Security division for fiscal 2010 increased $10.6 million, or 4%, to $251.5 million, from $240.9 million for fiscal 2009. The increase was attributable to a $6.1 million, or 3%, increase in overall equipment sales, driven by a $25.5 million increase in people screening and hold baggage screening products, which was partially offset by a $19.4 million decrease in revenues from our cargo inspection products. In addition, service revenues increased by $4.5 million, or 10%, due to the growing installed base of products from which we derive service revenue as warranty periods expire.
Revenues for the Healthcare division for fiscal 2010 decreased $7.7 million, or 4%, to $206.6 million, from $214.3 million for fiscal 2009. The decrease was primarily attributable to an 18% decrease in our anesthesia equipment sales and a $6.8 million reduction in the revenues of other product lines such as pulse oximeters. We believe that these decreases were primarily due to generally poor overall economic conditions particularly in Europe. This decrease was partially offset by a $2.8 million increase in patient monitoring revenues, mainly in North America.
Revenues for the Optoelectronics and Manufacturing division for fiscal 2010 decreased by $9.9 million, or 5%, to $171.2 million from $181.1 million for fiscal 2009 due to lower intersegment sales to both our Security and Healthcare divisions in fiscal 2010 as compared to the prior-year period. Sales to external customers though increased by $1.8 million, or 1.4%, to $137.0 million from $135.2 million for fiscal 2009, driven primarily by an increase in our contract manufacturing business. The Optoelectronics and Manufacturing division recorded intersegment sales of $34.2 million, compared to $45.9 million in the comparable prior-year period. Such intersegment sales are eliminated in consolidation.
41
Gross Profit
| |
2009 | % of Net Sales |
2010 | % of Net Sales |
2011 | % of Net Sales |
|||||||||||||
|---|---|---|---|---|---|---|---|---|---|---|---|---|---|---|---|---|---|---|---|
| |
(Dollars in millions) |
||||||||||||||||||
Gross profit |
$ | 201.5 | 34.1 | % | $ | 218.0 | 36.6 | % | $ | 239.3 | 36.5 | % | |||||||
Fiscal 2011 Compared with Fiscal 2010. Gross profit increased $21.3 million, or 10%, to $239.3 million for fiscal 2011, from $218.0 million for fiscal 2010, primarily due to a 10% increase in sales. Our gross margin percentage was flat in fiscal 2011 as compared to fiscal 2010, as improvements in gross margin stemming from further leveraging of our manufacturing and distribution infrastructure associated with increased sales, were offset by a less favorable mix of the products we sold, as sales by our Healthcare division, which generates the highest gross margin when compared to our other two divisions, did not increase as quickly as sales by our other two divisions.
Fiscal 2010 Compared with Fiscal 2009. Gross profit increased $16.5 million, or 8%, to $218.0 million for fiscal 2010, from $201.5 million for fiscal 2009, as a result of a 2.5% improvement in our gross margin. The gross margin increase to 36.6% in fiscal 2010 from 34.1% in fiscal 2009 was primarily attributable to manufacturing efficiencies gained through facility consolidation and operational improvement initiatives and due to a favorable product mix within our Security and Healthcare divisions.
Operating Expenses
| |
2009 | % of Net Sales |
2010 | % of Net Sales |
2011 | % of Net Sales |
2009-2010 % Change |
2010-2011 % Change |
|||||||||||||||||||
|---|---|---|---|---|---|---|---|---|---|---|---|---|---|---|---|---|---|---|---|---|---|---|---|---|---|---|---|
| |
(Dollars in millions) |
||||||||||||||||||||||||||
Selling, general and administrative |
$ | 137.9 | 23.4 | % | $ | 139.8 | 23.5 | % | $ | 142.6 | 21.7 | % | 1 | % | 2 | % | |||||||||||
Research and development |
36.9 | 6.2 | % | 38.6 | 6.5 | % | 45.5 | 7.0 | % | 5 | % | 18 | % | ||||||||||||||
Restructuring and other charges |
7.1 | 1.2 | % | 2.9 | 0.5 | % | 3.4 | 0.5 | % | (61 | )% | 17 | % | ||||||||||||||
Total operating expenses |
$ | 181.9 | 30.8 | % | $ | 181.3 | 30.5 | % | $ | 191.5 | 29.2 | % | — | % | 6 | % | |||||||||||
Selling, General and Administrative
Selling, general and administrative expenses consisted primarily of compensation paid to sales, marketing and administrative personnel, professional service fees and marketing expenses.
Fiscal 2011 Compared with Fiscal 2010. For fiscal 2011, SG&A expenses increased by $2.8 million, or 2%, to $142.6 million, from $139.8 million for fiscal 2010. This increase was primarily to support revenue growth in the Security and Optoelectronics and Manufacturing divisions, partially offset by lower spending in the Healthcare division resulting from cost containment initiatives that were a part of our continuous effort to leverage our cost structure.
Fiscal 2010 Compared with Fiscal 2009. For fiscal 2010, SG&A expenses increased by $1.9 million, or 1%, to $139.8 million, from $137.9 million for fiscal 2009. This increase in primarily to support revenue growth in the Security division, partially offset by lower spending throughout other parts of the company, especially in the Healthcare division, as a result of cost containment initiatives that were a part of our continuous effort to leverage our cost structure
42
Research and Development
Our Security and Healthcare divisions have historically invested substantial amounts in research and development. We intend to continue this trend in future years, although specific programs may or may not continue to be funded and funding levels may fluctuate. Research and development expenses included research related to new product development and product enhancement expenditures.
Fiscal 2011 Compared with Fiscal 2010. For fiscal 2011, such expenses increased by $6.9 million, or 18%, to $45.5 million, from $38.6 million for fiscal 2010. As a percentage of revenues, R&D expenses were 7.0% in fiscal 2011, compared to 6.5% in fiscal 2010. The increase in R&D spending in fiscal 2011 resulted from an increase in both our Security and Healthcare divisions in support of new product introductions.
Fiscal 2010 Compared with Fiscal 2009. For fiscal 2010, such expenses increased by $1.7 million, or 5%, to $38.6 million, from $36.9 million for fiscal 2009. As a percentage of revenues, R&D expenses were 6.5% in fiscal 2010, compared to 6.2% in fiscal 2009. The increase in R&D spending in fiscal 2010 resulted from an increase in both our Security and Healthcare divisions in support of new product introductions.
Restructuring and Other Charges
Beginning in fiscal 2007, we initiated a series of restructuring activities that were intended to realign our global capacity and infrastructure with demand by our customers and fully integrate acquisitions made in prior years, thereby improving our operational efficiency. These activities included reducing excess workforce and capacity, consolidating and relocating certain manufacturing facilities and reviewing the value of certain technologies and product lines. The overall objectives of the restructuring activities were to lower costs and better utilize our existing manufacturing capacity. Then in fiscal 2009, as a result of the worldwide economic downturn, we continued our ongoing focus to aggressively seek operating efficiencies and fixed cost structure reduction. During fiscal 2010 and 2011, we continued these efforts to further increase operating efficiencies, although we implemented fewer changes than those made in prior fiscal years. Our efforts have helped enhance our ability to improve operating margins, retain and expand existing relationships with customers and attract new business. We may utilize similar measures in the future to realign our operations to further increase our operating efficiencies. The effect of these efforts may materially affect our future operating results.
Fiscal 2011 Compared with Fiscal 2010. During fiscal 2011, we incurred $3.4 million of restructuring and other charges, of which $2.2 million related to headcount reductions and $1.2 million to a debt restructuring charge from the early termination of a credit facility, which we replaced with a new credit facility. See note 7 to the Consolidated Financial Statements for further discussion. Of this $3.4 million of restructuring costs, $1.5 million was recorded within our Healthcare division, $0.6 million within our Security division, and $1.3 million within our Corporate holding company segment. During fiscal 2010, we incurred total restructuring and other charges of $2.9 million related to headcount reductions, costs associated with the closure of certain facilities and a non-recurring litigation charge.
Fiscal 2010 Compared with Fiscal 2009. During fiscal 2010, we incurred $2.9 million of restructuring and other charges related to headcount reductions and facility closures. Of this $2.9 million of restructuring costs, $1.3 million was recorded within our Healthcare division, $0.5 million within our Security division, $1.0 million within our Optoelectronics and Manufacturing division and $0.1 million in our Corporate holding company segment. During fiscal 2009, we incurred total restructuring and other charges of $7.1 million related to headcount reductions, costs associated with the closure of certain facilities and a non-recurring litigation charge.
43
Interest Expense and Other Income, net
| |
2009 | % of Net Sales |
2010 | % of Net Sales |
2011 | % of Net Sales |
|||||||||||||
|---|---|---|---|---|---|---|---|---|---|---|---|---|---|---|---|---|---|---|---|
| |
(Dollars in millions) |
||||||||||||||||||
Interest expense and other income, net |
$ | 2.9 | (0.5 | )% | $ | 1.8 | (0.3 | )% | $ | 1.1 | (0.2 | )% | |||||||
Fiscal 2011 Compared to Fiscal 2010. In fiscal 2011, a $0.7 million reduction in interest expense and other income, net, resulted from reduced average debt levels outstanding and a reduction in the liability for contingent acquisition consideration that was recorded as other income during the year.
Fiscal 2010 Compared to Fiscal 2009. In fiscal 2010, a $1.1 million reduction in interest expense and other income, net, resulted from lower market-driven interest rates on our outstanding borrowings as well as lower levels of borrowings as a result of strong, positive cash flow and a reduction in a contingent liability related to an acquisition recorded as other income in fiscal 2010.
Provision for Income Taxes
The effective tax rate for a particular period varies depending on a number of factors including (i) the mix of income earned in various tax jurisdictions, each of which applies a unique range of income tax rates and income tax credits, (ii) changes in previously established valuation allowances for deferred tax assets (changes are based upon our current analysis of the likelihood that these deferred tax assets will be realized), (iii) the level of non-deductible expenses and (iv) tax holidays granted to certain of our international subsidiaries.
Fiscal 2011 Compared to Fiscal 2010. In fiscal 2011, our income tax expense was $13.3 million, compared to an income tax expense of $11.4 million for fiscal 2010. The effective income tax rate for fiscal 2011 decreased to 28.5%, from 32.7% for fiscal 2010. The largest driver of this 4.2% decrease in our income tax rate is the jurisdictions where taxable income was recognized. In fiscal 2011, a higher percentage of income was recognized in foreign jurisdictions with low tax rates and where we benefit from special tax exemptions.
Fiscal 2010 Compared to Fiscal 2009. In fiscal 2010, our income tax expense was $11.4 million, compared to an income tax expense of $5.4 million for fiscal 2009. The effective income tax rate for fiscal 2010 was 32.7%, compared to 32.5% for fiscal 2009.
Liquidity and Capital Resources
Over the past several years we have financed our business primarily through cash flow from operations and by utilizing our credit facilities. Cash and cash equivalents totaled $55.6 million at June 30, 2011, an increase of $3.6 million, or 7%, from $52.0 million at June 30, 2010. As discussed below, a principle use of cash in fiscal 2011 was the early pay down of a $32.6 million term loan associated with the termination of our prior credit facility. The changes in our working capital and cash and cash equivalent balances are described below.
| |
2009 | 2010 | 2011 | 2009-2010 % Change |
2010-2011 % Change |
|||||||||||
|---|---|---|---|---|---|---|---|---|---|---|---|---|---|---|---|---|
| |
(Dollars in millions) |
|||||||||||||||
Working capital |
$ | 187.6 | $ | 204.6 | $ | 244.3 | 9 | % | 19 | % | ||||||
Cash and cash equivalents |
25.2 | 52.0 | 55.6 | 106 | % | 7 | % | |||||||||
Working Capital
Fiscal 2011 Compared to Fiscal 2010. Working capital increased by $39.7 million, or 19%, during fiscal 2011 primarily due to: (i) a $43.7 million increase in inventory, mainly in our Security and Optoelectronic and
44
Manufacturing divisions, to support anticipated growth in shipments, (ii) a $12.5 million decrease in the current portion of long term debt due to the repayment and termination of our former credit facility, which occurred when we entered into a new $250 million credit facility in October 2010; (iii) a $4.0 million increase in accounts receivable and (iv) a $3.6 million increase in cash and cash equivalents. These increases to working capital were partially offset by a $16.8 million increase in accounts payable, driven by the increase in inventory previously noted and an $8.3 million increase in deferred revenue.
Fiscal 2010 Compared to Fiscal 2009. Working capital increased by $17.0 million, or 9%, during fiscal 2010. The most significant increases in working capital were due to (i) cash and cash equivalents increasing by $26.8 million, or 106%, to $52.0 in fiscal 2010 from $25.2 million in fiscal 2009 and (ii) accounts receivable, which increased by $22.3 million, or 20%, to $132.7 million in fiscal 2010 from $110.5 million in fiscal 2009. The increase in cash and cash equivalents reflects the significant generation of operating cash flow.
| |
2009 | 2010 | 2011 | 2009-2010 % Change |
2010-2011 % Change |
|||||||||||
|---|---|---|---|---|---|---|---|---|---|---|---|---|---|---|---|---|
| |
(Dollars in millions) |
|||||||||||||||
Cash provided by (used in): |
||||||||||||||||
Operating activities |
$ | 44.5 | $ | 52.1 | $ | 40.1 | 17 | % | (23 | )% | ||||||
Investing activities |
(12.4 | ) | (24.4 | ) | (24.0 | ) | 97 | % | (2 | )% | ||||||
Financing activities |
(24.8 | ) | (3.0 | ) | (15.9 | ) | (88 | )% | 430 | % | ||||||
Cash Provided by (Used in) Operating Activities
Cash flows from operating activities can fluctuate significantly from period to period as profitability, tax timing differences and other items can significantly impact cash flows. Our largest source of operating cash flows is cash collections from our customers following the sale of our products and services. Our primary uses of cash for operating activities are for purchasing inventory in support of the products that we sell, personnel related expenditures, facilities costs and payments for general operating matters.
Fiscal 2011 Compared to Fiscal 2010. Cash generated by operating activities in fiscal 2011 was $40.1 million, a decrease of $12.0 million, or 23%, from fiscal 2010. This reduction was primarily due to changes in working capital in the current-year period when compared to the prior-year period, including: (i) a $59.6 million increase in inventory, reflecting both a build-up of inventory, mainly in our Security and Optoelectronics and Manufacturing divisions to support growth as well as improvements realized in the prior fiscal year from inventory reduction initiatives; (ii) a $15.6 million decrease in advances received from customers; and (iii) a $5.1 million decrease in accrued payroll and related expenses. These unfavorable changes in cash flow were partially offset by the following favorable changes in working capital: (i) a $20.3 million improvement in the change from accounts receivable reflecting our ongoing focus on collection activity; (ii) a $19.8 million increase in cash from accounts payable, which largely corresponds to the aforementioned inventory buildup; (iii) a $9.2 million increase in cash from deferred revenues and (iv) a $18.1 million increase in net income for fiscal 2011, after giving consideration to non-cash operating items including depreciation and amortization, stock-based compensation, deferred taxes, provision for losses on accounts receivable and tax effect on the exercise of stock options among others for both periods.
Fiscal 2010 Compared to Fiscal 2009. Cash generated by operating activities in fiscal 2010 was $52.1 million, an increase of $7.6 million, or 17%, from fiscal 2009. This improvement was partially due to a $14.7 million increase in our net income in fiscal 2010 as compared to fiscal 2009, after giving consideration to non-cash operating items, including depreciation and amortization, stock-based compensation, deferred taxes and provisions for losses on accounts receivable, among others for both periods. This improvement was also due to an increased emphasis on better working capital management during fiscal 2010, resulting in: (i) a $37.5 million reduction in the change in inventory, due primarily to our inventory reduction initiatives, (ii) a $9.9 million increase in the change from accounts payables, (iii) a $5.0 million reduction in the change in other receivables and (iv) a
45
$4.3 million increase in the change in advances from customers. These cash generating improvements were partially offset by: (i) an increase in the change in account receivables of $54.2 million, partially due to a 19% increase in revenue in the three months ended June 30, 2010 as compared to the comparable prior year period and (ii) a decrease in the change in other accrued expenses and current liabilities of $7.7 million.
Cash Used in Investing Activities
The changes in cash flows from investing activities were primarily related to capital expenditures as well as the acquisition of a business and other assets to support our growth plans.
Fiscal 2011 Compared to Fiscal 2010. Net cash used in investing activities was $24.0 million in fiscal 2011, a decrease of $0.4 million, or 2%, as compared to the $24.4 million used in fiscal 2010. This decrease was primarily due to a $4.7 million reduction in capital expenditures offset by a $3.1 million increase in cash used to acquire businesses and a $1.2 million increase in cash used for the acquisition of intangible and other assets.
Fiscal 2010 Compared to Fiscal 2009. Net cash used in investing activities was $24.4 million in fiscal 2010, an increase of $12.0 million, or 97%, as compared to the $12.4 million used in fiscal 2009. This increase was primarily due to the manufacture of cargo screening systems destined for a future turn-key cargo screening solution to be provided at the port of San Juan, Puerto Rico. During fiscal 2010, we also paid $3.2 million related to an acquisition. There were no acquisitions in fiscal 2009.
Cash Provided by Financing Activities
The changes in cash flows from financing activities primarily relate to: (i) borrowings and payments under debt obligations; (ii) the issuance of and/or repurchase of common stock and (iii) employee stock acquisition activities.
Fiscal 2011 Compared to Fiscal 2010. Net cash used in financing activities was $15.9 million in fiscal 2011, compared to net cash of $3.0 million used in fiscal 2010. In fiscal 2011, we repaid a $32.6 million term loan that was outstanding under our former credit facility as well as a capital lease obligation of $0.7 million, as compared to fiscal 2010 when we paid down $12.0 million of scheduled debt and capital leases and reduced our bank lines of credit by $4.0 million. These payments were partially offset by the receipt of $19.6 million in proceeds from the exercise of stock options and the purchase of stock under our employee stock purchase plan in fiscal 2011, compared to $13.0 million in fiscal 2010. In addition, in fiscal 2011 we used $2.2 million in cash to repurchase 58,396 shares of our Common Stock under our Common Stock repurchase program, but did not make any such share repurchases in fiscal 2010.
Fiscal 2010 Compared to Fiscal 2009. Net cash used in financing activities was $3.0 million in fiscal 2010, a $21.8 million, compared to $24.8 million used in fiscal 2009. During fiscal 2010, we used $12.0 million in cash to pay down ongoing scheduled debt and capital leases and $4.0 million to pay off our bank lines of credit. In fiscal 2009, we paid down $6.6 million of scheduled debt and capital leases and $14.4 million to reduce our bank lines of credit. In fiscal 2010, we received proceeds of $13.0 million from the exercise of stock options and the purchase of stock under our employee stock purchase plan as compared to $3.6 million in fiscal 2009. In addition, in fiscal 2010, we did not repurchase any shares of our Common Stock repurchase program, but used $7.4 million in cash to repurchase 619,768 shares of our Common Stock under such program in fiscal 2009.
Borrowings
Outstanding lines of credit and current and long-term debt totaled $3.0 million at June 30, 2011, a decrease of $33.1 million from $36.1 million at June 30, 2010. See Note 7 to the Consolidated Financial Statements for further discussion.
46
The following is a summary of our contractual obligations and commitments at June 30, 2011 (in thousands):
| |
Payments Due by Period | |||||||||||||||
|---|---|---|---|---|---|---|---|---|---|---|---|---|---|---|---|---|
| |
Total | Less than 1 year |
2-3 years | 4-5 years | After 5 years |
|||||||||||
Total debt |
$ | 2,977 | $ | 221 | $ | 442 | $ | 442 | $ | 1,872 | ||||||
Operating leases |
$ | 36,576 | $ | 11,756 | $ | 18,988 | $ | 5,185 | $ | 647 | ||||||
Purchase obligations |
$ | 53,992 | $ | 49,503 | $ | 4,376 | $ | 113 | $ | — | ||||||
Defined benefit plan obligation |
$ | 8,715 | $ | 481 | $ | 590 | $ | 968 | $ | 6,676 | ||||||
Total contractual obligations |
$ | 102,260 | $ | 61,961 | $ | 24,396 | $ | 6,708 | $ | 9,195 | ||||||
Other Commercial Commitments—letters of credit |
$ | 46,847 | $ | 33,110 | $ | 11,884 | $ | 288 | $ | 1,565 | ||||||
We anticipate that cash generated from our operations, in addition to existing cash borrowing arrangements and future access to capital markets should be sufficient to meet our cash requirements for the foreseeable future. However, our future capital requirements will depend on many factors, including future business acquisitions, capital expenditures, litigation, stock repurchases and levels of research and development spending, among other factors. The adequacy of available funds will depend on many factors, including the success of our businesses in generating cash, continued compliance with financial covenants contained in our credit facility and the health of capital markets in general, among other factors.
Stock Repurchase Program
Our Board of Directors authorized a stock repurchase program under which we may repurchase up to 3,000,000 shares of our Common Stock. During the 12 months ended June 30, 2011, we repurchased 58,396 shares under this program. As of June 30, 2011, 652,809 shares were available for additional repurchase under the program. During the twelve months ended June 30, 2010, we did not repurchase any shares under this program. Upon repurchase, the shares are restored to the status of authorized but unissued shares and we record them as a reduction in the number of shares of Common Stock issued and outstanding in our Consolidated Financial Statements.
Off Balance Sheet Arrangements
As of June 30, 2011, we had no off balance sheet arrangements, as defined in Item 303(a)(4) of Regulation S-K, other than those previously disclosed.
New Accounting Pronouncements
For information with respect to new accounting pronouncements and the impact of these pronouncements on our Consolidated Financial Statements, see Note 1 to Consolidated Financial Statements.
Related-Party Transactions
In 1994, we, together with an unrelated company, formed ECIL-Rapiscan Security Products Limited, a joint venture organized under the laws of India. We own a 36% interest in the joint venture, our Chairman and Chief Executive Officer owns a 10.5% interest, and our Executive Vice President and the President of our Security division owns a 4.5% ownership interest. Our initial investment was $0.1 million. For the years ended June 30, 2009, 2010 and 2011, our equity earnings in the joint venture amounted to $0.7 million, $0.4 million and $0.6 million, respectively. We, our Chairman and Chief Executive Officer and our Executive Vice President and the President of our Security division collectively control less than 50% of the board of directors voting power in the joint venture. As a result, we account for the investment under the equity method of accounting. The joint venture
47
was formed for the purpose of the manufacture, assembly, service and testing of security and inspection systems and other products. Some of our subsidiaries are suppliers to the joint venture, which in turn manufactures and sells the resulting products. Sales to the joint venture for fiscal 2009, 2010 and 2011 were approximately $4.4 million, $4.4 million and $7.1 million, respectively. Receivables from the joint venture were $0.9 million and $2.2 million as of June 30, 2010 and 2011, respectively.
We have contracted with entities owned by members of our Board of Directors and/or their family members to provide messenger services, auto rental and printing services. Included in cost of sales and selling, general and administrative expenses for fiscal 2009, 2010 and 2011, are approximately $54,000, $64,000 and $60,000, respectively, for messenger service and auto rental; and $45,000, $60,000 and $31,000, respectively, for printing services.
UNAUDITED QUARTERLY RESULTS
The following tables present unaudited quarterly financial information for the four quarters ended June 30, 2010 and 2011 (in thousands, except per share data):
| |
Quarter Ended | ||||||||||||||
|---|---|---|---|---|---|---|---|---|---|---|---|---|---|---|---|
| |
September 30, 2009 |
December 31, 2009 |
March 31, 2010 |
June 30, 2010 |
|||||||||||
| |
(Unaudited) |
||||||||||||||
Revenues |
$ | 133,761 | $ | 150,621 | $ | 145,401 | $ | 165,328 | |||||||
Costs of goods sold |
89,294 | 94,256 | 92,184 | 101,343 | |||||||||||
Gross profit |
44,467 | 56,365 | 53,217 | 63,985 | |||||||||||
Operating expenses: |
|||||||||||||||
Selling, general and administrative expenses |
32,227 | 34,610 | 34,789 | 38,204 | |||||||||||
Research and development |
7,989 | 10,353 | 9,129 | 11,106 | |||||||||||
Restructuring and other charges |
53 | 607 | 946 | 1,253 | |||||||||||
Total operating expenses |
40,269 | 45,570 | 44,864 | 50,563 | |||||||||||
Income from operations |
4,198 | 10,795 | 8,353 | 13,422 | |||||||||||
Interest expense and other income, net |
605 | 784 | (175 | ) | 558 | ||||||||||
Income before provision for income taxes |
3,593 | 10,011 | 8,528 | 12,864 | |||||||||||
Provision for income taxes |
1,083 | 3,059 | 2,416 | 4,881 | |||||||||||
Net income |
$ | 2,510 | $ | 6,952 | $ | 6,112 | $ | 7,983 | |||||||
Basic earnings per common share |
$ | 0.14 | $ | 0.39 | $ | 0.34 | $ | 0.44 | |||||||
Diluted earnings per common share |
$ | 0.14 | $ | 0.39 | $ | 0.33 | $ | 0.42 | |||||||
48
| |
Quarter Ended | ||||||||||||||
|---|---|---|---|---|---|---|---|---|---|---|---|---|---|---|---|
| |
September 30, 2010 |
December 31, 2010 |
March 31, 2011 |
June 30, 2011 |
|||||||||||
| |
(Unaudited) |
||||||||||||||
Revenues |
$ | 128,453 | $ | 169,287 | $ | 174,931 | $ | 183,429 | |||||||
Costs of goods sold |
81,555 | 109,264 | 112,678 | 113,337 | |||||||||||
Gross profit |
46,898 | 60,023 | 62,253 | 70,092 | |||||||||||
Operating expenses: |
|||||||||||||||
Selling, general and administrative expenses |
31,976 | 33,958 | 37,116 | 39,583 | |||||||||||
Research and development |
9,231 | 11,842 | 12,436 | 11,939 | |||||||||||
Restructuring and other charges |
256 | 903 | 905 | 1,360 | |||||||||||
Total operating expenses |
41,463 | 46,703 | 50,457 | 52,882 | |||||||||||
Income from operations |
5,435 | 13,320 | 11,796 | 17,210 | |||||||||||
Interest expense and other income, net |
590 | 506 | (612 | ) | 542 | ||||||||||
Income before provision for income taxes |
4,845 | 12,814 | 12,408 | 16,668 | |||||||||||
Provision for income taxes |
1,453 | 3,596 | 3,642 | 4,622 | |||||||||||
Net income |
$ | 3,392 | $ | 9,218 | $ | 8,766 | $ | 12,046 | |||||||
Basic earnings per common share |
$ | 0.18 | $ | 0.49 | $ | 0.46 | $ | 0.63 | |||||||
Diluted earnings per common share |
$ | 0.18 | $ | 0.47 | $ | 0.45 | $ | 0.61 | |||||||
ITEM 7A. QUANTITATIVE AND QUALITATIVE DISCLOSURES ABOUT MARKET RISK
Market Risk
We are exposed to certain market risks, which are inherent in our financial instruments and arise from transactions entered into in the normal course of business. We may enter into derivative financial instrument transactions in order to manage or reduce market risk in connection with specific foreign-currency-denominated transactions. We do not enter into derivative financial instrument transactions for speculative purposes.
We are subject to interest rate risk on our short-term borrowings under our bank lines of credit. Borrowings under these lines of credit do not give rise to significant interest rate risk because these borrowings have short maturities and are borrowed at variable interest rates. Historically, we have not experienced material gains or losses due to interest rate changes.
Foreign Currency
We maintain the accounts of our operations in each of the following countries in the respective currencies: Finland, France, Germany, Italy and Greece (Euros), Singapore (U.S. dollars), Malaysia (U.S. dollars), United Kingdom (U.K. pounds), Norway (Norwegian kroners), India (Indian rupees), Indonesia (Indonesian rupiah and U.S. dollars), Hong Kong (Hong Kong dollars), China (Chinese Yuan), Canada (Canadian dollars), Mexico (Mexican pesos), Australia (Australian dollars) and Cyprus (Cypriot pounds). Foreign currency financial statements are translated into U.S. dollars at fiscal year-end rates, with the exception of revenues, costs and expenses, which are translated at average rates during the reporting period. We include gains and losses resulting from foreign currency transactions in income, while we exclude those resulting from translation of financial statements from income and include them as a component of accumulated other comprehensive income. Transaction gains and losses, which were included in our consolidated statement of operations, amounted to a gain (loss) of approximately $0.4 million, ($3.2) million and ($2.0) million for the fiscal years ended June 30, 2009, 2010 and 2011, respectively. Furthermore, a 10% appreciation of the U.S. dollar relative to the local currency exchange rates would have resulted in a net increase in our operating income of approximately $7.0 million in fiscal
49
2011. Conversely, a 10% depreciation of the U.S. dollar relative to the local currency exchange rates would have resulted in a net decrease in our operating income of approximately $7.0 million in fiscal 2011.
Use of Derivatives
Our use of derivatives consists primarily of foreign exchange contracts and interest rate swap agreements. As discussed in Note 1 to the Consolidated Financial Statements, as of June 30, 2011, we had outstanding a foreign currency forward contract, which was considered an effective cash flow hedge in its entirety. As a result, the net loss on such derivative contract has been reported as a component of other comprehensive income in the Consolidated Financial Statements and will be reclassified into net earnings when the hedged transaction settles.
Importance of International Markets
International markets provide us with significant growth opportunities. However, the following events, among others, could adversely affect our financial results in subsequent periods: periodic economic downturns in different regions of the world, changes in trade policies or tariffs, civil or military conflict and other political instability. We continue to perform ongoing credit evaluations of our customers' financial condition. We monitor economic and currency conditions around the world to evaluate whether there may be any significant effect on our international sales in the future. Due to our overseas investments and the necessity of dealing with local currencies in our foreign business transactions, we are at risk with respect to foreign currency fluctuations.
Inflation
We do not believe that inflation has had a material impact on our results of operations.
Interest Rate Risk
The principal maturity and estimated value of our long-term debt exposure as of June 30, 2011 are as follows (in thousands):
| |
Maturity | |
|
||||||||||||||||||||||
|---|---|---|---|---|---|---|---|---|---|---|---|---|---|---|---|---|---|---|---|---|---|---|---|---|---|
| |
2012 | 2013 | 2014 | 2015 | 2016 | 2017 and thereafter |
Total | Fair Value |
|||||||||||||||||
Secured long term loans |
$ | 221 | $ | 221 | $ | 221 | $ | 221 | $ | 221 | $ | 1,872 | $ | 2,977 | $ | 2,977 | |||||||||
Average interest rate |
2.0% | 2.0% | 2.0% | 2.0% | 2.0% | 2.0% | 2.0% | ||||||||||||||||||
The principal maturity and estimated value of our long-term debt exposure as of June 30, 2010 were as follows (in thousands):
| |
Maturity | |
|
||||||||||||||||||||||
|---|---|---|---|---|---|---|---|---|---|---|---|---|---|---|---|---|---|---|---|---|---|---|---|---|---|
| |
2011 | 2012 | 2013 | 2014 | 2015 | 2016 and thereafter |
Total | Fair Value |
|||||||||||||||||
Secured long term loans and capital lease obligations |
$ | 12,743 | $ | 6,294 | $ | 14,609 | $ | 218 | $ | 218 | $ | 2,027 | $ | 36,109 | $ | 36,109 | |||||||||
Average interest rate |
3.3% | 3.5% | 2.9% | 3.4% | 3.4% | 3.4% | 3.3% | ||||||||||||||||||
ITEM 8. FINANCIAL STATEMENTS AND SUPPLEMENTARY DATA
We make reference here to the Index to Consolidated Financial Statements that appears on page F-1 of this report. The Report of Independent Registered Public Accounting Firm from Moss Adams LLP, the Consolidated Financial Statements and the Notes to Consolidated Financial Statements listed in the Index to Consolidated
50
Financial Statements, which appear beginning on page F-2 of this report, are incorporated by reference into this Item 8.
ITEM 9. CHANGES IN AND DISAGREEMENTS WITH ACCOUNTANTS ON ACCOUNTING AND FINANCIAL DISCLOSURE
None.
ITEM 9A. CONTROLS AND PROCEDURES
Evaluation of Disclosure Controls and Procedures
As of June 30, 2011, the end of the period covered by this report, our management, including our Chief Executive Officer and our Chief Financial Officer, reviewed and evaluated the effectiveness of our disclosure controls and procedures (as defined in Rule 13a-15(e) and 15d-15(e) of the Securities Exchange Act of 1934, as amended). Such disclosure controls and procedures are designed to ensure that material information we must disclose in this report is recorded, processed, summarized and filed or submitted on a timely basis. Based upon that evaluation our management, Chief Executive Officer and Chief Financial Officer, concluded that our disclosure controls and procedures were effective as of June 30, 2011.
Management's Report on Internal Control over Financial Reporting
Our management is responsible for establishing and maintaining adequate internal control over financial reporting, as such term is defined in Exchange Act Rule 13a-15(f). Under the supervision and with the participation of management, including the Chief Executive Officer and our Chief Financial Officer, we conducted an evaluation of the effectiveness of our internal control over financial reporting based on the framework in Internal Control—Integrated Framework issued by the Committee of Sponsoring Organizations of the Treadway Commission (COSO). Based on that evaluation, management concluded that our internal control over financial reporting was effective as of June 30, 2011.
Moss Adams LLP, an independent registered public accounting firm, has audited and reported on the consolidated financial statements of OSI Systems, Inc. and on the effectiveness of our internal controls over financial reporting. The report of Moss Adams LLP is contained in this Annual Report.
Changes in Internal Control over Financial Reporting
There were no changes in our internal control over financial reporting during fiscal 2011 that have materially affected, or are reasonably likely to materially affect, our internal control over financial reporting.
None.
51
ITEM 10. DIRECTORS, EXECUTIVE OFFICERS AND CORPORATE GOVERNANCE
The information called for by this item is hereby incorporated by reference from our definitive Proxy Statement relating to the 2011 Annual Meeting of Stockholders, which Proxy Statement is anticipated to be filed with the Securities and Exchange Commission within 120 days of June 30, 2011.
ITEM 11. EXECUTIVE COMPENSATION
The information called for by this item is hereby incorporated by reference from our definitive Proxy Statement relating to the 2011 Annual Meeting of Stockholders, which Proxy Statement is anticipated to be filed with the Securities and Exchange Commission within 120 days of June 30, 2011.
ITEM 12. SECURITY OWNERSHIP OF CERTAIN BENEFICIAL OWNERS AND MANAGEMENT AND RELATED STOCKHOLDER MATTERS
The information called for by this item is hereby incorporated by reference from our definitive Proxy Statement relating to the 2011 Annual Meeting of Stockholders, which Proxy Statement is anticipated to be filed with the Securities and Exchange Commission within 120 days of June 30, 2011.
ITEM 13. CERTAIN RELATIONSHIPS AND RELATED TRANSACTIONS, AND DIRECTOR INDEPENDENCE
The information called for by this item is hereby incorporated by reference from our definitive Proxy Statement relating to the 2011 Annual Meeting of Stockholders, which Proxy Statement is anticipated to be filed with the Securities and Exchange Commission within 120 days of June 30, 2011.
ITEM 14. PRINCIPAL ACCOUNTING FEES AND SERVICES
The information called for by this item is hereby incorporated by reference from our definitive Proxy Statement relating to the 2011 Annual Meeting of Stockholders, which Proxy Statement is anticipated to be filed with the Securities and Exchange Commission within 120 days of June 30, 2011.
52
ITEM 15. EXHIBITS, FINANCIAL STATEMENT SCHEDULES
(a) The following documents are filed as part of this report:
1. Financial Statements. Please see the accompanying Index to Consolidated Financial Statements, which appears on page F-1 of the report. The Report of Independent Registered Public Accounting Firm, the Consolidated Financial Statements and the Notes to Consolidated Financial Statements listed in the Index to Consolidated Financial Statements, which appear beginning on page F-2 of this report, are incorporated by reference into Item 8 above.
2. Financial Statement Schedules.
Schedule II—Valuation and Qualifying Accounts
No other financial statement schedules are presented as the required information is either not applicable or included in the Consolidated Financial Statements or notes thereto.
(b) Exhibits. The exhibits listed on the accompanying Exhibit Index immediately following the signature page are filed as part of, or are incorporated by reference into, this report.
(c) Financial Statement Schedules. Reference is made to Item 15(a)(2) above.
53
OSI SYSTEMS, INC.
INDEX TO CONSOLIDATED FINANCIAL STATEMENTS
F-1
REPORT OF INDEPENDENT REGISTERED PUBLIC ACCOUNTING FIRM
To the Board of Directors and Stockholders of OSI Systems, Inc.:
We have audited the accompanying consolidated balance sheets of OSI Systems, Inc. and Subsidiaries (the "Company") as of June 30, 2010 and 2011, and the related consolidated statements of operations, comprehensive income, stockholders' equity and cash flows for each of the three years in the period ended June 30, 2011. Our audits also included the financial statement schedule listed in the index at Item 15 in Schedule II. We also have audited the Company's internal control over financial reporting as of June 30, 2011, based on criteria established in Internal Control—Integrated Framework issued by the Committee of Sponsoring Organizations of the Treadway Commission. The Company's management is responsible for these consolidated financial statements, for maintaining effective internal control over financial reporting, and for its assessment of the effectiveness of internal control over financial reporting, included in the accompanying Management's Annual Report on Internal Control Over Financial Reporting appearing under Item 9A. Our responsibility is to express an opinion on these consolidated financial statements and an opinion on the Company's internal control over financial reporting based on our audits.
We conducted our audits in accordance with the standards of the Public Company Accounting Oversight Board (United States). Those standards require that we plan and perform the audits to obtain reasonable assurance about whether the consolidated financial statements are free of material misstatement and whether effective internal control over financial reporting was maintained in all material respects. Our audits of the consolidated financial statements included examining, on a test basis, evidence supporting the amounts and disclosures in the consolidated financial statements, assessing the accounting principles used and significant estimates made by management, and evaluating the overall consolidated financial statement presentation. Our audit of internal control over financial reporting included obtaining an understanding of internal control over financial reporting, assessing the risk that a material weakness exists, and testing and evaluating the design and operating effectiveness of internal control based on the assessed risk. Our audits also include performing such other procedures as we considered necessary in the circumstances. We believe that our audits provide a reasonable basis for our opinions.
A company's internal control over financial reporting is a process designed to provide reasonable assurance regarding the reliability of financial reporting and the preparation of financial statements for external purposes in accordance with generally accepted accounting principles. A company's internal control over financial reporting includes those policies and procedures that (1) pertain to the maintenance of records that, in reasonable detail, accurately and fairly reflect the transactions and dispositions of the assets of the company; (2) provide reasonable assurance that transactions are recorded as necessary to permit preparation of financial statements in accordance with generally accepted accounting principles, and that receipts and expenditures of the company are being made only in accordance with authorizations of management and directors of the company; and (3) provide reasonable assurance regarding prevention or timely detection of unauthorized acquisition, use, or disposition of the company's assets that could have a material effect on the consolidated financial statements.
Because of its inherent limitations, internal control over financial reporting may not prevent or detect misstatements. Also, projections of any evaluation of effectiveness to future periods are subject to the risk that controls may become inadequate because of changes in conditions, or that the degree of compliance with the policies or procedures may deteriorate.
In our opinion, the consolidated financial statements referred to above present fairly, in all material respects, the consolidated financial position of OSI Systems, Inc. and Subsidiaries as of June 30, 2010 and 2011, and the consolidated results of their operations, their comprehensive income and their cash flows for each of the three years in the period ended June 30, 2011, in conformity with accounting principles generally accepted in the United States of America. Also, in our opinion, the consolidated financial statement schedule, when considered in relation to the basic consolidated financial statements taken as a whole, presents fairly, in all material respects, the information set forth therein. Also in our opinion, OSI Systems, Inc. and Subsidiaries, maintained, in all material respects, effective internal control over financial reporting as of June 30, 2011, based on criteria established in InternalControl—Integrated Framework issued by the Committee of Sponsoring Organizations of the Treadway Commission.
/s/
MOSS ADAMS LLP
Los Angeles, California
August 25, 2011
F-2
OSI SYSTEMS, INC. AND SUBSIDIARIES
CONSOLIDATED BALANCE SHEETS
(in thousands, except share data)
| |
June 30, | ||||||||||
|---|---|---|---|---|---|---|---|---|---|---|---|
| |
2010 | 2011 | |||||||||
ASSETS |
|||||||||||
CURRENT ASSETS: |
|||||||||||
Cash and cash equivalents |
$ | 51,989 | $ | 55,619 | |||||||
Accounts receivable, net |
132,728 | 136,716 | |||||||||
Other receivables |
2,859 | 5,012 | |||||||||
Inventories |
125,930 | 169,634 | |||||||||
Deferred income taxes |
17,262 | 17,156 | |||||||||
Prepaid expenses and other current assets |
18,433 | 21,149 | |||||||||
Total current assets |
349,201 | 405,286 | |||||||||
Property and equipment, net |
51,515 | 55,017 | |||||||||
Goodwill |
63,941 | 70,292 | |||||||||
Intangible assets, net |
31,975 | 33,707 | |||||||||
Other assets |
16,482 | 20,614 | |||||||||
Total assets |
$ | 513,114 | $ | 584,916 | |||||||
LIABILITIES AND STOCKHOLDERS' EQUITY |
|||||||||||
CURRENT LIABILITIES: |
|||||||||||
Current portion of long-term debt |
$ | 12,743 | $ | 221 | |||||||
Accounts payable |
49,673 | 66,462 | |||||||||
Accrued payroll and related expenses |
23,953 | 24,417 | |||||||||
Advances from customers |
25,325 | 25,191 | |||||||||
Accrued warranties |
10,930 | 14,530 | |||||||||
Deferred revenue |
7,698 | 15,956 | |||||||||
Other accrued expenses and current liabilities |
14,272 | 14,204 | |||||||||
Total current liabilities |
144,594 | 160,981 | |||||||||
Long-term debt |
23,366 | 2,756 | |||||||||
Other long-term liabilities |
31,444 | 36,379 | |||||||||
Total liabilities |
199,404 | 200,116 | |||||||||
Commitment and contingencies (Note 10) |
|||||||||||
Stockholders' Equity: |
|||||||||||
Preferred stock, no par value—authorized, 10,000,000 shares; no shares issued or outstanding |
— | — | |||||||||
Common stock, $0.001 par value—authorized, 100,000,000 shares; issued and outstanding, 18,326,133 and 19,507,065 shares at June 30, 2010 and 2011, respectively |
244,026 | 272,552 | |||||||||
Retained earnings |
76,681 | 110,103 | |||||||||
Accumulated other comprehensive income (loss) |
(6,997 | ) | 2,145 | ||||||||
Total stockholders' equity |
313,710 | 384,800 | |||||||||
Total liabilities and stockholders' equity |
$ | 513,114 | $ | 584,916 | |||||||
See accompanying notes to Consolidated Financial Statements.
F-3
OSI SYSTEMS, INC. AND SUBSIDIARIES
CONSOLIDATED STATEMENTS OF OPERATIONS
(in thousands, except per share data)
| |
Year Ended June 30, | |||||||||||||
|---|---|---|---|---|---|---|---|---|---|---|---|---|---|---|
| |
2009 | 2010 | 2011 | |||||||||||
Revenues |
$ | 590,361 | $ | 595,111 | $ | 656,100 | ||||||||
Cost of goods sold |
388,910 | 377,077 | 416,834 | |||||||||||
Gross profit |
201,451 | 218,034 | 239,266 | |||||||||||
Operating expenses: |
||||||||||||||
Selling, general and administrative expenses |
137,985 | 139,830 | 142,633 | |||||||||||
Research and development |
36,862 | 38,577 | 45,448 | |||||||||||
Restructuring and other charges |
7,123 | 2,859 | 3,424 | |||||||||||
Total operating expenses |
181,970 | 181,266 | 191,505 | |||||||||||
Income from operations |
19,481 | 36,768 | 47,761 | |||||||||||
Interest expense and other income, net |
2,936 | 1,772 | 1,026 | |||||||||||
Income before income taxes |
16,545 | 34,996 | 46,735 | |||||||||||
Provision for income taxes |
5,393 | 11,439 | 13,313 | |||||||||||
Net income |
$ | 11,152 | $ | 23,557 | $ | 33,422 | ||||||||
Earnings per share: |
||||||||||||||
Basic |
$ | 0.64 | $ | 1.32 | $ | 1.77 | ||||||||
Diluted |
$ | 0.63 | $ | 1.28 | $ | 1.71 | ||||||||
Shares used in per share calculation: |
||||||||||||||
Basic |
17,518 | 17,874 | 18,843 | |||||||||||
Diluted |
17,596 | 18,389 | 19,548 | |||||||||||
See accompanying notes to Consolidated Financial Statements.
F-4
OSI SYSTEMS, INC. AND SUBSIDIARIES
CONSOLIDATED STATEMENTS OF COMPREHENSIVE INCOME
(in thousands)
| |
2009 | 2010 | 2011 | |||||||||||
|---|---|---|---|---|---|---|---|---|---|---|---|---|---|---|
Net income |
$ | 11,152 | $ | 23,557 | $ | 33,422 | ||||||||
Other comprehensive income: |
||||||||||||||
Foreign currency translation adjustment |
(13,644 | ) | (3,202 | ) | 7,233 | |||||||||
Defined benefit pension plans, net of tax |
(529 | ) | (296 | ) | 165 | |||||||||
Net unrealized gain (loss) on investments and derivatives |
339 | (1,601 | ) | 717 | ||||||||||
Reclassification of net realized (gain) loss on investments and derivatives |
(55 | ) | 523 | 1,027 | ||||||||||
Other comprehensive income (loss) |
$ | (13,889 | ) | $ | (4,576 | ) | $ | 9,142 | ||||||
Comprehensive income (loss) |
$ | (2,737 | ) | $ | 18,981 | $ | 42,564 | |||||||
See accompanying notes to Consolidated Financial Statements
F-5
OSI SYSTEMS, INC. AND SUBSIDIARIES
CONSOLIDATED STATEMENTS OF STOCKHOLDERS' EQUITY
(in thousands, except share data)
| |
Common | |
|
||||||||||||||
|---|---|---|---|---|---|---|---|---|---|---|---|---|---|---|---|---|---|
| |
Accumulated Other Comprehensive Income (Loss) |
|
|||||||||||||||
| |
Number of Shares |
Amount | Retained Earnings |
Total | |||||||||||||
Balance—June 30, 2008 |
17,740,057 | $ | 224,581 | $ | 41,972 | $ | 11,468 | $ | 278,021 | ||||||||
Exercise of stock options |
163,680 | 2,495 | 2,495 | ||||||||||||||
Vesting of restricted shares |
52,006 | — | — | ||||||||||||||
Net tax expense of stock options exercised/forfeited |
— | (555 | ) | (555 | ) | ||||||||||||
Shares purchased under employee stock purchase program |
75,594 | 1,109 | 1,109 | ||||||||||||||
Stock compensation expense |
— | 5,055 | 5,055 | ||||||||||||||
Repurchase of common stock |
(619,768 | ) | (7,388 | ) | (7,388 | ) | |||||||||||
Net income |
— | — | 11,152 | 11,152 | |||||||||||||
Other comprehensive loss |
— | — | (13,889 | ) | (13,889 | ) | |||||||||||
Balance—June 30, 2009 |
17,411,569 | $ | 225,297 | $ | 53,124 | $ | (2,421 | ) | $ | 276,000 | |||||||
Exercise of stock options |
660,764 | 11,226 | 11,226 | ||||||||||||||
Vesting of restricted shares |
112,664 | — | — | ||||||||||||||
Net tax benefit of stock options exercised/forfeited |
— | 732 | 732 | ||||||||||||||
Shares purchased under employee stock purchase program |
141,136 | 1,760 | 1,760 | ||||||||||||||
Stock compensation expense |
— | 5,011 | 5,011 | ||||||||||||||
Net income |
— | — | 23,557 | 23,557 | |||||||||||||
Other comprehensive loss |
— | — | (4,576 | ) | (4,576 | ) | |||||||||||
Balance—June 30, 2010 |
18,326,133 | $ | 244,026 | $ | 76,681 | $ | (6,997 | ) | $ | 313,710 | |||||||
Exercise of stock options |
719,515 | 12,988 | 12,988 | ||||||||||||||
Vesting of restricted shares |
161,124 | — | — | ||||||||||||||
Net tax benefit of stock options exercised/forfeited |
— | 4,862 | 4,862 | ||||||||||||||
Shares purchased under employee stock purchase program |
142,671 | 1,973 | 1,973 | ||||||||||||||
Shares issued—exercise of warrants |
216,018 | 4,679 | 4,679 | ||||||||||||||
Stock compensation expense |
— | 5,789 | 5,789 | ||||||||||||||
Repurchase of common stock |
(58,396 | ) | (2,218 | ) | (2,218 | ) | |||||||||||
Other |
— | 453 | 453 | ||||||||||||||
Net income |
— | — | 33,422 | 33,422 | |||||||||||||
Other comprehensive income |
— | — | 9,142 | 9,142 | |||||||||||||
Balance—June 30, 2011 |
19,507,065 | $ | 272,552 | $ | 110,103 | $ | 2,145 | $ | 384,800 | ||||||||
See accompanying notes to Consolidated Financial Statements.
F-6
OSI SYSTEMS, INC. AND SUBSIDIARIES
CONSOLIDATED STATEMENTS OF CASH FLOWS
(in thousands)
| |
Year Ended June 30, | |||||||||||||||||
|---|---|---|---|---|---|---|---|---|---|---|---|---|---|---|---|---|---|---|
| |
2009 | 2010 | 2011 | |||||||||||||||
CASH FLOWS FROM OPERATING ACTIVITIES |
||||||||||||||||||
Net income |
$ | 11,152 | $ | 23,557 | $ | 33,422 | ||||||||||||
Adjustments to reconcile net income to net cash provided by operating activities: |
||||||||||||||||||
Depreciation and amortization |
17,805 | 18,561 | 18,529 | |||||||||||||||
Stock based compensation expense |
5,055 | 5,011 | 5,789 | |||||||||||||||
Provision for losses on accounts receivable |
5,377 | 291 | 1,844 | |||||||||||||||
Equity in earnings of unconsolidated affiliates |
(689 | ) | (402 | ) | (552 | ) | ||||||||||||
Tax effect of exercise (cancellation) of stock options |
(555 | ) | 732 | 4,862 | ||||||||||||||
Deferred income taxes |
(2,259 | ) | 2,714 | 4,806 | ||||||||||||||
Other |
200 | 289 | 191 | |||||||||||||||
Changes in operating assets and liabilities—net of business acquisitions: |
||||||||||||||||||
Accounts receivable |
30,821 | (23,373 | ) | (3,066 | ) | |||||||||||||
Other receivables |
(2,725 | ) | 2,234 | (2,111 | ) | |||||||||||||
Inventories |
(17,607 | ) | 19,898 | (39,700 | ) | |||||||||||||
Prepaid expenses and other current assets |
(1,660 | ) | (4,213 | ) | (7,276 | ) | ||||||||||||
Accounts payable |
(15,226 | ) | (5,375 | ) | 14,401 | |||||||||||||
Accrued payroll and related expenses |
667 | 4,865 | (249 | ) | ||||||||||||||
Advances from customers |
9,806 | 14,145 | (1,477 | ) | ||||||||||||||
Accrued warranties |
(615 | ) | 1,065 | 3,051 | ||||||||||||||
Deferred revenue |
3,996 | (1,087 | ) | 8,066 | ||||||||||||||
Other accrued expenses and current liabilities |
957 | (6,762 | ) | (391 | ) | |||||||||||||
Net cash provided by operating activities |
44,500 | 52,150 | 40,139 | |||||||||||||||
CASH FLOWS FROM INVESTING ACTIVITIES |
||||||||||||||||||
Acquisition of property and equipment |
(10,852 | ) | (18,087 | ) | (13,395 | ) | ||||||||||||
Proceeds from the sale of property and equipment |
2,300 | 37 | 3 | |||||||||||||||
Acquisition of businesses, net of cash acquired |
— | (3,241 | ) | (6,311 | ) | |||||||||||||
Purchase of investments and marketable securities |
(407 | ) | — | — | ||||||||||||||
Acquisition of intangible and other assets |
(3,467 | ) | (3,103 | ) | (4,306 | ) | ||||||||||||
Net cash used in investing activities |
(12,426 | ) | (24,394 | ) | (24,009 | ) | ||||||||||||
CASH FLOWS FROM FINANCING ACTIVITIES |
||||||||||||||||||
Net repayments of bank lines of credit |
(14,411 | ) | (4,000 | ) | — | |||||||||||||
Payments on long-term debt |
(5,692 | ) | (11,349 | ) | (32,602 | ) | ||||||||||||
Payments of capital lease obligations |
(899 | ) | (644 | ) | (710 | ) | ||||||||||||
Proceeds from exercise of stock options, warrants and employee stock purchase plan |
3,605 | 12,986 | 19,640 | |||||||||||||||
Repurchase of common shares |
(7,388 | ) | — | (2,218 | ) | |||||||||||||
Net cash used in financing activities |
(24,785 | ) | (3,007 | ) | (15,890 | ) | ||||||||||||
Effect of exchange rate changes on cash |
(349 | ) | 2,068 | 3,390 | ||||||||||||||
Net increase in cash and cash equivalents |
6,940 | 26,817 | 3,630 | |||||||||||||||
Cash and cash equivalents—beginning of year |
18,232 | 25,172 | 51,989 | |||||||||||||||
Cash and cash equivalents—end of year |
$ | 25,172 | $ | 51,989 | $ | 55,619 | ||||||||||||
Supplemental disclosure of cash flow information: |
||||||||||||||||||
Interest |
$ | 3,001 | $ | 2,758 | $ | 1,626 | ||||||||||||
Income taxes |
$ | 6,801 | $ | 7,588 | $ | 6,244 | ||||||||||||
See accompanying notes to Consolidated Financial Statements.
F-7
OSI SYSTEMS, INC. AND SUBSIDIARIES
NOTES TO CONSOLIDATED FINANCIAL STATEMENTS
FOR THE THREE YEARS ENDED JUNE 30, 2011
1. SUMMARY OF SIGNIFICANT ACCOUNTING POLICIES
Description of Business—OSI Systems, Inc., together with its subsidiaries (the "Company"), is a vertically integrated designer and manufacturer of specialized electronic systems and components for critical applications. The Company sells its products in diversified markets, including homeland security, healthcare, defense and aerospace.
The Company has three operating divisions: (i) Security, providing security inspection systems, turn-key security screening solutions and related services; (ii) Healthcare, providing patient monitoring, diagnostic cardiology and anesthesia systems, and related services and (iii) Optoelectronics and Manufacturing, providing specialized electronic components for the Security and Healthcare divisions as well as for applications in the defense and aerospace markets, among others.
Through its Security division, the Company designs, manufactures, markets and services security and inspection systems and provides turn-key security screening solutions. The Security division's products are used to inspect baggage, cargo, vehicles and other objects for weapons, explosives, drugs and other contraband and to screen people. Its turn-key security screening solutions include the provision of staffing and operation of security screening checkpoints. These products and services are also used for the safe, accurate and efficient verification of cargo manifests for the purpose of assessing duties and monitoring the export and import of controlled materials.
Through its Healthcare division, the Company designs, manufactures, markets and services patient monitoring, diagnostic cardiology and anesthesia delivery and ventilation systems worldwide primarily under the "Spacelabs" trade name. These products are used by care providers in critical care, emergency and perioperative areas within hospitals as well as physicians' offices, medical clinics and ambulatory surgery centers.
Through its Optoelectronics and Manufacturing division, the Company designs, manufactures and markets optoelectronic devices and provides electronics manufacturing services worldwide for use in a broad range of applications, including aerospace and defense electronics, security and inspection systems, medical imaging and diagnostics, computed tomography (CT), telecommunications, industrial automation, automotive diagnostic systems and renewable energy. This division provides products and services to original equipment manufacturers as well as to the Company's own Security and Healthcare divisions.
Consolidation—The Consolidated Financial Statements include the accounts of OSI Systems, Inc. and its wholly-owned and majority-owned subsidiaries. All significant intercompany accounts and transactions have been eliminated in consolidation. Investments in joint ventures over which the Company has significant influence but does not have voting control are accounted for using the equity method. Investments over which the Company does not have significant influence are accounted for using the cost method.
Use of Estimates—The preparation of financial statements in conformity with accounting principles generally accepted in the United States of America requires management to make estimates and assumptions that affect the reported amounts of assets and liabilities and the disclosure of contingent assets and liabilities at the date of the financial statements and the reported amounts of revenues and expenses during the reporting period. Actual results could differ from those estimates.
Cash Equivalents—The Company considers all highly liquid investments purchased with maturities of three months or less as of the acquisition date, to be cash equivalents.
Allowance for Doubtful Accounts—The allowance for doubtful accounts involves estimates based on management's judgment, review of individual receivables and analysis of historical bad debts. The Company
F-8
OSI SYSTEMS, INC. AND SUBSIDIARIES
NOTES TO CONSOLIDATED FINANCIAL STATEMENTS—(Continued)
FOR THE THREE YEARS ENDED JUNE 30, 2011
reviews customer credit limits based upon each customer's credit worthiness. The Company monitors collections and payments from its customers and maintains allowances for doubtful accounts for estimated losses resulting from the inability of its customers to make required payments. If the financial condition of the Company's customers were to deteriorate, resulting in an impairment of their ability to make payments, additional allowances may be required.
Inventories—Inventories are generally stated at the lower of cost (first-in, first-out) or market. The Company writes down inventory for slow-moving and obsolete inventory based on assessments of future demands, market conditions and customers who may be experiencing financial difficulties. If these factors are less favorable than those projected, additional inventory write-downs may be required.
Property and Equipment—Property and equipment are stated at cost less accumulated depreciation and amortization. Depreciation and amortization are computed using the straight-line method over the estimated useful lives of the assets. Amortization of leasehold improvements is calculated on the straight-line basis over the shorter of the useful life of the asset or the lease term. Leased capital assets are included in property and equipment. Amortization of property and equipment under capital leases is included with depreciation expense.
Goodwill and Other Intangible Assets and Valuation of Long-Lived Assets —Goodwill represents the excess purchase price of net tangible and intangible assets acquired in business combinations over their estimated fair value. Goodwill is allocated to the Company's segments based on the nature of the product line of the acquired business. The carrying value of goodwill is not amortized, but is annually tested for impairment during the Company's second quarter and more often if there is an indicator of impairment. Intangible assets other than goodwill are amortized over their useful lives unless these lives are determined to be indefinite. The Company tests goodwill for impairment using a two-step process. First, the Company determines if the carrying amount of any of its reporting units, consisting of the Security division, the Healthcare division and the Optoelectronics and Manufacturing division, exceeds its fair value. The fair value of the reporting units was calculated using the income approach and the market approach. Under the income approach, the fair value of the reporting units was calculated by estimating the present value of associated future cash flows. Under the market approach, the fair value was calculated using the guideline public company method and the mergers and acquisitions method. If this testwork indicates a potential impairment of goodwill associated with any reporting unit, the Company then compares the implied fair value of the goodwill associated with the respective reporting unit to its carrying amount to determine if there is an impairment loss. There was no goodwill impairment for each of three fiscal years ended June 30, 2011.
The Company evaluates long-lived assets with finite lives for impairment whenever events or changes in circumstances indicate that the carrying amount of the asset may not be recoverable. An impairment is considered to exist if the total estimated future cash flows on an undiscounted basis are less than the carrying amount of the assets. If impairment does exist, the Company measures the impairment loss and records it based on the discounted estimate of future cash flows. In estimating future cash flows, the Company groups assets that represent the lowest level for which identifiable cash flows are largely independent of the cash flows of other groups of assets and liabilities. The Company's estimate of future cash flows is based upon, among other things, certain assumptions about expected future operating performance, growth rates and other factors.
Income Taxes—Deferred income taxes are provided for temporary differences between the financial statement and income tax basis of the Company's assets and liabilities, based on enacted tax rates. A valuation allowance is provided when it is more likely than not that some portion or all of the deferred income tax assets will not be realized. Income tax accounting standards prescribe a two-step process for the financial statement measurement and recognition of a tax position taken or expected to be taken in a tax return. The first step involves
F-9
OSI SYSTEMS, INC. AND SUBSIDIARIES
NOTES TO CONSOLIDATED FINANCIAL STATEMENTS—(Continued)
FOR THE THREE YEARS ENDED JUNE 30, 2011
the determination of whether it is more likely than not (greater than 50 percent likelihood) that a tax position will be sustained upon examination, based on the technical merits of the position. The second step requires that any tax position that meets the more-likely-than-not recognition threshold be measured and recognized in the financial statements at the largest amount of benefit that is greater than 50 percent likely of being realized upon ultimate settlement. The income tax accounting standards also provide guidance on the accounting for related interest and penalties, financial statement classification and disclosure. The cumulative effect of applying these standards is to be reported as an adjustment to the opening balance of retained earnings in the period of adoption. See Note 9 for additional information.
Derivative Instruments and Hedging Activity—The Company's use of derivatives consists primarily of foreign exchange contracts and interest rate swap agreements. As of June 30, 2011, the Company had outstanding a foreign currency forward contract totaling $5.1 million to sell Polish Zloty in anticipation of the settlement in fiscal 2012 of sales denominated in Polish Zloty. Pursuant to generally accepted accounting standards related to derivatives and hedging, this forward contract was considered an effective cash flow hedge. As a result, the net gains or losses on such derivative contract has been reported as a component of other comprehensive income in the Consolidated Financial Statements and will be reclassified into net earnings when the hedged transaction settles.
Fair Value of Financial Instruments—The Company's financial instruments consist primarily of cash, marketable securities, accounts receivable, accounts payable and debt instruments. The carrying values of financial instruments, other than debt instruments, are representative of their fair values due to their short-term maturities. The carrying values of the Company's long-term debt instruments are considered to approximate their fair values because the interest rates of these instruments are variable or comparable to current rates offered to the Company.
Fair value is the price that would be received to sell an asset or paid to transfer a liability in an orderly transaction between market participants at the measurement date. The Company has determined that all of its marketable securities fall into the "Level 1" category, which values assets at the quoted prices in active markets for identical assets; while the Company's derivative instruments fall into the "Level 2" category, which values assets and liabilities from observable inputs other than quoted market prices. There were no assets or liabilities where "Level 3" valuation techniques were used and there were no assets and liabilities measured at fair value on a non-recurring basis.
The fair values of such assets (liabilities) were:
| |
June 30, | ||||||
|---|---|---|---|---|---|---|---|
| |
2010 | 2011 | |||||
Level 1 |
$ | 5,750 | $ | 8,115 | |||
Level 2 |
(244 | ) | (187 | ) | |||
Total |
$ | 5,506 | $ | 7,928 | |||
Revenue Recognition—The Company recognizes revenue upon shipment of products when title and risk of loss passes, and when terms are fixed and collection is probable. The portion of revenue for the sale attributable to installation is deferred and recognized when the installation service is provided. In an instance where terms of sale include subjective customer acceptance criteria, revenue is deferred until we have achieved the acceptance criteria. Concurrent with the shipment of the product, the Company accrues estimated product return reserves and warranty expenses. Critical judgments made by management related to revenue recognition include the determination of whether or not customer acceptance criteria are perfunctory or inconsequential. The determination of whether or
F-10
OSI SYSTEMS, INC. AND SUBSIDIARIES
NOTES TO CONSOLIDATED FINANCIAL STATEMENTS—(Continued)
FOR THE THREE YEARS ENDED JUNE 30, 2011
not customer acceptance terms are perfunctory or inconsequential impacts the amount and timing of revenue recognized. Critical judgments also include estimates of warranty reserves, which are established based on historical experience and knowledge of the product under warranty.
Revenues from out-of-warranty service maintenance contracts are recognized ratably over the term of such contract. For other services, revenues are recognized as the services are performed. Deferred revenue for services arises from advance payments received from customers for services not yet performed.
Freight—The Company records shipping and handling fees it charges to its customers as revenue and related costs as cost of goods sold.
Research and Development Costs—Research and development costs are those costs related to the development of a new product, process or service, or significant improvement to an existing product, process or service. Such costs are charged to operations as incurred.
Stock-Based Compensation—Stock-based compensation cost is measured at the grant date based on the estimated fair value of the award and is recognized as expense over the employee's requisite service period for all stock-based awards granted or modified. See Employee Stock Plans at Note 9 to the Consolidated Financial Statements.
Restructuring and Other Charges—The Company consolidates processes and facilities of its subsidiaries to better align with demand by its customers and thereby improve its operational efficiencies. The associated charges, including reducing workforce and capacity, are recognized as restructuring charges in the Consolidated Financial Statements. During fiscal years 2009, 2010 and 2011, the Company consolidated manufacturing and administrative processes and facilities of certain businesses that resulted in pre-tax restructuring charges of $7.1 million, $2.9 million and $3.4 million, respectively. See Note 6 for additional information about these restructuring charges.
Concentrations of Credit Risk—Financial instruments that are potentially subject to concentrations of credit risk consist primarily of cash, cash equivalents, marketable securities and accounts receivable. The Company restricts investments in cash equivalents to financial institutions with high credit standing. Credit risk on accounts receivable is minimized as a result of the large and diverse nature of the Company's worldwide customer base. No individual customer accounted for more than 10% of accounts receivable as of June 30, 2010 or 2011, or 10% of revenues for the years ended June 30, 2009, 2010 or 2011. The Company performs ongoing credit evaluations of its customers' financial condition and maintains allowances for potential credit losses.
Foreign Currency Translation—The Company transacts business in various foreign currencies. In countries where the functional currency of the underlying operations has been determined to be the local country's currency, revenues and expenses of operations outside the United States are translated into United States dollars using average exchange rates while assets and liabilities of operations outside the United States are translated into United States dollars using year-end exchange rates. The effects of foreign currency translation adjustments are included in stockholders' equity as a component of accumulated other comprehensive income in the accompanying consolidated balance sheets. Transaction gains and losses, which were included in our consolidated statement of operations, amounted to a gain (loss) of approximately $0.4 million, ($3.2) million, and ($2.0) million for the fiscal years ended June 30, 2009, 2010 and 2011, respectively.
F-11
OSI SYSTEMS, INC. AND SUBSIDIARIES
NOTES TO CONSOLIDATED FINANCIAL STATEMENTS—(Continued)
FOR THE THREE YEARS ENDED JUNE 30, 2011
Business Combinations—During the normal course of business the Company makes acquisitions. In the event that an individual acquisition (or an aggregate of acquisitions) is material, appropriate disclosure of such acquisition activity is provided.
Earnings per Share—Basic earnings per share is computed by dividing net income available to common stockholders by the weighted average number of common shares outstanding during the period. Diluted earnings per share is computed by dividing net income available to common stockholders by the sum of the weighted average number of common and dilutive potential common shares outstanding. Potential common shares consist of the shares issuable upon the exercise of stock options or warrants under the treasury stock method.
The following table sets forth the computation of basic and diluted earnings per share for the fiscal years ended June 30 (in thousands, except earnings per share data):
| |
2009 | 2010 | 2011 | |||||||
|---|---|---|---|---|---|---|---|---|---|---|
Net income available to common stockholders |
$ | 11,152 | $ | 23,557 | $ | 33,422 | ||||
Weighted average shares outstanding—basic |
17,518 | 17,874 | 18,843 | |||||||
Dilutive effect of stock options and warrants |
78 | 515 | 705 | |||||||
Weighted average of shares outstanding—diluted |
17,596 | 18,389 | 19,548 | |||||||
Basic earnings per share |
$ | 0.64 | $ | 1.32 | $ | 1.77 | ||||
Diluted earnings per share |
$ | 0.63 | $ | 1.28 | $ | 1.71 | ||||
As of June 30, 2009 and 2010, approximately 1.9 million and 0.4 million, respectively, of potentially dilutive shares associated with stock options and stock warrants were not included in diluted earnings per common share calculations because to do so would have been antidilutive. There were no such potentially dilutive shares as of June 30, 2011.
Provision for Warranties—The Company offers its customers warranties on most products that it sells. These warranties typically provide for repairs for a specified time period. Concurrent with the sale of products, a provision for estimated warranty expenses is recorded with a corresponding increase in cost of goods sold. This provision is adjusted periodically based on historical and anticipated experience. Actual expenses of repairs under warranty, including parts and labor, are charged to this provision when incurred.
| |
Provision for Warranties (in thousands) |
|||
|---|---|---|---|---|
Balance on June 30, 2008 |
$ | 11,597 | ||
Additions |
4,472 | |||
Reductions for warranty repair costs |
(5,963 | ) | ||
Balance on June 30, 2009 |
$ | 10,106 | ||
Additions |
6,653 | |||
Reductions for warranty repair costs |
(5,829 | ) | ||
Balance on June 30, 2010 |
$ | 10,930 | ||
Additions |
9,175 | |||
Reductions for warranty repair costs |
(5,575 | ) | ||
Balance on June 30, 2011 |
$ | 14,530 | ||
F-12
OSI SYSTEMS, INC. AND SUBSIDIARIES
NOTES TO CONSOLIDATED FINANCIAL STATEMENTS—(Continued)
FOR THE THREE YEARS ENDED JUNE 30, 2011
2. ACCOUNTS RECEIVABLE
Accounts receivable consisted of the following (in thousands):
| |
June 30, | ||||||
|---|---|---|---|---|---|---|---|
| |
2010 | 2011 | |||||
Trade receivables |
$ | 137,502 | $ | 139,957 | |||
Unbilled receivables |
1,232 | 2,552 | |||||
Total |
$ | 138,734 | $ | 142,509 | |||
Less: allowance for doubtful accounts |
(6,006 | ) | (5,793 | ) | |||
Accounts receivable, net |
$ | 132,728 | $ | 136,716 | |||
The unbilled costs and accrued profit at June 30, 2011, are expected to be entirely billed and collected during fiscal 2012.
3. INVENTORIES
Net inventory consisted of the following (in thousands):
| |
June 30, | ||||||
|---|---|---|---|---|---|---|---|
| |
2010 | 2011 | |||||
Raw materials |
$ | 69,421 | $ | 92,373 | |||
Work-in-process |
20,847 | 37,202 | |||||
Finished goods |
35,662 | 40,059 | |||||
Total |
$ | 125,930 | $ | 169,634 | |||
4. PROPERTY AND EQUIPMENT
Property and equipment consisted of the following (in thousands):
| |
|
June 30, | |||||||||
|---|---|---|---|---|---|---|---|---|---|---|---|
| |
Estimated Useful Lives |
||||||||||
| |
2010 | 2011 | |||||||||
Land |
N/A | $ | 5,078 | $ | 5,296 | ||||||
Buildings |
20 years | 8,618 | 9,638 | ||||||||
Leasehold improvements |
2-20 years | 12,549 | 12,989 | ||||||||
Equipment and tooling |
3-10 years | 62,861 | 72,104 | ||||||||
Furniture and fixtures |
3-13 years | 4,753 | 4,431 | ||||||||
Computer equipment |
3-5 years | 17,738 | 14,034 | ||||||||
Computer software |
3-10 years | 13,859 | 14,618 | ||||||||
Total |
125,456 | 133,110 | |||||||||
Less accumulated depreciation and amortization |
(73,941 | ) | (78,093 | ) | |||||||
Property and equipment, net |
$ | 51,515 | $ | 55,017 | |||||||
F-13
OSI SYSTEMS, INC. AND SUBSIDIARIES
NOTES TO CONSOLIDATED FINANCIAL STATEMENTS—(Continued)
FOR THE THREE YEARS ENDED JUNE 30, 2011
During fiscal 2009, 2010 and 2011, depreciation expense was approximately $13.9 million, $14.4 million and $14.2 million, respectively. Included in property and equipment are approximately $1.4 million of assets under capital leases as of June 30, 2010, net of accumulated depreciation. There were no assets under capital leases as of June 30, 2011.
5. GOODWILL AND INTANGIBLE ASSETS
The changes in the carrying amount of goodwill for fiscal 2010 and 2011 are as follows (in thousands):
| |
Security Group |
Healthcare Group |
Optoelectronics and Manufacturing Group |
Consolidated | |||||||||
|---|---|---|---|---|---|---|---|---|---|---|---|---|---|
Balance as of June 30, 2009 |
$ | 17,112 | $ | 35,736 | $ | 7,347 | $ | 60,195 | |||||
Goodwill acquired during the period |
— | — | 4,597 | 4,597 | |||||||||
Foreign currency translation adjustment |
(546 | ) | (333 | ) | 28 | (851 | ) | ||||||
Balance as of June 30, 2010 |
$ | 16,566 | $ | 35,403 | $ | 11,972 | $ | 63,941 | |||||
Goodwill acquired during the period |
3,863 | — | 1,654 | 5,517 | |||||||||
Foreign currency translation adjustment |
611 | 209 | 14 | 834 | |||||||||
Balance as of June 30, 2011 |
$ | 21,040 | $ | 35,612 | $ | 13,640 | $ | 70,292 | |||||
Intangible assets subject to amortization consisted of the following (in thousands):
| |
|
June 30, 2010 | June 30, 2011 | ||||||||||||||||||
|---|---|---|---|---|---|---|---|---|---|---|---|---|---|---|---|---|---|---|---|---|---|
| |
Weighted Average Lives |
Gross Carrying Value |
Accumulated Amortization |
Intangibles Net |
Gross Carrying Value |
Accumulated Amortization |
Intangibles Net |
||||||||||||||
Amortizable assets: |
|||||||||||||||||||||
Software development costs |
5 years | $ | 11,877 | $ | 3,954 | $ | 7,923 | $ | 13,090 | $ | 3,807 | $ | 9,283 | ||||||||
Patents |
10 years | 1,630 | 388 | 1,242 | 2,975 | 449 | 2,526 | ||||||||||||||
Core technology |
10 years | 2,029 | 1,094 | 935 | 2,151 | 1,376 | 775 | ||||||||||||||
Developed technology |
13 years | 17,246 | 8,942 | 8,304 | 18,823 | 10,718 | 8,105 | ||||||||||||||
Customer relationships/ backlog |
7 years | 10,437 | 6,132 | 4,305 | 10,411 | 6,824 | 3,587 | ||||||||||||||
Total amortizable assets |
43,219 | 20,510 | 22,709 | 47,450 | 23,174 | 24,276 | |||||||||||||||
Non-amortizable assets: |
|||||||||||||||||||||
Trademarks |
9,266 | 9,266 | 9,431 | 9,431 | |||||||||||||||||
Total intangible assets |
$ | 52,485 | $ | 20,510 | $ | 31,975 | $ | 56,881 | $ | 23,174 | $ | 33,707 | |||||||||
Amortization expense for fiscal 2009, 2010 and 2011 was $3.9 million, $4.1 million and $4.3 million, respectively. Future acquisitions could cause these amounts to increase. At June 30, 2011, estimated future amortization expense was as follows (in thousands):
2012 |
$ | 4,409 | ||||
2013 |
4,153 | |||||
2014 |
2,945 | |||||
2015 |
1,542 | |||||
2016 |
1,425 | |||||
2017 and thereafter |
9,802 | |||||
Total |
$ | 24,276 | ||||
F-14
OSI SYSTEMS, INC. AND SUBSIDIARIES
NOTES TO CONSOLIDATED FINANCIAL STATEMENTS—(Continued)
FOR THE THREE YEARS ENDED JUNE 30, 2011
Software development costs for software products incurred before establishing technological feasibility are charged to operations. Software development costs incurred after establishing technological feasibility and purchased software costs are capitalized on a product-by-product basis until the product is available for general release to customers at which time amortization begins. Annual amortization, charged to cost of sales, is the greater of (i) the amount computed using the ratio that current gross revenues for a product bear to the total current and anticipated future gross revenues for that product and (ii) the straight-line method over the remaining estimated economic life of the product. During fiscal 2009, 2010 and 2011, the Company capitalized software development costs in the amount of $3.4 million, $2.1 million and $1.2 million, respectively.
6. RESTRUCTURING AND OTHER CHARGES
In response to challenging worldwide economic conditions, the Company continued to optimize its cost structure by reducing excess workforce and facilities and consolidating and relocating certain manufacturing facilities. Such efforts resulted in restructuring charges of $7.1 million in 2009, $2.9 million in 2010 and $3.4 million in 2011. The restructuring accruals are included in other accrued expenses and current liabilities in the Consolidated Balance Sheets. The following table analyzes the key components of these restructuring and other charges throughout fiscal 2009, 2010 and 2011:
| |
Security Division |
Healthcare Division |
Optoelectronics and Manufacturing Division |
Corporate | Consolidated | |||||||||||||
|---|---|---|---|---|---|---|---|---|---|---|---|---|---|---|---|---|---|---|
Accrued balance as of June 30, 2008 |
$ | 324 | $ | 819 | $ | 21 | $ | — | $ | 1,164 | ||||||||
Expensed during the year |
||||||||||||||||||
Facility closure |
577 | 1,502 | 166 | — | 2,245 | |||||||||||||
Employee termination costs |
673 | 1,829 | 76 | 300 | 2,878 | |||||||||||||
Litigation |
— | — | — | 2,000 | 2,000 | |||||||||||||
Total expensed during year |
1,250 | 3,331 | 242 | 2,300 | 7,123 | |||||||||||||
Paid during the year |
876 | 4,072 | 64 | 140 | 5,152 | |||||||||||||
Accrued balance as of June 30, 2009 |
$ | 698 | $ | 78 | $ | 199 | $ | 2,160 | $ | 3,135 | ||||||||
Expensed during the year |
||||||||||||||||||
Facility closure |
509 | 89 | 559 | — | 1,157 | |||||||||||||
Employee termination costs |
6 | 1,210 | 396 | 90 | 1,702 | |||||||||||||
Total expensed during year |
515 | 1,299 | 955 | 90 | 2,859 | |||||||||||||
Paid during the year |
750 | 644 | 854 | 2,250 | 4,498 | |||||||||||||
Accrued balance as of June 30, 2010 |
$ | 463 | $ | 733 | $ | 300 | $ | — | $ | 1,496 | ||||||||
Expensed during the year |
||||||||||||||||||
Employee termination costs |
595 | 1,059 | 43 | 535 | 2,232 | |||||||||||||
Debt restructuring |
— | 449 | — | 743 | 1,192 | |||||||||||||
Total expensed during year |
595 | 1,508 | 43 | 1,278 | 3,424 | |||||||||||||
Paid during the year |
593 | 2,062 | 239 | 1,250 | 4,144 | |||||||||||||
Accrued balance as of June 30, 2011 |
$ | 465 | $ | 179 | $ | 104 | $ | 28 | $ | 776 | ||||||||
F-15
OSI SYSTEMS, INC. AND SUBSIDIARIES
NOTES TO CONSOLIDATED FINANCIAL STATEMENTS—(Continued)
FOR THE THREE YEARS ENDED JUNE 30, 2011
7. LINE-OF-CREDIT BORROWINGS AND DEBT
In October 2010, the Company entered into a credit agreement with a syndicate of banks. This new credit agreement replaced the Company's prior credit agreement, which was repaid and terminated simultaneously with its entry into the new agreement. The new agreement consists of a $250 million, five-year revolving credit facility, including a $155 million sub-limit for letters of credit. Borrowings under this facility bear interest, based on the Company's option, at either (i) London Interbank Offered Rate (LIBOR) plus margins that range from 2.00% to 2.50% or (ii) the sum of margins that range from 1.00% to 1.50% and the higher of (a) the bank's prime rate, (b) the Fed Funds rate plus 0.5% or (c) LIBOR plus 1.0%. The margins are determined by the Company's consolidated leverage ratio. The Company's borrowings under the credit agreement are guaranteed by the Company's U.S.-based subsidiaries and are secured by substantially all of the Company's and certain subsidiaries' assets. The agreement contains various representations, warranties, affirmative, negative and financial covenants and conditions of default customary for financing agreements of this type, including restrictions on the Company's ability to pay cash dividends. As of June 30, 2011, there was no debt outstanding under the revolving credit facility and $30.3 million was outstanding under the letter-of-credit facility.
Several of the Company's foreign subsidiaries maintain bank lines-of-credit, denominated in local currencies, to meet short-term working capital requirements and for the issuance of letters-of-credit. As of June 30, 2011, $16.5 million was outstanding under these letter-of-credit facilities, while no debt was outstanding. As of June 30, 2011, the total amount available under these credit facilities was $21.6 million, with a total cash borrowing sub-limit of $4.2 million.
In fiscal 2005, the Company entered into a bank loan of $5.3 million to fund the acquisition of land and buildings in the United Kingdom. The loan is payable over a 20-year period. The loan bears interest at British pound-based LIBOR plus 1.2%, payable on a quarterly basis. As of June 30, 2011, $3.0 million remained outstanding under this loan at an interest rate of 2.0% per annum.
Long-term debt consisted of the following at June 30 (in thousands):
| |
2010 | 2011 | |||||||
|---|---|---|---|---|---|---|---|---|---|
Five-year term loan due in 2013 |
$ | 32,281 | $ | — | |||||
Twenty-year term loan due in 2024 |
3,015 | 2,977 | |||||||
Capital leases and other |
813 | — | |||||||
|
36,109 | 2,977 | |||||||
Less current portion of long-term debt |
12,743 | 221 | |||||||
Long-term portion of debt |
$ | 23,366 | $ | 2,756 | |||||
Fiscal year principal payments of long-term debt as of June 30, 2011 are as follows (in thousands):
2012 |
$ | 221 | ||
2013 |
221 | |||
2014 |
221 | |||
2015 |
221 | |||
2016 |
221 | |||
2017 and thereafter |
1,872 | |||
Total |
$ | 2,977 | ||
F-16
OSI SYSTEMS, INC. AND SUBSIDIARIES
NOTES TO CONSOLIDATED FINANCIAL STATEMENTS—(Continued)
FOR THE THREE YEARS ENDED JUNE 30, 2011
8. STOCK-BASED COMPENSATION
As of June 30, 2011, the Company maintained one significant stock-based compensation plan—the 2006 Equity Participation Plan of OSI Systems (OSI Plan). The OSI Plan allows for the issuance of restricted stock and the granting of stock options. The Company recorded stock-based-compensation expense in the consolidated statement of operations as follows (in thousands):
| |
2009 | 2010 | 2011 | |||||||
|---|---|---|---|---|---|---|---|---|---|---|
Cost of goods sold |
$ | 291 | $ | 287 | $ | 378 | ||||
Selling, general and administrative |
4,527 | 4,499 | 5,176 | |||||||
Research and development |
237 | 225 | 235 | |||||||
Stock based compensation expense before taxes |
5,055 | 5,011 | 5,789 | |||||||
Less: Related income tax benefit |
1,819 | 1,750 | 1,994 | |||||||
Stock based compensation expense, net of estimated taxes |
$ | 3,236 | $ | 3,261 | $ | 3,795 | ||||
As of June 30, 2011, total unrecognized compensation cost related to non-vested stock-based compensation grants amounted to $1.3 million for stock options and $8.2 million for restricted stock under the OSI Plan. The Company expects to recognize these costs over a weighted-average period of 1.7 years with respect to the options and 2.8 years for grants of restricted stock.
Employee Stock Purchase Plan—The Company has an employee stock purchase plan under which eligible employees may purchase a limited number of shares of Common Stock at a discount of up to 15% of the market value of such stock at pre-determined, plan-defined dates. During the three years ended June 30, 2009, 2010 and 2011, employees purchased 75,594, 141,136 and 142,671 shares, respectively. As of June 30, 2011, there were 1,178,550 shares of the Company's Common Stock available for issuance under the plan.
OSI Plan
Stock Options—Under the OSI Plan, the Company is authorized to grant up to 5,350,000 shares of Common Stock in the form of incentive options, nonqualified options or restricted stock. Under the plan, the exercise price of nonqualified options may not be less than 85% of the fair market value of the Company's Common Stock on the date of grant. The exercise price of incentive stock options may not be less than the fair market value of the Company's Common Stock at the date of grant. The exercise price of incentive stock options granted to individuals who own more than 10% of the Company's voting stock may not be less than 110% of the fair market value of the Company's Common Stock on the date of grant.
No single method of estimating volatility is proper under all circumstances and to the extent that a company can derive implied volatility based on the trading of its financial instruments on a public market, it may be appropriate to use both implied and historical volatility in its assumptions. The Company has certain financial instruments that are publicly traded from which the Company can derive the implied volatility. Therefore, the Company used implied and historical volatility for valuing its stock options. The Company believes that implied and historical volatility is a better indicator of expected volatility because it is generally reflective of both historical volatility and expectations of how future volatility will differ from historical volatility.
F-17
OSI SYSTEMS, INC. AND SUBSIDIARIES
NOTES TO CONSOLIDATED FINANCIAL STATEMENTS—(Continued)
FOR THE THREE YEARS ENDED JUNE 30, 2011
The Company determined the fair value of stock options issued during fiscal 2009, 2010 and 2011 as of the date of the grant, using the Black-Scholes option pricing model with the following weighted average assumptions:
| |
2009 | 2010 | 2011 | |||||||
|---|---|---|---|---|---|---|---|---|---|---|
Expected dividend |
0 | % | 0 | % | 0 | % | ||||
Risk-free interest rate |
1.8 | % | 2.0 | % | 1.4 | % | ||||
Expected volatility |
41.5 | % | 39.0 | % | 40.0 | % | ||||
Expected life (in years) |
4.3 | 4.3 | 4.3 | |||||||
The following summarizes stock option activity for fiscal years 2009, 2010 and 2011:
| |
Number of Options |
Weighted- Average Exercise Price |
Weighted-Average Remaining Contractual Term |
Aggregate Intrinsic Value ($000) |
|||||||||||
|---|---|---|---|---|---|---|---|---|---|---|---|---|---|---|---|
Outstanding at June 30, 2008 |
2,290,996 | 18.93 | |||||||||||||
Granted |
332,500 | 14.32 | |||||||||||||
Exercised |
(163,680 | ) | 15.21 | ||||||||||||
Expired or forfeited |
(283,953 | ) | 19.51 | ||||||||||||
Outstanding at June 30, 2009 |
2,175,863 | 17.69 | |||||||||||||
Granted |
257,500 | 16.41 | |||||||||||||
Exercised |
(660,764 | ) | 16.98 | ||||||||||||
Expired or forfeited |
(216,489 | ) | 20.01 | ||||||||||||
Outstanding at June 30, 2010 |
1,556,110 | 17.46 | |||||||||||||
Granted |
107,140 | 30.62 | |||||||||||||
Exercised |
(719,515 | ) | 18.05 | ||||||||||||
Expired or forfeited |
(12,823 | ) | 21.50 | ||||||||||||
Outstanding at June 30, 2011 |
930,912 | 18.45 | 6.9 years | $ | 22,850 | ||||||||||
Exercisable at June 30, 2011 |
559,102 | $ | 17.68 | 5.9 years | $ | 14,156 | |||||||||
The per-share weighted-average grant-date fair value of stock options granted under the OSI Plan was $5.16, $5.64 and $10.50 for fiscal 2009, 2010 and 2011, respectively. The total intrinsic value of options exercised during fiscal 2011 was $13.5 million.
F-18
OSI SYSTEMS, INC. AND SUBSIDIARIES
NOTES TO CONSOLIDATED FINANCIAL STATEMENTS—(Continued)
FOR THE THREE YEARS ENDED JUNE 30, 2011
Restricted Stock Awards—A summary of restricted stock award activity for the periods indicated was as follows:
| |
Shares | Weighted- Average Fair Value |
|||||||
|---|---|---|---|---|---|---|---|---|---|
Nonvested at June 30, 2008 |
187,468 | $ | 23.04 | ||||||
Granted |
227,626 | 13.56 | |||||||
Vested |
(43,695 | ) | 23.35 | ||||||
Forfeited |
(11,708 | ) | 20.97 | ||||||
Nonvested at June 30, 2009 |
359,691 | $ | 17.07 | ||||||
Granted |
247,800 | 18.20 | |||||||
Vested |
(112,665 | ) | 17.99 | ||||||
Forfeited |
(15,289 | ) | 17.18 | ||||||
Nonvested at June 30, 2010 |
479,537 | $ | 17.44 | ||||||
Granted |
268,406 | 29.48 | |||||||
Vested |
(161,124 | ) | 18.08 | ||||||
Forfeited |
(21,706 | ) | 19.55 | ||||||
Nonvested at June 30, 2011 |
565,113 | $ | 22.89 | ||||||
The per-share weighted average grant-date fair value of restricted stock granted under the OSI Plan was $13.56, $18.20 and $29.48 for fiscal 2009, 2010 and 2011, respectively. The total fair value of shares vested during fiscal 2009, 2010 and 2011 was $1.0 million, $2.0 million and $2.9 million, respectively.
As of June 30, 2011, there were 1,533,000 shares available for grant under the OSI Plan. Under the terms of the OSI Plan, no more than 777,421 of these shares may be granted in the form of restricted stock.
9. INCOME TAXES
The following is a geographical breakdown of income (loss) before the provision (benefit) for income taxes (in thousands):
| |
2009 | 2010 | 2011 | |||||||||
|---|---|---|---|---|---|---|---|---|---|---|---|---|
Pre-tax income (loss): |
||||||||||||
United States |
$ | (4,751 | ) | $ | 14,888 | $ | 26,855 | |||||
Foreign |
21,296 | 20,108 | 19,880 | |||||||||
Total pre-tax income |
$ | 16,545 | $ | 34,996 | $ | 46,735 | ||||||
The Company's provision for income taxes consists of the following (in thousands):
| |
2009 | 2010 | 2011 | |||||||||||
|---|---|---|---|---|---|---|---|---|---|---|---|---|---|---|
Current: |
||||||||||||||
Federal |
$ | 3,442 | $ | 2,809 | $ | 5,068 | ||||||||
State |
418 | 745 | 1,040 | |||||||||||
Foreign |
3,556 | 2,644 | 2,398 | |||||||||||
Total current provision |
7,416 | 6,198 | 8,506 | |||||||||||
Deferred: |
||||||||||||||
Federal |
$ | (2,384 | ) | $ | 2,640 | $ | 3,085 | |||||||
State |
(121 | ) | (374 | ) | 1,192 | |||||||||
Foreign |
482 | 2,975 | 530 | |||||||||||
Total deferred provision |
(2,023 | ) | 5,241 | 4,807 | ||||||||||
Total provision |
$ | 5,393 | $ | 11,439 | $ | 13,313 | ||||||||
F-19
OSI SYSTEMS, INC. AND SUBSIDIARIES
NOTES TO CONSOLIDATED FINANCIAL STATEMENTS—(Continued)
FOR THE THREE YEARS ENDED JUNE 30, 2011
The exercise of stock options during the fiscal year ended June 30, 2009, 2010 and 2011 resulted in additional tax benefit (provision) and has been reflected as an adjustment of income taxes payable and an adjustment of additional paid-in capital. The adjustments recorded were $(0.6) million, $0.7 million and $4.9 million for the years ended June 30, 2009, 2010 and 2011, respectively.
As of June 30, 2010 and 2011, the Company's liability for uncertain tax positions was $9.4 million and $9.8 million, respectively. Of the $9.8 million, $8.0 million represents the amount of unrecognized tax benefits that, if recognized, would affect the effective tax rate.
The Company recognizes potential interest and penalties related to income tax matters in income tax expense. As of June 30, 2011, the Company had accrued $2.4 million for the payment of interest and penalties. The Company's uncertain tax positions are related to tax years that remain subject to examination by the relevant tax authorities. These include fiscal years after 2008 for federal purposes, fiscal years after 2007 for state purposes and fiscal years after 2000 for various foreign jurisdictions. Facts and circumstances could arise in the twelve month period following June 30, 2011 that could cause the Company to reduce the liability for unrecognized tax benefits, including, but not limited to, settlement of income tax positions or expiration of statutes of limitation. Since the ultimate resolution of uncertain tax positions depends on many factors and assumptions, the Company is not able to estimate the range of potential changes in the liability for unrecognized tax benefits or the timing of such changes.
A summary of activity of unrecognized tax benefits for fiscal 2009, 2010 and 2011 was as follows (in thousands).
Balance as July 1, 2008 |
$ | 4,767 | ||||
Additions on tax positions for the current year |
148 | |||||
Additions on tax positions from prior years |
972 | |||||
Balance as June 30, 2009 |
$ | 5,887 | ||||
Additions on tax positions for the current year |
1,119 | |||||
Additions on tax positions from prior years |
780 | |||||
Reductions as a result of a lapse of statute of limitations |
(456 | ) | ||||
Reduction in tax position from prior year |
(453 | ) | ||||
Balance at June 30, 2010 |
$ | 6,877 | ||||
Additions on tax positions for the current year |
454 | |||||
Additions on tax positions from prior years |
365 | |||||
Reduction in tax position from prior year |
(327 | ) | ||||
Balance at June 30, 2011 |
$ | 7,369 | ||||
The Company does not provide for U.S. income taxes on the undistributed earnings of its foreign subsidiaries as it is the Company's intention to utilize those earnings in the foreign operations for an indefinite period of time. At June 30, 2011, undistributed earnings of the foreign subsidiaries amounted to approximately $108.9 million. It is not practical to determine the amount of income or withholding tax that would be payable upon the remittance of these earnings.
F-20
OSI SYSTEMS, INC. AND SUBSIDIARIES
NOTES TO CONSOLIDATED FINANCIAL STATEMENTS—(Continued)
FOR THE THREE YEARS ENDED JUNE 30, 2011
Deferred income tax assets (liabilities) consisted of the following (in thousands):
| |
June 30, | ||||||||
|---|---|---|---|---|---|---|---|---|---|
| |
2010 | 2011 | |||||||
Deferred income tax assets: |
|||||||||
R&D tax credit carryforwards |
$ | 3,830 | $ | 4,178 | |||||
Net operating loss carryforwards |
3,475 | 6,075 | |||||||
Revitalization zone deductions |
879 | 855 | |||||||
Allowance for doubtful accounts |
1,206 | 1,355 | |||||||
Inventory reserve |
8,014 | 6,539 | |||||||
Inventory capitalization |
3,615 | 2,219 | |||||||
Accrued liabilities |
4,772 | 5,422 | |||||||
Deferred compensation |
4,839 | 2,438 | |||||||
Unrecognized tax benefit |
2,435 | 1,475 | |||||||
Other assets |
6,336 | 6,478 | |||||||
Total deferred income tax assets |
39,401 | 37,034 | |||||||
Valuation allowance |
(6,352 | ) | (8,292 | ) | |||||
Net deferred income tax assets |
33,049 | 28,742 | |||||||
Deferred income tax liabilities: |
|||||||||
Depreciation |
(314 | ) | (2,109 | ) | |||||
State income taxes |
(1,305 | ) | (743 | ) | |||||
Amortization of intangible assets |
(10,554 | ) | (9,403 | ) | |||||
Other liabilities |
(30 | ) | — | ||||||
Total deferred income tax liabilities |
(12,203 | ) | (12,255 | ) | |||||
Net deferred tax asset |
$ | 20,846 | $ | 16,487 | |||||
As of June 30, 2011, the Company had federal net operating loss carry forwards of approximately $4.6 million and state net operating loss carry forwards of $0.6 million. The Company's federal net operating losses will begin to expire in the tax year ending June 30, 2018, and are subject to limitations on their utilization. In addition, the Company had state tax credit carry forwards, including research and development and revitalization zone credits, of approximately $2.6 million. The Company's state tax credit carry forwards will begin to expire in the tax year ending June 30, 2012. As of June 30, 2011, the Company has a federal research and development tax credit carry forward of approximately $2.4 million. The Company's federal credit carry forwards will begin to expire in the tax year ending June 30, 2019.
The Company has established a valuation allowances that relate to the net operating loss of certain foreign subsidiaries, net operating loss subject to separate return U.S. federal limitation year rules, an unrealized capital loss related to a write-down of an equity investment and U.S. federal revitalization zone credits. During the year ended June 30, 2011, the Company recorded a $1.9 million increase to its valuation allowance, which entirely related to foreign net operating losses. The Company reviews the adequacy of valuation allowances and releases the allowances when it is determined that it is more likely than not that the benefits will be realized.
F-21
OSI SYSTEMS, INC. AND SUBSIDIARIES
NOTES TO CONSOLIDATED FINANCIAL STATEMENTS—(Continued)
FOR THE THREE YEARS ENDED JUNE 30, 2011
The consolidated effective income tax rate differs from the federal statutory income tax rate due primarily to the following:
| |
June 30, | |||||||||||
|---|---|---|---|---|---|---|---|---|---|---|---|---|
| |
2009 | 2010 | 2011 | |||||||||
Provision for income taxes at federal statutory rate |
35.0 | % | 35.0 | % | 35.0 | % | ||||||
State income taxes and credits—net of federal benefit |
1.2 | 0.7 | 3.1 | |||||||||
Research and development tax credits |
(2.8 | ) | (3.2 | ) | (2.2 | ) | ||||||
Foreign tax credits |
(3.4 | ) | (0.6 | ) | (3.5 | ) | ||||||
Subpart F income |
4.1 | 0.6 | 2.8 | |||||||||
Foreign income subject to tax at other than federal statutory rate |
(18.2 | ) | (5.3 | ) | (9.0 | ) | ||||||
Nondeductible expenses |
1.1 | 0.1 | 0.4 | |||||||||
Change in valuation allowance |
2.6 | 1.0 | 1.1 | |||||||||
Unrecognized tax benefit |
12.2 | 1.8 | 0.2 | |||||||||
Other |
0.8 | 2.6 | 0.6 | |||||||||
Effective income tax rate |
32.6 | % | 32.7 | % | 28.5 | % | ||||||
|
|
||||||||||||
The provision for income taxes consists of provisions for federal, state, and foreign income taxes. The Company operates in an international environment with significant operations in various locations outside the U.S. Accordingly, the consolidated income tax rate is a composite rate reflecting the earnings in the various locations and the applicable rates.
10. COMMITMENTS AND CONTINGENCIES
The following is a summary of commitments as of June 30, 2011 (in thousands):
| |
Payments Due by Period | |||||||||||||||
|---|---|---|---|---|---|---|---|---|---|---|---|---|---|---|---|---|
| |
Total | Less than 1 year |
2-3 years | 4-5 years | After 5 years |
|||||||||||
Total debt |
$ | 2,977 | $ | 221 | $ | 442 | $ | 442 | $ | 1,872 | ||||||
Operating leases |
$ | 36,576 | $ | 11,756 | $ | 18,988 | $ | 5,185 | $ | 647 | ||||||
Defined benefit plan obligation |
$ | 8,715 | $ | 481 | $ | 590 | $ | 968 | $ | 6,676 | ||||||
|
|
||||||||||||||||
Operating Leases—The Company leases facilities and certain equipment under various operating lease agreements. Certain leases provide for periodic rent increases and may contain escalation clauses and renewal options. Rent expense totaled $9.6 million, $10.4 million and $11.3 million for fiscal years 2009, 2010 and 2011, respectively.
Commitments—Under the terms and conditions of the purchase agreements associated with certain acquisitions, the Company may be obligated to make additional payments based on the achievement by the acquired operations of certain sales or profitability milestones. The maximum amount of such payments under arrangements with contingent consideration caps is $31 million. In addition, one of the purchase agreements the Company entered into requires royalty payments through 2022 based on the license of, or sales of products containing the technology of CXR Limited, a company acquired in 2004. For acquisitions that occurred prior to fiscal year 2010, which were accounted for under Statement of Financial Accounting Standards 141, "Business Combinations," the Company accounts for such contingent payments as an addition to the purchase price of the acquired business. For
F-22
OSI SYSTEMS, INC. AND SUBSIDIARIES
NOTES TO CONSOLIDATED FINANCIAL STATEMENTS—(Continued)
FOR THE THREE YEARS ENDED JUNE 30, 2011
acquisitions accounted for under Accounting Standards Codification 805, "Business Combinations," ("ASC 805"), the estimated fair value of these obligations is recorded as a liability in the Consolidated Balance Sheets with subsequent revisions reflected in the Consolidated Statements of Operations. As of June 30, 2010 and June 30, 2011, pursuant to ASC 805, $5.1 million and $9.2 million of contingent payment obligations, respectively, are included in other long-term liabilities in the accompanying Consolidated Balance Sheets. During fiscal 2010 and 2011, the fair values of these contingent obligations were revised and resulted in reductions of $0.7 million and $1.2 million, respectively. Such reductions were recorded as other income in the Consolidated Statements of Operations.
Environmental Contingencies—The Company is subject to various environmental laws. The Company's practice is to ensure that Phase I environmental site assessments are conducted for each of its properties in the United States at which the Company manufactures products in order to identify, as of the date of such report, potential areas of environmental concern related to past and present activities or from nearby operations. In certain cases, the Company has conducted further environmental assessments consisting of soil and groundwater testing and other investigations deemed appropriate by independent environmental consultants.
During one investigation, the Company discovered soil and groundwater contamination at its Hawthorne, California facility. The Company filed the requisite reports concerning this problem with the appropriate environmental authorities in fiscal 2001. The Company has not yet received any response to such reports, and no agency action or litigation is presently pending or threatened. The Company's site was previously used by other companies for semiconductor manufacturing similar to that presently conducted on the site by us, and it is not presently known who is responsible for the contamination or, if required, the remediation. The groundwater contamination is a known regional problem, not limited to the Company's premises or its immediate surroundings.
The Company has not accrued for loss contingencies relating to environmental matters because it believes that, although unfavorable outcomes may be possible, they are not considered by the Company's management to be probable and reasonably estimable. If one or more of environmental matters are resolved in a manner adverse to the Company, the impact on the Company's results of operations, financial position and/or liquidity could be material.
Legal Proceedings—The Company is involved in various claims and legal proceedings arising out of the ordinary course of business. In the Company's opinion after consultation with legal counsel, the ultimate disposition of such proceedings is not likely to have a material adverse effect on its financial position, future results of operations or cash flows. The Company has not accrued for loss contingencies relating to such matters because the Company believes that, although unfavorable outcomes in the proceedings may be possible, they are not considered by management to be probable or reasonably estimable. If one or more of these matters are resolved in a manner adverse to the Company, the impact on the Company's results of operations, financial position and/or liquidity could be material.
F-23
OSI SYSTEMS, INC. AND SUBSIDIARIES
NOTES TO CONSOLIDATED FINANCIAL STATEMENTS—(Continued)
FOR THE THREE YEARS ENDED JUNE 30, 2011
11. STOCKHOLDERS' EQUITY
Stock Repurchase Program
The Company's Board of Directors has authorized a Common Stock repurchase program. During fiscal 2009 and 2011, the Company repurchased 619,768 shares and 58,396 shares, respectively, under this program. During fiscal 2010, the Company did not repurchase any shares under this program. As of June 30, 2011, 652,809 shares were available for additional repurchase under the program. Upon repurchase, the shares were restored to the status of authorized but unissued shares in the accompanying Consolidated Financial Statements.
Warrants
In June 2004, the Company issued and sold an aggregate of 1,500,000 shares of Common Stock in a private placement to institutional investors and received net proceeds of $31 million. As part of the transaction, the Company issued warrants to purchase 337,500 additional shares of the Company's Common Stock at an exercise price of $27.73 per share exercisable at any time, in full or part, expiring on June 1, 2011. These warrants were exercised in fiscal 2011 and the Company received $4.7 million in proceeds from warrant holders that paid cash. As permitted under the terms of the agreement, certain warrants were tendered for cashless exercise.
12. RELATED-PARTY TRANSACTIONS
In 1994, the Company, together with an unrelated company, formed ECIL-Rapiscan Security Products Limited, a joint venture organized under the laws of India. The Company owns a 36% interest in the joint venture, the Company's Chairman and Chief Executive Officer owns a 10.5% interest, and the Company's Executive Vice President and President of the Company's Security division owns a 4.5% ownership interest. The Company's initial investment was approximately $0.1 million. For the years ended June 30, 2009, 2010 and 2011, the Company's equity earnings in the joint venture were approximately to $0.7 million, $0.4 million and $0.6 million, respectively. The Company, its Chairman and Chief Executive Officer and the Company's Executive Vice President and President of the Company's Security division collectively control less than 50% of the board of directors voting power in the joint venture. As a result, the Company accounts for the investment under the equity method of accounting. The joint venture was formed for the purpose of the manufacture, assembly, service and testing of security and inspection systems and other products. Some of the Company's subsidiaries are suppliers to the joint venture partner, which in turn manufactures and sells the resulting products. Sales to the joint venture partner for fiscal 2009, 2010 and 2011 were approximately $4.4 million, $4.4 million and $7.1 million, respectively. Receivables from the joint venture were $0.9 million and $2.2 million as of June 30, 2010 and 2011, respectively.
The Company has contracted with entities owned by members of its Board of Directors and/or their families to provide messenger service, auto rental and printing services. Such expenses for 2009, 2010 and 2011 were approximately $54,000, $64,000 and $60,000 for messenger services and auto rental and $45,000, $60,000 and $31,000 for printing services, respectively.
F-24
OSI SYSTEMS, INC. AND SUBSIDIARIES
NOTES TO CONSOLIDATED FINANCIAL STATEMENTS—(Continued)
FOR THE THREE YEARS ENDED JUNE 30, 2011
13. EMPLOYEE BENEFIT PLANS
Employee Retirement Savings Plans
The Company has various qualified employee retirement savings plans. Participants can contribute certain amounts to the plans and the Company matches a certain portion of employee contributions. The Company contributed approximately $2.8 million, $3.4 million and $3.6 million to the plans for the fiscal years ended June 30, 2009, 2010 and 2011, respectively.
Deferred Compensation Plan
The Company has a deferred compensation plan, which met the requirements for deferred compensation under Section 409A of the Internal Revenue Code. The plan provides that selected employees are eligible to defer up to 80% of their salaries and up to 100% of their bonuses. The Company may also make employer contributions to participant accounts in certain circumstances. The benefits under this plan are unsecured. Participants are generally eligible to receive payment of their vested benefit at the end of their elected deferral period or after termination of their employment for any reason or at a later date to comply with the restrictions of Section 409A. Discretionary company contributions and the related earnings are subject to a vesting schedule dependent upon years of service to the Company and, also, vest completely upon the participant's disability, death or a change of control. The Company made contributions of $0.6 million, $0.5 million and $0.9 million during fiscal year 2009, 2010 and 2011, respectively. As of June 30, 2011, the Company held assets of $6.5 million and liabilities of $6.0 million. Assets related to this plan are included in other assets and liabilities related to this plan are included in other long-term liabilities in the Consolidated Balance Sheets. The plan liabilities include accrued employer contributions not yet funded to the plan.
Employee Pension Plans
The Company sponsors a number of qualified and nonqualified pension plans for its employees at certain locations. In accordance with accounting standards for employee pension and postretirement benefits, the Company fully recognizes the overfunded or underfunded status of each of its defined benefit plans as an asset or liability in the Consolidated Balance Sheets. The asset or liability equals the difference between the fair value of the plans' assets and its benefit obligations. The liabilities associated with underfunded plans are classified as noncurrent, except to the extent the fair value of the plan's assets is less than the plan's estimated benefit payments over the next 12 months. The Company measures its pension and postretirement benefit plans' assets and benefit obligations as of June 30.
F-25
OSI SYSTEMS, INC. AND SUBSIDIARIES
NOTES TO CONSOLIDATED FINANCIAL STATEMENTS—(Continued)
FOR THE THREE YEARS ENDED JUNE 30, 2011
The following provides a reconciliation of the changes in the plans' benefit obligations and fair value of assets for fiscal years 2010 and 2011, and a statement of the funded status as of June 30, 2010 and 2011 (in thousands):
| |
2010 | 2011 | |||||||
|---|---|---|---|---|---|---|---|---|---|
Change in Benefit Obligation |
|||||||||
Benefit obligation at beginning of year |
$ | 7,997 | $ | 9,365 | |||||
Translation adjustment |
(459 | ) | 659 | ||||||
Service costs |
68 | 41 | |||||||
Interest costs |
502 | 497 | |||||||
Curtailment / plan amendment |
460 | — | |||||||
Plan participants' contributions |
(51 | ) | (131 | ) | |||||
Actuarial loss |
901 | 184 | |||||||
Benefits paid |
(53 | ) | (289 | ) | |||||
Benefit obligation at end of year |
9,365 | 10,326 | |||||||
Change in Plan Assets |
|||||||||
Fair value of plan assets at beginning of year |
4,316 | 5,254 | |||||||
Translation adjustment |
47 | 554 | |||||||
Actual return on plan assets |
651 | 543 | |||||||
Company contributions |
299 | 275 | |||||||
Plan participants' contributions |
65 | (195 | ) | ||||||
Benefits paid |
(124 | ) | (365 | ) | |||||
Fair value of plan assets at end of year |
5,254 | 6,066 | |||||||
Funded status |
(4,111 | ) | (4,260 | ) | |||||
Unrecognized net actuarial loss |
— | — | |||||||
Net amount recognized |
$ | (4,111 | ) | $ | (4,260 | ) | |||
Amount recognized in Consolidated Balance Sheets consist of: |
|||||||||
Investments |
$ | 552 | $ | 250 | |||||
Accrued pension liability |
(4,883 | ) | (4,510 | ) | |||||
Accumulated other comprehensive income |
3,072 | 2,770 | |||||||
The following table provides the net periodic benefit costs for each of the fiscal years ended June 30, (in thousands):
| |
2009 | 2010 | 2011 | |||||||
|---|---|---|---|---|---|---|---|---|---|---|
Net Periodic Benefit Costs |
||||||||||
Service costs |
$ | 297 | $ | 49 | $ | 41 | ||||
Interest costs |
537 | 464 | 458 | |||||||
Expected return on plan assets |
(300 | ) | (306 | ) | (352 | ) | ||||
Amortization of prior service costs |
148 | 258 | 335 | |||||||
Recognized actuarial loss/(gain) |
(135 | ) | 284 | 310 | ||||||
Curtailment |
(333 | ) | (14 | ) | — | |||||
Net periodic benefit cost |
$ | 214 | $ | 735 | $ | 792 | ||||
F-26
OSI SYSTEMS, INC. AND SUBSIDIARIES
NOTES TO CONSOLIDATED FINANCIAL STATEMENTS—(Continued)
FOR THE THREE YEARS ENDED JUNE 30, 2011
Plan Assumptions
| |
2010 | 2011 | |||||||
|---|---|---|---|---|---|---|---|---|---|
Weighted average assumptions at year-end: |
|||||||||
Discount rate |
5.1 | % | 5.2 | % | |||||
Expected return on plan assets |
6.2 | % | 6.0 | % | |||||
Rate of compensation increase |
0.2 | % | 2.5 | % | |||||
The long term return on assets has been derived from the weighted average of assumed returns on each of the major asset categories. The weighted average is based on the actual proportion of each major asset class held, rather than a benchmark portfolio of assets. The expected returns for each major asset class have been derived from a combination of both historical market returns and current market data as well as the views of a range of investment managers.
Plan Assets and Investment Policy
| |
Fiscal year ended June 30, 2010 |
Fiscal year ended June 30, 2011 |
|||||||||||
|---|---|---|---|---|---|---|---|---|---|---|---|---|---|
| |
Proportion of Fair Value |
Expected Rate of Return |
Proportion of Fair Value |
Expected Rate of Return |
|||||||||
Equity securities |
83 | % | 7 | % | 75 | % | 7 | % | |||||
Debt securities |
16 | % | 3 | % | 20 | % | 4 | % | |||||
Other |
1 | % | 5 | % | 5 | % | 1 | % | |||||
Combined |
100 | % | 6.2 | % | 100 | % | 6.0 | % | |||||
The defined benefit plans' assets are invested in a range of pooled investment funds that provide access to a diverse range of asset classes. The investment objective is to maximize the investment return over the long term without exposing the fund to an unnecessary level of risk. Within this objective, it is recognized that benefits will be secured by the purchase of annuities at the time of employee retirement.
The benchmark is to hold assets in both equity and debt securities. The proportion in each investment class is not mandated and is allowed to fluctuate with market movements. The equity holdings are maintained in balanced funds under the control of investment managers.
Day-to-day equities selection decisions are delegated to investment managers, although these are monitored against performance and risk targets. Due to the nature of the pooled funds, there are no significant holdings in any single company (greater than 5% of the total assets). The investment strategy is reviewed on a regular basis, based on the results of the liability studies.
F-27
OSI SYSTEMS, INC. AND SUBSIDIARIES
NOTES TO CONSOLIDATED FINANCIAL STATEMENTS—(Continued)
FOR THE THREE YEARS ENDED JUNE 30, 2011
Projected Benefit Payments
The following table reflects estimated benefits payments, based upon the same assumptions used to measure the benefit obligation and net pension cost, as of June 30, 2011 (in thousands):
| |
Pension Benefits | |||
|---|---|---|---|---|
July 1, 2011 to June 30, 2012 |
481 | |||
July 1, 2012 to June 30, 2013 |
211 | |||
July 1, 2013 to June 30, 2014 |
379 | |||
July 1, 2014 to June 30, 2015 |
228 | |||
July 1, 2015 to June 30, 2016 |
740 | |||
July 1, 2016 to June 30, 2021 |
6,676 | |||
Company Contribution
Currently, the Company's weighted average contribution rate is 3% of pensionable salaries. If Company contributions continue at the current rate, the estimated total Company contributions for fiscal 2012 will be approximately $0.7 million.
14. SEGMENT INFORMATION
The Company has determined that it operates in three identifiable industry segments, (a) security and inspection systems (Security division), (b) medical monitoring and anesthesia systems (Healthcare division) and (c) optoelectronic devices and manufacturing (Optoelectronics and Manufacturing division). The Company also has a corporate segment (Corporate) that includes executive compensation and certain other general and administrative expenses; expenses related to stock issuances; and legal and audit and other professional service fees not allocated to product segments. Both the Security and Healthcare divisions comprise primarily end-product businesses whereas the businesses of the Optoelectronics and Manufacturing division primarily supplies components and subsystems to original equipment manufacturers, including to the Security and Healthcare divisions. Sales between divisions are at transfer prices that approximate market values. All other accounting policies of the segments are the same as described in Note 1, Summary of Significant Accounting Policies.
F-28
OSI SYSTEMS, INC. AND SUBSIDIARIES
NOTES TO CONSOLIDATED FINANCIAL STATEMENTS—(Continued)
FOR THE THREE YEARS ENDED JUNE 30, 2011
The following tables present the operations and identifiable assets by industry segment (in thousands):
| |
2009 | ||||||||||||||||||||||
|---|---|---|---|---|---|---|---|---|---|---|---|---|---|---|---|---|---|---|---|---|---|---|---|
| |
Security Division |
Healthcare Division |
Optoelectronics and Manufacturing Division |
Corporate | Eliminations | Consolidated | |||||||||||||||||
Revenues: |
|||||||||||||||||||||||
External customer revenue |
$ | 240,919 | $ | 214,260 | $ | 135,182 | $ | — | $ | — | $ | 590,361 | |||||||||||
Revenue between product segments |
45,941 | — | (45,941 | ) | — | ||||||||||||||||||
Total revenues |
$ | 240,919 | $ | 214,260 | $ | 181,123 | $ | — | (45,941 | ) | $ | 590,361 | |||||||||||
Income (loss) from operations |
$ | 14,324 | $ | 5,106 | $ | 14,501 | $ | (13,890 | ) | $ | (560 | ) | $ | 19,481 | |||||||||
Segments assets |
$ | 191,164 | $ | 155,366 | $ | 84,434 | $ | 47,633 | $ | (3,769 | ) | $ | 474,828 | ||||||||||
Capital expenditures |
$ | 2,322 | $ | 2,890 | $ | 4,293 | $ | 1,347 | $ | — | $ | 10,852 | |||||||||||
Depreciation and amortization |
$ | 5,774 | $ | 8,389 | $ | 3,126 | $ | 516 | $ | — | $ | 17,805 | |||||||||||
| |
2010 | ||||||||||||||||||||||
|---|---|---|---|---|---|---|---|---|---|---|---|---|---|---|---|---|---|---|---|---|---|---|---|
| |
Security Division |
Healthcare Division |
Optoelectronics and Manufacturing Division |
Corporate | Eliminations | Consolidated | |||||||||||||||||
Revenues: |
|||||||||||||||||||||||
External customer revenue |
$ | 251,479 | $ | 206,557 | $ | 137,075 | $ | — | $ | — | $ | 595,111 | |||||||||||
Revenue between product segments |
— | 34,162 | — | (34,162 | ) | — | |||||||||||||||||
Total revenues |
$ | 251,479 | $ | 206,557 | $ | 171,237 | $ | — | (34,162 | ) | $ | 595,111 | |||||||||||
Income (loss) from operations |
$ | 23,351 | $ | 13,113 | $ | 11,958 | $ | (10,878 | ) | $ | (776 | ) | $ | 36,768 | |||||||||
Segments assets |
$ | 221,019 | $ | 138,739 | $ | 85,170 | $ | 72,731 | $ | (4,545 | ) | $ | 513,114 | ||||||||||
Capital expenditures |
$ | 12,362 | $ | 2,290 | $ | 2,414 | $ | 1,021 | $ | — | $ | 18,087 | |||||||||||
Depreciation and amortization |
$ | 6,210 | $ | 8,365 | $ | 3,449 | $ | 537 | $ | — | $ | 18,561 | |||||||||||
| |
2011 | ||||||||||||||||||||||
|---|---|---|---|---|---|---|---|---|---|---|---|---|---|---|---|---|---|---|---|---|---|---|---|
| |
Security Division |
Healthcare Division |
Optoelectronics and Manufacturing Division |
Corporate | Eliminations | Consolidated | |||||||||||||||||
Revenues: |
|||||||||||||||||||||||
External customer revenue |
$ | 294,686 | $ | 215,050 | $ | 146,364 | $ | — | $ | — | $ | 656,100 | |||||||||||
Revenue between product segments |
— | 46,509 | — | (46,509 | ) | — | |||||||||||||||||
Total revenues |
$ | 294,686 | $ | 215,050 | $ | 192,873 | $ | — | (46,509 | ) | $ | 656,100 | |||||||||||
Income (loss) from operations |
$ | 25,352 | $ | 17,857 | $ | 17,211 | $ | (11,322 | ) | $ | (1,337 | ) | $ | 47,761 | |||||||||
Segments assets |
$ | 245,068 | $ | 152,048 | $ | 109,961 | $ | 84,082 | $ | (6,243 | ) | $ | 584,916 | ||||||||||
Capital expenditures |
$ | 7,038 | $ | 2,986 | $ | 2,267 | $ | 1,104 | $ | — | $ | 13,395 | |||||||||||
Depreciation and amortization |
$ | 6,462 | $ | 7,675 | $ | 3,720 | $ | 672 | $ | — | $ | 18,529 | |||||||||||
F-29
OSI SYSTEMS, INC. AND SUBSIDIARIES
NOTES TO CONSOLIDATED FINANCIAL STATEMENTS—(Continued)
FOR THE THREE YEARS ENDED JUNE 30, 2011
The following tables present the revenues and identifiable assets by geographical area (in thousands):
| |
2009 | |||||||||||||||||||
|---|---|---|---|---|---|---|---|---|---|---|---|---|---|---|---|---|---|---|---|---|
| |
North America |
Europe | Asia | Eliminations | Total Consolidated |
|||||||||||||||
Revenues: |
||||||||||||||||||||
External customer revenue |
$ | 397,371 | $ | 135,173 | $ | 57,817 | $ | — | $ | 590,361 | ||||||||||
Revenue between product segments |
27,530 | — | 18,411 | (45,941 | ) | — | ||||||||||||||
Total revenue |
$ | 424,901 | $ | 135,173 | $ | 76,228 | $ | (45,941 | ) | $ | 590,361 | |||||||||
Long-lived assets |
$ | 108,801 | $ | 27,520 | $ | 11,442 | $ | 147,763 | ||||||||||||
| |
2010 | |||||||||||||||||||
|---|---|---|---|---|---|---|---|---|---|---|---|---|---|---|---|---|---|---|---|---|
| |
North America |
Europe | Asia | Eliminations | Total Consolidated |
|||||||||||||||
Revenues: |
||||||||||||||||||||
External customer revenue |
$ | 418,808 | $ | 126,450 | $ | 49,853 | $ | — | $ | 595,111 | ||||||||||
Revenue between product segments |
23,204 | — | 10,958 | (34,162 | ) | — | ||||||||||||||
Total revenue |
$ | 442,012 | $ | 126,450 | $ | 60,811 | $ | (34,162 | ) | $ | 595,111 | |||||||||
Long-lived assets |
$ | 125,485 | $ | 23,555 | $ | 11,289 | $ | 160,329 | ||||||||||||
| |
2011 | |||||||||||||||||||
|---|---|---|---|---|---|---|---|---|---|---|---|---|---|---|---|---|---|---|---|---|
| |
North America |
Europe | Asia | Eliminations | Total Consolidated |
|||||||||||||||
Revenues: |
||||||||||||||||||||
External customer revenue |
$ | 457,692 | $ | 124,196 | $ | 74,212 | $ | — | $ | 656,100 | ||||||||||
Revenue between product segments |
26,376 | — | 20,133 | (46,509 | ) | — | ||||||||||||||
Total revenue |
$ | 484,068 | $ | 124,196 | $ | 94,345 | $ | (46,509 | ) | $ | 656,100 | |||||||||
Long-lived assets |
$ | 132,110 | $ | 34,351 | $ | 13,838 | $ | 180,299 | ||||||||||||
* * * * * *
F-30
SCHEDULE II—VALUATION AND QUALIFYING ACCOUNTS
(In thousands)
| |
|
Additions | |
|
||||||||||||||
|---|---|---|---|---|---|---|---|---|---|---|---|---|---|---|---|---|---|---|
Description
|
Balance at Beginning of period |
Charged to costs and expenses |
Charged in other accounts |
Deductions- Write-offs |
Balance at end of period |
|||||||||||||
Balance for doubtful accounts: |
||||||||||||||||||
Year ended June 30, 2009 |
$ | 2,303 | $ | 5,740 | $ | — | $ | 1,147 | $ | 6,896 | ||||||||
Year ended June 30, 2010 |
$ | 6,896 | $ | 522 | $ | — | $ | 1,412 | $ | 6,006 | ||||||||
Year ended June 30, 2011 |
$ | 6,006 | $ | 1,844 | $ | — | $ | 2,057 | $ | 5,793 | ||||||||
Balance for warranty reserve: |
||||||||||||||||||
Year ended June 30, 2009 |
$ | 11,597 | $ | 4,472 | $ | — | $ | 5,963 | $ | 10,106 | ||||||||
Year ended June 30, 2010 |
$ | 10,106 | $ | 6,653 | $ | — | $ | 5,829 | $ | 10,930 | ||||||||
Year ended June 30, 2011 |
$ | 10,930 | $ | 7,581 | $ | — | $ | 3,981 | $ | 14,530 | ||||||||
F-31
Pursuant to the requirements of Section 13 or 15(d) of the Securities Exchange Act of 1934, the registrant has caused this report to be signed on its behalf by the undersigned, thereunto duly authorized.
| OSI SYSTEMS, INC. (Registrant) |
||||
Date: August 25, 2011 |
By: |
/s/ ALAN EDRICK Alan Edrick, Executive Vice President & Chief Financial Officer |
||
Pursuant to the requirements of the Securities Exchange Act of 1934, this report has been signed below by the following persons, on behalf of the registrant, and in the capacities and on the dates indicated.
Name
|
Title
|
Date
|
||
|---|---|---|---|---|
/s/ DEEPAK CHOPRA |
Chairman of the Board, |
August 25, 2011 | ||
/s/ ALAN EDRICK |
Executive Vice President & Chief |
August 25, 2011 |
||
/s/ AJAY MEHRA |
Executive Vice President, President of |
August 25, 2011 |
||
/s/ WILLIAM F. BALLHAUS, JR. |
Director |
August 25, 2011 |
||
/s/ DAVID T. FEINBERG |
Director |
August 25, 2011 |
||
/s/ STEVEN C. GOOD |
Director |
August 25, 2011 |
||
/s/ MEYER LUSKIN |
Director |
August 25, 2011 |
II-1
| No. | EXHIBIT DESCRIPTION
|
|
|---|---|---|
| 3.1 | Certificate of Incorporation of OSI Systems, Inc. (1) | |
3.2 |
Bylaws of OSI Systems, Inc. (1) |
|
4.1 |
Form of Common Stock Certificate (1) |
|
10.1 |
Lease (A) dated June 24, 2002, between S/I Sammamish I, LLC and Spacelabs Medical, Inc. (2) |
|
10.2 |
Lease (B) dated June 24, 2002, between S/I Sammamish I, LLC and Spacelabs Medical, Inc. (2) |
|
10.3 |
First Amendment to Lease (A) dated October 12, 2004, between S/I Sammamish I, LLC and OSI Systems, Inc. (3) |
|
10.4 |
First Amendment to Lease (B) dated October 12, 2004, between S/I Sammamish I, LLC and OSI Systems, Inc. (3) |
|
10.5 |
Deferred Compensation Plan of OSI Systems, Inc. (4) |
|
10.6 |
Employment Agreement dated September 22, 2008 between Alan Edrick and OSI Systems, Inc. (5) |
|
10.7 |
Employment Agreement dated September 22, 2008 between Victor Sze and OSI Systems, Inc. (5) |
|
10.8 |
OSI Systems, Inc. Nonqualified Defined Benefit Plan (6) |
|
10.9 |
OSI Systems, Inc. 2008 Employee Stock Purchase Plan (7) |
|
10.10 |
Employment Agreement dated September 14, 2009 between Ajay Mehra and OSI Systems, Inc. (8) |
|
10.11 |
Employment Agreement dated January 6, 2010 between Deepak Chopra and OSI Systems, Inc. (9) |
|
10.12 |
Form of Indemnification Agreement for Directors and Executive Officers of OSI Systems, Inc. (10) |
|
10.13 |
Credit Agreement dated October 15, 2010, between Wells Fargo Bank, N.A. and OSI Systems, Inc. (11) |
|
10.14 |
Amended and Restated 2006 Equity Participation Plan of OSI Systems, Inc. (12) |
|
14.1 |
Code of Ethics and Conduct (3) |
|
21.1* |
Subsidiaries of the Company |
|
23.1* |
Consent of Independent Registered Public Accounting Firm |
|
31.1* |
Certification Pursuant to Section 302 |
|
31.2* |
Certification Pursuant to Section 302 |
|
32.1* |
Certification Pursuant to Section 906 |
|
32.2* |
Certification Pursuant to Section 906 |
- *
- Filed herewith
- (1)
- Previously filed with our Current Report on Form 8-K filed March 8, 2010.
- (2)
- Previously filed with our Annual Report on Form 10-K filed September 13, 2004.
- (3)
- Previously filed with our Annual Report on Form 10-K filed September 29, 2005.
- (4)
- Previously filed with our Current Report on Form 8-K filed June 16, 2008.
- (5)
- Previously filed with our Current Report on Form 8-K filed September 23, 2008.
- (6)
- Previously filed with our Current Report on Form 8-K filed October 10, 2008.
- (7)
- Previously filed with our Proxy Statement on Schedule 14A filed October 14, 2008.
- (8)
- Previously filed with our Current Report on Form 8-K filed September 16, 2009.
- (9)
- Previously filed with our Current Report on Form 8-K filed January 8, 2010.
- (10)
- Previously filed with our Annual Report on Form 10-K filed August 27, 2010.
- (11)
- Previously filed with our Current Report on Form 8-K filed on October 19, 2010.
- (12)
- Previously filed with our Current Report on Form 8-K filed December 1, 2010.