Attached files
| file | filename |
|---|---|
| 8-K - FORM 8-K - Axos Financial, Inc. | d8k.htm |
| EX-99.1 - PRESS RELEASE REGARDING ELECTION OF DIRECTOR, DATED AUGUST 25, 2011 - Axos Financial, Inc. | dex991.htm |
 2011
Southern California Investor Conference
August 29, 2011
Greg Garrabrants
President &
Chief Executive Officer
Exhibit 99.2 |
 1
Safe Harbor
This presentation contains forward-looking
statements within the meaning of the Private
Securities Litigation Reform Act of 1995 (the
“Reform
Act”).
The
words
“believe,”
“expect,”
“anticipate,”
“estimate,”
“project,”
or the
negation thereof or similar expressions
constitute forward-looking statements within
the meaning of the Reform Act. These
statements
may
include,
but
are
not
limited
to,
projections of revenues, income or loss,
estimates of capital expenditures, plans for
future operations, products or services, and
financing needs or plans, as well as
assumptions relating to these matters. Such
statements involve risks, uncertainties and
other factors that may cause actual results, performance or achievements of the
Company and its subsidiaries
to
be
materially
different
from
any
future
results,
performance
or
achievements
expressed
or
implied
by
such
forward-looking
statements.
For
a
discussion
of
these
factors,
we
refer
you
to
the
Company's reports filed with the Securities and Exchange Commission, including its
Annual Report on Form 10-K for the year ended June 30, 2010 and its
Earnings Report on Form 10-Q for the quarter ended
March
31,
2011.
In
light
of
the
significant
uncertainties
inherent
in
the
forward-looking
statements
included
herein,
the
inclusion
of
such
information
should
not
be
regarded
as
a
representation
by
the
Company
or
by
any
other
person
or
entity
that
the
objectives
and
plans
of
the
Company
will
be
achieved. For all forward-looking statements, the Company claims the
protection of the safe-harbor for forward-looking statements
contained in the Reform Act. |
 Key
Accomplishments Return
on
equity
of
15.2%
for
Fiscal
2011,
15.6%
for
Q4
'11
1
Efficiency
ratio
of
39.9%
for
Fiscal
2011,
41.6%
for
Q4
'11
1
Common
stock
currently
trading
at:
105.5%
2
of
book;
7.71x
TTM
P/E
1
5-year
asset
growth
of
21.3%
(CAGR);
2011
Fiscal
year
asset
growth of
36.5%
1
5-year
deposit
growth
of
25.9%
(CAGR)
6/30/2011
1
Second highest ranking on SNL list of top performing thrifts (March 2011)
Top 30 community bank-based upon 3-year ROE
BofI joins the Russell 3000 index on June 25, 2010
Top
4
community
bank-based
upon
2-year
ROE
1
1.
Based on preliminary results for 6/30/11.
2.
As of 8/15/11 closing price of $14.42 per share.
1
2
3
4
5
6
8
9
7
2
Non-performing
assets
to
total
assets
of
0.99%
at
June
30,
2011
1
down
from 1.01% at
June 30, 2010 |
 Corporate Profile
$2.0 billion asset savings and loan
holding
company
1
11 years operating history, publicly
traded on NASDAQ(BOFI) since
2005
Headquartered in single branch
location in San Diego, CA
36,000
deposit
and
loan
customers
1
190 employees ($10 million in assets
per employee)
1
Market
Capitalization
of
$150
million
2
Price/Tangible
Book
Value
=
105.5%
2
1.
As of 6/30/11 (Unaudited).
2.
As of 8/15/11 closing price of $14.42 per share.
3 |
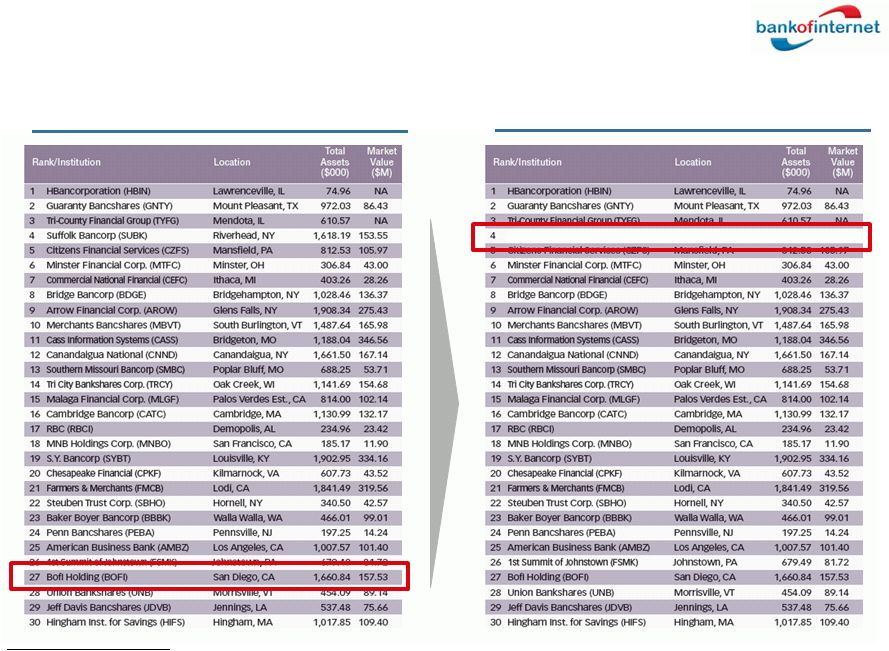
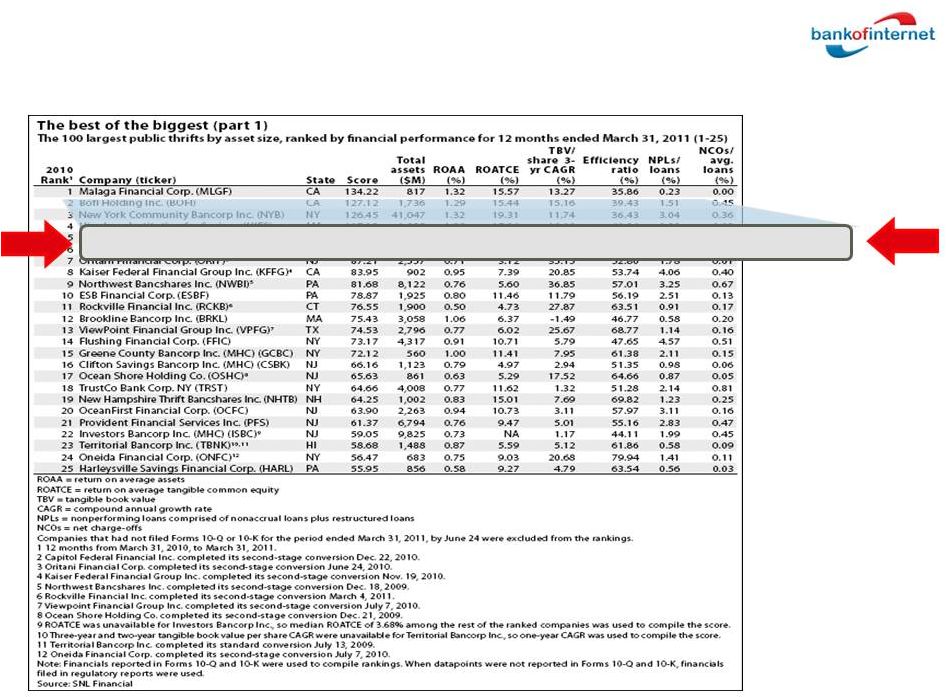 The
Best of the Biggest – The 100 Largest
Public Thrifts by Asset Size
BofI Holding, Inc. (BOFI)
2
CA
127.12
1,736
1.29
15.44
15.16
39.43
1.51
0.45
4 |
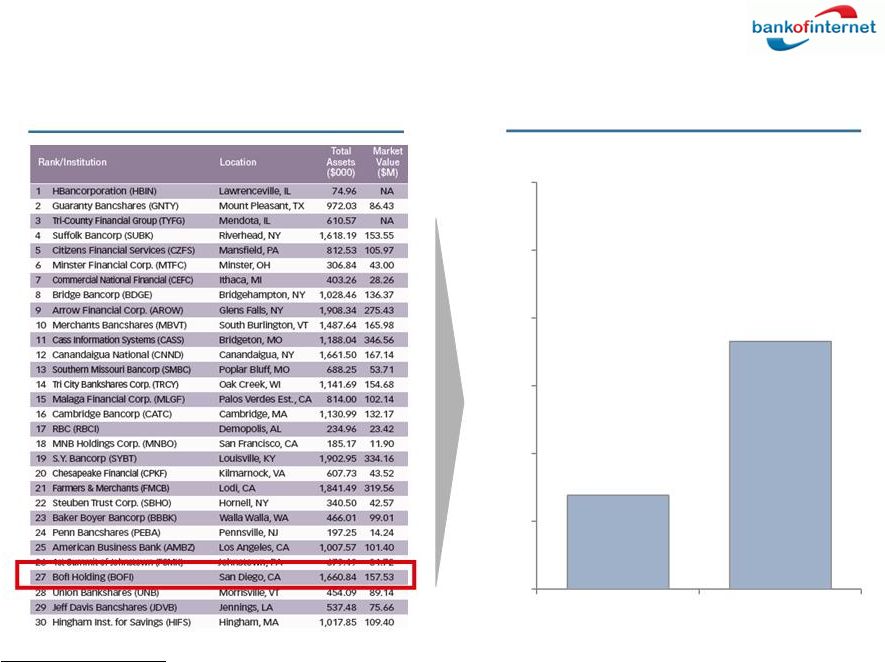 5
Asset growth (%)
BofI is Number 27th on the 3-Year
Average
ROE
Listing
...
... But BofI has Achieved Higher Asset
Growth and Maintained its ROE
1.
Source: SNL Survey Data as of 12/31/10.
2.
Based upon preliminary results for BofI through 6/30/11.
Top Community Banks
30
Average Asset Growth
Top
26
BofI Asset Growth for
Fiscal
2011
13.8
10
50
0
20
40
60
36.5
1
1
2 |
 6
BofI is 27th on the 3-Year Average ROE
Listing
1
...
BofI is 4th on the 2-Year Average ROE
Listing
2
...
BofI Holding (BOFI)
San Diego, CA
1,660.84
157.53
1.
Source: SNL Survey Data as of 12/31/10.
2.
Based
upon
Fiscal
2011
and
Fiscal
2010
results
for
BofI
compared
to
the
26
banks
that
ranked
higher
than
BofI
in
the
SNL
survey
prepared
for
the
three
years
ended 12/31/10.
Top Community Banks |
 7
2011 Fourth Quarter Highlights
Amount
($M or %)
Increase
(%)
$5.5
$1.1
$204.1
$74.5
$126.6
15.6 %
5.1
7.3
11.8
5.9
72.1
40 bps
Q4 vs. Q3
Fiscal Year
$519.2
$372.1
$636.2
36.5
38.4
335.7
Net income
Net interest income growth
Asset growth
Deposit growth
Loan origination growth
Return on equity
Asset growth
Deposit growth
Loan origination growth |
 8
Deposit products
•
Deposit
base:
~$1,239M
•
Full-featured products
•
Self-service operations
•
Highly efficient operations
(9 CSRs; 32,000
accounts)
•
Deposit
base:
~$101M
•
Strong start in first full
year of operations
•
One dedicated employee
•
Significant expansion
opportunities
1.
Bank as of 6/30/11.
Primary Business –
Deposits
1
1 |
 9
Lending
Single family
Multifamily
Capital
Markets
Gain-on-sale
Mortgage
Banking
Wholesale
Jumbo
Retail
Wholesale
Loan
purchases
Special
situations
•
Internet-focused lend sources
•
Self-service operation
•
Low-fixed costs
•
High-end portfolio lender
–
“Common Sense"
underwriting
–
Quarter to date average LTV
of 55.3%
•
15 high quality originators with
average experience of 15+ years
•
Highly ranked website-
apartmentbank.com
•
10-year history as portfolio bank
•
High credit quality
•
Quarter to date average LTV of
59.0% and DSCR of 1.51%
•
Wide network of relationships
•
Significant due diligence experience
•
Over $1bn of closed transactions
•
Complex transaction structure
assistance
•
Highly creative and opportunistic
55%
29%
16%
Primary Business –
Lending
1.
Percent of total originations and purchases for Fiscal 2011.
1
1
1 |
 10
Loan Origination Group Production
Single Family –
Jumbo Portfolio
Multifamily –
Portfolio
141.3
105.6
Total
$300.8
154.5
100.2
$274.5
Single Family –
Gain on Sale
$53.9
$19.8
(In millions)
1. Applications in as of 6/30/2011
Q4-2011
Production
Pipeline
1 |
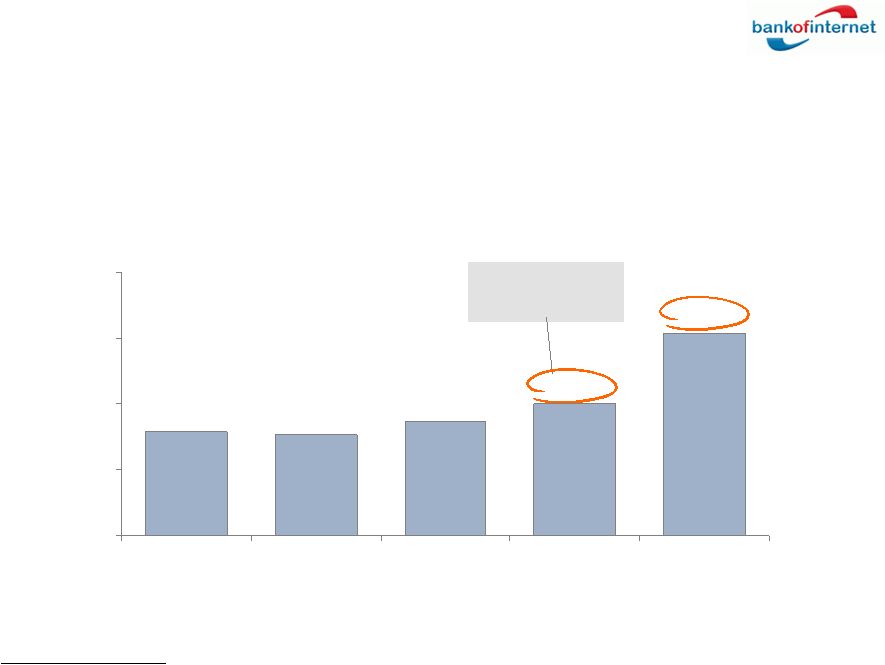
 11
0
53
29
80
20
74
141
100
Q4
Q2
Q1
Q3
($M)
40
60
79
20
Q1
Q2
106
100
0
Q4
74
Q3
27
($M)
40
60
80
Multi Family and Single Family Production are a
Reliable Asset Generation Platform for the Bank
Multifamily Loan Production
(year ended 6/30/11)
Single Family Jumbo
(year ended 6/30/11) |
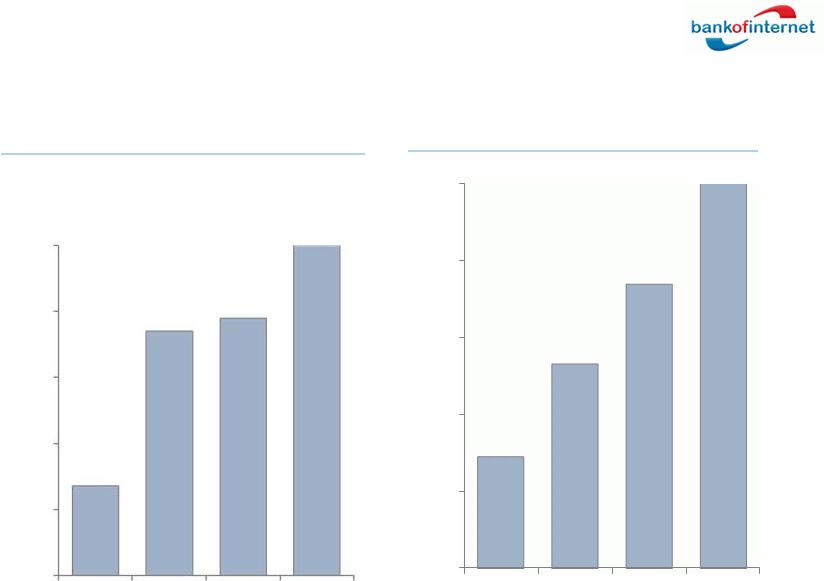
 12
Our Rapid Asset Growth Has Been Driven by
Strong and Profitable Organic Loan Production
Loan Portfolio 2011FY
Q4 2010
Q4 2011
0
$1,003,250
Q1 2011
1,000,000
$774,899
$1,113,813
500,000
1,500,000
Q2 2011
$876,934
Q3 2011
Multifamily
Avg LTV
Single family
Avg LTV
52%
51%
52%
53%
54%
53%
54%
54%
54%
54%
$1,325,301 |
 13
Our Business Model is More Profitable
Because Our Costs are Lower …
Salaries and benefits
Premises and equipment
BofI
1
(%)
0.77
0.15
Other non-interest
expense
0.53
Total non-interest
expense
1.45
Core business margin
2.13
1.37
0.37
1.28
3.02
0.54
Banks
$1-$10bn
2
(%)
Net interest income
3.58
3.56
As % of average assets
1.
Bank of Internet USA only for three months ended 3/31/11 - the most recent data on FDIC website
“Statistics on Depository Institutions Report. ”Excludes BofI Holding company to
compare to FDIC data.
2.
Commercial banks by asset size. FDIC reported for three months ended 3/31/11. Total of 431
institutions $1-$10 billion. |
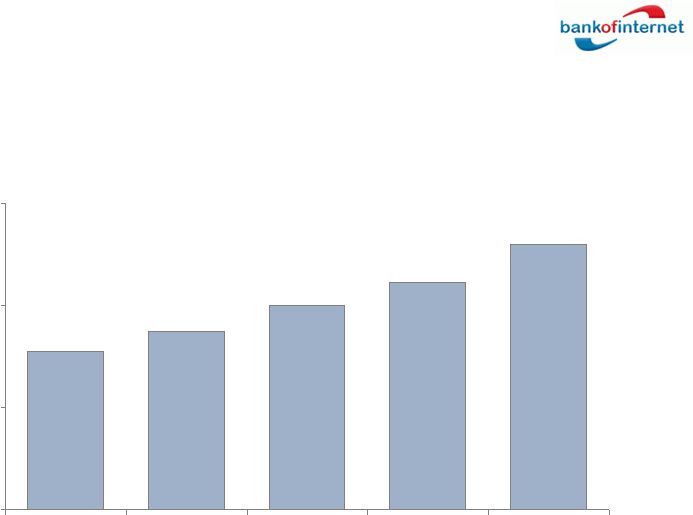
 14
Efficiency Ratio
(Bank of Internet USA, for the fiscal quarter ended)
61.50
40.11
34.49
30.67
31.39
0
20
40
60
80
(%)
Banks
1
Q3 ‘11
Q2 ‘11
Q1 ‘11
Q4 ’10
One of the lowest
rates in the
industry
…
Resulting In An Efficiency Ratio That Is
Consistently One of the Industry’s Lowest
1. Reported by FDIC – 431 commercial banks with $1-$10 billion in assets for the
quarter ended 3/31/11.
Source: FDIC Statistics on Depository Institutions. All data excludes holding companies for
banks. |
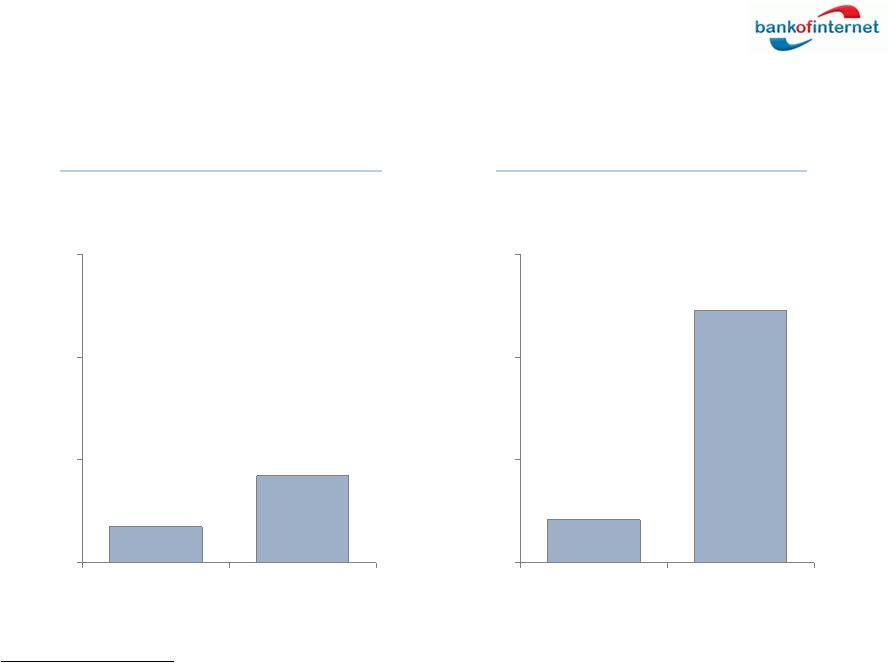 15
0.84
0.35
0
1
2
3
(%)
BofI
1
Bank $1-10bn
2
Assets 30-89 days delinquent
Assets in non-accrual
2.46
0.42
0
1
2
3
(%)
BofI
1
Bank $1-10bn
2
1.
Bank of Internet USA only at 3/31/11 (excludes BofI Holding, Inc. to compare to
FDIC data). 2.
Commercial banks by asset size. FDIC reported at 3/31/11. Total of 431 institutions
$1-$10 billion. Best in Class Asset Quality |
 16
Investment Considerations
High-quality consumer franchise
Attractive valuation
Scalability
Strong credit quality
Significant earnings upside potential |