Attached files
| file | filename |
|---|---|
| 8-K - USA TRUCK INC | form8k-08242011.htm |


Forward-Looking Statements
Forward-Looking Statements
This information and the statements made at this conference presentation may contain
forward-looking statements within the meaning of Section 27A of the Securities Act of
1933, as amended and Section 21E of the Securities Exchange Act of 1934, as amended.
These statements generally may be identified by their use of terms or phrases such as
“expects,” “estimates,” “anticipates,” “projects,” “believes,” “plans,” “intends,”
“may,” “will,” “should,” “could,” “potential,” “continue,” “future” and terms or
phrases of similar substance. Forward-looking statements are based upon the current
beliefs and expectations of our management and are inherently subject to risks and
uncertainties, some of which cannot be predicted or quantified, which could cause
future events and actual results to differ materially from those set forth in,
contemplated by, or underlying the forward-looking statements. Accordingly, actual
results may differ from those set forth in the forward-looking statements. Readers
should review and consider the factors that may affect future results and other
disclosures by the Company in its reports, Annual Report on Form 10-K and other
filings with the Securities and Exchange Commission. We disclaim any obligation to
update or revise any forward-looking statements to reflect actual results or changes in
the factors affecting the forward-looking information. In light of these risks and
uncertainties, the forward-looking events and circumstances discussed in this
conference presentation might not occur.
* Vision for Economic Value-Added
VEVA* Strategic Plan
VEVA* Strategic Plan
|
Objective #1
Earn Cost of Capital
|
|
1. Rebuild Our Foundation
• Fewer, more talented people
|
|
3. Regionalize Trucking Service
• Build density in regional lanes
• Improve pricing yield
• Attract the right customers
• Increase load “Velocity”
|
|
Objective #2
EBIT Growth
|
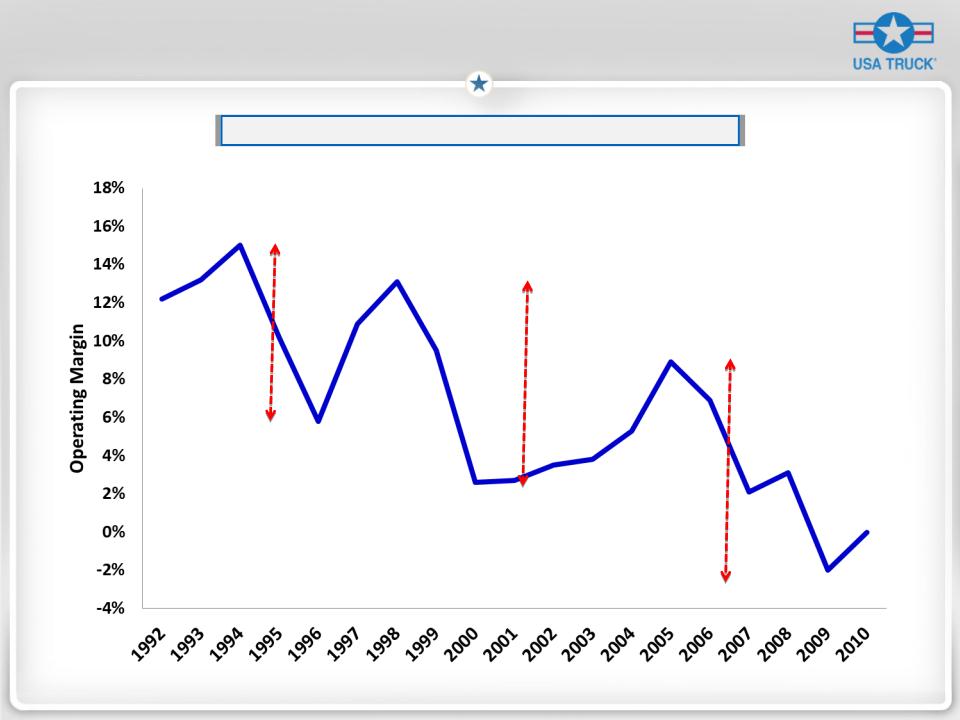
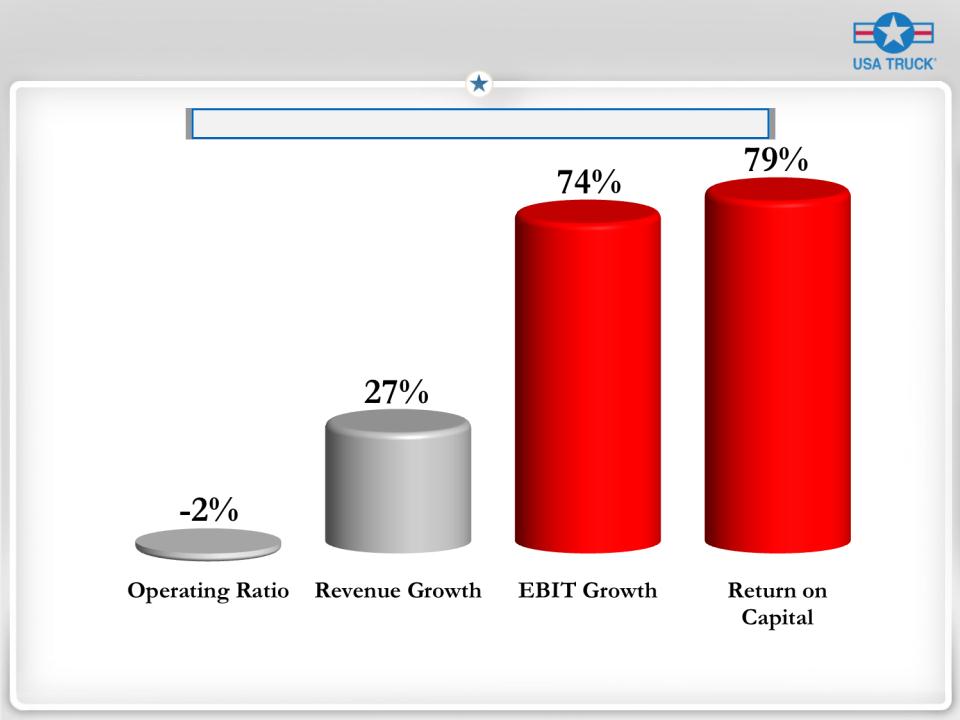
Change in Our Model Overdue
Change in Our Model Overdue
920 bps
1,050 bps
1,090 bps
Shallower Earnings Peaks and Deeper Troughs
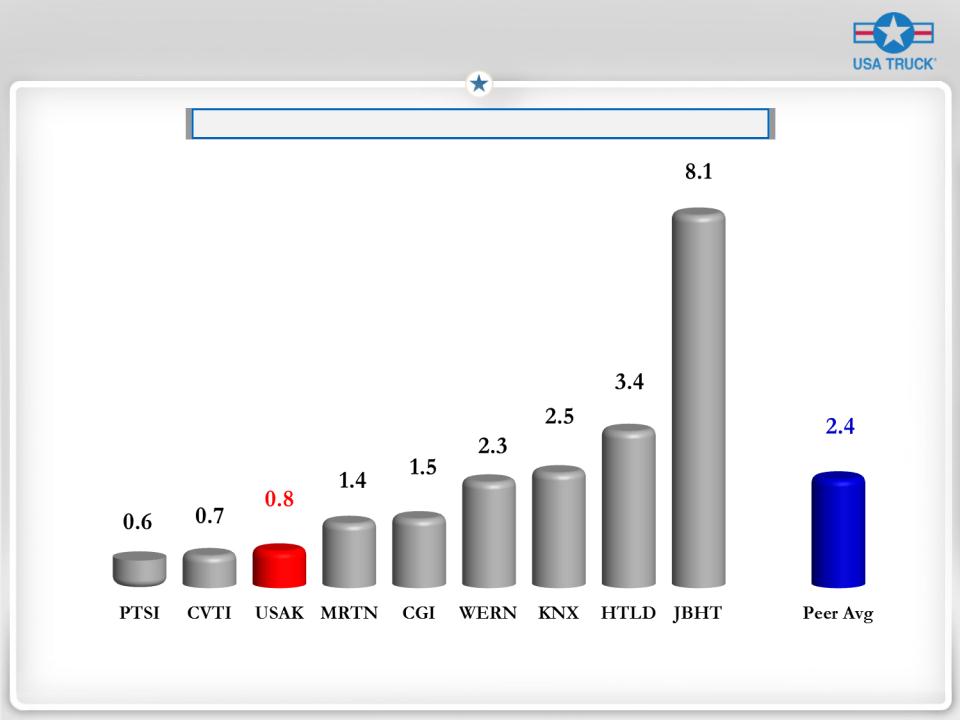
Shareholders Demand Change
Shareholders Demand Change
Truckload Peer Price-to-Book Ratios
As of August 11, 2011
Shareholders Reward Results
Shareholders Reward Results
Financial Performance Correlations to Stock Price
Source: Stephens, Inc., USA Truck, Inc. and SEC documents
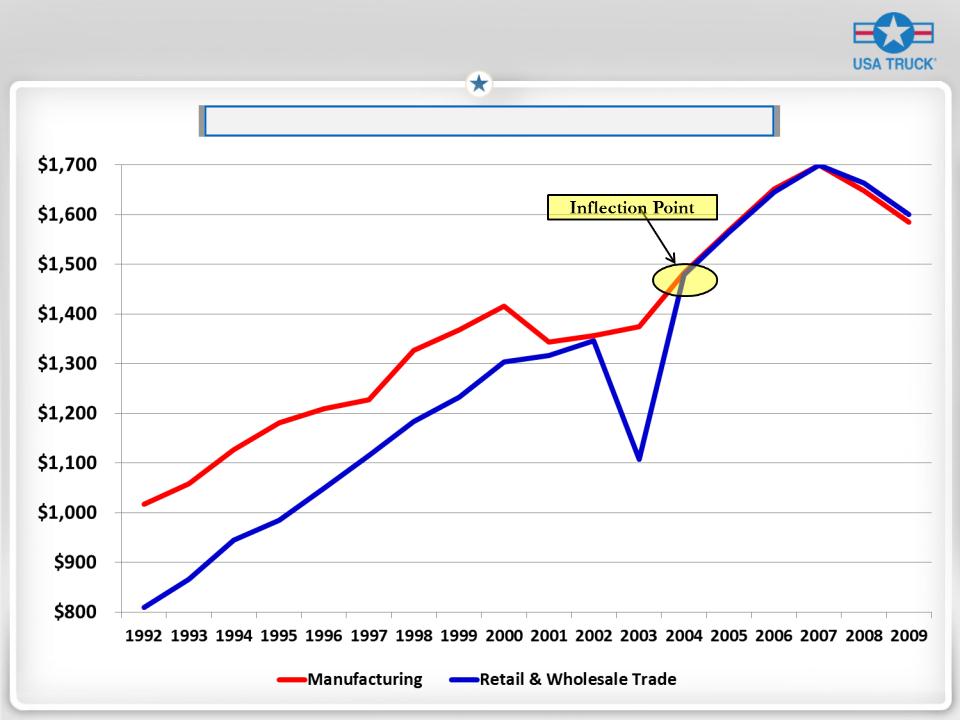
Customers Demand Change Too
Customers Demand Change Too
Billions of Dollars Contributed to U.S. GDP
The Market’s Affirmation
The Market’s Affirmation
Long-Haul Freight Ain’t What it Used to Be
Customers
“Big Boys” (provide broad bundle of TL services)
Everybody Else
Direct
Relationship
Control
Freight
Freight
Flexible Outsourced Capacity
Earn a return on every load without full capital risk
Disproportionate share of invested capital with
Insufficient returns
Insufficient returns
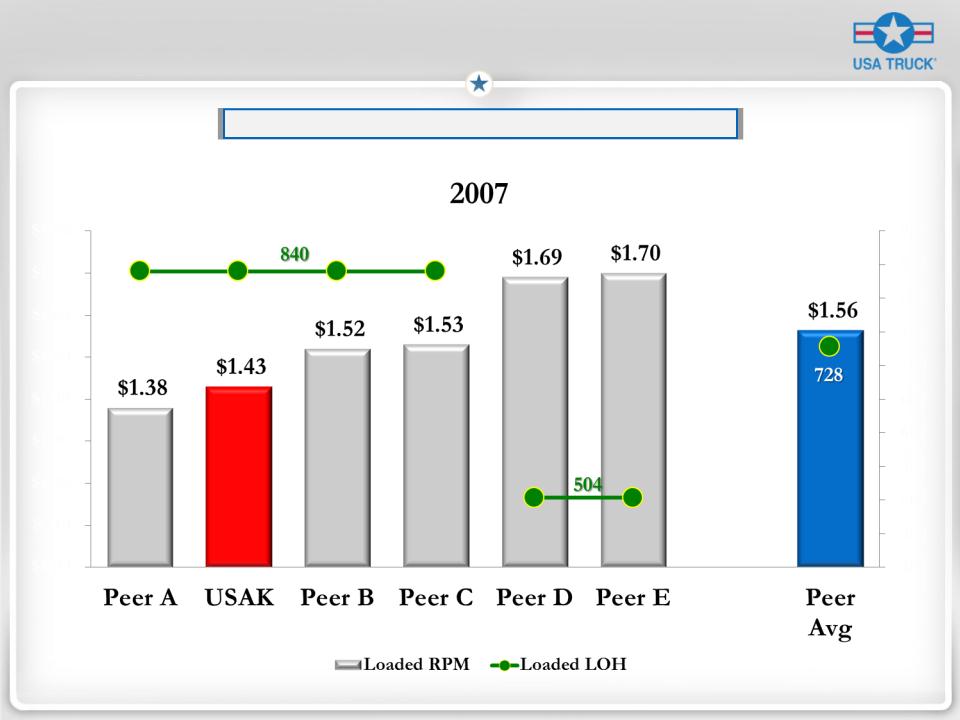
Customers Reward Service
Customers Reward Service
VEVA* Strategic Plan
VEVA* Strategic Plan
|
Objective #1
Earn Cost of Capital
|
|
1. Rebuild Our Foundation
• Fewer, more talented people
|
|
3. Regionalize Trucking Service
• Build density in regional lanes
• Improve pricing yield
• Attract the right customers
• Increase load “Velocity”
|
|
Objective #2
EBIT Growth
|
* Vision for Economic Value-Added

1. Rebuilding the Foundation
1. Rebuilding the Foundation
Significant Progress
|
|
2011
|
2007
|
Practical Effect
|
|
Fewer, More Talented People:
Drivers per non-driver
|
3.6
|
3.2
|
10%
less headcount
|
|
Updated Technology:
Core operating systems
converted to TMW |
100%
|
0%
|
Completed
Paving the way to
greater productivity
|
|
Improved Safety Performance:
Insurance and claims
expense as a % of base Trucking revenue |
6.9%
|
9.4%
|
250
basis points of
operating margin
|
|
Fixed Cost Discipline:
Trucking fixed costs per
truck per calendar day |
$130
|
$133
|
0.6%
CAGR despite intense
inflationary pressures |
With an Emerging “Big Boy” Model
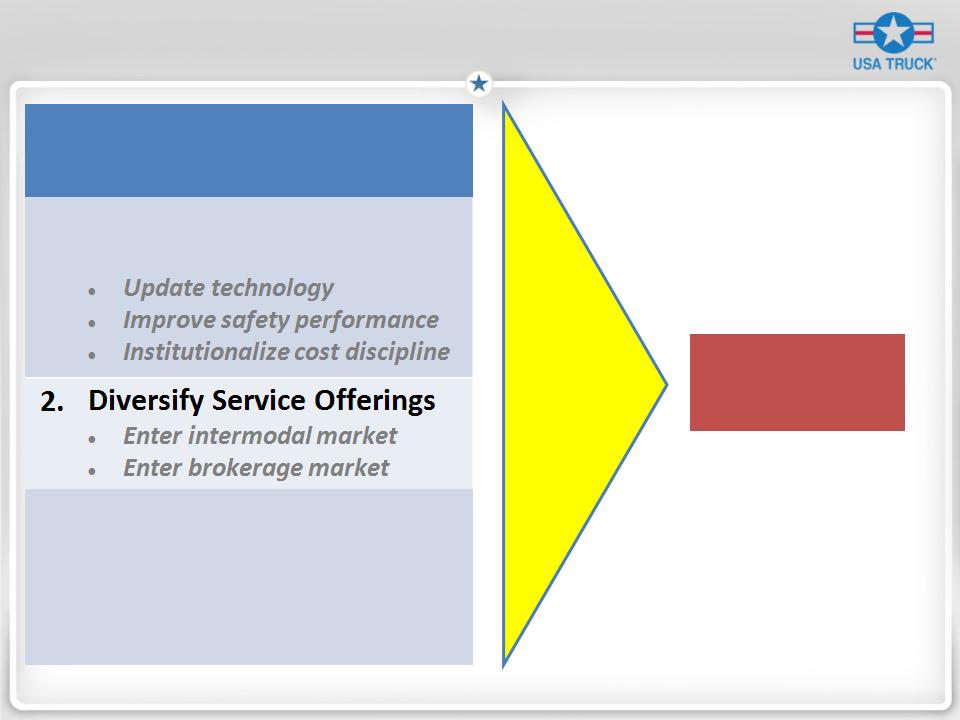
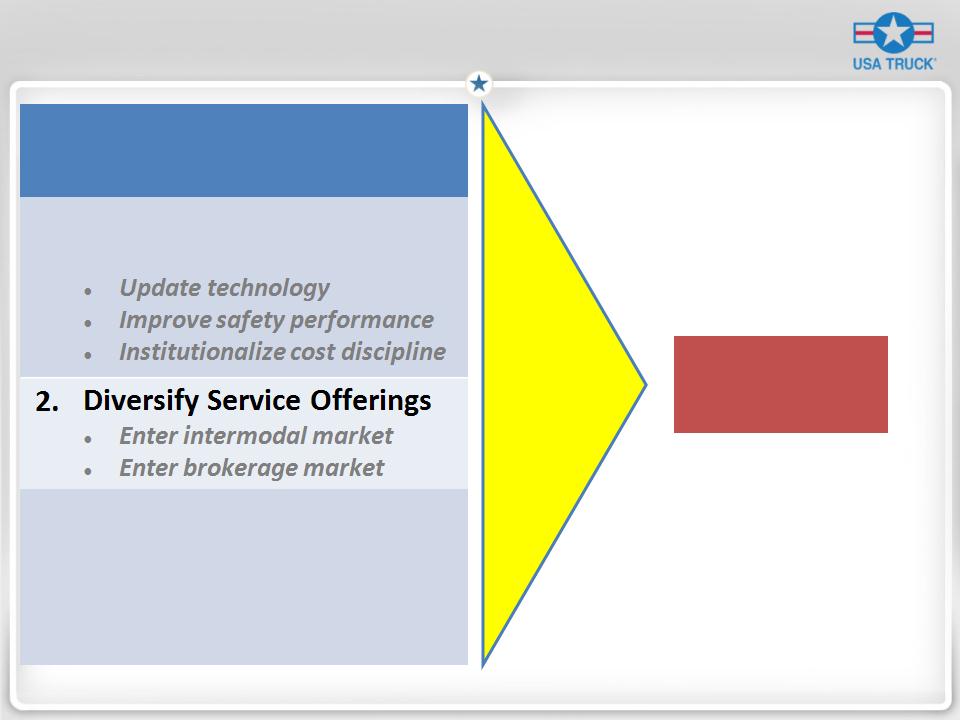
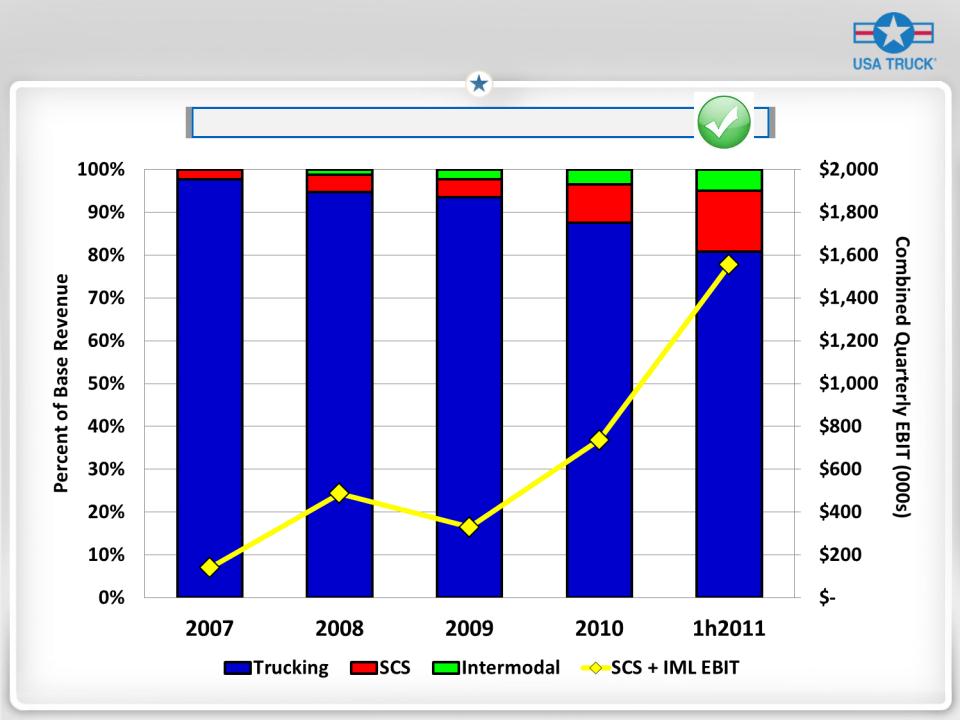
2. Diversify Service Offerings
2. Diversify Service Offerings
3. Regionalize Trucking Service
3. Regionalize Trucking Service
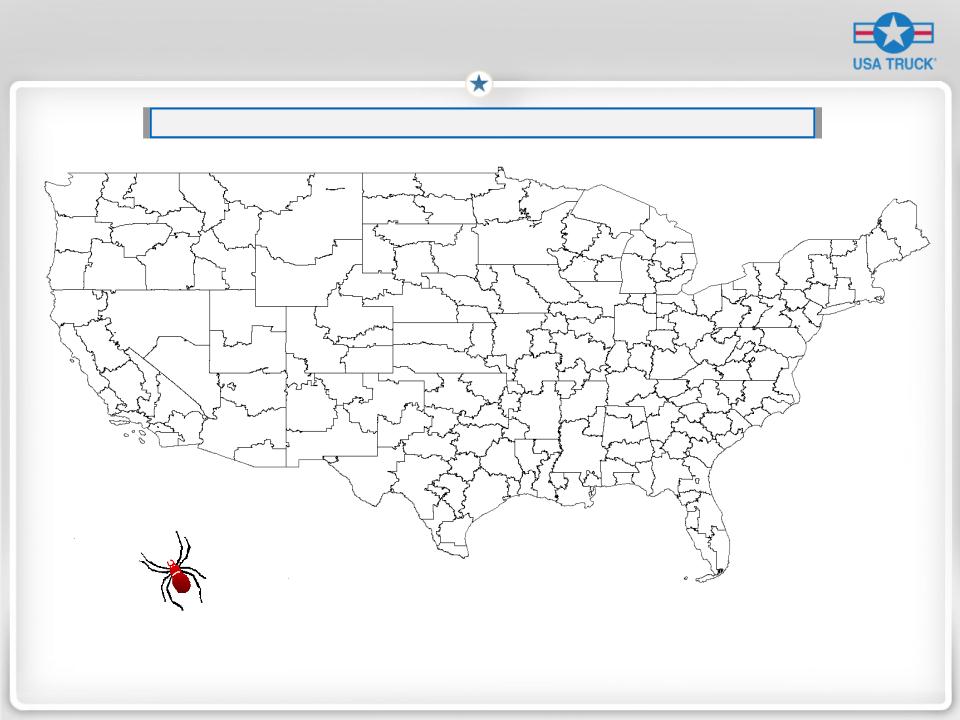
A 21st Century Freight Network - The Spider Web

3. Regionalize Trucking Service
3. Regionalize Trucking Service
Spinning the Spider Web
|
|
2011
|
2007
|
Practical Effect
|
|
Build Density in Regional Lanes:
% of loads in Spider Web
|
53%
|
< 30%
|
nearly
Double
|
|
Build Density in Regional Lanes:
Loaded Length-of-Haul
|
534
|
784
|
32%
Reduction
|
|
Improve Pricing Yield:
Base Trucking revenue per
loaded mile |
$1.66
|
$1.43
|
16%
Improvement
|
|
Attract the Right Customers:
% of revenue with “Core”
Customers |
33%
|
0%
no
strategy |
Order
From Chaos
|
|
Increase Load Velocity:
Loads per Truck per Week
|
3.2
|
2.5
|
Better
But Not Good Enough
|
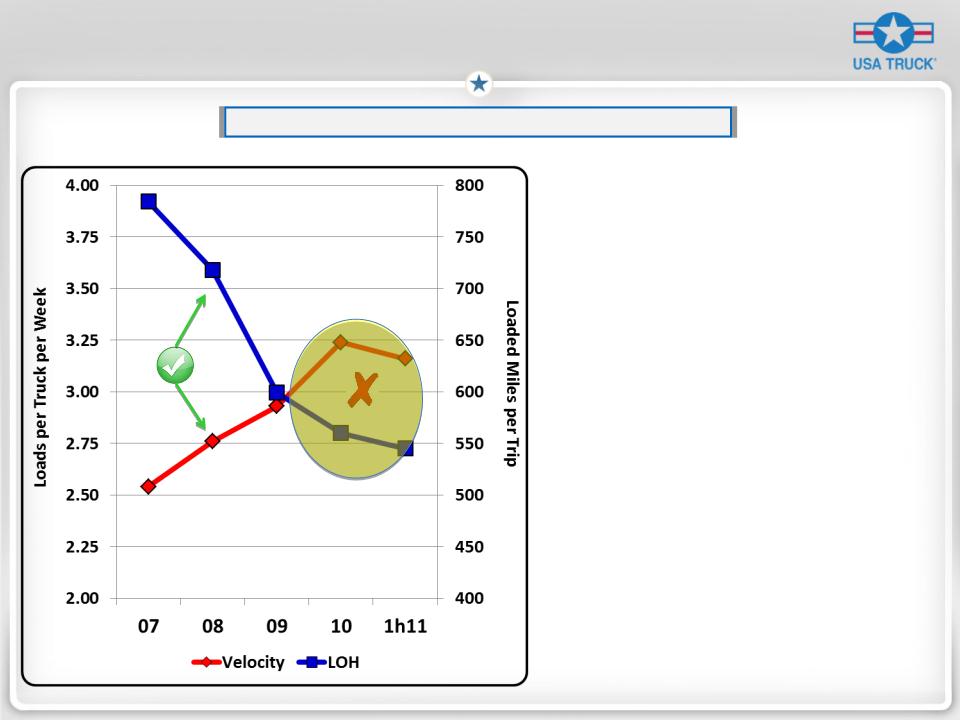
Velocity - The Missing Link
3. Regionalize Trucking Service
3. Regionalize Trucking Service
Obstacles:
•Operational Execution
•Operating System Conversion
•Unmanned Tractors > 10%
Solutions:
•Debug New System Settings (all
available resources allocated)
available resources allocated)
•100-Truck Fleet Reduction (during
3rd quarter)
3rd quarter)
•Fresh driver recruiting approach
(already hired outside help)
(already hired outside help)
•Operational leadership, intensity
and “regional” know-how (David
Hartline hired August 1st)
and “regional” know-how (David
Hartline hired August 1st)
Why Invest In USA Truck?