Attached files
| file | filename |
|---|---|
| EX-99.2 - PRESS RELEASE - Copano Energy, L.L.C. | ex99-2.htm |
| 8-K - COPANO ENERGY, L.L.C. FORM 8-K - Copano Energy, L.L.C. | form8-k.htm |
Exhibit 99.1

2011 Citigroup One-on-One
MLP/Midstream Infrastructure
Conference
August 24 - 25, 2011
MLP/Midstream Infrastructure
Conference
August 24 - 25, 2011
NASDAQ: CPNO

Disclaimer
This presentation includes “forward-looking statements,” as defined in the federal securities laws.
Statements that address activities or events that Copano believes will or may occur in the future are
forward-looking statements. These statements include, but are not limited to, statements about future
producer activity and Copano’s total distributable cash flow and distribution coverage. These statements
are based on management’s experience and perception of historical trends, current conditions, expected
future developments and other factors management believes are reasonable.
Important factors that could cause actual results to differ materially from those in the forward-looking
statements include the following risks and uncertainties, many of which are beyond Copano’s control:
the volatility of prices and market demand for natural gas and natural gas liquids; Copano’s ability to
continue to obtain new sources of natural gas supply and retain its key customers; the impact on
volumes and resulting cash flow of technological, economic and other uncertainties inherent in
estimating future production, producers’ ability to drill and successfully complete and attach new natural
gas supplies and the availability of downstream transportation systems and other facilities for natural
gas and NGLs; higher construction costs or project delays due to inflation, limited availability of required
resources, or the effects of environmental, legal or other uncertainties; general economic conditions;
the effects of government regulations and policies; and other financial, operational and legal risks and
uncertainties detailed from time to time in Copano’s quarterly and annual reports filed with the
Securities and Exchange Commission.
Copano undertakes no obligation to update any forward-looking statements, whether as a result of new
information or future events.
information or future events.
2

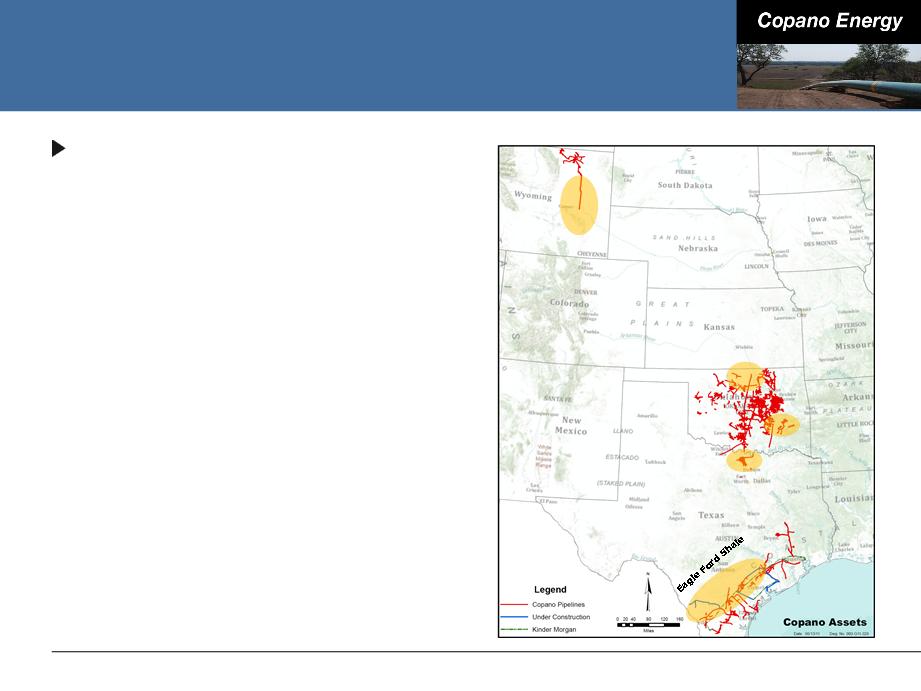
Introduction to Copano
Independent midstream company founded in 1992
■ Producer focused
■ Entrepreneurial approach
■ Focus on long-term accretive growth
■ Publicly traded LLC
● No general partner or incentive distribution rights
● Tax benefits similar to MLPs, but with corporate governance of a C-corp
Service throughput volumes approximate 1,500,000 MMBtu/d of
natural gas(1)
natural gas(1)
Approximately 6,700 miles of active pipelines
10 natural gas processing plants with over 1.2 Bcf/d of combined
processing capacity
processing capacity
One NGL fractionation facility with total capacity of 22,000 Bbls/d
■ Expansion underway to increase total capacity to 44,000 Bbls/d
3
(1) Based on 2Q 2011 results. Includes unconsolidated affiliates.
Operating Segments
Operating segments
■ Texas
■ Oklahoma
■ Rocky Mountains
■ Copano currently has assets in five
active U.S. resource plays
active U.S. resource plays
● Eagle Ford Shale
● North Barnett Shale Combo
● Woodford Shale
● Mississippi Lime
● Powder River Basin Niobrara
4
Powder River
Basin Niobrara
Basin Niobrara
Woodford
Shale
Shale
Mississippi
Lime
Lime
North Barnett
Shale Combo
Shale Combo
Executing On Our Business Strategy
Eagle Ford Shale, North Barnett Shale Combo, Woodford
Shale and Mississippi Lime
Shale and Mississippi Lime
Acquisition of the Harrah and Davenport plants
5
Organic Growth and
Bolt-on Acquisitions
Bolt-on Acquisitions
Maintaining Strong
Balance Sheet
Balance Sheet
Reduce Sensitivity
to Commodity
Prices
to Commodity
Prices
Flexibility in
Operations
Operations
Long-term, fee-based contracts - also reduce hedging
requirements
requirements
Access to multiple NGL markets
Ability to fractionate and produce y-grade product
Multiple plant residue alternatives
March 2010 equity offering
TPG Capital preferred equity investment
Senior notes refinancing
Extended maturity of revolver to 2016
Expand Midstream
Services Menu
Services Menu
Fractionation and NGL marketing services
Purity ethane and propane pipeline service
Y-grade service through the Liberty pipeline
Condensate and crude oil gathering project in planning phase

Agenda
6
|
Eagle Ford Shale
Growth Projects |
Business Segment
Outlook |
|
Financing and
Commodity Price Sensitivity |
Conclusions
|
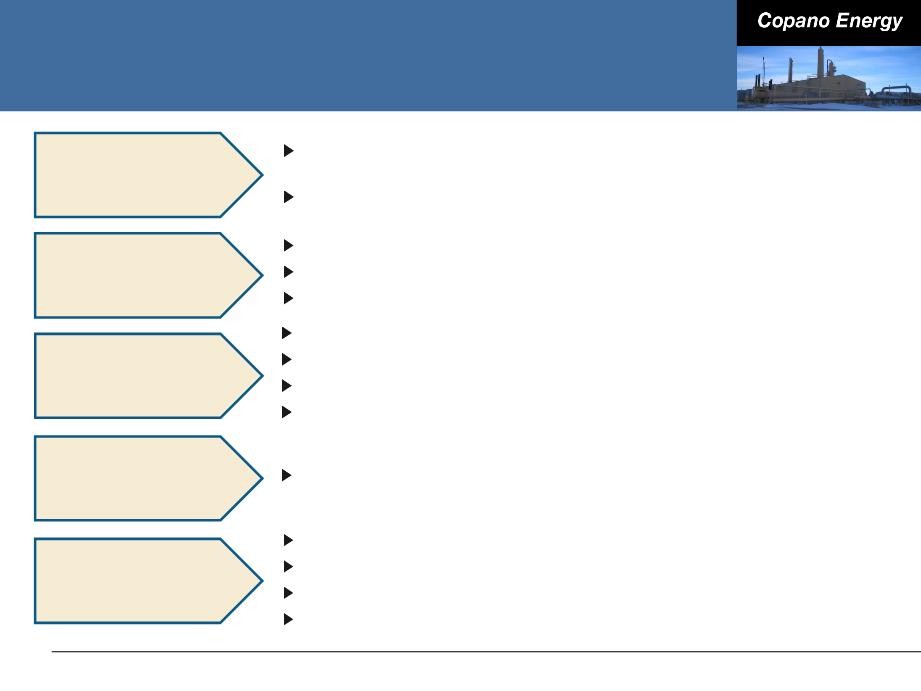
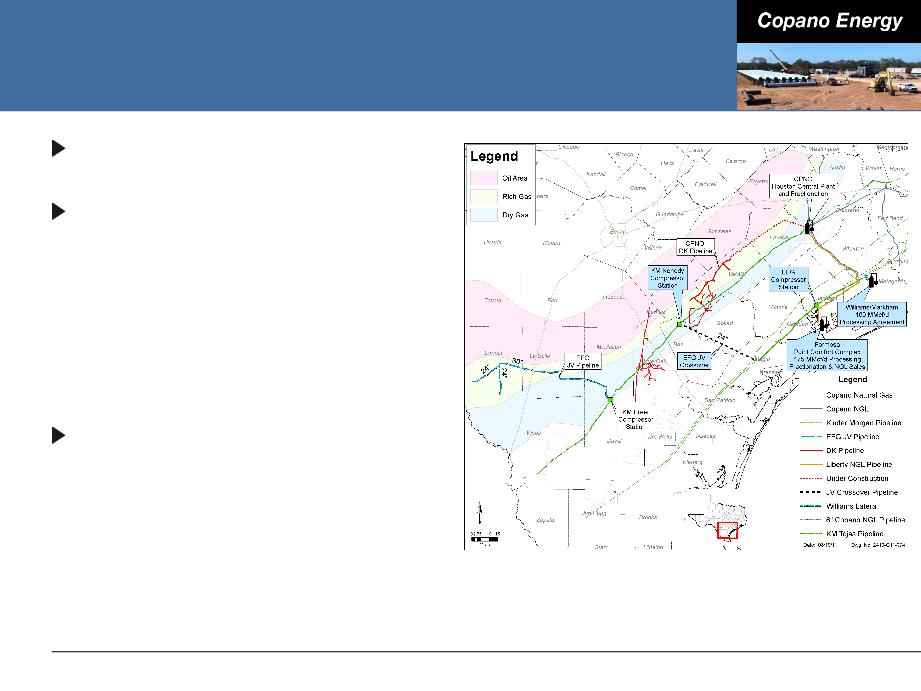
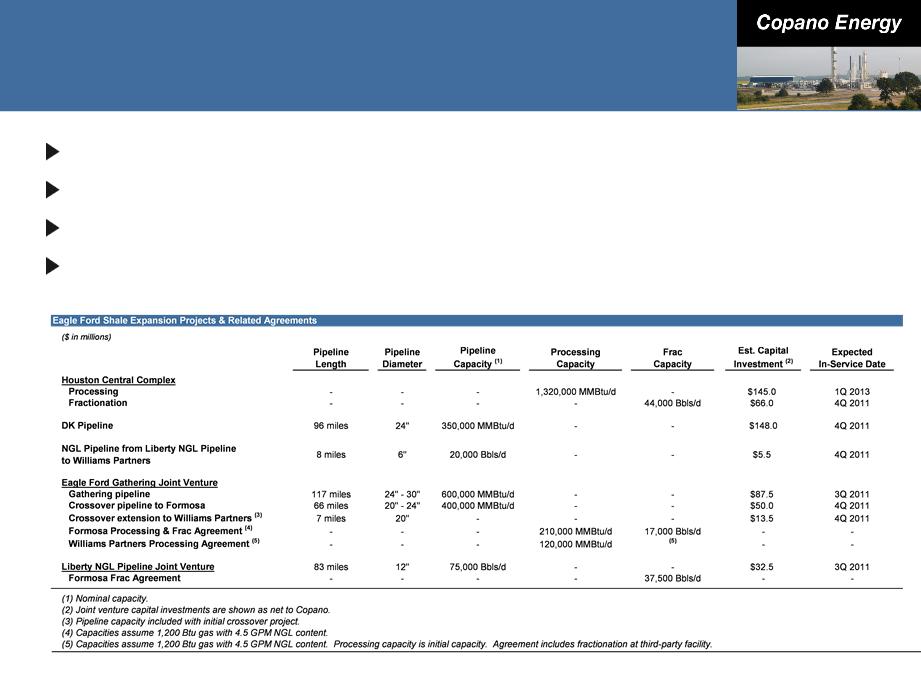
DK Pipeline and Extension
DK extension
■ Key producer contracts with
Abraxas, GeoSouthern, Petrohawk,
Pioneer, Riley and others
Abraxas, GeoSouthern, Petrohawk,
Pioneer, Riley and others
■ Announced February 2011
● 58 miles of 24” pipe
● Construction approximately 25%
complete
complete
■ Loops Kinder Morgan’s Index 50
pipeline, effectively boosting
pipeline capacity to Houston Central
complex
pipeline, effectively boosting
pipeline capacity to Houston Central
complex
■ Extension to Houston Central
complex will increase DK pipeline
capacity to 350,000 MMBtu/d from
225,000 MMBtu/d
complex will increase DK pipeline
capacity to 350,000 MMBtu/d from
225,000 MMBtu/d
■ Estimated capital investment of
$100 million
$100 million
7
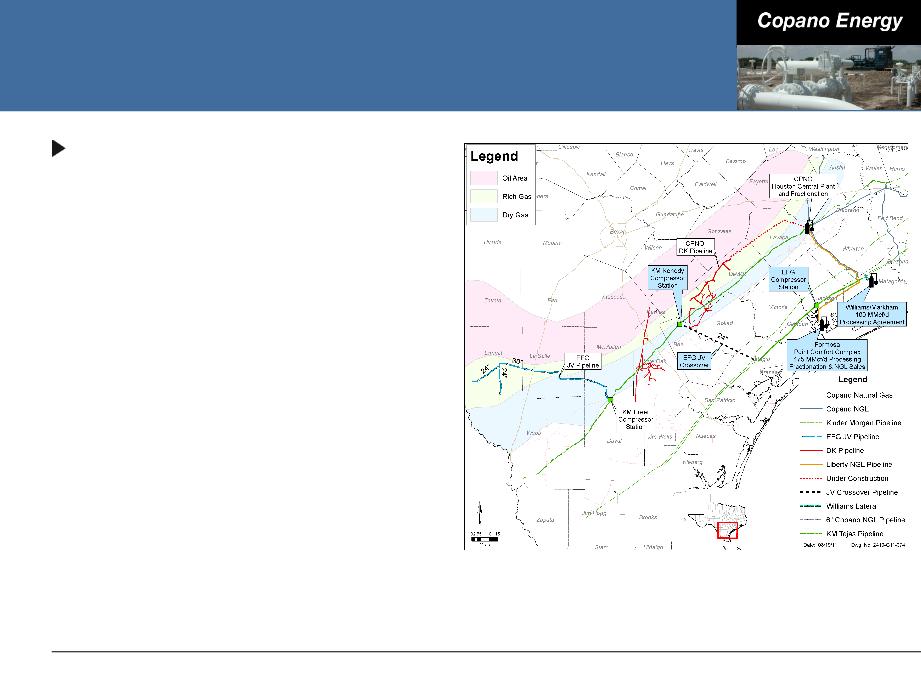
Southern Eagle Ford Shale
Eagle Ford Gathering (EFG)
■ 50/50 JV with Kinder Morgan
EFG Mainline
■ 117 miles of 30” and 24” pipe -
nearing completion
nearing completion
■ 30” pipeline now accepting
interruptible gas with full service
expected early October
interruptible gas with full service
expected early October
■ Nominal capacity of 600,000
MMBtu/d - expandable with
compression
MMBtu/d - expandable with
compression
■ Long-term, fee-based contracts with
volume commitments for 91% of
nominal capacity
volume commitments for 91% of
nominal capacity
● Newly added contacts with Rosetta
and Petrohawk
and Petrohawk
■ Estimated capital investment of
$87.5 million
$87.5 million
8
EFG Crossover
9
Allows for full utilization of EFG
Mainline pipeline
Mainline pipeline
66 miles of 24” and 20” pipe
connecting Kinder Morgan’s
Index 50 and Tejas 30”
pipelines to Formosa
connecting Kinder Morgan’s
Index 50 and Tejas 30”
pipelines to Formosa
■ Approximately 50% of 24” line
constructed
constructed
■ Estimated capital investment of $50
million
million
7 miles of 20” pipe connecting
Kinder Morgan’s Tejas 30”
pipeline to Williams Partners’
Markham plant
Kinder Morgan’s Tejas 30”
pipeline to Williams Partners’
Markham plant
■ Anticipate early October access to
Markham plant
Markham plant
■ Estimated capital investment of
$13.5 million
$13.5 million
EFG Crossover (cont’d)
10
Long-term contracts with
Formosa and Williams Partners
Formosa and Williams Partners
■ Formosa - 175 MMcf/d of
processing, fractionation and
product sales
processing, fractionation and
product sales
■ Williams Partners’ Markham - 100
MMcf/d processing and associated
with fractionation, with an option to
increase to 200 MMcf/d
MMcf/d processing and associated
with fractionation, with an option to
increase to 200 MMcf/d
● Copano to construct wholly owned
8-mile, 6” NGL pipeline from
Markham plant to Liberty NGL
pipeline estimated capital
investment of $5.5 million
8-mile, 6” NGL pipeline from
Markham plant to Liberty NGL
pipeline estimated capital
investment of $5.5 million
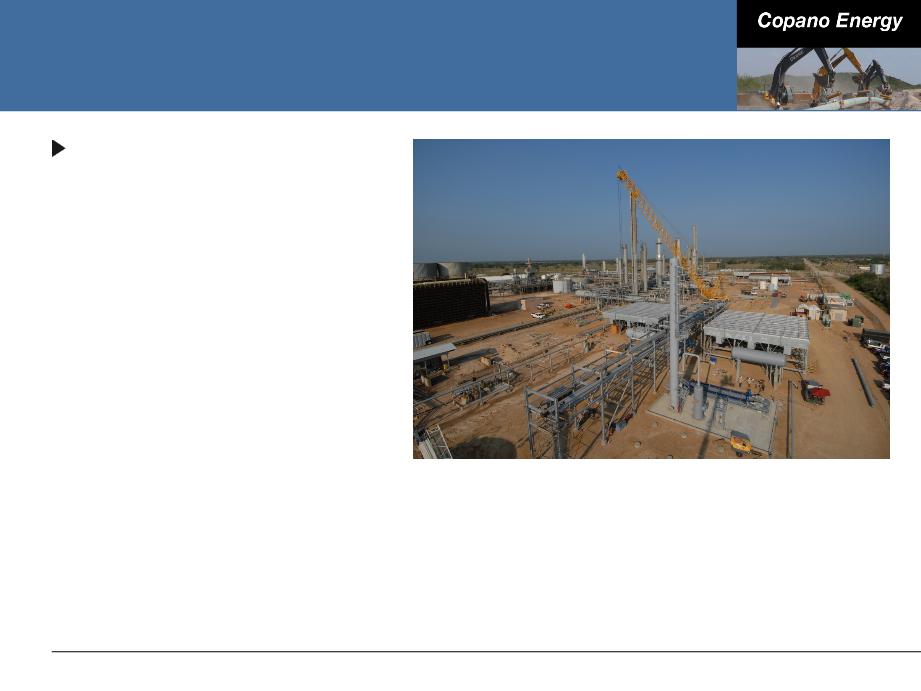
Houston Central Complex
Fractionation expansion
■ Fractionation expansion from
22,000 Bbls/d to 44,000
Bbls/d
22,000 Bbls/d to 44,000
Bbls/d
● All ethane and propane
expected to move to Dow
through Copano purity
pipelines
expected to move to Dow
through Copano purity
pipelines
■ Estimated capital investment
of $66 million
of $66 million
● Includes fractionation
facilities and related plant
upgrades and product
pipeline expansions
facilities and related plant
upgrades and product
pipeline expansions
11
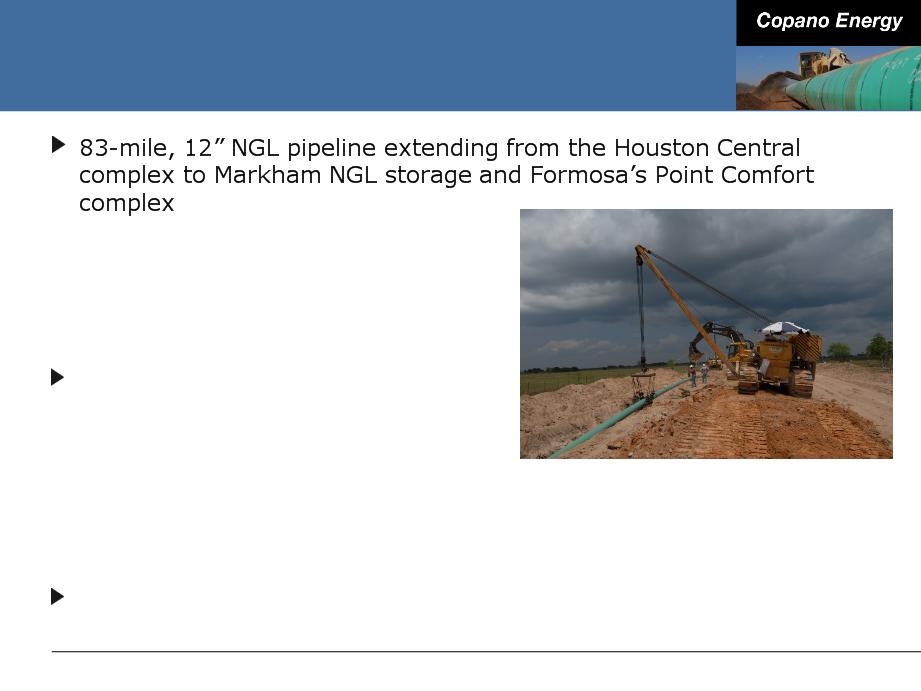
Liberty NGL Pipeline
■ Total capacity of 75,000 Bbls/d
■ Constructed through 50/50 JV
with Energy Transfer
with Energy Transfer
■ Houston Central to Clemville Storage
was placed in-service in early August
12
Long-term fractionation and product
sales agreement with Formosa on
favorable terms
sales agreement with Formosa on
favorable terms
■ Initial access to 7,000 Bbls/d
■ Upon completion of Formosa’s
fractionation expansion 1Q 2013, will
have up to 37,500 Bbls/d of firm capacity
for a 15-year term
fractionation expansion 1Q 2013, will
have up to 37,500 Bbls/d of firm capacity
for a 15-year term
Estimated capital investment of
$32.5 million
$32.5 million
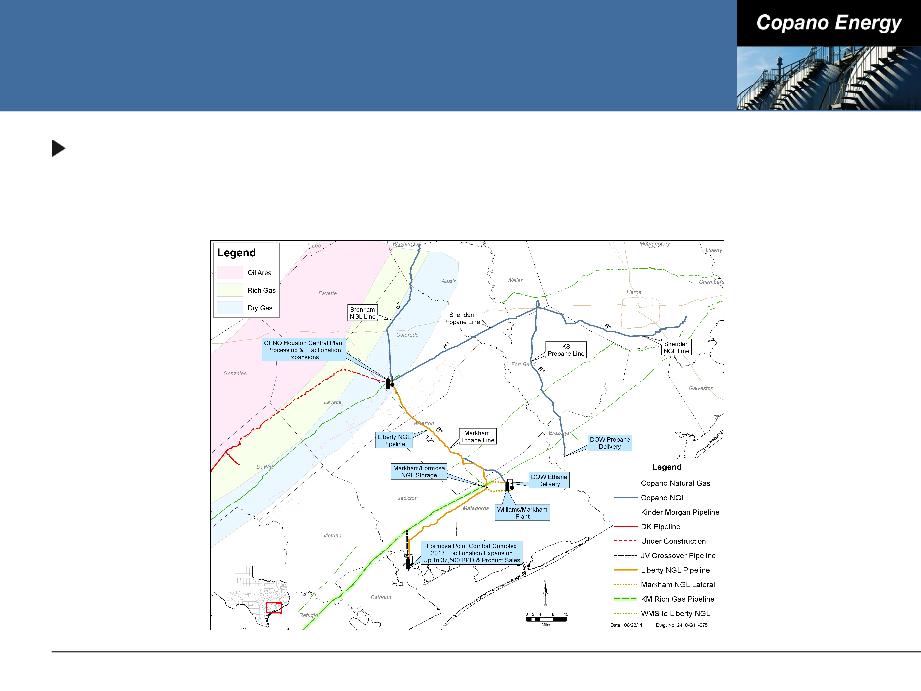
Houston Central NGL Infrastructure
13
Access to Dow and Formosa
■ Among the largest petrochemical users of NGLs in the U.S.
■ Long-term contracts with both Dow and Formosa
Summary of Eagle Ford Shale
Infrastructure
Infrastructure
14
Total capital investment of over $500 million
In excess of 1 Bcf/d of pipeline and processing capacity
Greater than 100,000 Bbls/d of fractionation capacity
Access to multiple markets for residue gas and NGLs
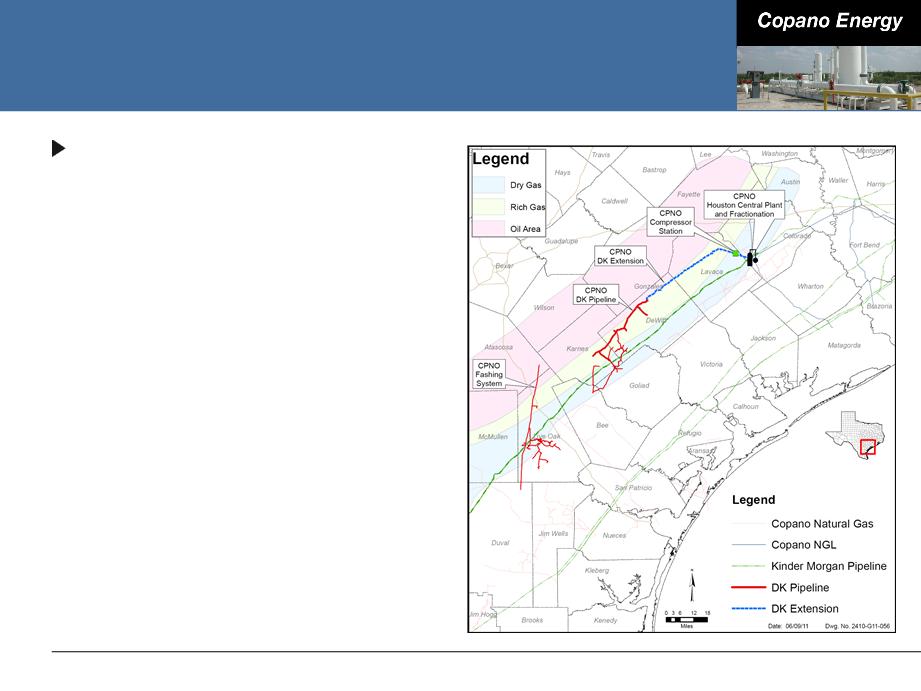
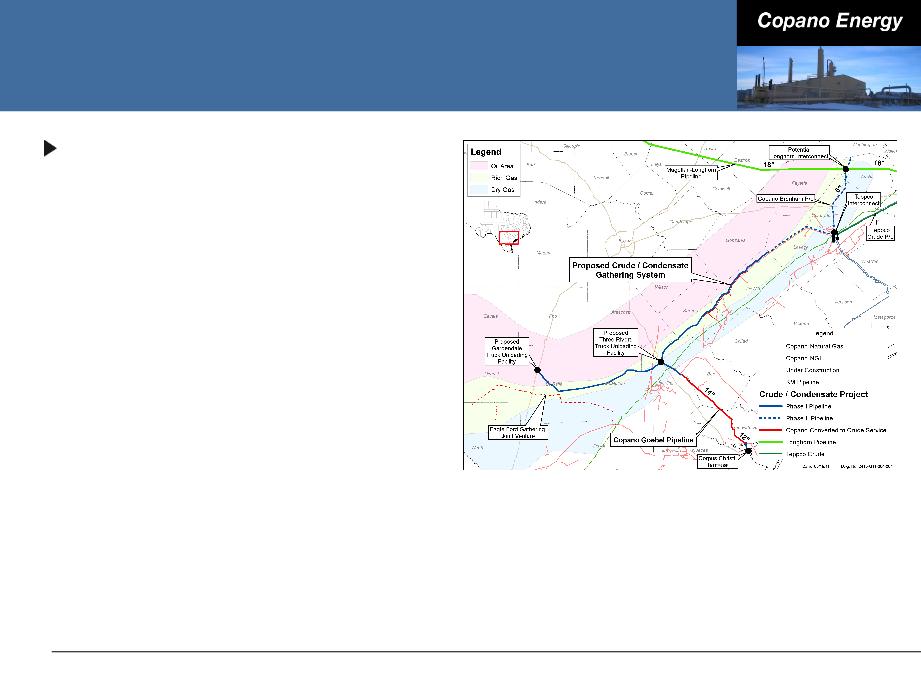
Growth Opportunities - Eagle Ford Shale
Potential extension of DK
pipeline to Fashing / Live Oak
system
pipeline to Fashing / Live Oak
system
■ Continues loop of Kinder Morgan’s
Index 50 pipeline through the
Eagle Ford Shale condensate
window
Index 50 pipeline through the
Eagle Ford Shale condensate
window
● 34 miles of 24” pipe
● Allows for gathering of
approximately 50,000 MMBtu/d
from additional Eagle Ford
Shale acreage
approximately 50,000 MMBtu/d
from additional Eagle Ford
Shale acreage
■ Ties additional existing Copano
gathering systems directly to
Houston Central complex
gathering systems directly to
Houston Central complex
■ Potential connectivity to the EFG
crossover line for DK pipeline and
Fashing / Live Oak volumes
crossover line for DK pipeline and
Fashing / Live Oak volumes
15
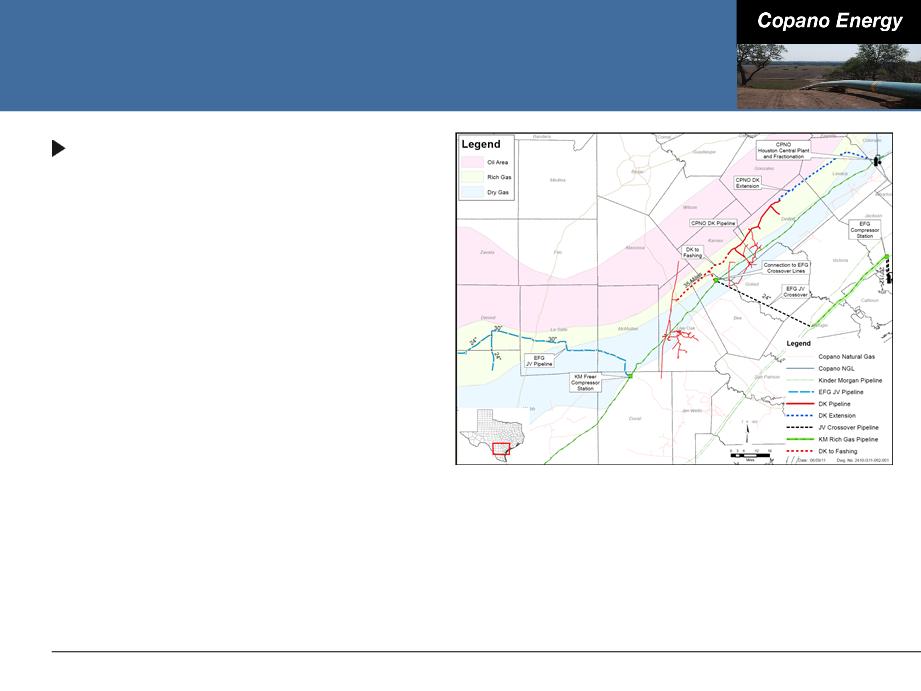
Growth Opportunities - Eagle Ford Shale
Crude oil / condensate initiative
■ 100,000 Bbls/d capacity pipeline
■ Fee-based revenue
■ Working to complete definitive JV
agreements and secure anchor
shipper by 3Q 2011
agreements and secure anchor
shipper by 3Q 2011
■ Convert existing 14” Copano
Goebel line to crude service
Goebel line to crude service
■ Tie into markets, storage and
loading docks in Corpus Christi
loading docks in Corpus Christi
■ Utilize dual-line rights of way in the
DK corridor to lay crude gathering
system
DK corridor to lay crude gathering
system
■ Proposed pipeline from Three
Rivers to Corpus Christi would
begin service in mid-2012;
remaining assets would begin 4Q
2012
Rivers to Corpus Christi would
begin service in mid-2012;
remaining assets would begin 4Q
2012
16

Business Segment Outlook
17
|
Eagle Ford Shale
Growth Projects |
Business Segment
Outlook |
|
Financing and
Commodity Price Sensitivity |
Conclusions
|

Texas Recent Developments
Saint Jo system - North Barnett Shale Combo
■ Gathering, treating and processing
■ Plant fully committed under long-term, fee-based contracts
■ System volumes have been averaging 110,000 MMBtu/d
Eagle Ford Shale
■ Copano’s total Eagle Ford Shale volumes have been averaging approximately
140,000 MMBtu/d
140,000 MMBtu/d
■ EFG 30” pipeline currently accepting interruptible gas (until Freer liquids
handling facility is operational in October)
handling facility is operational in October)
Lake Charles plant
■ Executed agreements for both natural gas receipt logistics and fractionation
and product sales
and product sales
● Equipment has been procured with expected in-service date in mid-October
■ Minimal capital investment of approximately $5 million
18

Texas Outlook
Saint Jo system
■ Copano’s largest producer has 11 rigs running in the area and expects to run 11
- 12 rigs for the remainder of the year
- 12 rigs for the remainder of the year
● On track to connect approximately 150 wells in 2011
■ Leasing activity continues
■ Evaluating opportunity to expand Saint Jo plant by 50,000 Mcf/d - 100,000
Mcf/d
Mcf/d
Eagle Ford Shale
■ Over 180 rigs currently running in the Eagle Ford Shale
■ As growth projects are completed, expect to see substantial volume increases
on both wholly owned and joint venture assets in the second half of 2011 and
beyond
on both wholly owned and joint venture assets in the second half of 2011 and
beyond
Assuming current prices continue and based on current outlook on
volumes, expect slightly higher segment gross margin in 3Q 2011
compared to 2Q 2011
volumes, expect slightly higher segment gross margin in 3Q 2011
compared to 2Q 2011
19
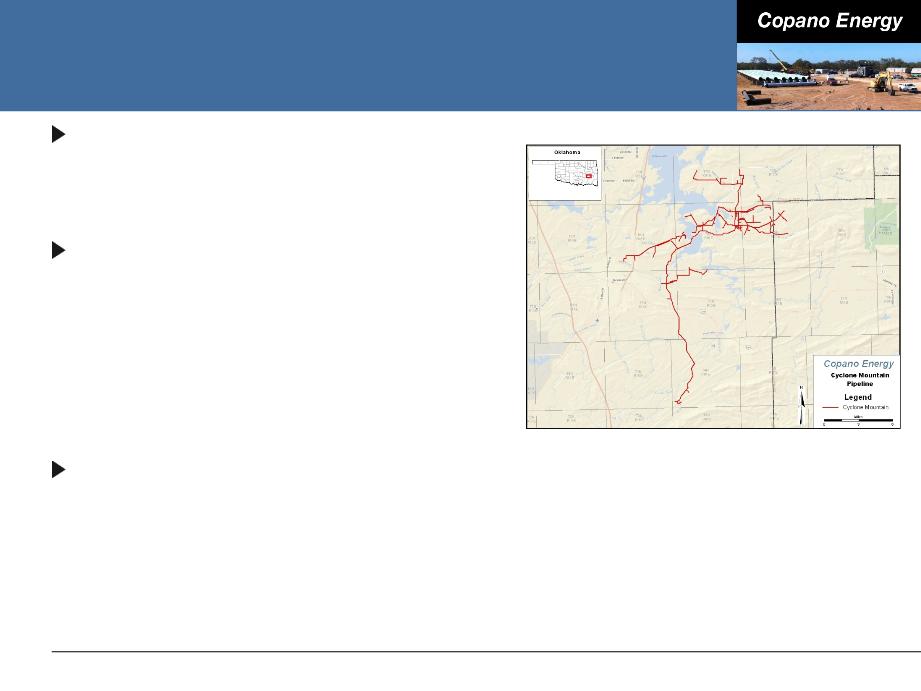
Oklahoma Recent Developments
Acquisition of Harrah plant from
Enogex (April 2011)
Enogex (April 2011)
■ Contributed $1.5 million in gross margin
in 2Q 2011
in 2Q 2011
Strong drilling activity in the
Woodford Shale around the Cyclone
Mountain system
Woodford Shale around the Cyclone
Mountain system
■ 2Q 2011 volumes increased an average
of 4,500 Mcf/d compared to 1Q 2011
of 4,500 Mcf/d compared to 1Q 2011
■ Two additional wells connected in late
July 2011 with combined rate of 14,000
Mcf/d
July 2011 with combined rate of 14,000
Mcf/d
Constructing Featherston treating
and compression station to handle
additional volumes
and compression station to handle
additional volumes
■ Capacity of 30,000 Mcf/d
■ Expect October 2011 in-service date
■ Further expansion in 2012 anticipated
20

Oklahoma Outlook
Rich gas (primarily Hunton dewatering and Mississippi Lime)
■ Drilling activity has increased in 3Q 2011 compared to 2Q 2011
■ 3 rigs running in the Hunton, 4 rigs in the Mississippi Lime and 13 rigs in other
rich gas areas
rich gas areas
■ Attractive processing upgrade and low geologic risk
Lean gas (primarily Woodford Shale)
■ Drilling activity remains steady in 3Q 2011 compared to 2Q 2011
■ 3 rigs running
Based on current commodity prices and volume outlook, expect
Oklahoma gross margin to be flat in 3Q 2011 compared to 2Q 2011
Oklahoma gross margin to be flat in 3Q 2011 compared to 2Q 2011
21

Rocky Mountains Outlook
Drilling and dewatering will be driven by commodity prices and
producer economics
producer economics
3Q 2011 volumes for Bighorn expected to be slightly lower vs. 2Q
2011
2011
3Q 2011 volumes for Fort Union expected to be higher vs. 2Q 2011
due to the Bison pipeline rupture
due to the Bison pipeline rupture
Second half 2011 Adjusted EBITDA expected to be slightly lower vs.
first half 2011
first half 2011
Recently approved project to connect 145 wells that have been
drilled, but not yet dewatered on the Bighorn system
drilled, but not yet dewatered on the Bighorn system
■ Volumes to flow once dewatering process is complete (12 - 18 months)
22

Financing and Commodity Price
Sensitivity
Sensitivity
23
|
Eagle Ford Shale
Growth Projects |
Business Segment
Outlook |
|
Financing and
Commodity Price Sensitivity |
Conclusions
|

Liquidity and Capitalization
At June 30, 2011:
■ $62 million cash
■ $700 million revolving credit facility
● Closed in June 2011 - added flexibility to existing financial covenants
● Approximately $360 million available
● Matures June 2016
■ $609.5 million senior notes
● $360.0 million 7.125% senior notes due 2021
● $249.5 million 7.75% senior notes due 2018
24
Shifting Contract Mix
Continued shift towards a more fee-based contract mix
■ Eagle Ford Shale, North Barnett Shale Combo and Woodford Shale volume
growth are key drivers
growth are key drivers
25
|
Contract Mix as a % of Gross Margin
|
||||||
|
|
1Q 2010
|
2Q 2010
|
3Q 2010
|
4Q 2010
|
1Q 2011
|
2Q 2011
|
|
Fee-based
|
27%
|
33%
|
37%
|
38%
|
41%
|
41%
|
|
Percentage-of-
proceeds |
39%
|
31%
|
30%
|
32%
|
32%
|
33%
|
|
Keep-
whole/Other |
36%
|
33%
|
29%
|
34%
|
39%
|
40%
|
|
Net hedging
|
-2%
|
3%
|
4%
|
-4%
|
-12%
|
-14%
|
Note: Includes Copano’s share of gross margin from unconsolidated affiliates. Approximate percentages based on Copano internal financial planning models.

Hedging Strategy
Continued focus on option-based, product-specific hedging strategy
■ Reliance on hedging will decrease as contract mix changes over time
2011 well hedged
■ Between 70% and 90% of ethane, propane, butane, natural gasoline and
condensate exposure is hedged
condensate exposure is hedged
2012 hedged near policy limits for all products except ethane
■ 80% of propane, butane, natural gasoline and condensate exposure hedged
■ 20% of ethane exposure hedged
2013 hedging positions continue to be added
■ Between 40% and 60% of butane, natural gasoline and condensate exposure
hedged
hedged
■ 40% of propane exposure hedged
■ No ethane hedges for 2013
26

Conclusions
27
|
Eagle Ford Shale
Growth Projects |
Business Segment
Outlook |
|
Financing and
Commodity Price Sensitivity |
Conclusions
|
Copano’s Key Strengths
Founded in 1992 as an independent midstream company
Experienced operator in liquids-rich natural gas plays
Six executive management members with 166 combined years of industry experience
28
Experienced
Operator /
Operator /
Seasoned Team
Strong Balance
Sheet with
Access to
Liquidity
Sheet with
Access to
Liquidity
Strategic and
Diverse Asset
Base
Diverse Asset
Base
Significant
Organic Growth
Organic Growth
Significant position in Eagle Ford Shale and North Barnett Shale Combo
One of the largest gatherers of associated gas in Eastern Oklahoma
Large gatherer of Powder River Basin gas with access to Niobrara and Frontier gas
Upon completion of processing expansion, Houston Central complex will be largest plant
in Texas
in Texas
Approximately $440 million in 2011 growth projects (1) - majority in Eagle Ford Shale
Investments in announced growth projects target 5x multiple
Opportunities beyond traditional gathering and processing
New $700 million revolver in place
$300 million TPG Capital preferred equity
Cash flow growth expected from projects due to be completed this year
Long-term
Contracts and
Improving
Contract Mix
Contracts and
Improving
Contract Mix
DK pipeline, Eagle Ford Gathering JV and Saint Jo system approximately 80%
contracted on a combined basis
contracted on a combined basis
Average contract length for Eagle Ford Shale and North Texas Barnett Combo
approaching 9 years
approaching 9 years
Contract mix expected to be two-thirds fee-based by end of 2012
(1) Includes Copano’s net share for unconsolidated affiliates.

Appendix
29
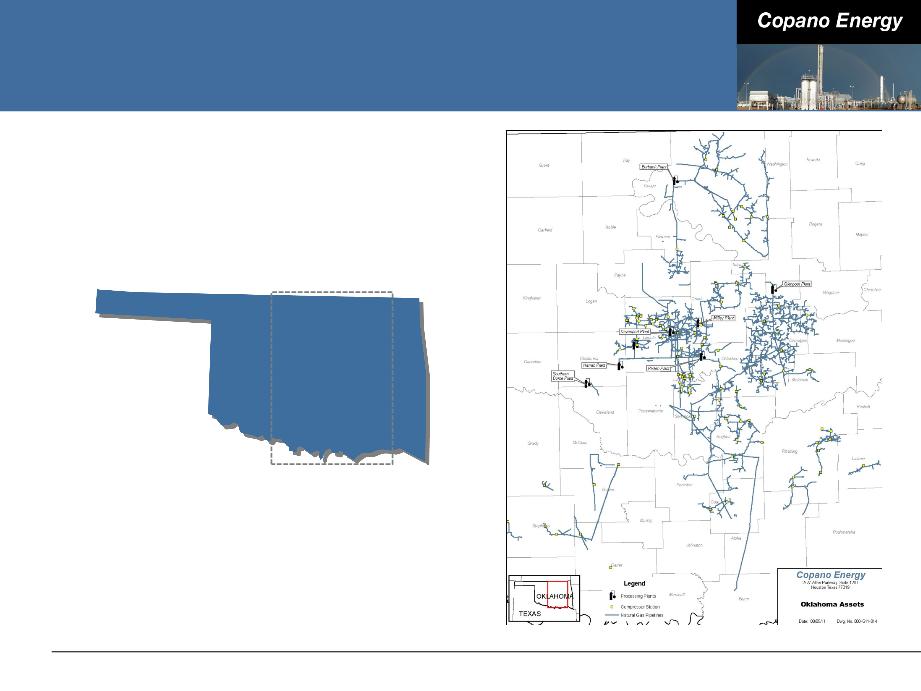
Oklahoma Assets
30
OKLAHOMA
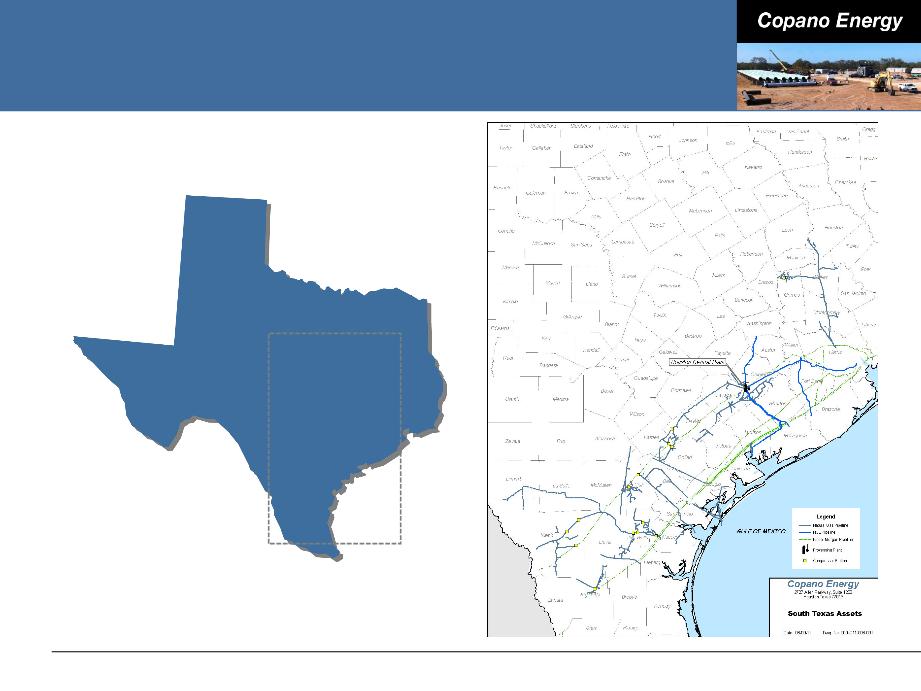
South Texas Assets
31
TEXAS
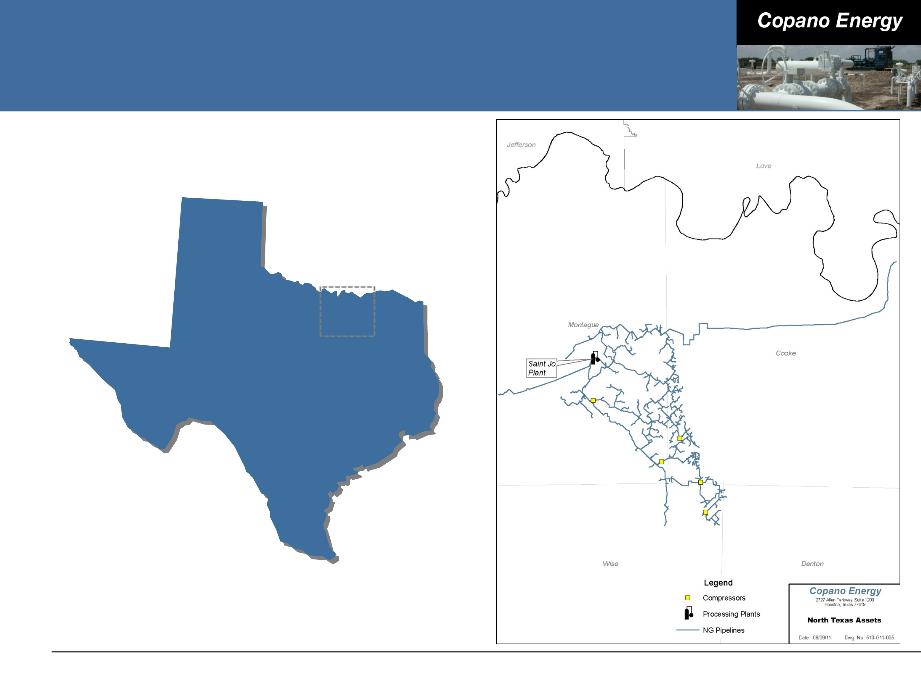
North Texas Assets
32
TEXAS
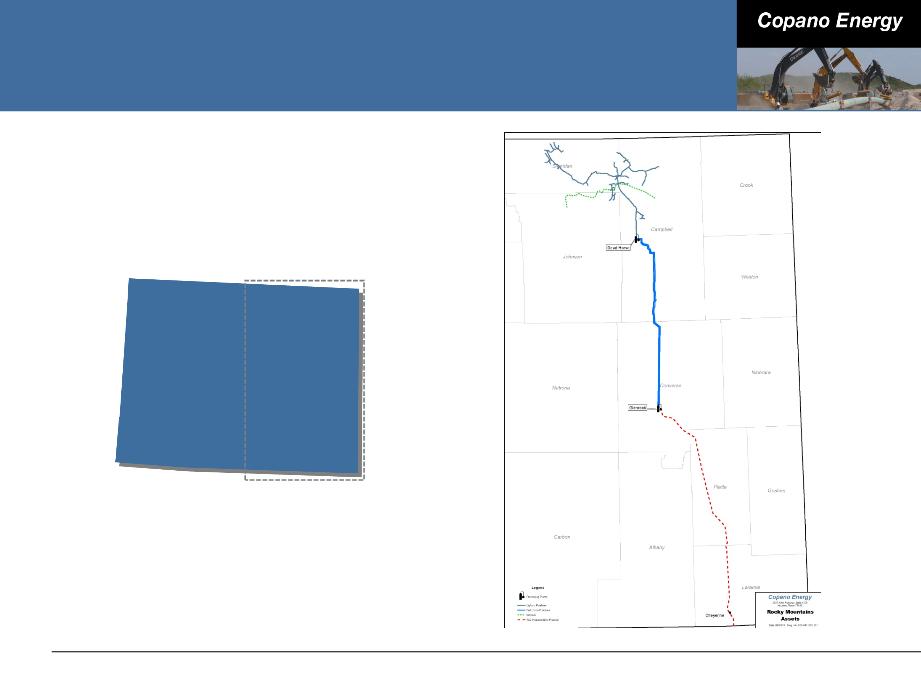
Rocky Mountains Assets
33
WYOMING
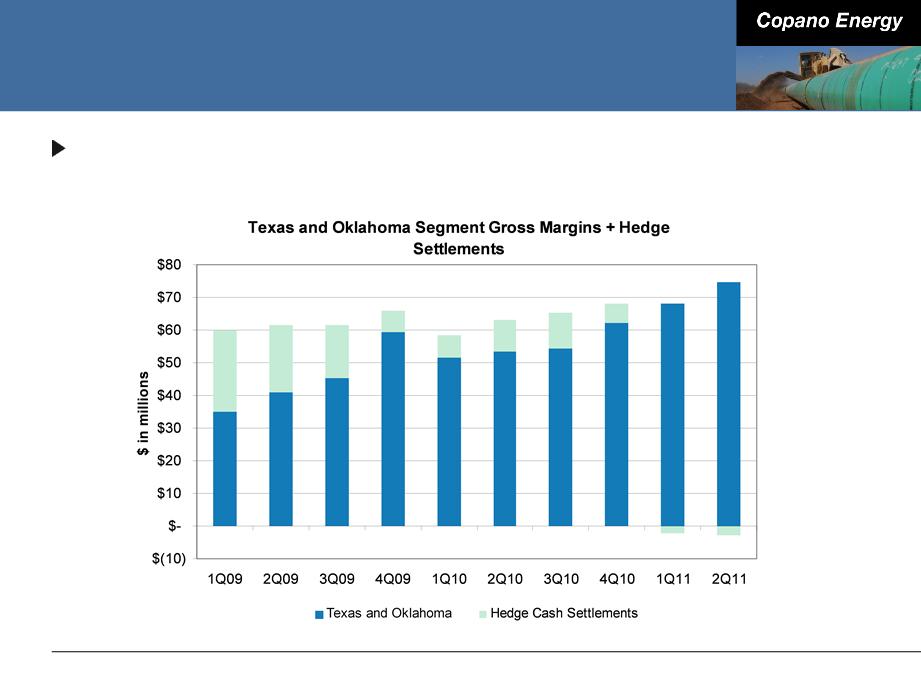
Solid Core Business Growth
34
From 1Q 2009 to 2Q 2011, Texas and Oklahoma operating
segment gross margins has increased approximately 114%
segment gross margins has increased approximately 114%
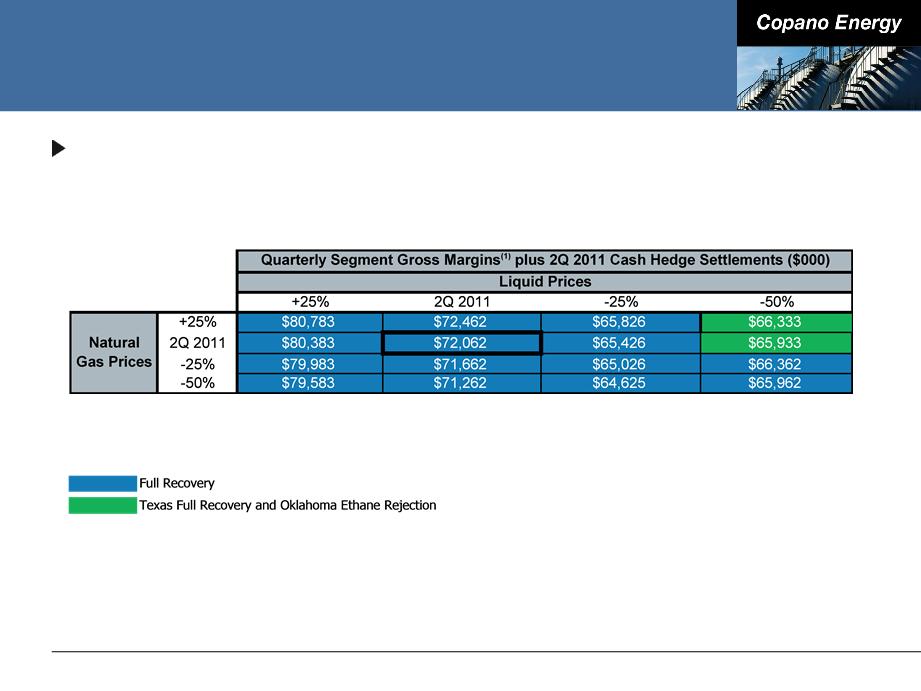
Commodity-Related Margin Sensitivities
Matrix reflects 2Q 2011 wellhead and plant inlet volumes, adjusted
using Copano’s 2011 planning model
using Copano’s 2011 planning model
35
(1) Consists of Texas and Oklahoma Segment gross margins.
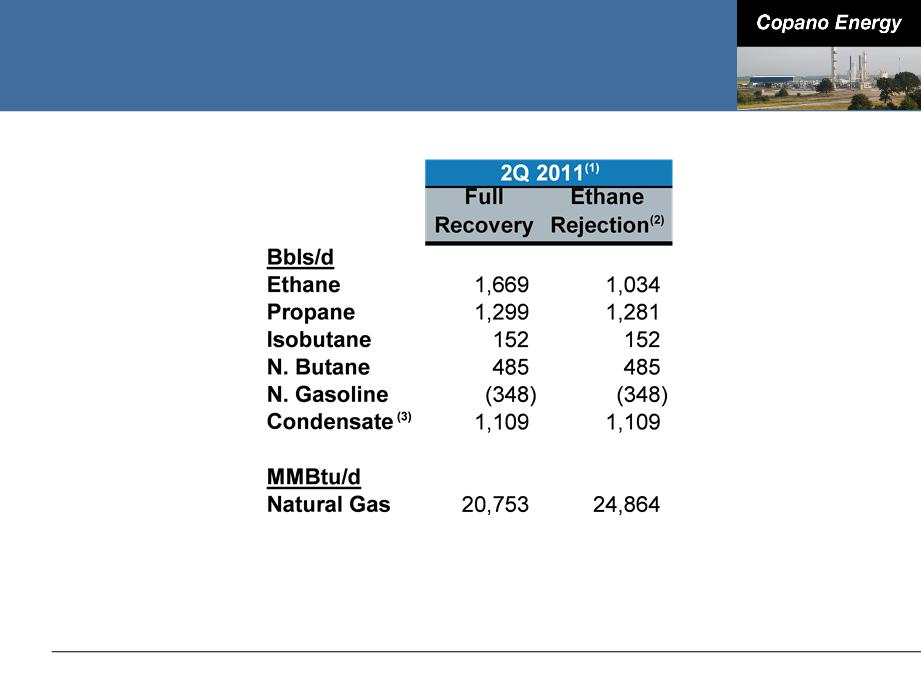
Oklahoma Net Commodity Exposure
36
Note: See explanation of processing modes in this Appendix. Values reflect rounding.
(1) Source: Copano Energy internal financial planning models.
(2) Ethane rejection at Paden plant is limited by nitrogen rejection facilities.
(3) Reflects impact of producer delivery point allocations, offset by field condensate collection and stabilization.
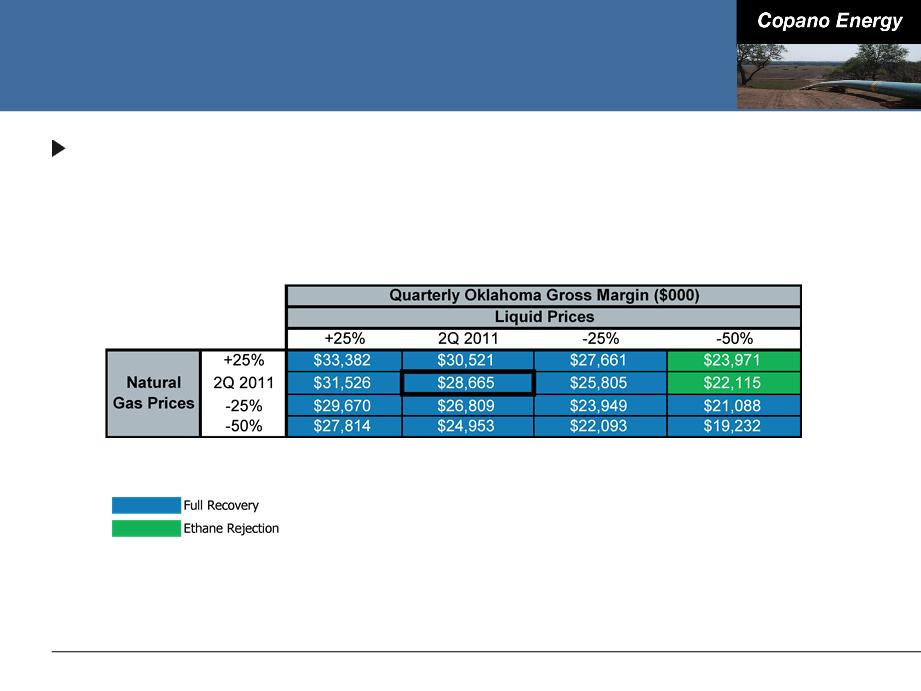
Oklahoma Commodity Price Sensitivities
Oklahoma segment gross margins excluding hedge settlements
■ Matrix reflects 2Q 2011 volumes, adjusted using Copano’s 2011 planning
model
model
37
Note: Please see this Appendix for definitions of processing modes and additional details.
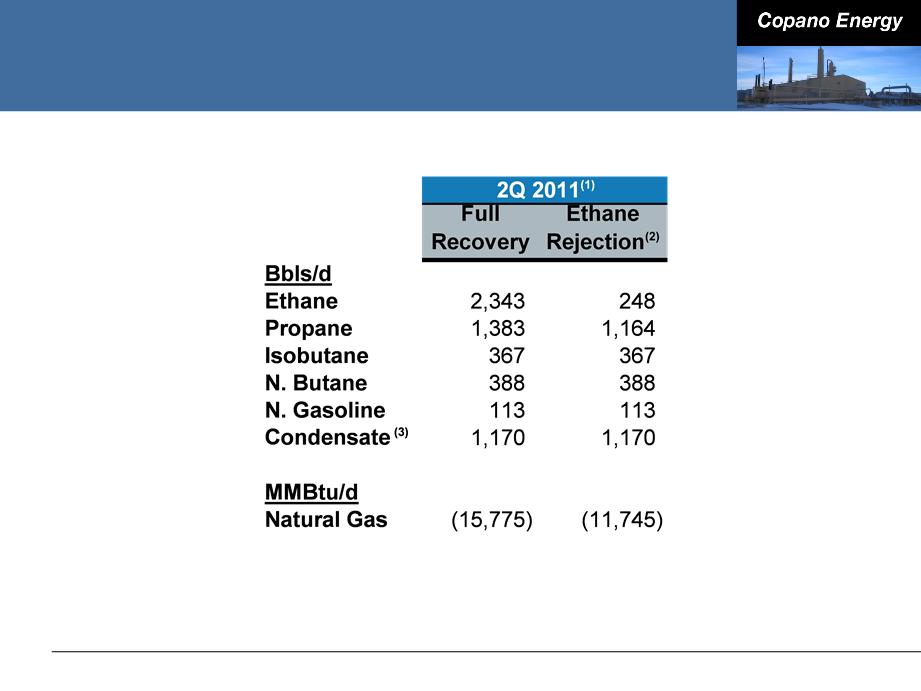
Texas Net Commodity Exposure
38
Note: See explanation of processing modes in this Appendix.
(1) Source: Copano Energy internal financial planning models. Based on 1Q 2011 daily wellhead/plant inlet volumes.
(2) Fractionation at Houston Central complex permits significant reductions in ethane recoveries in ethane rejection mode. To optimize profitability, plant
operations can also be adjusted to partial recovery mode.
operations can also be adjusted to partial recovery mode.
(3) At the Houston Central complex, pentanes+ may be sold as condensate.
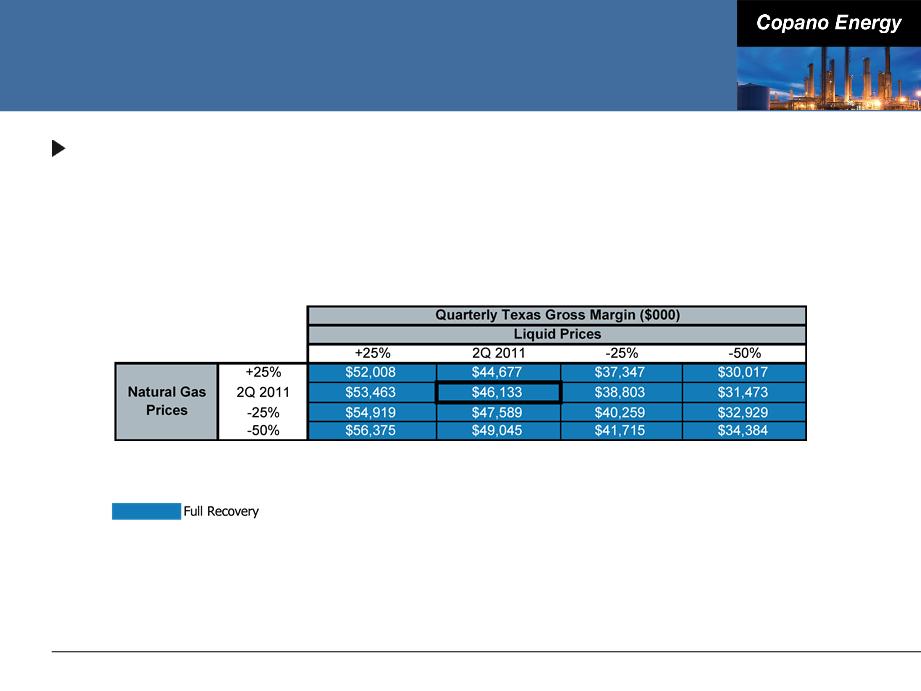
Texas Commodity Price Sensitivities
Texas segment gross margins excluding hedge settlements
■ Matrix reflects 2Q 2011 volumes and operating conditions, adjusted using
Copano’s 2011 planning model
Copano’s 2011 planning model
39
Note: Please see this Appendix for definitions of processing modes and additional details.

Rocky Mountains Sensitivities
2Q 2011 Adjusted EBITDA volume sensitivity (positive or negative
impact)
impact)
■ Bighorn: 10,000 MMBtu/d = $245,000(1)
■ Fort Union: 10,000 MMBtu/d = immaterial impact until physical volumes
exceed long-term contractual volume commitments
exceed long-term contractual volume commitments
● 2Q 2011 pipeline throughput: 391,626 MMBtu/d
● 2Q 2011 revenue based on 719,520 MMBtu/d of volume commitments
40
Note: See this Appendix for reconciliation of Adjusted EBITDA. Values reflect rounding.
(1) Impact on Adjusted EBITDA based on Copano’s interest in the unconsolidated affiliate.
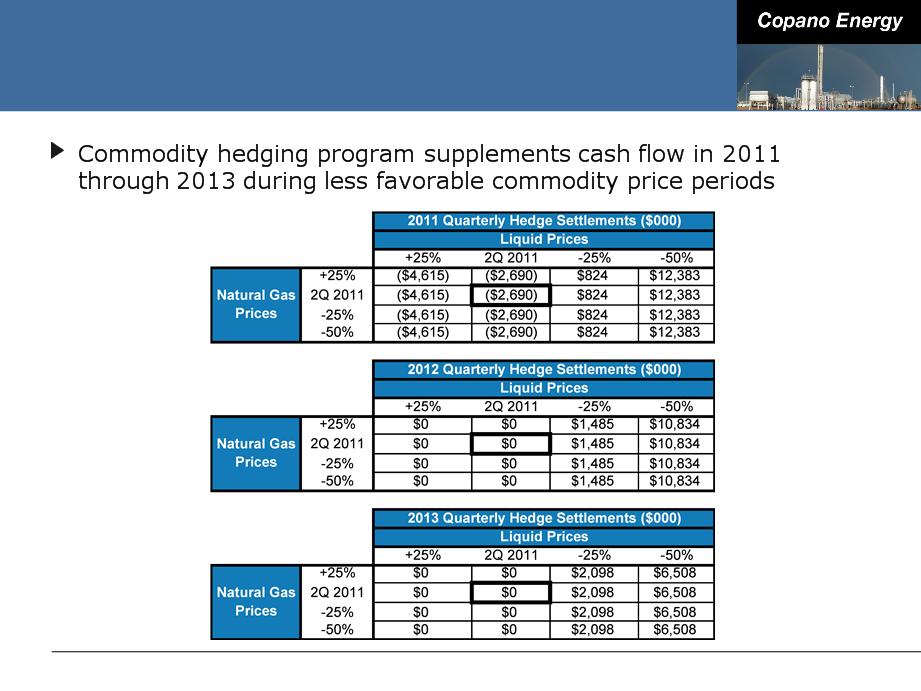
Hedging Impact of Commodity Price
Sensitivities
Sensitivities
41
Processing Modes
42
|
Full Recovery
|
|
|
|
Texas and Oklahoma - If the value of
recovered NGLs exceeds the fuel and gas shrinkage costs of recovering NGLs |
|
Ethane Rejection
|
|
|
|
Texas and Oklahoma - If the value of ethane
is less than the fuel and shrinkage costs to recover ethane (in Oklahoma, ethane rejection at Paden plant is limited by nitrogen rejection facilities) |
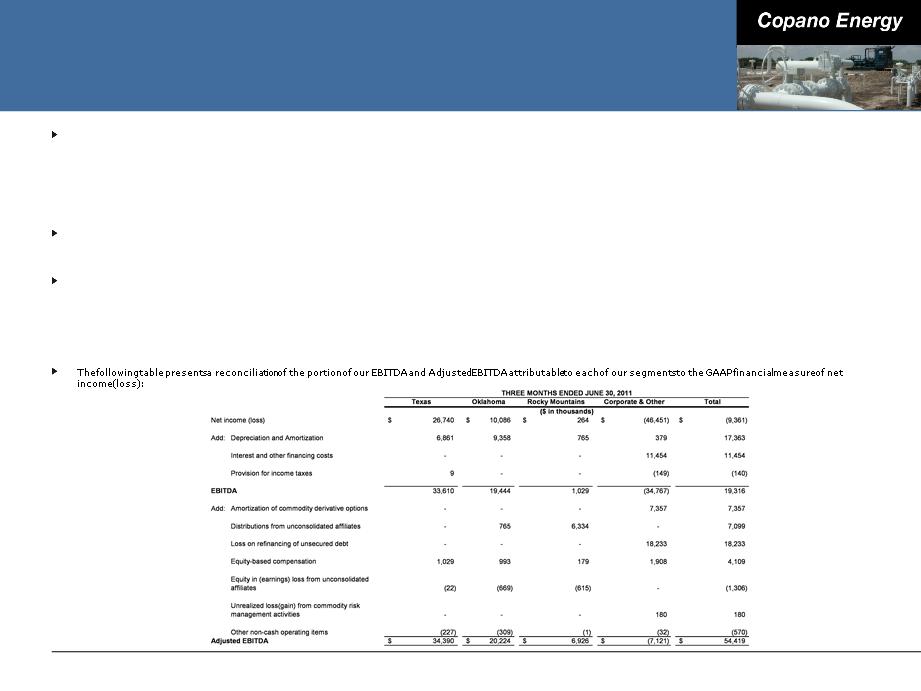
Reconciliation of Non-GAAP Financial
Measures
Measures
Adjusted EBITDA
Commencing with the second quarter of 2011, we revised our calculation of adjusted EBITDA to more closely resemble that of many of our peers in terms of measuring our
ability to generate cash. Our adjusted EBITDA (as revised) equals:
ability to generate cash. Our adjusted EBITDA (as revised) equals:
■ net income (loss);
■ plus interest and other financing costs, provision for income taxes, depreciation, amortization and impairment expense, non-cash amortization expense associated with
our commodity derivative instruments, distributions from unconsolidated affiliates, loss on refinancing of unsecured debt and equity-based compensation expense;
our commodity derivative instruments, distributions from unconsolidated affiliates, loss on refinancing of unsecured debt and equity-based compensation expense;
■ minus equity in earnings (loss) from unconsolidated affiliates and unrealized gains (losses) from commodity risk management activities; and
■ plus or minus other miscellaneous non-cash amounts affecting net income (loss) for the period.
In calculating adjusted EBITDA as revised, we no longer add to EBITDA (earnings before interest taxes depreciation and amortization our share of the depreciation,
amortization and impairment expense and interest and other financing costs embedded in our equity in earnings (loss) from unconsolidated affiliates; instead we now add to
EBITDA (i) our impairment expense, and other non-cash amounts affecting net income (loss) for the period, (ii) non-cash amortization expense associated with our
commodity derivative instruments, (iii) loss on refinancing of unsecured debt and (iv) distributions from unconsolidated affiliates.
We believe that our revised calculation of adjusted EBITDA is a more effective tool for our management in evaluating our operating performance for several reasons. Although
our historical method for calculating adjusted EBITDA was useful in assessing the performance of our assets (including our unconsolidated affiliates) without regard to
financing methods, capital structure or historical cost basis, the prior calculation was not as useful in evaluating the core performance of our assets and their ability to
generate cash because adjustments for a number of non-cash expenses and other non-cash and non-operating items were not reflected in the calculation and the impact of
cash distributions from our unconsolidated affiliates was likewise not reflected. We believe that the revised calculation of adjusted EBITDA is more consistent with the method
and presentation used by many of our peers and will allow management and analysts to better evaluate our performance relative to our peer companies. Also, we believe
that the revised calculation more effectively represents what lenders and debt holders, as well as industry analysts and many of our unitholders, have indicated is useful in
assessing our core performance and outlook and comparing us to other companies in our industry.
43