Attached files
| file | filename |
|---|---|
| EX-31.2 - EX-31.2 - ASPEN TECHNOLOGY INC /DE/ | a2205352zex-31_2.htm |
| EX-32.1 - EX-32.1 - ASPEN TECHNOLOGY INC /DE/ | a2205352zex-32_1.htm |
| EX-31.1 - EX-31.1 - ASPEN TECHNOLOGY INC /DE/ | a2205352zex-31_1.htm |
| EX-23.2 - EX-23.2 - ASPEN TECHNOLOGY INC /DE/ | a2205352zex-23_2.htm |
Use these links to rapidly review the document
TABLE OF CONTENTS
Item 15. Exhibits and Financial Statement Schedules.
INDEX TO CONSOLIDATED FINANCIAL STATEMENTS
UNITED STATES
SECURITIES AND EXCHANGE COMMISSION
Washington, D.C. 20549
FORM 10-K
| (Mark One) | ||
ý |
ANNUAL REPORT PURSUANT TO SECTION 13 OR 15(d) OF THE SECURITIES EXCHANGE ACT OF 1934 |
|
For the fiscal year ended June 30, 2011 |
||
or |
||
o |
TRANSITION REPORT PURSUANT TO SECTION 13 OR 15(d) OF THE SECURITIES EXCHANGE ACT OF 1934 |
|
For the transition period from to |
||
Commission file number: 0-24786
Aspen Technology, Inc.
(Exact name of registrant as specified in its charter)
| Delaware (State or other jurisdiction of incorporation or organization) |
04-2739697 (I.R.S. Employer Identification No.) |
|
200 Wheeler Road Burlington, Massachusetts (Address of principal executive offices) |
01803 (Zip Code) |
Registrant's telephone number, including area code: 781-221-6400
Securities
registered pursuant to Section 12(b) of the Act:
None
Securities
registered pursuant to Section 12(g) of the Act:
Common stock, $0.10 par value per share
Indicate by check mark if the registrant is a well-known seasoned issuer, as defined in Rule 405 of the Securities Act. Yes o No ý
Indicate by check mark if the registrant is not required to file reports pursuant to Section 13 or Section 15(d) of the Act. Yes o No ý
Indicate by check mark whether the registrant: (1) has filed all reports required to be filed by Section 13 or 15(d) of the Securities Exchange Act of 1934 during the preceding 12 months (or for such shorter period that the registrant was required to file such reports), and (2) has been subject to such filing requirements for the past 90 days. Yes ý No o
Indicate by checkmark whether the registrant has submitted electronically and posted on its corporate Web site, if any, every Interactive Data File required to be submitted and posted pursuant to Rule 405 of Regulation S-T (§232.405 of this chapter) during the preceding 12 months (or for such shorter period that the registrant was required to submit and post such files). Yes o No o
Indicate by check mark if disclosure of delinquent filers pursuant to Item 405 of Regulation S-K (§229.405 of this chapter) is not contained herein, and will not be contained, to the best of the registrant's knowledge, in definitive proxy or information statements incorporated by reference in Part III of this Form 10-K or any amendment to this Form 10-K. ý
Indicate by check mark whether the registrant is a large accelerated filer, an accelerated filer, a non-accelerated filer, or a smaller reporting company. See the definitions of "large accelerated filer," "accelerated filer" and "smaller reporting company" in Rule 12b-2 of the Exchange Act.
| Large accelerated filer ý | Accelerated filer o | Non-accelerated filer o (Do not check if a smaller reporting company) |
Smaller reporting company o |
Indicate by check mark whether the registrant is a shell company (as defined in Rule 12b-2 of the Act). Yes o No ý
As of December 31, 2010, the aggregate market value of common stock (the only outstanding class of common equity of the registrant) held by non-affiliates of the registrant was $981,809,000 based on a total of 77,307,796 shares of common stock held by non-affiliates and on a closing price of $12.70 on December 31, 2010 for the common stock as reported on The NASDAQ Global Select Market.
There were 94,012,219 shares of common stock outstanding as of August 15, 2011.
DOCUMENTS INCORPORATED BY REFERENCE
Portions of the registrant's Proxy Statement related to its 2011 Annual Meeting of Stockholders to be filed with the Securities and Exchange Commission pursuant to Regulation 14A not later than 120 days after the end of the fiscal year covered by this Form 10-K are incorporated by reference in Part III, Items 10-14 of this Form 10-K.
Our registered trademarks include aspenONE, Aspen Plus, AspenTech, the AspenTech logo, DMCplus, HTFS, HYSYS and INFOPLUS.21. Aspen Basic Engineering, Aspen Collaborative Demand Manager, Aspen Economic Evaluation, Aspen Exchanger Design and Rating, Aspen Fleet Optimizer, Aspen Inventory Management & Operations Scheduling, Aspen Petroleum Scheduler, Aspen Petroleum Supply Chain Planner, Aspen PIMS, Aspen Plus and Aspen Supply Chain Planner are our trademarks. All other trademarks, trade names and service marks appearing in this Form 10-K are the property of their respective owners.
2
SPECIAL NOTE REGARDING FORWARD-LOOKING STATEMENTS AND INDUSTRY DATA
This Form 10-K contains "forward-looking statements" within the meaning of Section 27A of the Securities Act of 1933 and Section 21E of the Securities Exchange Act of 1934. Forward-looking statements relate to future events or our future financial performance. We generally identify forward- looking statements by terminology such as "anticipate," "believe," "could," "estimate," "expect," "intend," "may," "potential," "should," "target," or the negative of these terms or other similar words. These statements are only predictions. The outcome of the events described in these forward-looking statements is subject to known and unknown risks, uncertainties and other factors that may cause our, our customers' or our industry's actual results, levels of activity, performance or achievements expressed or implied by these forward-looking statements, to differ. "Item 1. Business," "Item 1A. Risk Factors" and "Item 7. Management's Discussion and Analysis of Financial Condition and Results of Operations" as well as other sections in this Form 10-K, discuss some of the factors that could contribute to these differences. The forward-looking statements made in this Form 10-K relate only to events as of the date on which the statements are made. We undertake no obligation to update any forward- looking statement to reflect events or circumstances after the date on which the statement is made or to reflect the occurrence of unanticipated events. Our forward-looking statements do not reflect the potential impact of any future acquisitions, mergers, dispositions, joint ventures or investments we may make.
This Form 10-K also contains estimates and other information concerning our industry, including market size and growth rates that are based on industry publications, surveys and forecasts, including those generated by ARC Advisory Group. This information involves a number of assumptions and limitations, and you are cautioned not to give undue weight to these estimates. Although we believe the information in these industry publications, surveys and forecasts is reliable, we have not independently verified the accuracy or completeness of the information. The industry in which we operate is subject to a high degree of uncertainty and risk due to variety of factors, including those described in "Item 1A. Risk Factors."
Overview
We are a leading global provider of mission-critical process optimization software solutions, which are designed to manage and optimize plant and process design, operational performance, and supply chain planning. Our aspenONE software and related services have been developed specifically for companies in the process industries, including the energy, chemicals, engineering and construction, and pharmaceutical industries. Customers use our solutions to improve their competitiveness and profitability by increasing throughput and productivity, reducing operating costs, enhancing capital efficiency, and decreasing working capital requirements.
Our software incorporates our proprietary empirical models of manufacturing and planning processes and reflects the deep domain expertise we have amassed from focusing on solutions for the process industries for 30 years. We have developed our applications to design and optimize processes across three principal business areas: engineering, manufacturing and supply chain. We are a recognized market and technology leader in providing process optimization software for each of these business areas.
We have more than 1,500 customers globally. Our customers include manufacturers in process industries such as energy, chemicals, pharmaceuticals, consumer packaged goods, power, metals and mining, pulp and paper, and biofuels, as well as engineering and construction firms that help design and build process manufacturing plants. As of June 30, 2011, our installed base included 19 of the 20 largest petroleum companies, all of the 20 largest chemical companies, and 15 of the 20 largest
3
pharmaceutical companies. Customers outside the United States accounted for a majority of our total revenue in each of fiscal 2011, 2010 and 2009, and no single customer represented 10% or more of our total revenue in fiscal 2011, 2010 or 2009.
We have established sustainable competitive advantages based on the breadth, flexibility and return on investment associated with our software offerings, as well as our market leadership position, our extensive process industry expertise and our established, diversified customer base. We consult and collaborate with our customers to identify new applications which leads to innovative, targeted solutions and fosters long-term customer relationships. This approach has helped us develop software solutions that are embedded in our customers' operations and integrated with their core business processes.
In July 2009 we introduced our aspenONE subscription offering under which license revenue is recognized over the term of a license contract. Our aspenONE subscription offering provides customers with increased access to our applications and we believe this flexibility will lead to increased usage and revenue over time. Because we previously recognized a substantial majority of our license revenue upon shipment of software, our revenue for fiscal 2011and 2010 was significantly less than in the years preceding our licensing model change. We expect to recognize levels of revenue comparable to the years preceding our license model change when a significant majority of our existing arrangements has been renewed under our subscription-based licensing model. Customer collections are primarily driven by license and services billings on our portfolio of term arrangements, rather than recognized revenue. As a result, the transition to our subscription-based licensing model has not had an adverse impact on cash receipts, cash flows from operating activities or free cash flow.
Industry Background
The process industries consist of companies that typically manufacture finished products by applying a controlled chemical process either to a raw material that is fed continuously through the plant or to a specific batch of raw material. The process industries include energy, chemicals, pharmaceuticals, consumer packaged goods, power, metals and mining, pulp and paper, and biofuels as well as engineering and construction firms that design and build process manufacturing plants.
Process manufacturing is often complex because small changes in the feedstocks used, or to the chemical process applied, can have a significant impact on the efficiency and cost-effectiveness of manufacturing operations. As a result, process manufacturers, as well as the engineering and construction firms that partner with these manufacturers, have extensive technical requirements and need a combination of software, services and domain expertise to help design, operate and manage manufacturing environments. The unique characteristics associated with process manufacturing create special demands for business applications that frequently exceed the capabilities of generic software applications or non-process manufacturing software packages. The process industries require sophisticated, integrated software applications capable of designing and optimizing their complex, interconnected manufacturing and business processes.
Industry-Specific Challenges Facing the Process Industries
Companies in different process industries face specific challenges that are driving the need for solutions that design, operate and manage manufacturing environments more effectively:
- •
- Energy. Our energy markets are comprised of two primary
sectors: Exploration and Production, also called upstream, and Refining and Marketing, also called downstream:
- •
- Exploration and Production companies explore for and produce hydrocarbons. They are targeting reserves in increasingly diverse geographies with greater geological, logistical and political environments. They face challenges in designing and developing ever larger and
4
- •
- Refining and Marketing companies are characterized by high volumes and low operating margins. In order to deliver better
margins, they focus on optimizing feedstock selection and product mix, maximizing throughput, and minimizing inventory, all while operating safely and in accordance with regulations.
- •
- Chemicals. The chemicals industry includes both bulk and
specialty chemical companies:
- •
- Bulk chemical producers, which compete primarily on price, are seeking to achieve economies of scale and manage operating
margin pressure by building larger, more complex plants located near feedstock sources.
- •
- Specialty chemical manufacturers, which primarily manufacture highly differentiated customer-specific products, face
challenges in managing diverse product lines, multiple plants and complex supply chains.
- •
- Engineering and construction. Engineering and
construction firms must compete on a global basis in bidding on and executing complex, large-scale projects. They need a digital environment in which optimal plant designs can be produced quickly and
efficiently, incorporating highly accurate cost estimation technology. In addition, these projects require software that enables significant collaboration internally, with the manufacturer, and in
many cases, with other engineering and construction firms.
- •
- Pharmaceuticals. The increasing prevalence of generic drugs and expansion of regulatory requirements are driving pharmaceutical companies to improve their operational performance. They are seeking to optimize their manufacturing and distribution operations to help them meet demanding regulatory requirements, bring new products to market faster during their initial patent protection period and decrease production costs.
more complex and remote production, gathering and processing facilities as quickly as possible with the objective of optimizing production and ensuring regulatory compliance.
Similarly, companies in the consumer packaged goods, power, metals and mining, pulp and paper, and biofuels industries are seeking process optimization solutions that help them deliver improved financial and operating results in the face of varied process manufacturing challenges.
Increasing Complexity of the Process Industries
In addition to the technical requirements associated with the process industries, several industry trends are driving the growing complexity of these industries:
- •
- Globalization of markets. Process manufacturers are
expanding their operations beyond mature geographic markets in order to take advantage of growing demand and available feedstocks in emerging markets such as China, India, Russia, Latin America and
the Middle East. Process manufacturers must be able to design, build and operate plants in emerging markets efficiently and economically. They also need to improve efficiency and reduce costs at their
existing plants in mature markets in order to compete with new plants in emerging markets.
- •
- Volatile markets. Process manufacturers must react quickly
to frequent changes in feedstock prices, temporary or longer-term feedstock shortages, and rapid changes in finished product prices. Unpredictable commodity markets strain the
manufacturing and supply chain operations of process manufacturers, which must consider, and when appropriate implement, changes in inventory levels, feedstock inputs, equipment usage and operational
processes in order to remain competitive.
- •
- Increased margin pressure. As the result of the increasingly competitive global environment, process manufacturers are seeking to design more efficient new plants and, at the same time,
5
- •
- Shrinking engineering workforce. In mature markets, the
number of chemical engineers is decreasing, as more engineers are retiring than are entering the process industries. Process companies are seeking information technology solutions by which they can
capture and manage the knowledge acquired by their engineers through years of experience and can automate tasks traditionally performed by engineers.
- •
- Environmental and safety regulations. Process companies must comply with an expanding array of data maintenance and reporting requirements under governmental and regulatory mandates, and the global nature of their operations can subject them to numerous regulatory regimes. These companies often face heightened scrutiny and oversight because of the environmental, safety and other implications of their products and manufacturing processes. These companies increasingly are relying upon software applications to model potential outcomes, store operating data and develop reporting capabilities.
increase throughput and reduce costs at existing plants. These companies must optimize manufacturing operations and supply chain management, because even a relatively small change in feedstock, labor or energy costs, or in throughput, can have a significant impact on profitability.
Market Opportunity
Technology solutions historically have played a major role in helping companies in the process industries improve their manufacturing productivity. In the 1980's, process manufacturers implemented distributed control systems, or DCS, to automate the management of plant hardware. DCS use computer hardware, communication networks and industrial instruments to measure, record and automatically control process variables. In the 1990's, these manufacturers adopted enterprise resource planning, or ERP, systems to streamline back office functions and interact with DCS. This allowed process manufacturers to track, monitor and report the performance of each plant, rather than relying on traditional paper and generic word processing spreadsheets.
Many process manufacturers have implemented both DCS and ERP systems but have realized that their investments in hardware and back-office systems are inadequate. A DCS is only able to control and monitor processes based on fixed sets of parameters and cannot dynamically react to changes in the manufacturing process unless instructed by end users. ERP systems can only record what is produced in operations. Although DCS and ERP systems help manage manufacturing performance, neither of these systems can optimize what is produced, how it is produced or where it is produced. Moreover, neither can help a process manufacturer understand how to improve its processes or how to identify opportunities to decrease operating expenses.
Process optimization software addresses the gap between DCS and ERP systems. This software focuses on optimizing the manufacturing process itself: how the process is run and the economics of that process. By connecting DCS and ERP systems with intelligent, dynamic applications, process optimization software allows a manufacturer to make better, faster economic decisions. This software can optimize a manufacturing environment by, for example, incorporating process manufacturing domain knowledge, supporting real-time decision making, and providing the ability to forecast and simulate potential actions. Furthermore, these solutions can optimize the supply chain by helping a manufacturer to understand the operating conditions in each plant, which enables a manufacturer to decide where best to manufacture products.
Based on information and reports from ARC Advisory Group, the market for engineering, manufacturing and supply chain process optimization software and services for the energy, chemicals
6
and pharmaceuticals industries was approximately $2.5 billion. More specifically, based on this information, it is estimated that:
- •
- the engineering market was $585 million in 2010 and will grow 10% annually through 2015
- •
- the manufacturing market was $1.7 billion in 2008 and will grow 12% annually through 2013; and
- •
- the supply chain market was $279 million in 2008 and will grow 5% annually through 2013.
aspenONE Solutions
We provide integrated process optimization software solutions designed and developed specifically for the process industries. Customers use our solutions to improve their competitiveness and profitability by increasing throughput and productivity, reducing operating costs, enhancing capital efficiency, and decreasing working capital requirements. Our aspenONE software applications are organized into two suites, which are centered on our principal business areas of engineering, manufacturing and supply chain:
- •
- aspenONE Engineering. Our engineering software is used on
an engineer's desktop to design new plants, re-design existing plants, and simulate and optimize plant processes.
- •
- aspenONE Manufacturing and Supply Chain. Our manufacturing software is designed to optimize day-to-day processing activities, enabling process manufacturers to make better, more profitable decisions and to improve plant performance. Our supply chain management software is designed to enable process manufacturers to reduce inventory levels, increase asset efficiency and optimize supply chain decisions.
While a significant number of our customers have already migrated to our aspenONE subscription offering, we continue to offer customers the ability to purchase our applications as point products. By offering point products, we can acquire, retain and potentially up-sell any customer that does not want to migrate to our aspenONE subscription offering.
We offer customer support, professional services and training services to our customers. Under our aspenONE subscription offering, and for point product arrangements entered into since July 2009, maintenance is included for the term of the arrangement. Professional services are offered to customers as a means to further customize and integrate our technology based on specific customer requirements.
The key benefits of our aspenONE solutions include:
Broad and comprehensive software suites. We believe we are the only software provider that has developed comprehensive suites of software applications addressing the engineering, manufacturing and supply chain requirements of process manufacturers. While some competitors offer solutions in one or two principal business areas, no other vendor can match the breadth of our aspenONE offerings. In addition, we have developed an extensive array of software applications that address extremely specific and complex industry and end user challenges, such as production scheduling for petroleum companies and solubility modeling for solvent screening.
Mission-critical, integrated software solutions. aspenONE provides a standards-based framework that integrates applications, data and models within each of our software suites. Process manufacturers seeking to improve their mission-critical business operations can use the integrated software applications in the aspenONE Manufacturing and Supply Chain suite to support real-time decision making both for individual production facilities and across multiple sites. In addition, the common data models underlying an aspenONE suite improve collaboration and productivity by enabling data to be entered once and then maintained in a centralized repository accessible across a customer's enterprise.
7
Flexible commercial model. Our aspenONE subscription offering provides a customer with access to all of the applications within the aspenONE suite(s) the customer licenses. The customer can change or alternate the use of multiple applications in a licensed suite through the use of exchangeable units of measurement, or tokens, licensed in quantities determined by the customer. This enables the customer to use those applications whenever required and to experiment with different applications to best solve whatever critical business challenges the customer faces. The customer can easily increase its usage of our software as its business requirements evolve, without disrupting its business processes.
Hardware-independent technology. Our software can be easily integrated and used with equipment manufactured by any major process manufacturing hardware vendor. Because of our hardware-independent approach, customers can use our software solutions to create a unified view of their operations, even if their plants use hardware from different vendors.
Our Competitive Strengths
We believe our key competitive advantages include, in addition to the comprehensive breadth of our integrated software solutions and the flexibility of our aspenONE subscription offering, the following:
Market leadership. We are a leader in each of the markets addressed by our software. Based on information presented in reports issued by ARC Advisory Group relating to performance in our core industries, we ranked:
- •
- #1 in the market addressed by our engineering software;
- •
- #2 in the market addressed by our manufacturing software; and
- •
- #1 in the market addressed by our supply chain software.
Industry-leading innovation based on substantial process expertise. Over the past 30 years, we have designed a number of major process engineering advances considered to be industry-standard applications. Since our founding, we have built a highly specialized development organization comprised of not only traditional software engineers but also chemical engineers. As of June 30, 2011, approximately 50% of our software development personnel had degrees in chemical engineering or a similar discipline. This approach provides us with substantial process industry expertise, as our developers have critical know-how that allows us to address the specific challenges of our customers.
Rapid, high return on investment. Many customers purchase our software because they believe it will provide rapid, demonstrable and significant returns on their investment. For some customers, cost reductions in the first year following installation have exceeded the total cost of our software. For many customers, even a relatively small improvement in productivity can generate substantial recurring benefits due to the large production volumes and limited profit margins typical in process industries. In addition, our solutions can generate organizational efficiencies and operational improvements that can further increase a process company's return on investment.
Established, diversified customer base. We view our installed customer base of more than 1,500 customers as an important strategic asset and as evidence of our leadership position. As of June 30, 2011, our installed base included 19 of the 20 largest petroleum companies, all of the 20 largest chemical companies, and 15 of the 20 largest pharmaceutical companies. We consult and collaborate with customers to identify new applications, which leads to innovative, targeted solutions, long-term customer relationships and high renewal rates.
8
Growth Strategy
Our objective is to further establish and extend our position as a leading global provider of process optimization software and related services to the process industries. We intend to build upon our market and technology leadership position by pursuing the following:
Continue to provide innovative, market-leading solutions. We have pioneered a number of industry standard and award-winning software applications. For example, AspenPlus, our process modeling tool for the chemicals industry, has won the Chemical Processing magazine Readers' Choice Award for "Process Simulation Software" for the last seven years. We have been recognized by R&D Magazine for innovation in out of the box modeling capabilities that we developed with the National Institute of Standards and Technology. Our recent innovations include applications for electrolyte and biofuel characterizations and methodologies for carbon management. We intend to continue to invest in research and development in order to develop and offer new and enhanced solutions for our aspenONE suites.
Further penetrate existing customer base. We have an installed base of over 1,500 customers, but many customers do not use all of our products and services. We intend to target customers that use only one of our aspenONE suites or that do not extensively utilize our professional services and training capabilities. In addition, we believe that many of our customers do not take full advantage of the applications in the aspenONE suite they currently license. As we transition these customers to our aspenONE subscription offering, we will seek to identify ways in which they can improve their business processes by using the entire licensed suite of aspenONE applications, both at an individual user level and across all of their plant locations.
Expand presence in emerging markets. Companies in the process industries are expanding their operations to take advantage of growing demand and available feedstocks in less mature markets such as China, India, Russia, Latin America and the Middle East. Additionally, process manufacturers with existing plants in these markets are beginning to recognize the value of upgrading their operations to take advantage of process optimization solutions. We historically have derived a significant portion of our total revenue from outside of North America, and we believe we can further extend our international presence by penetrating emerging markets. We have, for example, established a direct sales force and customer support capabilities for Russia and the Middle East.
Extend vertical reach and indirect sales channel. We historically focused on the energy, chemicals, and engineering and construction industries and in recent years have increasingly targeted the pharmaceutical industry. We intend to expand beyond our core vertical industries, in part by further developing our indirect channel. We are expanding our relationships with third-party resellers that have a presence in certain non-core verticals such as power, consumer packaged goods, pulp and paper, minerals and mining, and biofuels. We believe these relationships will enable us to reach companies in additional process industries cost effectively and to leverage our indirect channel partners' market experience and domain expertise in those industries.
Products
Our integrated process optimization software solutions are designed and developed specifically for the process industries. Customers use our solutions to improve their competitiveness and profitability by increasing throughput and productivity, reducing operating costs, enhancing capital efficiency, and decreasing working capital requirements.
9
We have designed and developed our software applications across three principal business areas:
- •
- Engineering. Process manufacturers must address a variety
of challenges related to strategic planning, collaborative engineering, economic evaluation, debottlenecking and operational improvement. They must, for example, determine where they should locate
facilities, how they can lower manufacturing costs, what they should produce and how they can maximize plant efficiency. Our engineering software applications are used during both the design and the
ongoing operation of plant facilities to model and improve the way engineers develop and deploy manufacturing assets. In the design phase, for example, our software supports proposal generation,
develops highly accurate cost estimates, generates detailed implementation schedules and manages change orders. Our engineering solutions include desktop and server applications that typically do not
require substantial professional services, although services may be provided for customized model designs and process synthesis.
- •
- Manufacturing. Process manufacturers must address a wide
range of manufacturing challenges such as optimizing execution efficiency, reducing costs, selecting the right raw materials, scheduling and coordinating production processes, and identifying an
appropriate balance between turnaround times, delivery schedules, cost and inventory. Our manufacturing software products focus on optimizing day-to-day processing activities,
enabling customers to make better, faster decisions that lead to improved plant performance and operating results. These solutions include desktop and server applications that help customers make
real-time decisions, which can reduce fixed and variable costs and improve product yields.
- •
- Supply chain management. Process manufacturers must address numerous challenges as they strive to effectively and efficiently manage raw materials inventory, production schedules and feedstock purchasing decisions. Supply chain managers face these challenges in an environment of ever-changing market prices, supply constraints and customer demands. Our supply chain management solutions include desktop and server applications that help customers optimize critical supply chain decisions in order to reduce inventory, increase asset efficiency, and respond more quickly to changing market conditions.
Our software products can be linked with a customer's DCS and ERP systems to further improve the customer's ability to gather, analyze and use the resulting information across the customer's business processes. By integrating our solutions with their DCS and ERP systems, customers can utilize historical data and develop new models to project and simulate future operational behavior, throughput performance, economic value and profitability.
Our software applications are organized into two suites: aspenONE Engineering and aspenONE Manufacturing and Supply Chain. These suites are integrated applications that allow end users to utilize common data models to design process manufacturing environments, forecast and simulate potential actions, monitor operational performance, and manage planning and scheduling activities. The
10
two suites are designed around core modules and applications that allow customers to design, manage and operate their process manufacturing environments, as shown below:
Business Area
|
aspenONE Module | Major Products | Product Descriptions | |||
|---|---|---|---|---|---|---|
| Engineering | Engineering | Aspen Plus | Process modeling software for conceptual design, optimization and performance monitoring for the chemicals industry | |||
| Aspen HYSYS | Process modeling software for conceptual design, optimization and performance monitoring for the energy industry | |||||
| Aspen Basic Engineering | Workflow tool that allows engineers to build, re-use and share process models and data | |||||
| Aspen Economic Evaluation | Economic evaluation software for estimating costs of conceptual process designs | |||||
| Aspen Exchanger Design and Rating | Software used to design, simulate and optimize the performance of heat exchangers |
aspenONE Manufacturing and Supply Chain
Business Area
|
aspenONE Module | Major Products | Product Descriptions | |||
|---|---|---|---|---|---|---|
| Manufacturing | Production Management & Execution | Aspen InfoPlus.21 | Data historian software that collects and stores large volumes of data for analysis and reporting | |||
| Advanced Process Control | Aspen DMCplus | Multi-variable controller software capable of processing multiple constraints simultaneously | ||||
| Supply Chain | Planning & Scheduling | Aspen Collaborative Demand Manager | Enterprise solution for forecasting market demand | |||
| Aspen Petroleum Scheduler | Integrated system that supports comprehensive scheduling and optimization of refinery activities | |||||
| Aspen PIMS | Enterprise planning software that optimizes feedstock evaluation, product slate and operational execution | |||||
| Aspen Plant Scheduler | Plant scheduling software that optimizes production scheduling | |||||
| Aspen Supply Chain Planner | Software for determining what to produce given product demands, inventory, and manufacturing and distribution constraints | |||||
| Supply & Distribution | Aspen Inventory Management & Operations Scheduling | Enterprise solution that allows users to manage their supply and demand balancing, inventory and scheduling | ||||
| Aspen Petroleum Supply Chain Planner | Economic planning tool that solves multi-commodity, multi-period transportation optimization problems | |||||
| Aspen Fleet Optimizer | Enterprise solution for inventory management and truck transportation optimization |
Our product development activities are currently focused on strengthening the integration of our applications and adding new capabilities that address specific mission-critical operational business
11
processes in each industry. As of June 30, 2011, we had a total of 411 employees in our research and development group, which is comprised of software development, product development and quality assurance personnel. We incurred research and development expense of $50.8 million in fiscal 2011, $48.2 million in fiscal 2010 and $46.4 million in fiscal 2009.
Maintenance and Training
Maintenance consists primarily of providing customer technical support and access to software fixes and upgrades. For term arrangements entered into subsequent to our transition to a subscription-based licensing model, the license and software maintenance and support, or SMS, components cannot be separated, and SMS is included for the term of the arrangement. Customer technical support services are provided throughout the world by our three global call centers as well as via email and through our support website.
We offer a variety of training solutions ranging from standardized training, which can be delivered in a public forum, on-site at a customer's location or over the Internet, to customized training sessions, which can be tailored to fit customer needs. As of June 30, 2011, we had a total of 147 employees in our customer support and training group.
Professional Services
We offer professional services focused on implementation of our solution. Our professional services team primarily consists of project engineers with degrees in chemical engineering or a similar discipline, or who have significant relevant industry experience. Our employees include experts in fields such as thermophysical properties, distillation, adsorption processes, polymer processes, industrial reactor modeling, the identification of empirical models for process control or analysis, large-scale optimization, supply distribution systems modeling and scheduling methods. The services provided by our professional services team include implementing and integrating our software applications for customers that are seeking to integrate our technology with their existing systems in order to further improve their plant performance and gain better operational data. We offer our services on either a time-and-material or fixed-price basis. As of June 30, 2011, we had a total of 165 employees in our professional services group.
Business Segments
We have three operating segments: license, professional services, and maintenance and training. Our chief operating decision maker, the President and Chief Executive Officer, assesses financial performance and allocates resources based upon the three lines of business. For further information of our operating segments, see Note 15, "Segment and Geographic Information," to our Consolidated Financial Statements, included in "Item 15. Exhibits and Financial Statement Schedules" of this Form 10-K.
12
Customers
Our software solutions are installed at the facilities of more than 1,500 customers worldwide. These customers include process manufacturers and the engineering and construction firms that provide services to them. Our customers include:
| Energy | Chemicals | Pharmaceutical | ||
|---|---|---|---|---|
| BP International Ltd | Air Liquide | Bayer Technology Services GmbH | ||
| Exxon Mobil Corporation | BASF | Eli Lilly & Company | ||
| Flint Hills Resources, LLC | China Petrochemical International Co. Ltd | Pfizer, Inc. | ||
| Instituto Mexicano del Petroleo (PEMEX) | The Dow Chemical Company | |||
| Marathon Oil Corporation | INEOS | Other | ||
| Occidential Petroleum Corporation | Lyondell Basell Industries | Cargill, Incorporated | ||
| OMV Group | Mitsubishi Chemical USA, Inc. | Lafarge North America Inc. | ||
| Petróleos de Venezuela S.A. (PDVSA) | Saudi Basic Industries Corp (SABIC) | |||
| Repsol YPF, S.A. | Suid Afrikaanse Steenkool en Olie (Sasol) | |||
| Saudi Arabian Oil Co. (SaudiAramco) | ||||
| Shell Oil Company | Engineering and Construction | |||
| Statoil ASA | The Bechtel Group, Inc. | |||
| Suncor Energy Inc. | Jacobs Engineering Group Inc. | |||
| Total S.A | KBR, Inc. | |||
| Valero Energy Corp. | Technip SA | |||
| Técnicas Reunidas, S.A. | ||||
| WorleyParsons Limited |
No customer accounted for 10% or more of our total revenue in fiscal 2011, 2010 or 2009.
Sales and Marketing
We employ a value-based sales approach, offering our customers a comprehensive suite of software and services that enhance the efficiency and productivity of their engineering, manufacturing and supply chain operations. We have increasingly focused on selling our products as a strategic investment for our customers and therefore devote an increasing portion of our sales efforts at senior management levels, including senior decision makers in manufacturing, operations and technology. Our aspenONE solution strategy supports this value-based approach by broadening the scope of optimization across the entire enterprise and expanding the use of process models in the operations environment. In particular, we offer a variety of training programs focused on illustrating the capabilities of our applications and intend to implement incentive compensation programs for our sales force that will reward efforts that increase customer usage of our products.
Historically, most of our license sales have been generated through our direct sales force. Because the complexity and cost of our products often result in extended sales cycles, we believe that the development of long-term, consultative relationships with our customers is essential to a successful sales strategy. To develop these relationships, we focus our worldwide sales force on a defined set of strategic accounts. In North America we have organized our sales force around specific vertical markets. In the rest of the world the sales force is organized around specific countries or regions.
In July 2009 we introduced our aspenONE subscription offering under which customers receive access to all of the applications within the aspenONE suite(s) they license. This affords customers the ability to use our software whenever required and to experiment with different applications to best solve whatever critical business challenges they face. Customers can easily increase their usage of our software as their business requirements evolve, without disrupting their business processes. We believe our aspenONE subscription offering will further enable our sales force to develop consultative sales relationships with our customers.
In order to market the specific functionality and other complex technical features of our software, our account managers work with specialized teams of technical sales engineers and product specialists organized for each sales and marketing effort. Our technical sales engineers typically have advanced
13
degrees in chemical engineering or related disciplines and actively consult with a customer's plant engineers. Product specialists share their detailed knowledge of the specific features of our software solutions as they apply to the unique business processes of different vertical industries. In addition, we have a limited number of global account managers, each of whom is focused on a specific global account. Our overall sales force, which consists of quota-carrying sales account managers, sales services personnel, business support engineers, internal channel support personnel, industry business unit professionals, marketing personnel and support staff, consisted of 328 employees as of June 30, 2011.
We supplement our direct sales efforts with a variety of marketing initiatives, including industry analyst and public relations activities, campaigns to promote awareness, user group meetings and customer relationship programs. We have established reseller relationships with select companies that we believe can help us increase sales in specific regions and non-core target markets.
We also license our software products to universities that agree to use our products in teaching and research. We believe that students' familiarity with our products will stimulate future demand once the students enter the workplace.
Competition
Our markets in general are highly competitive, and we expect the intensity of competition in our markets to increase as existing competitors enhance and expand their product and service offerings and as new participants enter the market. Increased competition may result in price reductions, reduced profitability and loss of market share. We cannot ensure that we will be able to compete successfully against existing or future competitors. Some of our customers and companies with which we have strategic relationships also are, or may become, competitors.
Many of our current and potential competitors have greater financial, technical, marketing, service and other resources than we have. As a result, these companies may be able to offer lower prices, additional products or services, or other incentives that we cannot match or offer. These competitors may be in a stronger position to respond more quickly to new technologies and may be able to undertake more extensive marketing campaigns. We believe they also have adopted and may continue to pursue more aggressive pricing policies and make more attractive offers to potential customers, employees and strategic partners. For example, some competitors may be able to initiate relationships through sales and installations of hardware and then seek to expand their customer relationships by offering process optimization software at a discount.
In addition, many of our competitors have established, and may in the future continue to establish, cooperative relationships with third parties to improve their product offerings and to increase the availability of their products in the marketplace. Competitors with greater financial resources may make strategic acquisitions to increase their ability to gain market share or improve the quality or marketability of their products.
Our primary competitors differ among our principal product areas:
- •
- Our engineering software competes with products of businesses such as ABB Ltd., Honeywell
International, Inc., Invensys plc and KBC Advanced Technologies plc.
- •
- Our manufacturing software competes with products of companies such as ABB Ltd., Honeywell
International, Inc., Invensys plc, OSIsoft, Inc., Rockwell Automation, Inc., Siemens AG and Yokogawa Electric Corporation.
- •
- Our supply chain management software competes with products of companies such as JDA Software Group, Inc., Oracle Corporation and SAP AG.
In addition, we face challenges in selling our solutions to large companies in the process industries that have internally developed their own proprietary software solutions.
14
We believe the key competitive differentiator in our industry is the value, or return on investment, that our software and services provide. We seek to develop and offer integrated suites of targeted, high-value vertical industry solutions that can be implemented with relatively limited service requirements. We believe this approach provides us with an advantage over many of our competitors that offer software products that are point solutions or are more service-based. The principal competitive factors in our industry also include:
- •
- breadth, depth and integration of software offerings;
- •
- domain expertise of sales and service personnel;
- •
- consistent global support;
- •
- performance and reliability;
- •
- price; and
- •
- time to market.
Key License Agreements
Massachusetts Institute of Technology
In March 1982, we entered into a System License Agreement with the Massachusetts Institute of Technology, or MIT, under which we received a worldwide, perpetual non-exclusive license (with the right to sublicense) to use, reproduce, distribute and create derivative works of the computer programs known as "ASPEN" and the related documentation. The ASPEN program licensed from MIT provides a framework for simulating the steady-state behavior of chemical processes that we utilize in the simulation engine for our Aspen Plus product. MIT has agreed that we would own any derivative works and enhancements of ASPEN that we may create during the term of the agreement. A one-time license fee of $30,000 has been paid in full. MIT has the right to terminate the agreement upon the occurrence of any of the following events: if we breach the agreement and do not cure the breach within 90 days after receiving a written notice from MIT; if we cease to carry on our business; if proceedings under any bankruptcy or insolvency law are commenced by or against us and not dismissed within 90 days; if we make an assignment for the benefit of our creditors and such assignment is not discontinued within 90 days; or if a receiver is appointed for us and is not discharged within 90 days. In the event of such termination, our license to ASPEN will terminate but the sublicenses granted to our customers prior to termination will remain in effect.
Honeywell
We acquired Hyprotech Ltd. and related subsidiaries of AEA Technology plc in May 2002. The Federal Trade Commission alleged in an administrative complaint filed in August 2003 that this acquisition was improperly anticompetitive. In December 2004, we entered into a consent decree with the FTC to resolve the matter. In connection with the consent decree, we and certain of our subsidiaries entered into a purchase and sale agreement with Honeywell International Inc. and certain of its subsidiaries, pursuant to which we sold intellectual property and other assets to Honeywell relating to our operator training business and our Hyprotech engineering software products.
Under the terms of the transactions:
- •
- we retained a perpetual, irrevocable, worldwide, royalty-free non-exclusive license (with the
limited rights to sublicense) to the Hyprotech engineering software and have the right to continue to develop and sell the Hyprotech engineering products; and
- •
- we retained certain agreements with third parties other than customers or distributors for HYSYS and related products.
15
We are subject to ongoing compliance obligations under the FTC consent decree. Under a modification order that became final in August 2009, we are required to continue to provide the ability for users to save input variable case data for Aspen HYSYS and Aspen HYSYS Dynamics software in a standard "portable" format, which will make it easier for users to transfer case data from later versions of the products to earlier versions. We also must provide documentation to Honeywell of the Aspen HYSYS and Aspen HYSYS Dynamics input variables, as well as documentation of the covered heat exchange products. These requirements will apply to all existing and future versions of the covered products released prior to December 31, 2014 or December 31, 2016, at the option of Honeywell. In addition, we provided to Honeywell a license to modify and distribute (in object code form) certain versions of our flare system analyzer software.
There is no assurance that the actions required by the FTC's modified order and related settlement with Honeywell will not provide Honeywell with additional competitive advantages that could materially adversely affect our results of operations.
Intellectual Property
We regard our software as proprietary. Our strategy is to rely on a combination of copyright, patent, trademark and trade secret laws in the United States and other jurisdictions, and to rely on license and confidentiality agreements and software security measures to further protect our proprietary technology and brand. The laws of many countries in which our products are licensed may not protect our intellectual property rights to the same extent as the laws of the United States.
We have obtained or applied for patent protection with respect to some of our intellectual property, but generally do not rely on patents as a principal means of protecting intellectual property. As of June 30, 2011 we owned 30 patents issued in the United States and had 16 patent applications pending in the United States and foreign counterparts.
We conduct business under our trademarks and use trademarks on some of our products. We believe that having distinctive marks may be an important factor in marketing our products. We have registered or applied to register some of our significant trademarks in the United States and in selected other countries. Although we have a foreign trademark registration program for selected marks, the laws of many countries protect trademarks solely on the basis of registration and we may not be able to register or use such marks in each foreign country in which we seek registration. We actively monitor use of our trademarks and have enforced, and will continue to enforce, our rights to our trademarks.
We rely on trade secrets to protect certain of our technology. We generally seek to protect these trade secrets by entering into non-disclosure agreements with our employees and customers, and historically have restricted access to our software and source code, which we regard as proprietary information. In certain cases, we have provided copies of code to customers for the purpose of special product customization or have deposited the source code with a third-party escrow agent as security for ongoing service and license obligations. In these cases, we rely on non-disclosure and other contractual provisions to protect our proprietary rights. Trade secrets may be difficult to protect, and it is possible that parties may breach their confidentiality agreements with us.
The steps we have taken to protect our proprietary rights may not be adequate to deter misappropriation of our technology or independent development by others of technologies that are substantially equivalent or superior to our technology. Any misappropriation of our technology or development of competitive technologies could harm our business. We could incur substantial costs in protecting and enforcing our intellectual property rights.
Third parties have asserted, and may assert in the future, claims that our products infringe patents or patent applications under which we do not hold licenses or other rights. Third parties may own or control these patents and patent applications in the United States and abroad. These third parties have
16
brought, and could in the future bring, claims against us that would cause us to incur substantial expenses and, if successfully asserted against us, could cause us to pay substantial damages. Further, if a patent infringement suit were brought against us, we could be forced to stop or delay manufacturing or sales of the product that is the subject of the suit before or after the suit is decided on the merits. In addition, we could be forced to redesign a product that uses an allegedly infringing technology. The cost to us of any patent litigation or other proceeding, even if resolved in our favor, could be substantial and may require significant commitments of time by our management.
We believe that the success of our business depends more on the quality of our proprietary software products, technology, processes and know-how than on trademarks, copyrights or patents. While we consider our intellectual property rights to be valuable, we do not believe that our competitive position in the industry is dependent simply on obtaining legal protection for our software products and technology. Instead, we believe that the success of our business depends primarily on our ability to maintain a leadership position by developing proprietary software products, technology, information, processes and know-how. Nevertheless, we attempt to protect our intellectual property rights with respect to our products and development processes through trademark, copyright and patent registrations, both foreign and domestic, whenever appropriate as part of our ongoing research and development activities.
Employees
As of June 30, 2011, we had a total of 1,269 full-time employees, of whom 683 were located in the United States. None of our employees is represented by a labor union, except for 9 employees of our subsidiary Hyprotech UK Limited who belong to the Prospect union for professionals. We have experienced no work stoppages and believe that our employee relations are satisfactory.
Corporate Information
Aspen Technology, Inc. was formed in Massachusetts in 1981 and reincorporated in Delaware in 1998. Our principal executive offices are at 200 Wheeler Road, Burlington, MA 01803, and our telephone number at that address is (781) 221-6400. Our website address is http://www.aspentech.com. The information on our website is not part of this Form 10-K, unless expressly noted.
Available Information
Our website address is http://www.aspentech.com. Information contained on our website is not incorporated by reference into this Form 10-K unless expressly noted. We file reports with the Securities and Exchange Commission, or the SEC, which we make available on our website free of charge. These reports include annual reports on Form 10-K, quarterly reports on Form 10-Q, current reports on Form 8-K and amendments to such reports, each of which is provided on our website as soon as reasonably practicable after we electronically file such materials with or furnish them to the SEC. You can also read and copy any materials we file with the SEC at the SEC's Public Reference Room at 100 F Street, N.E., Washington, DC 20549. You can obtain additional information about the operation of the Public Reference Room by calling the SEC at 1-800-SEC-0330. In addition, the SEC maintains a website (http://www.sec.gov) that contains reports, proxy and information statements, and other information regarding issuers that file electronically with the SEC, including us.
17
Investing in our common stock involves a high degree of risk. You should carefully consider the risks and uncertainties described below before purchasing our common stock. The risks and uncertainties described below are not the only ones facing our company. Additional risks and uncertainties may also impair our business operations. If any of the following risks actually occurs, our business, financial condition, results of operations or cash flows would likely suffer. In that case, the trading price of our common stock could fall, and you may lose all or part of your investment in our common stock.
Risks Related to Our Business
If we fail to develop new software products, enhance existing products and services, or penetrate new vertical markets, we will be unable to implement our growth strategy successfully and our business could be seriously harmed.
The maintenance and extension of our market leadership and our future growth is largely dependent upon our ability to develop new software products that achieve market acceptance with acceptable operating margins. Enterprises are requiring their application software vendors to provide greater levels of functionality and broader product offerings. We must continue to enhance our current product line and develop and introduce new products and services that keep pace with increasingly sophisticated customer requirements and the technological developments of our competitors. Our business and operating results could suffer if we cannot successfully respond to the technological advances of competitors, or if our new products or product enhancements and services do not achieve market acceptance.
We have implemented a product strategy that unifies our software solutions under the aspenONE brand with differentiated aspenONE vertical solutions targeted at specific process industry segments. We cannot ensure that our product strategy will result in products that will meet market needs and achieve significant market acceptance. If we fail to introduce new products that meet the demands of our customers or our target markets, or if we fail to penetrate new vertical markets in the process industries, our operating results and cash flows from operations will grow at a slower rate than we anticipate and our financial condition could suffer.
Our business could suffer if the demand for, or usage of, our aspenONE software declines for any reason.
Our aspenONE suites account for a significant majority of our revenue and will continue to do so for the foreseeable future. If demand for, or usage of, our software declines for any reason, our operating results, cash flows from operations and financial position would suffer. Our business could be adversely affected by:
- •
- any decline in demand for or usage of our aspenONE suites;
- •
- the introduction of products and technologies that serve as a replacement or substitute for, or represent an improvement
over, our aspenONE suites;
- •
- technological innovations that our aspenONE suites do not address; and
- •
- our inability to release enhanced versions of our aspenONE suites on a timely basis.
Our transition to a subscription-based licensing model has resulted in, and is expected to continue to result in, lower revenue and operating losses. The reversal of a significant portion of our U.S. valuation allowance resulted in us reporting net income for fiscal 2011. However, we expect to generate net losses for the next few years, as customers continue to transition to our subscription-based licensing model.
Our aspenONE subscription offering, which we introduced in July 2009, provides customers with access to all of the applications within the aspenONE suite or suites they license and includes SMS for
18
the term of the license contract. Prior to July 2009 we primarily recognized license revenue "upfront," upon shipment of software, on a net present value basis in the period in which a license contract was signed, not over the license term. Although our aspenONE subscription offering makes our license revenue less volatile, it is difficult for us to increase our license revenue rapidly through additional bookings in a period, as license revenue from new customers will be recognized over the applicable license term. Similarly, the full effect of a decline in bookings in any period would not be fully recognized in our revenue for that period, but would negatively affect revenue in subsequent quarters.
As a result of the transition to our aspenONE subscription offering and the inclusion of SMS for the term of our point product arrangements, our revenue for fiscal 2011 and 2010 was significantly less than the level achieved in the years preceding the licensing model change. The decrease in revenue levels following the introduction of our aspenONE subscription offering have not been accompanied by a corresponding reduction in operating expenses. As a result, the change to our subscription-based licensing model has, and will continue to, result in our reporting lower revenue and operating losses for the next few years.
As further discussed in Note 10 to our Consolidated Financial Statements, "Income Taxes," we reversed a significant portion of our U.S. valuation allowance in the fourth quarter of fiscal 2011, which resulted in us reporting net income in the current fiscal year. However, this reversal is a non-recurring item, and we expect to return to a pattern where we generate net losses for the next few years.
Our operating results may suffer if customers in the energy, chemicals, engineering and construction, or pharmaceuticals industries experience an economic downturn or other adverse events.
We derive a majority of our revenue from companies in the energy, chemicals, engineering and construction, and pharmaceutical industries. Accordingly, our future success depends upon the continued demand for process optimization software and related services by companies in these process industries. These industries are highly cyclical and highly reactive to the price of oil, as well as general economic conditions. Adverse changes in these industries could and have caused delays and reductions in information technology spending by our customers, which could lead to reductions, postponements or cancellations of customer purchases of our products and services and in turn could negatively impact our operating results.
Because of the nature of their products and manufacturing processes, companies in these process industries are subject to heightened risk of adverse or even catastrophic environmental, safety and health accidents or incidents. Further, our customers are often subject to ever-changing standards and regulations, and the global nature of their operations can subject them to numerous regulatory regimes. Legislation or regulations regarding these areas may require us to make rapid changes in our products and services, and our inability to effect those changes could adversely impact our revenue, operating margins and other operating results. Any of the foregoing types of events that affect our customers may adversely impact their operations and information technology spending, which could have an adverse effect on our operating results.
In addition, in the past, worldwide economic downturns and pricing pressures experienced by energy, chemical, pharmaceutical and other process industries have led to consolidations and reorganizations. These downturns, pricing pressures and reorganizations have caused delays and reductions in capital and operating expenditures by many of these companies. These delays and reductions have reduced demand for products and services like ours.
A recurrence of these industry patterns, including any recurrence that may occur in connection with current global economic events, as well as general domestic and foreign economic conditions and other factors that reduce spending by companies in these industries, could harm our operating results in the future. There is no assurance that customers may not seek bankruptcy or other similar relief
19
from creditors, fail to pay amounts due to us, or pay those amounts more slowly, any of which could adversely affect our results of operations.
Unfavorable economic and market conditions or a lessening demand in the market for process optimization software could adversely affect our operating results.
Our business is influenced by a range of factors that are beyond our control and difficult or impossible to predict. If the market for process optimization software grows more slowly than we anticipate, demand for our products and services could decline and our operating results could be impaired. Further, the state of the economy, which deteriorated in the 2008 broad recession, may deteriorate further in the future. Our operating results may be adversely affected by unfavorable global economic and market conditions as well as a lessening demand for process optimization software generally. Customer demand for our products is intrinsically linked to the strength of the economy. If weakness in the economies of the United States and other countries persists, many customers may delay or reduce technology purchases. This could result in reductions in sales of our products, longer sales cycles, slower adoption of new technologies, increased price competition or reduced use of our products by our customers. We will lose revenue if demand for our products is reduced because potential customers experience weak or deteriorating economic conditions, catastrophic environmental or other events and our business, results of operations, financial condition and cash flow from operations would likely be adversely affected.
The majority of our revenue and an increasing percentage of our operations are attributable to operations outside the United States, and our operating results therefore may be materially affected by the economic, political, regulatory and other risks of foreign operations.
As of June 30, 2011, we operated in 28 countries. We sell our products primarily through a direct sales force located throughout the world. In the event that we are unable to adequately staff and maintain our foreign operations, we could face difficulties managing our international operations.
Customers outside the United States accounted for a significant amount of our total revenue in fiscal 2011 and in fiscal 2010. We anticipate that revenue from customers outside the United States will continue to account for a significant portion of our total revenue for the foreseeable future. Our operations outside the United States are subject to additional risks, including:
- •
- unexpected changes in regulatory requirements, exchange rates, tariffs and other barriers;
- •
- political and economic instability and possible nationalization of property by governments without compensation to the
owners;
- •
- less effective protection of intellectual property;
- •
- requirements of foreign laws and other governmental controls;
- •
- difficulties and delays in translating products and product documentation into foreign languages;
- •
- difficulties and delays in negotiating software licenses compliant with accounting revenue recognition requirements in the
United States;
- •
- difficulties in collecting trade accounts receivable in other countries;
- •
- adverse tax consequences; and
- •
- the challenges of handling legal disputes in foreign jurisdictions.
20
Fluctuations in foreign currency exchange rates could result in declines in our reported revenue and operating results.
In fiscal 2011, 21.7% of our total revenue was denominated in a currency other than the U.S. dollar. In addition, certain of our operating expenses incurred outside the United States are denominated in currencies other than the U.S. dollar. Our reported revenue and operating results are subject to fluctuations in foreign exchange rates. Foreign currency risk arises primarily from the net difference between non-U.S. dollar receipts from customers outside the United States and non-U.S. dollar operating expenses for subsidiaries in foreign countries. Currently, our largest exposures to foreign exchange rates exist primarily with the Euro, Pound Sterling, Canadian dollar and Japanese Yen against the U.S. dollar. Over recent months, the value of foreign currencies against the U.S. dollar has fluctuated dramatically. Since late fiscal 2008, we have not entered into derivative financial instruments, such as forward currency exchange contracts, intended to manage the volatility of these market risks. We cannot predict the impact of foreign currency fluctuations, and foreign currency fluctuations in the future may adversely affect our revenue and operating results. Any hedging policies we may implement in the future may not be successful, and the cost of those hedging techniques may have a significant negative impact on our operating results.
Competition from software offered by current competitors and new market entrants, as well as from internally developed solutions by our customers, could adversely affect our ability to sell our software products and related services and could result in pressure to price our products in a manner that reduces our margins.
Our markets in general are highly competitive and differ among our principal product areas: engineering, manufacturing, and supply chain management. Our engineering software competes with products of businesses such as ABB Ltd., Honeywell International, Inc., Invensys plc and KBC Advanced Technologies plc. Our manufacturing software competes with products of companies such as ABB Ltd., Honeywell International, Inc., Invensys plc, OSIsoft, Inc., Rockwell Automation, Inc., Siemens AG and Yokogawa Electric Corporation. Our supply chain management software competes with products of companies such as JDA Software Group, Inc., Oracle Corporation and SAP AG. In addition, we face challenges in selling our solutions to large companies in the process industries that have internally developed their own proprietary software solutions.
Many of our current and potential competitors have greater financial, technical, marketing, service and other resources than we have. As a result, these companies may be able to offer lower prices, additional products or services, or other incentives that we cannot match or offer. These competitors may be in a stronger position to respond more quickly to new technologies and may be able to undertake more extensive marketing campaigns. We believe they also have adopted and may continue to pursue more aggressive pricing policies and make more attractive offers to potential customers, employees and strategic partners. For example, some competitors may be able to initiate relationships through sales and installations of hardware and then seek to expand their customer relationships by offering process optimization software at a discount. In addition, many of our competitors have established, and may in the future continue to establish, cooperative relationships with third parties to improve their product offerings and to increase the availability of their products in the marketplace. Competitors with greater financial resources may make strategic acquisitions to increase their ability to gain market share or improve the quality or marketability of their products.
Competition could seriously impede our ability to sell additional software products and related services on terms favorable to us. Businesses may continue to enhance their internally developed solutions, rather than investing in commercial software such as ours. Our current and potential commercial competitors may develop and market new technologies that render our existing or future products obsolete, unmarketable or less competitive. In addition, if these competitors develop products with similar or superior functionality to our products, we may need to decrease the prices for our products in order to remain competitive. If we are unable to maintain our current pricing due to
21
competitive pressures, our margins will be reduced and our operating results will be negatively affected. We cannot ensure that we will be able to compete successfully against current or future competitors or that competitive pressures will not materially adversely affect our business, financial condition and operating results.
Defects or errors in our software products could harm our reputation, impair our ability to sell our products and result in significant costs to us.
Our software products are complex and may contain undetected defects or errors. We have not suffered significant harm from any defects or errors to date, but we have from time to time found defects in our products and we may discover additional defects in the future. We may not be able to detect and correct defects or errors before releasing products. Consequently, we or our customers may discover defects or errors after our products have been implemented. We have in the past issued, and may in the future need to issue, corrective releases of our products to remedy defects or errors. The occurrence of any defects or errors could result in:
- •
- lost or delayed market acceptance and sales of our products;
- •
- delays in payment to us by customers;
- •
- product returns;
- •
- injury to our reputation;
- •
- diversion of our resources;
- •
- legal claims, including product liability claims, against us;
- •
- increased service and warranty expenses or financial concessions; and
- •
- increased insurance costs.
Defects and errors in our software products could result in claims for substantial damages against us.
Arbitration and litigation involving a former reseller in the Middle East may subject us to substantial damages and expenses.
Prior to October 6, 2009, we had an exclusive reseller relationship covering certain countries in the Middle East with AspenTech Middle East W.L.L., a Kuwaiti corporation (now known as Advanced Technology Middle East W.L.L.) that we refer to below as ATME. Under the reseller agreement, we had the right to terminate for, among other things, a material breach in the event of ATME's willful misconduct or fraud. Effective October 6, 2009, we terminated the reseller relationship for material breach by ATME, based on certain actions of ATME.
On November 2, 2009, ATME commenced an action in the Queen's Bench Division (Commercial Court) of the High Court of Justice (England & Wales) captioned In The Matter Of An Intended Arbitration Between AspenTech Middle East W.L.L. and Aspen Technology, Inc., 2009 Folio 1436, seeking preliminary injunctive relief restraining us from taking any steps to impede ATME from serving as our exclusive reseller in the countries covered by the reseller agreement with ATME. We filed evidence in opposition to that request for relief on November 12, 2009. At a hearing on November 13, 2009, the court dismissed ATME's application for preliminary injunctive relief. The court sealed an Order to this effect on November 23, 2009, and further ordered that ATME pay our costs of claim.
Relatedly, on November 11, 2009, we filed a request for arbitration against ATME in the International Court of Arbitration of the International Chamber of Commerce, captioned Aspen Technology, Inc. v. AspenTech Middle East W.L.L., Case No. 16732/VRO. Our request for arbitration asserted claims against ATME seeking a declaration that ATME committed a material breach of our
22
agreement and that our termination of our agreement was lawful, and seeking damages for ATME's willful misconduct in connection with the reseller relationship. On November 18, 2009, ATME filed its answer to that request for arbitration and asserted counterclaims against us seeking a declaratory judgment that we unlawfully terminated our agreement with ATME and seeking damages for breach of contract by reason of our purported unlawful termination of our agreement. Our reply to those counterclaims was filed on December 18, 2009. Pursuant to a procedural order issued by the arbitral tribunal, a hearing was conducted between January 24, 2011 and February 2, 2011, and a supplemental hearing took place in June 2011.
We expect a determination to be made in the first half of fiscal 2012 with respect to the pending arbitration. However, we can provide no assurance as to the actual timing or outcome of the arbitration. In general, there is no provision for either party to appeal the determination reached. The reseller agreement with ATME contained a provision whereby we could be liable for a termination fee if the agreement were terminated other than for material breach. This fee is to be calculated based on a formula contained in the reseller agreement that we believe was originally developed based on certain assumptions about the future financial performance of ATME, as well as ATME's actual financial performance. Based on the formula and the financial information provided to us by ATME, which we have not verified independently, a calculation based on the formula would result in a termination fee of between $60 million and $77 million. Under the terminated reseller agreement, no termination fee is owed on termination for material breach. If we are found to have breached the terms of our agreement with ATME, we could be found liable for damages including the termination fee, the amount of which may be greater or less than the number indicated above. We intend to continue to pursue our claims against ATME, and to defend the counterclaim by ATME, vigorously.
On March 11, 2010, a Kuwaiti entity (known as ATME Group and affiliated with ATME) filed a lawsuit in a Kuwaiti court naming as defendants ATME, us and a reseller newly appointed by us in Kuwait. In this lawsuit, ATME Group claims that it was an exclusive reseller for ATME in Kuwait and that it therefore is entitled to damages resulting from purported customer contracts in Kuwait. We intend to defend this action vigorously.
We are subject to a lawsuit by a purchaser of our shares in a private placement.
In March 2006, we settled class action litigation, including related derivative claims, arising out of our originally filed consolidated financial statements for fiscal 2000 through 2004, the accounting for which we restated in March 2005. Certain members of the class (representing 1,457,969 shares of common stock, or less than 1% of the shares putatively purchased during the class action period) opted out of the settlement and had the right to bring their own state or federal law claims against us, referred to as "opt-out" claims. Opt-out claims were filed on behalf of the holders of approximately 1.1 million of such shares. All but one of these actions were settled and/or dismissed. The remaining action is discussed below.
380544 Canada, Inc., et al. v. Aspen Technology, Inc., was filed on February 15, 2007 in the federal district court for the Southern District of New York and docketed as Civ. A. No. 1:07-cv-01204-JFK in that court. The claims in this action include claims against us and one or more of our former officers alleging securities and common law fraud, breach of contract, deceptive practices and/or rescissory damages liability, based on the restated results of one or more fiscal periods included in our restated consolidated financial statements referenced in the class action. This action was brought by persons who purchased 566,665 shares of our common stock in a private placement. Certain motions to dismiss filed by other defendants were resolved on May 5, 2009. The claims in the 380544 Canada action are for damages totaling at least $4.0 million, not including claims for attorneys' fees. We plan to defend the 380544 Canada action vigorously.
23
We can provide no assurance as to the outcome of this case or the likelihood of the filing of additional opt-out claims, and these claims may result in judgments against us for significant damages. Regardless of the outcome, such litigation has resulted in the past, and may continue to result in the future, in significant legal expenses and may require significant attention and resources of management, all of which could result in losses and damages that have a material adverse effect on our business.
We may be subject to significant expenses and damages because of pending liability claims and other claims related to our products and services.
The sale and implementation of certain of our software products and services, particularly in the areas of advanced process control and supply chain management, entail the risk of product liability claims and associated damages. Our software products and services are often integrated with our customers' networks and software applications and are used in the design, operation and management of manufacturing and supply chain processes at large facilities, often for mission critical applications.
Any errors, defects, performance problems or other failures of our software could result in significant liability to us for damages or for violations of environmental, safety and other laws and regulations. Our software products and implementation services could give rise to warranty and other claims. In the ordinary course of business, we are from time to time involved in lawsuits or claims relating to our products or services. These matters include an April 2004 claim by a customer for approximately $5.0 million that certain of our software products and implementation services failed to meet the customer's expectations. We are unable to determine whether resolution of any of these matters will have a material adverse impact on our financial position, cash flows or results of operations, or, in many cases, reasonably estimate the amount of the loss, if any, that may result from the resolution of these matters.
Our agreements with customers generally contain provisions designed to limit our exposure to potential product liability claims. It is possible, however, that the limitation of liability provisions in our agreements may not be effective as a result of federal, foreign, state or local laws or ordinances or unfavorable judicial decisions. A substantial product liability judgment against us could materially and adversely harm our operating results and financial condition. Even if our software is not at fault, a product liability claim brought against us could be time-consuming, costly to defend and harmful to our operations and reputation.
Third-party claims that we infringe the intellectual property rights of others may be costly to defend or settle and could damage our business.
We cannot be certain that our software and services do not infringe issued patents, copyrights, trademarks or other intellectual property rights of third parties. Litigation regarding intellectual property rights is common in the software industry, and we may be subject to legal proceedings and claims from time to time, including claims of alleged infringement of intellectual property rights of third parties by us or our licensees concerning their use of our software products and integration technologies and services. Third parties may bring claims of infringement against us. Because our software is integrated with our customers' networks and business processes, as well as other software applications, third parties may bring claims of infringement against us, as well as our customers and other software suppliers, if the cause of the alleged infringement cannot easily be determined.
Claims of alleged infringement may have a material adverse effect on our business and may discourage potential customers from doing business with us on acceptable terms, if at all. Defending against claims of infringement may be time-consuming and may result in substantial costs and diversion of resources, including our management's attention to our business. Furthermore, a party making an infringement claim could secure a judgment that requires us to pay substantial damages. A judgment could also include an injunction or other court order that could prevent us from selling our software or
24
require that we re-engineer some or all of our products. Claims of intellectual property infringement also might require us to enter costly royalty or license agreements. We may be unable to obtain royalty or license agreements on terms acceptable to us or at all. Our business, operating results and financial condition could be harmed significantly if any of these events occurred, and the price of our common stock could be adversely affected. Furthermore, former employers of our current and future employees may assert that our employees have improperly disclosed confidential or proprietary information to us. In addition, we have agreed, and may agree in the future, to indemnify certain of our customers against claims that our software infringes upon the intellectual property rights of others. Although we carry general liability insurance, our current insurance coverage may not apply to, and likely would not protect us from, liability that may be imposed under any of the types of claims described above.
We may not be able to protect our intellectual property rights, which could make us less competitive and cause us to lose market share.
We regard our software as proprietary. Our strategy is to rely on a combination of copyright, patent, trademark and trade secret laws in the United States and other jurisdictions, and to rely on license and confidentiality agreements and software security measures to further protect our proprietary technology and brand. We have obtained or applied for patent protection with respect to some of our intellectual property, but generally do not rely on patents as a principal means of protecting our intellectual property. We have registered or applied to register some of our trademarks in the United States and in selected other countries. We generally enter into non-disclosure agreements with our employees and customers, and historically have restricted third-party access to our software and source code, which we regard as proprietary information. In certain cases, we have provided copies of source code to customers for the purpose of special product customization or have deposited copies of the source code with a third party escrow agent as security for ongoing service and license obligations. In these cases, we rely on non-disclosure and other contractual provisions to protect our proprietary rights.
The steps we have taken to protect our proprietary rights may not be adequate to deter misappropriation of our technology or independent development by others of technologies that are substantially equivalent or superior to our technology. Our intellectual property rights may expire or be challenged, invalidated or infringed upon by third parties or we may be unable to maintain, renew or enter into new licenses on commercially reasonable terms. Any misappropriation of our technology or development of competitive technologies could harm our business and could diminish or cause us to lose the competitive advantages associated with our proprietary technology, and could subject us to substantial costs in protecting and enforcing our intellectual property rights, including costs of proceedings we have instituted to enforce our intellectual property rights, such as those described in "Item 3. Other Proceedings," and/or temporarily or permanently disrupt our sales and marketing of the affected products or services. The laws of some countries in which our products are licensed do not protect our intellectual property rights to the same extent as the laws of the United States. Moreover, in some non-U.S. countries, laws affecting intellectual property rights are uncertain in their application, which can affect the scope of enforceability of our intellectual property rights.
25
In preparing our financial statements for fiscal 2011, we identified a material weakness in our internal control over financial reporting, and our failure to remedy this or other material weaknesses could result in material misstatements in our financial statements.
Our management is responsible for establishing and maintaining adequate internal control over our financial reporting, as defined in Rule 13a-15(f) under the Securities Exchange Act. Our management identified a material weakness in our internal control over financial reporting as of June 30, 2011. A material weakness is defined as a deficiency, or combination of deficiencies, in internal control over financial reporting, such that there is a reasonable possibility that a material misstatement of our annual or interim financial statements will not be prevented or detected on a timely basis.
The material weaknesses identified by management as of June 30, 2011 consisted of inadequate and ineffective controls over income tax accounting. As a result of this material weakness, our management concluded as of June 30, 2011 that our internal control over financial reporting was not effective based on criteria set forth by the Committee of Sponsoring Organization of the Treadway Commission in Internal Control—An Integrated Framework (September 1992).
We have been implementing and continue to implement remedial measures designed to address this material weakness. If our remedial measures are insufficient to address this material weakness, or if additional material weaknesses or significant deficiencies in our internal control are discovered or occur in the future, our consolidated financial statements may contain material misstatements and we could be required to restate our financial results.
Implementation of some of our products can be difficult and time-consuming, and customers may be unable to implement those products successfully or otherwise achieve all of the potential benefits of the products.
Some of our scheduling, production management and execution, and supply chain products must integrate with the existing computer systems and software programs of our customers. This process can be complex, time-consuming and expensive. As a result, some customers may have difficulty in implementing those products or be unable to implement them successfully or otherwise achieve the products' potential benefits. Delayed or ineffective implementation of those software products or related services may limit our revenue or may result in customer dissatisfaction, harm to our reputation and customer unwillingness to pay the fees associated with these products.
We may suffer losses on fixed-price professional service engagements.
We undertake a portion of our professional service engagements on a fixed-price basis. Under these types of engagements, we bear the risk of cost overruns and inflation. We occasionally experience cost overruns, which may have a negative impact on our operating results.
If we fail to comply or are deemed to have failed to comply with our ongoing Federal Trade Commission, or FTC, consent decree, our business may suffer.
In December 2004, we entered into a consent decree with the FTC with respect to a civil administrative complaint filed by the FTC in August 2003 alleging that our acquisition of Hyprotech in May 2002 was anticompetitive in violation of Section 5 of the Federal Trade Commission Act and Section 7 of the Clayton Act. In July 2009, we announced that the FTC closed an investigation relating to the alleged violations of the decree, and issued an order modifying the consent decree, which became final in August 2009. We are subject to ongoing compliance obligations under the FTC consent decree. There is no assurance that the actions required by the FTC's modified order and related settlement with Honeywell International, Inc. will not require significant attention and resources of management, which could have a material adverse effect on our business. Further, if we fail to comply, or are deemed to have failed to comply, with such consent decree, our business may suffer.
26
If we are not successful in attracting, integrating and retaining highly qualified personnel, we may not be able to successfully implement our business strategy.
Our ability to establish and maintain a position of technology leadership in the highly competitive software market depends in large part upon our ability to attract, integrate and retain highly qualified managerial, sales, technical and accounting personnel. Competition for qualified personnel in the software industry is intense. We have from time to time in the past experienced, and we expect to continue to experience in the future, difficulty in hiring and retaining highly skilled employees with appropriate qualifications. Our future success will depend in large part on our ability to attract, integrate and retain a sufficient number of highly qualified personnel, and there can be no assurance that we will be able to do so.
Our ability to raise capital in the future may be limited, and our failure to raise capital when needed could prevent us from executing our business plan.
We expect that our current cash and cash equivalents and cash flows from operations will be sufficient to meet our anticipated cash needs for at least the next twelve months. We may need to obtain additional financing thereafter or earlier, however, if our current plans and projections prove to be inaccurate or our expected cash flows prove to be insufficient to fund our operations because of lower-than-expected revenue, unanticipated expenses or other unforeseen difficulties.
Our ability to obtain additional financing will depend on a number of factors, including market conditions, our operating performance, the quality of our receivables, and the availability of capital in the credit markets. These factors may make the timing, amount, terms and conditions of any financing unattractive. If adequate funds are not available, or are not available on acceptable terms, we may have to forego strategic acquisitions or other investments.
Risks Related to Our Common Stock
Our common stock may experience substantial price and volume fluctuations.
The equity markets have from time to time experienced extreme price and volume fluctuations, particularly in the high technology sector, and those fluctuations often have been unrelated to the operating performance of particular companies. In addition, factors such our aspenONE subscription offering, our financial performance, the variability of earnings associated with the release of a significant portion of our U.S. valuation allowance, announcements of technological innovations or new products by us or our competitors, and market conditions in the computer software or hardware industries, may have a significant impact on the market price of our common stock.
In the past, following periods of volatility in the market price of a public company's securities, securities class action litigation has often been instituted against that company. This type of litigation against us could result in substantial liability and costs and divert management's attention and resources.
Our corporate documents and provisions of Delaware law may prevent a change in control or management that stockholders may consider desirable.
Section 203 of the Delaware General Corporation Law, our charter and our by-laws contain provisions that might enable our management to resist a takeover of our company. These provisions include:
- •
- limitations on the removal of directors;
- •
- a classified board of directors, so that not all members of the board are elected at one time;
- •
- advance notice requirements for stockholder proposals and nominations;
27
- •
- the inability of stockholders to act by written consent or to call special meetings;
- •
- the ability of the board to make, alter or repeal our by-laws; and
- •
- the ability of the board to designate the terms of and issue new series of preferred stock without stockholder approval.
These provisions could:
- •
- have the effect of delaying, deferring or preventing a change in control of our company or a change in our management that
stockholders may consider favorable or beneficial;
- •
- discourage proxy contests and make it more difficult for stockholders to elect directors and take other corporate actions;
and
- •
- limit the price that investors might be willing to pay in the future for shares of our common stock.
Item 1B. Unresolved Staff Comments.
None.
Our principal executive offices are located in leased facilities in Burlington, Massachusetts, consisting of approximately 75,000 square feet of office space. Our lease expires on January 31, 2015. These facilities accommodate our product development, sales, marketing, operations and finance and administrative functions. Subject to the terms and conditions of the lease, we may extend the term of the lease for two successive terms of five years each at 95% of the then-current market rate. As of June 30, 2011, under the lease, we had total future non-cancelable lease obligations of $7.5 million. We also will pay additional rent for our proportionate share of operating costs and taxes.
Prior to September 1, 2007, our principal offices occupied 110,843 square feet of office space in Cambridge, Massachusetts. The lease for this office space expires on September 30, 2012. As of June 30, 2011, we had multiple agreements, which expire through 2012, to sublease the former office space. We also lease space for our Houston, Texas facilities. This lease encompasses 76,315 square feet and expires in July 2016. We have an agreement, which expires in July 2016, to sublease approximately 8,000 square feet of this space. In addition to our Burlington and Houston locations, we also lease office space in Shanghai, Reading (UK), Singapore and Tokyo to accommodate sales, services and product development functions.
In the remainder of our other locations, the majority of our leases has lease terms of one year or less that are generally based on the number of workstations required. We believe this facilities strategy provides us with significant flexibility to adjust to changes in our business environment. We do not own any real property. We believe that our leased facilities are adequate for our anticipated future needs.
ATME Arbitration and Litigation
Prior to October 6, 2009, we had an exclusive reseller relationship covering certain countries in the Middle East with AspenTech Middle East W.L.L., a Kuwaiti corporation (now known as Advanced Technology Middle East W.L.L.) that we refer to below as ATME. Under the reseller agreement, we had the right to terminate for, among other things, a material breach in the event of ATME's willful misconduct or fraud. Effective October 6, 2009, we terminated the reseller relationship for material breach by ATME based on certain actions of ATME.
28
On November 2, 2009, ATME commenced an action in the Queen's Bench Division (Commercial Court) of the High Court of Justice (England & Wales) captioned In The Matter Of An Intended Arbitration Between AspenTech Middle East W.L.L. and Aspen Technology, Inc., 2009 Folio 1436, seeking preliminary injunctive relief restraining us from taking any steps to impede ATME from serving as our exclusive reseller in the countries covered by the reseller agreement with ATME. We filed evidence in opposition to that request for relief on November 12, 2009. At a hearing on November 13, 2009, the court dismissed ATME's application for preliminary injunctive relief. The court sealed an Order to this effect on November 23, 2009, and further ordered that ATME pay our costs of claim.
Relatedly, on November 11, 2009, we filed a request for arbitration against ATME in the International Court of Arbitration of the International Chamber of Commerce, captioned Aspen Technology, Inc. v. AspenTech Middle East W.L.L., Case No. 16732/VRO. Our request for arbitration asserted claims against ATME seeking a declaration that ATME committed a material breach of our agreement and that our termination of our agreement was lawful, and seeking damages for ATME's willful misconduct in connection with the reseller relationship. On November 18, 2009, ATME filed its answer to that request for arbitration and asserted counterclaims against us seeking a declaratory judgment that we unlawfully terminated our agreement with ATME and seeking damages for breach of contract by reason of our purported unlawful termination of our agreement. Our reply to those counterclaims was filed on December 18, 2009. Pursuant to a procedural order issued by the arbitral tribunal, a hearing was conducted between January 24, 2011 and February 2, 2011, and a supplemental hearing took place in June 2011.
We expect a determination to be made in the first half of fiscal 2012 with respect to the pending arbitration. However, we can provide no assurance as to the actual timing or outcome of the arbitration. In general, there is no provision for either party to appeal the determination reached. The reseller agreement with ATME contained a provision whereby we could be liable for a termination fee if the agreement were terminated other than for material breach. This fee is to be calculated based on a formula contained in the reseller agreement that we believe was originally developed based on certain assumptions about the future financial performance of ATME, as well as ATME's actual financial performance. Based on the formula and the financial information provided to us by ATME, which we have not verified independently, a calculation based on the formula would result in a termination fee of between $60 million and $77 million. Under the terminated reseller agreement, no termination fee is owed on termination for material breach. If we are found to have breached the terms of our agreement with ATME, we could be liable for damages including the termination fee, the amount of which may be greater or less than the number indicated above. We intend to continue to pursue our claims against ATME, and to defend the counterclaim by ATME, vigorously.
On March 11, 2010, a Kuwaiti entity (known as ATME Group and affiliated with ATME) filed a lawsuit in a Kuwaiti court naming as defendants ATME, us and a reseller newly appointed by us in Kuwait. In this lawsuit, ATME Group claims that it was an exclusive reseller for ATME in Kuwait and that it therefore is entitled to damages resulting from purported customer contracts in Kuwait. We intend to defend this action vigorously.
Class Action and Opt-out Claims
In March 2006, we settled class action litigation, including related derivative claims, arising out of our originally filed consolidated financial statements for fiscal 2000 through 2004, the accounting for which we restated in March 2005. Certain members of the class (representing 1,457,969 shares of common stock (or less than 1% of the shares putatively purchased during the class action period)) opted out of the settlement and had the right to bring their own state or federal law claims against us, referred to as "opt-out" claims. Opt-out claims were filed on behalf of the holders of approximately 1.1 million of such shares. All but one of these actions were settled and/or dismissed. The remaining action is discussed below.
29
380544 Canada, Inc., et al. v. Aspen Technology, Inc., was filed on February 15, 2007 in the federal district court for the Southern District of New York and docketed as Civ. A. No. 1:07-cv-01204-JFK in that court. The claims in this action include claims against us and one or more of our former officers alleging securities and common law fraud, breach of contract, deceptive practices and/or rescissory damages liability, based on the restated results of one or more fiscal periods included in our restated consolidated financial statements referenced in the class action. This action was brought by persons who purchased 566,665 shares of our common stock in a private placement. Certain motions to dismiss filed by other defendants were resolved on May 5, 2009. The claims in the 380544 Canada action are for damages totaling at least $4.0 million, not including claims for attorneys' fees. We plan to defend the 380544 Canada action vigorously.
We can provide no assurance as to the outcome of this case or the likelihood of the filing of additional opt-out claims, and these claims may result in judgments against us for significant damages. Regardless of the outcome, such litigation has resulted in the past, and may continue to result in the future, in significant legal expenses and may require significant attention and resources of management, all of which could result in losses and damages that have a material adverse effect on our business.
Other Proceedings
In the ordinary course of business, we also from time to time pursue lawsuits and claims to enforce our intellectual property rights and to address other intellectual property, commercial and miscellaneous matters. These matters include claims we asserted against M3 Technology, Inc. in July 2010 for misappropriation of our trade secrets and infringement of our copyrights, in an action that we commenced in the U.S. District Court for the Southern District of Texas captioned Aspen Technology, Inc. v. Tekin A. Kunt and M3 Technology, Inc. which is docketed as Civ. A. No. 4:10-cv-1127 in that court.
In addition, we are also from time to time involved in other lawsuits, claims, investigations, proceedings and threats of litigation. These include an April 2004 claim by a customer for approximately $5.0 million that certain of our software products and implementation services failed to meet the customer's expectations.
The results of litigation and claims cannot be predicted with certainty, and unfavorable resolutions are possible and could materially affect our results of operations, cash flows or financial position. In addition, regardless of the outcome, litigation could have an adverse impact on us because of litigation fees and costs, diversion of management resources and other factors.
While the outcome of the proceedings and claims identified above cannot be predicted with certainty, there are no other such matters, as of June 30, 2011, that, in the opinion of management, might have a material adverse effect on our financial position, results of operations or cash flows.
Item 4. (Removed and Reserved.)
30
Item 5. Market for Registrant's Common Equity, Related Stockholder Matters and Issuer Purchases of Equity Securities.
Market Information
Our common stock currently trades on The NASDAQ Global Select Market under the symbol "AZPN." Our common stock was traded on The NASDAQ Global Select Market (and its predecessors, the NASDAQ National Market and NASDAQ Global Market) from our initial public offering in 1994 through February 18, 2008, and then was quoted on the over the counter Pink OTC Markets under the symbol "AZPN.PK" until being relisted on The NASDAQ Global Select Market on February 10, 2010. The following table sets forth, for the periods indicated, the high and low sales prices per share of our common stock as reported by The NASDAQ Global Select Market or the Pink OTC Markets, as applicable:
| |
2011 | 2010 | |||||||||||
|---|---|---|---|---|---|---|---|---|---|---|---|---|---|
| |
Low | High | Low | High | |||||||||
Quarter ended June 30 |
$ | 14.38 | $ | 17.18 | $ | 9.52 | $ | 12.01 | |||||
Quarter ended March 31 |
13.02 | 16.00 | 8.32 | 10.59 | |||||||||
Quarter ended December 31 |
10.62 | 13.28 | 9.20 | 10.89 | |||||||||
Quarter ended September 30. |
9.34 | 11.32 | 8.55 | 10.75 | |||||||||
Holders
On August 15, 2011, there were 734 holders of record of our common stock. The number of record holders does not include persons who held our common stock in nominee or "street name" accounts through brokers.
Dividends
We have never declared or paid cash dividends on our common stock. We do not anticipate paying cash dividends on our common stock in the foreseeable future. Any future determination relating to our dividend policy will be made at the discretion of the board of directors and will depend on a number of factors, including our future earnings, capital requirements, financial condition and future prospects and such other factors as the board of directors may deem relevant.
31
Purchases of Equity Securities by the Issuer
The following table sets forth, for the month indicated, our purchases of common stock in the fourth quarter of fiscal 2011:
Issuer Purchases of Equity Securities
Period
|
(a) Total Number of Shares Purchased(1) |
(b) Average Price Paid per Share |
(c) Total Number of Shares Purchased as Part of Publicly Announced Program(2) |
(d) Approximate Dollar Value of Shares that May Yet Be Purchased Under the Program |
|||||||||
|---|---|---|---|---|---|---|---|---|---|---|---|---|---|
April 1 to 30, 2011 |
99,400 | $ | 14.89 | 99,400 | |||||||||
May 1 to 31, 2011 |
132,500 | $ | 16.27 | 132,500 | |||||||||
June 1 to 30, 2011 |
172,400 | $ | 15.85 | 172,400 | |||||||||
Totals |
404,300 | $ | 15.75 | 404,300 | $ | 29,469,058 | |||||||
- (1)
- As
of June 30, 2011, we had repurchased an aggregate of 701,030 shares of our common stock pursuant to the repurchase program that we publicly
announced on November 2, 2010 (the "Program").
- (2)
- The board of directors approved the repurchase by us of shares of our common stock having a value of up to $40,000,000 in the aggregate pursuant to the Program. The Program has an expiration date of October 31, 2011.
Securities Authorized for Issuance Under Equity Compensation Plans
The following table provides information about the securities authorized for issuance under our equity compensation plans as of June 30, 2011:
| |
Equity Compensation Plan Information | |||||||||
|---|---|---|---|---|---|---|---|---|---|---|
| |
(A) | (B) | (C) | |||||||
Plan category
|
Number of securities to be issued upon exercise of outstanding options, warrants and rights |
Weighted-average exercise price of outstanding options, warrants and rights |
Number of securities remaining available for future issuance under equity compensation plans (excluding securities reflected in column (A)) |
|||||||
Equity compensation plans approved by security holders |
6,062,681 | $ | 8.20 | 6,632,456 | ||||||
Equity compensation plans not approved by security holders |
— | — | — | |||||||
Total |
6,062,681 | $ | 8.20 | 6,632,456 | ||||||
Equity compensation plans approved by security holders consist of our 2005 stock incentive plan and our 2010 equity incentive plan.
The securities remaining available for future issuance under equity compensation plans approved by our security holders as of June 30, 2011 consisted of:
- •
- 862,030 shares of common stock issuable under our 2005 stock incentive plan; and
- •
- 5,770,426 shares of common stock issuable under our 2010 equity incentive plan.
Options issuable under the 2005 stock incentive plan have a maximum term of seven years. Options issuable under the 2010 equity incentive plan have a maximum term of ten years.
32
Stockholder Return Comparison
The information included in this section is not deemed to be "soliciting material" or to be "filed" with the SEC or subject to Regulation 14A or 14C under the Securities Exchange Act or to the liabilities of Section 18 of the Securities Exchange Act, and will not be deemed to be incorporated by reference into any filing under the Securities Act or the Securities Exchange Act, except to the extent we specifically incorporate it by reference into such a filing.
The graph below matches the cumulative 5-year total return of holders of Aspen Technology, Inc.'s common stock with the cumulative total returns of the NASDAQ Composite index and the NASDAQ Computer & Data Processing index. The graph assumes that the value of the investment in the company's common stock and in each of the indexes (including reinvestment of dividends) was $100 on June 30, 2006 and tracks it through June 30, 2011.
COMPARISON OF 5 YEAR CUMULATIVE TOTAL
Among Aspen Technology, Inc., the NASDAQ Composite Index
and the NASDAQ Computer & Data Processing Index
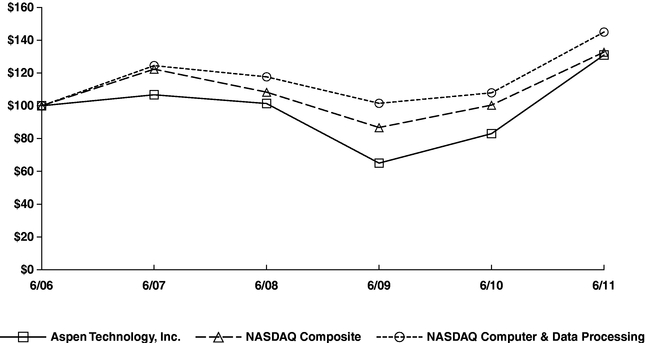
The stock price performance included in this graph is not necessarily indicative of future stock price performance.
| |
Fiscal Year Ended June 30, | ||||||||||||||||||
|---|---|---|---|---|---|---|---|---|---|---|---|---|---|---|---|---|---|---|---|
| |
2006 | 2007 | 2008 | 2009 | 2010 | 2011 | |||||||||||||
Aspen Technology, Inc. |
$ | 100.00 | $ | 106.71 | $ | 101.37 | $ | 65.02 | $ | 83.00 | $ | 130.95 | |||||||
NASDAQ Composite |
100.00 | 122.33 | 108.31 | 86.75 | 100.42 | 132.75 | |||||||||||||
NASDAQ Computer & Data Processing |
100.00 | 124.50 | 117.65 | 101.50 | 107.89 | 144.96 | |||||||||||||
33
Item 6. Selected Financial Data.
The following table presents selected consolidated financial and other data for Aspen Technology, Inc. The consolidated statement of operations data set forth below for fiscal 2011, 2010 and 2009 and the consolidated balance sheet data as of June 30, 2011, and 2010, are derived from our consolidated financial statements included beginning on page F-1 of this Form 10-K. The consolidated statement of operations data for fiscal 2008 and 2007 and the consolidated balance sheet data as of June 30, 2009, 2008, and 2007 are derived from our consolidated financial statements that are not included in this Form 10-K. The data presented below should be read in conjunction with our Consolidated Financial Statements and accompanying notes beginning on page F-1 and "Item 7. Management's Discussion and Analysis of Financial Condition and Results of Operations."
| |
Year Ended June 30, | |||||||||||||||
|---|---|---|---|---|---|---|---|---|---|---|---|---|---|---|---|---|
| |
2011 | 2010 | 2009 | 2008 | 2007 | |||||||||||
| |
(Dollars in Thousands, except per share data) |
|||||||||||||||
Consolidated Statement of Operations Data: |
||||||||||||||||
Revenue(1) |
$ | 198,154 | $ | 166,344 | $ | 311,580 | $ | 311,613 | $ | 341,029 | ||||||
Gross profit |
145,809 | 100,234 | 235,760 | 226,620 | 247,469 | |||||||||||
(Loss) income from operations |
(54,576 | ) | (109,370 | ) | 43,934 | 18,637 | 55,403 | |||||||||
Net income (loss)(2) |
10,257 | (107,445 | ) | 52,924 | 24,946 | 45,518 | ||||||||||
Accretion of preferred stock discount and dividends |
— | — | — | — | (7,290 | ) | ||||||||||
Net income (loss) attributable to common shareholders(2) |
$ | 10,257 | $ | (107,445 | ) | $ | 52,924 | $ | 24,946 | $ | 38,228 | |||||
Basic income (loss) per share attributable to common shareholders |
$ | 0.11 | $ | (1.18 | ) | $ | 0.59 | $ | 0.28 | $ | 0.54 | |||||
Diluted income (loss) per share attributable to common shareholders |
$ |
0.11 |
$ |
(1.18 |
) |
$ |
0.57 |
$ |
0.27 |
$ |
0.50 |
|||||
Weighted average shares outstanding—Basic |
93,488 |
91,247 |
90,053 |
89,640 |
70,879 |
|||||||||||
Weighted average shares outstanding—Diluted |
95,853 | 91,247 | 92,578 | 94,092 | 91,869 | |||||||||||
- (1)
- In
July 2009 we introduced our aspenONE subscription offering under which license revenue is recognized over the term of a license contract. We previously
recognized a substantial majority of our license revenue upfront, upon shipment of software. See "Item 7. Management's Discussion and Analysis and Results of Operations—Transition
to the aspenONE Subscription Offering."
- (2)
- Our income tax provision provided a net $54.0 million benefit in fiscal 2011, due to the reversal of a significant portion of our U.S. valuation allowance in the fourth quarter of fiscal 2011. See Note 10 to our Consolidated Financial Statements, "Income Taxes," for further information.
| |
Year Ended June 30, | ||||||||||||||||
|---|---|---|---|---|---|---|---|---|---|---|---|---|---|---|---|---|---|
| |
2011 | 2010 | 2009 | 2008 | 2007 | ||||||||||||
| |
(Dollars in Thousands) |
||||||||||||||||
Consolidated Balance Sheet Data: |
|||||||||||||||||
Cash and cash equivalents |
$ | 149,985 | $ | 124,945 | $ | 122,213 | $ | 134,048 | $ | 132,267 | |||||||
Working capital |
80,188 | 94,466 | 97,914 | 116,307 | 53,019 | ||||||||||||
Accounts receivable, net |
27,866 | 31,738 | 49,882 | 86,870 | 47,200 | ||||||||||||
Installments receivable, net |
86,476 | 128,598 | 177,921 | 134,290 | 42,827 | ||||||||||||
Collateralized receivables, net |
25,039 | 51,430 | 96,366 | 135,349 | 245,076 | ||||||||||||
Total assets |
411,975 | 393,359 | 515,976 | 554,626 | 528,897 | ||||||||||||
Deferred revenue |
128,943 | 87,279 | 78,871 | 106,905 | 67,106 | ||||||||||||
Secured borrowings |
24,913 | 76,135 | 112,096 | 147,207 | 206,150 | ||||||||||||
Total stockholders' equity |
157,803 | 140,970 | 229,410 | 172,813 | 137,206 | ||||||||||||
34
Item 7. Management's Discussion and Analysis of Financial Condition and Results of Operations.
You should read the following discussion in conjunction with our consolidated financial statements and related notes beginning on page F-1. In addition to historical information, this discussion contains forward-looking statements that involve risks and uncertainties. You should read "Item 1A. Risk Factors" for a discussion of important factors that could cause our actual results to differ materially from our expectations.
Our fiscal year ends on June 30, and references to a specific fiscal year are the twelve months ended June 30 of such year (for example, "fiscal 2011" refers to the year ended June 30, 2011).
Business Overview
We are a leading global provider of mission-critical process optimization software solutions, which are designed to manage and optimize plant and process design, operational performance, and supply chain planning. Our aspenONE software and related services have been developed specifically for companies in the process industries. Customers use our solutions to improve their competitiveness and profitability by increasing throughput and productivity, reducing operating costs, enhancing capital efficiency, and decreasing working capital requirements.
We have more than 1,500 customers globally. Our customers include manufacturers in process industries such as energy, chemicals, pharmaceuticals, consumer packaged goods, power, metals and mining, pulp and paper, and biofuels, as well as engineering and construction firms that help design and build process manufacturing plants. As of June 30, 2011, our installed base included 19 of the 20 largest petroleum companies, all of the 20 largest chemical companies, and 15 of the 20 largest pharmaceutical companies. Customers outside the United States accounted for a majority of our total revenue in each of fiscal 2011, 2010 and 2009, and no single customer represented 10% or more of our total revenue in fiscal 2011, 2010 or 2009.
Transition to the aspenONE Subscription Offering
In fiscal 2010, we began offering our aspenONE software under a subscription-based licensing model, under which a customer can access all products within a licensed suite (aspenONE Engineering or aspenONE Manufacturing and Supply Chain). During the license term, a customer is entitled to receive post contract support, which we refer to as SMS, as well as any software products and upgrades introduced into the licensed suite. Revenue is recognized over the term of a license agreement on a subscription, or "daily ratable," basis. We typically issue invoices annually, and we record each invoiced payment as deferred revenue and then recognize revenue from that payment due date over the applicable period. We also continue to offer our customers the ability to license specifically defined sets of aspenONE products, referred to as point products, which in July 2009 we began licensing with SMS included for the term of the arrangement. Revenue is recognized on these arrangements over the contract term, as payments become due.
Prior to fiscal 2010, we offered term or perpetual licenses to specific aspenONE products or specifically defined sets of aspenONE products, which we refer to as point products. The majority of our license revenue was recognized under an "upfront revenue model," in which the net present value of the aggregate license fees was recognized as revenue upon shipment of the point products. We typically invoiced customers annually and recorded the net present value of uninvoiced payments as installments receivable. Customers typically received one year of SMS bundled with their license agreements and then could elect to renew SMS annually. Revenue from SMS was recognized ratably over the period which the SMS was delivered.
35
Our aspenONE subscription offering has not changed the method or timing of our customer billing or cash collections and our net cash provided by operating activities increased in each of fiscal 2011 and 2010. The principal accounting implications of the change in our licensing model are as follows:
- •
- The majority of our license revenue is no longer recognized on an upfront basis. As the result of the transition to our
aspenONE subscription offering, our license revenue for fiscal 2011 and 2010 was significantly less than the level achieved in the fiscal years preceding our licensing model change. We expect that our
revenue will continue to increase as customers renew their previous upfront licensing arrangements under our subscription-based licensing model. We do not expect to recognize levels of revenue
comparable to prior fiscal years until a significant majority of our existing license agreements have been renewed under our subscription-based licensing model. Because the timing of our incurrence of
operating costs has not changed, the lower levels of revenue expected over the next few years may result in operating losses.
- •
- The amount of our installments receivable will continue to decrease, as license agreements executed under our upfront
revenue model reach the end of their terms. Uninvoiced payments are not recorded on our consolidated balance sheet under the subscription-based licensing model.
- •
- The amount of our deferred revenue will continue to increase over time, as installments for license transactions executed under our aspenONE subscription offering are deferred and recognized on a subscription basis.
For additional information about the recognition of revenue under the upfront revenue model and our subscription offering, see "—Revenue." Because of the accounting implications of our aspenONE subscription offering, we believe that, for the next several years, a number of performance indicators based on U.S. generally accepted accounting principles, or GAAP, will be of reduced value in assessing our performance, growth and financial condition. Accordingly, we are focusing on a number of other business metrics, including those described under "—Key Business Metrics."
Future Impact of Enhanced SMS Offering
In July 2011, we released an enhanced SMS offering to provide more value to our customers. As part of this offering, customers receive 24x7 support, faster response times and dedicated technical advocates. The enhanced SMS offering is being provided to both (i) aspenONE subscription customers and (ii) customers who have licensed point products on a term basis with SMS included for the term of the arrangement.
We do not have a history of selling this new SMS offering to customers on a stand-alone basis and cannot establish vendor-specific evidence of fair value, or "VSOE". As a result, beginning in July 2011, the revenue associated with point product arrangements that include the enhanced SMS offering is being recognized on a "daily ratable" basis, consistent with the revenue recognition of fees on our aspenONE subscription offering arrangements. Beginning in fiscal 2012, the ratable revenue from both aspenONE subscription arrangements and point product arrangements with enhanced SMS will be presented as "subscription and software revenue."
We expect the impact of the loss of VSOE to result in moderately lower revenue in fiscal 2012 due to timing. We currently recognize software revenue on point product arrangements over the contract term when the related installments become due. However, in fiscal 2012, we are recognizing revenue on a daily ratable basis, beginning when the installment becomes due. As a result of this change, only a portion of the revenue associated with the installment will be recognized during fiscal 2012.
The new SMS offering did not impact our results of operations or income statement presentation for fiscal 2011, 2010, or 2009.
36
Revenue
We generate revenue primarily from the following sources:
- •
- Software licenses. We provide integrated process
optimization software solutions designed specifically for the process industries. We license our software products, together with SMS, primarily on a term basis, and we offer extended payment options
for our term license agreements that generally require annual payments, which we also refer to as installments.
- •
- SMS and other. Our SMS business consists primarily of
providing customer technical support and access to software fixes and upgrades. We provide customer technical support services throughout the world from our three global call centers as well as via
email and through our support website. Our training business provides customers with a variety of training solutions, including on-site, Internet-based and customized training.
- •
- Professional services. We offer professional services that include implementing and integrating our technology with customers' existing systems in order to improve their plant performance and gain better operational data. Customers who use our professional services typically engage us to provide those services over periods of up to 24 months. We charge customers for professional services on a time-and-materials or fixed-price basis.
Before we can recognize revenue, the following four basic criteria generally must be met:
- •
- Persuasive evidence of an arrangement—As evidence of the
existence of an arrangement, we use a contract signed by the customer for software licenses and SMS and we use a signed contract and a statement of work for professional services.
- •
- Delivery of product—Software and the corresponding access keys
are generally delivered to customers via disk media with standard shipping terms of free carrier, our warehouse. Our software license agreements do not contain conditions for acceptance.
- •
- Fee is fixed or determinable—We assess whether a fee is fixed
or determinable at the outset of the arrangement. In addition, we assess whether contract modifications to an existing term arrangement constitute a concession. Our software license agreements do not
include a right of return or exchange.
- •
- Collection of fee is probable—We assess the probability of collecting from each customer at the outset of the arrangement based on a number of factors, including the customer's payment history, its current creditworthiness, economic conditions in the customer's industry and geographic location, and general economic conditions. If in our judgment collection of a fee is not probable, revenue is recognized as cash is collected, provided all other conditions for revenue recognition have been met.
We have established vendor-specific objective evidence, or VSOE, of fair value for SMS and professional services, but not for our software products. Our VSOE determination is based upon the price charged to similarly situated customers when the elements are sold separately. We allocate the arrangement consideration among the elements included in our multi-element arrangements using the residual method. Under the residual method, the VSOE of the undelivered elements is deferred and the remaining portion of the arrangement fee for perpetual and term licenses is recognized as revenue upon delivery of the software, assuming all other revenue recognition criteria are met. If VSOE does not exist for an undelivered element in an arrangement, revenue is deferred until such evidence does exist for the undelivered elements, or until all elements are delivered, whichever is earlier.
In July 2011, we released an enhanced SMS offering to provide more value to our customers, for which we do not have VSOE. As a result, beginning in fiscal 2012, we will no longer be able to separate the license and SMS components of our point product arrangements under the residual
37
method. In fiscal 2012 and beyond, the revenue associated with point product arrangements bundled with enhanced SMS will be recognized on a "daily ratable" basis, consistent with the revenue recognition of fees on our aspenONE subscription offering arrangements.
Software License Revenue
Prior to Fiscal 2010
Prior to fiscal 2010, we generally licensed point products pursuant to term or perpetual license agreements with contractual provisions intended to result in the "upfront" recognition of license revenue upon delivery of the point products, regardless of whether payment was made in period installments or at the outset of the arrangement. Under our upfront revenue model, we typically were able to demonstrate that the license fees were fixed or determinable for all arrangements, including those for term licenses containing extended payment terms, and we had an established history of collecting under the terms of these agreements without providing concessions to customers. A portion of the license fees generally was recorded as deferred revenue due to the inclusion of an undelivered element, SMS, and the amount of revenue allocated to SMS was based on the VSOE of fair value for SMS using the residual method. The net present value of the residual license fees typically was recognized upon delivery of the software.
License revenue recognized under the upfront revenue model upon the delivery of the licensed software (both term and perpetual license agreements) was reported as software revenue in the consolidated statements of operations.
Fiscal 2010 and Beyond
In July 2009, we began offering our aspenONE subscription offering, which provides customers with access to all products within the aspenONE suite(s) they license. During the term of a license agreement, a customer is entitled to receive SMS as well as any software products and upgrades that may be introduced into the licensed suite. For purposes of recognizing revenue, the license fees under these agreements are not fixed or determinable, because the agreements provide rights to future unspecified software products for no additional fee and therefore the economics of the arrangements are not comparable to our historical transactions with customers under the upfront revenue model. As a result, the amount of revenue recognized is limited to the amount of customer payments currently due, which generally results in license revenue being recognized over the term of the agreement on a subscription basis, beginning when the first payment is due, which typically is 30 days after execution of the agreement. For arrangements sold under the aspenONE subscription offering, the license and SMS components of the arrangement cannot be separated. As a result, all of the related revenue is reported as subscription revenue in the consolidated statements of operations.
We also offer our customers the ability to license point products. In July 2009 we began licensing point products on a term basis with SMS included for the full license term. Under these arrangements, license revenue cannot be recognized under the upfront revenue model, as the aggregate fees are not considered fixed or determinable because the agreements include SMS for the full term of the license and therefore the economics of the arrangements are not comparable to our historical transactions with customers under the upfront revenue model. License revenue for these arrangements generally is recognized as payments become due over the term of the agreement. Throughout fiscal 2010 and 2011, revenue from point product licenses with SMS included for the license term was reported as software revenue in the consolidated statements of operations. The revenue related to the SMS component of point product licenses is reported in services and other revenue in the consolidated statements of operations.
Beginning in July 2011, the revenue associated with point product arrangements bundled with enhanced SMS is recognized on a "daily ratable" basis, consistent with the revenue recognition of fees
38
on our aspenONE subscription offering arrangements. In fiscal 2012 and beyond, the ratable revenue from both aspenONE subscription arrangements and point product arrangements with enhanced SMS included for the term of the agreement will be presented in the consolidated statements of operations as "subscription and software revenue."
We generally do not intend to enter into new or renewal term contracts that will qualify for revenue recognition upfront, upon delivery of the licensed software. We may, however, do so on a limited basis, as follows:
- •
- The incremental revenue associated with amendments to existing term license agreements that was recognized under the
upfront revenue model will continue to be accounted for on an upfront basis, provided all other revenue recognition requirements have been met.
- •
- We anticipate that occasionally a customer may wish to license point products on a perpetual basis. If we agree to enter into a perpetual license agreement, the customer will not be entitled to receive software products that may be introduced and will receive SMS for only one year, subject to annual renewal at the election of the customer. Accordingly, we expect that the license fees for perpetual license agreements typically will continue to be recognized upon delivery of the software products using the residual method.
We do not anticipate that any of the foregoing arrangements will generate a significant portion of our revenue in the future.
SMS
Prior to fiscal 2010, SMS was typically included with the license agreement for the initial year of the license term and then could be renewed, typically on an annual basis, at the election of the customer. The fair value of SMS was deferred and subsequently recognized over the term of the SMS arrangement as services and other revenue in the consolidated statements of operations.
Since July 2009, license agreements executed under our aspenONE subscription and point product offerings include SMS for the full term of the arrangement. For arrangements sold under the aspenONE subscription offering, the license and SMS components of the arrangement cannot be separated. As a result, all of the related revenue is reported as subscription revenue in the consolidated statements of operations. Throughout fiscal 2011 and 2010, the SMS component of point product licenses is reported in services and other revenue in the consolidated statements of operations. Standalone renewal SMS on perpetual arrangements is reported as services and other revenue in the consolidated statements of operations.
Since we do not have VSOE for our enhanced SMS offering, in fiscal 2012 and beyond, the SMS component of point product arrangements will no longer be separable. Going forward, revenue from point product arrangements with enhanced SMS included for the term of the agreement will be presented in the consolidated statements of operations as "subscription and software revenue."
Professional Services
We provide professional services on a time-and-materials or fixed-price basis. We recognize professional services fees for time-and-materials contracts based upon hours worked and contractually agreed-upon hourly rates. We recognize revenue from fixed-price engagements using the proportional performance method, based on the ratio of costs incurred, substantially all of which are labor-related, to the total estimated project costs. Project costs are based on standard rates, which vary by the consultant's professional level, plus all direct expenses incurred to complete the engagement that are not reimbursed by the client. Project costs are typically expensed as incurred. Reimbursable amounts received from customers for out-of-pocket expenses are recorded as revenue.
39
We generally recognize revenue from professional services as the services are performed, assuming all other revenue recognition criteria have been met. Revenue from committed professional service arrangements that are sold as a single arrangement with, or in contemplation of, a licensing transaction is deferred and recognized on a ratable basis over the longer of (a) the period the services are performed or (b) the term of the related software arrangement. Under the upfront model, this typically resulted in professional services revenue being recognized over the period the services were performed. Under the subscription-based licensing model, this typically results in professional services revenue being recognized over the term of the related software arrangement. Our typical contract term approximates five years. Revenue recognized with respect to professional services is reported as services and other revenue in the consolidated statements of operations.
Key Components of Operations
Revenue
Subscription Revenue. Subscription revenue relates to the licensing of our products under our aspenONE subscription offering, where SMS is included for the entire term of the arrangement and the customer receives the right to unspecified future software products that may be introduced during the term of the arrangement for no additional fee. For arrangements sold under the aspenONE subscription offering, the license and SMS components of the arrangement cannot be separated. As a result, all of the related revenue is recognized ratably, and is reported as subscription revenue in the consolidated statements of operations. Beginning in fiscal 2012, subscription and software revenue will also include the fees from point product arrangements with SMS included for the term of the arrangement, for which we have not established VSOE.
Software Revenue. Software revenue consists of all license transactions that do not contain rights to future unspecified software products for no additional fee. Specifically, software revenue includes:
- •
- license revenue recognized under the upfront revenue model upon the delivery of the licensed software (that is, both
perpetual and term license agreements);
- •
- license revenue recognized over the term of the license agreements for term agreements, including point product licenses
with SMS included for the license term. Beginning in fiscal 2012, revenue from point product arrangements with SMS included for the license term will be recorded as subscription and software; and
- •
- other license revenue derived from transactions that are being recognized over time as the result of not previously meeting one or more of the requirements for recognition under the upfront revenue model.
Services and Other Revenue. Our services and other revenue consists primarily of revenue related to professional services, SMS from point product arrangements and standalone SMS renewals (excluding SMS on our aspenONE subscription arrangements) and training. Beginning in fiscal 2012, SMS revenue will also exclude fees from point product arrangement where we have not established VSOE for the SMS deliverable.
The amount and timing of this revenue depend on a number of factors, including:
- •
- whether the professional services arrangement was sold as a single arrangement with, or in contemplation of, a new
aspenONE licensing transaction;
- •
- the number, value and rate per hour of service transactions booked during the current and preceding periods;
40
- •
- the number and availability of service resources actively engaged on billable projects;
- •
- the timing of milestone acceptance for engagements contractually requiring customer sign-off;
- •
- the timing of negotiating and signing maintenance renewals;
- •
- the timing of collection of cash payments when collectability is uncertain; and
- •
- the size of the installed base of license contracts.
Cost of Revenue
Cost of Subscription and Software. The cost of subscription and software revenue consists of royalties, amortization of capitalized software costs, distribution fees, the costs of providing SMS on arrangements where the related revenue is recorded as subscription revenue, and costs related to delivery of software.
Cost of Services and Other. Our cost of services and other revenue consists primarily of personnel-related and external consultant costs associated with providing professional services, SMS on arrangements not recognized on a subscription basis and training to customers.
Operating Expenses
Selling and Marketing Expense. Selling expenses consist primarily of the personnel and travel expenses related to the effort expended to license our products and services to current and potential customers, as well as for overall management of customer relationships. Marketing expenses include expenses needed to promote our company and our products and to acquire market research and measure customer opinions to help us better understand our customers and their business needs.
Research and Development Expense. Research and development expenses primarily consist of personnel and external consultant expenses related to the creation of new products and to enhancements and engineering changes to existing products.
General and Administrative Expense. General and administrative expenses include the costs of corporate and support functions, such as executive leadership and administration groups, finance, legal, human resources and corporate communications, and other costs such as outside professional and consultant fees and provision for bad debts.
Restructuring Charges. Restructuring charges result from the closure or consolidation of our facilities, or from qualifying reductions in headcount.
Other Income and Expenses
Interest Income. Interest income is recorded for the accretion of interest on the installment payments of our term software license contracts when revenue is recognized upfront at net present value, and to a lesser extent from the investment of cash balances in short-term instruments.
Interest Expense. Interest expense consists of charges primarily related to our secured borrowings. Secured borrowings are derived from our borrowing arrangements with unrelated financial institutions.
Other Income (Expense), Net. Other income (expense), net is comprised primarily of foreign currency exchange gains (losses) generated from the settlement and remeasurement of transactions denominated in currencies other than the functional currency of our operating units. We may enter into foreign currency forward contracts to attempt to minimize the adverse impact related to unfavorable exchange rate movements, although we have not done so since fiscal 2008. Historically, our foreign currency forward contracts have not been designated as hedging instruments and, therefore, do not
41
qualify for fair value or cash flow hedge treatment under the criteria of Accounting Standards Codification, or ASC, Topic 815, Derivatives and Hedging. Therefore, any unrealized gains and losses on the foreign currency forward contracts, as well as the underlying transactions we are attempting to shield from exchange rate movements, would be recognized as a component of other income (expense), net.
Provision for Income Taxes. Provision for income taxes is comprised of the taxes currently payable as a result of domestic and foreign operations and the net tax effects of book-tax timing differences. We record interest and penalties related to income tax matters as income tax expense. We expect the amount of income tax expense, if any, to vary each reporting period depending upon fluctuations in our taxable income and our ability to utilize tax benefits from net loss carry-forwards.
Key Business Metrics
Background
With the adoption of our aspenONE subscription offering, our revenue for fiscal 2011 and 2010 was significantly less than in the years preceding our model change. We expect that our revenue will increase as customers renew their licensing arrangements under our subscription-based licensing model. We do not expect to recognize levels of revenue comparable to prior fiscal years until a significant majority of our existing license agreements has been renewed under our subscription-based licensing model. As a result, we believe that, for the next few years, a number of our performance indicators based on U.S. generally accepted accounting principles or GAAP, including revenue, gross profit, operating income (loss) and net income (loss), will be of limited value in assessing our performance, growth and financial condition. Accordingly, we instead are focusing on certain non-GAAP and other business metrics, including the key metrics set forth below, to track our business performance. None of these metrics should be considered as an alternative to any measure of financial performance calculated in accordance with GAAP.
To supplement our statements of cash flows presented on a GAAP basis, we use the non-GAAP measure of free cash flow to analyze cash flows generated from our operations. Management believes that this financial measure is useful to investors because it permits investors to view our performance using the same tools that management uses to gauge progress in achieving our goals. We believe this measure is also useful to investors because it is an indication of cash flow that may be available to fund further investments in future growth initiatives and it is also useful as a basis for comparing our performance with that of our competitors. To supplement our presentation of total cost of revenue and total operating costs presented on a GAAP basis, we use a non-GAAP measure of adjusted total costs, which excludes certain non-cash and non-recurring expenses. Management believes that this financial measure is useful to investors because it demonstrates the cash operating costs of the business. The presentation of these non-GAAP measures is not meant to be considered in isolation or as an alternative to cash flows from operating activities as a measure of liquidity or as an alternative to total cost of revenue and total operating costs as a measure of our total costs.
Total Term Contract Value
Total term contract value, or TCV, is an estimate of the renewal value, as of a specific date, of our active portfolio of term license agreements. TCV is calculated by multiplying the terminal annual payment for each active term license agreement by the original length of the existing license term, and then aggregating this amount for all active term license agreements. Accordingly, TCV represents the full renewal value of all of our current term license agreements under the hypothetical assumption that all of those agreements are simultaneously renewed for the identical license terms and at the same terminal annual payment amounts. TCV includes the value of SMS for any multi-year license agreements for which SMS is committed for the entire license term. TCV does not include any
42
amounts for perpetual licenses, professional services, training or standalone renewal SMS. TCV is calculated using constant currency assumptions for agreements denominated in currencies other than U.S. dollars in order to remove the impact of currency fluctuations between comparison dates.
We also estimate a license-only TCV, which we refer to as "TLCV," by removing the SMS portion of TCV using our historic estimated selling price for SMS. Our portfolio of active license agreements currently reflect a mix of (a) license agreements that include SMS for the entire license term and (b) legacy license agreements that do not include SMS. TLCV provides a consistent basis for assessing growth, particularly while customers are continuing to transition to arrangements that include SMS for the term of the arrangement.
We believe TCV and TLCV are useful metrics for analyzing our business performance, particularly while we are transitioning to our aspenONE subscription offering and revenue comparisons between fiscal periods do not reflect the actual growth rate of our business. Comparing TCV and TLCV for different dates provides insight into the growth and retention rate of our business during the period between those dates.
TCV and TLCV increase as the result of:
- •
- new term license agreements with new or existing customers;
- •
- renewals or modifications of existing license agreements that result in higher license fees due to price escalation or an
increase in the number of tokens (units of software usage) or products licensed; and
- •
- renewals of existing license agreements that increase the length of the license term.
The renewal of an existing license agreement will not increase TCV and TLCV unless the renewal results in higher license fees or a longer license term. TCV and TLCV are adversely affected by customer non-renewals and by renewals that result in lower license fees or a shorter license term. Our standard license term historically has been between five and six years, and we do not expect this standard term to change in the future. Many of our contracts have escalating annual payments throughout the term of the arrangement. By calculating TCV and TLCV based on the terminal year annual payment, we are typically using the highest annual fee from the existing arrangement to calculate the hypothetical renewal value of our portfolio of term arrangements.
We estimate that TLCV grew by approximately 11.7% during fiscal 2011 from $1.14 billion at June 30, 2010 to $1.28 billion at June 30, 2011, principally as the result of an increase in the number of tokens or products licensed. We estimate that TCV grew 16.9% during fiscal 2011 from $1.22 billion at June 30, 2010 to $1.42 billion at June 30, 2011.
Future Cash Collections and Billings Backlog
Future cash collections is the sum of billings backlog, accounts receivable, undiscounted installments receivable and undiscounted collateralized receivables. Billings backlog represents the aggregate value of uninvoiced bookings from prior and current periods that is not reflected on our consolidated balance sheets.
Prior to fiscal 2010, the majority of bookings was recognized as revenue in the period booked and reflected on our balance sheet as installments receivable, or if sold, as collateralized receivables. Installments receivable and collateralized receivables were discounted to net present value at prevailing market rates at the time of the transaction. Amounts collected for collateralized receivables are applied to pay the related secured borrowings and are not available for any other expenditures.
Under our aspenONE subscription offering and for point product arrangements with SMS included for the entire term of the arrangement, extended contractual payments are not considered fixed or
43
determinable and, as a result, are not included in installments receivable or collateralized receivables. These future payments are included in billings backlog, which is not reflected on our consolidated balance sheets. We believe future cash collections is a useful metric because it provides insight into the cash generation capability of our business. Under the upfront revenue model, we did not previously monitor billings backlog or future cash collections since we believed that accounts receivable, installments receivable, collateralized receivables and certain other measures were appropriate indicators of estimated cash generation at that time.
Since a substantial majority of our future bookings will reflect arrangements which include SMS for the term of the arrangement, we expect billings backlog to grow over time and expect installments receivable and collateralized receivables to decline. When all customers have transitioned to arrangements which include SMS for the term of the arrangement, future cash collections will include all contractually committed sources of cash associated with our licensing and SMS business. The only sources of cash that will continue to be excluded from future cash collections will be amounts attributable to professional services, training and any remaining standalone SMS.
The following table provides our future cash collections as of the dates presented:
| |
June 30, | ||||||||||
|---|---|---|---|---|---|---|---|---|---|---|---|
| |
2011 | 2010 | 2009 | ||||||||
| |
(Dollars in Thousands) |
||||||||||
Billings backlog |
$ | 640,988 | $ | 389,354 | $ | 100,499 | |||||
Accounts receivable, net |
27,866 | 31,738 | 49,882 | ||||||||
Installments receivable, undiscounted (non-GAAP)(1) |
95,796 | 147,315 | 208,204 | ||||||||
Collateralized receivables, undiscounted (non-GAAP)(1) |
26,691 | 56,461 | 107,750 | ||||||||
Future cash collections |
$ | 791,341 | $ | 624,868 | $ | 466,335 | |||||
- (1)
- Excludes unamortized discount.
The growth in billings backlog and future cash collections in fiscal 2011 reflected our customers' continued adoption of our subscription-based licensing model. We are actively engaged in transitioning customers from perpetual license arrangements to our subscription-based licensing model. Prior to fiscal 2008, we licensed our aspenONE Manufacturing and Supply Chain suite primarily on a perpetual basis, and as we convert these customers to our subscription-based licensing model, their licensing fees and SMS will become part of billings backlog and future cash collections.
Installments and collateralized receivables are shown at net present value on our consolidated balance sheets. Future cash collections excludes the unamortized discount on installment and collateralized receivables. Amounts collected for collateralized receivables are applied to pay the related secured borrowings and are not available for any other expenditures. We are providing the following reconciliation for the periods presented to reconcile to undiscounted installment and
44
collateralized receivables, as included in our future cash collections metric, with GAAP installment receivables, net and GAAP collateralized receivables, net:
| |
June 30, | ||||||||||
|---|---|---|---|---|---|---|---|---|---|---|---|
| |
2011 | 2010 | 2009 | ||||||||
| |
(Dollars in Thousands) |
||||||||||
Installments receivable, undiscounted (non-GAAP) |
$ | 95,796 | $ | 147,315 | $ | 208,204 | |||||
Unamortized discount |
(9,320 | ) | (18,717 | ) | (30,283 | ) | |||||
Installments receivable, net |
86,476 | 128,598 | 177,921 | ||||||||
Collateralized receivables, undiscounted (non-GAAP) |
26,691 | 56,461 | 107,750 | ||||||||
Unamortized discount |
(1,652 | ) | (5,031 | ) | (11,384 | ) | |||||
Collateralized receivables, net |
$ | 25,039 | $ | 51,430 | $ | 96,366 | |||||
Bookings
Bookings are a measure of the business closed during a period and represent the amount of contractually committed subscription and software fees, including any bundled SMS. Bookings do not include (a) fees for professional services, training or standalone renewal SMS or (b) any amount of subscription and/or software fees from pre-existing license agreements that were replaced by new arrangements prior to their scheduled expiration date. The contractual arrangements that contribute to bookings represent binding payment commitments by customers over periods that typically range from five to six years, although individual customer commitments can be for longer or shorter periods.
The following table presents our bookings for fiscal 2011 and 2010, following the introduction of our aspenONE subscription offering:
| |
Year ended June 30, | Period-to-period Change |
|||||||||||
|---|---|---|---|---|---|---|---|---|---|---|---|---|---|
| |
2011 | 2010 | $ | % | |||||||||
| |
(Dollars in Thousands) |
|
|||||||||||
Bookings |
$ | 388,749 | $ | 365,948 | $ | 22,801 | 6.2 | % | |||||
Period over-period bookings comparisons may not be particularly meaningful. The amount of bookings in a period is a function of (a) the volume, duration and value of contracts renewed during the period and (b) the amount of bookings that contribute to growth of TCV and TLCV (as described above). Contract renewals may occur on or near the expiration date of the existing contract (natural renewal), or alternatively, customers may elect to renew their contracts substantially in advance of the expiration date (early renewal). The timing and value of contract renewals has a significant impact on quarter-over-quarter and year-over-year comparisons of bookings. Therefore, short-term bookings trends are not indicative of the growth of the business.
Fiscal 2011 and 2010 growth and renewal bookings were both strong, demonstrating our customer's acceptance of our aspenONE subscription model. Because of the limitations of period-over-period bookings comparisons, we primarily focus on bookings' contribution to growth in TCV, TLCV, billings backlog and future cash collections as future indicators of revenue and cash flow growth.
45
Adjusted Total Costs
The following table presents our total cost of revenue and total operating expenses, as adjusted for stock-based compensation expense, for the indicated periods:
| |
Year Ended June 30, | |
|
|
|
||||||||||||||||||
|---|---|---|---|---|---|---|---|---|---|---|---|---|---|---|---|---|---|---|---|---|---|---|---|
| |
Period-to-Period Change 2011 to 2010 |
Period-to-Period Change 2010 to 2009 |
|||||||||||||||||||||
| |
2011 | 2010 | 2009 | ||||||||||||||||||||
| |
(Dollars in Thousands) |
$ |
% |
$ |
% |
||||||||||||||||||
Total cost of revenue |
$ | 52,345 | $ | 66,110 | $ | 75,820 | $ | (13,765 | ) | (20.8 | )% | $ | (9,710 | ) | (12.8 | )% | |||||||
Total operating expenses |
200,385 | 209,604 | 191,826 | (9,219 | ) | (4.4 | ) | 17,778 | 9.3 | % | |||||||||||||
Total expenses |
252,730 | 275,714 | 267,646 | (22,984 | ) | (8.3 | ) | 8,068 | 3.0 | % | |||||||||||||
Less: |
|||||||||||||||||||||||
Stock-based compensation |
(9,699 | ) | (15,260 | ) | (4,670 | ) | 5,561 | (36.4 | ) | (10,590 | ) | 226.8 | % | ||||||||||
Adjusted total costs (non-GAAP) |
$ | 243,031 | $ | 260,454 | $ | 262,976 | $ | (17,423 | ) | (6.7 | )% | $ | (2,522 | ) | (1.0 | )% | |||||||
Total expenses decreased $23.0 million in fiscal 2011 compared to 2010 and increased $8.1 million in fiscal 2010 compared to 2009. Adjusted total costs, which consist of total cost of revenue and total operating expenses, adjusted to exclude stock-based compensation, decreased by $17.4 million in fiscal 2011 compared to 2010 and $2.5 million in fiscal 2010 compared to 2009.
Stock-Based Compensation Expense
Stock-based compensation expense decreased $5.6 million in fiscal 2011 compared to 2010 and increased $10.6 million in fiscal 2010 compared to 2009. The size and vesting characteristics of our fiscal 2010 annual grant caused the increased level of stock-based compensation expense for fiscal 2010 compared to 2011 and 2009. During fiscal 2008, 2009 and for a portion of fiscal 2010, we were unable to issue equity awards to our directors and employees. In the second quarter of fiscal 2010, we became current with our SEC filings and we issued 2.7 million restricted stock units and 0.3 million stock options to our directors and employees. A portion of these awards vested upon issuance. For additional information about stock-based compensation program, see Note 9 to our Consolidated Financial Statements, "Stock-based Compensation."
Fiscal 2011 Compared to Fiscal 2010
The most significant components of the period-over-period decrease in adjusted total costs were decreased professional services costs (excluding stock-based compensation expenses) of $11.2 million, reduced finance related consultant and audit fees of $9.6 million, and lower royalty expense. These expense decreases were partially offset by increased legal and related expenses of $7.9 million. Legal expenses in the period primarily relate to the ATME matter and proceedings we have instituted to enforce our intellectual property rights. Please refer to Part I, Item 3, "Legal Proceedings," for more information on specific matters. Legal expenses for fiscal 2011 also include expenses related to the secondary offering of our common stock, which was effective as of September 22, 2010. For additional information on the comparison of fiscal 2011 to 2010 expenses, see "—Results of Operations."
Fiscal 2010 Compared to Fiscal 2009
The most significant components of the period-over-period decrease in adjusted total costs were lower expenses for finance related consultant and audit fees of $8.1 million, royalties of $5.0 million, payroll and benefits of $3.1 million, and third-party commissions of $1.2 million. These expense decreases were partially offset by increased expenses for sales commissions of $6.9 million, legal and
46
related expenses of $4.9 million and bonuses of $5.0 million. During fiscal 2010 we met all of our bonus criteria and accrued 100% of our bonus plan, as compared to 50% in fiscal 2009.
Free Cash Flow
Free cash flow is calculated as net cash provided by operating activities less the sum of (a) purchase of property, equipment, and leasehold improvements and (b) capitalized computer software development costs.
Customer collections and, consequently, cash flow from operating activities and free cash flow are primarily driven by license and services billings, rather than recognized revenue. As a result, the transition to our aspenONE subscription offering has not had an adverse impact on cash receipts. Until existing license contracts are renewed and license-related revenue returns to prior year levels, we believe free cash flow is a more relevant measure of our financial performance than income statement profitability measures such as total revenue, gross profit, operating profit and net income. Additionally, we also believe that free cash flow is often used by security analysts, investors and other interested parties in the evaluation of software companies.
The following table provides a reconciliation of net cash flow to free cash flow provided by operating activities for the periods presented:
| |
Year Ended June 30, | ||||||||||
|---|---|---|---|---|---|---|---|---|---|---|---|
| |
2011 | 2010 | 2009 | ||||||||
| |
(Dollars in Thousands) |
||||||||||
Net cash provided by operating activities |
$ | 63,330 | $ | 38,622 | $ | 33,032 | |||||
Purchase of property, equipment and leasehold improvements |
(2,839 | ) | (2,652 | ) | (2,972 | ) | |||||
Capitalized computer software development costs |
(1,990 | ) | (699 | ) | (2,382 | ) | |||||
Free cash flow (non-GAAP) |
$ | 58,501 | $ | 35,271 | $ | 27,678 | |||||
We believe we will continue to realize improved free cash flow as we benefit from the continued growth of our portfolio of term license contracts, combined with continued focus on cost management and as customers continue to renew contracts that were previously paid upfront. As part of our historical contract arrangements, customers could elect to pay for their term licenses upfront rather than over the contract term. The upfront payment would normally be equal to the net present value of the annual cash payments, typically discounted at an 8% rate. Prior period practices of upfront payments resulted in increased cash flow variability, both in the period of the payment, and the subsequent years of the contract term. We have moved away from upfront payments in recent years, and as a result, we expect cash flows to continue to normalize over the next several years.
47
Results of Operations
Comparison of Fiscal 2011 to Fiscal 2010
The following table sets forth the results of operations, percentage of net revenue and the period-over-period percentage change in certain financial data for fiscal 2011 and 2010:
| |
Year Ended June 30, | |
||||||||||||||||
|---|---|---|---|---|---|---|---|---|---|---|---|---|---|---|---|---|---|---|
| |
2011 | 2010 | % Change | |||||||||||||||
| |
(Dollars in Thousands) |
|
||||||||||||||||
Revenue: |
||||||||||||||||||
Subscription |
$ | 58,459 | 29.5 | % | $ | 11,071 | 6.7 | % | *% | |||||||||
Software |
45,240 | 22.8 | 42,920 | 25.8 | 5.4 | |||||||||||||
Total subscription and software |
103,699 | 52.3 | 53,991 | 32.5 | 92.1 | |||||||||||||
Services and other |
94,455 | 47.7 | 112,353 | 67.5 | (15.9 | ) | ||||||||||||
Total revenue |
198,154 | 100.0 | 166,344 | 100.0 | 19.1 | |||||||||||||
Cost of revenue: |
||||||||||||||||||
Subscription and software |
5,213 | 2.6 | 6,437 | 3.9 | (19.0 | ) | ||||||||||||
Services and other |
47,132 | 23.8 | 59,673 | 35.9 | (21.0 | ) | ||||||||||||
Total cost of revenue |
52,345 | 26.4 | 66,110 | 39.7 | (20.8 | ) | ||||||||||||
Gross profit |
145,809 | 73.6 | 100,234 | 60.3 | 45.5 | |||||||||||||
Operating expenses: |
||||||||||||||||||
Selling and marketing |
90,771 | 45.8 | 97,002 | 58.3 | (6.4 | ) | ||||||||||||
Research and development |
50,820 | 25.6 | 48,228 | 29.0 | 5.4 | |||||||||||||
General and administrative |
59,041 | 29.8 | 63,246 | 38.0 | (6.6 | ) | ||||||||||||
Restructuring charges |
(247 | ) | (0.1 | ) | 1,128 | 0.7 | * | |||||||||||
Total operating expenses |
200,385 | 101.1 | 209,604 | 126.0 | (4.4 | ) | ||||||||||||
Loss from operations |
(54,576 | ) | (27.5 | ) | (109,370 | ) | (65.7 | ) | (50.1 | ) | ||||||||
Interest income |
13,075 | 6.6 | 19,324 | 11.6 | (32.3 | ) | ||||||||||||
Interest expense |
(5,138 | ) | (2.6 | ) | (8,455 | ) | (5.1 | ) | (39.2 | ) | ||||||||
Other income (expense), net |
2,919 | 1.5 | (2,407 | ) | (1.4 | ) | (221.3 | ) | ||||||||||
Loss before provision for taxes |
(43,720 | ) | (22.1 | ) | (100,908 | ) | (60.7 | ) | (56.7 | ) | ||||||||
(Benefit from) provision for income taxes(1) |
(53,977 | ) | (27.2 | ) | 6,537 | 3.9 | * | |||||||||||
Net income (loss)(1) |
$ | 10,257 | 5.2 | % | $ | (107,445 | ) | (64.6 | )% | (109.5 | )% | |||||||
- *
- Not meaningful.
- (1)
- Our income tax provision provided a net $54.0 million benefit in fiscal 2011, due to the reversal of a significant portion of our U.S. valuation allowance in the fourth quarter of fiscal 2011. See Note 10 to our Consolidated Financial Statements, "Income Taxes," for further information.
Revenue
Total revenue increased by $31.8 million compared to the prior year. The increase was due to higher subscription and software revenue of $49.7 million, partially offset by lower services and other revenue of $17.9 million.
48
Subscription Revenue
| |
Year Ended June 30, | Period-to-Period Change |
|||||||||||
|---|---|---|---|---|---|---|---|---|---|---|---|---|---|
| |
2011 | 2010 | $ | % | |||||||||
| |
(Dollars in Thousands) |
|
|||||||||||
Subscription revenue |
$ | 58,459 | $ | 11,071 | $ | 47,388 | * | ||||||
As a percent of revenue |
29.5 | % | 6.7 | % | |||||||||
- *
- Not meaningful.
The increase in subscription revenue for fiscal 2011 is a result of a larger base of aspenONE subscription bookings from previous periods being recognized as revenue on a subscription basis in the current year. The modest amount of subscription revenue for the prior year was a result of subscription arrangements not being offered prior to fiscal 2010. We expect subscription revenue to continue to increase as customers renew existing contracts under our aspenONE subscription offering and subscription contracts become a more significant portion of our term license portfolio.
Software Revenue
| |
Year Ended June 30, | Period-to-Period Change |
|||||||||||
|---|---|---|---|---|---|---|---|---|---|---|---|---|---|
| |
2011 | 2010 | $ | % | |||||||||
| |
(Dollars in Thousands) |
|
|||||||||||
Software revenue |
$ | 45,240 | $ | 42,920 | $ | 2,320 | 5.4 | % | |||||
As a percent of revenue |
22.8 | % | 25.8 | % | |||||||||
The period-over-period increase in software revenue for fiscal 2011 resulted from increased revenue of $10.5 million from point product arrangements with SMS included for the entire term and $0.4 million from perpetual arrangements, partially offset by decreased revenue of $8.6 million from legacy software arrangements.
In fiscal 2011, revenue from legacy software arrangements totaled $22.8 million. Of the total legacy revenue, $21.1 million, or 93%, related to revenue that was not recorded in prior periods due to the arrangement not meeting all of the requirements for upfront revenue recognition. Amendments to legacy term arrangements that qualified for upfront revenue recognition in fiscal 2011 totaled $1.7 million.
We expect legacy software revenue to continue to decrease and be replaced with subscription revenue as legacy arrangements are renewed on our subscription-based license model. We do not expect point products licensed on a perpetual basis to be a significant source of revenue.
Services and Other Revenue
| |
Year Ended June 30, | Period-to-Period Change |
|||||||||||
|---|---|---|---|---|---|---|---|---|---|---|---|---|---|
| |
2011 | 2010 | $ | % | |||||||||
| |
(Dollars in Thousands) |
|
|||||||||||
Professional services revenue |
$ | 29,334 | $ | 37,491 | $ | (8,157 | ) | (21.8 | )% | ||||
SMS and other revenue |
65,121 | 74,862 | (9,741 | ) | (13.0 | ) | |||||||
Services and other revenue |
$ | 94,455 | $ | 112,353 | $ | (17,898 | ) | (15.9 | )% | ||||
As a percent of revenue |
47.7 | % | 67.5 | % | |||||||||
49
Professional Services Revenue
The period-over-period decrease in professional services revenue for fiscal 2011 primarily relates to decreased customer demand for professional services and higher professional services revenue deferrals. We often compete with a number of qualified competitors when bidding for professional service contracts, particularly in developed markets where our products are well established. Having a robust network of providers that can provide professional services to support the deployment and utilization of our software is beneficial to our licensing and SMS businesses. However, this competitive environment has had an unfavorable impact on our professional services business.
Under the aspenONE subscription offering, revenue from committed professional service arrangements that are sold as a single arrangement with, or in contemplation of, a new aspenONE licensing transaction is deferred and recognized on a ratable basis over the longer of (a) the period the services are performed or (b) the term of the related software arrangement. As our typical contract term approximates five years, professional services revenue on these types of arrangements will usually be recognized over a longer period than under the upfront revenue model. For fiscal 2011, we had net deferrals of $2.8 million for professional services bundled with aspenONE transactions.
The timing of revenue recognition on certain large arrangements can also impact the comparability of professional services revenue from period to period. In fiscal 2011, we deferred the recognition of $3.2 million of professional services revenue on certain large arrangements that did not meet the requirements for revenue recognition. By comparison, in fiscal 2010, we recognized approximately $4.5 million of previously deferred professional services revenue due to a large project achieving certain milestones.
SMS and Other Revenue
SMS and other revenue decreased for fiscal 2011, primarily due to customers transitioning to the aspenONE subscription offering, and, to a lesser extent, the continued trend of customers electing to replace perpetual license arrangements with new term contracts. Under the aspenONE subscription offering, SMS is included in subscription revenue, whereas it was presented as services and other revenue under the upfront revenue model.
Expenses
Cost of Subscription and Software Revenue
| |
Year Ended June 30, | Period-to-Period Change |
||||||||||||
|---|---|---|---|---|---|---|---|---|---|---|---|---|---|---|
| |
2011 | 2010 | $ | % | ||||||||||
| |
(Dollars in Thousands) |
|
||||||||||||
Cost of subscription and software revenue |
$ | 5,213 | $ | 6,437 | $ | (1,224 | ) | (19.0 | )% | |||||
Gross profit |
$ |
98,486 |
$ |
47,554 |
$ |
50,932 |
107.1 |
|||||||
Gross margin |
95.0 | % | 88.1 | % | ||||||||||
The period-over-period decrease in cost of subscription and software revenue for fiscal 2011 was primarily due to the reversal of a previously accrued liability resulting from the expiration of a technology vendor relationship. This reduction in expense was partially offset by a larger percentage of SMS services being provided to customers under aspenONE subscription offerings.
We allocate the portion of SMS costs associated with providing support services on our subscription products to cost of subscription and software revenue, in order to match the expense with the related revenue. Prior to the introduction of the aspenONE subscription offering in fiscal 2010, the costs associated with providing SMS were all included in cost of services and other revenue. As more
50
customers transition to the subscription-based licensing model, more of the related SMS costs will be included in cost of subscription and software.
After excluding the impact of the reversal of the previously accrued liability for fiscal 2011, our subscription and software gross margins were 91%, which was slightly higher than fiscal 2010.
Cost of Services and Other Revenue
| |
Year Ended June 30, | Period-to-Period Change |
||||||||||||
|---|---|---|---|---|---|---|---|---|---|---|---|---|---|---|
| |
2011 | 2010 | $ | % | ||||||||||
| |
(Dollars in Thousands) |
|
||||||||||||
Cost of services and other revenue |
$ | 47,132 | $ | 59,673 | $ | (12,541 | ) | (21.0 | )% | |||||
Gross profit |
$ |
47,323 |
$ |
52,680 |
$ |
(5,357 |
) |
(10.2 |
) |
|||||
Gross margin |
50.1 | % | 46.9 | % | ||||||||||
Our services and other revenue gross margins increased to 50.1% in fiscal 2011, compared with 46.9% in fiscal 2010, primarily as a result of lower expense in our professional services business, partially offset by higher professional service revenue deferrals and the impact of higher margin SMS revenue migrating to subscription revenue under the aspenONE subscription model.
Going forward, we expect the revenues and costs related to our SMS business to continue to migrate to cost of subscription and software revenue under the subscription-based model. Because SMS revenue has a higher gross profit margin than our professional services business we expect the reported gross profit margin of services and other revenue to decline.
Cost of Professional Services Revenue
The largest component of the reduction in cost of services and other revenue for fiscal 2011 pertained to our professional services business, which accounted for $11.6 million of the period-over-period decrease. The decrease was primarily related to the reduction of staffing levels in the professional services organization and the timing of expense recognition on certain projects. We reduced our staffing levels in fiscal 2010 to better align our cost structure with the decreased demand for professional services. We received a full year of cost benefit related to these reductions in fiscal 2011.
The timing of expense recognition on professional service arrangements can also impact the comparability of cost of professional services revenue from period to period. In fiscal 2011, we deferred costs of $1.6 million on a large arrangement where we are also deferring the related revenue. Also contributing to the period-over-period decrease in costs was a loss accrual of approximately $3.0 million related to a large professional service arrangement which was recognized in the fourth quarter of fiscal 2010.
Cost of SMS and Other Revenue
Cost of SMS and other revenue decreased $0.9 million in fiscal 2011, primarily due to the migration of SMS costs on our aspenONE subscription arrangements to cost of subscription and software revenue. As the subscription business grows, we expect the cost of SMS revenue to continue to migrate from cost of services and other revenue to cost of subscription and software revenue. Eventually, we expect the majority of the costs of our SMS business to be presented in cost of subscription and software revenue.
51
Selling and Marketing Expense
| |
Year Ended June 30, | Period-to-Period Change |
|||||||||||
|---|---|---|---|---|---|---|---|---|---|---|---|---|---|
| |
2011 | 2010 | $ | % | |||||||||
| |
(Dollars in Thousands) |
|
|||||||||||
Selling and Marketing |
$ | 90,771 | $ | 97,002 | $ | (6,231 | ) | (6.4 | )% | ||||
The period-over-period decrease in selling and marketing expense for fiscal 2011 primarily resulted from lower compensation expense of $4.0 million, including lower commissions, and lower stock-based compensation expense of $2.1 million.
Research and Development Expense
| |
Year Ended June 30, | Period-to-Period Change |
|||||||||||
|---|---|---|---|---|---|---|---|---|---|---|---|---|---|
| |
2011 | 2010 | $ | % | |||||||||
| |
(Dollars in Thousands) |
|
|||||||||||
Research and Development |
$ | 50,820 | $ | 48,228 | $ | 2,592 | 5.4 | % | |||||
The period-over-period increase in research and development expense for fiscal 2011 primarily resulted from higher compensation related costs of $3.7 million, partially offset by higher capitalized software development costs of $1.1 million and lower stock-based compensation expense of $0.7 million.
General and Administrative Expense
| |
Year Ended June 30, | Period-to-Period Change |
|||||||||||
|---|---|---|---|---|---|---|---|---|---|---|---|---|---|
| |
2011 | 2010 | $ | % | |||||||||
| |
(Dollars in Thousands) |
|
|||||||||||
General and Administrative |
$ | 59,041 | $ | 63,246 | $ | (4,205 | ) | (6.6 | )% | ||||
The period-over-period decrease in general and administrative expense for fiscal 2011 is primarily attributable to cost reductions for financial consultants of $6.5 million, lower audit and related expenses of $3.1 million, lower stock-based compensation of $2.3 million and net credits to our provision for doubtful account due to the collection of previously reserved receivables. These expense reductions were partially offset by higher legal and related costs of $7.9 million and, to a lesser extent, higher payroll and benefit related expenses.
The decrease in consultants and contractors fees is the result of our effort throughout fiscal 2010 to hire full-time finance personnel to replace and further reduce our reliance on more costly external consultants. In fiscal 2010, significant audit costs were incurred associated with the audit and filing of all of our fiscal 2009 Form 10-Q's and Form 10-K. By comparison, our fiscal 2011 audit and related expenses were for current period filings. Legal expenses in the period primarily relate to the ATME matter and proceedings we have instituted to enforce our intellectual property rights. Please refer to Part I, Item 3, "Legal Proceedings," for more information on specific matters.
52
Restructuring Charges
| |
Year Ended June 30, | Period-to-Period Change |
|||||||||||
|---|---|---|---|---|---|---|---|---|---|---|---|---|---|
| |
2011 | 2010 | $ | % | |||||||||
| |
(Dollars in Thousands) |
|
|||||||||||
Restructuring Charges |
$ | (247 | ) | $ | 1,128 | $ | (1,375 | ) | * | ||||
- *
- Not meaningful.
There were no new restructuring events in fiscal 2011. The activity in restructuring charges in fiscal 2011 resulted from accretion and adjustments to existing facilities-related restructuring plans.
Interest Income
| |
Year Ended June 30, | Period-to-Period Change |
|||||||||||
|---|---|---|---|---|---|---|---|---|---|---|---|---|---|
| |
2011 | 2010 | $ | % | |||||||||
| |
(Dollars in Thousands) |
|
|||||||||||
Interest Income |
$ | 13,075 | $ | 19,324 | $ | (6,249 | ) | (32.3 | )% | ||||
The period-over-period decrease in interest income for fiscal 2011 was primarily attributable to the continued decrease of our collateralized and installment receivables portfolios. We expect interest income to continue to decrease going forward.
Interest Expense
| |
Year Ended June 30, | Period-to-Period Change |
|||||||||||
|---|---|---|---|---|---|---|---|---|---|---|---|---|---|
| |
2011 | 2010 | $ | % | |||||||||
| |
(Dollars in Thousands) |
|
|||||||||||
Interest Expense |
$ | (5,138 | ) | $ | (8,455 | ) | $ | 3,317 | (39.2 | )% | |||
The period-over-period decrease in interest expense for fiscal 2011 was primarily attributable to lower average secured borrowing balances, resulting from the continued pay-down of our existing secured borrowing arrangements. We expect interest expense to continue to decrease going forward.
Other Income (Expense), Net
| |
Year Ended June 30, | Period-to-Period Change |
|||||||||||
|---|---|---|---|---|---|---|---|---|---|---|---|---|---|
| |
2011 | 2010 | $ | % | |||||||||
| |
(Dollars in Thousands) |
|
|||||||||||
Other Income (Expense), net |
$ | 2,919 | $ | (2,407 | ) | $ | 5,326 | (221.3 | )% | ||||
Other income (expense), net is comprised primarily of unrealized and realized foreign currency exchange gains and losses generated from the settlement and remeasurement of transactions denominated in currencies other than the functional currency of our operating units. Other income (expense), net also includes miscellaneous non-operating gains and losses.
For fiscal 2011, other income, net, included $3.3 million of currency gains, partially offset by write-off of a cost method investment. For fiscal 2010, other expenses, net, included $2.6 million of currency losses.
53
Provision for Income Taxes
| |
Year Ended June 30, | Period-to-Period Change |
|||||||||||
|---|---|---|---|---|---|---|---|---|---|---|---|---|---|
| |
2011 | 2010 | $ | % | |||||||||
| |
(Dollars in Thousands) |
|
|||||||||||
(Benefit from) provision for income taxes |
$ | (53,977 | ) | $ | 6,537 | $ | (60,514 | ) | * | ||||
- *
- Not meaningful.
The period-over-period decrease in the provision for income taxes was primarily due to the reversal of a significant portion of our U.S. valuation allowance in fiscal 2011. We made cash payments totaling $5.9 million in fiscal 2011, which were offset by cash refunds of $8.0 million. These payments were comprised of foreign payments of $5.7 million and U.S tax payments of $0.2 million.
Based on our evaluation of the realizability of our U.S. federal net operating loss carryforwards (NOLs), foreign tax credits, and R&D credits through the generation of future taxable income, a significant portion of the U.S. valuation allowance was reversed in the fourth quarter of fiscal year 2011. While we are currently operating at a taxable loss and have a history of losses, we have been able to forecast sufficient future operating results to utilize our deferred tax assets. In weighing the cumulative losses against our ability to forecast operating results and the incremental growth in our installed base of customers and acceptance of our subscription-based licensing model, we believe it is more likely than not that we will utilize these assets. Based on our current forecast, we expect that we will utilize all of our net operating losses ("NOLs"), foreign tax credits, and a portion of our R&D credits by fiscal year 2015, based on a "with and without" approach.
We have retained a small valuation allowance in the U.S. for the deferred tax asset related to our unrealized capital losses. We do not have any investments currently on our balance sheet that would give rise to a capital gain, and as a result, we believe that it is more likely than not that we will not receive a benefit from this deferred tax asset. We have also retained a valuation allowance on certain foreign subsidiarys' NOL carryfowards where it is more likely than not that a benefit will not be realized. At June 30, 2011, our total valuation allowance was $8.0 million.
54
Comparison of Fiscal 2010 to Fiscal 2009
The following table sets forth the results of operations, percentage of net revenue and the period-to-period percentage change in certain financial data for fiscal 2010 and 2009:
| |
Year Ended June 30, | |
||||||||||||||||
|---|---|---|---|---|---|---|---|---|---|---|---|---|---|---|---|---|---|---|
| |
2010 | 2009 | % Change | |||||||||||||||
| |
(Dollars in Thousands) |
|
||||||||||||||||
Revenue: |
||||||||||||||||||
Subscription |
$ | 11,071 | 6.7 | % | $ | — | — | % | *% | |||||||||
Software |
42,920 | 25.8 | 179,591 | 57.6 | (76.1 | ) | ||||||||||||
Total subscription and software(1) |
53,991 | 32.5 | 179,591 | 57.6 | (69.9 | ) | ||||||||||||
Services and other |
112,353 | 67.5 | 131,989 | 42.4 | (14.9 | ) | ||||||||||||
Total revenue |
166,344 | 100.0 | 311,580 | 100.0 | (46.6 | ) | ||||||||||||
Cost of revenue: |
||||||||||||||||||
Subscription and software |
6,437 | 3.9 | 12,409 | 4.0 | (48.1 | ) | ||||||||||||
Services and other |
59,673 | 35.9 | 63,411 | 20.4 | (5.9 | ) | ||||||||||||
Total cost of revenue |
66,110 | 39.7 | 75,820 | 24.3 | (12.8 | ) | ||||||||||||
Gross profit |
100,234 | 60.3 | 235,760 | 75.7 | (57.5 | ) | ||||||||||||
Operating expenses: |
||||||||||||||||||
Selling and marketing |
97,002 | 58.3 | 84,126 | 27.0 | 15.3 | |||||||||||||
Research and development |
48,228 | 29.0 | 46,375 | 14.9 | 4.0 | |||||||||||||
General and administrative |
63,246 | 38.0 | 58,256 | 18.7 | 8.6 | |||||||||||||
Restructuring charges |
1,128 | 0.7 | 2,446 | 0.8 | (53.9 | ) | ||||||||||||
Impairment of goodwill and intangible assets |
— | — | 623 | 0.2 | * | |||||||||||||
Total operating expenses |
209,604 | 126.0 | 191,826 | 61.6 | 9.3 | |||||||||||||
(Loss) income from operations |
(109,370 | ) | (65.7 | ) | 43,934 | 14.1 | (348.9 | ) | ||||||||||
Interest income |
19,324 | 11.6 | 22,698 | 7.3 | (14.9 | ) | ||||||||||||
Interest expense |
(8,455 | ) | (5.1 | ) | (10,516 | ) | (3.4 | ) | (19.6 | ) | ||||||||
Other (expense) income, net |
(2,407 | ) | (1.4 | ) | (1,824 | ) | (0.6 | ) | 32.0 | |||||||||
(Loss) income before provision for taxes |
(100,908 | ) | (60.7 | ) | 54,292 | 17.4 | (285.9 | ) | ||||||||||
Provision for income taxes |
6,537 | 3.9 | 1,368 | 0.4 | * | |||||||||||||
Net (loss) income |
$ | (107,445 | ) | (64.6 | )% | $ | 52,924 | 17.0 | % | (313.6 | )% | |||||||
- *
- Not meaningful.
- (1)
- In July 2009 we introduced our aspenONE licensing model under which license revenue is recognized over the term of a license contract. We previously recognized a substantial majority of our license revenue upfront, upon shipment of software. See "Item 7. Management's Discussion and Analysis and Results of Operations—Transition to AspenONE subscription offering."
Revenue
Total revenue in fiscal 2010 decreased primarily due to our transition to the aspenONE subscription offering. Total revenue from customers outside the United States was $102.8 million, or 61.8% of total revenue, and $213.9 million, or 68.7% of total revenue, for fiscal 2010 and 2009, respectively. The geographical mix of revenue can vary from period to period.
55
Subscription Revenue
| |
Year Ended June 30, |
Period-to-Period Change |
|||||||||||
|---|---|---|---|---|---|---|---|---|---|---|---|---|---|
| |
2010 | 2009 | $ | % | |||||||||
| |
(Dollars in Thousands) |
||||||||||||
Subscription revenue |
$ | 11,071 | $ | — | $ | 11,071 | * | ||||||
As a percent of revenue |
6.7 | % | * | ||||||||||
- *
- Not meaningful.
Subscription agreements were not offered prior to fiscal 2010. The relatively small amount of subscription revenue recognized in the current year is a reflection of both the ratable recognition of these arrangements and the short time span that the aspenONE subscription offering has been available. We expect subscription revenue to increase as customers renew existing contracts under our aspenONE subscription offering and subscription contracts become a more significant portion of our term license portfolio.
Software Revenue
| |
Year Ended June 30, |
Period-to-Period Change |
|||||||||||
|---|---|---|---|---|---|---|---|---|---|---|---|---|---|
| |
2010 | 2009 | $ | % | |||||||||
| |
(Dollars in Thousands) |
||||||||||||
Software revenue |
$ | 42,920 | $ | 179,591 | $ | (136,671 | ) | (76.1 | )% | ||||
As a percent of revenue |
25.8 | % | 57.6 | % | |||||||||
The decrease in software revenue was primarily attributable to the changes to our business model described above. Prior to July 2009, the substantial majority of our license revenue was recognized on an upfront basis. Going forward, we expect that most of our software revenue will be recognized over the contract term, either on a subscription basis or as payments become due.
The period-over-period decrease in software revenue for fiscal 2010 primarily resulted from decreased revenue of $146.3 million from upfront software arrangements. Decreases in revenue for the period were partially offset by increased revenue of $9.6 million from point product arrangements with SMS included for the entire term.
In fiscal 2010, revenue from legacy software arrangements totaled $33.3 million. Of the total legacy revenue, $28.4 million, or 85%, related to revenue that was not recorded in prior periods due to the arrangement not meeting all of the requirements for upfront revenue recognition. Perpetual license revenue totaled $1.9 million in fiscal 2010.
Services and Other Revenue
| |
Year Ended June 30, |
Period-to-Period Change |
|||||||||||
|---|---|---|---|---|---|---|---|---|---|---|---|---|---|
| |
2010 | 2009 | $ | % | |||||||||
| |
(Dollars in Thousands) |
||||||||||||
Services and other revenue |
$ | 112,353 | $ | 131,989 | $ | (19,636 | ) | (14.9 | )% | ||||
As a percent of revenue |
67.5 | % | 42.4 | % | |||||||||
56
Professional Services Revenue
| |
Year Ended June 30, |
Period-to-Period Change |
|||||||||||
|---|---|---|---|---|---|---|---|---|---|---|---|---|---|
| |
2010 | 2009 | $ | % | |||||||||
| |
(Dollars in Thousands) |
||||||||||||
Professional services revenue |
$ | 37,491 | $ | 48,352 | $ | (10,861 | ) | (22.5 | )% | ||||
As a percent of revenue |
22.5 | % | 15.5 | % | |||||||||
Customer demand for professional services began to decline in the second quarter of fiscal 2009, coincident with the downturn in the global economic environment, and continued throughout fiscal 2010. We often compete with a number of qualified competitors when bidding for professional service contracts, particularly in developed markets where our products are well established. Having a robust network of providers that can provide professional services to support the deployment and utilization of our software is beneficial to our licensing and SMS businesses. However, this competitive environment can have an unfavorable impact on our professional services revenue. Although there were signs of increased customer demand in the fourth quarter of fiscal 2010, we cannot be certain that this higher level of activity will continue throughout fiscal 2011 or beyond. We expect to realize growth opportunities in developing markets, in particular the Middle East.
Under the aspenONE subscription offering, revenue from committed professional service arrangements that are sold as a single arrangement with, or in contemplation of, a new aspenONE licensing transaction is deferred and recognized on a ratable basis over the longer of (a) the period the services are performed and (b) the term of the related software arrangement. We expect professional services deferred revenue related to new aspenONE licensing transactions to grow in fiscal 2011.
SMS and Other Revenue
| |
Year Ended June 30, |
Period-to-Period Change |
|||||||||||
|---|---|---|---|---|---|---|---|---|---|---|---|---|---|
| |
2010 | 2009 | $ | % | |||||||||
| |
(Dollars in Thousands) |
||||||||||||
SMS and other revenue |
$ | 74,862 | $ | 83,637 | $ | (8,775 | ) | (10.5 | )% | ||||
As a percent of revenue |
45.0 | % | 26.8 | % | |||||||||
The decrease in SMS and other revenue was primarily due to lower SMS revenue associated with customers transitioning to the aspenONE subscription offering and the continued trend of customers electing to replace perpetual license agreements with new term contracts. Under the aspenONE subscription offering, SMS revenue is included in subscription revenue, whereas it was included in services and other revenue under the prior licensing model. Additionally, the trend of moving customers from perpetual license agreements to term-based contracts has resulted in decreased SMS revenue for fiscal 2010. While the transition from perpetual to term-based contracts generally results in larger combined software license and SMS revenue for the business over the term of the arrangement, it results in decreased SMS revenue, because the SMS fee is calculated as a percentage of the license fee. Perpetual license arrangements typically have a larger initial license fee than term arrangements. We expect SMS and other revenue to continue to decrease as we transition our business to a predominantly subscription-based licensing model.
57
Expenses
Cost of Subscription and Software Revenue
| |
Year Ended June 30, |
Period-to-Period Change |
|||||||||||
|---|---|---|---|---|---|---|---|---|---|---|---|---|---|
| |
2010 | 2009 | $ | % | |||||||||
| |
(Dollars in Thousands) |
||||||||||||
Cost of subscription and software revenue |
$ | 6,437 | $ | 12,409 | $ | (5,972 | ) | (48.1 | )% | ||||
Gross margin |
88.1 | % | 93.1 | % | |||||||||
The period-over-period reduction in cost of subscription and software revenue was primarily due to decreases of $4.9 million in royalty costs during the period related to our license products and lower capitalized software amortization charges of $1.7 million. Previously our royalty expense was correlated to the mix of products sold and was typically recognized in the period in which revenue for those products was recorded. As a result of the change to the aspenONE subscription offering, royalty expense is incurred evenly over the contractual term, consistent with the revenue recognition on the related customer arrangement. Amortization of capitalized software costs for fiscal 2010 decreased $1.7 million compared to fiscal 2009 as a result of reduced cost capitalization in the current period and previously capitalized items reaching the end of their useful life in fiscal 2010. The decrease in cost of subscription and software revenue was partially offset by $0.7 million of costs associated with providing SMS for the aspenONE suite of products. These costs were not included in the cost of subscription and software prior to the transition to the aspenONE subscription offering in fiscal 2010.
Cost of Services and Other Revenue
| |
Year Ended June 30, |
Period-to-Period Change |
|||||||||||
|---|---|---|---|---|---|---|---|---|---|---|---|---|---|
| |
2010 | 2009 | $ | % | |||||||||
| |
(Dollars in Thousands |
||||||||||||
Cost of services and other revenue |
$ | 59,673 | $ | 63,411 | $ | (3,738 | ) | (5.9 | )% | ||||
Gross margin |
46.9 | % | 52.0 | % | |||||||||
Professional Services Revenue
The largest component of the reduction in cost of services and other revenue in fiscal 2010 pertained to our professional services business, which accounted for $4.4 million of the year-over-year decrease. The decrease was primarily related to our reduction of staffing levels by approximately 16% over the course of fiscal 2010 to better align our cost structure with the decreased demand for professional services. The timing of expense recognition on professional service arrangements can also impact the comparability of cost of professional services revenue from period to period. In fiscal 2010, we recorded a loss accrual of approximately $3.0 million related to a large professional service arrangement, which partially offset the impact of cost structure reductions.
SMS and Training Revenue
Costs associated with SMS and training revenue increased $0.1 million in fiscal 2010 as compared to fiscal 2009. As the subscription business grows, we expect the cost of SMS revenue to migrate from cost of services and other revenue to cost of subscription and software revenue. Currently it is not possible to predict the rate at which this migration will occur, because that rate will be a function of adoption of our aspenONE subscription offering. We do not have sufficient experience with the rate of adoption to provide a meaningful forecast of this change. Eventually, we expect the majority of our cost of SMS revenue to be accounted for in cost of subscription and software revenue.
58
Stock-based compensation expense related to cost of services and other revenue was $0.9 million higher in fiscal 2010 compared to fiscal 2009. We expect the reported gross profit margin of services and other revenue to continue to decline over the next several years, as SMS revenue is reclassified to subscription revenue, since SMS revenue has a high gross profit margin relative to the other revenue streams included in services and other revenue.
Selling and Marketing Expense
| |
Year Ended June 30, |
Period-to-Period Change |
|||||||||||
|---|---|---|---|---|---|---|---|---|---|---|---|---|---|
| |
2010 | 2009 | $ | % | |||||||||
| |
(Dollars in Thousands |
||||||||||||
Selling and marketing expense |
$ | 97,002 | $ | 84,126 | $ | 12,876 | 15.3 | % | |||||
As a percent of revenue |
58.3 | % | 27.0 | % | |||||||||
The increase in selling and marketing expense was predominantly the result of higher commissions of $6.9 million, stock-based compensation costs of $4.8 million and payroll and benefits expenses of $2.3 million. Commissions increased during fiscal 2010 as a result of increased bookings on a worldwide basis, as well as a greater number of sales personnel exceeding their sales targets as compared to fiscal 2009. Additionally, in fiscal 2010, bookings eligible for commissions included multi-year contractually committed SMS fees under the aspenONE subscription offering. Selling and marketing payroll and benefit expenses increased in fiscal 2010 due to increased headcount compared to fiscal 2009. These expense increases were partially offset by $1.2 million of reductions in third-party commissions. Previously, we accrued the entire amount of third-party commission costs related to a sale in the period in which revenue for those products was recorded. Since the introduction of our new product offerings, we expense the costs over the life of the agreement, on a basis consistent with the revenue recognized.
Research and Development Expense
| |
Year Ended June 30, |
Period-to-Period Change |
|||||||||||
|---|---|---|---|---|---|---|---|---|---|---|---|---|---|
| |
2010 | 2009 | $ | % | |||||||||
| |
(Dollars in Thousands |
||||||||||||
Research and development expense |
$ | 48,228 | $ | 46,375 | $ | 1,853 | 4.0 | % | |||||
As a percent of revenue |
29.0 | % | 14.9 | % | |||||||||
The increase in research and development expense was primarily the result of increased bonuses of $1.6 million, higher stock-based compensation expense of $1.4 million and increased expense related to a reduction in internal capitalized development costs of $1.4 million. In fiscal 2009, we capitalized significant costs related to the development and release of the aspenONE v7.1 product; we did not have similar levels of capitalizable costs in fiscal 2010. These cost increases were partially offset by reduced payroll and benefit expenses of $1.8 million and lower facility and IT-related costs of $1.1 million.
General and Administrative Expense
| |
Year Ended June 30, |
Period-to-Period Change |
|||||||||||
|---|---|---|---|---|---|---|---|---|---|---|---|---|---|
| |
2010 | 2009 | $ | % | |||||||||
| |
(Dollars in Thousands |
||||||||||||
General and administrative expense |
$ | 63,246 | $ | 58,256 | $ | 4,990 | 8.6 | % | |||||
As a percent of revenue |
38.0 | % | 18.7 | % | |||||||||
59
The increase in general and administrative expense is primarily attributable to $4.9 million of higher legal and related costs, $3.5 million of stock-based compensation, $2.1 million of payroll and benefit expenses, $1.7 million of increased bonus and $1.4 million of bad debt expense, partially offset by $8.5 million in cost reductions related to financial consultants and contractors and decreases in recruiting and related expenses of $0.7 million. The increase in legal fees in fiscal 2010 as compared to fiscal 2009 was due to our increased use of external legal services during the fiscal year, as well as the impact of us reaching the maximum reimbursable limit of an insurance policy in the second quarter of fiscal 2010 under which certain legal costs were previously covered. During the second quarter of fiscal 2010, we reached the maximum reimbursable limit for the policy and as a result, our expenses increased in fiscal 2010. The $2.1 million increase in payroll and benefit expenses is related to increased average headcount, primarily within the finance organization. We hired full-time finance personnel throughout fiscal 2010 to replace and further reduce our reliance on more costly external consultants.
Restructuring Charges
| |
Year Ended June 30, |
Period-to-Period Change |
|||||||||||
|---|---|---|---|---|---|---|---|---|---|---|---|---|---|
| |
2010 | 2009 | $ | % | |||||||||
| |
(Dollars in Thousands |
||||||||||||
Restructuring charges |
$ | 1,128 | $ | 2,446 | $ | (1,318 | ) | (53.9 | )% | ||||
As a percent of revenue |
0.7 | % | 0.8 | % | |||||||||
The activity in restructuring charges was the result of accretion and adjustments to existing facilities-related restructuring plans for changes in estimates and sub-lease assumptions.
Interest Income
| |
Year Ended June 30, |
Period-to-Period Change |
|||||||||||
|---|---|---|---|---|---|---|---|---|---|---|---|---|---|
| |
2010 | 2009 | $ | % | |||||||||
| |
(Dollars in Thousands |
||||||||||||
Interest income |
$ | 19,324 | $ | 22,698 | $ | (3,374 | ) | (14.9 | )% | ||||
As a percent of revenue |
11.6 | % | 7.3 | % | |||||||||
The $3.4 million decrease in interest income consists of a $2.2 million decline in interest income from our collateralized and installment receivables portfolios and a $1.2 million decrease from lower interest earnings on our cash and cash equivalent balances. Under the aspenONE subscription offering, receivables are recorded when the payments become due and payable and we no longer record installment receivables. We expect interest income to decrease going forward.
Interest Expense
| |
Year Ended June 30, |
Period-to-Period Change |
|||||||||||
|---|---|---|---|---|---|---|---|---|---|---|---|---|---|
| |
2010 | 2009 | $ | % | |||||||||
| |
(Dollars in Thousands |
||||||||||||
Interest expense |
$ | (8,455 | ) | $ | (10,516 | ) | $ | 2,061 | (19.6 | )% | |||
As a percent of revenue |
(5.1 | )% | (3.4 | )% | |||||||||
The $2.1 million decrease in interest expense was primarily attributable to lower average secured borrowing balances, resulting from the continued pay-down of our existing arrangements. We expect interest expense to decrease going forward.
60
Other (Expense) Income, Net
| |
Year Ended June 30, |
Period-to-Period Change |
|||||||||||
|---|---|---|---|---|---|---|---|---|---|---|---|---|---|
| |
2010 | 2009 | $ | % | |||||||||
| |
(Dollars in Thousands |
||||||||||||
Other (expense) income, net |
$ | (2,407 | ) | $ | (1,824 | ) | $ | (583 | ) | 32.0 | % | ||
As a percent of revenue |
(1.4 | )% | (0.6 | )% | |||||||||
The change in other (expense) income, net was primarily due to foreign currency losses due to the further weakening of the Pound Sterling and Euro, offset by gains recognized from the strengthening of the Canadian dollar. The losses recorded in the prior fiscal year were primarily the result of the weakening of Pound Sterling and the Euro throughout the period.
Provision for Income Taxes
| |
Year Ended June 30, | Period-to-Period Change |
|||||||||||
|---|---|---|---|---|---|---|---|---|---|---|---|---|---|
| |
2010 | 2009 | $ | % | |||||||||
| |
(Dollars in Thousands) |
||||||||||||
Provision for income taxes |
$ | 6,537 | $ | 1,368 | $ | 5,169 | * | ||||||
As a percent of revenue |
3.9 | % | 0.4 | % | |||||||||
- *
- Not meaningful.
The increase in provision for income taxes was primarily due to an increase in foreign income tax offset by a release of certain tax contingencies in Canada. Cash payments, net of refunds for income taxes, totaled $2.5 million in fiscal 2010.
Liquidity and Capital Resources
Resources
We have historically financed our operations with cash generated from operating activities and borrowings secured by our installment receivable contracts. As of June 30, 2011, our principal sources of liquidity consisted of $150.0 million in cash and cash equivalents. We previously maintained a bank credit facility, which we decided not to renew or extend when it matured on February 13, 2011.
We believe our existing cash and cash equivalents and our cash flow from operating activities will be sufficient to meet our anticipated cash needs for at least the next twelve months. To the extent our cash and cash equivalents and cash flow from operating activities are insufficient to fund our future activities, we may need to raise additional funds through the financing of additional receivables or from public or private equity or debt financings. We also may need to raise additional funds in the event we determine in the future to effect one or more acquisitions of businesses, technologies and products. If additional funding is required, we may not be able to effect a receivable, equity or debt financing on terms acceptable to us or at all.
61
The following table summarizes our cash flow activities for the years indicated:
| |
Year Ended June 30, | ||||||||||
|---|---|---|---|---|---|---|---|---|---|---|---|
| |
2011 | 2010 | 2009 | ||||||||
| |
(Dollars in Thousands) |
||||||||||
Cash flow provided by (used in): |
|||||||||||
Operating activities |
$ | 63,330 | $ | 38,622 | $ | 33,032 | |||||
Investing activities |
(4,829 | ) | (3,351 | ) | (5,354 | ) | |||||
Financing activities |
(34,264 | ) | (31,700 | ) | (38,419 | ) | |||||
Effect of exchange rates on cash balances |
803 | (839 | ) | (1,094 | ) | ||||||
Increase (decrease) in cash and cash equivalents |
$ | 25,040 | $ | 2,732 | $ | (11,835 | ) | ||||
Operating Activities
Our primary source of cash is from the annual fee payments associated with our software license arrangements and related software support services, and to a lesser extent from professional services and training. We believe that cash inflows from our term license business will grow as we benefit from the continued growth of our portfolio of term license contracts, and as customers renew expiring contracts that were previously paid upfront. We anticipate that existing cash balances, together with funds generated from operations, will be sufficient to finance our operations and meet our cash requirements for the foreseeable future.
Cash from operating activities provided $63.3 million during fiscal 2011. This amount resulted from net income of $10.3 million, adjusted for non-cash benefits of $53.1 million and a net $106.2 million source of cash due to decreases in operating assets and increases in operating liabilities.
Non-cash items within net income consisted primarily of a $54.0 million benefit from income taxes due to the reversal of a significant portion of our U.S. valuation allowance. Other non-cash items contributing to net income included net credits to our provision for doubtful account of $2.8 million and $2.2 million of net unrealized foreign currency gains. Partially offsetting these items were non-cash charges of $9.7 million for stock-based compensation expense and $5.3 million of depreciation and amortization.
Our cash balance increased in part due to a $106.2 million decrease in operating assets and an increase in operating liabilities. The cash generated from this change consisted of (a) decreases in installment and collateralized receivables totaling $72.8 million, (b) a decrease in accounts receivable of $6.0 million and (d) an increase in deferred revenue of $41.4 million. Partially offsetting these sources of cash were decreases in accounts payable, accrued expenses and other liabilities of $12.0 million, an increase in prepaid expenses and other assets of $0.8 million, an increase in unbilled services of $0.5 million and a decrease in income taxes payable of $0.8 million.
Investing Activities
During fiscal 2011, we used $2.8 million of cash for capital expenditures, primarily related to computer hardware and software expenditures. We do not currently expect our future investment in capital expenditures to be materially different from recent levels. In fiscal 2011, we capitalized software development costs of $2.0 million related to projects where we established technological feasibility. We are not currently party to any material purchase contracts related to future capital expenditures.
Financing Activities
During fiscal 2011 we used $34.3 million of cash for financing activities. We made net payments on secured borrowings of $29.6 million ($32.1 million of repayments offset by $2.5 million of proceeds);
62
paid $10.5 million for the repurchase of our common stock; paid withholding taxes of $3.9 million on vested and settled restricted stock units; and, received proceeds of $9.7 million from the exercise of employee stock options during fiscal 2011. As discussed further in "Net Repayments on Secured Borrowings for fiscal 2011 and 2010," we superseded a large, previously financed arrangement in the fourth quarter of fiscal 2011 and had not yet remitted the payment to the financial institution at June 30, 2011.
Net Repayments on Secured Borrowings for fiscal 2011 and 2010
When previously financed receivables contracts are replaced, or "superseded", with new arrangements, the secured borrowings collateralized by those receivables become immediately due and payable. As a result, they are reported in accrued expenses and other current liabilities until payment is remitted to the financial institution. Although our financing arrangements do not obligate us to replace superseded receivables, the terms on which we repurchase and replace superseded receivables may make it advantageous to do so. It is our intention to structure such replacements so that they do not result in a net increase in our secured borrowings balance, although this is not always possible, given the timing and size of the specific receivables involved.
The following schedule reconciles our net repayments on secured borrowings for fiscal 2011 and 2010:
| |
Year Ended June 30, | |||||||
|---|---|---|---|---|---|---|---|---|
| |
2011 | 2010 | ||||||
| |
(Dollars in Thousands) |
|||||||
Secured borrowings, beginning of year |
$ | 76,135 | $ | 112,096 | ||||
Secured borrowings, end of year |
24,913 | 76,135 | ||||||
Net change in secured borrowings |
(51,222 | ) | (35,961 | ) | ||||
Increase/(decrease) in accrued expenses and other current liabilities for amounts due to financing institutions* |
21,822 |
1,492 |
||||||
Impact of foreign currency |
(151 | ) | (372 | ) | ||||
Net repayments on secured borrowings |
$ | (29,551 | ) | $ | (34,841 | ) | ||
- *
- Accrued expenses and other current liabilities include $26.0 million, $4.2 million and $2.7 million for amounts due to financing institutions at June 30, 2011, 2010 and 2009, respectively.
Our current liability for amounts due to financing institutions totaled $26.0 million at June 30, 2011, an increase of $21.8 million from June 30, 2010. The increase relates to the superseding of a large previously financed arrangement. We are currently in discussions with the financing institution to determine whether or not we will replace the superseded installments with installments of a similar duration and size. Because an exchange has not occurred in fiscal 2011, the balance of the superseded receivables due to financing institutions is a current liability at June 30, 2011. In fiscal 2011, the $2.5 million of proceeds was used to replace the receivables that had been superseded in the fourth quarter of fiscal 2010, which totaled $4.2 million at June 30, 2010, as well as other agreements superseded during fiscal year 2011.
We did not finance any receivables to fund operations in fiscal 2011, and we have not done so since the second quarter of fiscal 2008. We expect the existing combined secured borrowings and amounts due to financing institution balances included in our consolidated balance sheet at June 30, 2011 to continue to decline during the remainder of fiscal 2011 and thereafter, as we continue the trend of not replacing securitized borrowings as they are paid down.
63
We have continued to reduce our secured borrowings and amounts due to financing institution balances, while maintaining our cash balance (in thousands):
| |
June 30, | |||||||||
|---|---|---|---|---|---|---|---|---|---|---|
| |
2011 | 2010 | 2009 | |||||||
| |
(Dollars in Thousands) |
|||||||||
Cash and cash equivalents |
$ | 149,985 | $ | 124,945 | $ | 122,213 | ||||
Secured borrowings |
24,913 |
76,135 |
112,096 |
|||||||
Amounts due to financing institutions |
26,038 | 4,216 | 2,724 | |||||||
Total secured borrowings and amounts due to financing institutions |
$ | 50,951 | $ | 80,351 | $ | 114,820 | ||||
Borrowings Collateralized by Receivable Contracts
We maintain arrangements with General Electric Capital Corporation and Silicon Valley Bank providing for borrowings that are secured by our installment and other receivable contracts, and for which limited recourse exists against us. Under these programs, we and the financial institution must agree to enter into each transaction and negotiate the amount borrowed and interest rate secured by each receivable. The customers' payments of the underlying receivables fund the repayment of the related amounts borrowed. The weighted average interest rate on the secured borrowings was 8.7% at June 30, 2011. The collateralized receivables earn interest income, and the secured borrowings accrue borrowing costs at approximately the same interest rate.
We did not finance any receivables to fund operations in fiscal 2011, and we have not done so since the second quarter of fiscal 2008. We have sold some large dollar receivables in order to fund the repurchase of several large groups of smaller receivables previously sold to the banks, for the purpose of simplifying our administration of the programs and replacing previously financed receivables that have been superseded and repurchased.
We estimate that there was approximately $65 million available under the Silicon Valley Bank program at June 30, 2011. As the collection of the collateralized receivables and resulting payment of the borrowing obligation reduces the outstanding balance, the availability under the arrangement can be increased. We expect to maintain our access to cash under this arrangement.
Under the terms of these programs, we have transferred the receivables to the financial institutions with limited financial recourse to us. We can be required to repurchase the receivables under certain circumstances in case of specific defaults by us as set forth in the program terms. Potential recourse obligations are primarily related to the Silicon Valley Bank arrangement, which requires us to pay interest to Silicon Valley Bank for a limited period when the underlying customer has not paid by the receivable due date. Other than the specific items noted above, the financial institution bears the credit risk of the customers associated with the receivables the institution purchased.
Contractual Obligations and Requirements
As of June 30, 2011, our contractual obligations consisted primarily of operating leases for our headquarters and other facilities, royalty, debt and other obligations. There were no additional commitments for capital purchases or other expenditures at June 30, 2011.
64
Our contractual obligations were as follows at June 30, 2011:
| |
Payments due by Period | |||||||||||||||||
|---|---|---|---|---|---|---|---|---|---|---|---|---|---|---|---|---|---|---|
| |
Total | Less than 1 Year |
1 to 3 Years |
3 to 5 Years |
More than 5 Years |
|||||||||||||
| |
(Dollars in Thousands) |
|||||||||||||||||
Contractual Cash Obligations: |
||||||||||||||||||
Operating leases |
$ | 27,483 | $ | 11,049 | $ | 10,993 | $ | 5,286 | $ | 155 | ||||||||
Fixed fee royalty obligations |
5,054 | 2,092 | 2,153 | 655 | 154 | |||||||||||||
Contractual royalty obligations |
3,761 | 2,640 | 857 | 264 | — | |||||||||||||
Other obligations |
1,135 | 763 | 207 | 165 | — | |||||||||||||
Total contractual cash obligations |
$ | 37,433 | $ | 16,544 | $ | 14,210 | $ | 6,370 | $ | 309 | ||||||||
Other Commercial Commitments: |
||||||||||||||||||
Standby letters of credit |
$ | 3,134 | $ | 3,116 | $ | 18 | $ | — | $ | — | ||||||||
Total commercial commitments |
$ | 3,134 | $ | 3,116 | $ | 18 | $ | — | $ | — | ||||||||
As of June 30, 2011, we had multiple agreements, which expire through 2012, to sublease approximately 115,239 square feet of our former office space in Cambridge, Massachusetts. The above table does not reflect contractual future sublease rental income, which totaled $3.9 million at June 30, 2011. See Note 11 to the Consolidated Financial Statements for additional information about our operating leases.
The standby letters of credit were issued by Silicon Valley Bank in the United States and National Westminster Bank in the United Kingdom, and secure performance on professional services contracts and rental agreements.
The above table does not reflect any amounts relating to transfers of certain receivables under our receivable sale facilities. Repayments of borrowings under these facilities are funded by the payments made by the customer either to the applicable financial institution directly or to us as agent, with no financial recourse to us. Since we do not have any contractual obligation to fund these payments and there are no financial guarantees issued in relation to these transactions, we do not have any contractual payment obligations relating to these transactions.
Off-Balance Sheet Arrangements
As of June 30, 2011, we did not have any significant off-balance sheet arrangements, as defined in Item 303(a)(4)(ii) of Regulation S-K of the SEC.
Critical Accounting Estimates and Judgments
Our consolidated financial statements are prepared in accordance with GAAP. The preparation of our financial statements requires management to make estimates and judgments that affect the reported amounts of assets, liabilities, revenue, expenses and related disclosures. We base our estimates on historical experience and various other assumptions that we believe to be reasonable under the circumstances, the results of which form the basis for making judgments about the carrying values of assets and liabilities that are not readily apparent from other sources. Actual results may differ from these estimates under different assumptions or conditions.
We believe that the assumptions and estimates associated with the following critical accounting policies have the greatest potential impact on our consolidated financial statements:
- •
- revenue recognition;
- •
- accounting for income taxes; and
65
- •
- loss contingencies.
For further information on our significant accounting policies, see Note 2 to the Consolidated Financial Statements.
Revenue Recognition
Four basic criteria must be satisfied before license revenue can be recognized: persuasive evidence of an arrangement between us and an end user; delivery of our product has occurred; the fee for the product is fixed or determinable; and collection of the fee is probable. Our management uses its judgment concerning the satisfaction of these four basic criteria, particularly the criteria relating to the determination of whether the arrangement fees are fixed or determinable and to the collectability of the arrangement fees, during evaluation of each revenue transaction.
Fee is fixed or determinable—We assess whether a fee is fixed or determinable at the outset of the arrangement. Significant judgment is involved in making this assessment. Under our upfront revenue model, we are able to demonstrate that the fees are fixed or determinable for all arrangements, including those for our term licenses that contain extended payment terms. We have an established history of collecting under the terms of these contracts without providing concessions to customers. In addition, we also assess whether contract modifications to an existing term arrangement constitute a concession. In making this assessment, significant analysis is performed to ensure that no concessions are given. Our software license agreements do not include right of return or exchange.
With the introduction of our aspenONE subscription offering and the changes to the licensing terms for point products licensed on a fixed-term basis, we cannot assert that the fees in these new arrangements are fixed or determinable because the rights provided to customers and the economics of the arrangements are not comparable to our historical transactions with other customers under the upfront revenue model. As a result, the amount of revenue recognized for these arrangements is limited by the amount of customer payments currently due. For our aspenONE subscription arrangements this generally results in the fees being recognized ratably over the term of the contracts. For our point product licenses with SMS included for the entire term of the arrangement, this generally results in the license fee being recognized as each payment comes due, while the allocated portion of the SMS revenue is recognized ratably over its annual term.
Collection of fee is probable—We assess the probability of collecting from each customer at the outset of the arrangement based on a number of factors, including the customer's payment history, its current creditworthiness, economic conditions in the customer's industry and geographic location, and general economic conditions. If in our judgment collection of a fee is not probable, revenue is recognized as cash is collected, provided all other conditions for revenue recognition have been met.
VSOE of Fair Value for SMS and Professional Services
We have established VSOE for SMS and professional services, but not for our software products. We assess VSOE of fair value for SMS and professional services based on an analysis of standalone sales of SMS and professional services, using the bell-shaped curve approach. We use the optional renewals of SMS on our legacy term license arrangements to support VSOE of fair value for SMS included in our fixed-term point product arrangements. The license product offerings and the SMS in the legacy term arrangements and the point product arrangements have been the same.
In July 2011, we released an enhanced SMS offering to provide more value to our customers. As part of this offering, customers will receive 24x7 support, faster response times and dedicated technical advocates. The enhanced SMS offering is being provided to both (i) aspenONE subscription customers and (ii) customers who have licensed point products on a term basis with SMS included for the term of the arrangement.
66
We do not have a history of selling this new SMS offering to customers on a stand-alone basis and cannot establish vendor-specific evidence of fair value, or "VSOE". As a result, beginning in July 2011, the revenue associated with point product arrangements that include the enhanced SMS offering is being recognized on a "daily ratable" basis, consistent with the revenue recognition of fees on our aspenONE subscription offering arrangements. Beginning in fiscal 2012, the ratable revenue from both aspenONE subscription arrangements and point product arrangements with enhanced SMS will be presented as "subscription and software revenue."
The new SMS offering did not impact our results of operations or income statement presentation for fiscal 2011, 2010, or 2009.
Professional Services Revenue
We provide professional services on a time-and-materials or fixed-price basis. We recognize professional services fees for time-and-materials contracts based upon hours worked and contractually agreed-upon hourly rates. We recognize revenue from fixed-price engagements using the proportional performance method, based on the ratio of costs incurred to the total estimated project costs. The use of the proportional performance method depends upon our ability to reliably estimate the direct costs to complete a project. We use historical experience as a basis for future estimates to complete current projects. Additionally, management believes that costs are the best available measure of performance. Reimbursable amounts received from customers for out-of-pocket expenses are recorded as revenue. If the costs to complete a project are not estimable or the completion is uncertain, the revenue is recognized upon completion of the services.
We have occasionally been required to commit unanticipated additional resources to complete projects, which have resulted in lower than anticipated income or losses on those contracts. Provisions for estimated losses on contracts are made during the period in which such losses become probable and can be reasonably estimated.
Accounting for Income Taxes
We utilize the asset and liability method of accounting for income taxes in accordance with ASC Topic 740, Accounting for Income Taxes. Under this method, deferred tax assets and liabilities are determined based on differences between the financial reporting and tax bases of assets and liabilities. Deferred tax assets and liabilities are measured using the enacted tax rates and statutes that will be in effect when the differences are expected to reverse. Deferred tax assets can result from unused operating losses, and research and development and foreign tax credit carryforwards and deductions recorded for financial statement purposes prior to them being deductable on a tax return. Valuation allowances are provided against net deferred tax assets if, based upon the available evidence, it is more likely than not that some or all of the deferred tax assets will not be realized. The ultimate realization of deferred tax assets is dependent upon the generation of future taxable income and the reversal of taxable temporary differences. We consider, among other available information, scheduled reversals of deferred tax liabilities, projected future taxable income, limitations on the availability of net operating loss and tax credit carryforwards, and other evidence assessing the potential realization of deferred tax assets. Adjustments to the valuation allowance are included in the tax provision in our consolidated statements of operations in the period they become known or can be estimated.
Significant management judgment is required in determining any valuation allowance recorded against deferred tax assets and liabilities. The valuation allowance is based on our estimates of taxable income for jurisdictions in which we operate and the period over which our deferred tax assets may be recoverable. A significant portion of the U.S. valuation allowance was released in the fourth quarter of fiscal year 2011. While we are currently operating at a taxable loss and have a history of losses, we have been able to forecast future operating results sufficient to utilize our deferred tax assets. In
67
weighing the cumulative losses against our ability to forecast operating results and the incremental growth in our installed base of customers and acceptance of our subscription-based licensing model, we believe it is more likely than not that we will utilize these assets. Based on our current forecast, we expect that we will utilize all of our NOLs, foreign tax credits, and a portion of our R&D credits by fiscal 2015, based on a "with and without" approach. We have retained a small valuation allowance in the U.S. for the deferred tax asset related to our unrealized capital losses. We do not have any investments currently that would give rise to a capital gain, and as a result, we believe that it is more likely than not that we will not receive a benefit from this deferred tax asset. We have also retained a valuation allowance on certain foreign subsidiary's NOL carryfowards. At June 30, 2011, our total valuation allowance was $8.0 million.
For fiscal 2011, our income tax provision included amounts determined under the provisions of FIN 48, Accounting for Uncertain Tax Positions (currently included as provisions of ASC Topic 740), which was adopted as of July 1, 2007 and is intended to satisfy additional income tax assessments, including interest and penalties, that could result from any tax return positions for which the likelihood of sustaining the position on audit does not meet a threshold of "more likely than not." The tax accrual included penalties and interest, which were recorded as a component of our income tax expense. Tax liabilities under FIN 48 were recorded as a component of our income taxes payable and other non-current liabilities balance and totaled $28.3 million as of June 30, 2011. The ultimate amount of taxes due will not be known until examinations are completed and settled or the audit periods are closed by statute.
Our U.S. and foreign tax returns are subject to periodic compliance examinations by various local and national tax authorities through periods defined by the tax code in the applicable jurisdiction. The years prior to 2007 are closed in the United States, although the utilization of net operating loss carryforwards and tax credits generated in earlier periods will keep these periods open for examination. Similarly, the years prior to 2008 are closed in the United Kingdom, although the utilization of net operating loss carryforwards generated in earlier periods will keep the periods open for examination. Our Canadian subsidiaries are subject to audit from 2007 forward, and certain other of our international subsidiaries are subject to audit from 2003 forward. In connection with examinations of tax filings, tax contingencies can arise from differing interpretations of applicable tax laws and regulations relative to the amount, timing or proper inclusion or exclusion of revenue and expenses in taxable income or loss. For periods that remain subject to audit, we have asserted and unasserted potential assessments that are subject to final tax settlements.
Loss Contingencies
The outcomes of legal proceedings and claims brought against us are subject to significant uncertainty. We accrue estimated liabilities for loss contingencies arising from claims, assessments, litigation and other sources when it is probable that a liability has been incurred and the amount of the claim, assessment or damages can be reasonably estimated. Disclosure of a contingency is required if there is at least a reasonable possibility that a loss has been incurred. In determining whether a loss should be accrued we evaluate, among other factors, the degree of probability of an unfavorable outcome and the ability to make a reasonable estimate of the amount of loss. Change in these factors could materially impact our consolidated financial statements.
Under the terms of substantially all of our license agreements, we have agreed to indemnify customers for costs and damages arising from claims against such customers based on, among other things, allegations that our software products infringe the intellectual property rights of a third party. In most cases, in the event of an infringement claim, we retain the right to procure for the customer the right to continue using the software product or to replace or modify the software product to eliminate the infringement while providing substantially equivalent functionality. If neither of those actions can be reasonably achieved, we may terminate the license agreement and provide a refund to the customer.
68
These indemnification provisions are accounted for in accordance with ASC Topic 460. The likelihood that we will be required to make refunds to customers under these indemnification provisions is considered remote. In most cases, and where legally enforceable, the indemnification refund is limited to the amount of the license fees paid by the customer.
Recently Adopted Accounting Pronouncements
In June 2011, the FASB issued ASU No. 2011-05, Comprehensive Income (Topic 220): Presentation of Comprehensive Income. ASU No. 2011-05 eliminates the option of presenting components of other comprehensive income as a part of the statement of changes in stockholders' equity. ASU No. 2011-05 requires all non-owner changes in stockholders' equity to be presented either in a single statement of comprehensive income or in two separate consecutive statements. ASU No. 2011-05 is effective for public entities for interim and annual periods beginning after December 15, 2011 and should be applied retrospectively. We will adopt ASU No. 2011-05 during the period ending March 31, 2012. The adoption of ASU No. 2011-05 is not expected to have a material effect on our financial position, results of operations or cash flows.
In May 2011, the FASB issued ASU No. 2011-04, Fair Value Measurement (Topic 820): Amendments to Achieve Common Fair Value Measurement and Disclosure Requirements in U.S. GAAP and IFRSs. ASU No. 2011-04 establishes common fair value measurement and disclosure requirements in U.S. GAAP and IFRSs and changes the wording used to describe the aforementioned requirements in the U.S GAAP. ASU No. 2011-04 establishes additional disclosure requirements for fair value measurements categorized within Level 3 of the fair value hierarchy. For these measurements, entities are required to disclose valuation processes used in developing fair values, as well as sensitivity of the fair value measurements to changes in unobservable inputs and interrelationships between them. ASU No. 2011-04 is effective for public entities for interim and annual periods beginning after December 15, 2011. We will adopt ASU No. 2011-04 during the period ending March 31, 2012. The adoption of ASU No. 2011-04 is not expected to have a material effect on our financial position, results of operations or cash flows.
In April 2011, the FASB issued ASU No. 2011-03, Transfers and Servicing (Topic 860): Reconsideration of Effective Control for Repurchase Agreements. ASU No. 2011-03 applies to repurchase and other agreements that both entitle and obligate the transferor to repurchase or redeem financial instruments before their maturity. ASU No. 2011-03 removes transferor's ability criterion from the consideration of effective control over the transferred assets and eliminates the requirement to demonstrate that the transferor possesses adequate collateral to fund substantially all the cost of purchasing replacement financial assets. ASU No. 2011-03 is effective for the first interim or annual period beginning on or after December 15, 2011 and should be applied prospectively to transactions or modifications of existing transactions that occur on or after the effective date. We will adopt ASU No. 2011-03 during the period ended March 31, 2012. The adoption of ASU No. 2011-03 is not expected to have a material effect on our financial position, results of operations or cash flows.
In July 2010, the FASB issued ASU No. 2010-20, Receivables (Topic 310): Disclosures about the Credit Quality of Financing Receivables and the Allowance for Credit Losses. ASU No. 2010-20 enhances the disclosures relating to the credit quality of financing receivables and the allowance for credit losses by requiring a greater level of disaggregated information as well as disclosure of credit quality indicators, past due information and modifications of financing receivables. The disclosures required by ASU No. 2010-20 which are as of the end of a reporting period are effective for interim and annual periods ending on or after December 15, 2010. The disclosures about activity during a period are effective for interim and annual periods beginning on or after December 15, 2010. We adopted the end of reporting period disclosure requirements of ASU No. 2010-20 on December 31, 2010. We adopted the disclosures about activity during a period ended March 31, 2011. The adoption of ASU No. 2010-20 did not have a material effect on our financial position, results of operations or cash flows.
69
In January 2010, the FASB issued Accounting Standards Update, or ASU, No. 2010-06, Fair Value Measurements and Disclosures (Topic 820): Improving Disclosures about Fair Value Measurements. This ASU requires new disclosures including significant transfers into and out of Level 1 and Level 2 fair value measurements and a reconciliation of Level 3 fair value measurements including purchases, sales, issuances, and settlements on a gross basis. It also clarifies existing disclosures regarding the level of disaggregation, inputs and valuation techniques. We adopted ASU No. 2010-06 during the period ended March 31, 2010. This ASU did not have a material impact on our financial operations, results of operations or cash flows.
In September 2009, the FASB issued ASU No. 2009-14, Software (Topic 985): Certain Revenue Arrangements That Include Software Element—a consensus of the FASB Emerging Issues Task Force. ASU No. 2009-14 amends the scope of software revenue recognition to exclude tangible products that contain both software and non-software components that function together to deliver a product's essential functionality. ASU No. 2009-14 is effective prospectively for revenue arrangements entered into or materially modified in fiscal years beginning on or after June 15, 2010. Early adoption is permitted. We adopted ASU No. 2009-14 on July 1, 2010. The adoption of ASU No. 2009-14 did not have a material effect on our financial operations, results of operations or cash flows.
In June 2009, the FASB issued ASU No. 2009-16, Transfers and Servicing (Topic 860): Accounting for Transfers of Financial Assets. ASU No. 2009-16 removes the concept of a qualifying special purpose entity from its scope and removes the exception from applying ASC Topic 810, Consolidation (formerly known as FASB Interpretation No. 46(R), Consolidation of Variable Interest Entities—an Interpretation of ARB No. 51). This ASU also clarifies the requirements for isolation and limitations on portions of financial assets that are eligible for sale accounting. ASU No. 2009-16 is effective for fiscal years beginning after November 15, 2009. We adopted ASU No. 2009-16 on July 1, 2010. The adoption of this ASU did not have a material impact on our financial operations, results of operations or cash flows.
Item 7A. Quantitative and Qualitative Disclosures about Market Risk.
In the ordinary course of conducting business, we are exposed to certain risks associated with potential changes in market conditions. These market risks include changes in currency exchange rates and interest rates. In order to manage the volatility of our more significant market risks, we may enter into derivative financial instruments such as forward currency exchange contracts.
In fiscal 2011, 21.7% of our total revenue was denominated in a currency other than the U.S. dollar. In addition, certain of our operating costs incurred outside the United States are denominated in currencies other than the U.S. dollar. We conduct business on a worldwide basis and as a result, a portion of our revenues, earnings, net assets, and net investments in foreign affiliates is exposed to changes in foreign currency exchange rates. We measure our net exposure for cash balance positions and for currency cash inflows and outflows in order to evaluate the need to mitigate our foreign exchange risk. We may enter into foreign currency forward contracts to minimize the impact related to unfavorable exchange rate movements, although we have not done so since fiscal 2008. During fiscal 2011, our largest exposures to foreign currency exchange rates existed primarily with the Euro, Pound Sterling, Canadian Dollar, and Japanese Yen.
During fiscal 2011, we recorded $3.3 million of net foreign currency exchange gains related to the settlement and remeasurement of transactions denominated in currencies other than the functional currency of our operating units. During fiscal 2010, the comparative foreign currency activity for similar non-functional currency denominated transactions resulted in a loss of $2.6 million. Our analysis of operating results transacted in various foreign currencies indicated that a hypothetical 10% change in the foreign currency exchange rates could have increased or decreased the consolidated results of operations for fiscal 2011 by approximately $2.9 million and by $1.5 million for fiscal 2010.
70
Investment Portfolio
We do not use derivative financial instruments in our investment portfolio. We place our investments in instruments that meet high credit quality standards, as specified in our investment policy guidelines. We do not expect any material loss with respect to our investment portfolio from changes in market interest rates or credit losses, as our investments consist primarily of money market accounts. At June 30, 2011, all of the instruments in our investment portfolio were included in cash and cash equivalents.
Item 8. Financial Statements and Supplementary Data.
The following consolidated financial statements specified by this Item, together with the reports thereon of KPMG LLP, are presented following Item 15 of this Form 10-K:
Financial Statements: |
|||
Report of Independent Registered Public Accounting Firm |
|||
Consolidated Statements of Operations for the years ended June 30, 2011, 2010 and 2009 |
|||
Consolidated Balance Sheets as of June 30, 2011 and 2010 |
|||
Consolidated Statements of Stockholders' Equity (Deficit) and Comprehensive Income (Loss) for the years ended June 30, 2011, 2010 and 2009 |
|||
Consolidated Statements of Cash Flows for the years ended June 30, 2011, 2010 and 2009 |
|||
Notes to Consolidated Financial Statements |
|||
Item 9. Changes in and Disagreements with Accountants on Accounting and Financial Disclosure.
None.
71
Item 9A. Controls and Procedures
a) Disclosure Controls and Procedures
Our management, with the participation of our chief executive officer and chief financial officer, evaluated the effectiveness of our disclosure controls and procedures as of June 30, 2011. The term "disclosure controls and procedures," as defined in Rules 13a-15(e) and 15d-15(e) under the Securities Exchange Act, means controls and other procedures of a company that are designed to ensure that information required to be disclosed by a company in the reports that it files or submits under the Securities Exchange Act is recorded, processed, summarized and reported, within the time periods specified in the SEC's rules and forms. Disclosure controls and procedures include, without limitation, controls and procedures designed to ensure that information required to be disclosed by a company in the reports that it files or submits under the Securities Exchange Act is accumulated and communicated to the Company's management, including its principal executive and principal financial officers, as appropriate to allow timely decisions regarding required disclosure. Management recognizes that any controls and procedures, no matter how well designed and operated, can provide only reasonable assurance of achieving their objectives, and management necessarily applies its judgment in evaluating the cost-benefit relationship of possible controls and procedures. Based on the evaluation of our disclosure controls and procedures as of June 30, 2011, and due to the material weakness in our internal control over financial reporting described in our accompanying Management's Report on Internal Control over Financial Reporting, our chief executive officer and chief financial officer concluded that, as of such date, our disclosure controls and procedures were not effective.
b) Management's Report on Internal Control over Financial Reporting
Our management is responsible for establishing and maintaining adequate internal control over financial reporting for our company. Internal control over financial reporting is defined in Rule 13a-15(f) and 15d-15(f) promulgated under the Exchange Act, as a process designed by, or under the supervision of, a company's principal executive and principal financial officers and effected by the Company's board of directors, management and other personnel, to provide reasonable assurance regarding the reliability of financial reporting and the preparation of financial statements for external purposes in accordance with generally accepted accounting principles, and includes those policies and procedures that:
- •
- pertain to the maintenance of records that, in reasonable detail, accurately and fairly reflect the transactions and
dispositions of the assets of the company;
- •
- provide reasonable assurance that transactions are recorded as necessary to permit preparation of financial statements in
accordance with generally accepted accounting principles, and that receipts and expenditures of the company are being made in accordance with authorizations of management and directors of the company;
and
- •
- provide reasonable assurance regarding prevention or timely detection of unauthorized acquisition, use or disposition of the company's assets that could have a material effect on the financial statements.
Because of its inherent limitations, internal control over financial reporting may not prevent or detect misstatements. Projections of any evaluation of effectiveness to future periods are subject to the risk that controls may become inadequate because of changes in conditions, or that the degree of compliance with the policies or procedures may deteriorate.
Our management, including our chief executive officer and chief financial officer, assessed the effectiveness of our internal control over financial reporting as of June 30, 2011. In connection with this assessment, we identified the following material weakness in internal control over financial reporting as of June 30, 2011. A material weakness is a deficiency, or a combination of deficiencies, in internal
72
control over financial reporting such that there is a reasonable possibility that a material misstatement of the annual or interim financial statements will not be prevented or detected on a timely basis. In making this assessment, our management used the criteria set forth by the Committee of Sponsoring Organizations of the Treadway Commission in Internal Control—An Integrated Framework (September 1992). Because of the material weakness described below, management concluded that, as of June 30, 2011, our internal control over financial reporting was not effective.
- •
- Inadequate and ineffective controls over income tax accounting and disclosure
We did not have adequate design or operation of controls that provide reasonable assurance that the accounting for income taxes and related disclosures were prepared in accordance with GAAP. Specifically, we did not have sufficient staffing and technical expertise in the tax function to provide adequate review and control with respect to the (a) complete and accurate recording of deferred tax assets and liabilities due to differences in accounting treatment for book and tax purposes; and (b) complete and accurate recording of income tax accounting entries and corresponding tax provisions and accruals.
This material weakness contributed to post-closing adjustments which have been reflected in the financial statements for the year ended June 30, 2011. These adjustments resulted in changes in deferred income tax assets and liabilities, accrued tax liability, income tax expense, and related disclosures.
KPMG LLP, our independent registered public accounting firm, has audited our consolidated financial statements and the effectiveness of our internal control over financial reporting as of June 30, 2011. This report appears below.
c) Changes in Internal Control over Financial Reporting
As previously reported in Item 9A of our Annual Report on Form 10-K for the year ended June 30, 2010, we reported following material weaknesses in our internal control over financial reporting (as defined in Rule 13a-15(f) and 15d-15(f) under the Exchange Act):
- •
- Inadequate and ineffective controls over income tax accounting and disclosure; and
- •
- Inadequate and ineffective controls over the recognition of professional services revenue
As a result of those material weaknesses in our internal control over financial reporting, our principal financial officer concluded that our internal control over financial reporting were not effective as of June 30, 2010.
During the quarter ended June 30, 2011, no changes other than those in conjunction with certain remediation efforts described below were identified to our internal control over financial reporting that materially affected, or were reasonably likely to materially affect, our internal control over financial reporting.
d) Remediation Efforts
We determined that the following material weakness (reported in our 2010 Form 10-K) was remediated as of June 30, 2011:
- •
- Inadequate and ineffective controls over the recognition of professional services revenue
The remediation efforts taken during our fiscal 2011, which were evidenced in the fourth quarter included the following:
- •
- Recognition of professional services revenue
73
- •
- Enhanced people management to recruit, retain and train qualified finance professionals to help ensure the effective
implementation of key controls and remedial actions to address the areas where material weakness was previously identified, and
- •
- Re-engineered procedures and controls in our professional services business processes in order
to:
- •
- Enhance presale deal review to help ensure that reliable revenue accounting determinations are provided in a timely
manner;
- •
- Enhance management monitoring of project status to ensure that all data that has revenue recognition impact is available
and reviewed for the purpose of recording professional services revenue completely, accurately and in a timely manner;
- •
- Ensure that multiple-element arrangements where services are bundled with a license or other services arrangements are
properly accounted for; and
- •
- Automate project accounting to have appropriately designed system configuration controls to ensure that data and reports
generated from the system can be relied upon for the purpose of accurately and timely recording revenue in accordance with GAAP.
- •
- Income tax accounting and disclosure
- •
- In fiscal 2011, we began implementing the following measures to improve our internal control over income tax accounting
and disclosure. We plan to further enhance these measures in fiscal 2012.
- •
- In the second quarter of fiscal 2011, we redesigned our tax accounting processes and related controls to ensure that our
accounting for income taxes and related disclosures can be completed accurately and in a timely manner;
- •
- In the third quarter of fiscal 2011, we delivered an extensive training program for the preparers of our foreign tax
packages which are used as inputs to our annual tax provision calculation; and
- •
- In the fourth quarter of fiscal 2011, we engaged external tax professionals to review complex tax areas in order to ensure
that the company's determination of associated deferred tax asset values was materially correct.
- •
- In fiscal 2012, we plan to implement additional measures to ensure the effective implementation of the key controls and implement remedial actions designed to address the areas where material weakness was previously identified. We plan to recruit additional qualified professionals into the tax function to address workload bottlenecks and inadequate review controls over key aspects of tax accounting. We also plan to train and utilize other qualified individuals, primarily within the accounting organization, to perform tasks that will alleviate work load on certain key resources in the tax department. If required we will continue to utilize qualified external consultants to advise on complex tax issues and to help implement improvement plans.
e) Remediation Plans
Management, in coordination with the input, oversight and support of our Audit Committee, has identified the above-mentioned measures, to strengthen our internal control over financial reporting and to address the material weakness described above. We began implementing these measures in fiscal 2011. We expect these remedial actions to be effectively implemented in fiscal 2012, to successfully remediate material weakness that is reported within this Form 10-K by end of fiscal 2012.
74
If the remedial measures described above are insufficient to address any of the identified material weaknesses or are not implemented effectively, or additional deficiencies arise in the future, material misstatements in our interim or annual financial statements may occur in the future. Among other things, any unremediated material weaknesses could result in material post-closing adjustments in future financial statements. Furthermore, any such unremediated material weaknesses could have the effects described in "Item 1A. Risk Factors—In preparing our financial statements for fiscal 2011, we identified a material weakness in our internal control over financial reporting, and our failure to remedy these or other material weaknesses could result in material misstatements in our financial statements" in Part I of this Form 10-K.
75
Report of Independent Registered Public Accounting Firm
The
Board of Directors and Stockholders
Aspen Technology, Inc.:
We have audited Aspen Technology, Inc.'s and subsidiaries (the "Company") internal control over financial reporting as of June 30, 2011, based on criteria established in Internal Control—Integrated Framework issued by the Committee of Sponsoring Organizations of the Treadway Commission (COSO). The Company's management is responsible for maintaining effective internal control over financial reporting and for its assessment of the effectiveness of internal control over financial reporting, included in the accompanying Management's Report on Internal Control over Financial Reporting (Item 9A). Our responsibility is to express an opinion on the Company's internal control over financial reporting based on our audit.
We conducted our audit in accordance with the standards of the Public Company Accounting Oversight Board (United States). Those standards require that we plan and perform the audit to obtain reasonable assurance about whether effective internal control over financial reporting was maintained in all material respects. Our audit included obtaining an understanding of internal control over financial reporting, assessing the risk that a material weakness exists, and testing and evaluating the design and operating effectiveness of internal control based on the assessed risk. Our audit also included performing such other procedures as we considered necessary in the circumstances. We believe that our audit provides a reasonable basis for our opinion.
A company's internal control over financial reporting is a process designed to provide reasonable assurance regarding the reliability of financial reporting and the preparation of financial statements for external purposes in accordance with generally accepted accounting principles. A company's internal control over financial reporting includes those policies and procedures that (1) pertain to the maintenance of records that, in reasonable detail, accurately and fairly reflect the transactions and dispositions of the assets of the company; (2) provide reasonable assurance that transactions are recorded as necessary to permit preparation of financial statements in accordance with generally accepted accounting principles, and that receipts and expenditures of the company are being made only in accordance with authorizations of management and directors of the company; and (3) provide reasonable assurance regarding prevention or timely detection of unauthorized acquisition, use, or disposition of the company's assets that could have a material effect on the financial statements.
Because of its inherent limitations, internal control over financial reporting may not prevent or detect misstatements. Also, projections of any evaluation of effectiveness to future periods are subject to the risk that controls may become inadequate because of changes in conditions, or that the degree of compliance with the policies or procedures may deteriorate.
A material weakness is a deficiency, or a combination of deficiencies, in internal control over financial reporting, such that there is a reasonable possibility that a material misstatement of the company's annual or interim financial statements will not be prevented or detected on a timely basis. A material weakness has been identified and included in management's assessment related to the inadequate and ineffective controls related to income tax accounting and disclosure.
We also have audited, in accordance with the standards of the Public Company Accounting Oversight Board (United States), the consolidated balance sheet of the Company as of June 30, 2011 and the related consolidated statements of operations, stockholders' equity (deficit) and comprehensive income (loss), and cash flows for the year then ended. This material weakness was considered in determining the nature, timing, and extent of audit tests applied in our audit of the 2011 consolidated financial statements, and this report does not affect our report dated August 23, 2011, which expressed an unqualified opinion on those consolidated financial statements.
76
In our opinion, because of the effect of the aforementioned material weakness on the achievement of the objectives of the control criteria, the Company has not maintained effective internal control over financial reporting as of June 30, 2011, based on criteria established in Internal Control—Integrated Framework issued by the Committee of Sponsoring Organizations of the Treadway Commission.
/s/ KPMG LLP
Boston,
Massachusetts
August 23, 2011
None.
77
Item 10. Directors, Executive Officers and Corporate Governance.
Incorporation by Reference
Certain information required under this Item 10 will appear under the sections entitled "Executive Officers of the Registrant," "Election of Directors," "Information Regarding our Board of Directors and Corporate Governance," "Code of Business Conduct and Ethics," and "Section 16(a) Beneficial Ownership Reporting Compliance" in our definitive proxy statement for our 2011 annual meeting of stockholders, and is incorporated herein by reference.
Item 11. Executive Compensation.
Incorporation by Reference
Certain information required under this Item 11 will appear under the sections entitled "Director Compensation," "Compensation Discussion and Analysis," "Executive Compensation" and "Employment and Change in Control Agreements" in our definitive proxy statement for our 2011 annual meeting of stockholders and is incorporated herein by reference.
Item 12. Security Ownership of Certain Beneficial Owners and Management and Related Stockholder Matters.
Certain information required under this Item 12 will appear under the sections entitled "Stock Owned by Directors, Executive Officers and Greater-than 5% Stockholders" and "Securities Authorized for Issuance Under Equity Compensation Plans" in our definitive proxy statement for our 2011 annual meeting of stockholders and is incorporated herein by reference.
Item 13. Certain Relationships and Related Transactions, and Director Independence.
Certain information required under this Item 13 will appear under the sections entitled "Information Regarding the Board of Directors and Corporate Governance" and "Related Party Transactions" in our definitive proxy statement for our 2011 annual meeting of stockholders and is incorporated herein by reference.
Item 14. Principal Accounting Fees and Services.
Certain information required under this Item 14 will appear under the section entitled "Independent Registered Public Accountants" in our definitive proxy statement for our 2011 annual meeting of stockholders and is incorporated herein by reference.
78
Item 15. Exhibits and Financial Statement Schedules.
(a)(1) Financial Statements
The consolidated financial statements appear immediately following page 80 ("Signatures").
(a)(2) Financial Statement Schedules
All schedules are omitted because they are not required or the required information is shown in the consolidated financial statements or notes thereto.
(a)(3) Exhibits
The exhibits listed in the accompanying exhibit index are filed or incorporated by reference as part of this Form 10-K.
79
Pursuant to the requirements of Section 13 or 15(d) of the Securities Exchange Act of 1934, the registrant has duly caused this report to be signed on its behalf by the undersigned, thereunto duly authorized.
| ASPEN TECHNOLOGY, INC. | ||||
Date: August 23, 2011 |
By: |
/s/ MARK E. FUSCO Mark E. Fusco President and Chief Executive Officer |
||
Date: August 23, 2011 |
By: |
/s/ MARK P. SULLIVAN Mark P. Sullivan Executive Vice President and Chief Financial Officer |
||
Pursuant to the requirements of the Securities Exchange Act of 1934, this report has been signed below by the following persons on behalf of the registrant and in the capacities and on the dates indicated.
Signature
|
Title
|
Date
|
||
|---|---|---|---|---|
| /s/ MARK E. FUSCO Mark E. Fusco |
President and Chief Executive Officer and Director (Principal Executive Officer) |
August 23, 2011 | ||
/s/ MARK P. SULLIVAN Mark P. Sullivan |
Executive Vice President and Chief Financial Officer (Principal Financial and Accounting Officer) |
August 23, 2011 |
||
/s/ STEPHEN M. JENNINGS Stephen M. Jennings |
Chairman of the Board of Directors |
August 23, 2011 |
||
/s/ DONALD P. CASEY Donald P. Casey |
Director |
August 23, 2011 |
||
/s/ GARY E. HAROIAN Gary E. Haroian |
Director |
August 23, 2011 |
80
Signature
|
Title
|
Date
|
||
|---|---|---|---|---|
| /s/ JOAN C. MCARDLE Joan C. McArdle |
Director | August 23, 2011 | ||
/s/ SIMON OREBI GANN Simon Orebi Gann |
Director |
August 23, 2011 |
||
/s/ ROBERT M. WHELAN, JR. Robert M. Whelan, Jr. |
Director |
August 23, 2011 |
81
INDEX TO CONSOLIDATED FINANCIAL STATEMENTS
F-1
Report of Independent Registered Public Accounting Firm
The
Board of Directors and Stockholders
Aspen Technology, Inc.:
We have audited the accompanying consolidated balance sheets of Aspen Technologies Inc. and subsidiaries (the "Company") as of June 30, 2011 and 2010, and the related consolidated statements of operations, stockholders' equity (deficit) and comprehensive income (loss), and cash flows for each of the years in the three-year period ended June 30, 2011. These consolidated financial statements are the responsibility of the Company's management. Our responsibility is to express an opinion on these consolidated financial statements based on our audits. We conducted our audits in accordance with the standards of the Public Company Accounting Oversight Board (United States). Those standards require that we plan and perform the audit to obtain reasonable assurance about whether the financial statements are free of material misstatement. An audit includes examining, on a test basis, evidence supporting the amounts and disclosures in the financial statements. An audit also includes assessing the accounting principles used and significant estimates made by management, as well as evaluating the overall financial statement presentation. We believe that our audits provide a reasonable basis for our opinion.
In our opinion, the consolidated financial statements referred to above present fairly, in all material respects, the financial position of the Company as of June 30, 2011 and 2010, and the results of its operations and its cash flows for each of the years in the three-year period ended June 30, 2011, in conformity with U.S. generally accepted accounting principles.
We also have audited, in accordance with the standards of the Public Company Accounting Oversight Board (United States), the Company's internal control over financial reporting as of June 30, 2011, based on criteria established in Internal Control—Integrated Framework issued by the Committee of Sponsoring Organizations of the Treadway Commission (COSO), and our report dated August 23, 2011 expressed an adverse opinion on the effectiveness of the Company's internal control over financial reporting.
/s/ KPMG LLP
Boston,
Massachusetts
August 23, 2011
F-2
ASPEN TECHNOLOGY, INC. AND SUBSIDIARIES
CONSOLIDATED STATEMENTS OF OPERATIONS
| |
Year Ended June 30, | |||||||||||
|---|---|---|---|---|---|---|---|---|---|---|---|---|
| |
2011 | 2010 | 2009 | |||||||||
| |
(Dollars in Thousands, except per share data) |
|||||||||||
Revenue: |
||||||||||||
Subscription |
$ | 58,459 | $ | 11,071 | $ | — | ||||||
Software |
45,240 | 42,920 | 179,591 | |||||||||
Total subscription and software(1) |
103,699 | 53,991 | 179,591 | |||||||||
Services and other |
94,455 | 112,353 | 131,989 | |||||||||
Total revenue |
198,154 | 166,344 | 311,580 | |||||||||
Cost of revenue: |
||||||||||||
Subscription and software |
5,213 | 6,437 | 12,409 | |||||||||
Services and other |
47,132 | 59,673 | 63,411 | |||||||||
Total cost of revenue |
52,345 | 66,110 | 75,820 | |||||||||
Gross profit |
145,809 | 100,234 | 235,760 | |||||||||
Operating expenses: |
||||||||||||
Selling and marketing |
90,771 | 97,002 | 84,126 | |||||||||
Research and development |
50,820 | 48,228 | 46,375 | |||||||||
General and administrative |
59,041 | 63,246 | 58,256 | |||||||||
Restructuring charges |
(247 | ) | 1,128 | 2,446 | ||||||||
Impairment of goodwill and intangible assets |
— | — | 623 | |||||||||
Total operating expenses |
200,385 | 209,604 | 191,826 | |||||||||
(Loss) income from operations |
(54,576 | ) | (109,370 | ) | 43,934 | |||||||
Interest income |
13,075 | 19,324 | 22,698 | |||||||||
Interest expense |
(5,138 | ) | (8,455 | ) | (10,516 | ) | ||||||
Other income (expense), net |
2,919 | (2,407 | ) | (1,824 | ) | |||||||
(Loss) income before provision for taxes |
(43,720 | ) | (100,908 | ) | 54,292 | |||||||
(Benefit from) provision for income taxes(2) |
(53,977 | ) | 6,537 | 1,368 | ||||||||
Net income (loss)(2) |
$ | 10,257 | $ | (107,445 | ) | $ | 52,924 | |||||
Earnings (loss) per common share: |
||||||||||||
Basic |
$ | 0.11 | $ | (1.18 | ) | $ | 0.59 | |||||
Diluted |
$ | 0.11 | $ | (1.18 | ) | $ | 0.57 | |||||
Weighted average shares outstanding: |
||||||||||||
Basic |
93,488 | 91,247 | 90,053 | |||||||||
Diluted |
95,853 | 91,247 | 92,578 | |||||||||
- (1)
- In
July 2009 we introduced our aspenONE subscription offering under which license revenue is recognized over the term of a license contract. We previously
recognized a substantial majority of our license revenue upfront, upon shipment of software. See "Item 7. Management's Discussion and Analysis and Results of Operations—Transition to the
aspenONE Subscription Offering."
- (2)
- Our income tax provision provided a net $54.0 million benefit in fiscal 2011, due to the reversal of a significant portion of our U.S. valuation allowance in the fourth quarter of fiscal 2011. See Note 10 to our Consolidated Financial Statements, "Income Taxes," for further information.
See accompanying notes to these consolidated financial statements.
F-3
ASPEN TECHNOLOGY, INC. AND SUBSIDIARIES
CONSOLIDATED BALANCE SHEETS
| |
June 30, | ||||||||
|---|---|---|---|---|---|---|---|---|---|
| |
2011 | 2010 | |||||||
| |
(Dollars in Thousands, except share data) |
||||||||
ASSETS |
|||||||||
Current assets: |
|||||||||
Cash and cash equivalents |
$ | 149,985 | $ | 124,945 | |||||
Accounts receivable, net |
27,866 | 31,738 | |||||||
Current portion of installments receivable, net |
38,703 | 51,729 | |||||||
Current portion of collateralized receivables |
15,748 | 25,675 | |||||||
Unbilled services |
2,319 | 1,860 | |||||||
Prepaid expenses and other current assets |
10,819 | 5,236 | |||||||
Prepaid income taxes |
1,151 | 7,468 | |||||||
Deferred income taxes—current |
7,272 | 1,234 | |||||||
Total current assets |
253,863 | 249,885 | |||||||
Non-current installments receivable, net |
47,773 | 76,869 | |||||||
Non-current collateralized receivables |
9,291 | 25,755 | |||||||
Property, equipment and leasehold improvements, net |
6,730 | 8,057 | |||||||
Computer software development costs, net |
2,813 | 2,367 | |||||||
Goodwill |
18,624 | 17,361 | |||||||
Deferred income taxes—non-current |
69,242 | 10,641 | |||||||
Other non-current assets |
3,639 | 2,424 | |||||||
Total assets |
$ | 411,975 | $ | 393,359 | |||||
LIABILITIES AND STOCKHOLDERS' EQUITY |
|||||||||
Current liabilities: |
|||||||||
Current portion of secured borrowing |
$ | 15,756 | $ | 30,424 | |||||
Accounts payable |
2,099 | 6,092 | |||||||
Accrued expenses and other current liabilities |
64,467 | 49,890 | |||||||
Income taxes payable |
672 | 1,161 | |||||||
Deferred revenue |
90,681 | 67,852 | |||||||
Total current liabilities |
173,675 | 155,419 | |||||||
Long-term secured borrowing |
9,157 | 45,711 | |||||||
Long-term deferred revenue |
38,262 | 19,427 | |||||||
Other non-current liabilities |
33,078 | 31,832 | |||||||
Commitments and contingencies (Note 11) |
|||||||||
Series D redeemable convertible preferred stock, $0.10 par value—Authorized—3,636 shares as of June 30, 2011 and 2010 |
|||||||||
Issued and outstanding—none as of June 30, 2011 and 2010 |
— | — | |||||||
Stockholders' equity: |
|||||||||
Common stock, $0.10 par value—Authorized—210,000,000 shares |
|||||||||
Issued—94,939,400 shares at June 30, 2011 and 92,668,280 shares at June 30, 2010 |
|||||||||
Outstanding—94,238,370 shares at June 30, 2011 and 92,434,816 shares at June 30, 2010 |
9,494 | 9,267 | |||||||
Additional paid-in capital |
530,996 | 515,729 | |||||||
Accumulated deficit |
(381,271 | ) | (391,038 | ) | |||||
Accumulated other comprehensive income |
9,115 | 7,525 | |||||||
Treasury stock, at cost—701,030 shares of common stock at June 30, 2011 and 233,464 at June 30, 2010 |
(10,531 | ) | (513 | ) | |||||
Total stockholders' equity |
157,803 | 140,970 | |||||||
Total liabilities and stockholders' equity |
$ | 411,975 | $ | 393,359 | |||||
See accompanying notes to these consolidated financial statements.
F-4
ASPEN TECHNOLOGY, INC. AND SUBSIDIARIES
CONSOLIDATED STATEMENTS OF STOCKHOLDERS' EQUITY (DEFICIT) AND
COMPREHENSIVE INCOME (LOSS)
| |
Common Stock | |
|
|
Treasury Stock | |
|
||||||||||||||||||||||
|---|---|---|---|---|---|---|---|---|---|---|---|---|---|---|---|---|---|---|---|---|---|---|---|---|---|---|---|---|---|
| |
|
|
Accumulated Other Comprehensive Income |
|
|
||||||||||||||||||||||||
| |
Number of Shares |
$0.10 Par Value |
Additional Paid-in Capital |
Accumulated Deficit |
Number of Shares |
Cost | Stockholders' Equity (Deficit) |
Total Comprehensive Income (Loss) |
|||||||||||||||||||||
| |
(Dollars in Thousands, except share data) |
||||||||||||||||||||||||||||
Balance June 30, 2008 |
90,235,526 | 9,024 | 493,088 | (336,517 | ) | 7,731 | 233,464 | (513 | ) | 172,813 | |||||||||||||||||||
Issuance of restricted stock units |
90,987 | 9 | (369 | ) | — | — | — | — | (360 | ) | |||||||||||||||||||
Stock-based compensation |
— | — | 4,759 | — | — | — | — | 4,759 | |||||||||||||||||||||
Translation adjustment |
— | — | — | — | (726 | ) | — | — | (726 | ) | $ | (726 | ) | ||||||||||||||||
Net income |
— | — | — | 52,924 | — | — | — | 52,924 | 52,924 | ||||||||||||||||||||
Balance June 30, 2009 |
90,326,513 | 9,033 | 497,478 | (283,593 | ) | 7,005 | 233,464 | (513 | ) | 229,410 | $ | 52,198 | |||||||||||||||||
Exercise of stock options |
1,416,794 | 142 | 7,039 | — | — | — | — | 7,181 | |||||||||||||||||||||
Issuance of restricted stock units |
924,973 | 92 | (4,132 | ) | — | — | — | — | (4,040 | ) | |||||||||||||||||||
Stock-based compensation |
— | — | 15,344 | — | — | — | — | 15,344 | |||||||||||||||||||||
Translation adjustment |
— | — | — | — | 520 | — | — | 520 | $ | 520 | |||||||||||||||||||
Net loss |
— | — | — | (107,445 | ) | — | — | — | (107,445 | ) | (107,445 | ) | |||||||||||||||||
Balance June 30, 2010 |
92,668,280 | $ | 9,267 | $ | 515,729 | $ | (391,038 | ) | $ | 7,525 | 233,464 | $ | (513 | ) | $ | 140,970 | $ | (106,925 | ) | ||||||||||
Exercise of stock options |
1,506,969 | 150 | 9,553 | — | — | — | — | 9,703 | |||||||||||||||||||||
Issuance of restricted stock units |
572,862 | 58 | (3,943 | ) | — | — | — | — | (3,885 | ) | |||||||||||||||||||
Conversion of warrants |
424,753 | 42 | (42 | ) | — | — | — | — | — | ||||||||||||||||||||
Retirement of treasury stock |
(233,464 | ) | (23 | ) | — | (490 | ) | — | (233,464 | ) | 513 | — | |||||||||||||||||
Repurchase of common stock |
— | — | — | — | — | 701,030 | (10,531 | ) | (10,531 | ) | |||||||||||||||||||
Stock-based compensation |
— | — | 9,699 | — | — | — | — | 9,699 | |||||||||||||||||||||
Translation adjustment |
— | — | — | — | 1,590 | — | — | 1,590 | 1,590 | ||||||||||||||||||||
Net income |
— | — | — | 10,257 | — | — | — | 10,257 | 10,257 | ||||||||||||||||||||
Balance June 30, 2011 |
94,939,400 | 9,494 | 530,996 | (381,271 | ) | 9,115 | 701,030 | (10,531 | ) | 157,803 | 11,847 | ||||||||||||||||||
See accompanying notes to these consolidated financial statements.
F-5
ASPEN TECHNOLOGY, INC. AND SUBSIDIARIES
CONSOLIDATED STATEMENTS OF CASH FLOWS
| |
Year Ended June 30, | ||||||||||
|---|---|---|---|---|---|---|---|---|---|---|---|
| |
2011 | 2010 | 2009 | ||||||||
| |
(Dollars in Thousands) |
||||||||||
Cash flows from operating activities: |
|||||||||||
Net income (loss) |
$ | 10,257 | $ | (107,445 | ) | $ | 52,924 | ||||
Adjustments to reconcile net income (loss) to net cash provided by operating activities: |
|||||||||||
Depreciation and amortization |
5,336 | 6,551 | 8,712 | ||||||||
Net foreign currency (gain) loss |
(2,167 | ) | 3,227 | 3,828 | |||||||
Stock-based compensation |
9,699 | 15,260 | 4,670 | ||||||||
Loss on the disposal of property, equipment and leasehold improvements |
453 | 53 | 466 | ||||||||
Write-down of investment |
600 | — | — | ||||||||
Deferred income taxes |
(64,264 | ) | (2,167 | ) | (911 | ) | |||||
Provision for bad debts |
(2,755 | ) | 585 | (314 | ) | ||||||
Loss on impairment of goodwill and intangible assets |
— | — | 623 | ||||||||
Changes in assets and liabilities: |
|||||||||||
Accounts receivable |
5,981 | 16,493 | 34,552 | ||||||||
Unbilled services |
(477 | ) | (1,573 | ) | 2,842 | ||||||
Prepaid expenses, other assets and prepaid income taxes |
(773 | ) | 8,905 | (11,589 | ) | ||||||
Installments and collateralized receivable |
72,752 | 92,450 | (8,042 | ) | |||||||
Income taxes payable |
(751 | ) | (773 | ) | (10,243 | ) | |||||
Accounts payable, accrued expenses and other liabilities |
(12,007 | ) | (1,612 | ) | (16,784 | ) | |||||
Deferred revenue |
41,446 | 8,668 | (27,702 | ) | |||||||
Net cash provided by operating activities |
63,330 | 38,622 | 33,032 | ||||||||
Cash flows from investing activities: |
|||||||||||
Purchase of property, equipment and leasehold improvements |
(2,839 | ) | (2,652 | ) | (2,972 | ) | |||||
Capitalized computer software development costs |
(1,990 | ) | (699 | ) | (2,382 | ) | |||||
Net cash used in investing activities |
(4,829 | ) | (3,351 | ) | (5,354 | ) | |||||
Cash flows from financing activities: |
|||||||||||
Exercise of stock options and warrants |
9,703 | 7,181 | — | ||||||||
Proceeds from secured borrowings |
2,500 | 9,501 | 30,153 | ||||||||
Repayments of secured borrowings |
(32,051 | ) | (44,342 | ) | (68,212 | ) | |||||
Repurchases of common stock |
(10,531 | ) | — | — | |||||||
Payment of tax withholding obligations related to restricted stock |
(3,885 | ) | (4,040 | ) | (360 | ) | |||||
Net cash used in financing activities |
(34,264 | ) | (31,700 | ) | (38,419 | ) | |||||
Effect of exchange rate changes on cash and cash equivalents |
803 | (839 | ) | (1,094 | ) | ||||||
Increase (decrease) in cash and cash equivalents |
25,040 | 2,732 | (11,835 | ) | |||||||
Cash and cash equivalents, beginning of year |
124,945 | 122,213 | 134,048 | ||||||||
Cash and cash equivalents, end of year |
$ | 149,985 | $ | 124,945 | $ | 122,213 | |||||
Supplemental disclosure of cash flow information: |
|||||||||||
Income tax (refunded) paid, net |
(2,112 | ) | $ | 2,541 | $ | 28,921 | |||||
Interest paid |
5,476 | 8,057 | 10,550 | ||||||||
See accompanying notes to these consolidated financial statements.
F-6
ASPEN TECHNOLOGY, INC. AND SUBSIDIARIES
NOTES TO CONSOLIDATED FINANCIAL STATEMENTS
(1) Operations
Aspen Technology, Inc., together with its subsidiaries, is a leading global provider of mission critical process optimization software solutions, which are designed to manage and optimize plant and process design, operational performance, and supply chain planning. Our aspenONE software and related services have been developed specifically for companies in the process industries, which consist of energy, chemicals, engineering and construction, pharmaceuticals, consumer packaged goods, power metals and mining, pulp and paper, and bio-fuels. We operate globally in 28 countries as of June 30, 2011.
(2) Significant Accounting Policies
(a) Principles of Consolidation
The accompanying consolidated financial statements include the accounts of the Company and our wholly owned subsidiaries. All intercompany balances and transactions have been eliminated in consolidation.
Reclassifications
Certain line items in prior period financial statements have been reclassified to conform to currently reported presentations.
(b) Management Estimates
The preparation of financial statements in conformity with accounting principles generally accepted in the United States of America requires management to make estimates and assumptions. These estimates and assumptions affect the reported amounts of assets and liabilities and disclosure of contingent assets and liabilities at the date of the financial statements and the reported amounts of revenue and expenses during the reporting period. Actual results could differ from those estimates.
(c) Cash and Cash Equivalents
Cash and cash equivalents consist of short-term, highly liquid investments with remaining maturities of three months or less when purchased.
(d) Derivative Instruments and Hedging
We conduct business on a worldwide basis and as a result, a portion of our revenues, earnings, net assets, and net investments in foreign affiliates is exposed to changes in foreign currency exchange rates. We measure our net exposure for cash balance positions and for currency cash inflows and outflows in order to evaluate the need to mitigate our foreign exchange risk. We may enter into foreign currency forward contracts to minimize the impact related to unfavorable exchange rate movements, although we have not entered into any forward contracts since fiscal 2008.
In the event we were to enter into foreign currency forward contracts, we would adjust the fair value of the derivative contract through earnings. This is consistent with our accounting for forward currency forward contracts in fiscal 2009. We did not meet the requirements of Accounting Standards Codification Topic 815, Derivatives and Hedging, in order to account for derivatives using hedge accounting treatment during fiscal 2009, the only period presented with derivative activity. During fiscal
F-7
ASPEN TECHNOLOGY, INC. AND SUBSIDIARIES
NOTES TO CONSOLIDATED FINANCIAL STATEMENTS (Continued)
(2) Significant Accounting Policies (Continued)
2009 the gain recognized on derivative contracts was $0.2 million. We did not have any derivative gains or losses during fiscal 2011 or 2010.
(e) Depreciation and Amortization
We provide for depreciation and amortization, primarily computed using the straight-line method, by charges to operations in amounts estimated to allocate the cost of the assets over their estimated useful lives, as follows:
Asset Classification
|
Estimated Useful Life | |
|---|---|---|
Computer equipment |
3 years | |
Purchased software |
3 - 5 years | |
Furniture and fixtures |
3 - 10 years | |
Leasehold improvements |
Life of lease or asset, whichever is shorter |
Depreciation expense was $3.8 million, $4.1 million and $4.6 million for fiscal 2011, 2010 and 2009, respectively.
(f) Revenue Recognition
We generate revenue from the following sources: (1) licensing software products; (2) providing post contract support (referred to as SMS) and training; and (3) providing professional services. We sell our software products to end users under fixed-term and perpetual licenses. As a standard business practice, we offer extended payment term options for our fixed-term license contracts, which are generally payable on an annual basis. Certain of our fixed-term license agreements include product mixing rights that allow customers the flexibility to change or alternate the use of multiple products included in the license arrangement after those products are delivered to the customer. We refer to these arrangements as token arrangements. Tokens are fixed units of measure. The amount of software usage is limited by the number of the tokens purchased by the customer.
Prior to fiscal 2010, we primarily executed software license arrangements with contractual provisions that resulted in the "upfront" recognition of license revenue upon delivery of the software products, provided all other revenue recognition requirements were met. Beginning in July 2009, we began offering our aspenONE suite of products on subscription basis, providing customers with access to all products within the aspenONE suite or suites they license. As part of our subscription-based offering, customers receive, for no additional fee, SMS for the term of the license and the right to unspecified future software products and upgrades that may be introduced into the licensed suite during the term of the arrangement. Under the subscription-based licensing model, we recognize revenue over the term of the agreement on a subscription, or "daily ratable" basis, beginning when the first payment is due, typically 30 days after signing the agreement, provided all other revenue recognition requirements are met. Beginning in July 2009, we also began bundling SMS for the full contract term on our point product license arrangements. Previously, SMS on our multi-year term point product arrangements was offered for an initial one-year period, and then renewed annually thereafter at the customers' option ("legacy term license arrangements").
Over the next several years, we expect to transition substantially all of our customers to our aspenONE subscription offering or to point product arrangements with SMS included for the contract
F-8
ASPEN TECHNOLOGY, INC. AND SUBSIDIARIES
NOTES TO CONSOLIDATED FINANCIAL STATEMENTS (Continued)
(2) Significant Accounting Policies (Continued)
term. During this transition period, we may have arrangements where the software element will be recognized upfront, including perpetual licenses and amendments to existing legacy term arrangements. We do not expect revenue related to these sources to be significant in relation to our total revenue.
Four basic criteria must be satisfied before software license revenue can be recognized: persuasive evidence of an arrangement between us and an end user; delivery of our product has occurred; the fee for the product is fixed or determinable; and collection of the fee is probable.
Persuasive evidence of an arrangement—We use a contract signed by the customer as evidence of an arrangement for software licenses and SMS. For professional services we use a signed contract and a statement of work to evidence an arrangement. In cases where both a signed contract and a purchase order are required by the customer, we consider both taken together as evidence of the arrangement.
Delivery of our product—Software and the corresponding access keys are generally delivered to customers via disk media with standard shipping terms of Free Carrier, Aspen Technology's warehouse (i.e., FCA, named place). Our software license agreements do not contain conditions for acceptance.
Fee is fixed or determinable—We assess whether a fee is fixed or determinable at the outset of the arrangement. Significant judgment is involved in making this assessment.
Under our upfront revenue model, we are able to demonstrate that the fees are fixed or determinable for all arrangements, including those for our term licenses that contain extended payment terms. We have an established history of collecting under the terms of these contracts without providing concessions to customers. In addition, we also assess whether contract modifications to an existing term arrangement constitute a concession. In making this assessment, significant analysis is performed to ensure that no concessions are given. Our software license agreements do not include right of return or exchange. For license arrangements executed under the upfront revenue model, we recognize license revenue upon delivery of the software product, provided all other revenue recognition requirements are met.
With the introduction of our aspenONE subscription offering and the changes to the licensing terms of our point products arrangements sold on a fixed-term basis, we cannot assert that the fees in these new arrangements are fixed or determinable because the rights provided to customers and the economics of the arrangements are not comparable to our historical transactions with other customers under the upfront revenue model. As a result, the amount of revenue recognized for these arrangements is limited by the amount of customer payments that become due. For our aspenONE subscription transactions this generally results in the fees being recognized ratably over the term of the contract. For our point product licenses sold with SMS included for the entire term of the arrangement, this generally results in the license fee being recognized as each payment comes due, while the allocated portion of the SMS revenue is recognized ratably over its annual term.
Collection of fee is probable—We assess the probability of collecting from each customer at the outset of the arrangement based on a number of factors, including the customer's payment history, its current creditworthiness, economic conditions in the customer's industry and geographic location, and general economic conditions. If in our judgment collection of a fee is not probable, revenue is recognized as cash is collected, provided all other conditions for revenue recognition have been met.
F-9
ASPEN TECHNOLOGY, INC. AND SUBSIDIARIES
NOTES TO CONSOLIDATED FINANCIAL STATEMENTS (Continued)
(2) Significant Accounting Policies (Continued)
We allocate the arrangement consideration among the elements included in our multi-element arrangements using the residual method. Under the residual method, the vendor-specific evidence of fair value, or "VSOE," of the undelivered elements is deferred and the remaining portion of the arrangement fee for perpetual and term licenses is recognized as revenue upon delivery of the software, assuming all other revenue recognition criteria are met. If VSOE does not exist for an undelivered element in an arrangement, revenue is deferred until such evidence does exist for the undelivered elements, or until all elements are delivered, whichever is earlier.
Under the upfront revenue model, the residual license fee is recognized upfront upon delivery of the software provided all other revenue recognition criteria were met. For arrangements entered into since July 2009, the arrangement fees are generally recognized over the term of the license agreement since these arrangements include contractual provisions such as rights to future unspecified software products for no additional fee or because we cannot assert that the fees are fixed or determinable.
We have established VSOE of fair value for SMS and professional services, but not for our software products. We assess VSOE of fair value for SMS and professional services based on an analysis of standalone sales of SMS renewals and professional services, using the bell-shaped curve approach. We use the optional renewals of SMS on our legacy term license arrangements to support VSOE of fair value for SMS included in our new fixed-term point product arrangements. The license product offerings and the SMS in the legacy term license arrangements and the new point product arrangements are the same.
Subscription Revenue
When a customer elects to license our products under our aspenONE subscription offering, SMS is included for the entire term of the arrangement and the customer receives, for the term of the arrangement, the right to any new unspecified future software products and upgrades that may be introduced into the licensed aspenONE software suite. These agreements combine the right to use all software products within a given product suite with SMS for the term of the arrangement. Due to our obligation to provide unspecified future software products and upgrades, we are required to recognize the revenue ratably (that is, on a daily ratable basis) over the term of the license, once the four revenue recognition criteria noted above are met. License and SMS revenue for arrangements sold under our subscription-based licensing model are combined and presented together as subscription revenue in the consolidated statements of operations.
Software Revenue
Software revenue consists of all license transactions that do not contain rights to future unspecified software products for no additional fee. Specifically, it includes license revenue recognized under the upfront revenue model upon the delivery of the licensed products (i.e., both perpetual and term license arrangements); license revenue recognized over the term of the license agreements for fixed-term contracts including point product licenses with SMS bundled for the entire license term; and other license revenue derived from transactions that are being recognized over time as the result of not previously meeting one or more of the requirements for recognition under the upfront revenue model.
The license fees derived from the sale of fixed-term point product arrangements with SMS included for the arrangement term are recognized under the residual method, as payments come due. The related SMS is recognized over the term of the SMS agreement beginning with the due date of the
F-10
ASPEN TECHNOLOGY, INC. AND SUBSIDIARIES
NOTES TO CONSOLIDATED FINANCIAL STATEMENTS (Continued)
(2) Significant Accounting Policies (Continued)
annual payment and is reported in services and other on the consolidated statement of operations. Occasionally, we expect certain customers to elect upfront payment terms. For these arrangements with upfront payment, all of the license revenue will be recognized upfront by applying the residual method of accounting when the above four revenue recognition requirements have been met.
Perpetual license arrangements do not include the same rights as those provided to customers under the aspenONE subscription offering. Accordingly, the license fees for perpetual license agreements will continue to be recognized upon delivery of the software products using the residual method provided all other revenue recognition requirements are met. The revenue attributable to perpetual software licenses is recognized in software revenue in the consolidated statement of operations.
Services and Other
SMS Revenue
Under the upfront revenue model, SMS is typically included with the license for the initial year of the license term. Under these arrangements, the fair value of SMS is deferred and subsequently amortized into services and other in the consolidated statement of operations over the contractual term of the SMS arrangement. SMS renewals are at the option of the customer.
For arrangements executed under the aspenONE subscription offering or where point product licenses are sold with SMS for the contract term, the customer commits to SMS for the entire term of the license arrangement. The revenue related to the SMS component of the aspenONE subscription offering is reported in subscription revenue in the consolidated statements of operations. The revenue related to the SMS component of point product licenses, for which we have VSOE, is reported in services and other revenue in the consolidated statement of operations.
Professional Services
Professional services are provided to customers on a time-and-materials (T&M) or fixed-price basis. We allocate the fair value of our professional services that are bundled with non-aspenONE subscription arrangements, and generally recognize the related revenue as the services are performed, assuming all other revenue recognition criteria have been met. We recognize professional services fees for our T&M contracts based upon hours worked and contractually agreed-upon hourly rates. Revenue from fixed-price engagements is recognized using the proportional performance method based on the ratio of costs incurred, to the total estimated project costs. Professional services revenue is recognized within services and other revenue in the statement of operations. Project costs are based on standard rates, which vary by the consultant's professional level, plus all direct expenses incurred to complete the engagement that are not reimbursed by the client. Project costs are typically expensed as incurred. The use of the proportional performance method is dependent upon our ability to reliably estimate the costs to complete a project. We use historical experience as a basis for future estimates to complete current projects. Additionally, we believe that costs are the best available measure of performance. Reimbursables received from customers for out-of-pocket expenses are recorded as revenue.
If the costs to complete a project are not estimable or the completion is uncertain, the revenue is recognized upon completion of the services. In those circumstances in which committed professional services arrangements are sold as a single arrangement with, or in contemplation of, a new license
F-11
ASPEN TECHNOLOGY, INC. AND SUBSIDIARIES
NOTES TO CONSOLIDATED FINANCIAL STATEMENTS (Continued)
(2) Significant Accounting Policies (Continued)
agreement, revenue is deferred and recognized on a ratable basis over the longer of the period the services are performed or the license term. We have occasionally been required to commit unanticipated additional resources to complete projects, which resulted in lower than anticipated income or losses on those contracts. Provisions for estimated losses on contracts are made during the period in which such losses become probable and can be reasonably estimated.
Occasionally, we provide professional services considered essential to the functionality of the software. We recognize the combined revenue from the sale of the software and related services using the percentage-of-completion method. When these professional services are combined with, and essential to, the functionality of an aspenONE subscription transaction, the amount of combined revenue will be recognized over the longer of the subscription term or the period the professional services are provided.
Deferred Revenue
Under the upfront revenue model and for point product arrangements, a portion of the arrangement fee is generally recorded as deferred revenue due to the inclusion of an undelivered element, typically SMS. The amount of revenue allocated to undelivered elements is based on the VSOE of fair value for those elements using the residual method and is earned and recognized as revenue as each element is delivered. Deferred revenue related to these transactions generally consists of SMS and represents payments received in advance of services rendered as of the balance sheet dates.
Under the aspenONE subscription offering, customers receive rights to unspecified future products and SMS for the full contract term. As VSOE does not exist for both of these undelivered elements, we are required to recognize the arrangement fees ratably (i.e., on a subscription basis) over the term of the license. Therefore, deferred revenue is recorded as each payment comes due and revenue is recognized ratably over the associated license period.
Other Licensing Matters
Our standard licensing agreements include a product warranty provision. Such warranties are accounted for in accordance with ASC Topic 460, Guarantees (ASC 460). We have not experienced significant claims related to software warranties beyond the scope of SMS support, which we are already obligated to provide, and consequently, we have not established reserves for warranty obligations.
Our agreements with our customers generally require us to indemnify the customer against claims that our software infringes third party patent, copyright, trademark or other proprietary rights. Such indemnification obligations are generally limited in a variety of industry-standard respects, including our right to replace an infringing product. As of June 30, 2011, we had not experienced any material losses related to these indemnification obligations and no claims with respect thereto were outstanding. We do not expect significant claims related to these indemnification obligations, and consequently, have not established any related reserves.
F-12
ASPEN TECHNOLOGY, INC. AND SUBSIDIARIES
NOTES TO CONSOLIDATED FINANCIAL STATEMENTS (Continued)
(2) Significant Accounting Policies (Continued)
(g) Installments Receivable
Installments receivable resulting from product sales under the upfront revenue model were discounted to present value at prevailing market rates (generally 8% to 9%) at the date the contract is signed, based on the customers' credit rating. Finance fees are recognized using the effective interest method over the relevant license term and are classified as interest income. Installments receivable are split between current and non-current in our consolidated balance sheets based on the maturity date of the related installment. Non-current installments receivable consists of receivables with a due date greater than one year from the period-end date. Current installments receivable consists of invoices with a due date of less than one year but greater than 45 days from the period-end date. Once an installments receivable invoice is due within 45 days, it is reclassified as a trade accounts receivable on our consolidated balance sheet. As a result, we did not have any past due installments receivable as of June 30, 2011.
Our non-current installments receivable fall within the scope of Accounting Standards Update (ASU) No. 2010-20, Receivables (Topic 310): Disclosures about the Credit Quality of Financing Receivables and the Allowance for Credit Losses. As our portfolio of financing receivables arise from the sale of our software licenses, the methodology for determining our allowance for doubtful accounts is based on the collective population and is not stratified by class or portfolio segment. We consider factors such as existing economic conditions, country risk, and customers' past payment history in determining our allowance for doubtful accounts. We reserve against our installments receivable when the related trade accounts receivable has been past due for over a year, or when there is a specific risk of collectability. Our specific reserve reflects the full value of the related installments receivable for which collection has been deemed uncertain. Our specific reserve represented 92% and 95% of our total installments receivable allowance for doubtful accounts at June 30, 2011 and 2010, respectively. In instances where an installment receivable that is reserved against ages into trade accounts receivable, the related reserve is transferred to our trade accounts receivable allowance. We write off receivables when they have been deemed uncollectable, based on our judgment. In instances where we write off a given customers' trade accounts receivables, we also write off any related current and non-current installment receivables balances. Any incremental interest income for installments receivable that have been reserved against is offset by an additional provision to the allowance for doubtful accounts.
The following table summarizes our net current and non-current installments receivable and allowance for doubtful accounts balances (dollars in thousands) at June 30, 2011 and June 30, 2010:
| |
Current | Non-current | Total | |||||||||
|---|---|---|---|---|---|---|---|---|---|---|---|---|
June 30, 2011 |
||||||||||||
Installments receivable, gross |
$ | 39,470 | $ | 47,894 | $ | 87,364 | ||||||
Less: Allowance for doubtful accounts |
(767 | ) | (121 | ) | (888 | ) | ||||||
Installments receivable, net |
$ | 38,703 | $ | 47,773 | $ | 86,476 | ||||||
June 30, 2010 |
||||||||||||
Installments receivable, gross |
$ | 52,848 | $ | 78,065 | $ | 130,913 | ||||||
Less: Allowance for doubtful accounts |
(1,119 | ) | (1,196 | ) | (2,315 | ) | ||||||
Installments receivable, net |
$ | 51,729 | $ | 76,869 | $ | 128,598 | ||||||
F-13
ASPEN TECHNOLOGY, INC. AND SUBSIDIARIES
NOTES TO CONSOLIDATED FINANCIAL STATEMENTS (Continued)
(2) Significant Accounting Policies (Continued)
The following table shows a rollforward of our current and non-current allowance for doubtful accounts for the installments receivable balances (dollars in thousands):
| |
Current | Non-Current | Total | ||||||||
|---|---|---|---|---|---|---|---|---|---|---|---|
Balance at June 30, 2010 |
$ | 1,119 | $ | 1,196 | $ | 2,315 | |||||
Transfers to trade accounts receivable |
(993 | ) | — | (993 | ) | ||||||
Transfers from non-current to current |
757 | (757 | ) | — | |||||||
Write-offs |
(302 | ) | (322 | ) | (624 | ) | |||||
Recoveries of previous write-offs |
194 | — | 194 | ||||||||
Provision for bad debts |
(8 | ) | 4 | (4 | ) | ||||||
Balance at June 30, 2011 |
$ | 767 | $ | 121 | $ | 888 | |||||
Our installments receivable balance will continue to decrease over time, as licensing agreements previously executed under our upfront revenue model reach the end of their terms and are renewed under our new licensing model. Under the aspenONE subscription offering and for point product arrangements sold with SMS bundled for the entire license term, payment amounts under extended payment term arrangements are not presented in the consolidated balance sheets as the related arrangement fees are not fixed or determinable. Accordingly, future installments under our new licensing model are not considered financing receivables.
(h) Computer Software Development Costs
Certain computer software development costs are capitalized in the accompanying consolidated balance sheets. Capitalization of computer software development costs begins upon the establishment of technological feasibility. In accordance with ASC Topic 985-20, Costs of Software to Be Sold, Leased, or Marketed, we define the establishment of technological feasibility as the completion of a detailed program design. Amortization of capitalized computer software development costs is provided on a product-by-product basis using the greater of (a) the amount computed using the ratio that current gross revenue for a product bear to total of current and anticipated future gross revenue for that product or (b) the straight-line method, beginning upon commercial release of the product, and continuing over the remaining estimated economic life of the product, not to exceed three years. Software for internal use is capitalized in accordance with ASC Topic 350-40, Intangibles Goodwill and Other—Internal Use Software. At each balance sheet date, we evaluate the unamortized capitalized software costs for potential impairment by comparing to the net realizable value of the products. Total computer software costs capitalized were $2.0 million, $0.7 million and $2.4 million during the years ended June 30, 2011, 2010 and 2009, respectively. Total amortization expense charged to operations was approximately $1.5 million, $2.2 million and $3.9 million for the years ended June 30, 2011, 2010 and 2009, respectively. Computer software development accumulated amortization totaled $68.9 million and $67.3 million as of June 30, 2011 and 2010, respectively.
(i) Foreign Currency Translation
The determination of the functional currency of subsidiaries is based on the subsidiaries' financial and operational environment and is normally the local currency. Gains and losses from foreign currency translation related to entities whose functional currency is their local currency are credited or charged to accumulated other comprehensive income (loss), included in stockholders' equity in the consolidated
F-14
ASPEN TECHNOLOGY, INC. AND SUBSIDIARIES
NOTES TO CONSOLIDATED FINANCIAL STATEMENTS (Continued)
(2) Significant Accounting Policies (Continued)
balance sheets. In all instances, foreign currency transaction gains or losses are credited or charged to the consolidated statements of operations as incurred as a component of other income (expense), net. Foreign currency transaction gains and (losses) were $3.3 million, ($2.6) million and ($1.8) million in fiscal 2011, 2010 and 2009, respectively.
(j) Earnings (Loss) Applicable to Common Stockholders
Basic earnings per share were determined by dividing income attributable to common stockholders by the weighted average common shares outstanding during the period. Diluted earnings per share were determined by dividing income (loss) attributable to common stockholders by diluted weighted average shares outstanding during the period. Diluted weighted average shares reflect the dilutive effect, if any, of potential common shares. To the extent their effect is dilutive, employee equity awards and warrants, based on the treasury stock method, are included in the calculation of diluted earnings per share. For year ended June 30, 2010, all potential common shares were anti-dilutive due to the net loss. The calculations of basic and diluted net income (loss) per share and basic and diluted weighted average shares outstanding are as follows (dollars in thousands, except per share data):
| |
Year Ended June 30, | ||||||||||
|---|---|---|---|---|---|---|---|---|---|---|---|
| |
2011 | 2010 | 2009 | ||||||||
Net income (loss) |
$ | 10,257 | $ | (107,445 | ) | $ | 52,924 | ||||
Weighted average shares outstanding |
93,488 | 91,247 | 90,053 | ||||||||
Dilutive impact from: |
|||||||||||
Share-based payment awards |
2,313 | — | 2,133 | ||||||||
Warrants |
52 | — | 392 | ||||||||
Dilutive weighted average shares outstanding |
95,853 | 91,247 | 92,578 | ||||||||
Earnings (loss) per share |
|||||||||||
Basic |
$ | 0.11 | $ | (1.18 | ) | $ | 0.59 | ||||
Dilutive |
$ | 0.11 | $ | (1.18 | ) | $ | 0.57 | ||||
The following potential common shares were excluded from the calculation of dilutive weighted average shares outstanding because the exercise price of the stock options exceeded the average market price of our common stock and/or their effect would be anti-dilutive at the balance sheet date (shares in thousands):
| |
Year Ended June 30, | |||||||||
|---|---|---|---|---|---|---|---|---|---|---|
| |
2011 | 2010 | 2009 | |||||||
Common stock equivalents |
1,728 | 8,642 | 2,230 | |||||||
F-15
ASPEN TECHNOLOGY, INC. AND SUBSIDIARIES
NOTES TO CONSOLIDATED FINANCIAL STATEMENTS (Continued)
(2) Significant Accounting Policies (Continued)
(k) Concentration of Credit Risk
Financial instruments that potentially subject us to concentrations of credit risk are principally cash and cash equivalents, accounts receivable and installments and collateralized receivables. We place our cash and cash equivalents in financial institutions management believes to be high credit quality. Concentration of credit risk with respect to receivables is limited to certain customers to which we make substantial sales. To reduce risk, we assess the financial strength of our customers. We do not generally require collateral or other security in support of our receivables. As of June 30, 2011 and 2010, no customer receivables represented more than 10% of total receivables. Our business and results of operations are affected by international, national and regional economic conditions.
(l) Allowance for Doubtful Accounts and Discounts
We make judgments as to our ability to collect outstanding receivables and provide allowances for the portion of receivables when a loss is reasonably expected to occur. The allowance for doubtful accounts is established to represent the best estimate of the net realizable value of the outstanding accounts and installments receivable. The development of the allowance for doubtful accounts is based on a review of past due amounts, historical write-off and recovery experience, as well as aging trends affecting specific accounts and general operational factors affecting all accounts. In addition, factors are developed utilizing historical trends in bad debts, returns and allowances.
We consider current economic trends when evaluating the adequacy of the allowance for doubtful accounts. If circumstances relating to specific customers change or unanticipated changes occur in the general business environment, our estimates of the recoverability of receivables could be further adjusted.
The following table presents our allowance for doubtful accounts activity for accounts and installments receivable in fiscal 2011, 2010 and 2009, respectively (dollars in thousands):
| |
Year Ended June 30, | ||||||||||
|---|---|---|---|---|---|---|---|---|---|---|---|
| |
2011 | 2010 | 2009 | ||||||||
Balance, beginning of year |
$ | 7,000 | $ | 8,487 | $ | 10,637 | |||||
Provision for bad debts |
(2,618 | ) | 437 | (1,378 | ) | ||||||
Write-offs |
(1,611 | ) | (1,924 | ) | (772 | ) | |||||
Balance, end of year |
$ | 2,771 | $ | 7,000 | $ | 8,487 | |||||
The decrease in the allowance for doubtful accounts was primarily due to net collections in fiscal 2011 of previously reserved receivables, which offset new reserves in the year. Also contributing to the decrease in the allowance for doubtful accounts were write-offs for receivables deemed uncollectible.
F-16
ASPEN TECHNOLOGY, INC. AND SUBSIDIARIES
NOTES TO CONSOLIDATED FINANCIAL STATEMENTS (Continued)
(2) Significant Accounting Policies (Continued)
The following table summarizes our receivable balances, net of the related allowance for doubtful accounts, as of June 30, 2011 and 2010 (dollars in thousands). Installments and collateralized receivables are presented on the consolidated balance sheet and in the table below net of discounts for future interest established at inception of the installment arrangement and carry terms of up to five years.
| |
June 30, | |||||||||||||||||||
|---|---|---|---|---|---|---|---|---|---|---|---|---|---|---|---|---|---|---|---|---|
| |
2011 | 2010 | ||||||||||||||||||
| |
Gross | Allowance | Net | Gross | Allowance | Net | ||||||||||||||
Accounts Receivable |
$ | 29,750 | $ | 1,884 | $ | 27,866 | $ | 36,423 | $ | 4,685 | $ | 31,738 | ||||||||
Installments Receivable |
||||||||||||||||||||
Current |
$ | 39,470 | $ | 767 | $ | 38,703 | $ | 52,848 | $ | 1,119 | $ | 51,729 | ||||||||
Non-current |
47,894 | 121 | 47,773 | 78,065 | 1,196 | 76,869 | ||||||||||||||
|
$ | 87,364 | $ | 888 | $ | 86,476 | $ | 130,913 | $ | 2,315 | $ | 128,598 | ||||||||
Collateralized Receivable |
||||||||||||||||||||
Current |
$ | 15,748 | $ | — | $ | 15,748 | $ | 25,675 | $ | — | $ | 25,675 | ||||||||
Non-current |
9,291 | — | 9,291 | 25,755 | — | 25,755 | ||||||||||||||
|
$ | 25,039 | $ | — | $ | 25,039 | $ | 51,430 | $ | — | $ | 51,430 | ||||||||
The unamortized discount on installments and collateralized receivables is recognized over the term of the installment arrangement as interest income, using the effective interest method. The total of such unrecognized discounts as of June 30, 2011 and 2010 was as follows (dollars in thousands):
| |
June 30, | ||||||
|---|---|---|---|---|---|---|---|
| |
2011 | 2010 | |||||
Current portion of installments receivable |
$ | 1,937 | $ | 2,775 | |||
Current portion of collateralized receivables |
623 | 1,158 | |||||
Long-term installments receivable |
7,383 | 15,942 | |||||
Long-term collateralized receivables |
1,029 | 3,873 | |||||
(m) Fair Value of Financial Instruments
Effective July 1, 2008, we adopted the provisions of ASC Topic 820, Fair Value Measurements and Disclosures (ASC 820), for financial assets and financial liabilities. Effective July 1, 2009, we adopted the provisions of ASC 820 for non-financial assets and non-financial liabilities. ASC 820 defines fair value, establishes a framework for measuring fair value in GAAP and expands disclosures about fair value measurements.
ASC 820 defines fair value as the price that would be received to sell an asset, or paid to transfer a liability, in an orderly transaction between market participants. ASC 820 establishes a fair value hierarchy for valuation inputs that gives the highest priority to quoted prices in active markets for
F-17
ASPEN TECHNOLOGY, INC. AND SUBSIDIARIES
NOTES TO CONSOLIDATED FINANCIAL STATEMENTS (Continued)
(2) Significant Accounting Policies (Continued)
identical assets or liabilities and the lowest priority to unobservable inputs. The fair value hierarchy is as follows:
- •
- Level 1 Inputs—Unadjusted quoted prices in active markets for identical assets or liabilities that the
reporting entity has the ability to access at the measurement date.
- •
- Level 2 Inputs—Inputs other than quoted prices included in Level 1 that are observable for the
asset or liability, either directly or indirectly. These might include quoted prices for similar assets or liabilities in active markets, quoted prices for identical or similar assets or liabilities
in markets that are not active, inputs other than quoted prices that are observable for the asset or liability (such as interest rates, volatilities, prepayment speeds, credit risks, etc.) or inputs
that are derived principally from or corroborated by market data by correlation or other means.
- •
- Level 3 Inputs—Unobservable inputs for determining the fair values of assets or liabilities that reflect an entity's own assumptions about the assumptions that market participants would use in pricing the assets or liabilities.
Cash Equivalents. Cash equivalents are reported at fair value utilizing quoted market prices in identical markets, or "Level 1 Inputs." Our cash equivalents consist of short-term, highly liquid investments with remaining maturities of three months or less when purchased.
Financial instruments not measured or recorded at fair value in the accompanying financial statements consist of accounts receivable, installments receivable, collateralized receivables, accounts payable and secured borrowings. The estimated fair value of accounts receivable, installments receivable, collateralized receivables and accounts payable approximates the carrying value. The estimated fair value of secured borrowings exceeds the carrying value by $1.1 million as of June 30, 2011. The fair value of secured borrowings was calculated using the market approach, utilizing interest rates that were indirectly observable in markets for similar liabilities, or "Level 2 Inputs."
The following table summarizes financial assets and financial liabilities measured and recorded at fair value on a recurring basis in the accompanying financial statements as of June 30, 2011 and 2010, segregated by the level of the valuation inputs within the fair value hierarchy utilized to measure fair value (dollars in thousands):
| |
Fair Value Measurement at Reporting Date Using |
|||||||||
|---|---|---|---|---|---|---|---|---|---|---|
Description
|
Quoted Prices in Active Markets for Identical Assets (Level 1) |
Significant Other Observable Inputs (Level 2) |
Significant Unobservable Inputs Level (3) |
|||||||
June 30, 2011 |
||||||||||
Assets: |
||||||||||
Cash equivalents |
$ | 139,000 | — | — | ||||||
June 30, 2010 |
||||||||||
Assets: |
||||||||||
Cash equivalents |
$ | 107,000 | — | — | ||||||
F-18
ASPEN TECHNOLOGY, INC. AND SUBSIDIARIES
NOTES TO CONSOLIDATED FINANCIAL STATEMENTS (Continued)
(2) Significant Accounting Policies (Continued)
Certain non-financial assets and liabilities are measured at fair value on a recurring basis. These include reporting units measured at fair value using market and income approaches in the first step of a goodwill impairment test. Certain non-financial assets, including goodwill, intangible assets and other non-financial long-lived assets, are measured at fair value using market and income approaches on a non-recurring basis when there is an indication that there may be a triggering event which could result in impairment.
(n) Intangible Assets, Goodwill and Long-Lived Assets
Acquired intangibles are removed from the accounts when fully amortized and no longer in use. Intangible assets related to customer relationships were fully amortized as of June 30, 2011 and 2010. Intangible asset amortization expense was $0.2 million for fiscal 2010 and 2009. There was no acquired intangible asset amortization expense in fiscal 2011, as fiscal 2010 was the final year of amortization on our acquired intangible asset. Amortization expense is provided on a straight-line basis over the estimated useful lives of the intangible assets.
The changes in the carrying amount of the goodwill by reporting unit for fiscal 2011 and 2010 were as follows (dollars in thousands):
| |
Reporting Unit | |||||||||||||
|---|---|---|---|---|---|---|---|---|---|---|---|---|---|---|
Asset Class
|
License | Professional Services |
Maintenance and Training |
Total | ||||||||||
Balance as of June 30, 2009 |
||||||||||||||
Goodwill |
$ | 68,044 | $ | 5,102 | $ | 14,211 | $ | 87,357 | ||||||
Accumulated impairment losses |
(65,569 | ) | (5,102 | ) | — | (70,671 | ) | |||||||
|
$ | 2,475 | $ | — | $ | 14,211 | $ | 16,686 | ||||||
Effect of changes in currency translation |
15 | — | 660 | 675 | ||||||||||
Balance as of June 30, 2010 |
||||||||||||||
Goodwill |
$ | 68,059 | $ | 5,102 | $ | 14,871 | $ | 88,032 | ||||||
Accumulated impairment losses |
(65,569 | ) | (5,102 | ) | — | (70,671 | ) | |||||||
|
$ | 2,490 | $ | — | $ | 14,871 | $ | 17,361 | ||||||
Effect of changes in currency translation |
(10 | ) | — | 1,273 | 1,263 | |||||||||
Balance as of June 30, 2011 |
||||||||||||||
Goodwill |
$ | 68,049 | $ | 5,102 | $ | 16,144 | $ | 89,295 | ||||||
Accumulated impairment losses |
(65,569 | ) | (5,102 | ) | — | (70,671 | ) | |||||||
|
$ | 2,480 | $ | — | $ | 16,144 | $ | 18,624 | ||||||
We test goodwill for impairment annually at the reporting unit level using a fair value approach in accordance with the provisions of ASC Topic 350, Intangibles—Goodwill and Other. We conduct our annual impairment test on December 31, of each year. The initial step requires us to determine the fair value of each reporting unit and compare it to the carrying value, including goodwill, of such reporting unit. If the fair value exceeds the carrying value, no impairment loss is to be recognized. However, if the carrying value of the reporting unit exceeds its fair value, the goodwill of this unit may be impaired. The amount of impairment, if any, is then measured based upon the estimated fair value of goodwill at
F-19
ASPEN TECHNOLOGY, INC. AND SUBSIDIARIES
NOTES TO CONSOLIDATED FINANCIAL STATEMENTS (Continued)
(2) Significant Accounting Policies (Continued)
the valuation date. We performed our annual impairment test for each reporting unit as of December 31, 2010 and determined that the estimated fair values substantially exceeded the carrying values. As such, no impairment losses were recognized as a result of the analysis. If an event occurs or circumstances change that would more likely than not reduce the fair value of a reporting unit below its carrying value, goodwill will be evaluated for impairment between annual tests.
Certain negative macroeconomic factors began to impact the global credit markets in late calendar 2008 and we noted significant unfavorable trends in business conditions in the second quarter of fiscal 2009. In connection with preparing the annual impairment assessment for fiscal 2009, we identified significant deterioration in the expected future financial performance of the professional services segment compared to the expected future financial performance of this segment at the end of fiscal 2008. As a result, we recognized goodwill and intangible assets impairments of $0.5 million and $0.1 million, respectively, within the professional services reporting unit during the second fiscal quarter of 2009, which ended December 31, 2008, to write off all of the remaining goodwill and intangible assets of this reporting unit. The method for determining fair value was based on weighting estimates of future cash flows from the reporting units and estimates of the market value of the reporting units, based on comparable companies. These impairment losses were recorded as loss on impairment of goodwill and intangible assets in the consolidated statement of operations.
We evaluate our long-lived assets, which include property and leasehold improvements and intangible assets, excluding goodwill, for impairment as events and circumstances indicate that the carrying amount may not be recoverable. If we determine that an impairment review is required, we would review the expected future undiscounted cash flows to be generated by the assets. If we determine that the carrying value of our long-lived assets may not be recoverable, we would measure any impairment based on a discounted cash flow method using a discount rate determined by us to be commensurate with the risk inherent in our current business model.
(o) Comprehensive Income
Comprehensive income is defined as the change in equity of a business enterprise during a period from transactions and other events and circumstances from non-owner sources. Comprehensive income is disclosed in the accompanying consolidated statements of stockholders' equity (deficit) and comprehensive income (loss). The components of accumulated other comprehensive income as of June 30, 2011, 2010 and 2009 consist of cumulative translation adjustments.
(p) Accounting for Stock-Based Compensation
We adopted ASC Topic 718, Compensation—Stock Compensation (ASC 718). Under the provisions of this topic, stock-based compensation cost is measured at the grant date based on the fair value of the award and is recognized as expense over the vesting period.
(q) Accounting for Transfers of Financial Assets
We derecognize financial assets, specifically accounts receivable and installments receivable, when control has been surrendered in compliance with ASC Topic 860, Transfers and Servicing. Transfers of accounts receivable and installments receivable that meet the requirements of ASC 860 for sale accounting treatment are removed from the balance sheet and gains or losses on the sale are recognized. If the conditions for sale accounting treatment are not met, or are no longer met, accounts
F-20
ASPEN TECHNOLOGY, INC. AND SUBSIDIARIES
NOTES TO CONSOLIDATED FINANCIAL STATEMENTS (Continued)
(2) Significant Accounting Policies (Continued)
receivable and installments receivable transferred are classified as collateralized receivables in the consolidated balance sheet and cash received from these transactions is classified as secured borrowings. All transfers of assets are accounted for as secured borrowings. Transaction costs associated with secured borrowings, if any, are treated as borrowing costs and recognized in interest expense. When we receive cash from a customer, the collateralized receivable balance is reduced and the related secured borrowing is reclassified to an accrued liability account, "due to financing institutions" until payment is remitted to the financial institution.
(r) Income Taxes
Deferred income taxes are recognized based on temporary differences between the financial statement and tax bases of assets and liabilities. Deferred tax assets and liabilities are measured using the statutory tax rates and laws expected to apply to taxable income in the years in which the temporary differences are expected to reverse. Valuation allowances are provided against net deferred tax assets if, based upon the available evidence, it is more likely than not that some or all of the deferred tax assets will not be realized. The ultimate realization of deferred tax assets is dependent upon the generation of future taxable income and the timing of the temporary differences becoming deductible. Management considers, among other available information, scheduled reversals of deferred tax liabilities, projected future taxable income, limitations of availability of net operating loss carryforwards, and other matters in making this assessment.
We do not provide deferred taxes on unremitted earnings of foreign subsidiaries since we intend to indefinitely reinvest either currently or sometime in the foreseeable future. Unrecognized provisions for taxes on undistributed earnings of foreign subsidiaries, which are considered indefinitely reinvested, are not material to our consolidated financial position or results of operations. We are continuously subject to examination by the IRS, as well as various state and foreign jurisdictions. The IRS and other taxing authorities may challenge certain deductions and credits reported by us on our income tax returns. In July 2006, the FASB issued FIN 48, Accounting for Uncertain Tax Positions, (currently included as provisions of ASC Topic 740), which clarifies the criteria for recognition and measurement of benefits from uncertain tax positions. Under ASC 740, an entity should recognize a tax benefit when it is more-likely-than-not, based on the technical merits, that the position would be sustained upon examination by a taxing authority. The amount to be recognized, if the more-likely-than-not threshold was passed, should be measured as the largest amount of tax benefit that is greater than 50 percent likely of being realized upon ultimate settlement with a taxing authority that has full knowledge of all relevant information. Furthermore, any change in the recognition, de-recognition or measurement of a tax position should be recorded in the period in which the change occurs. We account for interest and penalties related to uncertain tax positions as part of the provision for income taxes.
(s) Loss Contingencies
We accrue estimated liabilities for loss contingencies arising from claims, assessments, litigation and other sources when it is probable that a liability has been incurred and the amount of the claim assessment or damages can be reasonably estimated. We believe that we have sufficient accruals to cover any obligations resulting from claims, assessments or litigation that have met these criteria.
(t) Advertising Costs
We charge advertising costs to expense as the costs are incurred. We incurred advertising expenses of $3.0 million, $2.7 million and $2.5 million during fiscal 2011, 2010 and 2009, respectively. We had no prepaid advertising costs included in the accompanying consolidated balance sheets.
F-21
ASPEN TECHNOLOGY, INC. AND SUBSIDIARIES
NOTES TO CONSOLIDATED FINANCIAL STATEMENTS (Continued)
(2) Significant Accounting Policies (Continued)
(u) Research and Development Expense
We charge research and development expenditures to expense as the costs are incurred. Research and development expenses include salaries, direct costs incurred and building and overhead expenses.
(v) Accounting for Restructuring Accruals
We follow ASC Topic 420, Exit or Disposal Cost Obligations. In addition, we consider the guidance where applicable in ASC Topic 712, Compensation—Nonretirement Postemployment Benefits, and ASC Topic 715, Compensation—Retirement Benefits. In accounting for these obligations, we are required to make assumptions related to the amounts of employee severance, benefits, and related costs and to the time period over which facilities will remain vacant, sublease terms, sublease rates and discount rates. Estimates and assumptions are based on the best information available at the time the obligation has arisen. The restructuring charge for restructuring programs that have future payments that extend beyond one year is recorded at the net present value of the future cash payments to be made. The discount is then accreted to restructuring expense over the term of the remaining payments. These estimates are reviewed and revised as facts and circumstances dictate; changes in these estimates could have a material effect on the amount accrued on the consolidated balance sheet.
(w) Subsequent Events
We evaluated events occurring between the end of our most recent fiscal year and the date the financial statements were issued. There were no subsequent events to be disclosed based on this evaluation.
(x) Recently Adopted Accounting Pronouncements
In July 2010, the FASB issued ASU No. 2010-20, Receivables (Topic 310): Disclosures about the Credit Quality of Financing Receivables and the Allowance for Credit Losses. ASU No. 2010-20 enhances the disclosures relating to the credit quality of financing receivables and the allowance for credit losses by requiring a greater level of disaggregated information as well as disclosure of credit quality indicators, past due information and modifications of financing receivables. The disclosures required by ASU No. 2010-20 which are as of the end of a reporting period are effective for interim and annual periods ending on or after December 15, 2010. The disclosures about activity during a period are effective for interim and annual periods beginning on or after December 15, 2010. We adopted the end of reporting period disclosure requirements of ASU No. 2010-20 on December 31, 2010. We adopted the activity disclosures during the period ended March 31, 2011. The adoption of ASU No. 2010-20 did not have a material effect on our financial position, results of operations or cash flows.
In January 2010, the FASB issued Accounting Standards Update, or ASU, No. 2010-06, Fair Value Measurements and Disclosures (Topic 820): Improving Disclosures about Fair Value Measurements. This ASU requires new disclosures including significant transfers into and out of Level 1 and Level 2 fair value measurements and a reconciliation of Level 3 fair value measurements including purchases, sales, issuances, and settlements on a gross basis. It also clarifies existing disclosures regarding the level of disaggregation, inputs and valuation techniques. We adopted ASU No. 2010-06 during the period ended March 31, 2010. This ASU did not have a material impact on our financial operations, results of operations or cash flows.
F-22
ASPEN TECHNOLOGY, INC. AND SUBSIDIARIES
NOTES TO CONSOLIDATED FINANCIAL STATEMENTS (Continued)
(2) Significant Accounting Policies (Continued)
In June 2009, the FASB issued ASU No. 2009-16, Transfers and Servicing (Topic 860): Accounting for Transfers of Financial Assets. ASU No. 2009-16 removes the concept of a qualifying special purpose entity from its scope and removes the exception from applying ASC Topic 810, Consolidation (formerly known as FASB Interpretation No. 46(R)). This ASU also clarifies the requirements for isolation and limitations on portions of financial assets that are eligible for sale accounting. ASU No. 2009-16 is effective for fiscal years beginning after November 15, 2009. We adopted ASU No. 2009-16 on July 1, 2010. The adoption of this ASU did not have a material impact on our financial operations, results of operations or cash flows.
(3) Restructuring Charges
All restructuring activities detailed below were initiated prior to fiscal 2011. The Company undertook no restructuring actions during fiscal 2011.
Restructuring charges, net totaled ($0.2) million, $1.1 million and $2.4 million during fiscal 2011, 2010 and 2009, respectively. Net restructuring credits of ($0.2) million recorded in fiscal 2011 was comprised of a credit of ($0.6) million related to changes in the estimates of future operating costs and sublease assumptions and $0.4 million of accretion charges.
Restructuring liabilities are related to the closure of facilities and contract termination costs and amount to $4.2 million at June 30, 2011. Accretion charges expected to be recorded over the remaining term of the liabilities total $0.2 million at June 30, 2011. Anticipated net cash payments to settle these liabilities amount to $4.4 million at June 30, 2011 and are expected to be made through fiscal 2017.
The following activity was recorded for the indicated years (dollars in thousands):
| |
Closure/ Consolidation of Facilities and Contract Termination Costs |
Employee Severance, Benefits, and Related Costs |
Total | ||||||||
|---|---|---|---|---|---|---|---|---|---|---|---|
Accrued expenses, June 30, 2008 |
$ | 16,354 | $ | 31 | $ | 16,385 | |||||
Restructuring charge |
— | 1,700 | 1,700 | ||||||||
Fiscal 2009 payments |
(5,009 | ) | (1,604 | ) | (6,613 | ) | |||||
Restructuring charge—accretion |
629 | — | 629 | ||||||||
Change in estimate—revised assumption |
(55 | ) | 172 | 117 | |||||||
Accrued expenses, June 30, 2009 |
11,919 | 299 | 12,218 | ||||||||
Restructuring charge |
— | — | — | ||||||||
Fiscal 2010 payments |
(4,535 | ) | (297 | ) | (4,832 | ) | |||||
Restructuring charge—accretion |
420 | — | 420 | ||||||||
Change in estimate—revised assumption |
710 | (2 | ) | 708 | |||||||
Accrued expenses, June 30, 2010 |
$ | 8,514 | $ | — | $ | 8,514 | |||||
Restructuring charge |
— | — | — | ||||||||
Fiscal 2011 payments |
(4,066 | ) | — | (4,066 | ) | ||||||
Restructuring charge—accretion |
354 | — | 354 | ||||||||
Change in estimate—revised assumption |
(601 | ) | — | (601 | ) | ||||||
Accrued expenses, June 30, 2011 |
$ | 4,201 | $ | — | $ | 4,201 | |||||
F-23
ASPEN TECHNOLOGY, INC. AND SUBSIDIARIES
NOTES TO CONSOLIDATED FINANCIAL STATEMENTS (Continued)
(3) Restructuring Charges (Continued)
(a) Restructuring charges originally arising during the three months ended March 31, 2009
During the three months ended March 31, 2009, we initiated a worldwide plan to reduce operating expenses by reorganizing business units through headcount reductions. During fiscal 2009, we recorded a restructuring charge of $1.7 million associated with headcount reductions. Approximately 70 employees, or 5% of the workforce, were terminated under the restructuring plan. The employees were primarily located in North America and Europe. All business units were affected, including services, sales and marketing, research and development, and general and administrative. We completed the restructuring plan during fiscal 2010 and made total payments of $0.3 million during the period then ended.
(b) Restructuring charges originally arising during the three months ended June 30, 2007
In May 2007, we initiated a plan to relocate our corporate headquarters from Cambridge, Massachusetts to Burlington, Massachusetts. The relocation resulted in vacating our previously leased corporate headquarters premises, subleasing the space to a third party and relocating to a new facility. The closure and relocation actions were completed in October 2007. This action resulted in aggregate restructuring charges of $6.0 million recorded during the fiscal year ended June 30, 2008. We recorded additional charges of $0.2 million, $0.3 million and $0.4 million related primarily to accretion of restructuring liabilities during fiscal years 2011, 2010 and 2009, respectively. During fiscal 2010, we revised the estimated amount of expected cash flows required to settle the restructuring liability and recorded a credit of ($0.1) million within "Restructuring charges" in the accompanying consolidated statements of operations for the period then ended.
Total payments made to settle the restructuring liability amounted to $1.3 million during fiscal 2011 and 2010, respectively. The remaining liability balance related to the restructuring action amounts to $1.6 million as of June 30, 2011 and is expected to be paid through fiscal 2013.
(c) Restructuring charges originally arising in the three months ended June 30, 2004
In June 2004, we initiated a plan to reduce our operating expenses in order to better align our operating cost structure with the economic environment and improve operating margins. The plan to reduce operating expenses resulted in the consolidation of facilities, termination of lease agreements with remaining terms ranging from several months to eight years, headcount reductions, and termination of operating contracts. In the aggregate, approximately 147 employees located in North America and Europe, or 9% of the workforce, were terminated under the restructuring plan. The restructuring plan affected all business units, including services, sales and marketing, research and development, and general and administrative.
These actions resulted in aggregate restructuring charges of $37.6 million recorded throughout fiscal year 2008, including fixed assets impairment charges of $1.0 million. We recorded additional charges of $0.1 million, $0.1 million and $0.3 million related to accretion of restructuring liabilities during fiscal years 2011, 2010 and 2009, respectively. During fiscal 2011 and 2010, we revised the estimated amount of expected cash flows required to settle the restructuring liability and recorded a credit of ($0.2) million and a charge of $0.5 million within "Restructuring charges" in the accompanying consolidated statements of operations for the period then ended. The revision of the estimated amount related primarily to the changes in the future operating cost estimates and sublease income assumptions associated with the facilities.
F-24
ASPEN TECHNOLOGY, INC. AND SUBSIDIARIES
NOTES TO CONSOLIDATED FINANCIAL STATEMENTS (Continued)
(3) Restructuring Charges (Continued)
Total payments made to settle the restructuring liability amounted to $1.1 million and $1.3 million during fiscal 2011 and 2010, respectively. The remaining liability balance related to the restructuring action amounts to $1.3 million as of June 30, 2011 and is expected to be paid through fiscal 2017.
(d) Restructuring charges originally arising in the three months ended December 31, 2002
In October 2002, management initiated a plan to reduce operating expenses in response to general economic uncertainties and first quarter revenue falling below expectations. The plan to reduce operating expenses resulted in headcount reductions, consolidation of facilities, and discontinuation of development and support for certain non-critical products. These actions resulted in aggregate restructuring charges of $28.7 million.
During the fiscal 2011, 2010 and 2009, we revised the estimated amount of expected cash flows required to settle the restructuring liability and recorded charges of $0.1 million, $0.4 million and $0.1 million within "Restructuring charges" in the accompanying consolidated statements of operations for the periods then ended. The revision of the estimated amounts related primarily to the changes in the facilities future operating costs.
Total payments made to settle the restructuring liability amounted to $1.8 million and $1.9 million during fiscal 2011 and 2010, respectively. The remaining liability balance related to the restructuring action amounts to $1.3 million as of June 30, 2011 and is expected to be paid through fiscal 2013.
(4) Secured Borrowings and Collateralized Receivables
We have transferred certain customer installment and trade receivables to financial institutions that are accounted for as secured borrowings. The transferred receivables serve as collateral under the receivable sales facilities. Under the upfront model, the carrying value of each collateralized receivable typically approximated the carrying value of the equivalent secured borrowing. However, and with increasing frequency as a result of the change to the subscription-based revenue model, when the financed future committed customer receivable has not yet been recognized as revenue, the related collateralized receivable is not recorded on our balance sheet. Under these programs, we and the financial institution must agree to enter into each transaction and negotiate the amount borrowed and interest rate secured by each receivable. The customers' payments of the underlying receivables fund the repayment of the related amounts borrowed. The weighted average interest rate on the secured borrowings was 8.7% at June 30, 2011. The collateralized receivables earn interest income, and the secured borrowings accrue borrowing costs at approximately the same interest rate.
We maintain arrangements with General Electric Capital Corporation and Silicon Valley Bank ("SVB") providing for borrowings that are secured by our installment and other receivable contracts, and for which limited recourse exists against us. We can be required to repurchase the receivables under certain circumstances in case of specific defaults by us as set forth in the program terms. Potential recourse obligations are primarily related to the SVB arrangement, which requires us to pay interest to SVB for a limited period when the underlying customer has not paid by the receivable due date. Payments related to this obligation have been less than $0.1 million for fiscal 2011, 2010 and 2009. Other than the specific items noted above, the financial institution bears the credit risk of the customers associated with the receivables the institution purchased. In the ordinary course of us acting as a servicing agent for receivables transferred to SVB, we may receive funds from customers that are processed and remitted onward to SVB. While in our possession, these cash receipts are contractually
F-25
ASPEN TECHNOLOGY, INC. AND SUBSIDIARIES
NOTES TO CONSOLIDATED FINANCIAL STATEMENTS (Continued)
(4) Secured Borrowings and Collateralized Receivables (Continued)
owned by SVB and are held by us on their behalf until remitted to the bank. We did not have any cash receipts held for the benefit of SVB in our cash balances and current liabilities as of June 30, 2011 and 2010. Any such amounts would be restricted from our use.
At June 30, 2011 and 2010, receivables totaling $25.0 million and $51.4 million, respectively, were pledged as collateral for the secured borrowings. The secured borrowings totaled $24.9 million and $76.1 million as of June 30, 2011 and 2010, respectively. The collateralized receivables are presented at their net present value. The interest rate implicit in the installment receivables was 8% as of June 30, 2011 and 2010. We recorded $3.2 million, $6.2 million and $8.7 million of interest income associated with the collateralized receivables for fiscal 2011, 2010 and 2009, respectively, and recognized $5.3 million, $8.0 million and $10.5 million of interest expense associated with the secured borrowings. Proceeds from and payments on the secured borrowings are presented as components of cash flows from financing activities in the consolidated statements of cash flows. Reductions of secured borrowings are recognized as financing cash flows upon payment to the financial institution and operating cash flows from collateralized receivables are recognized upon customer payment of amounts due.
Since December 2007, we have not sold any receivables for the purpose of raising cash, but we have sold some large dollar receivables in order to fund the repurchase of several large groups of smaller receivables previously sold to the banks, for the purpose of simplifying our administration of the programs and replacing previously financed receivables that have been superseded and repurchased. When previously financed receivables contracts are superseded with new arrangements, the secured borrowings collateralized by those receivables become immediately due and payable. As a result, they are reported in accrued expenses and other current liabilities until payment is remitted to the financial institution.
Our current liability for amounts due to financing institutions totaled $26.0 million at June 30, 2011, an increase of $21.8 million from June 30, 2010. The increase relates to the superseding of a large previously financed arrangement. The balance of the superseded receivables due to financing institutions is a current liability at June 30, 2011. In fiscal 2011, the $2.5 million of proceeds was used to replace the receivables that had been superseded in the fourth quarter of fiscal 2010, which totaled $4.2 million at June 30, 2010, as well as other agreements superseded during fiscal year 2011.
(5) Line of Credit
We previously maintained a bank credit facility, which we decided not to renew or extend when it matured on February 13, 2011. We believe our existing cash and cash equivalents and our cash flow from operating activities will be sufficient to meet our anticipated cash needs for at least the next twelve months.
F-26
ASPEN TECHNOLOGY, INC. AND SUBSIDIARIES
NOTES TO CONSOLIDATED FINANCIAL STATEMENTS (Continued)
(6) Supplemental Balance Sheet Information
Property, equipment and leasehold improvements in the accompanying consolidated balance sheets consist of the following (dollars in thousands):
| |
June 30, | ||||||
|---|---|---|---|---|---|---|---|
| |
2011 | 2010 | |||||
Property, equipment and leasehold improvements—at cost |
|||||||
Computer equipment |
$ | 9,764 | $ | 9,358 | |||
Purchased software |
18,946 | 19,194 | |||||
Furniture & fixtures |
5,751 | 5,693 | |||||
Leasehold improvements |
3,709 | 3,581 | |||||
Accumulated depreciation |
(31,440 | ) | (29,769 | ) | |||
Property, equipment and leasehold improvements—net |
$ | 6,730 | $ | 8,057 | |||
We account for asset retirement obligations in accordance with ASC Topic 410, Asset Retirement and Environmental Obligations. Our asset retirement obligations relate to leasehold improvements for leased properties. As of June 30, 2011 and 2010, the balance of our asset retirement obligations was $0.8 million and $0.7 million, respectively.
Accrued expenses in the accompanying consolidated balance sheets consist of the following (dollars in thousands):
| |
June 30, | |||||||
|---|---|---|---|---|---|---|---|---|
| |
2011 | 2010 | ||||||
Royalties and outside commissions |
$ | 3,158 | $ | 4,856 | ||||
Payroll and payroll-related |
20,510 | 21,862 | ||||||
Restructuring accruals |
3,259 | 4,266 | ||||||
Amounts due to financing institutions |
26,038 | 4,216 | ||||||
Other |
11,502 | 14,690 | ||||||
Total accrued expenses |
$ | 64,467 | $ | 49,890 | ||||
Other non-current liabilities in the accompanying consolidated balance sheets consist of the following (dollars in thousands):
| |
June 30, | |||||||
|---|---|---|---|---|---|---|---|---|
| |
2011 | 2010 | ||||||
Restructuring accruals |
$ | 942 | $ | 4,248 | ||||
Deferred rent |
2,139 | 2,193 | ||||||
Royalties and outside commissions |
603 | 3,667 | ||||||
Other* |
29,394 | 21,724 | ||||||
Total other non-current liabilities |
$ | 33,078 | $ | 31,832 | ||||
- *
- Other is comprised primarily of our reserve for uncertain tax liabilities. See Note 10, "Income Taxes" for additional information.
F-27
ASPEN TECHNOLOGY, INC. AND SUBSIDIARIES
NOTES TO CONSOLIDATED FINANCIAL STATEMENTS (Continued)
(7) Preferred Stock
Our Board of Directors is authorized, subject to any limitations prescribed by law, without further stockholder approval, to issue, from time to time, up to an aggregate of 10,000,000 shares of preferred stock in one or more series. Each such series of preferred stock shall have such number of shares, designations, preferences, voting powers, qualifications and special or relative rights or privileges, which may include, among others, dividend rights, voting rights, redemption and sinking fund provisions, liquidation preferences and conversion rights, as shall be determined by the Board of Directors in a resolution or resolutions providing for the issuance of such series. Any such series of preferred stock, if so determined by the Board of Directors, may have full voting rights with the common stock or limited voting rights and may be convertible into common stock or another security of the Company.
Series D redeemable convertible preferred stock
In August 2003, we issued and sold 300,300 shares of Series D-1 redeemable convertible preferred stock (Series D-1 Preferred), along with warrants to purchase up to 6,006,006 shares of common stock at a price of $3.33 per share, in a private placement to several investment partnerships managed by Advent International Corporation for an aggregate purchase price of $100.0 million. Concurrently, we paid cash of $30.0 million and issued 63,064 shares of Series D-2 convertible preferred stock (Series D-2 Preferred), along with warrants to purchase up to 1,261,280 shares of common stock at a price of $3.33 per share, to repurchase all of the outstanding Series B Preferred. In addition, we exchanged existing warrants to purchase 791,044 shares of common stock at an exercise price ranging from $20.64 to $23.99 held by the holders of the Series B Preferred, for new warrants to purchase 791,044 shares of common stock at an exercise price of $4.08. These transactions are referred to collectively as the Series D Preferred financing.
Each share of Series D Preferred was entitled to vote on all matters in which holders of common stock were entitled to vote, receiving a number of votes equal to the number of shares of common stock into which it was then convertible. In addition, holders of Series D-1 Preferred, as a separate class, were entitled to elect a certain number of directors, based on a formula as defined in the Series D Preferred Certificate of Designations. The holders of the Series D-1 Preferred were entitled to elect a number of our directors calculated as a ratio of the Series D-1 Preferred voting power as compared to the total voting power of our common stock. The Series D-1 Preferred holders were elected as three of the six current directors of the Company.
On May 16, 2006, the Holders of the Series D Preferred converted 30,000 shares into 3,000,000 shares of common stock. In December 2006, the holders of the Series D-1 Preferred converted their remaining 270,300 shares into 27,030,000 shares of common stock. In December 2006, we announced that we would redeem any shares of our Series D-2 Preferred that were not converted by our holders into common shares by January 30, 2007. In January 2007, the remaining 63,064 shares of Series D-2 Preferred were converted by our holder into 6,306,400 shares of common stock.
(8) Common Stock
Warrants
We have issued warrants in connection with various financing activities. These warrants provided for net equity settlement and were accounted for in equity. As of June 30, 2011 we did not have any warrants outstanding.
F-28
ASPEN TECHNOLOGY, INC. AND SUBSIDIARIES
NOTES TO CONSOLIDATED FINANCIAL STATEMENTS (Continued)
(8) Common Stock (Continued)
In connection with the August 2003 Series D Preferred financing, we issued warrants with seven-year lives to purchase 7,267,286 shares of common stock at an exercise price of $3.33 per share. In July 2006, 6,006,006 warrants were exercised in a cashless exercise, resulting in the issuance of 4,369,336 shares of our common stock. In November 2007, warrants to purchase 630,640 shares of common stock were exercised in a cashless exercise, resulting in the issuance of 500,203 shares of common stock. On August 13, 2010, the remaining warrants were exercised in a cashless exercise, resulting in the issuance of 424,753 shares of our common stock.
(9) Stock-Based Compensation
Stock Compensation Plans
In April 2010, the shareholders approved the establishment of the 2010 Equity Incentive Plan (the 2010 Plan), which provides for the reservation of 7,000,000 shares of common stock for issuance under the 2010 Plan. The 2010 Plan provides for the grant of incentive and nonqualified stock options, stock appreciation rights, restricted stock, restricted stock units, other stock-related awards, and performance awards that may be settled in cash, stock, or other property. As of June 30, 2011, there were 5,770,426 shares of common stock available for issuance subject to awards under the 2010 Plan.
In May 2005, the shareholders approved the establishment of the 2005 Stock Incentive Plan (the 2005 Plan), which provides for the reservation of up to 4,000,000 shares of common stock for issuance under the 2005 Plan. The 2005 Plan provides for the grant of incentive and nonqualified stock options and other stock-based awards, including the grant of shares based upon certain conditions, the grant of securities convertible into common stock and the grant of stock appreciation rights. Restricted stock and other stock-based awards granted under the 2005 Plan may not exceed, in the aggregate, 4,000,000 shares of common stock. As of June 30, 2011, there were 862,030 shares of common stock available for issuance subject to awards under the 2005 Plan.
General Award Terms
We issue stock options and restricted stock units to our employees and outside directors, pursuant to stockholder approved stock option plans. Option awards are generally granted with an exercise price equal to the market price of our stock at the date of grant; those options generally vest over four years and have 7 or 10-year contractual terms. Restricted stock units (RSUs) generally vest over four years. Historically, our practice has been to settle stock option exercises and restricted stock vesting through newly-issued shares.
Stock Compensation Accounting
Our stock based compensation is principally accounted for as awards of equity instruments. Our policy is to issue new shares upon the exercise of stock awards. We adopted the simplified method related to accounting for the tax effects of share-based payment awards to employees ASC Topic 718, Compensation—Stock Compensation (ASC 718). We use the "with-and-without" approach for determining if excess tax benefits are realized under ASC 718.
We utilize the Black-Scholes option valuation model for estimating the fair value of options granted. The Black-Scholes option valuation model incorporates assumptions regarding expected stock price volatility, the expected life of the option, a risk- free interest rate, dividend yield and a fair value
F-29
ASPEN TECHNOLOGY, INC. AND SUBSIDIARIES
NOTES TO CONSOLIDATED FINANCIAL STATEMENTS (Continued)
(9) Stock-Based Compensation (Continued)
of the Company common stock. The expected stock price volatility is determined based on our stock's historic prices over a period commensurate with the expected life of the option. The expected life of an option represents the period that options are expected to be outstanding for and is determined based on our historic option exercise experience. The risk- free interest rate is based on U.S. Treasury yield curve for notes with terms approximating the expected life of the options granted. The expected dividend yield is zero based on our history and expectation of not paying dividends on common shares. We recognize compensation costs on a straight-line basis over the requisite service period for time-vested awards.
We did not grant any stock options in fiscal 2009. We estimated the fair value of the awards granted in fiscal years ended June 30, 2011 and 2010 on the measurement dates using the Black- Scholes option valuation model with the following weighted average assumptions:
| |
Year Ended June 30, | |||
|---|---|---|---|---|
| |
2011 | 2010 | ||
| |
Stock Option Plans |
Stock Option Plans |
||
Weighted average fair value |
$4.99 | $3.96 | ||
Risk-free interest rate |
1.3% | 1.4% | ||
Expected dividend yield |
None | None | ||
Expected life (in years) |
4.6 | 3.4 | ||
Expected volatility factor |
53% | 57% | ||
The stock-based compensation expense and its classification (dollars in thousands) in the statement of operations for fiscal 2011, 2010 and 2009 was as follows (in thousands):
| |
Year Ended June 30, | ||||||||||
|---|---|---|---|---|---|---|---|---|---|---|---|
| |
2011 | 2010 | 2009 | ||||||||
Recorded as expense: |
|||||||||||
Cost of service and other |
$ | 945 | $ | 1,314 | $ | 429 | |||||
Selling and marketing |
3,603 | 5,742 | 928 | ||||||||
Research and development |
1,152 | 1,880 | 460 | ||||||||
General and administrative |
3,999 | 6,324 | 2,853 | ||||||||
Total stock-based compensation expense |
$ | 9,699 | $ | 15,260 | $ | 4,670 | |||||
During the period from mid-September 2007 until November 9, 2009, and from November 16, 2009 to December 21, 2009, we did not maintain our status as a timely filer with the SEC and we were unable to issue stock-based compensation to our directors and employees. On October 29, 2009 the Board of Directors approved the grant as of November 9, 2009 of 2,727,033 RSUs and 264,640 stock options under the 2005 Stock Incentive Plan and the 2001 Stock Option Plan. A portion of these awards vested upon issuance. The immediate vesting of a portion of the November 2009 grant caused the higher level of stock-based compensation expense for fiscal 2010, as compared to fiscal 2011.
The compensation committee and Board of Directors completed its annual program grant for fiscal 2012 and authorized and approved the grant of 887,857 RSUs and 744,197 stock options with a grant date of August 1, 2011.
F-30
ASPEN TECHNOLOGY, INC. AND SUBSIDIARIES
NOTES TO CONSOLIDATED FINANCIAL STATEMENTS (Continued)
(9) Stock-Based Compensation (Continued)
A summary of stock option and RSU activity under all stock option plans in fiscal 2011, 2010 and 2009 is as follows:
| |
Stock Options | Restricted Stock Units | ||||||||||||||||||
|---|---|---|---|---|---|---|---|---|---|---|---|---|---|---|---|---|---|---|---|---|
| |
Shares | Weighted Average Exercise Price |
Weighted Average Remaining Contractual Term |
Aggregate Intrinsic Value (in 000's) |
Shares | Weighted Average Grant Date Fair Value |
||||||||||||||
Outstanding at June 30, 2008 |
7,739,935 | $ | 7.62 | 321,505 | $ | 10.42 | ||||||||||||||
Granted |
— | — | — | — | ||||||||||||||||
Settled (RSUs) |
— | — | (134,477 | ) | 10.42 | |||||||||||||||
Exercised |
— | — | — | — | ||||||||||||||||
Cancelled / Forfeited |
(170,720 | ) | 7.96 | (36,415 | ) | 10.42 | ||||||||||||||
Outstanding at June 30, 2009 |
7,569,215 | 7.61 | 150,613 | 10.42 | ||||||||||||||||
Granted |
264,640 | 9.55 | 2,749,283 | 9.56 | ||||||||||||||||
Settled (RSUs) |
— | — | (1,333,370 | ) | 9.63 | |||||||||||||||
Exercised |
(1,416,794 | ) | 5.07 | — | — | |||||||||||||||
Cancelled / Forfeited |
(1,021,191 | ) | 13.90 | (54,263 | ) | 9.66 | ||||||||||||||
Outstanding at June 30, 2010 |
5,395,870 | 7.19 | 1,512,263 | 9.58 | ||||||||||||||||
Granted |
1,030,154 | 11.21 | 788,928 | 11.02 | ||||||||||||||||
Settled (RSUs) |
— | — | (853,044 | ) | 9.91 | |||||||||||||||
Exercised |
(1,506,969 | ) | 6.44 | — | — | |||||||||||||||
Cancelled / Forfeited |
(194,750 | ) | 23.15 | (109,771 | ) | 9.89 | ||||||||||||||
Outstanding at June 30, 2011 |
4,724,305 | $ | 7.64 | 4.9 | $ | 45,058 | 1,338,376 | $ | 10.19 | |||||||||||
Vested and exercisable at June 30, 2011 |
3,978,750 | $ | 6.96 | 4.2 | $ | 40,668 | — | — | ||||||||||||
Vested and expected to vest at June 30, 2011 |
4,640,250 |
$ |
7.58 |
4.9 |
$ |
44,543 |
1,200,016 |
$ |
10.19 |
|||||||||||
The weighted average grant-date fair value of RSUs granted during fiscal 2011 and 2010 was $11.02 and 9.56, respectively; there were no RSU grants in fiscal 2009. Total fair value of vested shares from RSU grants amounted to $11.7 million, $13.1 million and $1.2 million during the years ended June 30, 2011, 2010 and 2009, respectively.
As of June 30, 2011, the total future unrecognized compensation cost related to stock options and RSUs was $3.7 million and $14.0 million, respectively, and is expected to be recorded over a weighted average period of 3.2 years and 2.7 years, respectively.
The total intrinsic value of options exercised during fiscal 2011 and 2010 was $12.2 million and $8.3 million, respectively. There were no options exercised in fiscal 2009. We received $9.7 million and $7.2 million in cash proceeds from option exercises during fiscal 2011 and 2010, respectively. We paid $3.9 million, $4.0 million and $0.4 million for withholding taxes on vested RSUs during fiscal 2011, 2010 and 2009, respectively.
F-31
ASPEN TECHNOLOGY, INC. AND SUBSIDIARIES
NOTES TO CONSOLIDATED FINANCIAL STATEMENTS (Continued)
(9) Stock-Based Compensation (Continued)
At June 30, 2011, common stock reserved for future issuance or settlement under equity compensation plans was 12.7 million shares.
(10) Income Taxes
(Loss) income before provision for income taxes consists of the following (in thousands):
| |
Year Ended June 30, | |||||||||
|---|---|---|---|---|---|---|---|---|---|---|
| |
2011 | 2010 | 2009 | |||||||
Domestic |
$ | (50,395 | ) | $ | (96,937 | ) | $ | 48,095 | ||
Foreign |
6,675 | (3,971 | ) | 6,197 | ||||||
Total |
$ | (43,720 | ) | $ | (100,908 | ) | $ | 54,292 | ||
The provision/ (benefit) for income taxes shown in the accompanying consolidated statements of operations is composed of the following (in thousands):
| |
Year Ended June 30, | ||||||||||
|---|---|---|---|---|---|---|---|---|---|---|---|
| |
2011 | 2010 | 2009 | ||||||||
Federal— |
|||||||||||
Current |
$ | — | $ | 2,586 | $ | 1,616 | |||||
Deferred |
(60,004 | ) | (2,490 | ) | (1,616 | ) | |||||
State— |
|||||||||||
Current |
132 | 170 | 1,064 | ||||||||
Deferred |
(1,702 | ) | — | — | |||||||
Foreign— |
|||||||||||
Current |
5,446 | 5,907 | (71 | ) | |||||||
Deferred |
2,151 | 364 | 375 | ||||||||
|
$ | (53,977 | ) | $ | 6,537 | $ | 1,368 | ||||
F-32
ASPEN TECHNOLOGY, INC. AND SUBSIDIARIES
NOTES TO CONSOLIDATED FINANCIAL STATEMENTS (Continued)
(10) Income Taxes (Continued)
The provision for income taxes differs from that based on the federal statutory rate due to the following (in thousands):
| |
Year Ended June 30, | |||||||||
|---|---|---|---|---|---|---|---|---|---|---|
| |
2011 | 2010 | 2009 | |||||||
Federal tax at statutory rate |
$ | (15,302 | ) | $ | (35,318 | ) | $ | 19,002 | ||
State income taxes |
86 | — | 595 | |||||||
Subpart F and dividend income |
1,235 | 458 | 1,467 | |||||||
Foreign taxes and rate differences |
2,218 | 6,445 | (682 | ) | ||||||
Stock Compensation |
3,338 | 1,987 | (501 | ) | ||||||
Tax credits |
(4,524 | ) | — | (6,092 | ) | |||||
Tax contingencies |
7,158 | 170 | (2,615 | ) | ||||||
Return to provision adjustments |
1,182 | — | 1,000 | |||||||
Valuation allowance |
(48,830 | ) | 32,772 | (12,911 | ) | |||||
Other |
(538 | ) | 23 | 2,105 | ||||||
Provision for income taxes |
$ | (53,977 | ) | $ | 6,537 | $ | 1,368 | |||
The approximate tax effect of each type of temporary difference and tax carryforward is as follows (in thousands):
| |
June 30, | ||||||
|---|---|---|---|---|---|---|---|
| |
2011 | 2010 | |||||
Deferred tax assets: |
|||||||
Federal and state credits |
$ | 6,669 | $ | 4,677 | |||
Foreign tax credits |
30,356 | 21,411 | |||||
Federal and state loss carryforwards |
26,310 | 15,029 | |||||
Foreign loss carryforwards |
3,328 | 1,651 | |||||
Revenue |
2,123 | 2,892 | |||||
Restructuring accruals |
1,517 | 2,974 | |||||
Other reserves and accruals |
6,002 | 8,888 | |||||
Intangible assets |
1,398 | 2,910 | |||||
Property and leasehold improvements |
4,238 | 5,003 | |||||
Other temporary differences |
5,783 | 13,908 | |||||
|
87,724 | 79,343 | |||||
Deferred tax liabilities: |
|||||||
Revenue |
(475 | ) | (522 | ) | |||
Other reserves and accruals |
— | (141 | ) | ||||
Intangible assets |
(1,602 | ) | (1,328 | ) | |||
Property and leasehold improvements |
(345 | ) | (905 | ) | |||
Other temporary differences |
(743 | ) | (474 | ) | |||
|
(3,165 | ) | (3,370 | ) | |||
Valuation allowance |
(8,045 | ) | (64,098 | ) | |||
Net deferred tax assets (liabilities) |
$ | 76,514 | $ | 11,875 | |||
F-33
ASPEN TECHNOLOGY, INC. AND SUBSIDIARIES
NOTES TO CONSOLIDATED FINANCIAL STATEMENTS (Continued)
(10) Income Taxes (Continued)
Upon customer payment of certain foreign receivables, withholding taxes are withheld by customers and remitted to local tax authorities as required by statute. Under current U.S. tax law, these withholding taxes may be creditable against U.S. taxes payable subject to certain limitations. The withholding taxes are included in the foreign tax provision as they are withheld and remitted. Utilization of such taxes as foreign tax credits is recorded as a reduction of the domestic tax expense in the period it is more likely than not that these deferred tax assets will be realized. We do not provide deferred taxes on unremitted earnings of foreign subsidiaries since we intend to indefinitely reinvest either currently or sometime in the foreseeable future. Unrecognized provisions for taxes on undistributed earnings of foreign subsidiaries, which are considered indefinitely reinvested, are not material to our consolidated financial position or results of operations.
As of June 30, 2011, we have available U.S. federal net operating loss carryforwards of $118.6 million after the carryback discussed in the following paragraph. Of that amount, $53.9 million relate to stock-based compensation tax deductions in excess of book compensation expense (APIC NOLs) that will be credited to additional paid in capital when such deductions reduce taxes payable as determined on a "with-and-without" basis. Accordingly, these APIC NOLs will reduce federal taxes payable if realized in future periods, but NOLs related to such benefits are not included in the table above.
During fiscal 2010, we generated $106.9 million of U.S. federal net operating losses (NOLs). We elected to carryback these NOLs to fiscal 2007, 2008 and fiscal 2009, which resulted in freeing up $5.5 million of previously used foreign tax credits, $0.1 million of research and development credits, and $9.6 million of APIC NOLs. The foreign tax credits expire at various dates from 2014 through 2021.
We have foreign loss carryforwards of $10.0 million which expire beginning in 2020 and others with no expiration date. We also have state research and development credits, and alternative minimum tax (AMT) credit carryforwards. The tax credits and foreign NOL carryforwards expire at various dates from 2012 through 2031, while the AMT credit carryforwards have unlimited carryforward periods.
We have determined that we underwent an ownership change (as defined under section 382 of the Internal Revenue Code of 1986, as amended) during fiscal 2004. As such, the utilization of certain federal NOLs and tax credits are limited. Moreover, an ownership change also occurred under the laws of certain states and foreign countries in which we have generated NOLs and tax credits. Accordingly, these NOLs and tax credits will also be limited under rules similar to those of section 382. These limitations impact the amount of APIC NOLs, if any, that may be utilized in a given year. Currently, there is $36.6 million of APIC NOLs that are not subject to this limitation. The remaining $17.3 million of APIC NOLs would be limited to approximately $7.2 million per year. The federal NOLs as of June 30, 2011 begin to expire in 2021.
Based on the Company's evaluation of the realizability in future years of its deferred tax assets, a significant portion of the U.S. valuation allowance was reversed in fiscal 2011 due to the Company's projection of future taxable income. A valuation allowance has been retained in the U.S. for certain R&D credits that are anticipated to expire unused and a deferred tax asset on unrealized capital losses. A valuation allowance has also been retained on certain foreign subsidiary NOL carryfowards because it is more likely than not that a benefit will not be realized.
F-34
ASPEN TECHNOLOGY, INC. AND SUBSIDIARIES
NOTES TO CONSOLIDATED FINANCIAL STATEMENTS (Continued)
(10) Income Taxes (Continued)
For fiscal 2011, our income tax provision included amounts determined under the provisions of FIN 48, Accounting for Uncertain Tax Positions (currently included as provisions of ASC Topic 740), which was adopted as of July 1, 2007 and is intended to satisfy additional income tax assessments, including interest and penalties, that could result from any tax return positions for which the likelihood of sustaining the position on audit does not meet a threshold of "more likely than not." The tax accrual included penalties and interest, which were recorded as a component of our income tax expense. Tax liabilities under FIN 48 were recorded as a component of our income taxes payable and other non-current liabilities. The ultimate amount of taxes due will not be known until examinations are completed and settled or the audit periods are closed by statute.
A reconciliation of the reserve for uncertain tax positions is as follows (in thousands):
Balance as of June 30, 2008 |
24,831 | ||||
Gross increases—tax positions in prior period |
5,767 | ||||
Gross decreases—tax positions in prior period |
(5,107 | ) | |||
Gross increases—tax positions in current period |
698 | ||||
Gross decreases—payments |
(1,599 | ) | |||
Gross decreases—lapse of statutes |
(3,764 | ) | |||
Currency translation adjustment |
(1,588 | ) | |||
Balance as of June 30, 2009 |
19,238 | ||||
Gross increases—tax positions in prior period |
111 | ||||
Gross decreases—tax positions in prior period |
(958 | ) | |||
Gross increases—tax positions in current period |
2,114 | ||||
Gross decreases—payments |
(332 | ) | |||
Gross decreases—lapse of statutes |
(2,354 | ) | |||
Currency translation adjustment |
(89 | ) | |||
Balance as of June 30, 2010 |
$ | 17,730 | |||
Gross increases—tax positions in prior period |
4,599 | ||||
Gross decreases—tax positions in prior period |
(1,025 | ) | |||
Gross increases—tax positions in current period |
3,333 | ||||
Gross decreases—payments |
0 | ||||
Gross decreases—lapse of statutes |
(517 | ) | |||
Currency translation adjustment |
715 | ||||
Balance as of June 30, 2011 |
24,835 | ||||
Our policy is to recognize interest and penalties related to income tax matters as income tax expense and accordingly, we recorded approximately $1.2 million for interest and penalties during fiscal 2011. At June 30, 2011, we had approximately $2.0 million of accrued interest and $1.5 million of penalties related to uncertain tax positions. At June 30, 2011, the total amount of unrecognized tax benefits is $24.9 million, and of that amount, $19.3 million, if recognized, would reduce the effective tax rate. We do not anticipate the total amount of unrecognized tax benefits to change within the next twelve months.
Fiscal years 2007-2010 are open to audit in the United States and Canada.
F-35
ASPEN TECHNOLOGY, INC. AND SUBSIDIARIES
NOTES TO CONSOLIDATED FINANCIAL STATEMENTS (Continued)
(10) Income Taxes (Continued)
Subsidiaries of Aspen Technology in a number of countries outside of the U.S. and Canada are also subject to tax audits. The Company estimates that the effects of such tax audits are not material to these consolidated financial statements.
(11) Operating Leases
We lease certain facilities and various office equipment under non-cancellable operating leases with terms in excess of one year. Rent expense charged to operations, excluding sublease income, amounted to approximately $6.7 million, $6.7 million and $6.8 million for the years ended June 30, 2011, 2010 and 2009, respectively.
Future minimum lease payments under these leases and scheduled sublease payments as of June 30, 2011 are as follows (dollars in thousands):
| |
Gross Payments |
Scheduled Sublease Payments |
Net Payments |
||||||||
|---|---|---|---|---|---|---|---|---|---|---|---|
Year Ended June 30, |
|||||||||||
2012 |
$ | 11,049 | $ | 2,630 | $ | 8,419 | |||||
2013 |
6,784 | 778 | 6,006 | ||||||||
2014 |
4,209 | 159 | 4,050 | ||||||||
2015 |
3,417 | 159 | 3,258 | ||||||||
2016 |
1,869 | 159 | 1,710 | ||||||||
Thereafter |
155 | 13 | 142 | ||||||||
Total |
$ | 27,483 | $ | 3,898 | $ | 23,585 | |||||
Due to various restructuring activities (refer to Note 3) we have vacated certain of our leased space and are subleasing a portion of this space. The scheduled sublease payments are included in the table above. We have issued approximately $3.1 million of standby letters of credit in connection with certain facility leases that expire through 2016.
In May 2007, we entered into a lease agreement with respect to office space in Burlington, Massachusetts. Commencing September 1, 2007, we moved our principal corporate offices to this location and occupied 60,177 square feet of space. The initial term of the lease commenced with respect to (a) 31,174 square feet of leased premises on September 1, 2007, (b) an additional 29,003 square feet on October 1, 2007 and (c) an additional 1,309 square feet of leased space on October 26, 2007 (d) an additional 1,680 square feet on March 27, 2008 and (e) an additional 11,893 square feet on August 1, 2008. The initial term of the lease will expire seven years and four months following the term commencement date for the third phase of the leased premises. Subject to the terms and conditions of the lease, we may extend the term of the lease for two successive terms of five years each at 95% of the then market rate. Under the lease, we will pay additional rent for its proportionate share of operating expenses and taxes. Future minimum lease payments through January 2015 under this lease of $7.5 million are included in the table above.
On September 5, 2007, we entered into an additional sublease agreement related to our former office space in Cambridge, Massachusetts, effective October 1, 2007 for approximately 111,000 square feet that expires on September 30, 2012. As of June 30, 2011, we had multiple agreements that expire
F-36
ASPEN TECHNOLOGY, INC. AND SUBSIDIARIES
NOTES TO CONSOLIDATED FINANCIAL STATEMENTS (Continued)
(11) Operating Leases (Continued)
through 2012 to sublease the former office space in Cambridge. These sublease agreements represent $3.1 million of scheduled sublease payments and are included in the above table.
In addition to our Burlington location, we also lease office space in Houston, Shanghai, Reading (UK), Singapore and Tokyo to accommodate sales, services and product development functions. In the remainder of our other locations, the majority of our leases has lease terms of one year or less that are generally based on the number of workstations required.
(12) Commitments and Contingencies
(a) ATME arbitration
Prior to October 6, 2009, we had an exclusive reseller relationship covering certain countries in the Middle East with AspenTech Middle East W.L.L., a Kuwaiti corporation (now known as Advanced Technology Middle East W.L.L.) that we refer to below as ATME. Under the reseller agreement, we had the right to terminate for a material breach in the event of ATME's willful misconduct or fraud. Effective October 6, 2009, we terminated the reseller relationship for material breach by ATME based on certain actions of ATME.
On November 2, 2009, ATME commenced an action in the Queen's Bench Division (Commercial Court) of the High Court of Justice (England & Wales) captioned In The Matter Of An Intended Arbitration Between AspenTech Middle East W.L.L. and Aspen Technology, Inc., 2009 Folio 1436, seeking preliminary injunctive relief restraining us from taking any steps to impede ATME from serving as our exclusive reseller in the countries covered by the reseller agreement with ATME. We filed evidence in opposition to that request for relief on November 12, 2009. At a hearing on November 13, 2009, the court dismissed ATME's application for preliminary injunctive relief. The court sealed an Order to this effect on November 23, 2009, and further ordered that ATME pay our costs of claim.
Relatedly, on November 11, 2009, we filed a request for arbitration against ATME in the International Court of Arbitration of the International Chamber of Commerce, captioned Aspen Technology, Inc. v. AspenTech Middle East W.L.L., Case No. 16732/VRO. Our request for arbitration asserted claims against ATME seeking a declaration that ATME committed a material breach of our agreement and that our termination of our agreement was lawful, and seeking damages for ATME's willful misconduct in connection with the reseller relationship. On November 18, 2009, ATME filed its answer to that request for arbitration and asserted counterclaims against us seeking a declaratory judgment that we unlawfully terminated our agreement with ATME and seeking damages for breach of contract by reason of our purported unlawful termination of our agreement. Our reply to those counterclaims was filed on December 18, 2009. Pursuant to a procedural order issued by the arbitral tribunal, a hearing was conducted between January 24, 2011 and February 2, 2011, and a supplemental hearing took place in June 2011.
We expect a determination to be made in the first half of fiscal 2012 with respect to the pending arbitration. However, we can provide no assurance as to the actual timing or outcome of the arbitration. In general, there is no provision for either party to appeal the determination reached. The reseller agreement with ATME contained a provision whereby we could be liable for a termination fee if the agreement were terminated other than for material breach. This fee is to be calculated based on a formula contained in the reseller agreement that we believe was originally developed based on certain assumptions about the future financial performance of ATME, as well as ATME's actual financial
F-37
ASPEN TECHNOLOGY, INC. AND SUBSIDIARIES
NOTES TO CONSOLIDATED FINANCIAL STATEMENTS (Continued)
(12) Commitments and Contingencies (Continued)
performance. Based on the formula and the financial information provided to us by ATME, which we have not verified independently, a calculation based on the formula would result in a termination fee of between $60 million and $77 million. Under the terminated reseller agreement, no termination fee is owed on termination for material breach. If we are found to have breached the terms of our agreement with ATME, we could be liable for damages including the termination fee, the amount of which may be greater or less than the number indicated above. We intend to continue to pursue our claims against ATME, and to defend the counterclaim by ATME, vigorously.
On March 11, 2010, a Kuwaiti entity (known as ATME Group and affiliated with ATME) filed a lawsuit in a Kuwaiti court naming as defendants ATME, us and a reseller newly appointed by us in Kuwait. In this lawsuit, ATME Group claims that it was an exclusive reseller for ATME in Kuwait and, as such, is entitled to damages resulting from purported customer contracts in Kuwait. We intend to defend this action vigorously.
(b) Class action and opt-out claims
In March 2006, we settled class action litigation, including related derivative claims, arising out of our originally filed consolidated financial statements for fiscal 2000 through 2004, the accounting for which we restated in March 2005. Certain members of the class (representing 1,457,969 shares of common stock (or less than 1% of the shares putatively purchased during the class action period)) opted out of the settlement and had the right to bring their own state or federal law claims against us, referred to as "opt-out" claims. Opt-out claims were filed on behalf of the holders of approximately 1.1 million of such shares. All but one of these actions were settled and/or dismissed. The remaining action is discussed below.
380544 Canada, Inc., et al. v. Aspen Technology, Inc., was filed on February 15, 2007 in the federal district court for the Southern District of New York and docketed as Civ. A. No. 1:07-cv-01204-JFK in that court. The claims in this action include claims against us and one or more of our former officers alleging securities and common law fraud, breach of contract, deceptive practices and/or rescissory damages liability, based on the restated results of one or more fiscal periods included in our restated consolidated financial statements referenced in the class action. This action was brought by persons who purchased 566,665 shares of our common stock in a private placement. Certain motions to dismiss filed by other defendants were resolved on May 5, 2009. The claims in the 380544 Canada action are for damages totaling at least $4.0 million, not including claims for attorneys' fees. We plan to defend the 380544 Canada action vigorously.
(c) Other
In the ordinary course of business, we also from time to time pursue lawsuits and claims to enforce our intellectual property rights and to address other intellectual property, commercial and miscellaneous matters. These matters include claims we asserted against M3 Technology, Inc. in July 2010 for misappropriation of our trade secrets and infringement of our copyrights, in an action that we commenced in the U.S. District Court for the Southern District of Texas captioned Aspen Technology, Inc. v. Tekin A. Kunt and M3 Technology, Inc. which is docketed as Civ. A. No. 4:10-cv-1127 in that court.
In addition, we are also from time to time involved in other lawsuits, claims, investigations, proceedings and threats of litigation. These include an April 2004 claim by a customer for
F-38
ASPEN TECHNOLOGY, INC. AND SUBSIDIARIES
NOTES TO CONSOLIDATED FINANCIAL STATEMENTS (Continued)
(12) Commitments and Contingencies (Continued)
approximately $5.0 million that certain of our software products and implementation services failed to meet the customer's expectations.
The results of litigation and claims cannot be predicted with certainty, and unfavorable resolutions are possible and could materially affect our results of operations, cash flows or financial position. In addition, regardless of the outcome, litigation could have an adverse impact on us because of litigation fees and costs, diversion of management resources and other factors.
While the outcome of the proceedings and claims identified above cannot be predicted with certainty, there are no other such matters, as of June 30, 2011, that, in the opinion of management, might have a material adverse effect on our financial position, results of operations or cash flows.
(13) Retirement and Profit Sharing Plans
We maintain a defined contribution retirement plan under Section 401(k) of the IRC covering all eligible employees, as defined. Under the plan, a participant may elect to defer receipt of a stated percentage of his or her compensation, subject to limitation under the IRC, which would otherwise be payable to the participant for any plan year. We may make discretionary contributions to this plan, including making matching contributions of 50%, up to a maximum of 6% of an employee's pretax contribution. In fiscal 2011, 2010 and 2009, we made matching contributions of approximately $1.8 million, $1.8 million and $1.3 million, respectively. Additionally, we participate in certain government mandated and defined contribution plans throughout the world for which we comply with all funding requirements.
(14) Other Investments
In November 2000, we invested $0.6 million in a global chemical business-to-business e-commerce company supporting major chemical companies in Asia. We recorded a non-operating loss for the full value of this investment in the third quarter of fiscal 2011 due to the determination of an other-than-temporary impairment of its fair value.
(15) Segment and Geographic Information
Operating segments are defined as components of an enterprise about which separate financial information is available that is evaluated regularly by the chief operating decision maker, or decision making group, in deciding how to allocate resources and in assessing performance. Our chief operating decision maker is our President and Chief Executive Officer.
We have three operating segments: license, professional services, and maintenance and training. The chief operating decision maker assesses financial performance and allocates resources based upon the three lines of business.
The license line of business is engaged in the development and licensing of software. The professional services line of business offers implementation, advanced process control, real-time optimization and other professional services in order to provide its customers with complete solutions. The maintenance and training line of business provides customers with a wide range of support services that include on-site support, telephone support, software updates and various forms of training on how to use our products.
F-39
ASPEN TECHNOLOGY, INC. AND SUBSIDIARIES
NOTES TO CONSOLIDATED FINANCIAL STATEMENTS (Continued)
(15) Segment and Geographic Information (Continued)
The accounting policies of the operating segments are the same as those described in the summary of significant accounting policies. We do not track assets or capital expenditures by operating segments. Consequently, it is not practical to show assets, capital expenditures, depreciation or amortization by operating segments.
The following table presents a summary of operating segments (dollars in thousands):
| |
License | Training, and Other |
Maintenance, Professional Services |
Total | ||||||||||
|---|---|---|---|---|---|---|---|---|---|---|---|---|---|---|
Year Ended June 30, 2011— |
||||||||||||||
Segment revenues |
$ | 103,699 | $ | 65,121 | $ | 29,334 | $ | 198,154 | ||||||
Segment expenses |
66,821 | 13,495 | 25,404 | 105,720 | ||||||||||
Segment operating profit(1) |
$ | 36,878 | $ | 51,626 | $ | 3,930 | $ | 92,434 | ||||||
Year Ended June 30, 2010— |
||||||||||||||
Segment revenues |
$ | 53,991 | $ | 74,862 | $ | 37,491 | $ | 166,344 | ||||||
Segment expenses |
70,822 | 15,076 | 36,081 | 121,979 | ||||||||||
Segment operating profit(1) |
$ | (16,831 | ) | $ | 59,786 | $ | 1,410 | $ | 44,365 | |||||
Year Ended June 30, 2009— |
||||||||||||||
Segment revenues |
$ | 179,591 | $ | 83,637 | $ | 48,352 | $ | 311,580 | ||||||
Segment expenses |
62,794 | 14,887 | 39,930 | 117,611 | ||||||||||
Segment operating profit(1) |
$ | 116,797 | $ | 68,750 | $ | 8,422 | $ | 193,969 | ||||||
- (1)
- The Segment operating profits reported reflect only the direct expenses of the operating segment and do not contain an allocation for selling and marketing, general and administrative, development, restructuring and other corporate expenses incurred in support of the segments.
F-40
ASPEN TECHNOLOGY, INC. AND SUBSIDIARIES
NOTES TO CONSOLIDATED FINANCIAL STATEMENTS (Continued)
(15) Segment and Geographic Information (Continued)
Reconciliation to (Loss) Income Before Provision for Taxes
The following table presents a reconciliation of total segment operating profit to income before provision for income taxes (dollars in thousands):
| |
Year Ended June 30, | ||||||||||
|---|---|---|---|---|---|---|---|---|---|---|---|
| |
2011 | 2010 | 2009 | ||||||||
Total segment operating profit for reportable segments |
$ | 92,434 | $ | 44,365 | $ | 193,969 | |||||
Cost of license and amortization for technology related costs |
(5,213 | ) | (6,437 | ) | (12,409 | ) | |||||
Marketing |
(12,690 | ) | (12,897 | ) | (12,662 | ) | |||||
Research and development |
(41,932 | ) | (39,124 | ) | (37,625 | ) | |||||
General and administrative and overhead |
(77,723 | ) | (78,889 | ) | (79,600 | ) | |||||
Stock-based compensation |
(9,699 | ) | (15,260 | ) | (4,670 | ) | |||||
Restructuring charges |
247 | (1,128 | ) | (2,446 | ) | ||||||
Impairment of goodwill and intangible assets |
— | — | (623 | ) | |||||||
Other income (expense) |
2,919 | (2,407 | ) | (1,824 | ) | ||||||
Interest income, net |
7,937 | 10,869 | 12,182 | ||||||||
(Loss) income before provision for income taxes |
$ | (43,720 | ) | $ | (100,908 | ) | $ | 54,292 | |||
Geographic Information:
Revenue to external customers is attributed to individual countries based on the location the product or services are sold. Domestic and international sales as a percentage of total revenue are as follows:
| |
Year Ended June 30, | |||||||||
|---|---|---|---|---|---|---|---|---|---|---|
| |
2011 | 2010 | 2009 | |||||||
United States |
35.8 | % | 38.2 | % | 31.3 | % | ||||
Europe |
26.6 | 26.6 | 26.8 | |||||||
Other(1) |
37.6 | 35.2 | 41.9 | |||||||
|
100.0 | % | 100.0 | % | 100.0 | % | ||||
- (1)
- Other consists primarily of APAC, Canada, Latin America and the Middle East.
During fiscal 2011, 2010 and 2009 there were no customers that individually represented greater than 10% of our total revenue.
We have long-lived assets of approximately $5.7 million that are located domestically and $1.0 million that reside in other geographic locations as of June 30, 2011.
F-41
ASPEN TECHNOLOGY, INC. AND SUBSIDIARIES
NOTES TO CONSOLIDATED FINANCIAL STATEMENTS (Continued)
(16) Quarterly Financial Data (Unaudited)
The following tables present quarterly consolidated statement of operations data for fiscal 2011 and 2010. The below data is unaudited but, in our opinion, reflects all adjustments necessary for a fair presentation of this data in accordance with GAAP (dollars in thousands, except per share data).
| |
Three Months Ended | |||||||||||||
|---|---|---|---|---|---|---|---|---|---|---|---|---|---|---|
| |
June 30, 2011 |
March 31, 2011 |
December 31, 2010 |
September 30, 2010 |
||||||||||
Net revenue |
$ | 52,645 | $ | 52,601 | $ | 49,808 | $ | 43,100 | ||||||
Gross profit |
37,495 | 42,209 | 36,253 | 29,852 | ||||||||||
(Loss) income from operations |
(18,324 | ) | (7,244 | ) | (9,300 | ) | (19,708 | ) | ||||||
Income (loss) applicable to common stockholders |
41,681 | (5,687 | ) | (10,269 | ) | (15,468 | ) | |||||||
Earnings (loss) per common share: |
||||||||||||||
Basic |
$ | 0.44 | $ | (0.06 | ) | $ | (0.11 | ) | $ | (0.17 | ) | |||
Diluted |
$ | 0.43 | $ | (0.06 | ) | $ | (0.11 | ) | $ | (0.17 | ) | |||
Weighted average shares outstanding: |
||||||||||||||
Basic |
94,169 | 93,862 | 93,252 | 92,689 | ||||||||||
Diluted |
96,568 | 93,862 | 93,252 | 92,689 | ||||||||||
| |
Three Months Ended | |||||||||||||
|---|---|---|---|---|---|---|---|---|---|---|---|---|---|---|
| |
June 30, 2010 |
March 31, 2010 |
December 31, 2009(1) |
September 30, 2009(1) |
||||||||||
Net revenue |
$ | 38,244 | $ | 45,618 | $ | 42,686 | $ | 39,796 | ||||||
Gross profit |
20,746 | 30,944 | 26,217 | 22,327 | ||||||||||
(Loss) income from operations |
(35,604 | ) | (19,647 | ) | (29,315 | ) | (24,804 | ) | ||||||
(Loss) income applicable to common stockholders |
(33,972 | ) | (21,754 | ) | (30,657 | ) | (21,062 | ) | ||||||
(Loss) earnings per common share: |
||||||||||||||
Basic |
$ | (0.37 | ) | $ | (0.24 | ) | $ | (0.34 | ) | $ | (0.23 | ) | ||
Diluted |
$ | (0.37 | ) | $ | (0.24 | ) | $ | (0.34 | ) | $ | (0.23 | ) | ||
Weighted average shares outstanding: |
||||||||||||||
Basic |
92,222 | 91,835 | 91,002 | 90,107 | ||||||||||
Diluted |
92,222 | 91,835 | 91,002 | 90,107 | ||||||||||
F-42
| |
|
|
Incorporated by Reference | |||||||
|---|---|---|---|---|---|---|---|---|---|---|
| Exhibit Number |
Description | Filed with this Form 10-K |
Form | Filing Date with SEC(1) |
Exhibit Number |
|||||
| 3.1 | Certificate of Incorporation of Aspen Technology, Inc., as amended | 8-K | August 22, 2003 | 4 | ||||||
3.2 |
By-laws of Aspen Technology, Inc. |
8-K |
March 27, 1998 |
3.2 |
||||||
4.1 |
Specimen certificate for common stock, $.10 par value, of Aspen Technology, Inc. |
8-A/A |
June 12, 1998 |
4 |
||||||
4.2 |
Rights Agreement dated March 12, 1998 between Aspen Technology, Inc. and American Stock Transfer and Trust Company, as Rights Agent, including form of Certificate of Designation of Series A Participating Cumulative Preferred Stock and form of Rights Certificate |
8-K |
March 27, 1998 |
4.1 |
||||||
4.2a |
Amendment No. 1 dated October 26, 2001 to Rights Agreement dated march 12, 1998 between Aspen Technology, Inc. and American Stock Transfer and Trust Company, as Rights Agent |
8-A/A |
November 8, 2001 |
4.4 |
||||||
4.3 |
Form of WD Common Stock Purchase Warrants of Aspen Technology, Inc. dated August 14, 2003 |
8-K |
August 22, 2003 |
99.3 |
||||||
10.1 |
Lease Agreement dated January 30, 1992 between Aspen Technology, Inc. and Teachers Insurance and Annuity Association of America regarding 10 Canal Park, Cambridge, Massachusetts |
10-K |
April 11, 2008 |
10.1 |
||||||
10.1a |
First Amendment to Lease Agreement dated May 5, 1997 between Aspen Technology, Inc. and Beacon Properties, L.P., successor-in-interest to Teachers Insurance and Annuity Association of America |
10-K |
September 28, 2000 |
10.2 |
||||||
10.1b |
Second Amendment to Lease Agreement dated August 14, 2000 between Aspen Technology, Inc. and EOP-Ten Canal Park, L.L.C., successor-in-interest to Beacon Properties, L.P. |
10-K |
September 28, 2000 |
10.3 |
||||||
10.1c |
Amendment dated September 5, 2007 to Lease Agreement dated January 30, 1992 between Aspen Technology, Inc. and MA-Ten Canal Park, L.L.C. |
10-K |
April 11, 2008 |
10.1c |
||||||
10.2 |
Sublease dated September 5, 2007 between Aspen Technology, Inc. and MA-Ten Canal Park L.L.C. regarding 10 Canal Park, Cambridge, Massachusetts |
10-K |
April 11, 2008 |
10.2 |
||||||
10.3 |
Lease dated May 7, 2007 between Aspen Technology, Inc. and One Wheeler Road Associates regarding 200 Wheeler Road, Burlington Massachusetts |
10-K |
April 11, 2008 |
10.3 |
||||||
10.4 |
System License Agreement dated March 30, 1982 between Aspen Technology, Inc. and the Massachusetts Institute of Technology |
10-K |
April 11, 2008 |
10.4 |
||||||
| |
|
|
Incorporated by Reference | |||||||
|---|---|---|---|---|---|---|---|---|---|---|
| Exhibit Number |
Description | Filed with this Form 10-K |
Form | Filing Date with SEC(1) |
Exhibit Number |
|||||
| 10.5 | Amendment dated March 30, 1982 to System License Agreement dated March 30, 1982 between Aspen Technology, Inc. and the Massachusetts Institute of Technology | 10-K | April 11, 2008 | 10.5 | ||||||
10.6† |
Purchase and Sale Agreement dated October 6, 2004 among Aspen Technology, Inc., Hyprotech Company, AspenTech Canada Ltd. and Hyprotech UK Ltd. and Honeywell International Inc., Honeywell Control Systems Limited and Honeywell Limited—Honeywell Limitee |
10-Q |
March 15, 2005 |
10.1 |
||||||
10.6a† |
Amendment No. 1 dated December 23, 2004 to Purchase and Sale Agreement dated October 6, 2004 among Aspen Technology, Inc., Hyprotech Company, AspenTech Canada Ltd., and Hyprotech UK Ltd. and Honeywell International Inc., Honeywell Control Systems Limited and Honeywell Limited—Honeywell Limitee |
10-Q |
March 15, 2005 |
10.2 |
||||||
10.7† |
Hyprotech License Agreement dated December 23, 2004 between Aspen Technology, Inc. and Honeywell International, Inc. |
10-Q |
March 15, 2005 |
10.3 |
||||||
10.8† |
Hyprotech License Agreement dated December 23, 2004 between AspenTech Canada Ltd. and Honeywell Limited—Honeywell Limitee |
10-Q |
March 15, 2005 |
10.4 |
||||||
10.9† |
Hyprotech License Agreement dated December 23, 2004 between Hyprotech Company and Honeywell Limited—Honeywell Limitee |
10-Q |
March 15, 2005 |
10.5 |
||||||
10.10† |
Hyprotech License Agreement dated December 23, 2004 between AspenTech Ltd. and Honeywell Control Systems Limited |
10-Q |
March 15, 2005 |
10.6 |
||||||
10.11† |
Hyprotech License Agreement dated December 23, 2004 between Hyprotech UK Ltd. and Honeywell Control Systems Limited |
10-Q |
March 15, 2005 |
10.7 |
||||||
10.12 |
Vendor Program Agreement dated March 29, 1990 between Aspen Technology, Inc. and General Electric Capital Corporation |
10-K |
April 11, 2008 |
10.13 |
||||||
10.12a |
Rider No. 1 dated December 14, 1994, to Vendor Program Agreement dated March 29, 1990 between Aspen Technology, Inc. and General Electric Capital Corporation |
10-K |
April 11, 2008 |
10.13a |
||||||
10.12b |
Rider No. 2 dated September 4, 2001 to Vendor Program Agreement dated March 29, 1990 between Aspen Technology, Inc. and General Electric Capital Corporation |
10-K |
April 11, 2008 |
10.13b |
||||||
10.12c |
Waiver and Consent Agreement dated March 31, 2009 |
10-K |
June 30, 2009 |
10.13c |
||||||
| |
|
|
Incorporated by Reference | |||||||
|---|---|---|---|---|---|---|---|---|---|---|
| Exhibit Number |
Description | Filed with this Form 10-K |
Form | Filing Date with SEC(1) |
Exhibit Number |
|||||
| 10.13 | Non-Recourse Receivables Purchase Agreement dated December 31, 2003 between Silicon Valley Bank and Aspen Technology, Inc. | 10-Q | February 17, 2004 | 10.1 | ||||||
10.13a |
First Amendment dated June 30, 2004 to Non-Recourse Receivables Purchase Agreement dated December 31, 2003 between Silicon Valley Bank and Aspen Technology, Inc. |
10-K |
April 11, 2008 |
10.15a |
||||||
10.13b |
Second Amendment dated September 30, 2004 to Non-Recourse Receivables Purchase Agreement dated December 31, 2003 between Silicon Valley Bank and Aspen Technology, Inc. |
10-Q |
March 15, 2005 |
10.1 |
||||||
10.13c |
Third Amendment dated December 31, 2004 to Non-Recourse Receivables Purchase Agreement dated December 31, 2003 between Silicon Valley Bank and Aspen Technology, Inc. |
10-Q |
March 15, 2005 |
10.8 |
||||||
10.13d |
Fourth Amendment dated March 8, 2005 to Non-Recourse Receivables Purchase Agreement dated December 31, 2003 between Silicon Valley Bank and Aspen Technology, Inc. |
10-K |
April 11, 2008 |
10.15d |
||||||
10.13e |
Fifth Amendment dated March 31, 2005 to Non-Recourse Receivables Purchase Agreement dated December 31, 2003 between Silicon Valley Bank and Aspen Technology, Inc. |
10-Q |
May 10, 2005 |
10.1 |
||||||
10.13f |
Sixth Amendment dated December 29, 2005 to Non-Recourse Receivables Purchase Agreement dated December 31, 2003 between Silicon Valley Bank and Aspen Technology, Inc. |
10-K |
April 11, 2008 |
10.15f |
||||||
10.13g |
Seventh Amendment dated July 17, 2006 to Non-Recourse Receivables Purchase Agreement dated December 31, 2003 between Silicon Valley Bank and Aspen Technology, Inc. |
10-K |
April 11, 2008 |
10.15g |
||||||
10.13h |
Eighth Amendment dated September 15, 2006 to Non-Recourse Receivables Purchase Agreement dated December 31, 2003 between Silicon Valley Bank and Aspen Technology, Inc. |
10-K |
April 11, 2008 |
10.15h |
||||||
10.13i |
Ninth Amendment dated January 12, 2007 to Non-Recourse Receivables Purchase Agreement dated December 31, 2003 between Silicon Valley Bank and Aspen Technology, Inc. |
10-Q |
May 10, 2007 |
10.3 |
||||||
10.13j |
Tenth Amendment dated April 13, 2007 to Non-Recourse Receivables Purchase Agreement dated December 31, 2003 between Silicon Valley Bank and Aspen Technology, Inc. |
10-K |
April 11, 2008 |
10.15j |
||||||
10.13k |
Eleventh Amendment dated June 28, 2007 to Non-Recourse Receivables Purchase Agreement dated December 31, 2003 between Silicon Valley Bank and Aspen Technology, Inc. |
10-K |
April 11, 2008 |
10.15k |
||||||
| |
|
|
Incorporated by Reference | |||||||
|---|---|---|---|---|---|---|---|---|---|---|
| Exhibit Number |
Description | Filed with this Form 10-K |
Form | Filing Date with SEC(1) |
Exhibit Number |
|||||
| 10.13l | Twelfth Amendment dated October 16, 2007 to Non-Recourse Receivables Purchase Agreement dated December 31, 2003 between Silicon Valley Bank and Aspen Technology, Inc. | 10-K | April 11, 2008 | 10.15l | ||||||
10.13m |
Thirteenth Amendment dated December 12, 2007 to Non-Recourse Receivables Purchase Agreement dated December 31, 2003 between Silicon Valley Bank and Aspen Technology, Inc. |
10-K |
April 11, 2008 |
10.15m |
||||||
10.13n |
Fourteenth Amendment dated December 28, 2007 to Non-Recourse Receivables Purchase Agreement dated December 31, 2003 between Silicon Valley Bank and Aspen Technology, Inc. |
8-K |
January 7, 2008 |
10.2 |
||||||
10.13o |
Fifteenth Amendment dated January 24, 2008 to Non-Recourse Receivables Purchase Agreement dated December 31, 2003 between Silicon Valley Bank and Aspen Technology, Inc. |
10-Q |
February 19, 2009 |
10.2 |
||||||
10.13p |
Sixteenth Amendment dated May 15, 2008 to Non-Recourse Receivables Purchase Agreement dated December 31, 2003 between Silicon Valley Bank and Aspen Technology, Inc. |
10-Q |
February 19, 2009 |
10.3 |
||||||
10.13q |
Seventeenth Amendment dated November 14, 2008 to Non-Recourse Receivables Purchase Agreement dated December 31, 2003 between Silicon Valley Bank and Aspen Technology, Inc. |
10-Q |
February 19, 2009 |
10.4 |
||||||
10.13r |
Eighteenth Amendment dated January 30, 2009 to Non-Recourse Receivables Purchase Agreement dated December 31, 2003 between Silicon Valley Bank and Aspen Technology, Inc. |
10-Q |
February 19, 2009 |
10.5 |
||||||
10.13s |
Nineteenth Amendment dated May 15, 2009 to Non-Recourse Receivables Purchase Agreement dated December 31, 2003 between Silicon Valley Bank and Aspen Technology, Inc. |
10-K |
June 30, 2009 |
10.15s |
||||||
10.13t |
Twentieth Amendment dated November 3, 2009 to Non-Recourse Receivables Purchase Agreement dated December 31, 2003 between Silicon Valley Bank and Aspen Technology, Inc. |
10-K |
November 9, 2009 |
10.15t |
||||||
10.13u |
Twenty-first Amendment dated June 7, 2010 to Non-Recourse Receivables Purchase Agreement dated December 31, 2003 between Silicon Valley Bank and Aspen Technology, Inc. |
10-Q |
February 8, 2011 |
10.1 |
||||||
10.13v |
Twenty-second Amendment dated December 7, 2010 to Non-Recourse Receivables Purchase Agreement dated December 31, 2003 between Silicon Valley Bank and Aspen Technology, Inc. |
10-Q |
February 8, 2011 |
10.2 |
||||||
10.14 |
Loan Agreement dated June 15, 2005 among Aspen Technology, Inc., Aspen Technology Receivables II LLC, Guggenheim Corporate Funding, LLC and the lenders named therein. |
8-K |
June 20, 2005 |
10.1 |
||||||
| |
|
|
Incorporated by Reference | |||||||
|---|---|---|---|---|---|---|---|---|---|---|
| Exhibit Number |
Description | Filed with this Form 10-K |
Form | Filing Date with SEC(1) |
Exhibit Number |
|||||
| 10.15 | Security Agreement dated June 15, 2005 between Aspen Technology Receivables II LLC and Guggenheim Corporate Funding, LLC |
8-K | June 20, 2005 | 10.2 | ||||||
10.16 |
Release Letter dated December 28, 2007 relating to Loan Agreement dated June 15, 2005 among Aspen Technology, Inc., Aspen Technology Receivables II LLC, Guggenheim Corporate Funding, LLC and the Lenders named therein |
8-K |
January 7, 2008 |
10.1 |
||||||
10.17 |
Purchase and Sale Agreement dated June 15, 2005 between Aspen Technology, Inc. and Aspen Technology Receivables I LLC |
8-K |
June 20, 2005 |
10.3 |
||||||
10.18 |
Purchase and Resale Agreement dated June 15, 2005 between Aspen Technology Receivables I LLC and Aspen Technology Receivables II LLC |
8-K |
June 20, 2005 |
10.4 |
||||||
10.19 |
Loan and Security Agreement dated January 30, 2003 among Silicon Valley Bank and Aspen Technology, Inc., AspenTech, Inc. and Hyprotech Company |
10-Q |
February 14, 2003 |
10.1 |
||||||
10.20a |
Letter Agreement dated February 14, 2003 amending Loan and Security Agreement dated January 30, 2003 among Silicon Valley Bank and Aspen Technology, Inc., AspenTech, Inc. and Hyprotech Company |
10-K |
April 11, 2008 |
10.22a |
||||||
10.20b |
First Loan Modification Agreement dated June 27, 2003 to Loan and Security Agreement dated January 30, 2003 among Silicon Valley Bank and Aspen Technology, Inc., AspenTech, Inc. and Hyprotech Company |
10-K |
September 29, 2003 |
10.22 |
||||||
10.20c |
Second Loan Modification Agreement dated September 10, 2004 to Loan and Security Agreement dated January 30, 2003 among Silicon Valley Bank and Aspen Technology, Inc., AspenTech, Inc. and Hyprotech Company |
10-K |
September 13, 2004 |
10.70 |
||||||
10.20d |
Third Loan Modification Agreement dated January 28, 2005 to Loan and Security Agreement dated January 30, 2003 among Silicon Valley Bank and Aspen Technology, Inc., AspenTech, Inc. and Hyprotech Company |
10-K |
April 11, 2008 |
10.22d |
||||||
10.20e† |
Fourth Loan Modification Agreement dated April 1, 2005 to Loan and Security Agreement dated January 30, 2003 among Silicon Valley Bank and Aspen Technology, Inc., AspenTech, Inc. and Hyprotech Company |
10-Q |
May 10, 2005 |
10.2 |
||||||
| |
|
|
Incorporated by Reference | |||||||
|---|---|---|---|---|---|---|---|---|---|---|
| Exhibit Number |
Description | Filed with this Form 10-K |
Form | Filing Date with SEC(1) |
Exhibit Number |
|||||
| 10.20f | Fifth Loan Modification Agreement dated May 6, 2005 to Loan and Security Agreement dated January 30, 2003 among Silicon Valley Bank and Aspen Technology, Inc., AspenTech, Inc. and Hyprotech Company | 10-K | April 11, 2008 | 10.22f | ||||||
10.20g |
Sixth Loan Modification Agreement dated June 15, 2005 to Loan and Security Agreement dated January 30, 2003 among Silicon Valley Bank and Aspen Technology, Inc., AspenTech, Inc. and Hyprotech Company |
8-K |
June 20, 2005 |
10.5 |
||||||
10.20h |
Seventh Loan Modification Agreement dated September 13, 2005 to Loan and Security Agreement dated January 30, 2003 among Silicon Valley Bank and Aspen Technology, Inc., AspenTech, Inc. and Hyprotech Company |
10-K |
September 13, 2005 |
10.79 |
||||||
10.20i |
Eighth Amendment to Loan and Security Agreement dated December 30, 2005 to Loan and Security Agreement dated January 30, 2003 among Silicon Valley Bank and Aspen Technology, Inc., AspenTech, Inc. and Hyprotech Company |
10-K |
April 11, 2008 |
10.22i |
||||||
10.20j |
Ninth Loan Modification Agreement dated July 17, 2006 to Loan and Security Agreement dated January 30, 2003 among Silicon Valley Bank and Aspen Technology, Inc., AspenTech, Inc. and Hyprotech Company |
10-K |
April 11, 2008 |
10.22j |
||||||
10.20k |
Tenth Loan Modification Agreement dated September 15, 2006 to Loan and Security Agreement dated January 30, 2003 among Silicon Valley Bank and Aspen Technology, Inc., AspenTech, Inc. and Hyprotech Company |
10-K |
September 28, 2006 |
10.84 |
||||||
10.20l |
Eleventh Loan Modification Agreement dated September 27, 2006 to Loan and Security Agreement dated January 30, 2003 among Silicon Valley Bank and Aspen Technology, Inc., AspenTech, Inc. and Hyprotech Company |
10-Q |
November 14, 2006 |
10.3 |
||||||
10.20m |
Twelfth Loan Modification Agreement dated January 12, 2007 to Loan and Security Agreement dated January 30, 2003 among Silicon Valley Bank and Aspen Technology, Inc., AspenTech, Inc. and Hyprotech Company |
10-Q |
May 10, 2007 |
10.1 |
||||||
10.20n |
Thirteenth Loan Modification Agreement dated April 13, 2007 to Loan and Security Agreement dated January 30, 2003 among Silicon Valley Bank and Aspen Technology, Inc., AspenTech, Inc. and Hyprotech Company |
10-K |
April 11, 2008 |
10.22n |
||||||
| |
|
|
Incorporated by Reference | |||||||
|---|---|---|---|---|---|---|---|---|---|---|
| Exhibit Number |
Description | Filed with this Form 10-K |
Form | Filing Date with SEC(1) |
Exhibit Number |
|||||
| 10.20o | Fourteenth Loan Modification Agreement dated June 28, 2007 to Loan and Security Agreement dated January 30, 2003 among Silicon Valley Bank and Aspen Technology, Inc., AspenTech, Inc. and Hyprotech Company | 10-K | April 11, 2008 | 10.22o | ||||||
10.20p |
Fifteenth Loan Modification Agreement dated August 30, 2007 to Loan and Security Agreement dated January 30, 2003 among Silicon Valley Bank and Aspen Technology, Inc., AspenTech, Inc. and Hyprotech Company |
10-K |
April 11, 2008 |
10.22p |
||||||
10.20q |
Sixteenth Loan Modification Agreement dated October 16, 2007 to Loan and Security Agreement dated January 30, 2003 among Silicon Valley Bank and Aspen Technology, Inc., AspenTech, Inc. and Hyprotech Company |
10-K |
April 11, 2008 |
10.22q |
||||||
10.20r |
Seventeenth Loan Modification Agreement dated December 28, 2007 to Loan and Security Agreement dated January 30, 2003 among Silicon Valley Bank and Aspen Technology, Inc., AspenTech, Inc. and Hyprotech Company |
8-K |
January 7, 2008 |
10.3 |
||||||
10.20s |
Eighteenth Loan Modification Agreement dated January 24, 2008 to Loan and Security Agreement dated January 30, 2003 among Silicon Valley Bank and Aspen Technology, Inc., AspenTech, Inc. and Hyprotech Company |
10-Q |
February 19, 2009 |
10.7 |
||||||
10.20t |
Nineteenth Loan Modification Agreement dated April 11, 2008 to Loan and Security Agreement dated January 30, 2003 among Silicon Valley Bank and Aspen Technology, Inc., AspenTech, Inc. and Hyprotech Company |
10-Q |
February 19, 2009 |
10.8 |
||||||
10.20u |
Twentieth Loan Modification Agreement dated May 15, 2008 to Loan and Security Agreement dated January 30, 2003 among Silicon Valley Bank and Aspen Technology, Inc., AspenTech, Inc. and Hyprotech Company |
10-Q |
February 19, 2009 |
10.9 |
||||||
10.20v |
Twenty-first Loan Modification Agreement dated June 12, 2008 to Loan and Security Agreement dated January 30, 2003 among Silicon Valley Bank and Aspen Technology, Inc., AspenTech, Inc. and Hyprotech Company |
10-Q |
February 19, 2009 |
10.10 |
||||||
10.20w |
Twenty-second Loan Modification Agreement dated July 15, 2008 to Loan and Security Agreement dated January 30, 2003 among Silicon Valley Bank and Aspen Technology, Inc., AspenTech, Inc. and Hyprotech Company |
10-Q |
February 19, 2009 |
10.11 |
||||||
| |
|
|
Incorporated by Reference | |||||||
|---|---|---|---|---|---|---|---|---|---|---|
| Exhibit Number |
Description | Filed with this Form 10-K |
Form | Filing Date with SEC(1) |
Exhibit Number |
|||||
| 10.20x | Twenty-third Loan Modification Agreement dated September 30, 2008 to Loan and Security Agreement dated January 30, 2003 among Silicon Valley Bank and Aspen Technology, Inc., AspenTech, Inc. and Hyprotech Company | 10-Q | February 19, 2009 | 10.12 | ||||||
10.20y |
Twenty-fourth Loan Modification Agreement dated November 14, 2008 to Loan and Security Agreement dated January 30, 2003 among Silicon Valley Bank and Aspen Technology, Inc., AspenTech, Inc. and Hyprotech Company |
10-Q |
February 19, 2009 |
10.13 |
||||||
10.20z |
Twenty-fifth Loan Modification Agreement dated January 15, 2009 to Loan and Security Agreement dated January 30, 2003 among Silicon Valley Bank and Aspen Technology, Inc., AspenTech, Inc. and Hyprotech Company |
10-Q |
February 19, 2009 |
10.14 |
||||||
10.20aa |
Twenty-sixth Loan Modification Agreement dated May 15, 2009 to Loan and Security Agreement dated January 30, 2003 among Silicon Valley Bank and Aspen Technology, Inc., AspenTech, Inc. and Hyprotech Company |
10-K |
June 30, 2009 |
10.22aa |
||||||
10.20ab |
Twenty-seventh Loan Modification Agreement dated November 3, 2009 to Loan and Security Agreement dated January 30, 2003 among Silicon Valley Bank and Aspen Technology, Inc., AspenTech, Inc. and Hyprotech Company |
10-K |
November 9, 2009 |
10.22ab |
||||||
10.20ac |
Twenty-eighth Loan Modification Agreement dated June 11, 2010 to Loan and Security Agreement dated January 30, 2003 among Silicon Valley Bank and Aspen Technology, Inc., AspenTech, Inc. and Hyprotech Company |
S-1 |
July 30, 2010 |
10.20ac |
||||||
10.20ad |
Twenty-ninth Loan Modification Agreement dated November 15, 2010 to Loan and Security Agreement dated January 30, 2003 among Silicon Valley Bank and Aspen Technology, Inc., AspenTech, Inc. and Hyprotech Company |
10-Q |
February 8, 2011 |
10.3 |
||||||
10.27 |
Investor Rights Agreement dated August 14, 2003 among Aspen Technology, Inc. and the Stockholders named therein |
8-K |
August 22, 2003 |
99.1 |
||||||
10.28 |
Management Rights Letter dated August 14, 2003 among Aspen Technology, Inc. and the entities named therein. |
8-K |
August 22, 2003 |
99.2 |
||||||
10.29 |
Amended and Restated Registration Rights Agreement dated March 19, 2002 between Aspen Technology, Inc. and the Purchasers named therein. |
8-K |
March 20, 2002 |
99.2 |
||||||
10.30^ |
Aspen Technology, Inc. 1995 Stock Option Plan |
S-8 |
September 9, 1996 |
4.5 |
||||||
10.31^ |
Aspen Technology, Inc. Amended and Restated 1995 Directors Stock Option Plan |
10-K |
April 11, 2008 |
10.37 |
||||||
| |
|
|
Incorporated by Reference | |||||||
|---|---|---|---|---|---|---|---|---|---|---|
| Exhibit Number |
Description | Filed with this Form 10-K |
Form | Filing Date with SEC(1) |
Exhibit Number |
|||||
| 10.32^ | Aspen Technology, Inc. 1996 Special Stock Option Plan | 10-K | September 29, 1997 | 10.23 | ||||||
10.33^ |
PetrolSoft Corporation 1998 Stock Option Plan |
S-8 |
July 28, 2000 |
4 |
||||||
10.34^ |
Aspen Technology, Inc. Restated 2001 Stock Option Plan |
10-K |
September 28, 2006 |
10.54 |
||||||
10.35^ |
Form of Terms and Conditions of Stock Option Agreement Granted under Aspen Technology, Inc. 2001 Restated Stock Option Plan |
10-Q |
November 14, 2006 |
10.7 |
||||||
10.36^ |
Aspen Technology, Inc. 2005 Stock Incentive Plan (as amended) |
10-K |
November 9, 2009 |
10.39 |
||||||
10.37^ |
Form of Terms and Conditions of Stock Option Agreement Granted under Aspen Technology, Inc. 2005 Stock Incentive Plan |
10-Q |
November 14, 2006 |
10.8 |
||||||
10.38^ |
Form of Restricted Stock Unit Agreement Granted under Aspen Technology, Inc. 2005 Stock Incentive Plan |
10-Q |
November 14, 2006 |
10.9 |
||||||
10.39^ |
Form of Restricted Stock Unit Agreement-G Granted under Aspen Technology, Inc. 2005 Stock Incentive Plan |
10-Q |
November 14, 2006 |
10.10 |
||||||
10.40^ |
Terms and Conditions of Restricted Stock Unit Agreement Granted under 2005 Stock Incentive Plan |
10-K |
November 9, 2009 |
10.43 |
||||||
10.41^ |
Aspen Technology, Inc. 2010 Equity Incentive Plan |
8-K |
April 21, 2010 |
10.1 |
||||||
10.42^ |
Form of Restricted Stock Unit Agreement Granted under Aspen Technology, Inc. 2010 Equity Incentive Plan |
10-K |
September 2, 2010 |
10.42 |
||||||
10.43^ |
Form of Terms and Conditions of Stock Option Agreement Granted under Aspen Technology, Inc. 2010 Equity Incentive Plan |
10-K |
September 2, 2010 |
10.43 |
||||||
10.44^ |
Form of Confidentiality and Non-Competition Agreement of Aspen Technology, Inc. |
10-K |
April 11, 2008 |
10.45 |
||||||
10.45^ |
Aspen Technology, Inc. Director Compensation Policy |
S-1 |
July 30, 2010 |
10.43 |
||||||
10.46^ |
Form of Aspen Technology, Inc. Executive Annual Incentive Bonus Plan for Fiscal 2009 |
8-K |
June 30, 2008 |
99.1 |
||||||
10.47^ |
Form of Aspen Technology, Inc. Operations Executives Plan Fiscal 2009 |
8-K |
June 30, 2008 |
99.2 |
||||||
10.48^ |
Aspen Technology, Inc. Executive Annual Incentive Bonus Plan for Fiscal 2010 |
8-K |
September 11, 2009 |
99.1 |
||||||
10.49^ |
From of Aspen Technology, Inc. Executive Annual Incentive Bonus Plan for Fiscal 2011 |
8-K |
August 4, 2010 |
10.1 |
||||||
10.50^ |
Amended and Restated Employment Agreement effective October 3, 2007, between Aspen Technology, Inc. and Mark Fusco |
10-K |
April 11, 2008 |
10.50 |
||||||
| |
|
|
Incorporated by Reference | |||||||
|---|---|---|---|---|---|---|---|---|---|---|
| Exhibit Number |
Description | Filed with this Form 10-K |
Form | Filing Date with SEC(1) |
Exhibit Number |
|||||
| 10.51^ | Form of Executive Retention Agreement entered into by Aspen Technology, Inc. and each executive officer of Aspen Technology, Inc. (other than Mark E. Fusco) | 10-Q | February 9, 2010 | 10.1 | ||||||
10.52^ |
Amendment Number 1 dated December 29, 2006 to Stock Option Agreement granted to Manolis E. Kotzabasakis on or about August 18, 2003 under Aspen Technology, Inc. 1995 Stock Option Plan, as amended (Award Identification No. P040380) |
8-K |
January 5, 2007 |
10.1 |
||||||
10.53^ |
Amendment Number 1 dated December 29, 2006 to Stock Option Agreement granted to Manolis E. Kotzabasakis on or about August 18, 2003 under Aspen Technology, Inc. 2001 Stock Option Plan, as amended (Award Identification No. P040002) |
8-K |
January 5, 2007 |
10.2 |
||||||
10.54^ |
Amendment Number 1 dated December 29, 2006 to the Stock Option Agreement granted to Manolis E. Kotzabasakis on or about August 18, 2003 under Aspen Technology, Inc. 2001 Stock Option Plan, as amended (Award Identification No. P0405621) |
8-K |
January 5, 2007 |
10.3 |
||||||
10.55^ |
Offer letter dated June 24, 2009 by and between Aspen Technology, Inc. and Mark P. Sullivan |
S-1 |
July 30, 2010 |
10.52 |
||||||
10.56^ |
Aspen Technology, Inc. Executive Annual Incentive Bonus Plan (Fiscal Year 2012) |
8-K |
July 20, 2011 |
10.1 |
||||||
21.1 |
Subsidiaries of Aspen Technology, Inc. |
S-1 |
July 30, 2010 |
21.1 |
||||||
23.2 |
Consent of KPMG LLP |
X |
||||||||
31.1 |
Certification of Principal Executive Officer Pursuant to Section 302 of the Sarbanes-Oxley Act of 2002 |
X |
||||||||
31.2 |
Certification of Principal Financial Officer Pursuant to Section 302 of the Sarbanes-Oxley Act of 2002 |
X |
||||||||
32.1* |
Certification Pursuant to 18 U.S.C. Section 1350, As Adopted Pursuant to Section 906 of the Sarbanes-Oxley Act of 2002 |
X |
||||||||
- (1)
- The
SEC File No. is 000-24786, other than Exhibit 10.30 (SEC File No. 333-11651), Exhibit 10.33 (SEC File
No. 333-42536) and Exhibit 10.41 (001-34630).
- †
- Confidential
treatment requested as to certain portions
- ^
- Management
contract or compensatory plan or arrangement
- *
- The certification attached as Exhibit 32.1 that accompanies this Form 10-K is not deemed filed with the SEC and is not to be incorporated by reference into any filing of Aspen Technology, Inc. under the Securities Act of 1933 or the Securities Exchange Act of 1934, whether made before or after the date of this Form 10-K, irrespective of any general incorporation language contained in such filing.