Attached files
| file | filename |
|---|---|
| 8-K - FORM 8-K - Colonial Financial Services, Inc. | t71387_8k.htm |
Exhibit 99
 |
CFS
COLONIAL
FINANCIAL
SERVICES, INC.
Annual Meeting
August 18, 2011
|
 |
CFS
COLONIAL
FINANCIAL
SERVICES, INC.
Forward Looking Statements
This presentation contains forward-looking statements, which can be identified by the use of words such as “estimate,” “project,” “believe,” “intend,” “anticipate,” “plan,” “seek,” “expect” and words of similar meaning. These forward-looking statements include, but are not limited to:
statements of our goals, intentions and expectations;
statements regarding our business plans, prospects, growth and operating strategies; statements regarding the asset quality of our loan and investment portfolios; and estimates of our risks and future costs and benefits.
These forward-looking statements are based on current beliefs and expectations of our management and are inherently subject to significant business, economic and competitive uncertainties and contingencies, many of which are beyond our control. In addition, these forward-looking statements are subject to assumptions with respect to future business strategies and decisions that are subject to change.
The following factors, among others, could cause actual results to differ materially from the anticipated results or other expectations expressed in the forward-looking statements:
general economic conditions, either nationally or in our market areas, that are worse than expected; competition among depository and other financial institutions;
inflation and changes in the interest rate environment that reduce our margins or reduce the fair value of financial instruments; adverse changes in the securities markets; changes in laws or government regulations or policies affecting financial institutions, including changes in regulatory fees and capital requirements; our ability to enter new markets successfully and capitalize on growth opportunities; our ability to successfully integrate acquired entities, if any; changes in consumer spending, borrowing and savings habits; changes in accounting policies and practices, as may be adopted by the bank regulatory agencies, the Financial Accounting Standards Board the Securities and Exchange Commission and the Public Company Accounting Oversight Board; changes in our organization, compensation and benefit plans; and changes in the financial condition or future prospects of issuers of securities that we own.
Because of these and other uncertainties, our actual future results may be materially different from the results indicated by these forward looking statements.
2
|
 |
Company Overview
|
 |
CFS
COLONIAL
FINANCIAL
SERVICES, INC.
Company Profile
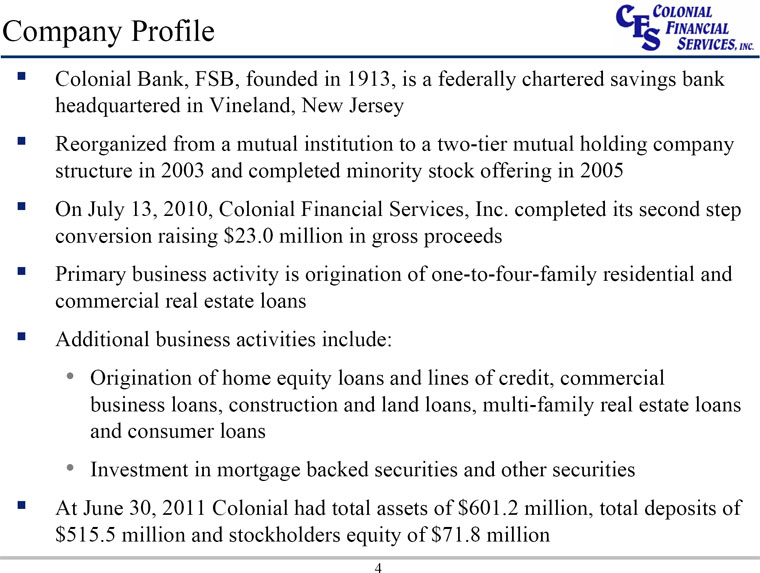
Colonial Bank, FSB, founded in 1913, is a federally chartered savings bank headquartered in Vineland, New Jersey
Reorganized from a mutual institution to a two-tier mutual holding company structure in 2003 and completed minority stock offering in 2005
On July 13, 2010, Colonial Financial Services, Inc. completed its second step conversion raising $23.0 million in gross proceeds
Primary business activity is origination of one-to-four-family residential and commercial real estate loans
Additional business activities include:
• Origination of home equity loans and lines of credit, commercial business loans, construction and land loans, multi-family real estate loans and consumer loans
• Investment in mortgage backed securities and other securities
At June 30, 2011 Colonial had total assets of $601.2 million, total deposits of $515.5 million and stockholders equity of $71.8 million
4
|
 |
CFS
COLONIAL
FINANCIAL
SERVICES, INC.
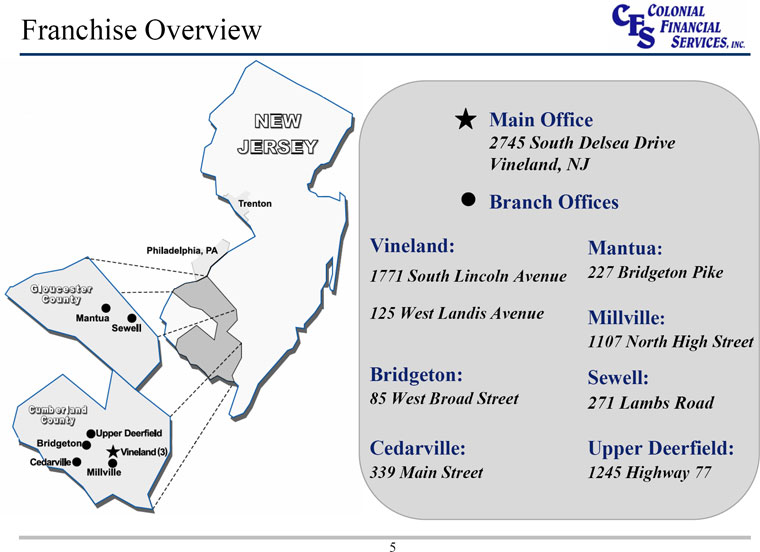
Franchise Overview
Main Office
2745 South Delsea Drive Vineland, NJ
Branch Offices
Vineland: Mantua:
1771 South Lincoln Avenue 227 Bridgeton Pike 125 West Landis Avenue Millville: 1107 North High Street
Bridgeton: Sewell:
85 West Broad Street 271 Lambs Road
Cedarville: Upper Deerfield:
339 Main Street 1245 Highway 77
5
|
 |
CFS
COLONIAL
FINANCIAL
SERVICES, INC.
Market Area Overview
Colonial Savings Bank operates 8 full-service branch offices in Gloucester and Cumberland counties in New Jersey
Located in close proximity to several major urban centers
• Philadelphia, Pennsylvania
• Atlantic City, New Jersey
• Wilmington, Delaware
As suburban communities to these urban centers, the market area has displayed stability in the recent environment and the outlook remains strong
• Median household income growth is expected to exceed both the state of New Jersey and the nation as a whole
Broad range of employers. Key industries include:
• Federal, state and local governments • Higher education
• Healthcare • Agriculture
• Retail • Food processing
Source: SNL Financial 6
|
 |
CFS
COLONIAL
FINANCIAL
SERVICES, INC.
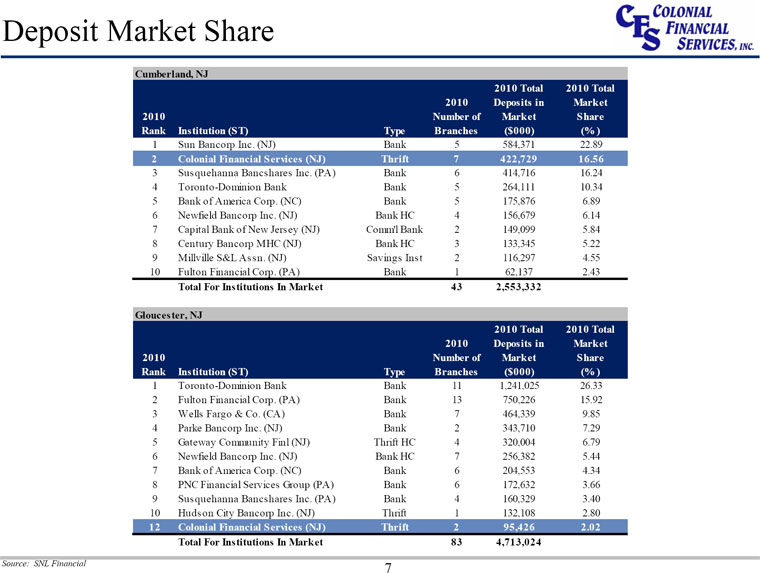
Deposit Market Share
Cumberland, NJ
2010 Total 2010 Total 2010 Deposits in Market 2010 Number of Market Share Rank Institution (ST) Type Branches ($000) (% )
1 Sun Bancorp Inc. (NJ) Bank 5 584,371 22.89
2 Colonial Financial Services (NJ) Thrift 7 422,729 16.56
3 Susquehanna Bancshares Inc. (PA) Bank 6 414,716 16.24
4 Toronto-Dominion Bank Bank 5 264,111 10.34
5 Bank of America Corp. (NC) Bank 5 175,876 6.89
6 Newfield Bancorp Inc. (NJ) Bank HC 4 156,679 6.14
7 Capital Bank of New Jersey (NJ) Comm'l Bank 2 149,099 5.84
8 Century Bancorp MHC (NJ) Bank HC 3 133,345 5.22
9 Millville S&L Assn. (NJ) Savings Inst 2 116,297 4.55
10 Fulton Financial Corp. (PA) Bank 1 62,137 2.43
Total For Institutions In Market 43 2,553,332
Gloucester, NJ
2010 Total 2010 Total 2010 Deposits in Market 2010 Number of Market Share Rank Institution (ST) Type Branches ($000) (% )
1 Toronto-Dominion Bank Bank 11 1,241,025 26.33
2 Fulton Financial Corp. (PA) Bank 13 750,226 15.92
3 Wells Fargo & Co. (CA) Bank 7 464,339 9.85
4 Parke Bancorp Inc. (NJ) Bank 2 343,710 7.29
5 Gateway Community Finl (NJ) Thrift HC 4 320,004 6.79
6 Newfield Bancorp Inc. (NJ) Bank HC 7 256,382 5.44
7 Bank of America Corp. (NC) Bank 6 204,553 4.34
8 PNC Financial Services Group (PA) Bank 6 172,632 3.66
9 Susquehanna Bancshares Inc. (PA) Bank 4 160,329 3.40
10 Hudson City Bancorp Inc. (NJ) Thrift 1 132,108 2.80
12 Colonial Financial Services (NJ) Thrift 2 95,426 2.02 Total For Institutions In Market 83 4,713,024
Source: SNL Financial 7
|
 |
CFS
COLONIAL
FINANCIAL
SERVICES, INC.
Business Strategy
Implement a controlled growth strategy to prudently increase profitability and enhance shareholder value
Maintain strong asset quality through conservative underwriting and aggressive monitoring of assets
Emphasize lower cost core deposits
Manage interest rate risk and reduce the exposure of our net interest income to changes in market interest rates
Expand franchise through selective de novo branching
Capitalize on existing infrastructure and management’s knowledge of the local banking environment
8
|
 |
Financial Highlights
|
 |
CFS
COLONIAL
FINANCIAL
SERVICES, INC.
Loan Portfolio Growth
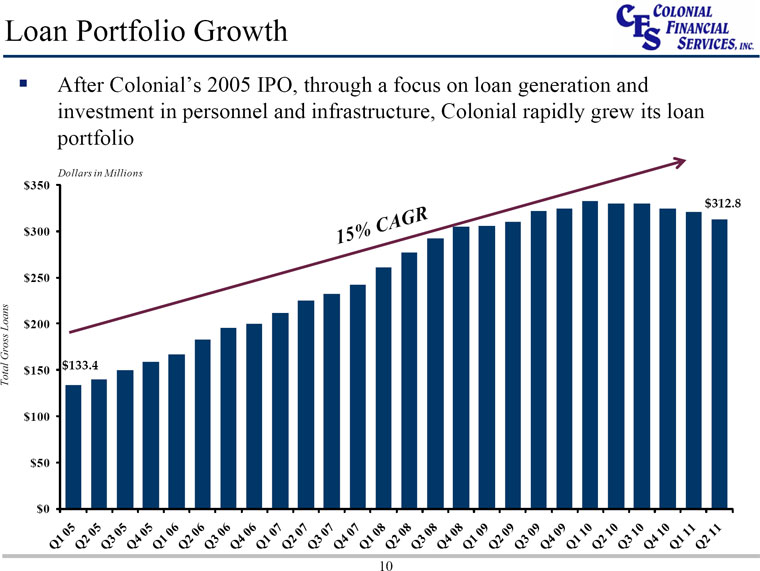
After Colonial’s 2005 IPO, through a focus on loan generation and investment in personnel and infrastructure, Colonial rapidly grew its loan portfolio
Dollars in Millions $350 $312.8
AG R
$300 % C
15
$250
$200
Total Gross Loans $150 $133.4 $100
$50
$0
10
|
 |
CFS
COLONIAL
FINANCIAL
SERVICES, INC.
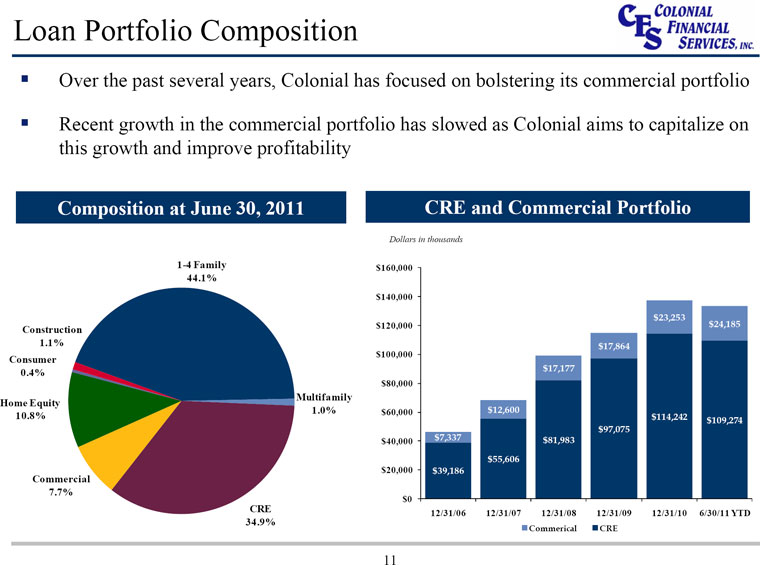
Loan Portfolio Composition
Over the past several years, Colonial has focused on bolstering its commercial portfolio
Recent growth in the commercial portfolio has slowed as Colonial aims to capitalize on this growth and improve profitability
Composition at June 30, 2011 CRE and Commercial Portfolio
Dollars in thousands
1-4 Family $160,000 44.1% $140,000
$23,253 $120,000 $24,185
Construction
1.1% $17,864
Consumer $100,000
0.4% $17,177 $80,000
Multifamily Home Equity
1.0% $60,000 $12,600
10.8% $114,242 $109,274 $97,075 $40,000 $7,337 $81,983 $55,606 $20,000 $39,186
Commercial 7.7% $0
CRE 12/31/06 12/31/07 12/31/08 12/31/09 12/31/10 6/30/11 YTD
34.9%
Commerical CRE
11
|
 |
CFS
COLONIAL
FINANCIAL
SERVICES, INC.
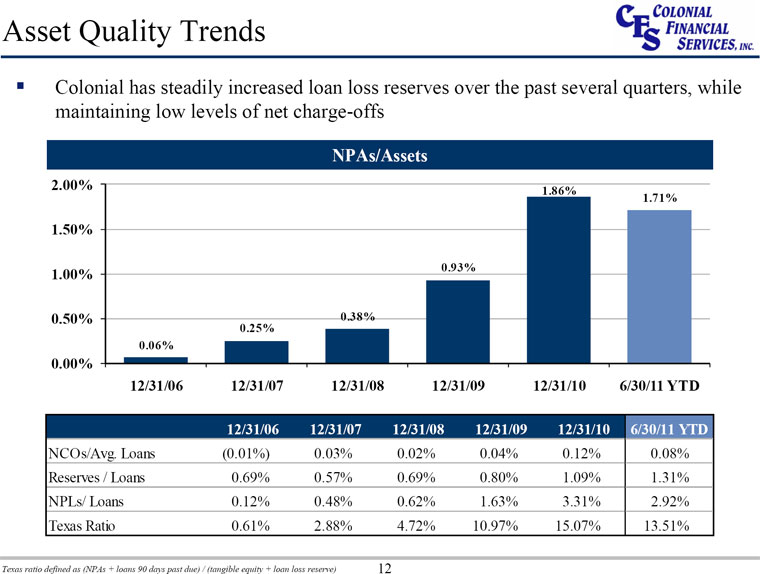
Asset Quality Trends
Colonial has steadily increased loan loss reserves over the past several quarters, while maintaining low levels of net charge-offs
NPAs/Assets
2.00% 1.86%
1.71%
1.50%
1.00% 0.93%
0.50% 0.38%
0.25% 0.06%
0.00%
12/31/06 12/31/07 12/31/08 12/31/09 12/31/10 6/30/11 YTD
12/31/06 12/31/07 12/31/08 12/31/09 12/31/10 6/30/11 YTD
NCOs/Avg. Loans (0.01%) 0.03% 0.02% 0.04% 0.12% 0.08% Reserves / Loans 0.69% 0.57% 0.69% 0.80% 1.09% 1.31% NPLs/ Loans 0.12% 0.48% 0.62% 1.63% 3.31% 2.92% Texas Ratio 0.61% 2.88% 4.72% 10.97% 15.07% 13.51%
Texas ratio defined as (NPAs + loans 90 days past due) / (tangible equity + loan loss reserve) 12
|
 |
CFS
COLONIAL
FINANCIAL
SERVICES, INC.
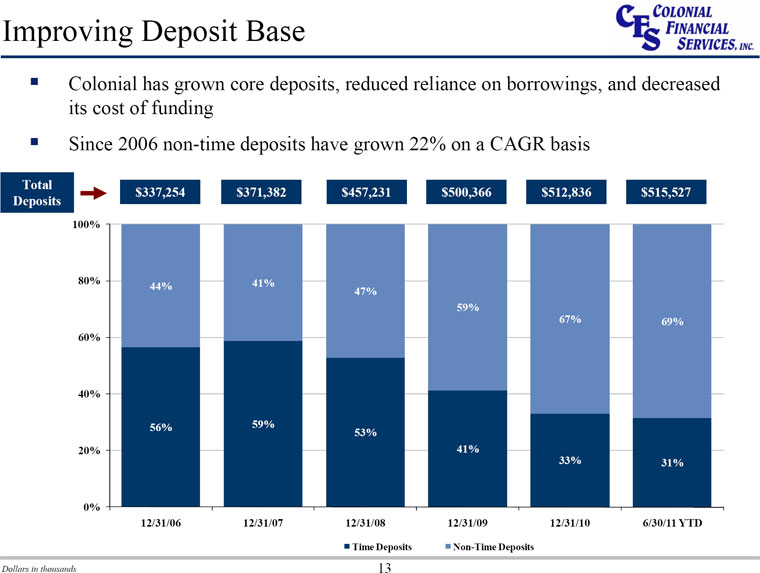
Improving Deposit Base
Colonial has grown core deposits, reduced reliance on borrowings, and decreased its cost of funding
Since 2006 non-time deposits have grown 22% on a CAGR basis
Total $337,254 $371,382 $457,231 $500,366 $512,836 $515,527 Deposits
100%
80% 41% 44%
47%
59%
67% 69% 60%
40%
56% 59%
53%
20% 41%
33% 31%
0%
12/31/06 12/31/07 12/31/08 12/31/09 12/31/10 6/30/11 YTD
Time Deposits Non-Time Deposits
Dollars in thousands 13
|
 |
CFS
COLONIAL
FINANCIAL
SERVICES, INC.
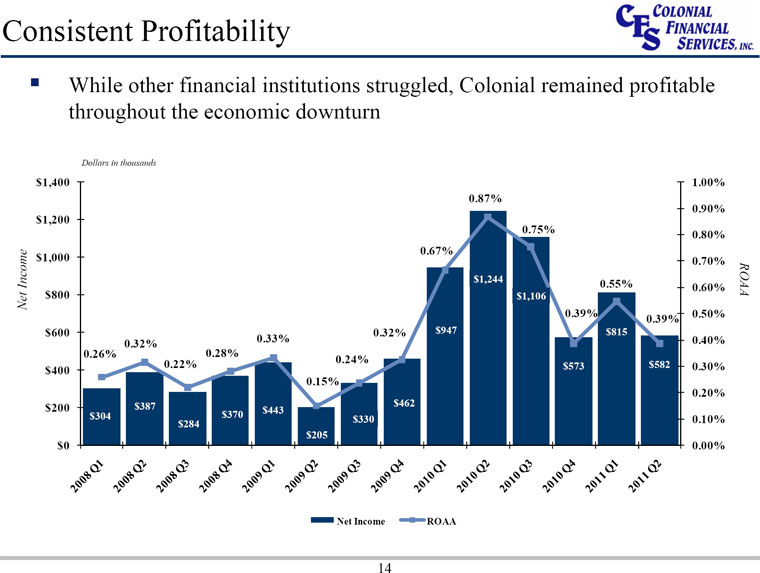
Consistent Profitability
While other financial institutions struggled, Colonial remained profitable throughout the economic downturn
Dollars in thousands
$1,400 1.00% 0.87% 0.90% $1,200 0.75% 0.80% 0.67% $1,000 0.70% $1,244 0.55% 0.60% ROAA
Net Income $800 $1,106
0.39% 0.50% 0.39% $600 0.32% $947 $815 0.33% 0.40% 0.26% 0.32% 0.28% 0.22% 0.24% $582 $400 $573 0.30% 0.15% 0.20% $200 $387 $462 $370 $443 $304 $330 0.10% $284 $205
$0 0.00%
Net Income ROAA
14
|
 |
CFS
COLONIAL
FINANCIAL
SERVICES, INC.
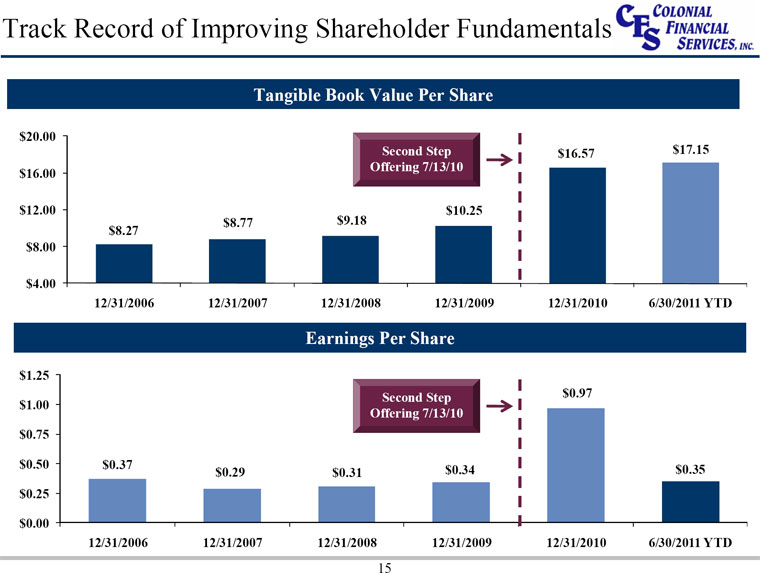
Track Record of Improving Shareholder Fundamentals
Tangible Book Value Per Share
$20.00
Second Step $16.57 $17.15 Offering 7/13/10 $16.00
$12.00 $10.25 $8.77 $9.18 $8.27 $8.00
$4.00
12/31/2006 12/31/2007 12/31/2008 12/31/2009 12/31/2010 6/30/2011 YTD
Earnings Per Share
$1.25
Second Step $0.97 $1.00 Offering 7/13/10 $0.75
$0.50 $0.37 $0.34 $0.35 $0.29 $0.31 $0.25
$0.00
12/31/2006 12/31/2007 12/31/2008 12/31/2009 12/31/2010 6/30/2011 YTD
15
|
 |
Market Statistics
|
 |
CFS
COLONIAL
FINANCIAL
SERVICES, INC.
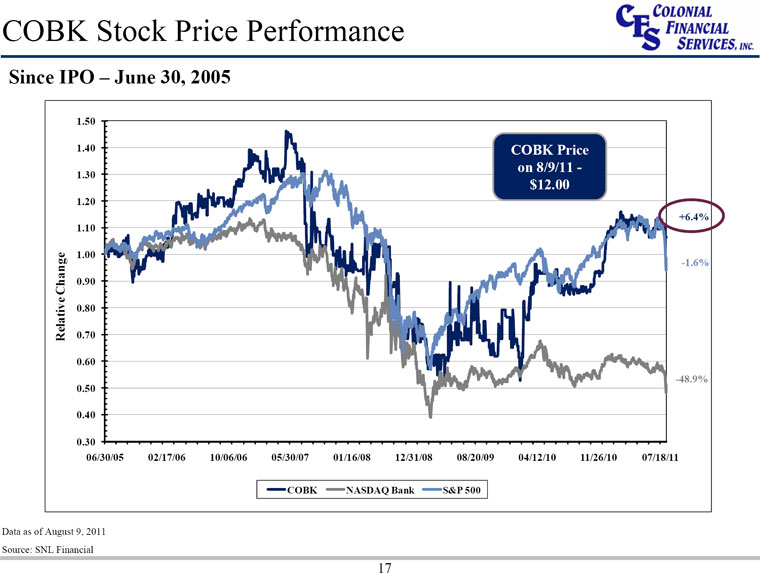
COBK Stock Price Performance
Since IPO – June 30, 2005
1.50
1.40 COBK Price on 8/9/11 -
1.30
$12.00
1.20
+6.4% 1.10
1.00
-1.6% 0.90
0.80
Relative Change 0.70 0.60
-48.9% 0.50
0.40
0.30
06/30/05 02/17/06 10/06/06 05/30/07 01/16/08 12/31/08 08/20/09 04/12/10 11/26/10 07/18/11
COBK NASDAQ Bank S&P 500
Data as of August 9, 2011 Source: SNL Financial
17
|
 |
CFS
COLONIAL
FINANCIAL
SERVICES, INC.
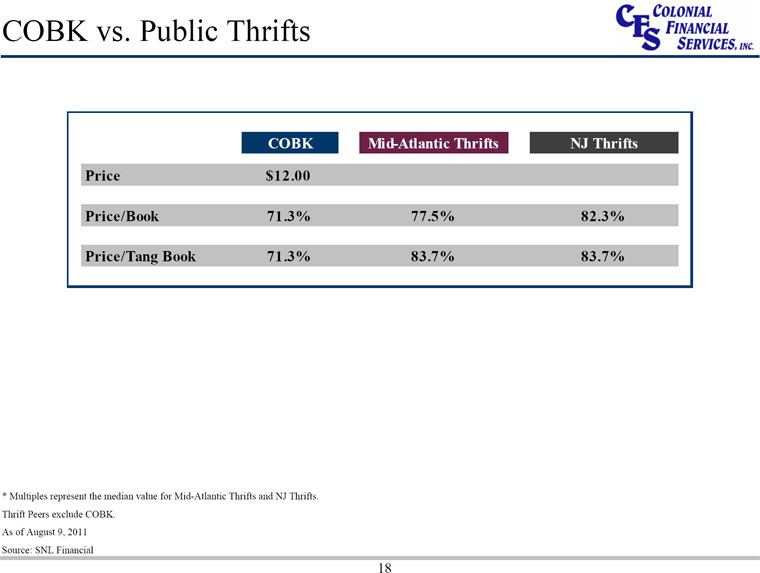
COBK vs. Public Thrifts
COBK Mid-Atlantic Thrifts NJ Thrifts Price $12.00 Price/Book 71.3% 77.5% 82.3% Price/Tang Book 71.3% 83.7% 83.7%
* Multiples represent the median value for Mid-Atlantic Thrifts and NJ Thrifts. Thrift Peers exclude COBK.
As of August 9, 2011 Source: SNL Financial
18
|
 |
Questions?
|