Attached files
| file | filename |
|---|---|
| 8-K - 8-K - DEERE & CO | a11-24414_18k.htm |
| EX-99.2 - EX-99.2 - DEERE & CO | a11-24414_1ex99d2.htm |
| EX-99.1 - EX-99.1 - DEERE & CO | a11-24414_1ex99d1.htm |

|
|
| 3rd Quarter 2011 Earnings Conference Call 2 Safe Harbor Statement & Disclosures The earnings call and accompanying material include forward-looking comments and information concerning the company’s projections, plans and objectives for the future, including estimates and assumptions with respect to economic, political, technological, weather, market acceptance and other factors that impact our businesses and customers. They also may include financial measures that are not in conformance with accounting principles generally accepted in the United States of America (GAAP). Words such as “forecast,” “projection,” “outlook,” “prospects,” “expected,” “estimated,” “will,” “plan,” “anticipate,” “intend,” “believe,” or other similar words or phrases often identify forward-looking statements. Actual results may differ materially from those projected in these forward-looking statements based on a number of factors and uncertainties. Additional information concerning factors that could cause actual results to differ materially is contained in the company’s most recent Form 8-K and periodic report filed with the U.S. Securities and Exchange Commission, and is incorporated by reference herein. Investors should refer to and consider the incorporated information on risks and uncertainties in addition to the information presented here. Investors should consider non-GAAP financial measures in addition to, and not as a substitute for, financial measures prepared in accordance with GAAP. The company, except as required by law, undertakes no obligation to update or revise its forward-looking statements whether as a result of new developments or otherwise. The call and accompanying materials are not an offer to sell or a solicitation of offers to buy any of the company’s securities. 26 |
|
|
| 3rd Quarter 2011 Earnings Conference Call 3 Third Quarter Overview (in millions of dollars except per share amounts) Q3 2011 Q3 2010 Change Net Sales and Revenues $8,372 $6,837 +22% Net Sales $7,722 $6,224 +24% Net Income Attributable to Deere & Company $712 $617 +15% Diluted EPS $1.69 $1.44 +17% 27 |
|
|
| 3rd Quarter 2011 Earnings Conference Call 4 Third Quarter Overview Net Sales Equipment operations net sales: Up 24% in Q3 2011 vs. Q3 2010 Currency translation: +6 points Price realization: +3 points 28 |
|
|
| 3rd Quarter 2011 Earnings Conference Call 5 Production Tonnage Approximate % Change* Q3 2011 Actual Q3 2011 Previous Forecast Q4 2011 Forecast FY 2011 Forecast FY 2011 Previous Forecast Total Worldwide +9 +11 +13 +21 +19 Worldwide A&T +7 +12 +9 +17 +17 Worldwide C&F +20 +7 +31 +43 +36 U.S. and Canada +1 +1 +12 +19 +17 Outside U.S. and Canada +23 +29 +14 +24 +24 U.S. and Canada A&T -3 +1 +6 +14 +13 *Percentage change from same period in previous year, excluding purchased product Deere & Company Forecast as of 17 August 2011 (Previous Forecast as of 18 May 2011) 29 |
|
|
| 3rd Quarter 2011 Earnings Conference Call 6 2011 Company Outlook Fourth Quarter 2011 Forecast Net sales: Up ~ 20% vs. Q4 2010 Currency translation: ~ +4 points Fiscal Year 2011 Forecast Net sales: Up ~ 25% vs. FY 2010 Currency translation: ~ +4 points Price realization: ~ +3 points Previous forecast: Up 21-23% vs. FY 2010 Currency translation: ~ +3 points Price realization: ~ +3 points Net income attributable to Deere & Company of ~ $2.7 billion Previous forecast: ~ $2.65 billion Deere & Company Forecast as of 17 August 2011 (Previous Forecast as of 18 May 2011) 30 |
|
|
| 3rd Quarter 2011 Earnings Conference Call 7 Worldwide Agriculture & Turf Third Quarter Overview (in millions of dollars) Q3 2011 Q3 2010 Change Net Sales $6,371 $5,217 +22% Operating Profit* $859 $824 +4% Production Tonnage +7% Incremental Margin ~ 3% *Q3 2011 operating profit impacted by: Higher shipment volumes Improved price realization Increased raw-material costs Higher selling, administrative and general expenses 31 |
|
|
| 3rd Quarter 2011 Earnings Conference Call 8 U.S. Commodity Price Estimates (dollars per bushel, except cotton, which is dollars per pound) 2009/10 2010/11 Estimate Previous 2010/11 2011/12 Forecast Previous 2011/12 2011/12 USDA Corn $3.55 $5.30 $5.20 $5.75 $5.50 $6.20-$7.20 Wheat $4.87 $5.70 $5.75 $7.30 $7.25 $7.00-$8.20 Soybeans $9.59 $11.65 $11.55 $12.75 $12.75 $12.50-$14.50 Cotton $0.63 $0.81 $0.81 $0.90 $1.00 $0.85-$1.05 Unless Otherwise Labeled, Deere & Company Forecast as of 17 August 2011 (Previous Forecast as of 18 May 2011) USDA Forecast 11 August 2011 32 |
|
|
(Yield in bushels per acre, except cotton, which is pounds per acre) Acres Planted (millions) Yield 2010/11 2011/12 Forecast 2010/11 2011/12 Forecast 2011/12 USDA Corn 88.2 92.3 152.8 156.0 153.0 Wheat 53.6 56.4 46.4 45.2 45.2 Soybeans 77.4 75.2 43.5 43.1 41.4 Cotton 11.0 13.7 812 790 822 | 3rd Quarter 2011 Earnings Conference Call 9 U.S. Acres Planted and Crop Yields Unless Otherwise Labeled, Deere & Company Forecast as of 17 August 2011 USDA Forecast 11 August 2011 33 |
|
|
| 3rd Quarter 2011 Earnings Conference Call 10 U.S. Farm Cash Receipts (in billions of dollars) 2010 Forecast Previous 2010 2011 Forecast Previous 2011 2012 Forecast Previous 2012 Crops $170.9 $170.9 $207.6* $210.1 $198.1* $202.0 Livestock $141.5 $141.5 $153.0 $149.4 $151.9 $152.0 Government Payments $12.2 $12.2 $11.8 $11.9 $12.3 $12.3 Total Cash Receipts $324.6 $324.6 $372.4* $371.4 $362.3* $366.3 Deere & Company Forecast as of 17 August 2011 (Previous Forecast as of 18 May 2011) *Prior to USDA release of supply and demand report on 11 August 2011. Incorporating the crop price and yield data from that report, preliminary Deere estimates of crops and total gross cash receipts increase ~$5 billion in 2011 and ~$12 billion in 2012. 34 |
|
|
| 3rd Quarter 2011 Earnings Conference Call 11 EU 27 Economic Update Deere & Company Forecast as of 17 August 2011 35 Farm income stable to positive due to improved prices Regions and segments differ Fundamentals remain positive Grain, beef, and milk prices remain at good levels Input costs increasing, but below peak levels Investment interest in agricultural machinery stable to positive Low levels of used equipment Grain harvest hampered regionally by wet weather Forage production recovering from spring dryness |
|
|
12 Setting Directions New Product Introduction: EU 27, CIS* Largest new product introduction for Region 2 Over 6,000 participants from 57 countries Over 100 new products 80% of large (140+ horsepower) tractor and combine models new or updated Enhanced portfolio of farm implements Focus on Dealer of Tomorrow strategy | 3rd Quarter 2011 Earnings Conference Call *Commonwealth of Independent States 36 |
|
|
| 3rd Quarter 2011 Earnings Conference Call 13 Farm Net Income Brazil and Argentina Brazil (in billions of U.S. dollars) 2010 Previous 2010 2011 Forecast Previous 2011 2012 Forecast Previous 2012 Soybeans 4.5 4.5 5.2 8.8 5.4 6.7 Sugarcane 10.3 10.3 11.3 13.4 12.0 13.6 Other* 0.6 0.6 3.7 3.9 3.6 1.9 Total 15.4 15.4 20.2 26.1 21.0 22.2 Argentina (in billions of U.S. dollars) 2010 Previous 2010 2011 Forecast Previous 2011 2012 Forecast Previous 2012 Total 6.1 6.1 8.0 7.6 8.4 6.4 * Includes corn, paddy rice, and cotton Deere & Company Forecast as of 17 August 2011 (Previous Forecast as of 18 May 2011) 37 |
|
|
| 3rd Quarter 2011 Earnings Conference Call 14 Agriculture & Turf Retail Sales Industry Outlook – Fiscal 2011 U.S. and Canada Ag: Up 5-10% No change from previous forecast EU 27 Ag: Up 10-15% Previous forecast: Up ~ 15% CIS* countries Ag: Notably higher No change from previous forecast Asia Ag: Sales forecast to rise sharply again this year No change from previous forecast South America Ag: Down ~ 5% Previous forecast: Down 5-10% U.S. and Canada turf and utility equipment: ~ Flat No change from previous forecast *Commonwealth of Independent States Deere & Company Forecast as of 17 August 2011 (Previous Forecast as of 18 May 2011) 38 |
|
|
| 3rd Quarter 2011 Earnings Conference Call 15 Worldwide Agriculture & Turf Deere & Company Outlook Fiscal Year 2011 Forecast Net sales: Up ~ 21% Currency translation: ~ +4 points Previous forecast: Up ~ 20% Currency translation: ~ +4 points Deere & Company Forecast as of 17 August 2011 (Previous Forecast as of 18 May 2011) 39 |
|
|
Delivering Customer Solutions 8335R: Outstanding Fuel Efficiency & Lower Operating Cost | 3rd Quarter 2011 Earnings Conference Call 16 John Deere 8335R: Nebraska OECD Tractor Test 1990—Summary 758 John Deere 8320R: Nebraska OECD Tractor Test 1963—Summary 660 John Deere 8430: Nebraska OECD Tractor Test 1873—Summary 527 First iT4 compliant tractor through Nebraska OECD testing Single fluid, EGR iT4 engine design validated Better fuel efficiency than 8430 and 8320R First row-crop tractor to break through 300 PTO hp barrier Factory installed JDLinkTM to help increase profitability Transmits machine data to owners and dealers to optimize for peak performance iT4 – Interim Tier 4 OECD – Organization for Economic Cooperation and Development EGR – Exhaust Gas Recirculation PTO – Power Take-Off 40 |
|
|
| 3rd Quarter 2011 Earnings Conference Call 17 Worldwide Construction & Forestry Third Quarter Overview (in millions of dollars) Q3 2011 Q3 2010 Change Net Sales $1,351 $1,007 +34% Operating Profit* $110 $66 +67% Production Tonnage +20% Incremental Margin ~ 13% *Q3 2011 operating profit impacted by: Higher shipment and production volumes Improved price realization Increased raw-material costs Higher selling, administrative and general expenses 41 |
|
|
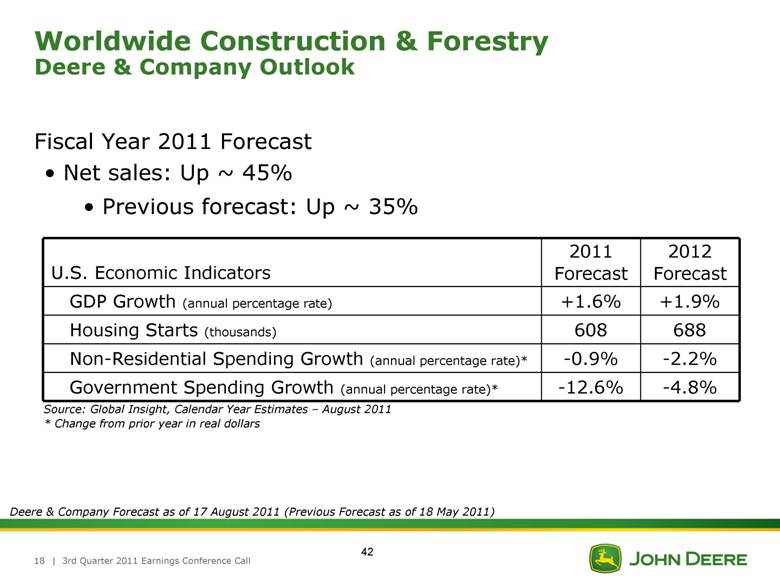
U.S. Economic Indicators 2011 Forecast 2012 Forecast GDP Growth (annual percentage rate) +1.6% +1.9% Housing Starts (thousands) 608 688 Non-Residential Spending Growth (annual percentage rate)* -0.9% -2.2% Government Spending Growth (annual percentage rate)* -12.6% -4.8% | 3rd Quarter 2011 Earnings Conference Call 18 Worldwide Construction & Forestry Deere & Company Outlook Source: Global Insight, Calendar Year Estimates – August 2011 * Change from prior year in real dollars Fiscal Year 2011 Forecast Net sales: Up ~ 45% Previous forecast: Up ~ 35% Deere & Company Forecast as of 17 August 2011 (Previous Forecast as of 18 May 2011) 42 |
|
|
| 3rd Quarter 2011 Earnings Conference Call 19 Worldwide Financial Services Credit Loss History 0.08% Provision for Credit Losses / Average Owned Portfolio * Annualized provision for credit losses as of 31 July 2011 43 |
|
|
| 3rd Quarter 2011 Earnings Conference Call 20 Worldwide Financial Services Third Quarter 2011 Net income attributable to Deere & Company $126 million in Q3 2011 vs. $102 million in Q3 2010 Fiscal Year 2011 Forecast Net income attributable to Deere & Company of ~ $460 million Previous forecast: ~ $435 million Deere & Company Forecast as of 17 August 2011 (Previous Forecast as of 18 May 2011) 44 |
|
|
| 3rd Quarter 2011 Earnings Conference Call 21 Consolidated Trade Receivables & Inventory (in millions of dollars) Q3 2011* Actual 2011** Forecast 2011** Previous Forecast A&T 1,244 300 125 C&F 585 475 225 Total, as reported 1,829 775 100 Total, constant exchange 1,400 600 50 * Change at 31 July 2011 vs. 31 July 2010 ** Change at 31 October 2011 vs. 31 October 2010 Deere & Company Forecast as of 17 August 2011 (Previous Forecast as of 18 May 2011) 45 |
|
|
| 3rd Quarter 2011 Earnings Conference Call 22 Retail Sales U.S. and Canada Ag Industry* Deere** Utility Tractors 8% less than the industry Row-Crop Tractors 11% slightly more than the industry 4WD Tractors 5% a single digit Combines 25% more than the industry July 2011 Retail Sales and Dealer Inventories * As reported by the Association of Equipment Manufacturers ** As reported to the Association of Equipment Manufacturers *** At 31 July – in units as a % of trailing 12 months retail sales, as reported to the Association of Equipment Manufacturers Deere Dealer Inventories*** U.S. and Canada Ag 2011 2010 Row-Crop Tractors 18% 18% Combines 18% 19% 46 |
|
|
| 3rd Quarter 2011 Earnings Conference Call 23 July 2011 Retail Sales EU 27 Deere* Tractors double digits Combines double digits U.S. and Canada Deere* Selected Turf & Utility Equipment double digits * Based on internal sales reports U.S. and Canada – Construction & Forestry Deere* First-in-the-Dirt double digits Settlements double digits 47 |
|
|
| 3rd Quarter 2011 Earnings Conference Call 24 Material Costs and Freight Equipment Operations Third Quarter 2011 Up ~ $195 million vs. Q3 2010 Fiscal Year 2011 Forecast Up ~ $700 million vs. FY 2010 Agriculture & Turf ~ $600 million Construction & Forestry ~ $100 million Previous forecast: Margin impact ~ (2) points vs. FY 2010 Deere & Company Forecast as of 17 August 2011 (Previous Forecast as of 18 May 2011) 48 |
|
|
| 3rd Quarter 2011 Earnings Conference Call 25 Research & Development Expense Equipment Operations Third Quarter 2011 Up ~ 22% vs. Q3 2010 Fiscal Year 2011 Forecast Up ~ 17% vs. FY 2010 No change from previous forecast Deere & Company Forecast as of 17 August 2011 (Previous Forecast as of 18 May 2011) 49 |
|
|
| 3rd Quarter 2011 Earnings Conference Call 26 Selling, Administrative & General Expense Equipment Operations Third Quarter 2011 Up ~ 14% vs. Q3 2010 Growth: ~ +5 points Currency translation: ~ +4 points Incentive compensation: ~ +3 points Fiscal Year 2011 Forecast Up ~ 13% vs. FY 2010 Incentive compensation: ~ +3 points Currency translation: ~ +2 points Growth: ~ +2 points Previous forecast: Up ~ 14% vs. FY 2010 Incentive compensation: ~ +3 points Currency translation: ~ +2 points Growth: ~ +1 point Deere & Company Forecast as of 17 August 2011 (Previous Forecast as of 18 May 2011) 50 |
|
|
| 3rd Quarter 2011 Earnings Conference Call 27 Income Taxes Equipment Operations Third Quarter 2011 Effective tax rate: ~ 34% Fiscal Year 2011 Forecast Projected effective tax rate: 33-35% No change from previous forecast Deere & Company Forecast as of 17 August 2011 (Previous Forecast as of 18 May 2011) 51 |
|
|
| 3rd Quarter 2011 Earnings Conference Call 28 Continued Strong Operating Performance Equipment Operations Cash Flows from Operations Fiscal Year 2008: $2.4 billion Fiscal Year 2009: $1.4 billion Fiscal Year 2010: $2.5 billion Fiscal Year 2011 Forecast: ~ $2.7 billion Previous forecast: ~ $3.1 billion Deere & Company Forecast as of 17 August 2011 (Previous Forecast as of 18 May 2011) 52 |
|
|
| 3rd Quarter 2011 Earnings Conference Call 29 Other Information Fiscal Year 2011 Forecast Equipment Operations Capital Expenditures: ~ $1.1 billion No change from previous forecast Depreciation and Amortization: ~ $600 million No change from previous forecast Pension/OPEB Contributions: ~ $125 million Previous forecast: ~ $115 million Deere & Company Forecast as of 17 August 2011 (Previous Forecast as of 18 May 2011) 53 |
|
|
| 3rd Quarter 2011 Earnings Conference Call 30 Share Repurchase As Part of Publicly Announced Plans Actual Shares Repurchased* (in millions) Total Amount** (in billions) 2004 5.9 $0.2 2005 27.7 $0.9 2006 34.0 $1.3 2007 25.7 $1.5 2008 21.2 $1.7 2009 0.0 $0.0 2010 5.2 $0.4 2011 YTD 12.8 $1.1 Cumulative cost of repurchases 2004-3Q2011: ~ $7.0 billion Amount remaining on May 2008 authorization of $5 billion: ~ $4.6 billion 31 July 2011 period ended shares (basic): ~ 413.9 million (diluted): ~ 418.4 million Shares repurchased 2004-3Q2011: ~ 132.5 million Average repurchase price 2004-3Q2011: $52.97 * All shares adjusted for two-for-one stock split effective 26 November 2007 ** Rounded totals for each period – sum may not tie to cumulative cost of repurchases 2004-3Q2011 54 |
|
|
| 3rd Quarter 2011 Earnings Conference Call 31 Appendix 55 |
|
|
Deere Use-of-Cash Priorities | 3rd Quarter 2011 Earnings Conference Call 32 Manage the balance sheet, including liquidity, to support a rating that provides access to low-cost and readily available short- and long-term funding mechanisms Reflects the strategic nature of our financial services operation Committed to “A” Rating Cash from Operations Fund Operating and Growth Needs Common Stock Dividend Share Repurchase Fund value-creating investments in our businesses Consistently and moderately raise dividend targeting a 25%-35% payout ratio of mid-cycle earnings Consider share repurchase as a means to deploy excess cash to shareholders, once above requirements are met and repurchase is viewed as value-enhancing 56 |
|
|
| 3rd Quarter 2011 Earnings Conference Call 33 Worldwide Financial Services Unsecured Term Debt Maturities* * Maturities as of 31 July 2011 57 |
|
|
| 3rd Quarter 2011 Earnings Conference Call 34 Sources and Uses of Cash Fiscal 2004–2010 Equipment Operations ~55% of cash from operations returned to shareholders (1) Other includes excess tax benefits from share-based compensation, effect of exchange rates on cash and cash equivalents, proceeds from maturities and sales of marketable securities and purchases of marketable securities Source: Deere & Company SEC filings (1) $4,160 $3,348 58 |
|
|
U.S. Farm Prices | 3rd Quarter 2011 Earnings Conference Call 35 Source: Actual Data: USDA Forecast Data: Deere & Company Forecast as of 17 August 2011 59 |
|
|
| 3rd Quarter 2011 Earnings Conference Call 36 World Farm Fundamentals Global Stocks-To-Use Ratios Corn Wheat Soybeans Source: USDA - 11 August 2011 Cotton 60 |
|
|
| 3rd Quarter 2011 Earnings Conference Call 37 U.S. Net Farm Cash Income (in billions of dollars) 2010 Forecast Previous 2010 2011 Forecast Previous 2011 2012 Forecast Previous 2012 Total Cash Receipts $324.6 $324.6 $372.4 $371.4 $362.3 $366.3 Other Cash Income $21.0 $21.0 $21.2 $21.1 $23.8 $23.8 Gross Cash Income $345.6 $345.6 $393.6 $392.5 $386.1 $390.1 Cash Expenses ($254.2) ($254.2) ($282.0) ($280.0) ($283.0) ($284.0) Net Cash Income $91.4 $91.4 $111.6 $112.5 $103.1 $106.1 Deere & Company Forecast as of 17 August 2011 (Previous Forecast as of 18 May 2011) 61 |
|
|
Deere’s fourth quarter 2011 conference call is scheduled for 9:00 a.m. central time on Wednesday, November 23, 2011 62 |