Attached files
| file | filename |
|---|---|
| 8-K - ROSE UPDATED COMPANY PRESENTATION - NBL Texas, LLC | rosepres.htm |
Rosetta Resources Inc.
Speaker: Randy L. Limbacher
August 2011
www.rosettaresources.com / NASDAQ: ROSE
High Asset Quality - Executing Business Plan - Future Growth Catalysts - Financial Strength
Exhibit 99.1

2
– Doubled proved reserves to 970 Bcfe at mid-year 2011.
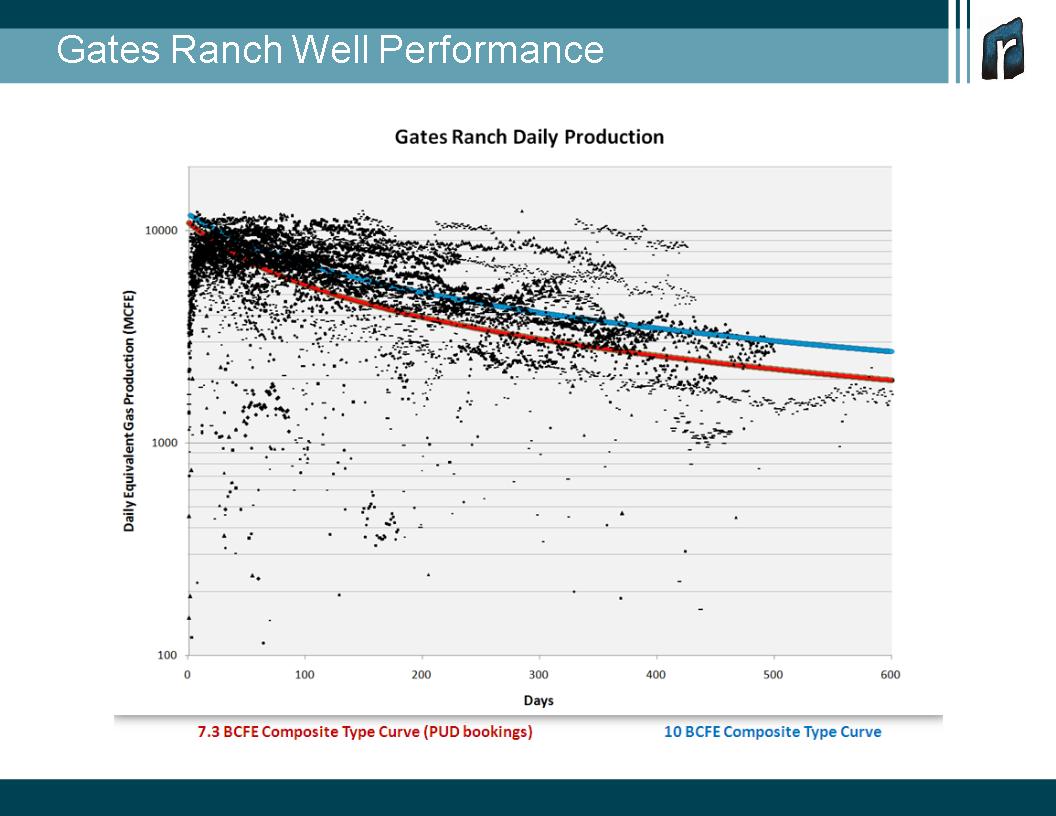
– Increased gross estimated ultimate recovery to 10 Bcfe per
Gates Ranch Eagle Ford well.
Gates Ranch Eagle Ford well.
– Set record levels of daily equivalent gas and liquids
production.
production.
– Expanded Southern Alberta Basin horizontal drilling program.
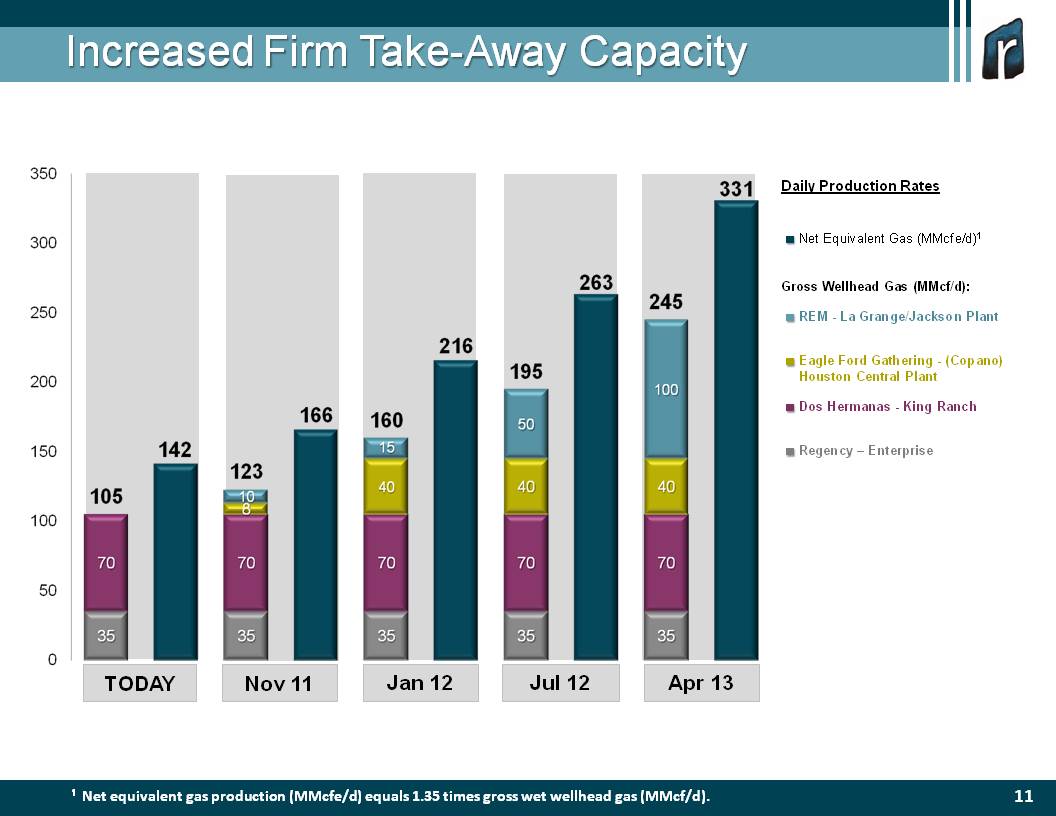
– Increased daily firm transportation and processing capacity
from Eagle Ford by 20 percent.
from Eagle Ford by 20 percent.
– Increased 2011 Capital Budget to $475 million.
Year-to-Date Highlights

3
– Asset Base High Graded
– Executing Business Plan
– Testing Growth Catalysts
– Financial Strength
Agenda

4
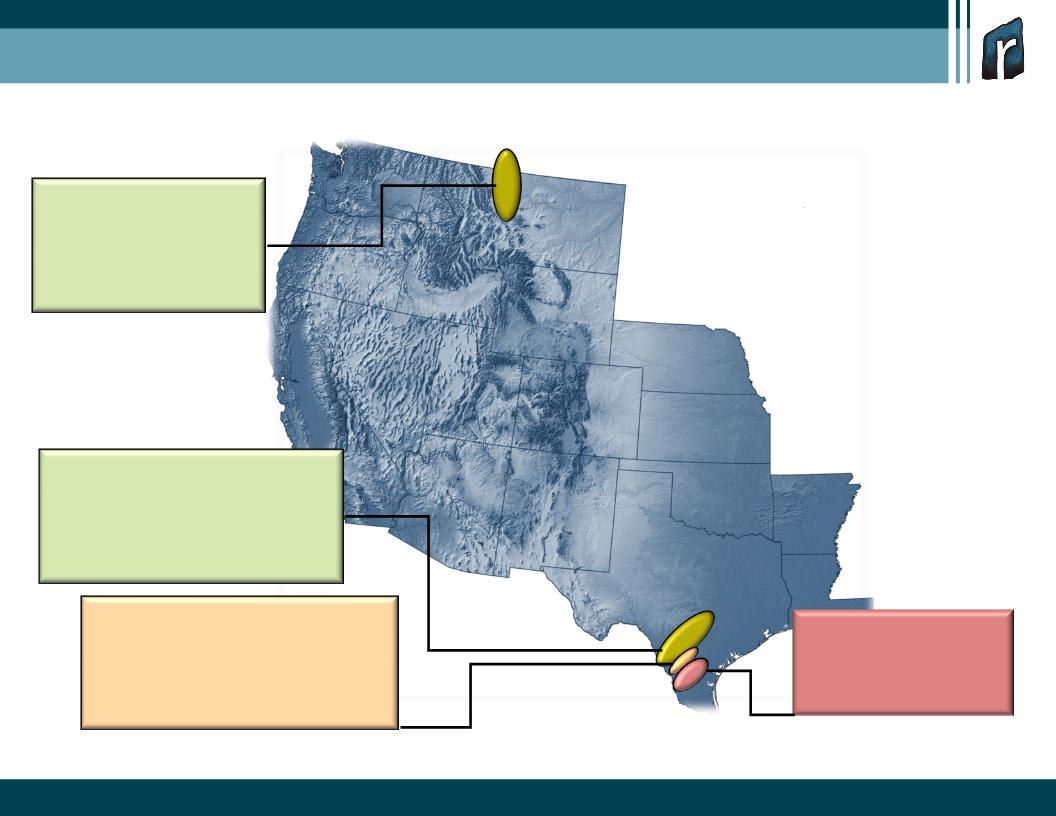
Asset Base High Graded
5
Alberta Basin
300,000 net acres
6 BBOE hydrocarbon resource in place
1500 potential locations
Exploration underway
11 delineation wells completed
7 horizontal wells planned (2011)
Eagle Ford Liquids
50,000 net acres
20 TCFE hydrocarbon resource in place
450 potential remaining locations (excluding infill)
36 horizontal wells completed*
125 MMcfe/d net*
6-10 years of potential remaining inventory
Eagle Ford Dry Gas
15,000 net acres
5 TCFE hydrocarbon resource in place
145 potential locations (excluding infill)
4 horizontal wells completed*
5 MMcfe/d net*
3-4 years of remaining inventory
South Texas
(Non-Eagle Ford)
100,000 net acres
Numerous stacked reservoirs
20 MMcfe/d net*
* End of 2Q 2011
Asset Base High Graded
6
Executing Business Plan
7
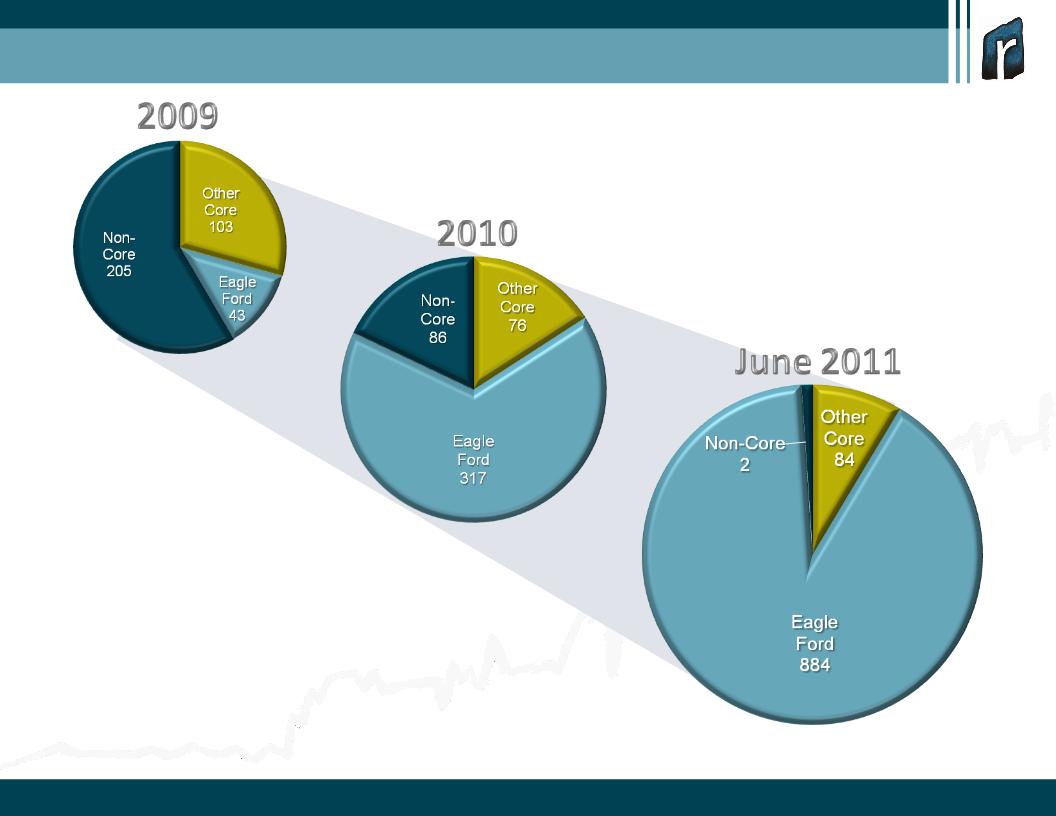
Proved Reserves - Doubled Since YE 2010
■ Eagle Ford
■ Other Core
■ Non-Core
351 Bcfe
479 Bcfe
970 Bcfe

8
Year-end 2011: 58 wells*
* Completed wells
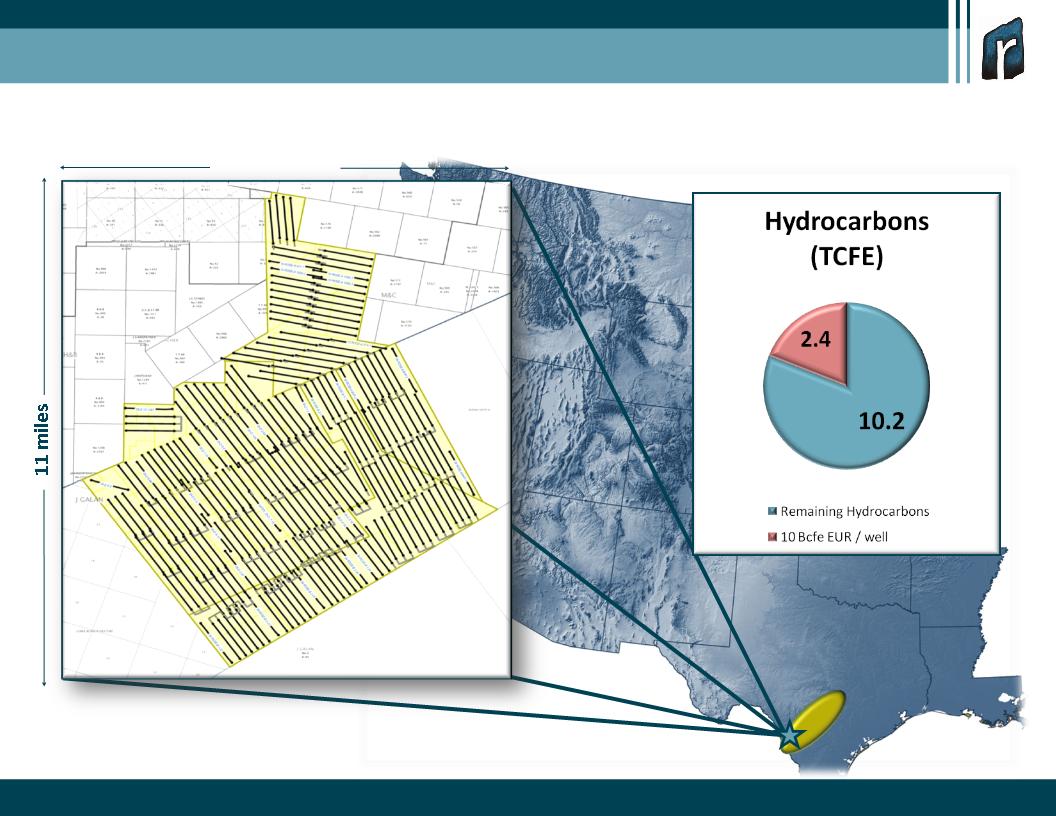
9 miles
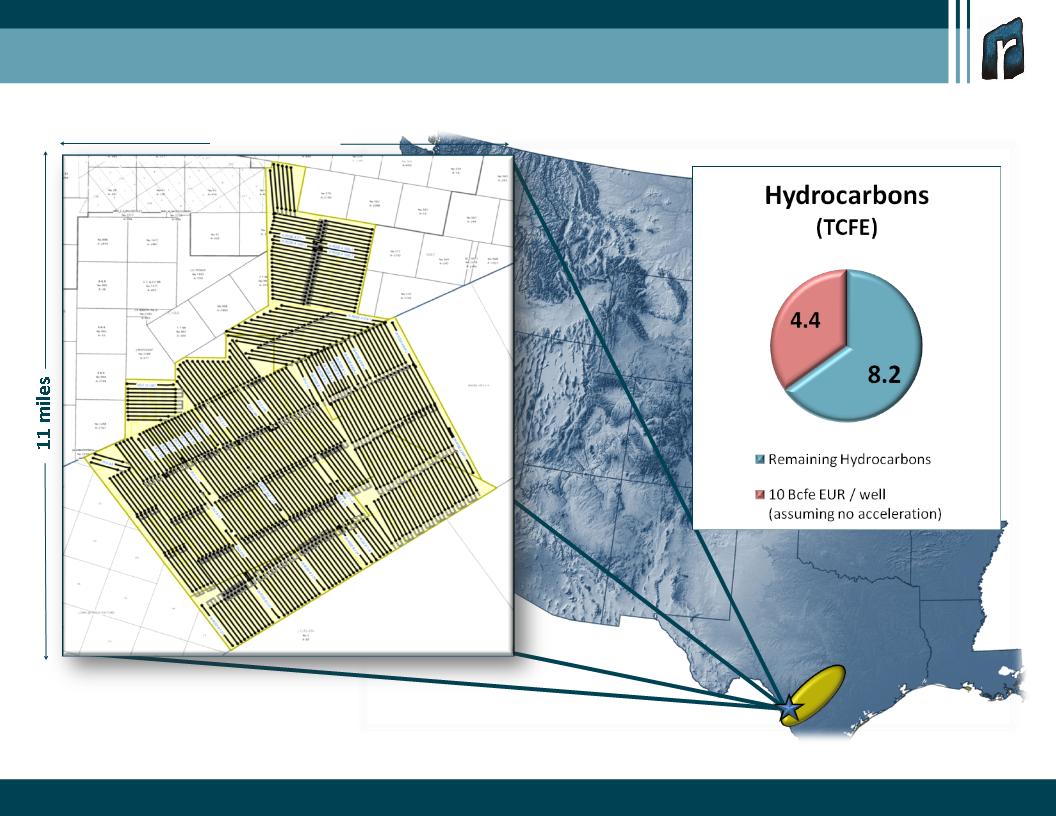
More than 12 TCFE of “hydrocarbons in place” have been delineated and are
now being exploited…
now being exploited…
Gates Ranch
9
10
Field Development: 236 wells*
*Excludes infill drilling
9 miles
Using our current development pace, well spacing, and type curve, we will have continued
development through 2016…while recovering approximately 20% of the hydrocarbons in place…
development through 2016…while recovering approximately 20% of the hydrocarbons in place…
Gates Ranch
12
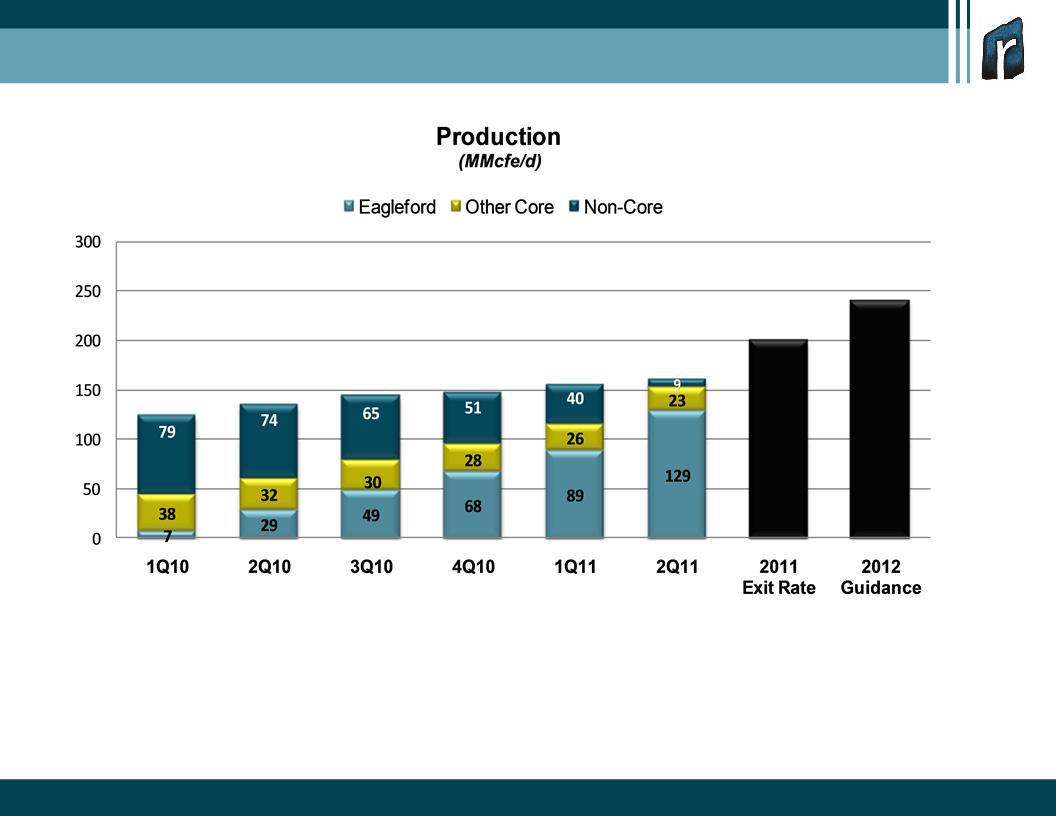
Strong Exit Rates and 2012 Growth Projected
190-200
220-240

13
Testing Growth Catalysts
14
* Includes 50- to 60-acre infill drilling which will be tested during the latter part of 2011.
Field Development: 441 wells*
9 miles
Gates Ranch Infill Drilling
15
|
Area
|
Window
|
Net
Acreage |
|
Gates Ranch
|
Liquids
|
26,500
|
|
Non-Gates Ranch
|
Liquids
|
23,500
|
|
Encinal Area
|
Dry Gas
|
15,000
|
|
TOTAL
|
|
65,000
|
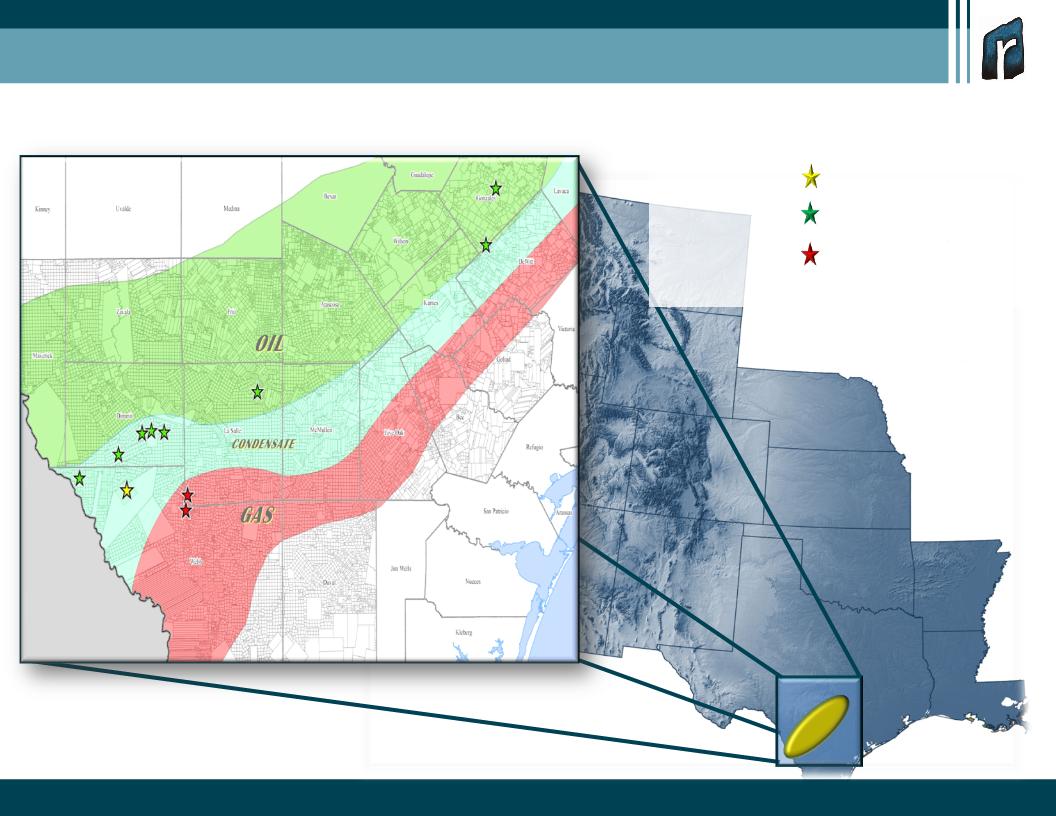
Other Eagle Ford Areas
16
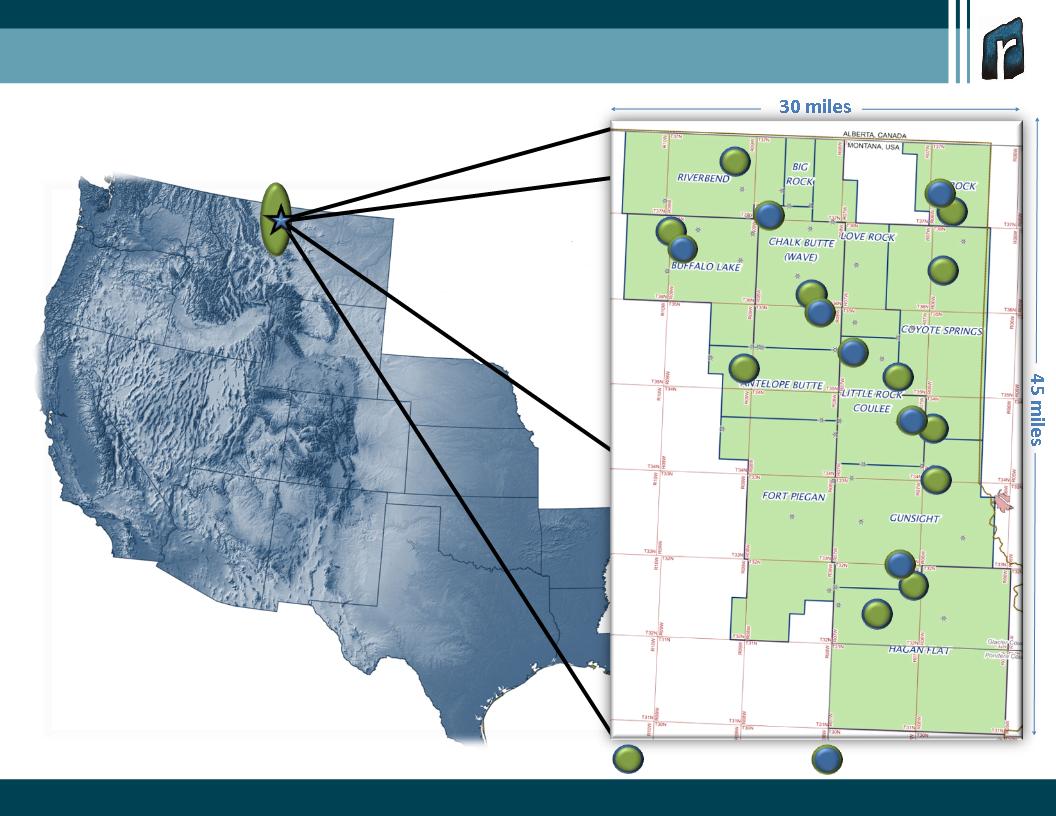
Delineation Wells (11)
Current 7-well HZ Program
Expanded Southern Alberta Basin Horizontal Drilling
17
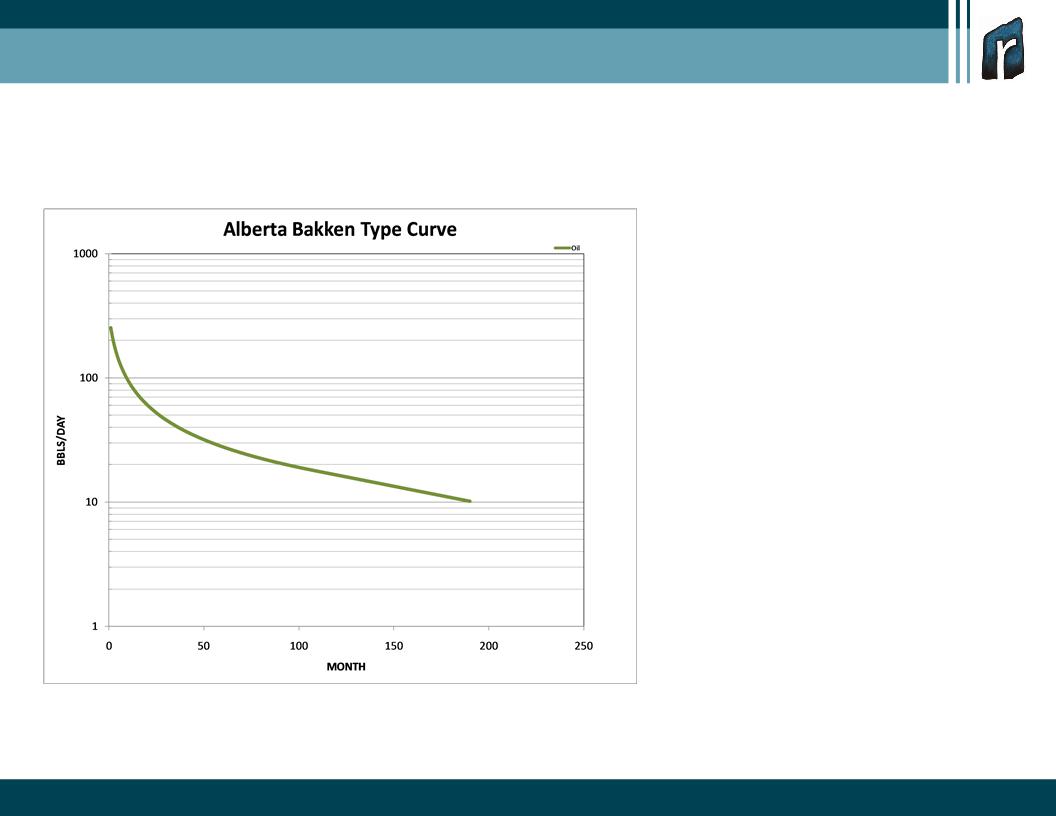
Well Performance Parameters
§ 250 IP BOEPD (gross)
§ 185,000 BOE EUR (gross)
§ 160-acre spacing
§ $4 million well costs
Southern Alberta Basin
Representative Base Case Economic Model
|
Per Well Economics (BFIT)
|
||
|
Pricing ($/BBL WTI)
|
$85
|
$95
|
|
ROR (%)
|
21.3
|
35.1
|
|
NPV 10% ($M)
|
931
|
1,926
|
|
F/D ($/BOE)
|
27.46
|
27.46
|

18
Financial Strength

19
Lower Cost Structure
|
|
Six Months Ended
|
||||||
|
S/Mcfe
|
|
June 30, 2011
(Actual)
|
|
|
July-December, 2011
(Guidance Range)
|
||
|
Direct LOE
|
$
|
0.59
|
|
$
|
0.36
|
$
|
0.40
|
|
Workovers
|
|
0.02
|
|
|
0.02
|
|
0.03
|
|
Insurance
|
|
0.02
|
|
|
0.02
|
|
0.02
|
|
Ad Valorem Tax
|
|
0.19
|
|
|
0.10
|
|
0.12
|
|
Production Taxes
|
|
0.16
|
|
|
0.18
|
|
0.22
|
|
Treating, Transportation & Marketing
|
|
0.29
|
|
|
0.60
|
|
0.66
|
|
G&A, excluding stock-based compensation
|
|
0.74
|
|
|
0.56
|
|
0.62
|
|
Interest Expense
|
|
0.40
|
|
|
0.29
|
|
0.32
|
|
DD&A
|
|
2.36
|
|
|
1.73
|
|
1.91
|
20
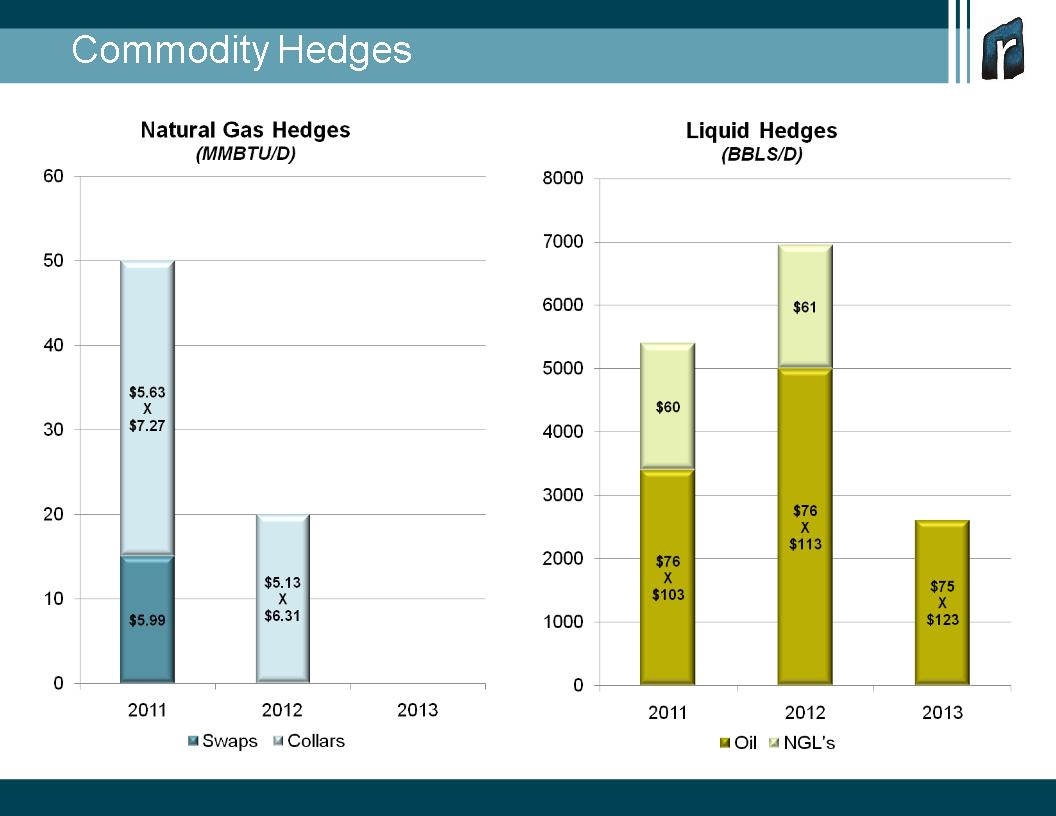
50
20
6,950
5,400
3,750
21
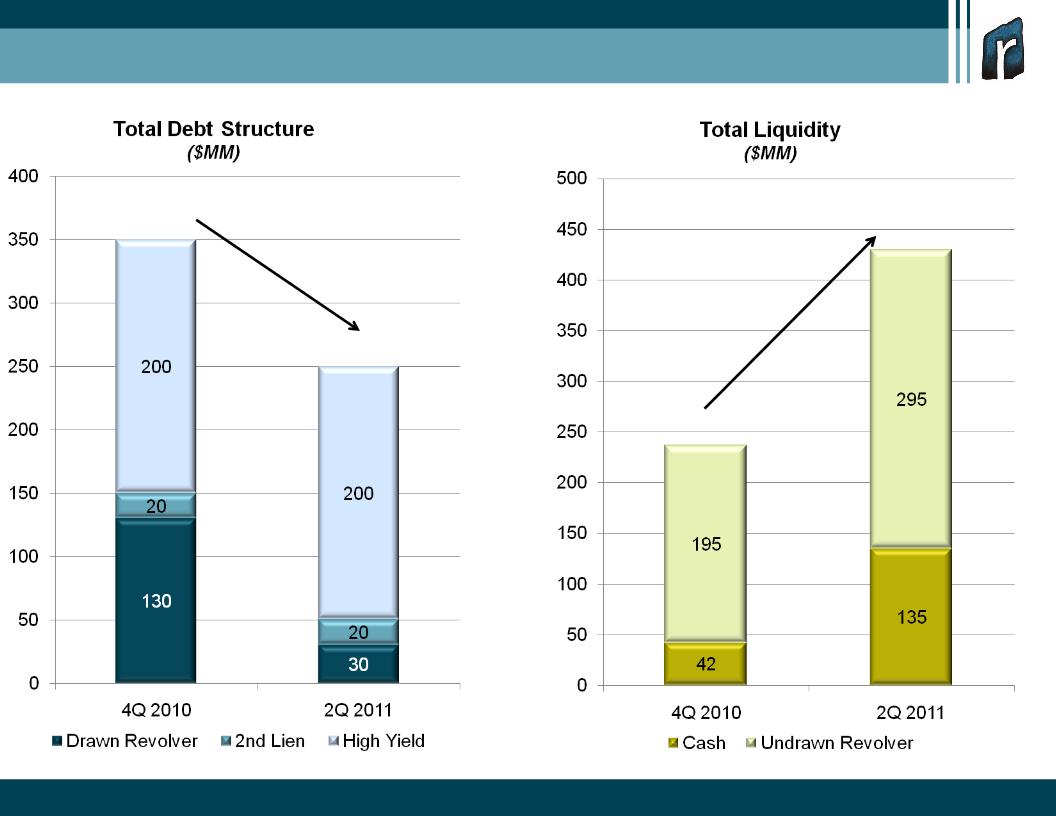
Debt and Liquidity
350
250
430
237

22
|
(MM)
|
2Q 2011
|
4Q 2010
|
|
Long-Term Debt
|
$250
|
$350
|
|
Total Stockholder’s Equity
|
547
|
529
|
|
TOTAL
|
$797
|
$879
|
|
|
|
|
|
Capitalization
|
|
|
|
- Debt
|
31%
|
40%
|
|
- Capital
|
69%
|
60%
|
|
TOTAL
|
100%
|
100%
|
Capital Structure

23
– Asset Base High Graded
– Divestiture program complete
– South Texas focus
– Alberta Basin option
– Strong Eagle Ford project inventory
– Executing Business Plan
– Proved reserves doubled since 12/31/10
– Gates Ranch recoveries increased
– Increased firm take-away capacity
– Strong exit rates and 2012 growth projected
– Testing Growth Catalysts
– Gates Ranch infill
– Other Eagle Ford areas
– Expanded Alberta Basin horizontal program
– Financial Strength
– Lower cost structure
– $430MM in liquidity
Summary

24
This presentation includes forward-looking statements, which give the Company's current expectations or
forecasts of future events based on currently available information. Forward-looking statements are
statements that are not historical facts, such as expectations regarding drilling plans, including the
acceleration thereof, production rates and guidance, resource potential, incremental transportation capacity,
exit rate guidance, net present value, development plans, progress on infrastructure projects, exposures to
weak natural gas prices, changes in the Company's liquidity, changes in acreage positions, expected
expenses, expected capital expenditures, and projected debt balances. The assumptions of management and
the future performance of the Company are subject to a wide range of business risks and uncertainties and
there is no assurance that these statements and projections will be met. Factors that could affect the
Company's business include, but are not limited to: the risks associated with drilling of oil and natural gas
wells; the Company's ability to find, acquire, market, develop, and produce new reserves; the risk of drilling
dry holes; oil and natural gas price volatility; derivative transactions (including the costs associated therewith
and the abilities of counterparties to perform thereunder); uncertainties in the estimation of proved, probable,
and possible reserves and in the projection of future rates of production and reserve growth; inaccuracies in
the Company's assumptions regarding items of income and expense and the level of capital expenditures;
uncertainties in the timing of exploitation expenditures; operating hazards attendant to the oil and natural gas
business; drilling and completion losses that are generally not recoverable from third parties or insurance;
potential mechanical failure or underperformance of significant wells; availability and limitations of capacity in
midstream marketing facilities, including processing plant and pipeline construction difficulties and operational
upsets; climatic conditions; availability and cost of material, supplies, equipment and services; the risks
associated with operating in a limited number of geographic areas; actions or inactions of third-party operators
of the Company's properties; the Company's ability to retain skilled personnel; diversion of management's
attention from existing operations while pursuing acquisitions or dispositions; availability of capital; the
strength and financial resources of the Company's competitors; regulatory developments; environmental risks;
uncertainties in the capital markets; general economic and business conditions (including the effects of the
worldwide economic recession); industry trends; and other factors detailed in the Company's most recent
Form 10-K, Form 10Q and other filings with the Securities and Exchange Commission. If one or more of these
risks or uncertainties materialize (or the consequences of such a development changes), or should underlying
assumptions prove incorrect, actual outcomes may vary materially from those forecasted or expected. The
Company undertakes no obligation to publicly update or revise any forward-looking statements except as
required by law.
Forward-Looking Statements and Terminology Used

25
For filings reporting year-end 2010 reserves, the SEC permits the optional disclosure of probable and possible
reserves. The Company has elected not to report probable and possible reserves in its filings with the
SEC. We use the term “net risked resources” to describe the Company’s internal estimates of volumes of
natural gas and oil that are not classified as proved reserves but are potentially recoverable through
exploratory drilling or additional drilling or recovery techniques. Estimates of unproved resources are by their
nature more speculative than estimates of proved reserves and accordingly are subject to substantially greater
risk of actually being realized by the Company. Estimates of unproved resources may change significantly as
development provides additional data, and actual quantities that are ultimately recovered may differ
substantially from prior estimates. We use the term “BFIT NPV10” to describe the Company’s estimate of
before income tax net present value discounted at 10 percent resulting from project economic evaluation. The
net present value of a project is calculated by summing future cash flows generated by a project, both inflows
and outflows, and discounting those cash flows to arrive at a present value. Inflows primarily include revenues
generated from estimated production and commodity prices at the time of the analysis. Outflows include
drilling and completion capital and operating expenses. Net present value is used to analyze the profitability of
a project. Estimates of net present value may change significantly as additional data becomes available, and
with adjustments in prior estimates of actual quantities of production and recoverable reserves, commodity
prices, capital expenditures, and/or operating expenses.
Forward-Looking Statements and Terminology Used (cont.)