Attached files
| file | filename |
|---|---|
| EX-32.2 - EXHIBIT 32.2 - UNIVERSAL TRAVEL GROUP | v230103_ex32-2.htm |
| EX-31.2 - EXHIBIT 31.2 - UNIVERSAL TRAVEL GROUP | v230103_ex31-2.htm |
| EX-32.1 - EXHIBIT 32.1 - UNIVERSAL TRAVEL GROUP | v230103_ex32-1.htm |
| EX-31.1 - EXHIBIT 31.1 - UNIVERSAL TRAVEL GROUP | v230103_ex31-1.htm |
UNITED STATES
SECURITIES AND EXCHANGE COMMISSION
Washington, D.C. 20549
FORM 10-Q
(Mark One)
|
x
|
QUARTERLY REPORT PURSUANT TO SECTION 13 OR 15(d) OF THE SECURITIES EXCHANGE ACT OF 1934
|
For the quarterly period ended June 30, 2011
|
¨
|
TRANSITION REPORT PURSUANT TO SECTION 13 OR 15(d) OF THE EXCHANGE ACT
|
For the transition period from ______________ to _____________
Commission file number: 001-34284
UNIVERSAL TRAVEL GROUP
(Exact name of registrant as specified in its charter)
|
Nevada
|
90-0296536
|
|
|
(State or other jurisdiction of incorporation or
|
(I.R.S. Employer Identification No.)
|
|
|
organization)
|
|
9F, Building A, Rongchao Marina Bay Center
|
|
|
|
NO. 2021 Haixiu Road, Bao’an District, Shenzhen
|
||
|
People’s Republic of China
|
518133
|
|
|
(Address of principal executive offices)
|
(Zip Code)
|
|
86 755 836 68489
|
|
(Registrant’s telephone number, including area code)
|
|
(Former name, former address and former fiscal year, if changed since last report)
|
Indicate by check mark whether the registrant (1) has filed reports required to be filed by Section 13 or 15(d) of the Securities Exchange Act of 1934 during the preceding 12 months (or for such shorter period that the registrant was required to file such reports), and (2) has been subject to such filing requirements for the past 90 days. Yes x No ¨
Indicate by check mark whether the registrant has submitted electronically and posted on its corporate Web site, if any, every Interactive Data File required to be submitted and posted pursuant to Rule 405 of Regulation S-T (§232.405 of this chapter) during the preceding 12 months (or for such shorter period that the registrant was required to submit and post such files). Yes x No ¨
Indicate by check mark whether the registrant is a large accelerated filer, an accelerated filer, a non-accelerated filer, or a smaller reporting company. See the definitions of “large accelerated filer”, “accelerated filer” and “smaller reporting company” in Rule 12b-2 of the Exchange Act.
|
Large accelerated filer
|
¨
|
Accelerated filer
|
¨
|
|
Non-accelerated filer
|
¨
|
Smaller reporting company
|
x
|
Indicate by check mark whether the registrant is a shell company (as defined in Rule 12b-2 of the Exchange Act). Yes ¨ No x
APPLICABLE ONLY TO ISSUERS INVOLVED IN BANKRUPTCY
PROCEEDINGS DURING THE PRECEDING FIVE YEARS
Indicate by check mark whether the registrant has filed all documents and reports required to be filed by Sections 12, 13, or 15(d) of the Securities Exchange Act of 1934 subsequent to the distribution of securities under a plan confirmed by a court. Yes ¨ No ¨
APPLICABLE ONLY TO CORPORATE ISSUERS
Indicate the number of shares outstanding of each of the issuer’s classes of common equity, as of the latest practicable date:
As of August 15, 2011, there were 19,898,235 shares of $0.001 par value common stock issued and outstanding.
FORM 10-Q
UNIVERSAL TRAVEL GROUP
INDEX
|
Page
|
||||
|
PART I.
|
Financial Information
|
|
||
|
Item 1. Financial Statements (Unaudited).
|
|
|||
|
Report of Independent Registered Public Accounting Firm
|
|
|||
|
Condensed Consolidated Balance Sheets as of June 30, 2011 (Unaudited) and December 31, 2010
|
1
|
|||
|
Unaudited Condensed Consolidated Statements of Income and Comprehensive Income for the Three and Six Months Ended June 30, 2011 and 2010
|
2
|
|||
|
Unaudited Condensed Consolidated Statements of Cash Flows for the Six Months Ended June 30, 2011 and 2010
|
3
|
|||
|
Notes to Unaudited Condensed Consolidated Financial Statements as of June 30, 2011
|
4
|
|||
|
Item 2. Management’s Discussion and Analysis of Financial Condition and Results of Operations.
|
18
|
|||
|
Item 3. Quantitative and Qualitative Disclosures About Market Risk.
|
30
|
|||
|
Item 4. Controls and Procedures.
|
30
|
|||
|
PART II.
|
Other Information
|
30
|
||
|
Item 1. Legal Proceedings.
|
30
|
|||
|
Item 1A. Risk Factors.
|
31
|
|||
|
Item 2. Unregistered Sales of Equity Securities and Use of Proceeds.
|
31
|
|||
|
Item 3. Defaults Upon Senior Securities.
|
31
|
|||
|
Item 4. (Removed and Reserved).
|
31
|
|||
|
Item 5. Other Information.
|
31
|
|||
|
Item 6. Exhibits.
|
31
|
PART I - FINANCIAL INFORMATION
Item 1. Financial Statements (Unaudited)
UNIVERSAL TRAVEL GROUP
CONSOLIDATED FINANCIAL STATEMENTS
JUNE 30, 2011
REPORT OF INDEPENDENT REGISTERED PUBLIC ACCOUNTING FIRM
To the Board of Directors and
Stockholders of Universal Travel Group
We have reviewed the accompanying consolidated balance sheet of Universal Travel Group as of June 30, 2011, and the related consolidated statements of income and comprehensive income for the three-month and six-month periods ended June 30, 2011 and 2010 and cash flows for the six-month periods ended June 30, 2011 and 2010. These consolidated financial statements are the responsibility of the company’s management.
We conducted our review in accordance with the standards of the Public Company Accounting Oversight Board (United States). A review of interim financial information consists principally of applying analytical procedures and making inquiries of persons responsible for financial and accounting matters. It is substantially less in scope than an audit conducted in accordance with standards of the Public Company Accounting Oversight Board (United States), the objective of which is the expression of an opinion regarding the consolidated financial statements taken as a whole. Accordingly, we do not express such an opinion.
Based on our review, we are not aware of any material modifications that should be made to the accompanying consolidated financial statements for them to be in conformity with accounting principles generally accepted in the United States of America.
/s/ EFP Rotenberg, LLP
EFP Rotenberg, LLP
Rochester, New York
August 15, 2011
TABLE OF CONTENTS
|
Consolidated Condensed Balance Sheets
|
1
|
|
|
Unaudited Condensed Consolidated Statements of Income and Comprehensive Income
|
2
|
|
|
Unaudited Condensed Consolidated Statements of Cash Flows
|
3
|
|
|
Notes to the Unaudited Condensed Consolidated Financial Statements
|
4- 17
|
UNIVERSAL TRAVEL GROUP
CONDENSED CONSOLIDATED BALANCE SHEETS
|
June 30,
|
December 31,
|
|||||||
|
2011
|
2010
|
|||||||
|
Unaudited
|
||||||||
|
ASSETS
|
||||||||
|
Cash and cash equivalents
|
$ | 41,807,581 | $ | 39,618,988 | ||||
|
Restricted Cash
|
987,158 | 307,027 | ||||||
|
Short term investments
|
38,991,181 | 19,681,308 | ||||||
|
Accounts receivable, net
|
30,191,899 | 38,658,011 | ||||||
|
Other receivables and deposits, net
|
659,165 | 780,400 | ||||||
|
Trade deposit
|
8,415,816 | 8,173,426 | ||||||
|
Prepayments
|
1,698,726 | 1,216,857 | ||||||
|
Note receivable
|
- | 2,314,259 | ||||||
|
Total Current Assets
|
122,751,526 | 110,750,276 | ||||||
|
Property & equipment, net
|
1,518,857 | 1,692,595 | ||||||
|
Intangible assets, net
|
2,766,580 | 3,110,882 | ||||||
|
Goodwill
|
24,508,909 | 24,508,909 | ||||||
|
Total Noncurrent Assets
|
28,794,346 | 29,312,386 | ||||||
|
Total Assets
|
$ | 151,545,872 | $ | 140,062,662 | ||||
|
LIABILITIES AND STOCKHOLDERS' EQUITY
|
||||||||
|
Current Liabilities
|
||||||||
|
Accounts payable and accrued expenses
|
$ | 5,464,925 | $ | 5,045,674 | ||||
|
Customer deposits
|
2,067,956 | 2,203,487 | ||||||
|
Income tax payable
|
1,944,629 | 3,189,965 | ||||||
|
Total Current Liabilities
|
9,477,510 | 10,439,126 | ||||||
|
Warrants - derivative liability
|
365,713 | 810,929 | ||||||
|
Deferred tax liability
|
477,397 | 477,397 | ||||||
|
Long-term income tax payable
|
30,804 | 30,804 | ||||||
|
Total Liabilities
|
10,351,424 | 11,758,256 | ||||||
|
Stockholders' Equity
|
||||||||
|
Common stock, $.001 par value, 70,000,000 shares authorized, 19,898,235 issued and outstanding at June 30, 2011 and December 31, 2010, respectively
|
19,898 | 19,898 | ||||||
|
Preferred stock, $0.001 par value, 5,000,000 shares authorized, no shares issued and outstanding at June 30, 2011 and December 31, 2010, respectively.
|
- | - | ||||||
|
Additional paid in capital
|
65,825,734 | 64,171,555 | ||||||
|
Statutory reserve
|
1,062,741 | 1,062,741 | ||||||
|
Retained earnings
|
68,521,489 | 59,624,186 | ||||||
|
Accumulated other comprehensive income
|
5,764,586 | 3,426,026 | ||||||
|
Total Stockholders' Equity
|
141,194,448 | 128,304,406 | ||||||
|
Total Liabilities and Stockholders' Equity
|
$ | 151,545,872 | $ | 140,062,662 | ||||
The accompanying notes are an integral part of these unaudited condensed consolidated financial statements.
1
UNIVERSAL TRAVEL GROUP
UNAUDITED CONDENSED CONSOLIDATED
STATEMENTS OF INCOME AND COMPREHENSIVE INCOME
FOR THE THREE AND SIX MONTHS ENDED JUNE 30,
|
For the six months ended June 30,
|
For the three months ended June 30,
|
|||||||||||||||
|
2011
|
2010
|
2011
|
2010
|
|||||||||||||
|
Restated
|
Restated
|
|||||||||||||||
|
Revenues
|
||||||||||||||||
|
Air ticketing, net
|
$ | 10,280,773 | $ | 8,702,488 | $ | 5,020,345 | $ | 4,796,513 | ||||||||
|
Hotel reservation, net
|
6,389,731 | 6,462,123 | 2,695,778 | 3,432,017 | ||||||||||||
|
Packaged tours, gross
|
49,986,767 | 37,127,291 | 25,145,655 | 23,637,593 | ||||||||||||
| 66,657,271 | 52,291,902 | 32,861,778 | 31,866,123 | |||||||||||||
|
Cost of services
|
||||||||||||||||
|
Air ticketing, net
|
3,773,987 | 2,833,290 | 1,857,664 | 1,465,419 | ||||||||||||
|
Hotel reservation, net
|
1,537,696 | 1,979,573 | 163,312 | 981,156 | ||||||||||||
|
Packaged tours, gross
|
43,721,220 | 32,491,924 | 22,091,650 | 20,688,727 | ||||||||||||
| 49,032,903 | 37,304,787 | 24,112,626 | 23,135,302 | |||||||||||||
|
Gross Profit
|
17,624,368 | 14,987,115 | 8,749,152 | 8,730,821 | ||||||||||||
|
Selling, general and administrative expenses
|
(5,571,512 | ) | (3,643,184 | ) | (2,573,414 | ) | (2,077,197 | ) | ||||||||
|
Income from operations
|
12,052,856 | 11,343,931 | 6,175,738 | 6,653,624 | ||||||||||||
|
Other income (expense)
|
||||||||||||||||
|
Other income (expense)
|
(17,502 | ) | 6,917 | (3,112 | ) | 3,363 | ||||||||||
|
Gain on change of fair value of derivative liabilities
|
445,216 | 949,004 | 95,404 | 839,553 | ||||||||||||
|
Interest income
|
234,821 | 38,711 | 117,287 | 16,522 | ||||||||||||
|
Total other income
|
662,535 | 994,632 | 209,579 | 859,438 | ||||||||||||
|
Income before income taxes
|
12,715,391 | 12,338,563 | 6,385,317 | 7,513,062 | ||||||||||||
|
Provision for income taxes
|
3,818,088 | 3,061,550 | 1,943,544 | 1,782,484 | ||||||||||||
|
Net Income
|
$ | 8,897,303 | $ | 9,277,013 | $ | 4,441,773 | $ | 5,730,578 | ||||||||
|
Comprehensive Income
|
||||||||||||||||
|
Net income
|
$ | 8,897,303 | $ | 9,277,013 | $ | 4,441,773 | $ | 5,730,578 | ||||||||
|
Foreign currency translation adjustments
|
2,338,560 | (454,079 | ) | 1,417,639 | 49,825 | |||||||||||
|
Total Comprehensive income
|
$ | 11,235,863 | $ | 8,822,934 | $ | 5,859,412 | $ | 5,780,403 | ||||||||
|
Net income per common share
|
||||||||||||||||
|
Basic
|
$ | 0.45 | $ | 0.54 | $ | 0.22 | $ | 0.33 | ||||||||
|
Diluted
|
$ | 0.44 | $ | 0.52 | $ | 0.22 | $ | 0.31 | ||||||||
|
Weighted average common shares outstanding
|
||||||||||||||||
|
Basic
|
19,898,235 | 17,066,154 | 19,898,235 | 17,404,834 | ||||||||||||
|
Diluted
|
20,142,816 | 17,935,313 | 19,940,736 | 18,219,639 | ||||||||||||
The accompanying notes are an integral part of these unaudited condensed consolidated financial statements.
2
UNIVERSAL TRAVEL GROUP
UNAUDITED CONDENSED CONSOLIDATED STATEMENTS OF CASH FLOWS
FOR THE SIX MONTHS ENDED JUNE 30,
|
2011
|
2010
|
|||||||
|
CASH FLOWS FROM OPERATING ACTIVITIES
|
||||||||
|
Net income
|
$ | 8,897,303 | $ | 9,277,013 | ||||
|
Add:
|
||||||||
|
Adjustments to reconcile net income to net cash provided by operating activities:
|
||||||||
|
Depreciation and amortization
|
616,591 | 763,707 | ||||||
|
Provision for doubtful accounts
|
- | 56,824 | ||||||
|
Stock based compensation
|
1,654,180 | 677,004 | ||||||
|
(Gain)/Loss on change in fair value of derivative liabilities
|
(445,216 | ) | (949,004 | ) | ||||
|
(Increase) / decrease in assets:
|
||||||||
|
Restricted cash
|
(665,993 | ) | (542 | ) | ||||
|
Accounts receivable
|
9,257,884 | (2,068,457 | ) | |||||
|
Other receivable
|
137,740 | (726,410 | ) | |||||
|
Due from related parties
|
- | (6,986,717 | ) | |||||
|
Advances
|
- | 440,063 | ||||||
|
Prepayments
|
(449,086 | ) | (1,676,062 | ) | ||||
|
Trade deposits
|
(53,641 | ) | 2,077,455 | |||||
|
Escrow deposits
|
- | - | ||||||
|
Increase / (decrease) in current liabilities:
|
||||||||
|
Accounts payable and accrued expenses
|
299,899 | 3,358,139 | ||||||
|
Customer deposits
|
(184,306 | ) | (682,465 | ) | ||||
|
Income tax payable
|
(1,304,929 | ) | 49,711 | |||||
|
Net cash provided by operating activities
|
17,760,426 | 3,610,258 | ||||||
|
CASH FLOWS FROM INVESTING ACTIVITIES
|
||||||||
|
Purchase of property & equipment
|
(62,662 | ) | (1,864,774 | ) | ||||
|
Purchase of intangibles
|
- | (51,359 | ) | |||||
|
(Increase)/Decrease in short term investments
|
(18,658,694 | ) | - | |||||
|
(Increase)/Decrease in notes receivable
|
2,342,675 | 1,484,210 | ||||||
|
Acquisition deposits
|
- | 478,391 | ||||||
|
Cash paid for acquisition – net of cash acquired
|
- | (15,782,799 | ) | |||||
|
Net cash (used in) investing activities
|
(16,378,681 | ) | (15,736,331 | ) | ||||
|
CASH FLOWS FROM FINANCING ACTIVITIES
|
||||||||
|
Proceeds of equity financing
|
- | 18,768,054 | ||||||
|
Net cash provided by financing activities
|
- | 18,768,054 | ||||||
|
Effect of exchange rate changes on cash and cash equivalents
|
806,848 | 271,514 | ||||||
|
Net change in cash and cash equivalents
|
2,188,593 | 6,913,495 | ||||||
|
Cash and cash equivalents, beginning balance
|
39,618,988 | 36,574,741 | ||||||
|
Cash and cash equivalents, ending balance
|
$ | 41,807,581 | $ | 43,488,236 | ||||
|
SUPPLEMENTAL DISCLOSURES:
|
||||||||
|
Cash paid during the period for:
|
||||||||
|
Interest payments
|
$ | - | $ | - | ||||
|
Income taxes
|
$ | 5,063,424 | $ | 2,380,077 | ||||
|
Purchased goodwill
|
$ | - | $ | (14,612,639 | ) | |||
|
Purchased intangible assets
|
- | (3,236,376 | ) | |||||
|
Fair value of assets purchased less cash acquired
|
- | (767,602 | ) | |||||
|
Acquisition financed with stock issuance
|
- | 2,833,818 | ||||||
|
Acquisition paid for with cash - net of acquired
|
$ | - | $ | (15,782,799 | ) | |||
The accompanying notes are an integral part of these unaudited condensed consolidated financial statements.
3
UNIVERSAL TRAVEL GROUP
NOTES TO UNAUDITED CONDENSED CONSOLIDATED FINANCIAL STATEMENTS
JUNE 30, 2011
Note 1 - ORGANIZATION
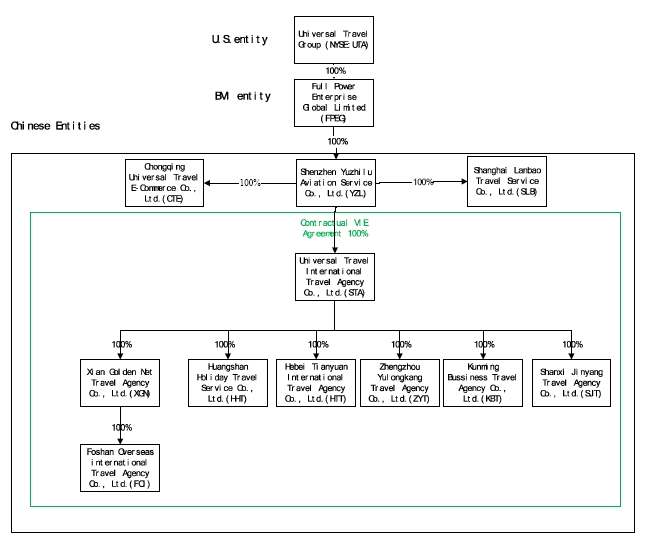
Universal Travel Group was incorporated on January 28, 2004 under the laws of the State of Nevada. Full Power Enterprise Global Limited was incorporated under the laws of the British Virginia Islands. Shenzhen Yuzhilu Aviation Service Co., Ltd. was incorporated on March 9, 1998 under the laws of the People’s Republic of China (PRC)., Xi’an Golden Net Travel Serve Services was incorporated on July 25, 2001 under the laws of PRC, Shanghai Lanbao Travel Service Co., Ltd. was established in 2002 under the laws of PRC. Foshan Overseas International Travel Service Co., Ltd. was incorporated in 1990 under the laws of PRC, Chongqing Universal Travel E-Commerce Co., Ltd. and Universal Travel International Travel Agency Co., Ltd. (formerly named Shenzhen Universal Travel Agency Co., Ltd.) were both incorporated in 2009 under the laws of PRC, Hebei Tianyuan Travel Agency Co., Ltd. was incorporated in April 1999 under the laws of PRC, Huangshan Holiday Travel Service Co., Ltd. was incorporated in April 1999 under the laws of PRC, Zhengzhou Yulongkang Travel Agency Co., Ltd. was incorporated in 2000 under the laws of PRC, Kunming Business Travel Service Co., Ltd. was incorporated in 1993 under the laws of PRC, Shanxi Jinyang Travel Agency Co., Ltd. was incorporated in 1988 under the laws of PRC. Collectively these corporations are referred to herein as the Company.
Universal Travel Group owns 100% of the equity interest in Full Power Enterprise Global Limited, which in turn owns 100% of the equity interest in Shenzhen Yuzhilu Aviation Service Co., Ltd., a wholly owned foreign entity in the PRC. Universal Travel Group and Full Power Enterprise Global Limited do not conduct any substantive operations of their own. Instead, all operations of the consolidated company are conducted through its subsidiary, Shenzhen Yuzhilu Aviation Service Co., Ltd. (“YZL”). YZL and its subsidiaries, and various variable interest entities, collectively, related to herein as subsidiaries.
In 2007 and 2009, YZL entered into certain shareholding agreements with various related PRC residents and Shenzhen Yuzhixing Aviation Service, Co. Limited (“Party B”) to hold YZL shares of ownership of Xi’an Golden Net Travel Serve Services Co., Ltd. (“XGN”) and Universal Travel International Travel Agency Co., Ltd., formerly known as Shenzhen Universal Travel Agency Co., Ltd. (“STA”).The significant details of the agreements and other important information, among others, are outlined below:
Universal Travel Group funded the start up activities and incorporation of XGN and STA and related subsidiaries, through cash or common stock issuance;
YZL entrusted Party B as the name holder only of YZL equity interest in XGN and STA;
Party B shall neither participate in the management of operation nor shareholder meeting decisions of YZL, XGN or STA;
YZL, as the actual fund provider of XGN and STA, will enjoy all shareholder rights and profit sharing;
YZL, is entitled to all profits and is required to absorb all losses of XGN and STA and its subsidiaries;
Party B is not responsible for losses nor to benefit from any income of XGN and/or STA;
YZL will cover any capital infusion requirements of XGN and STA and related subsidiaries; and
If XGN and/or STA were to dissolve, YZL will enjoy the right to allocate and divide assets.
Based on these contractual arrangements, management believes that XGN and STA and related subsidiaries should be considered “Variable Interest Entity” (“VIE”) under ASC 810 “Consolidation of Variable Interest Entities, an Interpretation of ARB No. 51”, because the equity holders in XGN and STA no longer have the characteristics of a controlling financial interest, and the Company, through YZL, is the primary beneficiary of XGN and STA and its operations.
On March 17, 2011, the shareholders of XGN transferred 100% of the equity interests in XGN to STA and completed the registration of change in ownership with the PRC authorities on April 2, 2011. As a result, XGN is no longer subject to the aforementioned VIE arrangements and is no longer considered our VIE under ASC 810.
Universal Travel Group and YZL are responsible to fund any capital share shortfalls for STA and its subsidiaries. In addition, Universal Travel Group funded through cash and common stock the acquisitions as discussed in Note 2.
4
UNIVERSAL TRAVEL GROUP
NOTES TO UNAUDITED CONDENSED CONSOLIDATED FINANCIAL STATEMENTS
JUNE 30, 2011
Note 1 - ORGANIZATION (CONTINUED)
The Company, through its subsidiaries and VIE, engaged in the travel business, including airline ticketing, hotel reservation services and domestic and international packaged tour services in the PRC.
The following diagram illustrates our corporate structure.
Note 2 - SUMMARY OF SIGNIFICANT ACCOUNTING POLICIES
Basis of Presentation
These accompanying condensed financial statements present the Company's results of operations, financial position and cash flows on a consolidated basis. The condensed consolidated financial statements include Universal Travel Group and its wholly-owned subsidiaries and its subsidiaries owned through shareholding agreements with Chinese residents, significant intercompany transactions and accounts have been eliminated in consolidation. Our policy is to consolidate all subsidiaries in which we hold a greater than 50% voting interest or otherwise control its operating activities and financial interest. It is management's opinion that all adjustments necessary for a fair statement of the results for the interim periods have been made, and all adjustments are of a normal recurring nature. The results of operations for the six-month period ended June 30, 2011, are not necessarily indicative of the results that may be expected for the year ending December 31, 2011. These interim unaudited condensed consolidated financial statements should be read in conjunction with the audited consolidated financial statements and related notes included in our Annual Report on Form 10-K for the year ended December 31, 2010, previously filed with the Securities and Exchange Commission (“SEC”).
The Company operates in three segments in accordance with accounting guidance FASB ASC Topic 280, “Segment Reporting.” Our Chief Executive Officer has been identified as the chief operating decision maker as defined by FASB ASC Topic 280.
5
UNIVERSAL TRAVEL GROUP
NOTES TO UNAUDITED CONDENSED CONSOLIDATED FINANCIAL STATEMENTS
JUNE 30, 2011
Note 2 - SUMMARY OF SIGNIFICANT ACCOUNTING POLICIES (CONTINUED)
Reclassification
Certain prior-year amounts have been reclassified to conform to the current-year presentation. These reclassifications had no effect on reported income or losses.
Acquisitions
In March and June of 2010, the Company had five acquisitions to fit its geographic expansion strategy, and in all and every acquisition, the Company negotiated in arm's length with acquisition target and got the approval from our board of directors before closing.
On June 28, 2010, the Company through its VIE structure and strategy consummated the acquisition of a 100% interest in Kunming Business Travel Agency Co., Ltd. (“KBT”) through a cash and stock transaction valued at approximately US$5.7 million in the aggregate.
The stock consideration consisted of 79,487 newly issued shares of the company's common stock, which were given to KBT’s shareholder immediately before the completion of the share exchange transaction. The cash consideration consisted of $5,163,625. The shares were valued at $572,243, which was the average fair value of the shares 15 days prior to the date of the exchange agreement. This amount is included in the cost of net assets, identified intangible assets, and goodwill purchased.
KBT is engaged in the business of Chinese domestic tourism. The purchase price was determined based on arms' length negotiations between Universal Travel Group and the shareholder of KBT, and approved by our board of directors.
The acquisition had been accounted for as a purchase business combination and the results of operations from the acquisition date have been included in the Company's consolidated financial statements in accordance with ASC810. The allocation of the purchase price is as follows:
|
Cash acquired
|
$
|
814,097
|
||
|
Other assets
|
441,494
|
|||
|
Property Plant & Equipment
|
80,121
|
|||
|
Identifiable Intangibles
|
892,898
|
|||
|
Goodwill
|
3,977,608
|
|||
|
Total assets acquired
|
6,206,218
|
|||
|
Liabilities assumed
|
||||
|
Accounts & Income Taxes payable
|
174,732
|
|||
|
Deferred Tax Liability
|
223,224
|
|||
|
Other payable
|
72,394
|
|||
|
Total
|
$
|
5,735,868
|
The excess of purchase price over tangible assets acquired and liabilities assumed was $4,870,506 of which $3,977,608 was recorded as goodwill. At the time of the acquisition $892,898 of identifiable intangible assets and related deferred tax liability of $223,224 existed under the contractual legal or the reparability criterion as required under ASC 805 and ASC 740, respectively.
Prior to the acquisition, Kunming Business Travel Agency Co., Ltd. prepared its financial statements under accounting principles generally accepted in the United States of America.
6
UNIVERSAL TRAVEL GROUP
NOTES TO UNAUDITED CONDENSED CONSOLIDATED FINANCIAL STATEMENTS
JUNE 30, 2011
Note 2 - SUMMARY OF SIGNIFICANT ACCOUNTING POLICIES (CONTINUED)
Acquisitions (Continued)
On June 28, 2010, the Company through its VIE structure and strategy consummated the acquisition of a 100% interest in Shanxi Jinyang Travel Agency Co., Ltd. (“SJT”) through a cash and stock transaction valued at approximately US$2.3 million in the aggregate.
The stock consideration consisted of 31,387 newly issued shares of the company's common stock, which were given to SJT’s shareholder immediately before the completion of the share exchange transaction. The cash consideration consisted of $2,038,946. The shares were valued at $225,986, which was the average fair value of the shares 15 days prior to the date of the exchange agreement. This amount is included in the cost of net assets, identified intangible assets, and goodwill purchased.
SJT is engaged in the business of Chinese domestic tourism. The purchase price was determined based on arms' length negotiations between Universal Travel Group and the shareholder of SJT, and approved by our board of directors.
The acquisition had been accounted for as a purchase business combination and the results of operations from the acquisition date have been included in the Company's consolidated financial statements in accordance with ASC810. The allocation of the purchase price is as follows:
|
Cash acquired
|
$
|
7,258
|
||
|
Other assets
|
534,373
|
|||
|
Property Plant & Equipment
|
20,339
|
|||
|
Identifiable Intangibles
|
361,124
|
|||
|
Goodwill
|
1,609,816
|
|||
|
Total assets acquired
|
2,532,910
|
|||
|
Liabilities assumed
|
||||
|
Accounts & Income Taxes payable
|
78,574
|
|||
|
Deferred Tax Liability
|
90,281
|
|||
|
Other payable
|
99,123
|
|||
|
Total
|
$
|
2,264,932
|
The excess of purchase price over tangible assets acquired and liabilities assumed was $1,970,940 of which $1,609,816 was recorded as goodwill. At the time of the acquisition $361,124 of identifiable intangible assets and related deferred tax liability of $90,281 existed under the contractual legal or the reparability criterion as required under ASC 805 and ASC 740, respectively.
Prior to the acquisition, Shanxi Jinyang Travel Agency Co., Ltd. prepared its financial statements under accounting principles generally accepted in the United States of America.
On March 29, 2010 the Company through its VIE structure and strategy consummated the acquisition of a 100% interest in Zhengzhou Yulongkang Travel agency Co. Ltd (“ZYT”) through a cash and stock transaction valued at approximately US$5.7 million in the aggregate.
7
UNIVERSAL TRAVEL GROUP
NOTES TO UNAUDITED CONDENSED CONSOLIDATED FINANCIAL STATEMENTS
JUNE 30, 2011
Note 2 - SUMMARY OF SIGNIFICANT ACCOUNTING POLICIES (CONTINUED)
Acquisitions (Continued)
The stock consideration consisted of 60,633 newly issued shares of the Company’s common stock, which were given to ZYT’s shareholder immediately before the completion of the share exchange transaction. The cash consideration consisted of $5,141,764. The shares were valued at $571,172, which was the average fair value of the shares 15 days prior to the date of the exchange agreement. This amount is included in the cost of net assets, identified intangible assets, and goodwill purchased.
ZYT is engaged in the business of Chinese domestic tourism. The purchase price was determined based on arms' length negotiations between Universal Travel Group and the shareholder of ZYT and was approved by our board of directors.
The acquisition had been accounted for as a purchase business combination and the results of operations from the acquisition date have been included in the Company's consolidated financial statements in accordance with ASC 810. The allocation of the purchase price is as follows:
|
Cash acquired
|
$
|
1,513,636
|
||
|
Accounts receivable
|
29,154
|
|||
|
Other assets
|
11,779
|
|||
|
Property Plant & Equipment
|
29,019
|
|||
|
Identifiable Intangibles
|
805,626
|
|||
|
Goodwill
|
3,812,004
|
|||
|
Total assets acquired
|
6,201,218
|
|||
|
Liabilities assumed
|
||||
|
Accounts & Income Taxes payable
|
230,107
|
|||
|
Deferred Tax Liability
|
201,406
|
|||
|
Other payable
|
56,769
|
|||
|
Total
|
$
|
5,712,936
|
The excess of purchase price over tangible assets acquired and liabilities assumed was $4,617,630 of which $3,812,004 was recorded as goodwill. At the time of the acquisition $805,626 of identifiable intangible assets and related deferred tax liability of $201,406 existed under the contractual legal or the reparability criterion as required under ASC 805 and ASC 740, respectively.
Prior to the acquisition, Zhengzhou Yulongkang Travel agency Co. Ltd prepared its financial statements under accounting principles generally accepted in the United States of America.
On March 26, 2010 the Company through its VIE structure and strategy consummated the acquisition of a 100% interest in Huangshan Holiday Travel Service Co., Ltd (“HHT”) through a cash and stock transaction valued at approximately US$2.9 million in the aggregate.
The stock consideration consisted of 61,846 newly issued shares of the company’s common stock, which were given to HHT’s shareholder immediately before the completion of the share exchange transaction. The cash consideration consisted of $2,343,824. The shares were valued at $585,691, which was the average fair value of the shares 15 days prior to the date of the exchange agreement. This amount is included in the cost of net assets, identified intangible assets, and goodwill purchased.
8
UNIVERSAL TRAVEL GROUP
NOTES TO UNAUDITED CONDENSED CONSOLIDATED FINANCIAL STATEMENTS
JUNE 30, 2011
Note 2 - SUMMARY OF SIGNIFICANT ACCOUNTING POLICIES (CONTINUED)
Acquisitions (Continued)
HHT is engaged in the business of Chinese domestic tourism. The purchase price was determined based on arms' length negotiations between Universal Travel Group and the shareholder of HHT, and approved by our board of directors.
The acquisition had been accounted for as a purchase business combination and the results of operations from the acquisition date have been included in the Company's consolidated financial statements in accordance with ASC 810. The allocation of the purchase price is as follows:
|
Cash acquired
|
$
|
340,174
|
||
|
Accounts receivable
|
21,450
|
|||
|
Other assets
|
452,193
|
|||
|
Property Plant & Equipment
|
69,682
|
|||
|
Identifiable Intangibles
|
479,870
|
|||
|
Goodwill
|
1,892,511
|
|||
|
Total assets acquired
|
3,255,880
|
|||
|
Liabilities assumed
|
||||
|
Accounts & Income Taxes payable
|
176,863
|
|||
|
Deferred Tax Liability
|
119,968
|
|||
|
Other payable
|
29,534
|
|||
|
Total
|
$
|
2,929,515
|
The excess of purchase price over tangible assets acquired and liabilities assumed was $2,372,381 of which $1,892,511 was recorded as goodwill. At the time of the acquisition $479,870 of identifiable intangible assets and related deferred tax liability of $119,968 existed under the contractual legal or the reparability criterion as required under ASC 805 and ASC 740, respectively.
Prior to the acquisition, Huangshan Holiday Travel Service Co., Ltd prepared its financial statements under accounting principles generally accepted in the United States of America.
On March 29, 2010 the Company through its VIE structure and strategy consummated the acquisition of a 100% interest in Hebei Tianyuan Travel Agency Co., Ltd (“HTT”) through a cash and stock transaction valued at approximately US$4.4 million in the aggregate.
The stock consideration consisted of 93,282 newly issued shares of the company’s common stock, which were given to HTT’s shareholder immediately before the completion of the share exchange transaction. The cash consideration consisted of $3,519,736. The shares were valued at $878,726, which was the average fair value of the shares prior to the date of the exchange agreement. This amount is included in the cost of net assets, identified intangible assets, and goodwill purchased.
HTT is engaged in the business of Chinese domestic tourism. The purchase price was determined based on arms' length negotiations between Universal Travel Group and the shareholder of HTT, and approved by our board of directors.
The acquisition had been accounted for as a purchase business combination and the results of operations from the acquisition date have been included in the Company's consolidated financial statements in accordance with ASC 810. The allocation of the purchase price is as follows:
9
UNIVERSAL TRAVEL GROUP
NOTES TO UNAUDITED CONDENSED CONSOLIDATED FINANCIAL STATEMENTS
JUNE 30, 2011
Note 2 - SUMMARY OF SIGNIFICANT ACCOUNTING POLICIES (CONTINUED)
Acquisitions (Continued)
|
Cash acquired
|
$
|
532,349
|
||
|
Accounts receivable
|
120,152
|
|||
|
Other assets
|
208,771
|
|||
|
Property Plant & Equipment
|
49,637
|
|||
|
Identifiable Intangibles
|
696,858
|
|||
|
Goodwill
|
3,320,700
|
|||
|
Total assets acquired
|
4,928,467
|
|||
|
Liabilities assumed
|
||||
|
Accounts & Income Taxes payable
|
232,188
|
|||
|
Deferred Tax Liability
|
174,215
|
|||
|
Other payable
|
123,602
|
|||
|
Total
|
$
|
4,398,462
|
The excess of purchase price over tangible assets acquired and liabilities assumed was $4,017,558 of which $3,320,700 was recorded as goodwill. At the time of the acquisition $696,858 of identifiable intangible assets and related deferred tax liability of $174,215 existed under the contractual legal or the reparability criterion as required under ASC 805 and ASC 740, respectively.
Prior to the acquisition, Hebei Tianyuan Travel Agency Co., Ltd prepared its financial statements under accounting principles generally accepted in the United States of America.
On March 17, 2011, the shareholders of Xi’an Golden Net Travel Serve Services Co., Ltd. (“XGN”) transferred 100% of the equity interests in XGN to STA and completed the registration of change in ownership with the PRC authorities on April 2, 2011. As a result, XGN became a wholly owned subsidiary of STA. The Company, though its VIE, STA, acquired a 100% interest in XGN.
Translation Adjustment
As of June 30, 2011 and December 31, 2010, the accounts of Universal Travel Group were maintained, and its condensed financial statements were expressed, in Chinese Yuan Renminbi (CNY). Such financial statements were translated into U.S. Dollars (USD) in accordance with the Foreign Currency Matters Topic of the FASB Accounting Standards Codification (“ASC 830”) with the CNY as the functional currency. According to the Statement, all assets and liabilities were translated at the current exchange rate, stockholders equity are translated at the historical rates and income statement items are translated at the average exchange rate for the period. The resulting translation adjustments are reported under other comprehensive income in accordance with the Comprehensive Income Topic of the FASB Accounting Standard Codification (“ASC 830”). Transaction gains and losses are reflected in the income statement and such differences may be material to the financial statements.
Use of Estimates
The preparation of condensed financial statements in conformity with U.S. generally accepted accounting principles requires management to make estimates and assumptions that affect the reported amounts of assets and liabilities and disclosure of contingent assets and liabilities at the date of the financial statements and the reported amounts of revenues and expenses during the reporting period. Actual results could differ from those estimates and such differences maybe material to the financial statements. The more significant estimates and assumptions made by management include among others, consolidation of VIE's, allowance for doubtful accounts, long-lived asset impairment, useful lives and residual values of fixed assets, stock based compensation, valuation of warrant derivative liability, purchase price allocation of fair market value of assets and liabilities acquired and deferred income taxes. The current economic environment has increased the degree of uncertainty inherent in these estimates and assumptions.
10
UNIVERSAL TRAVEL GROUP
NOTES TO UNAUDITED CONDENSED CONSOLIDATED FINANCIAL STATEMENTS
JUNE 30, 2011
Note 2 - SUMMARY OF SIGNIFICANT ACCOUNTING POLICIES (CONTINUED)
Principles of Consolidation
The condensed consolidated financial statements include the accounts of Universal Travel Group and its wholly owned subsidiaries and Variable Interest Entities, including Shenzhen Yuzhilu Aviation Service Co., Ltd., Shanghai Lanbao Travel Service Co., Ltd., Xi’an Golden Net Travel Serve Services Co., Ltd., Foshan Overseas International Travel Service Co. Ltd., Chongqing Universal Travel E-Commerce Co., Ltd., Universal Travel International Travel Agency Co., Ltd., Hebei Tianyuan Travel Agency Co., Ltd., Huangshan Holiday Travel Service Co., Ltd., Zhengzhou Yulongkang Travel Agency Co., Ltd., Kunming Business Travel Service Co., Ltd., Shanxi Jinyang Travel Agency Co., Ltd., and Full Power Enterprise Global Limited, collectively referred to herein as the Company. All material inter-company accounts, transactions and profits have been eliminated in consolidation.
Risks and Uncertainties
The Company's operation is located in the PRC. There can be no assurance that the Company will be able to successfully continue the operation and failure to do so would have a material adverse effect on the Company's financial position, results of operations and cash flows. Also, the success of the Company's operations is subject to numerous contingencies, some of which are beyond management's control. These contingencies include general economic conditions, competition, governmental and political conditions, and changes in regulations. Among other risks, the Company's operations will be subject to risk of restrictions on transfer of funds, domestic and international customs, changing taxation policies, foreign exchange restrictions, and political and governmental regulations.
Contingencies
Certain conditions may exist as of the date the condensed financial statements are issued. These conditions may result in a future loss to the Company but which will only be resolved when one or more future events occur or fail to occur. The Company’s management and legal counsel assess such contingent liabilities, and such assessment inherently involves an exercise of judgment. In assessing loss contingencies related to legal proceedings that are pending against the Company or unasserted claims that may result in such proceedings, the Company’s legal counsel evaluates the perceived merits of any legal proceedings or unasserted claims as well as the perceived merits of the amount of relief sought or expected to be sought.
If the assessment of a contingency indicates that it is probable given the current economic environment that a material loss has been incurred and the amount of the liability can be estimated, then the estimated liability would be accrued in the Company’s financial statements. If the assessment indicates that a potential material loss contingency is not probable but is reasonably possible, or is probable but cannot be estimated, then the nature of the contingent liability, together with an estimate of the range of possible loss if determinable and material would be disclosed. Loss contingencies considered to be remote by management are generally not disclosed unless they involve guarantees, in which case the guarantee would be disclosed.
On April 15, 2011, the plaintiff Albert Snellink commenced putative class action in the United States District Court, District of New Jersey against Universal Travel Group, and Jiangping Jiang, Yizhao Zhang and Jing Xie, officers of the Company. In the complaint, plaintiff alleges a claim for violations of Section 10(b) and Rule 10b-5 of the Securities Exchange Act of 1934, as amended (the “Exchange Act”), against all defendants, and a claim for a violation of Section 20(a) of the Exchange Act against the individual defendants in connection with purported misrepresentations contained in the Company’s public filings and press releases. The complaint seeks unspecified compensatory damages, and his costs incurred in the action. The Company’s time to answer or move with respect to the complaint has not yet expired. The Company believes that the allegations of complaint are without merit, and intends to vigorously defend the lawsuit.
11
UNIVERSAL TRAVEL GROUP
NOTES TO UNAUDITED CONDENSED CONSOLIDATED FINANCIAL STATEMENTS
JUNE 30, 2011
Note 2 - SUMMARY OF SIGNIFICANT ACCOUNTING POLICIES (CONTINUED)
Contingencies (Continued)
On May 20, 2011, the plaintiff Alex Loeb commenced a derivative action in the First Judicial District Court of the State of Nevada in and for Carson City against Universal travel Group, and Jiangping Jiang, Jing Xie, Huijie Gao, Jiduan Yuan, Lizong Wang, Wenbin An, Lawrence Lee, Yizhao Zhang and Liquan Wang, officers and directors of the Company. In the complaint, plaintiff purports to assert derivative claims against the individual defendants for alleged breaches of fiduciary duties, waste of corporate assets and unjust enrichment based upon alleged conduct of the individual defendants which damaged the Company’s reputation, goodwill and standing in the business community. The complaint also alleges that such conduct may result in liability for violations of federal law. The complaint seeks, among other relief, the amount of damages sustained by the Company as a result of the Defendants’ breach of fiduciary duties, waste of corporate assets and unjust enrichment and plaintiff’s counsel’s, accountant’s and experts’ fees. On June 17, 2011, the Company filed an answer to the compliant in which the Company denied the material allegations of the complaint. The Company intends to vigorously defend the lawsuit.
As of June 30, 2011, the Company is not involved in any another material legal dispute, other than those disclosed above and those which occur in the normal operations of a business.
Net Income (Loss) Per Share
The Company accounts for net income (loss) per share EPS in accordance with FASB Accounting Standards Codification Topic on Earning Per Share (“ASC 260”), which requires presentation of basic and diluted EPS on the face of the statement of income for all entities with complex capital structures and requires a reconciliation of the numerator and denominator of the basic EPS computation to the numerator and denominator of the diluted EPS. Basic net income (loss) per share is computed by dividing net income (loss) by the weighted average number of shares of common stock outstanding during each period. It excludes the dilutive effects of potentially issuable common shares such as those related to the Company’s warrants and stock options (calculated using the treasury stock method). Diluted net income (loss) per share is calculated by including potentially dilutive share issuances in the denominator.
12
UNIVERSAL TRAVEL GROUP
NOTES TO UNAUDITED CONDENSED CONSOLIDATED FINANCIAL STATEMENTS
JUNE 30, 2011
Note 2 - SUMMARY OF SIGNIFICANT ACCOUNTING POLICIES (CONTINUED)
Net Income (Loss) Per Share (Continued)
The following table sets forth the computation of basic and diluted earnings per share of common stock:
|
Six months ended June 30,
|
Three months ended June 30,
|
|||||||||||||||
|
|
2011
|
2010
|
2011
|
2010
|
||||||||||||
|
Basic earnings per share:
|
||||||||||||||||
|
Numerator:
|
||||||||||||||||
|
Net income used in computing basic earnings per share
|
$ | 8,897,303 | $ | 9,277,013 | $ | 4,441,773 | $ | 5,730,578 | ||||||||
|
Net income applicable to common shareholders
|
$ | 8,897,303 | $ | 9,277,013 | $ | 4,441,773 | $ | 5,730,578 | ||||||||
|
Denominator:
|
||||||||||||||||
|
Weighted average common shares outstanding
|
19,898,235 | 17,066,154 | 19,898,235 | 17,404,834 | ||||||||||||
|
Basic earnings per share
|
$ | 0.45 | $ | 0.54 | $ | 0.22 | $ | 0.33 | ||||||||
|
Diluted earnings per share:
|
||||||||||||||||
|
Numerator:
|
||||||||||||||||
|
Net income used in computing basic earnings per share
|
$ | 8,897,303 | $ | 9,277,013 | $ | 4,441,773 | $ | 5,730,578 | ||||||||
|
Net income applicable to common shareholders
|
$ | 8,897,303 | $ | 9,277,013 | $ | 4,441,773 | $ | 5,730,578 | ||||||||
|
Denominator:
|
||||||||||||||||
|
Weighted average common shares outstanding
|
19,898,235 | 17,066,154 | 19,898,235 | 17,404,834 | ||||||||||||
|
Weighted average effect of dilutive securities:
|
||||||||||||||||
|
Stock options and warrants
|
244,581 | 869,159 | 42,501 | 814,806 | ||||||||||||
|
Shares used in computing diluted net income per share
|
20,142,816 | 17,935,313 | 19,940,736 | 18,219,639 | ||||||||||||
|
Diluted earnings per share from continuing operations
|
$ | 0.44 | $ | 0.52 | $ | 0.22 | $ | 0.31 | ||||||||
|
Total net income per common share
|
||||||||||||||||
|
Basic
|
$ | 0.45 | $ | 0.54 | $ | 0.22 | $ | 0.33 | ||||||||
|
Diluted
|
$ | 0.44 | $ | 0.52 | $ | 0.22 | $ | 0.31 | ||||||||
Recent Accounting Pronouncements
In June 2011, the FASB issued guidance related to the presentation of comprehensive income in the financial statements. The new accounting guidance eliminates the option to present the components of other comprehensive income as part of the statement of shareholders' equity. Under the new guidance, the Company must report comprehensive income in either a single continuous statement of comprehensive income which contains two sections, net income and other comprehensive income, or in two separate but consecutive statements. This guidance will be effective during the interim and annual periods beginning after December 15, 2011 with early adoption permitted. The adoption of this standard will not have an impact on the Company's consolidated financial position results of operations or cash flows as it only requires a change in the format of the current presentation.
13
UNIVERSAL TRAVEL GROUP
NOTES TO UNAUDITED CONDENSED CONSOLIDATED FINANCIAL STATEMENTS
JUNE 30, 2011
Note 2 - SUMMARY OF SIGNIFICANT ACCOUNTING POLICIES (CONTINUED)
Recent Accounting Pronouncements (Continued)
In May 2011, the FASB issued guidance related to fair value measurement and disclosures in the financial statements. This guidance conforms the wording to describe many of the requirements in U.S. GAAP to International Financial Reporting Standards to ensure the related standards are consistently applied. The guidance also expands the disclosures for fair value measurements that are estimated using significant unobservable (Level 3) inputs. This new guidance is effective during interim and annual periods beginning after December 15, 2011 and is to be applied prospectively. The adoption of this standard will not materially expand the Company's consolidated financial statement footnote disclosures.
Note 3 – SHORT-TERM INVESTMENT
As of June 30, 2011, the Company has invested $38,991,181 into HappyFund of China Construction Bank with interest rate 3.10%, 3.34%, and 4.39%. These investments consist primarily of money market accounts with maturities ranging from one months to three months accordingly they are classified as short term investments in the accompanying financial statements.
Note 4 - INCOME TAXES
The Company is subject to U.S. federal income tax, and the Company’s subsidiaries incorporated in the PRC are subject to enterprise income taxes in the PRC.
During the three months ended June 30, 2011 and 2010, the Company recorded an income tax expense of approximately $1.9 million and $1.8 million, respectively. During the six months ended June 30, 2011 and 2010, the Company recorded an income tax expense of approximately $3.8 million and $3.1 million, respectively. The increase in the Company’s income tax expense was primarily due to the increase in profits of its PRC subsidiaries and VIE.
The effective tax rate increased by 6% from a 24% effective rate for the three months ended June 30, 2010 to a 30% effective rate for the three months ended June 30, 2011. The effective tax rate increased by 5% from 25% for the six months ended June 30, 2010 to 30% for the six months ended June 30, 2011.
As of June 30, 2011, unrecognized tax benefits were $30,804. The total amount of unrecognized tax benefits that, if recognized, would favorably affect the effective tax rate was $30,804 at June 30, 2011. As of June 30, 2010, unrecognized tax benefits were $0. The total amount of unrecognized tax benefits that, if recognized, would favorably affect the effective tax rate was $0 at June 30, 2010.
For the three months ended June 30, 2011 and 2010, the Company recorded uncertain tax benefits of approximately $0 and $0, respectively. For the six months ended June 30, 2011 and 2010, the Company recorded uncertain tax benefits of approximately $0 and $0, respectively.
Aggregate undistributed earnings of approximately $98 million as of June 30, 2011 of the Company’s PRC subsidiaries that are available for distribution to the Company are considered to be indefinitely reinvested, and, accordingly, no provision has been made for the PRC dividend withholding taxes that would be payable upon distribution to the Company. Additionally, the PRC tax authorities have clarified that distributions made out of pre-January 1, 2008 retained earnings would not be subject to the withholding tax.
The Company's tax years from 2006 to 2010 remain open in various jurisdictions.
14
UNIVERSAL TRAVEL GROUP
NOTES TO UNAUDITED CONDENSED CONSOLIDATED FINANCIAL STATEMENTS
JUNE 30, 2011
Note 5 - SEGMENT INFORMATION
Pursuant to ASC 280 the Company operates and discloses three reportable segments: air ticketing, hotel reservation and packaged tours. Substantially all of the Company’s revenues and long-lived assets are in the PRC. The Company currently operates and prepares accounting and other financial reports separately to management for eleven major business organizations (Shenzhen Yuzhilu Aviation Service Co., Ltd., Shanghai Lanbao Travel Service Co., Ltd., Foshan International Travel Service Co., Ltd., Xi’an Golden Net Travel Serve Services Co., Ltd., Chongqing Travel World E-Business Co., Ltd., Universal Travel International Travel Agency Co., Ltd., Hebei Tianyuan Travel Agency Co., Ltd., Zhengzhou Yulongkang Travel Agency Co., Ltd., Huangshan Holiday Travel Service Co., Ltd., Kunming Business Travel Service Co., Ltd., and Shanxi Jinyang Travel Agency Co., Ltd.).
Our air-ticketing segment relates to the segment reporting of Shenzhen Yuzhilu Aviation Service Co., Ltd. and Chongqing Travel World E-Business Co., Ltd.; Hotel reservation segment relates to Shenzhen Yuzhilu Aviation Service Co., Ltd., Shanghai Lanbao Travel Service Co., Ltd. and Huangshan Holiday Travel Service Co., Ltd.; Packaged tours segment relates to Chongqing Travel World E-Business Co., Ltd., Foshan International Travel Service Co., Ltd., Xi’an Golden Net Travel Serve Service Company Ltd., Universal Travel International Travel Agency Co., Ltd., Hebei Tianyuan Travel Agency Co., Ltd., Zhengzhou Yulongkang Travel Agency Co., Ltd., Huangshan Holiday Travel Service Co., Ltd., Kunming Business Travel Service Co., Ltd., and Shanxi Jinyang Travel Agency Co., Ltd. Management monitors these segments regularly to make decisions about resources to be allocated to the segment and assess its performance.
15
UNIVERSAL TRAVEL GROUP
NOTES TO UNAUDITED CONDENSED CONSOLIDATED FINANCIAL STATEMENTS
JUNE 30, 2011
Note 5 - SEGMENT INFORMATION (CONTINUED)
The following tables present summarized information by segment:
|
Air
|
Hotel
|
Packaged
|
Other
|
Total
|
||||||||||||||||
|
Ticketing
|
Reservation
|
Tours
|
||||||||||||||||||
|
Six Months Ended June 30, 2011
|
||||||||||||||||||||
|
Revenue, net
|
$ | 10,280,773 | $ | 6,389,731 | $ | 49,986,767 | $ | - | $ | 66,657,271 | ||||||||||
|
Cost of services
|
$ | 3,773,987 | $ | 1,537,696 | $ | 43,721,220 | $ | - | $ | 49,032,903 | ||||||||||
|
Gross profit
|
$ | 6,506,786 | $ | 4,852,035 | $ | 6,265,547 | $ | - | $ | 17,624,368 | ||||||||||
|
Income from operations
|
$ | 7,189,838 | $ | 2,049,272 | $ | 5,472,579 | $ | (2,658,833 | ) | $ | 12,052,856 | |||||||||
|
Income tax expenses
|
$ | 1,825,648 | $ | 514,766 | $ | 1,390,637 | $ | 87,037 | $ | 3,818,088 | ||||||||||
|
Depreciation & Amortization
|
$ | 546,814 | $ | 4,331 | $ | 65,446 | $ | - | $ | 616,591 | ||||||||||
|
Asset expenditures
|
$ | 62,662 | $ | - | $ | - | $ | - | $ | 62,662 | ||||||||||
|
Goodwill
|
$ | - | $ | 3,081,799 | $ | 21,427,110 | $ | - | $ | 24,508,909 | ||||||||||
|
Total assets
|
$ | 104,908,639 | $ | 478,447 | $ | 45,810,995 | $ | 347,791 | $ | 151,545,872 | ||||||||||
|
Six Months Ended June 30, 2010
|
||||||||||||||||||||
|
Revenue, net
|
$ | 8,702,488 | $ | 6,462,123 | $ | 37,127,291 | $ | - | $ | 52,291,902 | ||||||||||
|
Cost of services
|
$ | 2,833,290 | $ | 1,979,573 | $ | 32,491,924 | $ | - | $ | 37,304,787 | ||||||||||
|
Gross profit
|
$ | 5,869,198 | $ | 4,482,550 | $ | 4,635,367 | $ | - | $ | 14,987,115 | ||||||||||
|
Income from operations
|
$ | 4,165,082 | $ | 4,389,490 | $ | 4,130,012 | $ | (1,340,653 | ) | $ | 11,343,931 | |||||||||
|
Income tax expenses
|
$ | 1,049,783 | $ | 982,799 | $ | 1,028,968 | $ | - | $ | 3,061,550 | ||||||||||
|
Depreciation & Amortization
|
$ | 740,235 | $ | 879 | $ | 22,593 | $ | - | $ | 763,707 | ||||||||||
|
Asset expenditures
|
$ | 1,852,357 | $ | - | $ | 12,417 | $ | - | $ | 1,864,774 | ||||||||||
|
Goodwill
|
$ | $ | 3,081,799 | $ | 21,427,110 | $ | - | $ | 24,508,909 | |||||||||||
|
Total assets
|
$ | 60,542,681 | $ | 7,435,604 | $ | 28,741,119 | $ | 23,943,549 | $ | 120,662,953 | ||||||||||
|
Three Months Ended June 30, 2011
|
||||||||||||||||||||
|
Revenue, net
|
$ | 5,020,345 | $ | 2,695,778 | $ | 25,145,655 | $ | - | $ | 32,861,778 | ||||||||||
|
Cost of services
|
$ | 1,857,664 | $ | 163,312 | $ | 22,091,650 | $ | - | $ | 24,112,626 | ||||||||||
|
Gross profit
|
$ | 3,162,681 | $ | 2,532,466 | $ | 3,054,005 | $ | - | $ | 8,749,152 | ||||||||||
|
Income from operations
|
$ | 4,922,641 | $ | 4,140 | $ | 2,560,760 | $ | (1,311,803 | ) | $ | 6,175,738 | |||||||||
|
Income tax expenses
|
$ | 1,219,276 | $ | 3,110 | $ | 627,262 | $ | 93,896 | $ | 1,943,544 | ||||||||||
|
Depreciation & Amortization
|
$ | 274,445 | $ | 2,171 | $ | 32,696 | $ | - | $ | 309,312 | ||||||||||
|
Asset expenditures
|
$ | 44,413 | $ | - | $ | - | $ | - | $ | 44,413 | ||||||||||
|
Goodwill
|
$ | - | $ | 3,081,799 | $ | 21,427,110 | $ | - | $ | 24,508,909 | ||||||||||
|
Three Months Ended June 30, 2010
|
||||||||||||||||||||
|
Revenue, net
|
$ | 4,796,513 | $ | 3,432,017 | $ | 23,637,593 | $ | - | $ | 31,866,123 | ||||||||||
|
Cost of services
|
$ | 1,465,419 | $ | 981,156 | $ | 20,688,727 | $ | - | $ | 23,135,302 | ||||||||||
|
Gross profit
|
$ | 3,331,094 | $ | 2,450,861 | $ | 2,948,866 | $ | - | $ | 8,730,821 | ||||||||||
|
Income from operations
|
$ | 2,396,956 | $ | 2,395,312 | $ | 2,594,654 | $ | (733,298 | ) | $ | 6,653,624 | |||||||||
|
Income tax expenses
|
$ | 656,059 | $ | 476,671 | $ | 649,754 | $ | - | $ | 1,782,484 | ||||||||||
|
Depreciation & Amortization
|
$ | 442,389 | $ | 440 | $ | 19,774 | $ | - | $ | 462,603 | ||||||||||
|
Asset expenditures
|
$ | 1,244,147 | $ | - | $ | 1,011 | $ | - | $ | 1,245,158 | ||||||||||
|
Goodwill
|
$ | - | $ | 3,081,799 | $ | 21,427,110 | $ | - | $ | 24,508,909 | ||||||||||
16
UNIVERSAL TRAVEL GROUP
NOTES TO UNAUDITED CONDENSED CONSOLIDATED FINANCIAL STATEMENTS
JUNE 30, 2011
Note 6 - PRO FORMA FINANCIAL STATEMENTS
Pro Forma financial statements present revenue and related data of five subsidiaries acquired in 2010 as if the acquisitions were made at the earliest date presented of January 1, 2010.
For the six months ended June 30, 2010, the revenue, income from operations, net income, and net income per common share in Pro Forma financial statements are as follow:
|
For the six months ended June 30,
|
||||
|
2010
|
||||
|
Revenues
|
$ | 65,821,830 | ||
|
Income from operations
|
$ | 12,926,713 | ||
|
Net Income
|
$ | 10,431,632 | ||
|
Net income per common share
|
||||
|
Basic
|
$ | 0.61 | ||
|
Dilute
|
$ | 0.58 | ||
Note 7 - SUBSEQUENT EVENTS
On April 12, 2011, the Company’s stock was suspended from trading when it was unable to file its Annual Report on Form 10-K by April 15, 2011 as a result of Windes & McClaughry Accountancy Corporation resignation on April 9, 2011. On June 8, 2011, the Company filed its Annual Report on Form 10-K. On July 22, 2011, the Company filed its quarterly report on Form 10-Q for the quarter ended March 31, 2011. As of August 12, 2011, the Company's stock is still suspended from trading.
As of June 30, 2011, the Company has evaluated subsequent events for potential recognition and disclosure through the date of the financial statement issuance.
17
Item 2. Management’s Discussion and Analysis of Financial Condition and Results of Operations.
Forward-Looking Statements: No Assurances Intended
In addition to historical information, this quarterly report contains forward-looking statements, which are generally identifiable by use of the words “believes,” “expects,” “intends,” “anticipates,” “plans to,” “estimates,” “projects,” or similar expressions. These forward-looking statements represent Management’s belief as to the future of Universal Travel Group. Whether those beliefs become reality will depend on many factors that are not under management’s control. Many risks and uncertainties exist that could cause actual results to differ materially from those reflected in these forward-looking statements. Readers are cautioned not to place undue reliance on these forward-looking statements. We undertake no obligation to revise or publicly release the results of any revision to these forward-looking statements.
Business Overview
We are a travel services provider in the People’s Republic of China (“PRC”) engaged in providing air ticketing and hotel booking services as well as domestic and international packaged tourism services throughout the PRC via the internet, the customer representatives and the kiosks.
|
Name of Entities
|
Place of
Incorporation
|
Expiration date
|
Ownership
Percentage
|
|||||
|
Universal Travel Group
|
Nevada, USA
|
- | 100 | % | ||||
|
Full Power Enterprise Global Limited
|
British Virginia Islands
|
- | 100 | % | ||||
|
Shenzhen Yuzhilu Aviation Service Co., Ltd.
|
China
|
1998.3.9-2018.3.9 | 100 | % | ||||
|
Xi’an Golden Net Travel Serve Services Co., Ltd.
|
China
|
2001.8.1-2016.9.4 |
100
|
% | ||||
|
Shanghai Lanbao Travel Service Co., Ltd.
|
China
|
2002.5.29-2015.4.28 | 100 | % | ||||
|
Foshan Overseas International Travel Service Co., Ltd.
|
China
|
Infinite Term
|
100 | % | ||||
|
Chongqing Universal Travel E-Commerce Co., Ltd.
|
China
|
Infinite Term
|
100 | % | ||||
|
Universal Travel International Travel Agency Co., Ltd.
(formerly named: Shenzhen Universal Travel Agency Co., Ltd.) |
China
|
Infinite Term
|
100
|
%VIE | ||||
|
Hebei Tianyuan International Travel Agency Co., Ltd.
|
China
|
1999.10.8-2019.10.7 | 100 | % | ||||
|
Huangshan Holiday Travel Service Co., Ltd.
|
China
|
Infinite Term
|
100 | % | ||||
|
Zhengzhou Yulongkang Travel Agency Co., Ltd.
|
China
|
2000.11.1-2020.11.1 | 100 | % | ||||
|
Kunming Business Travel Service Co., Ltd.
|
China
|
2001.10.8-2011.10.8 | 100 | % | ||||
|
Shanxi Jinyang Travel Agency Co., Ltd.
|
China
|
2005.5.19-2015.5.18 | 100 | % |
In 2007 and 2009, YZL entered into certain shareholding agreements with various related PRC residents and Shenzhen Yuzhixing Aviation Service, Co. Limited (“Party B”) to hold YZL shares of ownership of Xi’an Golden Net Travel Serve Services Co., Ltd. (“XGN”) and Universal Travel International Travel Agency Co., Ltd., formerly known as Shenzhen Universal Travel Agency Co., Ltd. (“STA”).The significant details of the agreements and other important information, among others, are outlined below:
Universal Travel Group funded the start up activities and incorporation of XGN and STA and related subsidiaries, through cash or common stock issuance;
YZL entrusted Party B as the name holder only of YZL equity interest in XGN and STA;
Party B shall neither participate in the management of operation nor shareholder meeting decisions of YZL, XGN or STA;
YZL, as the actual fund provider of XGN and STA, will enjoy all shareholder rights and profit sharing;
YZL, is entitled to all profits and is required to absorb all losses of XGN and STA and its subsidiaries;
Party B is not responsible for losses nor to benefit from any income of XGN and/or STA;
YZL will cover any capital infusion requirements of XGN and STA and related subsidiaries; and
If XGN and/or STA were to dissolve, YZL will enjoy the right to allocate and divide assets.
Based on these contractual arrangements, management believes that XGN and STA and related subsidiaries should be considered “Variable Interest Entity” (“VIE”) under ASC 810 “Consolidation of Variable Interest Entities, an Interpretation of ARB No. 51”, because the equity holders in XGN and STA no longer have the characteristics of a controlling financial interest, and the Company, through YZL, is the primary beneficiary of XGN and STA and its operations.
On March 17, 2011, the shareholders of XGN transferred 100% of the equity interests in XGN to STA and completed the registration of change in ownership with the PRC authorities on April 2, 2011. As a result, XGN is no longer subject to the aforementioned VIE arrangements and is no longer considered our VIE under ASC 810.
18
Universal Travel Group and YZL are responsible to fund any capital share shortfalls for STA and its subsidiaries. In addition, Universal Travel Group funded through cash and common stock the acquisitions as discussed in Note 2.
In 2007, we completed the acquisitions of Xi'an Golden Net Travel Serve Service Co., Ltd., which specializes in domestic packaged tour services, and Shanghai Lanbao Travel Service Co., Ltd., which specializes in hotel reservations and Foshan Overseas International Travel Service Co., Ltd, which handles both domestic and international travel inquiries.
In early 2008, we successfully integrated our packaged tours, air-ticketing and hotel reservation businesses onto our newly developed on-line platform, which provides rich and comprehensive travel information to primarily leisure travelers.
In October 2008, we successfully rolled out our TRIPEASY Kiosks, an innovative self-service terminal capable of handling a full ranging of booking services including packaged tours through a secured built in payment function that accepts all major Chinese bank cards. On September 9, 2010, we sold all of 1,523 Kiosks to Shenzhen Xunbao E-commerce Co. Ltd. with a slight gain. The strategy of sales of Kiosks was to minimize our capital expenditures and related expenses. We still have the full right to use these Kiosks after the sales for two years according to the agreement.
In December 2008, we established Universal Travel International Travel Agency Co., Ltd. (formerly known as Shenzhen Universal Travel Agency Co. Ltd.), a PRC company, to meet the increasing packaged-tour demand in Shenzhen City.
In March 2009, in order to seize the opportunities arising from the economic promotion by the PRC government of the mid and western regions of the PRC, we strategically set up Chongqing Universal Travel E-Commerce Co., Ltd., a PRC company, to strengthen our presence in that region. It began generating revenues in the third quarter of 2009.
In 2009, we were selected one of the Top Ten Brands of Travel Services in the PRC. We believe our quality of services will distinguish us in our long term competitiveness.
In 2010, we acquired a total of five companies for stock and cash through our VIE structure and strategy, namely Huangshan Holiday Travel Service Co., Ltd., Hebei Tianyuan International Travel Agency Co., Ltd., Zhengzhou Yulongkang Travel Agency Co., Ltd., Kunming Business Travel Agency Co., Ltd. and Shanxi Jinyang Travel Agency Co., Ltd.
In order to finance the abovementioned acquisitions and our working capital, on December 10, 2009, we entered into a subscription agreement to sell to institutional investors an aggregate of 2,222,222 shares of our common stock at a price of $9.00 per share for net proceeds of approximately $19.0 million. The sale of the common stock closed on December 15, 2009. The offer and sale of the shares were made pursuant to an effective Registration Statement on Form S-3 (Registration No. 333-161139) initially filed with the Securities and Exchange Commission on August 7, 2009 and amended on November 2, 2009. The Registration Statement was declared effective on November 5, 2009.
19
On June 15, 2010, we entered into an underwriting agreement (the “Underwriting Agreement”) with Brean Murray, Carret & Co., LLC, as representative of the underwriters (the “Representative”), related to a public offering of 2,857,143 shares of the Company's common stock at a price of $7.00 per share less a 5% underwriting commission. Under the terms of the Underwriting Agreement, we granted the Representative an option, exercisable for 30 days, to purchase up to an additional 428,572 shares of common stock to cover over-allotments, if any. The offering was made pursuant to an effective registration statement on Form S-3, as amended and supplemented (Registration Statement No. 333-161139) filed with the Securities and Exchange Commission. On June 21, 2010, we closed the common stock offering announced on June 16, 2010. In the transaction, we issued 2,857,143 shares of common stock at $7.00 per share for an aggregate amount of $20 million.
On December 24, 2010, we, through our subsidiary, Universal Travel International Travel Agency Co., Ltd., obtained the International Travel License issued by the National Travel Authority, granting us the right to operate and offer global package tours in mainland PRC and our subsidiary changed name to Universal Travel International Travel Agency Co., Ltd. to reflect the upgrade. In the past, we had only been able to offer such packages through agencies which possess this license. There are over 20,000 travel agencies in the PRC, of which only approximately 1,300 travel agencies have this International Travel License.
In order to leverage on our International Travel License, we have decided to franchise our license to local travel agencies. Recently, we granted our franchise to eight local travel agencies in Shenyang, Dalian and Qingdao. They have converted their business model, adopted our franchise operating scheme, and updated their local business registration to run this franchise officially. As of June 30, 2011, we are still providing training and internal control testing for these franchisees and accordingly they have not generated any revenue yet.
We currently have three discrete lines of business and revenue, and each is carried out by a few subsidiaries of the Company and our VIE: (i) air-ticketing (Shenzhen Yuzhilu Aviation Service Co., Ltd. and Chongqing Universal Travel E-Commerce Co., Ltd.), (ii) hotel reservations (Shenzhen Yuzhilu Aviation Service Co., Ltd., Shanghai Lanbao Travel Service Co., Ltd. and Huangshan Holiday Travel Service Co., Ltd.), and (iii) packaged tours (Chongqing Universal Travel E-Commerce Co., Ltd., Xi'an Golden Net Travel Serve Service Co., Ltd., Foshan Overseas International Travel Service Co., Ltd., Universal Travel International Travel Agency Co. Ltd., Huangshan Holiday Travel Service Co., Ltd., Hebei Tianyuan International Travel Agency Co., Ltd., Zhengzhou Yulongkang Travel Agency Co., Ltd., Shanxi Jinyang Travel Agency Co., Ltd. and Kunming Business Travel Agency Co., Ltd.).
Our strategy is to further utilize our international travel license, and expand our geographic service coverage by establishing more franchise offices and set up call centers in some of these franchisee offices where there is customer demand for air-ticketing and hotel reservation services. We also plan to integrate our offline businesses with our online platform.
We aim to be the foremost leading online travel services provider in the PRC, especially in the air ticketing, hotel reservation and packaged tour service sectors.
Income Tax Expense
We are subject to U.S. federal income tax, and our subsidiaries incorporated in the PRC are subject to enterprise income taxes in the PRC. We recorded an income tax expense of approximately $1.9 million and $1.8 million for the three months ended June 30, 2011 and 2010, respectively. We recorded an income tax expense of approximately $3.8 million and $3.1 million for the six months ended June 30, 2011 and 2010, respectively. The increase in income tax expense was primarily due to the increase in profits of its PRC subsidiaries.
As of June 30, 2011, unrecognized tax benefits were $30,804. The total amount of unrecognized tax benefits that, if recognized, would favorably affect the effective tax rate was $30,804 at June 30, 2011. As of June 30, 2010, unrecognized tax benefits were $0. The total amount of unrecognized tax benefits that, if recognized, would favorably affect the effective tax rate was $0 at June 30, 2010.
For the three months ended June 30, 2011 and 2010, the Company recorded uncertain tax benefits of approximately $0 and $0, respectively. For the six months ended June 30, 2011 and 2010, the Company recorded uncertain tax benefits of approximately $0 and $0, respectively.
20
RESULTS OF OPERATIONS
The following table presents certain consolidated statement of operations information derived from the consolidated statements of income for the three months ended June 30, 2011 and 2010 respectively.
|
Three months ended
|
Three months ended
|
Increase /
|
||||||||||||||
|
June 30, 2011
|
June 30, 2010
|
(Decrease)
|
Percentage
|
|||||||||||||
|
Revenues
|
||||||||||||||||
|
Air ticketing, net
|
$ | 5,020,345 | $ | 4,796,513 | $ | 223,832 | 4.67 | % | ||||||||
|
Hotel reservation, net
|
2,695,778 | 3,432,017 | (736,239 | ) | -21.45 | % | ||||||||||
|
Packaged tours, gross
|
25,145,655 | 23,637,593 | 1,508,062 | 6.38 | % | |||||||||||
| 32,861,778 | 31,866,123 | 995,655 | 3.12 | % | ||||||||||||
|
Cost of services
|
||||||||||||||||
|
Air ticketing, net
|
1,857,664 | 1,465,419 | 392,245 | 26.77 | % | |||||||||||
|
Hotel reservation, net
|
163,312 | 981,156 | (817,844 | ) | -83.36 | % | ||||||||||
|
Packaged tours, gross
|
22,091,650 | 20,688,727 | 1,402,923 | 6.78 | % | |||||||||||
| 24,112,626 | 23,135,302 | 977,324 | 4.22 | % | ||||||||||||
|
Gross Profit
|
8,749,152 | 8,730,821 | 18,331 | 0.21 | % | |||||||||||
|
Selling, general and administrative expenses
|
(2,573,414 | ) | (2,077,197 | ) | (496,217 | ) | 23.89 | % | ||||||||
|
Income from operations
|
6,175,738 | 6,653,624 | (477,886 | ) | -7.18 | % | ||||||||||
|
Other income (expense)
|
||||||||||||||||
|
Other income (expense)
|
(3,112 | ) | 3,363 | (6,475 | ) | 192.54 | % | |||||||||
|
Gain on change of fair value of derivative liabilities
|
95,404 | 839,553 | (744,149 | ) | -88.64 | % | ||||||||||
|
Interest income
|
117,287 | 16,522 | 100,765 | 609.88 | % | |||||||||||
|
Total other income
|
209,579 | 859,438 | (649,859 | ) | -75.61 | % | ||||||||||
|
Income before income taxes
|
6,385,317 | 7,513,062 | (1,127,745 | ) | -15.01 | % | ||||||||||
|
Provision for income taxes
|
1,943,544 | 1,782,484 | 161,060 | 9.04 | % | |||||||||||
|
Net Income
|
$ | 4,441,773 | $ | 5,730,578 | $ | (1,288,805 | ) | -22.49 | % | |||||||
For the three months ended June 30, 2011:
|
Air
|
(%) of
|
Hotel
|
(%) of
|
Packaged
|
(%) of
|
|||||||||||||||||||||||
|
Revenue Segment
|
Ticketing
|
sector
|
Reservation
|
sector
|
Tours
|
sector
|
Total
|
|||||||||||||||||||||
|
Revenue
|
$ | 5,020,345 | 15.28 | % | $ | 2,695,778 | 8.20 | % | $ | 25,145,655 | 76.52 | % | $ | 32,861,778 | ||||||||||||||
|
Cost of Services
|
(1,857,664 | ) | 7.70 | % | (163,312 | ) | 0.68 | % | (22,091,650 | ) | 91.62 | % | (24,112,626 | ) | ||||||||||||||
|
Gross Profit
|
$ | 3,162,681 | 36.15 | % | $ | 2,532,466 | 28.95 | % | $ | 3,054,005 | 34.91 | % | $ | 8,749,152 | ||||||||||||||
|
Gross Margin
|
63.00 | % | 93.94 | % | 12.15 | % | 26.62 | % | ||||||||||||||||||||
|
Segment effect in Gross Margin (*)
|
9.62 | % | 7.71 | % | 9.29 | % | 26.62 | % | ||||||||||||||||||||
21
For the three months ended June 30, 2010:
|
Air
|
(%) of
|
Hotel
|
(%) of
|
Packaged
|
(%) of
|
|||||||||||||||||||||||
|
Revenue Segment
|
Ticketing
|
sector
|
Reservation
|
sector
|
Tours
|
sector
|
Total
|
|||||||||||||||||||||
|
Revenue
|
$ | 4,796,513 | 15.05 | % | $ | 3,432,017 | 10.77 | % | $ | 23,637,593 | 74.18 | % | $ | 31,866,123 | ||||||||||||||
|
Cost of Services
|
(1,465,419 | ) | 6.33 | % | (981,156 | ) | 4.24 | % | (20,688,727 | ) | 89.42 | % | (23,135,302 | ) | ||||||||||||||
|
Gross Profit
|
$ | 3,331,094 | 38.15 | % | $ | 2,450,861 | 28.07 | % | $ | 2,948,866 | 33.78 | % | $ | 8,730,821 | ||||||||||||||
|
Gross Margin
|
69.45 | % | 71.41 | % | 12.48 | % | 27.40 | % | ||||||||||||||||||||
|
Segment effect in Gross Margin (*)
|
10.45 | % | 7.69 | % | 9.25 | % | 27.40 | % | ||||||||||||||||||||
(*) “Segment effect in Gross Margin” was calculated by multiplying “the percentage of the segment revenue over the total revenue” with “gross margin of the related sector”. This outlines how each segment contributes to the total gross margin.
Revenue
Our air-ticketing segment relates to the segment reporting of Shenzhen Yuzhilu Aviation Service Co., Ltd. and Chongqing Travel World E-Business Co., Ltd. Our hotel reservation segment relates to Shenzhen Yuzhilu Aviation Service Co., Ltd., Shanghai Lanbao Travel Service Co., Ltd. and Huangshan Holiday Travel Service Co., Ltd. Our packaged tours segment relates to Chongqing Travel World E-Business Co., Ltd., Foshan Overseas International Travel Service Co., Ltd., Xi’an Golden Net Travel Serve Service Co., Ltd., Universal Travel International Travel Agency Co. Ltd., Huangshan Holiday Travel Service Co., Ltd., Hebei Tianyuan International Travel Agency Co., Ltd., Zhengzhou Yulongkang Travel Agency Co., Ltd., Shanxi Jinyang Travel Agency Co., Ltd. and Kunming Business Travel Agency Co., Ltd.
Revenues for the three months ended June 30, 2011 were $32,861,778, compared to $31,866,123 for the same period in 2010, an increase of $995,655, or approximately 3.12%. The slight increase in revenue is contributed by our expanded packaged tours business and stable sales in our air ticketing business. We continue to see success in cross marketing and selling our travel related products across our business segments and increased brand awareness from online and offline sales.
Revenues from air-ticketing segment were $5,020,345 for the three months ended June 30, 2011 compared to $4,796,513 for the same period last year, an increase of $223,832, or approximately 4.67%. This slight increase is generally driven by increase in air-ticket sales volume and higher air-ticket prices than the same quarter last year. We attribute the higher air ticket sales to a booming tourism industry, general inflation in PRC economy, as well as less competition among airlines. As the PRC economy continues to grow, we believe that our growth in air-ticketing is sustainable in the foreseeable future.
Revenues from the hotel reservations segment were $2,695,778 for the three months ended June 30, 2011 compared to $3,432,017 for the same quarter in 2010, a decrease of $736,239, or approximately 21.45%. The decrease is associated with the transition period of our new strategy in this segment. In the second quarter this year, we ceased all hotel rooms wholesaling operations, which was previously conducted through the China Booking Association platform. Instead we focused our strategy on the more profitable direct sales and hotel packaged products. Accordingly, there was a slight decrease in revenue during this transition period. We believe the change in our hotel reservation strategy will enhance our competitiveness, increase our profitability and place our hotel reservation business in an advantageous position for long term success.
Revenues from our packaged tour segment were $25,145,655 for the three months ended June 30, 2011, compared to $23,637,593 for the same quarter in 2010, an increase of $1,508,062, or approximately 6.38%. The slight increase is a result of our efforts to expand our packaged tour business and mix and growth in domestic tours sales but offset by a drop in sales in international tours by Foshan Overseas International Travel Service Co., Ltd. after Japan's earthquake, tsunami, and radiation disaster.
Cost of Services
Costs of services for air tickets cover mainly business and revenue related expenses and commissions paid to retail agents. Costs of services for hotel reservations cover mainly commissions paid to the sales agents for selling hotel rooms in the Company’s system. Commission rates vary and are paid to these sales agents after we are paid our commissions by the hotels. Costs of services for packaged tours include meals, transportation (airline tickets, train tickets and car rental), lodging, airport transfers, tickets to local attractions and tours.
22
Other direct costs such as systems and related technologies used by each segment operations, and costs associated with payment processing are also included in the Company’s costs of services. In addition, the Company allocates costs of labor and facilities, depreciation, communications, and utility expenses incurred by each segment between costs of services and general administrative expenses. We do not offer any volume rebates but enjoy volume rebates from our vendors, calculated based on the vendors’ own internal rebate policy. We do not record receivables for these rebates, and we only record them as a reduction of cost when received.
Costs of services for the three months ended June 30, 2011 were $24,112,626 compared to $23,135,302 for the same quarter last year, an increase of $977,324, or approximately 4.22%. The increase is in tandem with the increase of revenue. Our increased cost in air ticketing business is associated with higher percentage of commission cost to a major retail agency in this segment. The comparatively higher costs of services resulted from packaged tours making up a greater percentage of our total revenue and their corresponding higher cost of services. But we were able to integrate with wider geographic covered local subsidiaries as a result of acquisitions to create synergy to tightly control our packaged tour segment costs.
Costs of services from the air-ticketing segment were $1,857,664 for the three months ended June 30, 2011, compared to $1,465,419 for the same quarter last year, an increase of $392,245, or approximately 26.77%. This increase is associated with the higher salaries expenses along with increased numbers of employees in this segment and increased percentage of commission paid to a major retail agency.
Costs of services from the hotel-reservation segment were $163,312 for the three months ended June 30, 2011, compared to $981,156 for the same quarter last year, a decrease of $817,844, or approximately 83.36%. The significant decrease is a result from our strategy to focus on direct sales to reduce commissions paid to second tier wholesale agents. in the second quarter this year.
Costs of services from the packaged-tour segment were $22,091,650 for the three months ended June 30, 2011, compared to $20,688,727 for the same quarter last year, an increase of $1,402,923 or approximately 6.78%. The increase is in tandem with the increase of revenue.
Gross Profit
Gross profit for the three months ended June 30, 2011 was $8,749,152 compared to $8,730,821, for the same quarter last year, an increase of $18,331, or approximately 0.21%. The stability in gross profit is due to the growth in revenue and control of cost as explained above. The growth in both our domestic air-ticketing business and hotel reservation business is a result of synergies from our packaged tour operations.
Gross profit in our air-ticketing segment was $3,162,681 for the three months ended June 30, 2011, compared to $3,331,094 for the same quarter last year, a decrease of $168,413, or approximately 5.06%. Gross profit margin for the three months ended June 30, 2011 was 63.00%, slightly lower than 69.45% for the same quarter last year. We anticipate that our gross margin in the air-ticketing segment will be stable and improve in the foreseeable future.
Gross profit in our hotel reservation segment was $2,532,466 for the quarter ended June 30, 2011 compared to $2,450,861 for the same quarter last year, an increase of $81,605, or approximately 3.33%. Gross profit margin in this segment for the three months ended June 30, 2011 was 93.94%, compared to 71.41% for the same quarter last year, an increase of 22.53%. The increase in gross profit margin is due to our new strategy to focus on more profitable direct sales in the second quarter this year.
Gross profit in our packaged tour segment was $3,054,005 for the three months ended June 30, 2011 compared to $2,948,866 for the same quarter last year, an increase of $105,139, or approximately 3.57%. Gross profit margin in this segment for the quarter ended June 30, 2011 was 12.15% compared to 12.48% for the same quarter last year, a decrease of 0.33%. The stability in gross margin for this segment was mainly attributable to improved profit margins from our 2010 acquired subsidiaries into this segment. We believe that our strong local contacts and networks established through our subsidiaries are critical in our nationwide expansion strategy.
23
Our air-ticketing and hotel reservations have much higher gross margin than our packaged tour business primarily because our revenues from air-ticketing and hotel reservation are the commissions we generated. Our costs of service are mainly costs relating to systems and related technologies used in operations, costs associated with payment processing, and allocation of costs of labor and facilities, communications, and utility expenses, which all together are not substantial, while costs of services for the packaged tours include meals, transportation (airline tickets, train tickets and car rental), lodging, airport transfers, tickets to local attractions and tours, that all together are much substantial variables and fixed overheads.
Consolidated gross margin for the three months ended June 30, 2011 came in at 26.62%, a 0.77% slight decrease from the 27.40% in the same quarter last year. The stability in gross margin is mainly due to integration among segments and as our strategy increased focus on online development.
Selling, General and Administrative Expenses
Major selling, general, and administrative expenses for the three months ended June 30, 2011 and 2010 are as follows:
|
|
For the three months ended June 30,
|
Increase /
|
||||||||||||||
|
|
2011
|
2010
|
(Decrease)
|
Percentage
|
||||||||||||
|
Salary and commission
|
$ | 385,447 | $ | 401,699 | $ | (16,252 | ) | -4.05 | % | |||||||
|
Marketing
|
171,176 | 103,815 | 67,361 | 64.89 | % | |||||||||||
|
Rent
|
102,490 | 89,759 | 12,731 | 14.18 | % | |||||||||||
|
Depreciation and amortization
|
269,146 | 435,821 | (166,675 | ) | -38.24 | % | ||||||||||
|
Professional fees
|
599,272 | 394,245 | 205,027 | 52.01 | % | |||||||||||
|
Stock-based compensation
|
720,241 | 340,372 | 379,869 | 111.60 | % | |||||||||||
|
Other general and administrative expenses
|
325,642 | 311,486 | 14,156 | 4.54 | % | |||||||||||
|
Total
|
$ | 2,573,414 | $ | 2,077,197 | $ | 496,217 | 23.89 | % | ||||||||
Selling, general and administrative expenses totaled $2,573,414 for the three months ended June 30, 2011 compared to $2,077,197 for the same quarter last year, an increase of $496,217, or approximately 23.89%.
Selling, general and administrative expenses were approximately 7.83% of revenue for the three months ended June 30, 2011 as compared to 6.52% for the same quarter last year. General increase in selling, general and administrative expenses are in connection with the growth in business operations during the second quarter of 2011, as compared to the same quarter last year. During the second quarter of 2011, we incurred extra professional fees, more rent expenses, less depreciation expenses than the same quarter last year, and higher stock based compensation for 2010 incentive stock plan. To promote our businesses, especially air ticketing business, we spent $272,900 on advertisements on popular Chinese websites in the second quarter of 2011, while we did not incur so much for the same quarter last year.
Other Income (Expenses)
Gain on change in fair value of derivative liability for the three months ended June 30, 2011 was $95,404 compared to $839,553 for the same quarter last year. The Company adopted Derivative and Hedging, ASC 815-40 effective January 1, 2009. The warrants issued in connection with the Securities Purchase Agreement dated August 28, 2008 were reclassified from equity to derivative liability and marked to market. Therefore, the Company recorded a gain on change in fair value of derivative liability of $95,404 on June 30, 2011 to mark to market for the decrease in fair value of the warrants from April 1, 2011 to June 30, 2011.
24
Net Income
Net income was $4,441,773, or 13.52% of revenues for the three months ended June 30, 2011, compared to $5,730,578, or 17.98% of revenues for the same quarter last year, a decrease of $1,288,805, or 22.49%. The decrease in net income is mostly associated with increased selling, general and administrative expenses for expanding our business and decreased non-cash gain on change in fair value of derivative liability.
SIX MONTHS ENDED JUNE 30, 2011 AND 2010
The following table presents certain consolidated statement of operations information derived from the consolidated statements of income for the six months ended June 30, 2011 and 2010 respectively.
|
Six months ended
|
Six months ended
|
Increase /
|
||||||||||||||
|
June 30, 2011
|
June 30, 2010
|
(Decrease)
|
Percentage
|
|||||||||||||
|
Revenues
|
||||||||||||||||
|
Air ticketing, net
|
$ | 10,280,773 | $ | 8,702,488 | $ | 1,578,285 | 18.14 | % | ||||||||
|
Hotel reservation, net
|
6,389,731 | 6,462,123 | (72,392 | ) | -1.12 | % | ||||||||||
|
Packaged tours, gross
|
49,986,767 | 37,127,291 | 12,859,476 | 34.64 | % | |||||||||||
| 66,657,271 | 52,291,902 | 14,365,369 | 27.47 | % | ||||||||||||
|
Cost of services
|
||||||||||||||||
|
Air ticketing, net
|
3,773,987 | 2,833,290 | 940,697 | 33.20 | % | |||||||||||
|
Hotel reservation, net
|
1,537,696 | 1,979,573 | (441,877 | ) | -22.32 | % | ||||||||||
|
Packaged tours, gross
|
43,721,220 | 32,491,924 | 11,229,296 | 34.56 | % | |||||||||||
| 49,032,903 | 37,304,787 | 11,728,116 | 31.44 | % | ||||||||||||
|
Gross Profit
|
17,624,368 | 14,987,115 | 2,637,253 | 17.60 | % | |||||||||||
|
Selling, general and administrative expenses
|
(5,571,512 | ) | (3,643,184 | ) | 1,928,328 | 52.93 | % | |||||||||
|
Income from operations
|
12,052,856 | 11,343,931 | 708,925 | 6.25 | % | |||||||||||
|
Other income (expense)
|
||||||||||||||||
|
Other income (expense)
|
(17,502 | ) | 6,917 | (24,419 | ) | -353.03 | % | |||||||||
|
Gain on change of fair value of derivative liabilities
|
445,216 | 949,004 | (503,788 | ) | -53.09 | % | ||||||||||
|
Interest income
|
234,821 | 38,711 | 196,110 | 506.60 | % | |||||||||||
|
Total other income
|
662,535 | 994,632 | (332,097 | ) | -33.39 | % | ||||||||||
|
Income before income taxes
|
12,715,391 | 12,338,563 | 376,828 | 3.05 | % | |||||||||||
|
Provision for income taxes
|
3,818,088 | 3,061,550 | 756,538 | 24.71 | % | |||||||||||
|
Net Income
|
$ | 8,897,303 | $ | 9,277,013 | $ | (379,710 | ) | -4.09 | % | |||||||
For the six months ended June 30, 2011:
|
Air
|
(%) of
|
Hotel
|
(%) of
|
Packaged
|
(%) of
|
|||||||||||||||||||||||
|
Revenue Segment
|
Ticketing
|
sector
|
Reservation
|
sector
|
Tours
|
sector
|
Total
|
|||||||||||||||||||||
|
Revenue
|
$ | 10,280,773 | 15.42 | % | $ | 6,389,731 | 9.59 | % | $ | 49,986,767 | 74.99 | % | $ | 66,657,271 | ||||||||||||||
|
Cost of Services
|
(3,773,987 | ) | 7.70 | % | (1,537,696 | ) | 3.14 | % | (43,721,220 | ) | 89.17 | % | (49,032,903 | ) | ||||||||||||||
|
Gross Profit
|
$ | 6,506,786 | 36.92 | % | $ | 4,852,035 | 27.53 | % | $ | 6,265,547 | 35.55 | % | $ | 17,624,368 | ||||||||||||||
|
Gross Margin
|
63.29 | % | 75.93 | % | 12.53 | % | 26.44 | % | ||||||||||||||||||||
|
Segment effect in Gross Margin (*)
|
9.76 | % | 7.28 | % | 9.40 | % | 26.44 | % | ||||||||||||||||||||
25
For the six months ended June 30, 2010:
|
Air
|
(%) of
|
Hotel
|
(%) of
|
Packaged
|
(%) of
|
|||||||||||||||||||||||
|
Revenue Segment
|
Ticketing
|
sector
|
Reservation
|
sector
|
Tours
|
sector
|
Total
|
|||||||||||||||||||||
|
Revenue
|
$ | 8,702,488 | 16.64 | % | $ | 6,462,123 | 12.36 | % | $ | 37,127,291 | 71.00 | % | $ | 52,291,902 | ||||||||||||||
|
Cost of Services
|
(2,833,290 | ) | 7.59 | % | (1,979,573 | ) | 5.31 | % | (32,491,924 | ) | 87.10 | % | (37,304,787 | ) | ||||||||||||||
|
Gross Profit
|
$ | 5,869,198 | 39.16 | % | $ | 4,482,550 | 29.91 | % | $ | 4,635,367 | 30.93 | % | $ | 14,987,115 | ||||||||||||||
|
Gross Margin
|
67.44 | % | 69.37 | % | 12.49 | % | 28.66 | % | ||||||||||||||||||||
|
Segment effect in Gross Margin (*)
|
11.22 | % | 8.57 | % | 8.86 | % | 28.66 | % | ||||||||||||||||||||
(*) “Segment effect in Gross Margin” was calculated by multiplying “the percentage of the segment revenue over the total revenue” with “gross margin of the related sector”. This outlines how each segment contributes to the total gross margin.
Revenue
Our air-ticketing segment relates to the segment reporting of Shenzhen Yuzhilu Aviation Service Co., Ltd. and Chongqing Travel World E-Business Co., Ltd. Our hotel reservation segment relates to Shenzhen Yuzhilu Aviation Service Co., Ltd., Shanghai Lanbao Travel Service Co., Ltd. and Huangshan Holiday Travel Service Co., Ltd. Our packaged tour segment relates to Chongqing Travel World E-Business Co., Ltd., Foshan Overseas International Travel Service Co., Ltd., Xi’an Golden Net Travel Serve Service Co., Ltd., Universal Travel International Travel Agency Co. Ltd., Huangshan Holiday Travel Service Co., Ltd., Hebei Tianyuan International Travel Agency Co., Ltd., Zhengzhou Yulongkang Travel Agency Co., Ltd., Shanxi Jinyang Travel Agency Co., Ltd. and Kunming Business Travel Agency Co., Ltd.
Revenues for the six months ended June 30, 2011 were $66,657,271, compared to $52,291,902 for the same period in 2010, an increase of $14,365,369, or approximately 27.47%. The increase is contributed by our business expansion, especially in packaged tour segment, along with the strong demand for travel as a result of the recovery of PRC economy, and the continuing effect of the PRC government’s stimulus package, benefiting the whole industry. We continue to see success in cross marketing and selling our travel related products across our business segments and increased brand awareness from online and offline sales.
Revenues from air-ticketing segment were $10,280,773 for the six months ended June 30, 2011 compared to $8,702,488 for the same period last year, an increase of $1,578,285, or approximately 18.14%. This increase is generally driven by increase in air-ticket sales volume and higher air-ticket prices than the same quarter last year, and increased revenue from Chongqing Travel World E-Business Co., Ltd. as it gained more local market share after being established for over a year. We attribute the higher air ticket sales to booming tourism, general inflation in the PRC economy, as well as the downgraded competition among airlines. As the PRC economy continues to grow, we believe that our growth in air-ticketing segment is sustainable in the foreseeable future.
Revenues from the hotel reservation segment were $6,389,731 for the six months ended June 30, 2011 compared to $6,462,123 for the same period in 2010, a decrease of $72,392, or approximately 1.12%. In the second quarter this year, we ceased all hotel rooms wholesaling operations, which was previously conducted through the China Booking Association platform. Instead we focused our strategy on our more profitable direct sales and hotel packaged products, resulting in a slight decrease in revenue during this transition period. We believe the change in our hotel reservation strategy will enhance our competitiveness and profitability and place our hotel reservation business in an advantageous position for long term success.
Revenues from our packaged tour segment were $49,986,767 for the six months ended June 30, 2011, compared to $37,127,291 for the same period in 2010, an increase of $12,859,476, or approximately 34.64%. The increase is associated with our expansion in this segment. Our subsidiaries acquired in 2010 in this segment contributed $22,512,538 for the six months ended June 30, 2011 compared to $7,275,588 for the same period last year, which was in a transition period.
26
Cost of Services
Costs of services for air tickets cover mainly business and revenue related expenses and commissions paid to retail agents. Costs of services for hotel reservations cover mainly commissions paid to the sales agents for selling hotel rooms in the Company’s system. Commission rates vary and are paid to these sales agents after we are paid our commissions by the hotels. Costs of services for packaged tours include meals, transportation (airline tickets, train tickets and car rental), lodging, airport transfers, tickets to local attractions and tours.
Other direct costs such as costs relating to systems and related technologies used by each segment operations, and costs associated with payment processing are also included in the Company’s costs of services. In addition, the Company allocates costs of labor and facilities, depreciation, communications, and utility expenses incurred by each segment between costs of services and general administrative expenses. We do not offer any volume rebates but enjoy volume rebates from our vendors, calculated based on the vendors’ own internal rebate policy. We do not record receivables for these rebates, and we only record them as a reduction of cost when received.
Costs of services for the six months ended June 30, 2011 were $49,032,903 compared to $37,304,787 for the same period last year, an increase of $11,728,116, or approximately 31.44%. The increase is associated with a combination of higher costs in our air ticketing business due to the higher commissions to a major retail agency, offset by the lower commissions paid to second tier wholesale agents in our hotel reservation business due to our new strategy to focus more on direct sales and packaged products in the second quarter, and higher cost incurred in expanding our packaged tour business. The increase is in tandem with the increase of revenue.
Costs of services from the air-ticketing segment were $3,773,987 for the six months ended June 30, 2011, compared to $2,833,290 for the same period last year, an increase of $940,697, or approximately 33.20%. This increase is associated with the higher booking volumes, higher salaries expenses due to increased numbers of employees and higher percentage of commissions paid to a major retail agency in this segment.
Costs of services from the hotel-reservation segment were $1,537,696 for the six months ended June 30, 2011, compared to $1,979,573 for the same period last year, a decrease of $444,817, or approximately 22.32%. We benefit from our strategy to focus on direct sales for the reduction on commissions paid to second tier wholesale agents in the second quarter.
Costs of services from the packaged-tour segment were $43,721,220 for the six months ended June 30, 2011, compared to $32,491,924 for the same period last year, an increase of $11,229,296, or approximately 34.56%. The increase is also in tandem with the increase of revenue.
Gross Profit
Gross profit for the six months ended June 30, 2011 was $17,624,368 compared to $14,987,115, for the same period last year, an increase of $2,637,253, or approximately 17.60%. The increase in gross profit is due to the growth in revenue and control of cost as explained above. The growth in both our domestic air-ticketing business and hotel reservation business is a result of synergies from our packaged tour operations.
Gross profit in our air-ticketing segment was $6,506,786 for the six months ended June 30, 2011, compared to $5,869,198 for the same period last year, an increase of $637,588, or approximately 10.86%. Gross profit margin for the six months ended June 30, 2011 was 63.29%, slightly lower than 67.44% for the same period last year, a slight decrease of 4.15%. The decreased gross profit margin is mostly due to higher commission paid to a major retail agency. We anticipate that our gross margin in the air-ticketing segment will be stable and improve in the foreseeable future.
Gross profit in our hotel reservation segment was $4,852,035 for the six months ended June 30, 2011 compared to $4,482,550 for the same period last year, an increase of $369,485, or approximately 8.24%. Gross profit margin in this segment for the six months ended June 30, 2011 was 75.93%, compared to 69.37% for the same period last year, an increase of 6.56%. The increase in gross profit is due to our new strategy to focus on more profitable direct sales.
27
Gross profit in our packaged tour segment was $6,265,547 for the six months ended June 30, 2011 compared to $4,635,367 for the same period last year, an increase of $1,630,180, or approximately 35.17%. Gross profit margin in this segment for the six months ended June 30, 2011 was 12.53% compared to 12.49% for the same period last year, an increase of 0.04%. The stability in gross margin for this segment was mainly attributable to improved profit margins from Universal Travel International Travel Agency Co. Ltd, and Shanxi Jinyang Travel Agency Co., Ltd. We believe that our strong local contacts and networks established through our subsidiaries are critical in our nationwide expansion strategy.
Our air-ticketing and hotel reservations have much higher gross margin than our packaged tour business primarily as our revenues from air-ticketing and hotel reservation segments are the commissions we generated. Our costs of service are mainly costs relating to systems and related technologies used in operations, costs associated with payment processing, and allocation of costs of labor and facilities, communications, and utility expenses, which all together are not substantial, while costs of services for the packaged tours include meals, transportation (airline tickets, train tickets and car rental), lodging, airport transfers, tickets to local attractions and tours, that all together are much substantial variables and fixed overheads.
Consolidated gross margin for the six months ended June 30, 2011 came in at 26.44%, a 2.22% decrease from the 28.66% in the same period last year. The lower gross margin is mainly due to our increased weight of our lower margin packaged tours segment in our revenue mix. Due to the difference in revenues recognition, our packaged tour segment has lower gross margin. During the first six months of 2011, revenues generated from packaged tours grew at a much higher rate than revenues generated from air ticketing and hotel reservation segments as a result of acquisitions of five packaged tour travel agencies, leading to lower overall gross margin. However, management believes the packaged tour segment is critical to the substantial growth of air ticketing and hotel reservation segments in the long run, and overall gross margin is expected to improve as integration among segments improves and as our strategy increases focus on online development.
Selling, General and Administrative Expenses
Major selling, general, and administrative expenses for the six months ended June 30, 2011 and 2010 are as follows:
|
For the six months ended June 30,
|
Increase /
|
|||||||||||||||
|
|
2011
|
2010
|
(Decrease)
|
Percentage
|
||||||||||||
|
Salary and commission
|
$ | 831,800 | $ | 717,699 | $ | 114,101 | 15.90 | % | ||||||||
|
Marketing
|
507,252 | 175,057 | 332,195 | 189.76 | % | |||||||||||
|
Rent
|
185,730 | 170,343 | 15,387 | 9.03 | % | |||||||||||
|
Depreciation and amortization
|
507,737 | 668,383 | -160,646 | -24.04 | % | |||||||||||
|
Professional fees
|
1,003,029 | 659,250 | 343,779 | 52.15 | % | |||||||||||
|
Stock-based compensation
|
1,654,180 | 677,004 | 977,176 | 144.34 | % | |||||||||||
|
Other general and administrative expenses
|
881,784 | 575,448 | 306,336 | 53.23 | % | |||||||||||
|
Total
|
$ | 5,571,512 | $ | 3,643,184 | $ | 1,928,328 | 52.93 | % | ||||||||
Selling, general and administrative expenses totaled $5,571,512 for the six months ended June 30, 2011 compared to $3,643,184 for the same period last year, an increase of $1,928,328, or approximately 52.93%.
Selling, general and administrative expenses were approximately 8.36% of revenue for the six months ended June 30, 2011 as compared to 6.97% for the same period last year. General increase in selling, general and administrative expenses are in connection with the growth in business operations during the six months period of 2011, as compared to the same period last year. During the first six months of 2011, we incurred extra professional fees, more salaries expenses, less depreciation expenses than the same period last year, and higher stock based compensation for 2010 incentive stock plan. To promote our businesses, especially air ticketing business, we spent $507,252 on advertisements on popular Chinese websites in the first six months of 2011, while we did not incur so much for the same period last year. The increased salary expense and commission are due to an increase in the number of newly hired employees.
28
Other Income (Expenses)
Gain on change in fair value of derivative liability for the six months ended June 30, 2011 was $445,216 compared to $949,004 for the same period last year. The Company adopted Derivative and Hedging, ASC 815-40 effective January 1, 2009. The warrants issued in connection with the Securities Purchase Agreement dated August 28, 2008 were reclassified from equity to derivative liability and marked to market. Therefore, the Company recorded a gain on change in fair value of derivative liability of $445,216 on June 30, 2011 to mark to market for the decrease in fair value of the warrants from January 1, 2011 to June 30, 2011.
Net Income
Net income was $8,897,303, or 13.35% of revenues for the six months ended June 30, 2011, compared to $9,277,013, or 17.74% of revenues for the same period last year, a decrease of $379,710, or 4.09%. The stability in net income is mostly due to our efforts to expand our business, our merger and acquisition strategy, and the non-cash gain on change in fair value of derivative liability.
LIQUIDITY AND CAPITAL RESOURCES
Cash for operations and liquidity needs are funded primarily through cash flows from operations and equity raise. Cash and cash equivalents were $41,807,581 as of June 30, 2011. Current assets and current liabilities as of June 30, 2011 were $122,751,526 and $9,477,510, respectively, yielding working capital of $113,274,016. We believe that the funds available to us from operations and equity raise are adequate to meet our operating needs for the next twelve months. For the six months ended June 30, 2011, net cash provided by operating activities was approximately $17,760,426, which resulted primarily from our operations and effective management of cash flow.
Capital Expenditure
Total capital expenditure for the six months ended June 30, 2011 was $62,662, used to purchase fixed assets, primarily transportation equipment and lease hold improvement for our call center in our new headquarter in Shenzhen. Management may consider substantial increase in decoration and equipment or other supporting machinery expenditures as we start our franchise model and to support the fast development and expansion of our business.
Working Capital Requirements
Historically, operations and short term financing have been sufficient to meet our cash needs. We believe that we will be able to generate revenue from operations to provide the necessary cash flow to meet anticipated working capital requirements. However, our actual working capital needs for the long and short term will depend upon numerous factors, including operating results, competition, the opportunity to acquire or start-up new businesses, and the availability of credit facilities, none of which can be predicted with certainty. Due to our rapid growth and expansion, our need for additional capital may arise, and management will seek to raise capital for the maintenance and expansion of our operations through the issuance of debt or equity if necessary. To satisfy these capital needs due to our broad expansion in PRC, we may incur additional capital expenditures.
We filed a Registration Statement on Form S-3 to register $50,000,000 worth of securities on August 7, 2009, which became effective on November 5, 2009. In December 15, 2009, we closed Subscription Agreements with certain investors to sell to them an aggregate of 2,222,222 shares of common stocks for net proceeds of $18.9 million. We also closed another common stock public offering transaction on June 16, 2010. In this transaction we issued 2,857,143 shares of common stocks for net proceeds of $18.8 million.
Unless otherwise indicated in a prospectus supplement, we intend to use the net proceeds from the sale of the securities under the S-3 registration for general corporate purposes, including expanding our products, and for general working capital purposes. We may also use a portion of the net proceeds to acquire or invest in businesses and products that are complementary to our own, although we have no current plans, commitments or agreements with respect to any acquisitions.
29
Off-Balance Sheet Arrangements
We have never entered into any off-balance sheet financing arrangements except leases and have never established any special purpose entities. We have not guaranteed any debt or commitments of other entities or entered into any options on non-financial assets.
Item 3. Quantitative and Qualitative Disclosures About Market Risk.
Not applicable.
Item 4. Controls and Procedures.
Evaluation of our Disclosure Controls
As of the end of the period covered by this Quarterly Report on Form 10-Q, our principal executive officer and principal financial officer have evaluated the effectiveness of our “disclosure controls and procedures” (“Disclosure Controls”). Disclosure Controls, as defined in Rule 13a-15(e) of the Securities Exchange Act of 1934, as amended (the “Exchange Act”), are procedures that are designed with the objective of ensuring that information required to be disclosed in our reports filed under the Exchange Act, such as this Quarterly Report, is recorded, processed, summarized and reported within the time periods specified in the Securities and Exchange Commission’s rules and forms. Disclosure Controls are also designed with the objective of ensuring that such information is accumulated and communicated to our management, including the chief executive officer (“CEO”) and chief financial officer (“CFO”), as appropriate to allow timely decisions regarding required disclosure. Our management, including the CEO and CFO, does not expect that our Disclosure Controls will prevent all error and all fraud. A control system, no matter how well conceived and operated, can provide only reasonable, not absolute, assurance that the objectives of the control system are met. Further, the design of a control system must reflect the fact that there are resource constraints, and the benefits of controls must be considered relative to their costs. Because of the inherent limitations in all control systems, no evaluation of controls can provide absolute assurance that all control issues and instances of fraud, if any, within the company have been detected. These inherent limitations include the realities that judgments in decision-making can be faulty, and that breakdowns can occur because of simple error or mistake. The design of any system of controls also is based in part upon certain assumptions about the likelihood of future events, and there can be no assurance that any design will succeed in achieving its stated goals under all potential future conditions.
Based upon their controls evaluation, our CEO and CFO have concluded that our Disclosure Controls are effective at a reasonable assurance level.
Changes in Internal Control over Financial Reporting
There have been no changes in our internal controls over financial reporting during our second fiscal quarter that have materially affected, or are reasonably likely to materially affect, our internal control over financial reporting.
PART II - OTHER INFORMATION
Item 1. Legal Proceedings.
On May 20, 2011, the plaintiff Alex Loeb commenced this derivative action in the First Judicial District Court of the State of Nevada in and for Carson City against the Company, and Jiangping Jiang, Jing Xie, Huijie Gao, Jiduan Yuan, Lizong Wang, Wenbin An, Lawrence Lee, Yizhao Zhang and Liquan Wang, officers and directors of the Company. In the complaint, plaintiff purports to assert derivative claims against the individual defendants for alleged breaches of fiduciary duties, waste of corporate assets and unjust enrichment based upon alleged conduct of the individual defendants which damaged the Company’s reputation, goodwill and standing in the business community. The complaint also alleges that such conduct may result in liability for violations of federal law. The complaint seeks, among other relief, the amount of damages sustained by the Company as a result of the Defendants’ breach of fiduciary duties, waste of corporate assets and unjust enrichment and plaintiff’s counsel’s, accountant’s and experts’ fees. On June 17, 2011, the Company filed an answer to the compliant in which the Company denied the material allegations of the complaint. The Company intends to vigorously defend the lawsuit.
On April 15, 2011, the plaintiff Albert Snellink commenced this putative class action in the United States District Court, District of New Jersey against the Company, and Jiangping Jiang, Yizhao Zhang and Jing Xie, officers of the Company. In the complaint, plaintiff alleges a claim for violations of Section 10(b) and Rule 10b-5 of the Securities Exchange Act of 1934, as amended (the “Exchange Act”), against all defendants, and a claim for a violation of Section 20(a) of the Exchange Act against the individual defendants in connection with purported misrepresentations contained in the Company’s public filings and press releases. The complaint seeks unspecified compensatory damages, and his costs incurred in the action. The Company’s time to answer or move with respect to the complaint has not yet expired. The Company believes that the allegations of complaint are without merit, and intends to vigorously defend the lawsuit.
30
Item 1A. Risk Factors.
Not applicable.
Item 2. Unregistered Sales of Equity Securities and Use of Proceeds.
None.
Item 3. Defaults Upon Senior Securities.
None.
Item 4. (Removed and Reserved).
Item 5. Other Information.
Not applicable.
Item 6. Exhibits.
Copies of the following documents are included as exhibits to this report pursuant to Item 601 of Regulation S-K.
|
Exhibit No.
|
SEC Ref.
No.
|
Title of Document
|
|
1
|
31.1
|
Certification of the Principal Executive Officer pursuant to Section 302 of the Sarbanes-Oxley Act of 2002
|
|
2.
|
31.2
|
Certification of the Principal Financial Officer pursuant to Section 302 of the Sarbanes-Oxley Act of 2002
|
|
3
|
32.1
|
Certification of the Principal Executive Officer pursuant to U.S.C. Section 1350 as adopted pursuant to Section 906 of the Sarbanes-Oxley Act of 2002*
|
|
4
|
32.2
|
Certification of the Principal Financial Officer pursuant to U.S.C. Section 1350 as adopted pursuant to Section 906 of the Sarbanes-Oxley Act of 2002*
|
|
5
|
101.INS
|
XBRL Instance Document.**
|
|
6
|
101.SCH
|
XBRL Taxonomy Extension Schema Document.**
|
|
7
|
101.CAL
|
XBRL Taxonomy Calculation Linkbase Document.**
|
|
8
|
101.PRE
|
XBRL Taxonomy Presentation Linkbase Document.**
|
|
9
|
101.LAB
|
XBRL Taxonomy Label Linkbase Document.**
|
|
10
|
101.INS
|
XBRL Instance Document.**
|
* The Exhibits attached to this report shall not be deemed “filed” for purposes of Section 18 of the Securities Exchange Act of 1934 (the “Exchange Act”) or otherwise subject to liability under that section, nor shall it be deemed incorporated by reference in any filing under the Securities Act of 1933, as amended, or the Exchange Act, except as expressly set forth by specific reference in such filing.
31
** Attached as Exhibits 101 to this report are the following financial statements from the Company’s Quarterly Report on Form 10-Q for the second quarter ended June 30, 2011 formatted in XBRL (“eXtensible Business Reporting Language”): (i) the Unaudited Condensed Consolidated Balance Sheets, (ii) the Unaudited Condensed Consolidated Statements of Income and Comprehensive Income, (iii) the Unaudited Condensed Consolidated Statements of Cash Flows, and (iv) related notes to these unaudited condensed consolidated financial statements tagged as blocks of text.
The XBRL related information in Exhibits 101 to this report shall not be deemed “filed” or a part of a registration statement or prospectus for purposes of Section 11 or 12 of the Securities Act of 1933, as amended, and is not filed for purposes of Section 18 of the Securities Exchange Act of 1934, as amended, or otherwise subject to the liabilities of those sections.
32
SIGNATURES
Pursuant to the requirements of the Securities Exchange Act of 1934, the registrant has duly caused this report to be signed on its behalf by the undersigned thereunto duly authorized.
Date: August 15, 2011
|
UNIVERSAL TRAVEL GROUP
|
||
|
By:
|
/s/ Jiangping Jiang
|
|
|
Jiangping Jiang
Chairwoman and Chief Executive Officer
(Principal Executive Officer)
|
||
|
By:
|
/s/ Jing Xie
|
|
|
Jing Xie
Chief Financial Officer
(Principal Financial Officer)
|
||
33