Attached files
UNITED STATES
SECURITIES AND EXCHANGE COMMISSION
Washington, D.C. 20-549
FORM 10-Q
(Mark One)
|
¨
|
QUARTERLY REPORT PURSUANT TO SECTION 13 OR 15(d) OF THE SECURITIES EXCHANGE ACT OF 1934
|
For the quarterly period ended June 30, 2011
or
|
¨
|
TRANSITION REPORT UNDER SECTION 13 OR 15(d) OF THE EXCHANGE ACT
|
For the transition period from ______________ to _____________
Commission file number: 333-152286
GLOBAL PHARM HOLDINGS GROUP, INC.
(Exact name of registrant as specified in its charter)
|
Delaware
|
20-8767223
|
|
|
(State or other jurisdiction of incorporation or
|
(I.R.S. Employer Identification No.)
|
|
|
organization)
|
||
|
25/F New World Center, No. 6009 Yitian Road, Futian
|
518026
|
|
|
District, Shenzhen,
|
(Zip Code)
|
|
|
People’s Republic of China
|
||
|
(Address of principal executive offices)
|
86-755-83230226
(Registrant’s telephone number, including area ccode)
Indicate by check mark whether the registrant (1) has filed reports required to be filed by Section 13 or 15(d) of the Securities Exchange Act of 1934 during the preceding 12 months (or for such shorter period that the registrant was required to file such reports), and (2) has been subject to such filing requirements for the past 90 days. Yes þ No ¨
Indicate by check mark whether the registrant has submitted electronically and posted on its corporate Web site, if any, every Interactive Data File required to be submitted and posted pursuant to Rule 405 of Regulation S-T (§232.405 of this chapter) during the preceding 12 months (or for such shorter period that the registrant was required to submit and post such files).
Yes þ No ¨
Indicate by check mark whether the registrant is a large accelerated filer, an accelerated filer, a non-accelerated filer or a smaller reporting company. See the definitions of “large accelerated filer,” “accelerated filer” and “smaller reporting company” in Rule 12b-2 of the Exchange Act.
|
Large accelerated filer ¨
|
Accelerated filer ¨
|
|
Non-accelerated filer ¨
|
Smaller reporting company þ
|
Indicate by check mark whether the registrant is a shell company (as defined in Rule 12b-2 of the Exchange Act).
Yes ¨ No þ
As of August 11, 2011, there are 26,000,000 of $0.001 par value common stock issued and outstanding.
FORM 10-Q
GLOBAL PHARM HOLDINGS GROUP, INC.
INDEX
|
Page
|
||
| PART I. Financial Information | ||
|
Item 1.
|
Condensed Consolidated Financial Statements (unaudited)
|
1
|
|
Condensed Consolidated Balance Sheets as of June 30, 2011 and December 31, 2010
|
2
|
|
|
Condensed Consolidated Statements of Income and Comprehensive Income for the Three and Six Months Ended June 30, 2011 and 2010
|
3
|
|
|
Condensed Consolidated Statements of Cash Flows for the Six Months Ended June 30, 2011 and 2010
|
4
|
|
|
Notes to Unaudited Condensed Consolidated Financial Statements
|
5 –21
|
|
|
Item 2.
|
Management’s Discussion and Analysis of Financial Condition and Results of Operation
|
22
|
|
Item 3.
|
Quantitative and Qualitative Disclosures About Market Risk
|
38
|
|
Item 4.
|
Controls and Procedures
|
38
|
|
PART II. Other Information
|
||
|
Item 1.
|
Legal Proceedings
|
40
|
|
Item 1A.
|
Risk Factors
|
40
|
|
Item 2.
|
Unregistered Sales of Equity Securities and Use of Proceeds
|
40
|
|
Item 3.
|
Defaults Upon Senior Securities
|
40
|
|
Item 4.
|
Removed and Reserved
|
40
|
|
Item 5.
|
Other Information
|
40
|
|
Item 6.
|
Exhibits
|
40
|
GLOBAL PHARM HOLDINGS GROUP, INC.
CONDENSED CONSOLIDATED FINANCIAL STATEMENTS
TABLE OF CONTENTS
|
Condensed Consolidated Financial Statements (unaudited)
|
|
|
Condensed Consolidated Balance Sheets
|
2
|
|
Condensed Consolidated Statements of Income and Comprehensive Income
|
3
|
|
Condensed Consolidated Statements of Cash Flows
|
4
|
|
Notes to Unaudited Condensed Consolidated Financial Statements
|
5 - 21
|
1
GLOBAL PHARM HOLDINGS GROUP, INC.
CONDENSED CONSOLIDATED BALANCE SHEETS
|
June 30, 2011
|
||||||||
|
|
(Unaudited)
|
December 31, 2010
|
||||||
|
ASSETS
|
||||||||
|
Current assets:
|
||||||||
|
Cash and cash equivalents
|
$ | 9,144,834 | $ | 4,271,498 | ||||
|
Accounts receivable
|
24,918,594 | 19,771,619 | ||||||
|
Inventories
|
18,980,396 | 16,058,760 | ||||||
|
Restricted cash
|
1,213,714 | 1,538,251 | ||||||
|
Other current assets
|
1,978,407 | 1,326,660 | ||||||
|
Total current assets
|
56,235,945 | 42,966,788 | ||||||
|
Property, plant and equipment, net
|
676,529 | 210,665 | ||||||
|
Intangible assets, net
|
297,874 | - | ||||||
|
Goodwill
|
374,143 | - | ||||||
|
Total assets
|
$ | 57,584,491 | $ | 43,177,453 | ||||
|
LIABILITIES AND STOCKHOLDERS' EQUITY
|
||||||||
|
Current liabilities:
|
||||||||
|
Short-term loans
|
$ | 464,145 | $ | 1,972,150 | ||||
|
Bank acceptance
|
1,528,560 | 21,212 | ||||||
|
Accounts payable and accrued expenses
|
22,023,372 | 20,944,923 | ||||||
|
Income and other taxes payable
|
2,076,102 | 1,728,499 | ||||||
|
Due to related parties
|
3,813,329 | 882,505 | ||||||
|
Total current liabilities
|
29,905,508 | 25,549,289 | ||||||
|
Stockholders' equity:
|
||||||||
|
Common stock, par value, $0.001 per share, 100,000,000 shares
authorized, 26,000,000 issued and outstanding.
|
26,000 | 26,000 | ||||||
|
Additional paid-in capital
|
9,200,623 | 9,200,623 | ||||||
|
Statutory surplus reserves
|
1,310,701 | 1,310,701 | ||||||
|
Retained earnings
|
15,764,962 | 6,546,406 | ||||||
|
Accumulated other comprehensive income
|
1,032,115 | 544,434 | ||||||
|
Total shareholders' equity - Global Pharm Holdings Group, Inc.
|
27,334,401 | 17,628,164 | ||||||
|
Non-controlling interests
|
344,582 | - | ||||||
|
Total stockholders’ equity
|
27,678,983 | 17,628,164 | ||||||
|
Total liabilities and stockholders’ equity
|
$ | 57,584,491 | $ | 43,177,453 | ||||
See accompanying notes to unaudited condensed consolidated financial statements.
2
GLOBAL PHARM HOLDINGS GROUP, INC.
CONDENSED CONSOLIDATED STATEMENTS OF INCOME AND COMPREHENSIVE INCOME
(Unaudited)
|
Three months ended June 30,
|
Six months ended June 30,
|
|||||||||||||||
|
2011
|
2010
|
2011
|
2010
|
|||||||||||||
|
Revenues, net
|
$ | 45,386,335 | $ | 30,530,977 | $ | 87,490,082 | $ | 59,259,637 | ||||||||
|
Cost of goods sold
|
38,003,386 | 24,989,792 | 72,279,229 | 48,632,162 | ||||||||||||
|
Gross profit
|
7,382,949 | 5,541,185 | 15,210,853 | 10,627,475 | ||||||||||||
|
Expenses:
|
||||||||||||||||
|
Operating expenses
|
936,732 | 233,371 | 1,352,645 | 364,999 | ||||||||||||
|
General and administrative
|
987,391 | 1,794,759 | 1,720,080 | 2,165,148 | ||||||||||||
|
Income from operations
|
5,458,826 | 3,513,055 | 12,138,128 | 8,097,328 | ||||||||||||
|
Interest income (expense)
|
843 | 13,226 | (3,381 | ) | 17,874 | |||||||||||
|
Miscellaneous expense
|
28,418 | - | 30,239 | - | ||||||||||||
|
Income before income taxes
|
5,431,251 | 3,526,281 | 12,104,508 | 8,115,202 | ||||||||||||
|
Provision for income taxes
|
1,513,005 | 1,255,682 | 2,887,305 | 2,419,451 | ||||||||||||
|
Net income – including non-controlling interest
|
3,918,246 | 2,270,599 | 9,217,203 | 5,695,751 | ||||||||||||
|
Net loss – non-controlling interests
|
1,361 | - | 1,353 | - | ||||||||||||
|
Net income - Global Pharm Holdings Group, Inc.
|
3,919,607 | 2,270,599 | 9,218,556 | 5,695,751 | ||||||||||||
|
Other comprehensive income
|
||||||||||||||||
|
Foreign currency translation adjustment
|
338,623 | 33,092 | 487,681 | 32,226 | ||||||||||||
|
Total comprehensive income
|
$ | 4,258,230 | $ | 2,303,691 | $ | 9,706,237 | $ | 5,727,977 | ||||||||
|
Earnings per share of common stock:
|
||||||||||||||||
|
Basic and diluted earnings per share
|
$ | 0.15 | $ | 0.12 | $ | 0.35 | $ | 0.30 | ||||||||
|
Basic and diluted weighted average shares
|
26,000,000 | 19,094,000 | 26,000,000 | 19,094,000 | ||||||||||||
See accompanying notes to unaudited condensed consolidated financial statements.
3
GLOBAL PHARM HOLDINGS GROUP, INC.
CONDENSED CONSOLIDATED STATEMENTS OF CASH FLOWS
(Unaudited)
|
Six Months Ended June 30,
|
||||||||
|
2011
|
2010
|
|||||||
|
Cash flows from operating activities
|
||||||||
|
Net income–including non-controlling interest
|
$ | 9,217,203 | $ | 5,695,751 | ||||
|
Adjustments to reconcile net income to net cash provided by operating activities:
|
||||||||
|
Stock-based compensation
|
- | 1,492,100 | ||||||
|
Depreciation and amortization
|
56,018 | 29,169 | ||||||
|
Changes in operating assets and liabilities:
|
||||||||
|
Accounts receivable
|
(4,214,512 | ) | (1,431,800 | ) | ||||
|
Inventories
|
(1,550,865 | ) | (5,409,249 | ) | ||||
|
Restricted cash
|
329,540 | - | ||||||
|
Other current assets
|
473,282 | (1,304,551 | ) | |||||
|
Accounts payable and other accrued liabilities
|
(232,917 | ) | 7,380,555 | |||||
|
Income and other taxes payable
|
305,186 | (776,305 | ) | |||||
|
Due from related party
|
- | (33,983 | ) | |||||
|
Due to related parties
|
875,411 | 132,940 | ||||||
|
Net cash provided by operating activities
|
5,258,346 | 5,774,627 | ||||||
|
Cash flows from investing activities
|
||||||||
|
Purchase of property, plant and equipment
|
(302,718 | ) | (9,063 | ) | ||||
|
Acquisition of subsidiaries, net of cash acquired
|
(567,391 | ) | - | |||||
|
Net cash used in investing activities
|
(870,109 | ) | (9,063 | ) | ||||
|
Cash flows from financing activities:
|
||||||||
|
Short-term loan borrowing
|
- | 365,001 | ||||||
|
Short-term loan repayments
|
(1,529,073 | ) | - | |||||
|
Bank acceptance
|
1,483,968 | (219,000 | ) | |||||
|
Dividend paid to the former shareholders
|
- | (3,208,521 | ) | |||||
|
Due from shareholders
|
- | 24,484 | ||||||
|
Contribution from non-controlling interest
|
344,835 | - | ||||||
|
Net cash provided by (used in) financing activities
|
299,730 | (3,038,036 | ) | |||||
|
Net increase in cash and cash equivalents
|
4,687,967 | 2,727,528 | ||||||
|
Effect of exchange rate changes on cash and cash equivalents
|
185,369 | (12,852 | ) | |||||
|
Cash and cash equivalents - beginning of period
|
4,271,498 | 7,455,147 | ||||||
|
Cash and cash equivalents - end of period
|
$ | 9,144,834 | $ | 10,169,823 | ||||
|
Supplemental disclosure of cash flow information:
|
||||||||
|
Cash paid for interest
|
$ | 20,662 | $ | 12,908 | ||||
|
Cash paid for income taxes
|
2,549,041 | 2,743,066 | ||||||
| Supplemental disclosure of non-cash financing activities: | ||||||||
| Accrued purchase price included in due to related parties | $ | 1,639,978 | $ | - | ||||
See accompanying notes to unaudited condensed consolidated financial statements.
4
GLOBAL PHARM HOLDINGS GROUP, INC
NOTES TO UNAUDITED CONDENSED CONSOLIDATED FINANCIAL STATEMENTS
JUNE 30, 2011
1. Description of Business and Merger
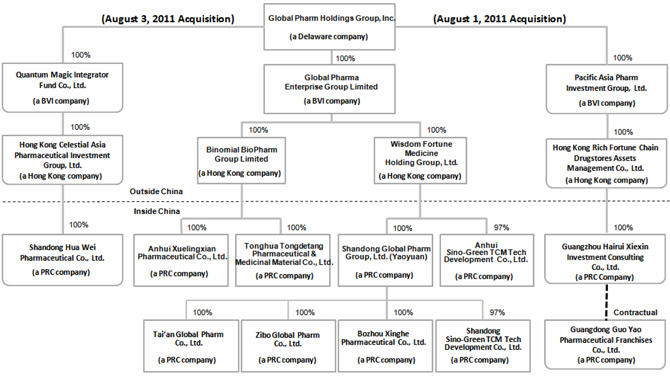
Global Pharm Holdings Group, Inc. (“Global Pharm” or the “Company”) was incorporated in Delaware on February 9, 2007. As of June 30, 2011, the Company engages in the wholesale and distribution of pharmaceutical-related products, and herbal cultivation business in China through its seven indirectly owned Chinese subsidiaries, including Tonghua Tongdetang Pharmaceutical and Medicinal Material Co., Ltd. (“Tongdetang”), Anhui Xuelingxian Pharmaceutical Co., Ltd. (“Xuelingxian”), Shandong Global Pharm Co., Ltd. (“Shandong Global”), Anhui Sino-Green TCM Tech Development Co., Ltd. (“Anhui Sino-Green TCM Tech”), Shandong Sino-Green TCM Tech Development Co., Ltd. (“Shandong Sino-Green TCM Tech”), Zibo Global Pharm Co., Ltd. (“Zibo Global,” formerly “Zibo Hongmao Pharmaceutical Sales Co., Ltd.”) and Tai’an Global Pharm Co., Ltd. (“Tai’an Global,” formerly “Tai’an Senlin Pharmaceutical Co., Ltd.” and, together with Tongdetang, Xuelingxian, Shandong Global, Anhui Sino-Green TCM Tech, Shandong Sino-Green TCM Tech, Zibo Global, the “PRC Subsidiaries”).
5
On April 6, 2011, the Company obtained the business license of Anhui Sino-Green TCM. Hong Kong Wisdom Fortune Medicine Holding Group Limited, a subsidiary of the Company (“Wisdom Fortune”), together with Anhui Qianyi Pharmaceutical Co., Ltd. (“Qianyi Pharmaceutical”), a PRC company, established the joint venture, Anhui Sino-Green TCM Tech, in Bozhou City, Anhui Province. Anhui Sino-Green TCM Tech is primarily focused on herbal cultivation business. The registered capital of Anhui Sino-Green TCM Tech is $10 million. Wisdom Fortune invested $9.7 million and Qianyi Pharmaceutical invested $0.3 million, which reflects a 97 percent and 3 percent ownership interest in Anhui Sino-Green TCM Tech, respectively. As of July 6, 2011, the Company paid $1.5 million of the registered capital and the remaining $8.2 million is due by April 6, 2013. The Company will fund the remaining registered capital from working capital and future financing.
On April 21, 2011, the Company obtained the business license of Shandong Sino-Green TCM Tech. Shandong Global together with Jinan Linong TCM Plantation Co., Ltd. (“Jinan Linong”), a PRC company, established the joint venture, Shandong Sino-Green TCM Tech, in Jinan City, Shandong Province. Shandong Sino-Green TCM Tech is primarily focused on herbal cultivation business. The registered capital of Shandong Sino-Green TCM Tech is RMB 10 million (approximately US $1.5 million). Shandong Global invested RMB 9.7 million (approximately US $1.5 million) and Jinan Linong invested RMB 0.3 million (approximately US $0.1 million), which reflects a 97 percent and 3 percent ownership interest in Shandong Sino-Green TCM Tech, respectively. On April 20, 2011, Shandong Global paid RMB 9.7 million (approximately US $1.5 million) of registered capital.
Establishing joint ventures with local companies in Bozhou City and Mashan town, represent a new stage for the Company’s development of the TCM cultivation base projects. In addition, both projects are a further step to obtain the quality TCM variety that is certified with National Geographical Place of Origin Trademark. The savings related to obtaining TCM herbal related raw materials directly from the place of origin will significantly enhance the Company’s products portfolio, and create a significant synergy between the Company’s herbal cultivation business and pharmaceutical products distribution business.
Acquisition of Zibo Global and Tai’an Global
On May 30, 2011, the Company acquired the 100% equity interest of Tai’an Global through its subsidiary, Shandong Global, for cash consideration of RMB 7 million (approximately US $1.1 million). As of June 30, 2011, the Company had paid RMB 2.3 million (approximately US $0.4 million) to the former shareholder of Tai’an Global with the remaining RMB 4.7 million (approximately US $0.7 million) to be paid before September 15, 2011. The Company will fund the remaining balance from working capital.
On May 31, 2011, the Company acquired the 100% equity interest of Zibo Global through its subsidiary, Shandong Global, for a cash consideration of RMB 8 million (approximately US $1.2 million). As of June 30, 2011, the Company had paid RMB 2.1 million (approximately US $0.3 million) to the former shareholder of Zibo Global with the remaining RMB 5.9 million (approximately US $0.9 million) to be paid before September 30, 2011. The Company will fund the remaining balance from working capital.
With the acquisition of Tai’an Global and Zibo Global, the Company enhanced the depth and breadth of its sales coverage in Shandong Province and the expansion of its distribution network into the cities of Tai'an and Zibo in Shandong. In addition, the two newly acquired entities will broaden their products portfolios by having access to the Shandong Global and Shandong Sino-Green TCM Tech’s product lines.
6
Accounting Treatment of the Merger; Financial Statement Presentation
The Company was incorporated in Delaware on February 9, 2007 under the name “Top Flight Game Birds, Inc.” Prior to the merger as described below, the Company was a non-operating shell company. On August 12, 2010, the Company entered into a Share Exchange Agreement (the “Share Exchange Agreement”) with Global Pharm BVI Enterprise Group Limited, a British Virgin Islands company formed on June 14, 2010 (“Global Pharm BVI”). Pursuant to the Share Exchange Agreement, the Company issued 1,800,000 of its restricted shares to acquire all of the issued and outstanding shares of Global Pharm BVI. Immediately subsequent to the merger, the former stockholders and key management of Global Pharm BVI were given certain call rights to acquire an aggregate of 80.36% of the outstanding common stock of the Company at four different occurrence dates, contingent on the attainment of various targets. In addition, all of the officers and directors of Global Pharm BVI were appointed as officers and directors of the Company immediately following the merger. On September 20, 2010, the Company changed its name to Global Pharm Holdings Group, Inc. Subsequent to the merger, all of the targets were attained and, upon the exercise of the call rights, the former stockholders and key management of Global Pharm BVI owned an aggregate of 80.36% of the outstanding common stock of the Company.
The merger of a private operating company into a non-operating public shell company with nominal net assets is considered to be a capital transaction in substance, rather than a business combination, for accounting purposes. Accordingly, the Company treated this transaction as a reverse merger (the “Reverse Merger”). These transactions are considered to be capital transactions in substance, rather than business combinations. Accordingly, the Share Exchange Agreement has been accounted for as a recapitalization and, for accounting purposes, Global Pharma BVI is considered the acquirer in the Reverse Merger. The historical consolidated financial statements are those of Global Pharma BVI.
2. Basis of Presentation and Summary of Significant Accounting Policies
Basis of Presentation
The accompanying unaudited Condensed Consolidated Financial Statements have been prepared in accordance with generally accepted accounting principles for interim financial information and with the instructions to Form 10-Q adopted under the Securities Exchange Act of 1934, as amended. Accordingly, they do not include all of the information and footnotes required by accounting principles generally accepted in the United States of America for complete financial statements. In the opinion of the Company’s management, the accompanying unaudited Condensed Consolidated Financial Statements contain all adjustments (consisting of normal recurring accruals and adjustments) necessary to present fairly the financial position, results of operations and cash flows of the Company at the dates and for the periods indicated. The interim results for the period ended June 30, 2011 are not necessarily indicative of results for the full 2011 fiscal year or any other future interim periods. Because the merger was accounted for as a reverse acquisition under generally accepted accounting principles, the financial statements for periods prior to August 12, 2010 reflect only the operations of Global Pharm BVI.
These unaudited Condensed Consolidated Financial Statements have been prepared by management and should be read in conjunction with the Financial Statements and notes thereto included in the Company’s Annual Report on Form 10-K for the year ended December 31, 2010 filed with the Securities and Exchange Commission.
The preparation of financial statements in conformity with generally accepted accounting principles requires that management make estimates and assumptions that affect the reported amounts of assets and liabilities and disclosure of contingent assets and liabilities at the date of the financial statements and the reported amounts of revenues and expenses during the reporting periods. Estimates and assumptions principally relate to services performed by third parties but not yet invoiced, estimates of the fair value and forfeiture rates of stock options issued to employees and consultants, and estimates of the probability and potential magnitude of contingent liabilities. Actual results could differ from those estimates.
7
Summary of Significant Accounting Policies
Purchase Accounting and Business Combinations
The Company accounts for its business combinations using the purchase method of accounting which requires that intangible assets be recognized apart from goodwill if they are contractual in nature or separately identifiable. Acquisitions are measured on the fair value of consideration exchanged and, if the consideration given is not cash, measurement is based on the fair value of the consideration given or the fair value of the assets acquired, whichever is more reliably measurable. The excess of cost of an acquired entity over the fair value of identifiable acquired assets and liabilities assumed is allocated to goodwill.
The valuation and allocation process relies on significant assumptions made by management. In certain situations, the allocations of excess purchase price are based upon preliminary estimates and assumptions. Accordingly, the allocations are subject to revision when the Company receives updated information, including appraisals and other analyses, which are completed within one year of the acquisition. Revisions to the fair values, which may be significant, are recorded when pending information is finalized, within one year from the acquisition date.
Goodwill
Goodwill is the excess of the purchase price paid over the fair value of the net assets of the acquired business. Amortization of goodwill is not permitted. Goodwill is tested annually for impairment by comparing the fair value of the reporting unit to its carrying amount including goodwill. If the carrying amount of the reporting unit exceeds its fair value, an impairment loss is recognized. The amount of impairment loss is determined by comparing the implied fair value of reporting unit goodwill with the carrying amount. If the carrying amount exceeds the implied fair value then an impairment loss is recognized equal to that excess. No impairment charges have been recorded as a result of the Company’s annual impairment assessments.
Intangible Assets
Purchased intangible assets with finite lives are amortized using the accelerated amortization method over the estimated economic lives of the assets. The Company’s finite-lived intangible assets consist of customer relationships, contractor and resume databases, trade name and internal use software and are being amortized over periods ranging from five to nine years.
Revenue Recognition
The Company’s revenue recognition policies are in compliance with Staff Accounting Bulletin 104. Sales revenue is recognized when all of the following have occurred: (i) persuasive evidence of an arrangement exists, (ii) delivery has occurred or services have been rendered, (iii) the price is fixed or determinable and (iv) the ability to collect is reasonably assured. These criteria are generally satisfied at the time of shipment when risk of loss and title passes to the customer. The Company’s four segments have the same revenue recognition policy. Revenues are recorded net of value-added taxes.
New Accounting Standards
In December 2010, the Financial Accounting Standards Board issued guidance which modifies Step 1 of the goodwill impairment test for reporting units with zero or negative carrying amounts. For those reporting units, an entity is required to perform Step 2 of the goodwill impairment test if it is more likely than not that a goodwill impairment exists. In reviewing that determination, an entity must consider whether there are any adverse qualitative factors indicating impairment may exist. This guidance is effective for fiscal years and interim periods within those years, beginning after December 15, 2010. This guidance is therefore effective for the Company’s fiscal year ending December 31, 2011.
Principles of Consolidation
The unaudited condensed consolidated financial statements include the accounts of Global Pharm Holdings Group, Inc. and its direct and indirect majority-owned subsidiaries. All significant intercompany accounts and transactions have been eliminated in consolidation.
Foreign Currency Translation
The Company’s functional currency is the Renminbi (“RMB”). The unaudited condensed consolidated financial statements of the Company are translated from RMB into US$. Accordingly, all assets and liabilities are translated at the exchange rates prevailing at the balance sheet dates, all income and expenditure items are translated at the average rates for each of the periods and equity accounts, except for retained earnings, are translated at the rate at the transaction date. Retained earnings reflect the cumulative net income (loss) translated at the average rates for the respective periods since inception less dividends translated at the rate at the transaction date.
8
RMB is not a fully convertible currency. All foreign exchange transactions involving RMB must take place either through the People's Bank of China (the "PBOC") or other institutions authorized to buy and sell foreign exchange. The exchange rates adopted for the foreign exchange transactions are the rates of exchange quoted by the PBOC, which are determined largely by supply and demand. Translation of amounts from RMB into US$ has been made at the following exchange rates for the respective periods:
|
Six Months Ended June 30,
|
||||||||
|
2011
|
2010
|
|||||||
|
Assets and liabilities
|
1 US $: 6.46350RMB
|
1 US $: 6.84930RMB
|
||||||
|
Statement of income
|
1 US $: 6.53991RMB
|
1 US $: 6.84930RMB
|
||||||
The resulting translation adjustments are recorded as other comprehensive income in the unaudited condensed consolidated statement of income and comprehensive income and as a separate component of stockholders equity.
Basic and Diluted Earnings per Share
The Company’s basic earnings per share is computed using the weighted-average number of shares outstanding for the periods presented.
Diluted earnings per share is based on the assumption that any dilutive options, warrants or other instruments were converted or exercised. Dilution is computed by applying the treasury stock method. Under this method, the Company’s outstanding stock options are assumed to be exercised, and funds thus obtained are assumed to be used to purchase common stock at the average market price during the period. As of each of June 30, 2011 and December 31, 2010, the Company has no dilutive securities.
3. Short-Term Loans
Short-term loans including accrued interest as of June 30, 2011 and December 31, 2010 consist of the following:
|
Date
obtained
|
Term
|
Interest
|
Loan amount
|
Payment
|
June 30, 2011
|
December 31, 2010
|
|||||||||||
|
12/28/10
|
December 28, 2010 - March 27, 2011
|
5.89 | % |
$1,365,335
(RMB 9 million)
|
Interest payable monthly, principle due at maturity
|
$ | - | $ | 1,365,335 | ||||||||
|
12/31/10
|
December 30, 2010 - December 31, 2011
|
6.97 | % |
$455,111
(RMB 3 million)
|
Interest payable monthly, principle due at maturity
|
464,145 | 455,111 | ||||||||||
|
5/7/10
|
June 1, 2010 - May 31, 2011
|
5.58 | % |
$151,704
(RMB 1 million)
|
Interest payable quarterly, principle due at maturity
|
- | 151,704 | ||||||||||
|
Total
|
$ | 464.145 | $ | 1,972,150 | |||||||||||||
9
On December 28, 2010, the Company entered into a credit agreement with Shandong Qilu Bank for a loan in the principal amount of $1,365,335, which is secured by a guarantee by the Company to maintain a bank deposit balance of $1,517,039 with Shandong Qilu Bank. The bank deposit is presented as restricted cash on the Company’s balance sheet at December 31, 2010. As of June 30, 2011, the loan balance has been paid in full.
On December 30, 2010, the Company entered into a credit agreement with Shandong Qilu Bank for a loan in the principal amount of $455,111, which is secured by a pledge by the Company of its inventory, valued at RMB 6 million, or $910,223. Shandong Qilu Bank has authorized a third party to monitor the pledged inventory.
On June 1, 2010, the Company entered into a credit agreement with Construction Bank of China for a loan in the principal amount of $151,704, which is secured by a guarantee by two of its shareholders and the property owned by Bozhou City Herb Research Institute, valued at RMB 4 million or $606,815. As of June 30, 2011, the loan balance has been paid in full.
Interest expense was $20,662 and $12,908 for the six months ended June 30, 2011 and 2010, respectively. Interest expense was $10,798 and $7,706 for the three months ended June 30, 2011 and 2010, respectively.
4. Income and Other Taxes Payable
Income and other taxes payable consist of the following:
|
|
June 30, 2011
|
December 31, 2010
|
||||||
|
Income tax payable
|
$ | 1,515,703 | $ | 1,177,439 | ||||
|
Value-added tax payable
|
513,446 | 445,052 | ||||||
|
City construction tax payable
|
40,135 | 31,154 | ||||||
|
Stamp duty payable
|
6,529 | 5,054 | ||||||
|
Individual tax payable
|
289 | 69,800 | ||||||
|
Total income and other taxes payable
|
$ | 2,076,102 | $ | 1,728,499 | ||||
5. Related Party Transactions
Parties are considered to be related if one party has the ability, directly or indirectly, to control the other party or exercise significant influence over the other party in making financial and operational decisions. Parties are also considered to be related if they are subject to common control or common significant influence.
10
The following table sets forth the amounts due to related parties as of June 30, 2011 and December 31, 2010.
|
Related Party
|
Relationship
|
Nature
|
June 30, 2011
|
December 31, 2010
|
||||||||
|
Yunlu Yin
|
Director, Chairman
|
Business expenses
|
$ | 1,466,840 | $ | 821,005 | ||||||
|
paid personally
|
||||||||||||
|
CEO
|
Accrued salary
|
66,000 | 30,000 | |||||||||
|
Business expenses
|
4,155 | - | ||||||||||
|
An Fu
|
Director, CFO
|
paid personally
|
||||||||||
|
Accrued salary
|
29,000 | 19,000 | ||||||||||
|
Dan Li
|
Board secretary
|
Accrued salary
|
27,500 | 12,500 | ||||||||
|
Yanliang Song
|
Vice president
|
Accrued salary
|
4,000 | - | ||||||||
|
Anhui Qianyi Pharmaceutical
|
Non-controlling interest shareholder
|
Operating expenses
|
140,713 | - | ||||||||
|
Xinjuan Lv, Lingjin Kong
|
Managements
|
Unpaid purchase price - Tai'an Global
|
727,160 | - | ||||||||
|
Jiang Yanqiu
|
Management
|
Working capital - Tai'an Global
|
187,357 | - | ||||||||
|
Hongsheng Chen
|
Management
|
Unpaid purchase price - Zibo Global
|
912,818 | - | ||||||||
|
Working capital - Zibo Global
|
239,503 | - | ||||||||||
|
Other Directors
|
Directors
|
Accrued salary
|
8,283 | - | ||||||||
|
Total
|
$ | 3,813,329 | $ | 882,505 | ||||||||
The amounts due to related parties are unsecured, non-interest bearing and payable on demand. The Company anticipates paying the remaining balance due to Mr. Yin in the third quarter in 2012. The Company will pay the unpaid purchase price of $727,160 before September 15, 2011 and $912,818 before September 30, 2011. The working capital is due on demand and the Company anticipates paying the remaining balance $426,860 by the end of 2011.
6. Statutory Reserve
The laws and regulations of the People’s Republic of China (the “PRC”) require that before a foreign invested enterprise can legally distribute profits, it must first satisfy all tax liabilities, provide for losses in previous years, and make allocations, in proportions determined at the discretion of the board of directors, to the statutory reserve. The statutory reserves include the surplus reserve fund.
The Company is required to transfer 10% of its net income, as determined in accordance with PRC accounting rules and regulations, to a statutory surplus reserve fund until such reserve balance reaches 50% of the Company's PRC subsidiaries registered capital. The transfer to this reserve must be made before distribution of any dividends to shareholders. Transfers to the statutory surplus reserve fund were nil for the six months ended June 30, 2011 and 2010. As of June 30, 2011, the Company has fulfilled the reserve requirement.
The surplus reserve fund is non-distributable other than during liquidation and can be used to fund previous years’ losses, if any, and may be utilized for business expansion or converted into share capital by issuing new shares to existing shareholders in proportion to their shareholding or by increasing the par value of the shares currently held by them, provided that the remaining reserve balance after such issue is not less than 50% of the registered capital of the Company’s PRC subsidiaries.
11
7. Commitments
Capital Commitments
On April 6, 2011, the Company obtained the business license of Anhui Sino-Green TCM Tech, Wisdom Fortune together with Qianyi Pharmaceutical, a PRC company, established the joint venture, Anhui Sino-Green TCM Tech, in Bozhou City, Anhui Province. The registered capital of Anhui Sino-Green TCM Tech is US $10 million. Wisdom Fortune will invest US $9.7 million and Qianyi Pharmaceutical will invest US $0.3 million, which reflects a 97 percent and 3 percent ownership interest in Anhui Sino-Green TCM Tech, respectively. The Company is required to pay US $8,245,000 within two years of April 6, 2011. As of July 6, 2011, the Company has paid the first payment of registered capital amount of US $1,455,000. The Company will fund the remaining registered capital requirement from working capital and future financing.
On May 30, 2011, the Company acquired the 100% equity interest of Tai’an Global through its subsidiary, Shandong Global, for cash consideration of RMB 7 million (approximately US $1.1 million). As of June 30, 2011, the Company had paid RMB 2.3 million (approximately US $0.4 million) to the former shareholder of Tai’an Global with the remaining RMB 4.7 million (approximately US $0.7 million) to be paid before September 15, 2011. The Company will fund the remaining registered capital requirement from working capital.
On May 31, 2011, the Company acquired the 100% equity interest of Zibo Global through its subsidiary, Shandong Global, for cash consideration of RMB 8 million (approximately US $1.2 million). As of June 30, 2011, the Company had paid RMB 2.1 million (approximately US $0.3 million) to the former shareholder of Zibo Global with the remaining RMB 5.9 million (approximately US $0.9 million) to be paid before September 30, 2011. The Company will fund the remaining registered capital requirement from working capital.
Lease Commitments
As of June 30, 2011, the Company has entered into or assumed the following lease agreements subsequent to December 31, 2010. The following table sets forth the lessor, term, payment and purpose of the leased property:
12
|
Lessor
|
Term
|
Rent per year
|
Description
|
||||||||
|
RMB
|
US $
|
||||||||||
|
Mengwang Village Committee of Dayang County, Qiaocheng District, Bozhou City, Anhui Province, PRC
|
January 1, 2011-December 31, 2015
|
6,820,000 | $ | 1,041,204 |
Used for herbal cultivation, totaling 791 acres.
|
||||||
|
Limenlou Village Committee of Shijiuli County, Qiaocheng Dictrict, Bozhou City, Anhui Province, PRC
|
January 1, 2011-December 31, 2015
|
5,280,000 | $ | 806,095 |
Used for herbal cultivation, totaling 1,021 acres.
|
||||||
|
Tai'anDabaiyu Community Committee
|
May 30, 2011 - February 28, 2014
|
103,680 | $ | 15,951 |
Used as office, totaling 1,744 square feet; Used for warehouse, totaling 13,175 square feet
|
||||||
|
Shandong Zibo Pharmaceutical Supply Station
|
May 31, 2011 - December 31, 2011
|
61,400 | $ | 9,446 |
Used as warehouse, totaling 10,656 square feet
|
||||||
|
Zibo Professional Tech School
|
May 31, 2011- December 31, 2011
|
73,820 | $ | 11,357 |
Used as office and workforce dormitory , totaling 8,352 square feet
|
||||||
|
Zibo Professional Tech School
|
May 31, 2011 - December 31, 2011
|
24,000 | $ | 3,692 |
Used as warehouse, totaling 2,863 square feet
|
||||||
|
Shandong Province Changqing district, Masha town People's Government
|
April 10, 2011- April 9, 2021
|
40,000 | $ | 6,154 |
Used as office, totaling 10,764 square feet
|
||||||
|
Shandong Province Changqing district, Masha town People's Government
|
April 29,2011 - April 28 2041
|
1,349,677 | $ | 207,645 |
Used for TCM cultivation land, totaling 352.9 acres
|
||||||
|
|
June 10, 2011 - June 9 2021
|
1,710,000 | $ | 263,081 |
Used for TCM Cultivation land, totaling 330 acres
|
||||||
|
Bozhou City Qiaocheng District Shibali Town Government
|
October 10, 2011 - October 9, 2021
|
6,840,000 | $ | 1,052,322 |
Used for TCM Cultivation land, totaling 1,318 acres
|
||||||
|
January 1, 2012 - December 31, 2021
|
8,550,000 | $ | 1,315,403 |
Used for TCM Cultivation land, totaling 1,647 acres
|
|||||||
|
Wan Zhi Li
|
May 20, 2011 - December 31, 2011
|
3,244 | $ | 499 |
Used as office, warehouse and workforce dormitory, totaling 2,153 square feet
|
||||||
8. Concentrations
Hainan Lingkang Pharmaceutical Co., Ltd (“Lingkang”) accounted for approximately 26.0% of the Company’s purchases for the six months ended June 30, 2011; Lingkang and Bozhou Zhongzheng Herb Pieces Co., Ltd (“Zhongzheng”) accounted for approximately 32.6% and 11.6% of the Company’s purchases for the six months ended June 30, 2010, respectively.
13
Lingkang accounted for approximately 25% and 31% of the Company’s outstanding accounts payable as of June 30, 2011 and December 31, 2010.
There were no customers who accounted for greater than 10% of the Company’s sales for each of the six months ended June 30, 2011 and 2010. There were no customers that accounted for greater than 10% of outstanding accounts receivable as of June 30, 2011, and December 31, 2010.
9. Acquisitions
As previously discussed in Note 1, the Company completed the acquisitions of Tai’an Global and Zibo Global on May 30, 2011 and May 31, 2011, respectively. The pro forma condensed combined financial statements reflect the accounting for the transactions under the acquisition method; as such the purchase prices are allocated to the assets acquired and liabilities assumed based on the Company’s estimate of fair value by utilizing a third-party valuation report, with any excess of the purchase prices acquired over the fair value of the identifiable net assets recorded as goodwill. The Company acquired gross accounts receivable of $490,206 that also represents the fair value.
The following is the purchase price allocation for Tai’an Global and Zibo Global:
|
Tai'an Global
|
Zibo Global
|
Total
|
||||||||||
|
Consideration
|
||||||||||||
|
Cash
|
$ | 1,083,005 | $ | 1,237,720 | $ | 2,320,725 | ||||||
|
Fair value of total consideration transferred
|
1,083,005 | 1,237,720 | 2,320,725 | |||||||||
|
Acquisition-related costs
|
- | - | - | |||||||||
|
Recognized amounts of identifiable assets acquired and liabilities assumed
|
||||||||||||
|
Cash and cash equivalent
|
12,477 | 100,879 | 113,356 | |||||||||
|
Accounts receivable
|
102,374 | 387,832 | 490,206 | |||||||||
|
Other receivable and current assets
|
464,145 | 640,276 | 1,104,421 | |||||||||
|
Inventories
|
250,392 | 783,305 | 1,033,697 | |||||||||
|
Property, plant and equipment
|
143,248 | 51,402 | 194,650 | |||||||||
|
Software
|
3,945 | 4,466 | 8,411 | |||||||||
|
Customer relationship
|
139,553 | 168,533 | 308,086 | |||||||||
|
Total liabilities
|
(200,577 | ) | (1,105,668 | ) | (1,306,245 | ) | ||||||
|
Total identifiable net assets
|
915,557 | 1,031,025 | 1,946,582 | |||||||||
|
Goodwill
|
167,448 | $ | 206,695 | $ | 374,143 | |||||||
The following table sets forth the net cash outflow on acquisition:
|
Zibo Global
|
Tai'an Global
|
Total
|
||||||||||
|
Consideration
|
||||||||||||
|
Cash
|
$ | 1,237,720 | $ | 1,083,005 | $ | 2,320,725 | ||||||
|
Acquisition payable to former shareholders (Note 5)
|
912,818 | 727,160 | 1,639,978 | |||||||||
|
Cash and cash equivalent in subsidiaries acquired
|
100,879 | 12,477 | 113,356 | |||||||||
|
Net cash outflow on acquisition
|
224,023 | 343,368 | 567,391 | |||||||||
The fair value of the intangible assets and the estimated useful lives over which they are being amortized on an accelerated basis are:
|
Fair Value
|
Estimated Useful life
|
||||
|
Customer relationships
|
$ | 308,086 |
5 years
|
||
The Company recorded amortization expenses of $10,212 for the three and six months ended June 30, 2011.
14
The transaction resulted in a purchase price allocation of $374,143 to goodwill, representing the financial, strategic and operational value of the transaction to the Company. Goodwill is attributed to the premium that the Company was willing to pay to obtain the value of the business of each of Tai'an Global and Zibo Global and the synergies created with the integration of key components of a commercial infrastructure. The total amount of the goodwill acquired is not deductible for tax purposes. Goodwill of $374,143 is allocated to the pharmaceutical products distribution segment.
The following table sets forth revenue and earnings for Tai’an Global and Zibo Global included in the Company’s unaudited condensed consolidated statements of income and comprehensive income for the six months ended June 30, 2011, and the revenue and earnings of the combined entities had the acquisitions occurred on either January 1, 2011 or January 1, 2010:
|
|
Revenue
(Unaudited)
|
Earning
(Unaudited)
|
||||||
|
Tai'an Global
|
USD
|
USD
|
||||||
|
Actual from 5/30/2011 to 6/30/2011
|
363,820 | (11,223 | ) | |||||
|
Supplemental pro forma from 1/1/2011 to 6/30/2011
|
1,356,200 | (20,474 | ) | |||||
|
Supplemental pro forma from 1/1/2010 to 6/30/2010
|
871,431 | (14,419 | ) | |||||
|
Revenue
(Unaudited)
|
Earning
(Unaudited)
|
|||||||
|
Zibo Global
|
USD
|
USD
|
||||||
|
Actual from 5/31/2011 to 6/30/2011
|
1,400,596 | (53,104 | ) | |||||
|
Supplemental pro forma from 1/1/2011 to 6/30/2011
|
5,664,506 | (106,909 | ) | |||||
|
Supplemental pro forma from 1/1/2010 to 6/30/2010
|
2,143,110 | (28,327 | ) | |||||
10. Segment Reporting
The Company uses the management approach model for segment reporting. The management approach model is based on how management organizes segments within a company for making operating decisions and assessing performance. Reportable segments are based on products and services, geography, legal structure, management structure or any other manner in which management disaggregates a company. Based on this model, the Company has four reportable segments. The Company’s principal businesses are pharmaceutical products distribution, TCM processing and distribution, herbal cultivation and sales, and flower tea bags. All sales were sold to customers in the PRC.
Based on the various operation activities, the Company’s reportable segments are as follows:
|
|
¨
|
Pharmaceutical products distribution – the sale of healthcare products to hospitals and pharmacy shops.
|
|
|
¨
|
TCM processing and distribution – rough processing and sale of TCM product.
|
|
|
¨
|
Herbal cultivation and sales – the planting, processing and selling of herbs in China.
|
|
|
¨
|
Flower tea bags – manufacture and sale of flower tea bags.
|
15
In April 2011, the Company's management decided to reclassify operations of OEM products from the TCM processing and distribution segment to the pharmaceutical products distribution segment in order to better manage the OEM products sales. The three and six months periods ended June 30, 2010 segment reporting for the TCM processing and distribution segment and pharmaceutical products distribution segment have been reclassified accordingly.
|
For the six months ended June 30, 2011 (unaudited)
|
||||||||||||||||||||||||
|
US $
|
Pharmaceutical
products
distribution
|
TCM processing
and distribution
|
Herbal cultivation
and sales
|
Flower tea
bags
|
Corporate
|
Total
|
||||||||||||||||||
|
Revenue, net
|
72,169,822 | 10,365,812 | 4,679,373 | 275,075 | - | 87,490,082 | ||||||||||||||||||
|
Net income - Global Pharm Holdings Group, Inc.
|
7,306,147 | 1,314,860 | 1,299,417 | 76,759 | (778,627 | ) | 9,218,556 | |||||||||||||||||
|
Total assets
|
41,910,549 | 13,549,858 | 1,950,706 | - | 173,378 | 57,584,491 | ||||||||||||||||||
|
For the six months ended June 30, 2010 (unaudited) (reclassified)
|
||||||||||||||||||||||||
|
US $
|
Pharmaceutical
products
distribution
|
TCM processing
and distribution
|
Herbal cultivation
and sales
|
Flower tea
bags
|
Corporate
|
Total
|
||||||||||||||||||
|
Revenue, net
|
47,360,171 | 9,000,270 | - | 2,899,196 | - | 59,259,637 | ||||||||||||||||||
|
Net income
|
5,586,817 | 1,115,455 | - | 529,936 | (1,536,457 | ) | 5,695,751 | |||||||||||||||||
|
Total assets
|
26,852,037 | 12,502,743 | - | - | 257,818 | 39,612,598 | ||||||||||||||||||
|
For the three months ended June 30, 2011 (unaudited)
|
||||||||||||||||||||||||
|
US $
|
Pharmaceutical
products
distribution
|
TCM processing
and distribution
|
Herbal cultivation and
sales
|
Flower tea bags
|
Corporate
|
Total
|
||||||||||||||||||
|
Revenue, net
|
39,738,572 | 5,647,763 | - | - | - | 45,386,335 | ||||||||||||||||||
|
Net income- Global Pharm Holdings Group, Inc.
|
3,769,281 | 696,485 | (44,000 | ) | - | (502,159 | ) | 3,919,607 | ||||||||||||||||
|
For the three months ended June 30, 2010 (unaudited) (reclassified)
|
||||||||||||||||||||||||
|
US $
|
Pharmaceutical
products
distribution
|
TCM processing
and distribution
|
Herbal cultivation and
sales
|
Flower tea
bags
|
Corporate
|
Total
|
||||||||||||||||||
|
Revenue, net
|
24,338,686 | 4,314,919 | - | 1,877,372 | - | 30,530,977 | ||||||||||||||||||
|
Net income
|
2,893,228 | 547,607 | - | 321,864 | (1,492,100 | ) | 2,270,599 | |||||||||||||||||
16
11. Subsequent Event
On July 4, 2011, Shandong Global, entered into a merger and acquisition agreement (the “Merger and Acquisition Agreement”), as thereafter amended on July 5, 2011 pursuant to a supplemental agreement (“the Supplemental Agreement”), with Bozhou Xinghe Pharmaceutical Co., Ltd (“Bozhou Xinghe”) and the stockholders of Bozhou Xinghe to purchase the 100% equity interest of Bozhou Xinghe for cash consideration of RMB 30 million (approximately US $4.6 million). Bozhou Xinghe was incorporated on April 16, 2009 under the laws of the PRC and is a Traditional Chinese Medicine (“TCM”) herb processing manufacturer. On July 5, 2011, the Company obtained the new business license of Bozhou Xinghe and completed the acquisition. After the completion of the acquisition, Bozhou Xinghe became a wholly owned subsidiary of the Company. Under the terms of the Merger and Acquisition Agreement, as thereafter amended, the Company is required to pay the former stockholders of Bozhou Xinghe an amount of RMB 20 million (approximately US $3.1 million) within 15 business days after the Company receives the new business license and another RMB 10 million (approximately US $1.5 million) within nine months after the date of completion. On August 8, 2011, the Company had paid RMB 10 million (approximately US $1.5 million) and will pay another RMB 10 million to the former shareholders of Bozhou Xinghe before August 30, 2011 with the remaining RMB 10 million to be paid before April 5, 2012. The Company will fund the unpaid acquisition cost from working capital.
Under the terms of the Merger and Acquisition Agreement and the Supplemental Agreement, the Company will only acquire the fixed assets, land uses right, and Good Manufacturing Practice (“GMP”) certificates, and will assume the bank loans and the registered capital of Bozhou Xinghe. The former stockholders will be entitled to Bozhou Xinghe’s bank deposits, accounts receivable, prepayments and other current assets, accounts payable, taxes payable and other current liabilities, and intangible assets including customer relationships and sales network.
The following table sets forth the Company’s best estimate of fair value of the assets acquired and liabilities assumed. The Company is in the process of obtaining a third-party valuation for the assets acquired and liabilities assumed, and will refine fair value estimates when the valuation is completed using the balances as of the closing date, July 5, 2011.
|
|
Bozhou Xinghe
|
|||
|
Consideration
|
|
|||
|
Cash
|
$ | 4,640,371 | ||
|
Fair value of assets transferred
|
4,640,371 | |||
|
Acquisition related costs (appraisal, audit, legal) - estimated
|
76,566 | |||
|
|
|
|||
|
Property, plant and equipment
|
7,835,422 | |||
|
Vehicles
|
54,082 | |||
|
Land use rights
|
1,173,248 | |||
|
GMP certificates
|
773,193 | |||
|
Bank loans
|
(7,115,236 | ) | ||
|
Total identifiable net assets
|
2,720,709 | |||
|
Goodwill
|
$ | 1,919,662 | ||
The acquisition of Bozhou Xinhe represents a direct complement to the Company’s TCM plantation business in the cities of Bozhou and Jinan by the addition of a critical production capacity, so that the Company’s cultivated raw herbs can be processed directly at its own plant. In addition, this facility offers the Company a potential platform to produce TCM pharmaceutical products in the near future. Such direct-processing capacity with its stringent quality control would serve to further guarantee our product quality, which will reward the Company a premium price in the market. The new plant will also allow the Company to customize some herbal pieces products upon distribution customers' request, therefore, expanding its distributed product portfolio.
The Company will apply acquisition accounting to the Bozhou Xinghe acquired business and its results of operations will be included in the Company’s consolidated results of operations following the respective acquisition date. The contributed businesse of Bozhou Xinghe will be recorded at its fair value.
Due to the recent nature of the Bozhou Xinghe acquisition and limitations on access to Bozhou Xinghe’s information prior to the acquisition date, the initial accounting for the business acquisition is incomplete as of the date of this report. The Company is unable to provide amounts recognized as of the acquisition date for major classes of assets and liabilities acquired and resulting from the transaction, including the information required for intangible assets and goodwill. The Company is in the process of obtaining third-party valuation for the assets acquired and liabilities assumed, and will refine fair value estimates when the valuation is completed using the balances as of the closing date, July 5, 2011. The Company also cannot provide the supplemental pro forma revenue and earnings of the combined entity due to the incomplete initial accounting for the transaction. The Company will include this information in its Quarterly Report on Form 10-Q for the three months ending September 30, 2011.
17
Quantum Acquisition
On August 3, 2011, the Company entered into a Share Purchase Agreement (the “Acquisition Agreement”) with each of the persons set forth in Schedule B-1 thereto (each a “Quantum Seller” and collectively the “Quantum Sellers”). Pursuant to the Acquisition Agreement, the Sellers agreed to sell and the Company agreed to purchase the aggregate of 50,000 ordinary shares (“Sale Shares”) in Quantum Magic Integrator Fund Co., Limited, a company incorporated and existing under the laws of the British Virgin Islands (“Quantum”), representing the entire issued share capital of Quantum. The consideration for the Sale Shares is US $9,000,000, to be paid in full by the Company by issuing the Consideration Shares (as defined under the Acquisition Agreement) to the Quantum Sellers within 90 days after the Closing Date (as defined under the Acquisition Agreement). The number of the Consideration Shares to be issued to the Quantum Sellers shall be equal to US $9,000,000 divided by the fair market value of the Company’s issued and outstanding common stock as at the Closing Date, as determined by a third-party appraiser selected by the Company at its discretion. As of the date of this report, the Company is in the process of obtaining third-party valuation for its common stock as of such date of execution. Under the Quantum Share Purchase Agreement, 80% of the total shares to be issued will be issued to the original stockholders of Quantum within 90 days after the date of the Quantum Share Purchase Agreement and the remaining 20% to be pledged to the Company. The pledged shares shall be transferred to the original shareholders of Quantum if Shandong Hua Wei Pharmaceutical Co., Ltd. (“Shandong Hua Wei”) achieves certain revenue targets for 2011.
On the date of the Acquisition Agreement, the Company and the Quantum Sellers also entered into a Share Pledge Agreement pursuant to which the Sellers pledge 10% of the Consideration Shares to Global Pharm to secure the Sellers’ covenants and undertakings in relation to Quantum’s financial performance for the fiscal year ending December 31, 2011 as set forth in the Acquisition Agreement.
Quantum, incorporated in the British Virgin Islands on April 19, 2010, held the 100% equity interest of Hong Kong Celestial Asia Pharmaceutical Investment Group Limited (“Celestial Asia Pharm”). Celestial Asia Pharm, a Hong Kong holding company, was incorporated on August 24, 2009 under the laws of Hong Kong, and held the 100% equity interest of Shandong Hua Wei. Shandong Hua Wei was incorporated on March 18, 1998 under the laws of the PRC and engages in the pharmaceutical-related products distribution business in China. Upon execution of the Quantum Share Purchase Agreement, Shandong Hua Wei became an indirectly wholly owned subsidiary of the Company.
The acquisition of Quantum will expand the Company’s sales coverage in Shandong Province.
The following table set forth Quantum’s revenue and earnings included in the Company’s unaudited condensed consolidated statements of income and comprehensive income for the six months ended June 30, 2011, and the revenue and earnings of the combined entity had the acquisition of Quantum occurred on either January 1, 2011 or January 1, 2010. The information presented below is based on the Company’s initial estimates and does not consider amortization expense of intangible assets:
|
|
Revenue
(unaudited)
|
Earning
(unaudited)
|
||||||
|
Quantum
|
USD
|
USD
|
||||||
|
Actual from 6/1/2011 to 6/30/2011
|
- | - | ||||||
|
Supplemental pro forma from 1/1/2011 to 6/30/2011
|
25,804,650 | 6,599 | ||||||
|
Supplemental pro forma from 1/1/2010 to 6/30/2010
|
20,321,782 | 13,849 | ||||||
The Company will apply acquisition accounting to the Quantum acquired businesses and their results of operations will be included in the Company’s consolidated results of operations following the acquisition date. The acquired businesses of Quantum will be recorded at its fair value.
Due to the recent nature of the Quantum acquisition and limitations on access to Quantum’s information prior to such acquisition date, the initial accounting for the business acquisition is incomplete as of the date of this report. The Company is unable to provide amounts recognized as of the acquisition date for major classes of assets and liabilities acquired and resulting from the transactions, including the information required for indemnification assets and goodwill since the incomplete initial accounting for the transactions. The Company is in the process of obtaining third-party valuation for the assets acquired and liabilities assumed, and will refine fair value estimates when the valuation is completed using the balances as of the closing date, August 3, 2011.
Pacific Asia Acquisition
On August 1, 2011, the Company entered into a Share Purchase Agreement (the “Acquisition Agreement”) with each of the persons set forth in Schedule B-1 thereto (each a “Pacific Asia Seller” and collectively the “Pacific Asia Sellers”). Pursuant to the Acquisition Agreement, the Pacific Asia Sellers agreed to sell and the Company agreed to purchase the aggregate of 50,000 ordinary shares (“Sale Shares”) in Pacific Asia Pharm Investment Group Co., Limited, a company incorporated and existing under the laws of the British Virgin Islands (“Pacific Asia”), representing the entire issued share capital of Pacific Asia. The consideration for the Sale Shares is US $42,000,000, to be paid in full by Global Pharm by issuing the Consideration Shares (as defined under the Acquisition Agreement) to the Pacific Asia Sellers within 90 days after the Closing Date (as defined under the Acquisition Agreement). The number of the Consideration Shares to be issued to the Pacific Asia Sellers shall be equal to US $42,000,000 divided by the fair market value of the Company’s issued and outstanding common stock as at the Closing Date, as determined by a third-party appraiser selected by the Company at its discretion.
On the date of the Acquisition Agreement, the Company and the Pacific Asia Sellers also entered into a Share Pledge Agreement pursuant to which the Pacific Asia Sellers pledge 10% of the Consideration Shares to Global Pharm to secure the Pacific Asia Sellers’ covenants and undertakings in relation to Pacific Asia’s financial performance for the fiscal year ending December 31, 2011 as set forth in the Acquisition Agreement.
18
Pacific Asia, incorporated in the British Virgin Islands on April 8, 2010, held the 100% equity interest of Hong Kong Rich Fortune Chain Drugstores Assets Management Co., Ltd. (“Rich Fortune”). Rich Fortune, a Hong Kong holding company, was incorporated on January 12, 2009 under the laws of Hong Kong, held the 100% equity interest of Guangzhou Hairui Xiexin Investment Consulting Co., Ltd. (“Hairui Xiexin”). Hairui Xiexin was incorporated on June 3, 2011 under the laws of the PRC.
Guangdong Guo Yao Pharmaceutical Franchises Co. Ltd. (“GDGY”), a pharmaceutical-related products distributor, was incorporated on June 6, 2001 under the laws of the PRC. As of August 1, 2011, GDGY manages a chain of 1,234 drug stores in the Guangdong Province and manages these drug stores through a target management contract entered into with the manager of each store, pursuant to which the managers are the primary beneficiary of each drug store and assume full responsibility for the operating and legal risks of each drug store. The drug stores shall purchase pharmaceutical-related products from GDGY directly at market price; otherwise, the drug stores must pay a franchise fee of a pre-determined sum to GDGY.
Effective as of July 11, 2011, Hairui Xiexin entered into a series of contractual arrangements with GDGY and the shareholders of GDGY, pursuant to which Hairui Xiexin will act as the management company and operation trustee for GDGY, while GDGY conducts the principal operations of the business. The contractual agreements effectively transferred the economic benefits of GDGY’s business to Hairui Xiexin, and Hairui Xiexin assumed effective control and management of GDGY. The contractual agreements include the following:
(i) Entrusted Management Agreement
The Entrust Management Agreement, entered into by and between Hairui Xiexin and GDGY, and the shareholders of GDGY, provides that Hairui Xiexin shall provide exclusive technical, business and management consulting services to GDGY. GDGY shall timely pay the service fees to Hairui Xiexin in the manner and at the time designated by Hairui Xiexin.
(ii) Proxy Agreement
The Proxy Agreement, entered into by and between Hairui Xiexin, GDGY and the shareholders of GDGY, provides that the GDGY shareholders shall irrevocably entrust a designee of Hairui Xiexin with such shareholders’ voting rights and the right to represent such shareholders to exercise such shareholders’ rights at any shareholders’ meeting of GDGY or with respect to any shareholder action to be taken in accordance with the applicable laws and GDGY’s articles of association. The terms of the agreement are binding on the parties for as long as the GDGY’s shareholders continue to hold any equity interest in GDGY. Any GDGY shareholder will cease to be a party to the agreement once it transfers its equity interests with the prior approval of Hairui Xiexin.
(iii) Exclusive Option Agreement
The Exclusive Option Agreement, entered into by and between Hairui Xiexin, GDGY and the shareholders of GDGY, grants Hairui Xiexin an irrevocable exclusive purchase option to purchase all or part of the shares of GDGY currently owned by the shareholders of GDGY at the lowest price which is permitted under the laws of the PRC. Without Hairui Xiexin’s prior consent, GDGY shall not distribute any dividend to its shareholders. With Hairui Xiexin’s consent, GDGY could distribute dividend to its shareholders and Hairui Xiexin shall be entitled to receive all the dividends or proceeds distributed.
19
(iv) Share Pledge Agreement
The Share Pledge Agreement entered into by and between Hairui Xiexin, GDGY, and the shareholders of GDGY, provides that the shareholders of GDGY shall pledge all of their equity interests in GDGY to Hairui Xiexin as security against their obligations under the other management agreements described in this section. Under the terms of Share Pledge Agreement, the shareholders of GDGY shall not transfer any of the pledged shares without the permission of Hairui Xiexin and Hairui Xiexin shall be entitled to receive all proceeds (if any) resulting from the pledged shares, including but not limited to any bonus, dividend and any other returns on the pledged equity.
(v) Management Fee Payment Agreement
The Management Fee Payment Agreement, entered into by and between Hairui Xiexin, GDGY and the shareholders of GDGY, provides that the shareholders of GDGY shall pay the management fees to Hairui Xiexin in accordance with the Proxy Agreement and the Exclusive Option Agreement. The amount of the management fee shall be equal to the amount Hairui Xiexin is to pay to GDGY or the shareholders of GDGY in the event that Hairui Xiexin exercises the exclusive option pursuant to the Exclusive Option Agreement.
As a result of the Pacific Asia Share Exchange Agreement and the above contractual agreements, Pacific Asia, Rich Fortune and GDGY became directly and indirectly controlled companies by the Company, and GDGY continued to function as the Company’s operating entity.
With the acquisition of Pacific Asia, the Company will have opportunity to extend its integrated value chain into the pharmaceutical retailing sector. The acquisition will also enhance the Company’s goods purchase power and increase the sales volume of high profit TCM products. The acquisition of Pacific Asia will increase the value for the Company’s distribution business segment and offers extensive retail channel for its quality TCM herb products obtained directly from its TCM business entities in Bozhou City.
The Company will apply acquisition accounting to the Pacific Asia acquired businesses and their results of operations will be included in the Company’s consolidated results of operations following the acquisition date. The acquired business of Pacific Asia will be recorded at fair value.
The following table sets forth Pacific Asia’s revenue and earnings included in the Company’s unaudited condensed consolidated statements of income and comprehensive income for the six months ended June 30, 2011, and the revenue and earnings of the combined entity had the acquisition of Pacific Asia occurred on either January 1, 2011 or January 1, 2010. The information presented below is based on the Company’s initial estimates and does not take into consideration amortization expense of intangible assets:
20
|
Revenue
(unaudited)
|
Earning
(unaudited)
|
|||||||
|
Pacific Asia
|
USD
|
USD
|
||||||
|
Actual from 6/1/2011 to 6/30/2011
|
- | - | ||||||
|
Supplemental pro forma from 1/1/2011 to 6/30/2011
|
26,092,357 | 2,978,716 | ||||||
|
Supplemental pro forma from 1/1/2010 to 6/30/2010
|
22,295,462 | 2,496,814 | ||||||
Due to the recent nature of the acquisition of Pacific Asia and limitations on access to Pacific Asia information prior to the acquisition date, the initial accounting for the business acquisition is incomplete as of the date of this report. The Company is unable to provide amounts recognized as of the acquisition date for major classes of assets and liabilities acquired and resulting from the transaction, including the information required for indemnification assets and goodwill since the incomplete initial accounting for the transaction. The Company is in the process of obtaining third-party valuation for the assets acquired and liabilities assumed, and will refine fair value estimates when the valuation is completed using the balances as of the closing date, August 1, 2011.
21
MANAGEMENT’S DISCUSSION AND ANALYSIS OF FINANCIAL CONDITION AND RESULTS OF OPERATION
Forward-Looking Information
The following discussion should be read in conjunction with our consolidated financial statements and notes to those consolidated financial statements, included elsewhere in this Quarterly Report on Form 10-Q. This discussion contains forward-looking statements that involve risks and uncertainties. We have tried, wherever possible, to identify these forward-looking statements by using words such as “forecast,” “project,” “anticipate,” “plan,” “strategy,” “intend,” “potential,” “outlook,” “target,” “seek,” “continue,” “believe,” “could,” “estimate,” “expect,” “may,” “probable,” “should,” “will” or other words of similar meaning. Our actual results and the timing of selected events could differ materially from those anticipated in these forward-looking statements as a result of various factors, including those set forth under “Risk Factors” contained in our Annual Report on Form 10-K for the year ended December 31, 2010, filed with the SEC on April 13, 2011 and elsewhere in this Report.
Overview
We were incorporated in Delaware on February 9, 2007, under the name “Top Flight Gamebirds, Inc.” Our principal executive offices are located at Room 2503-2505, New World Center, No. 6009 Yitian Road, Futian District, Shenzhen, Guangdong 518026, People’s Republic of China, or the PRC. On September 20, 2010, we changed our name to Global Pharm Holdings Group, Inc. Prior to the merger as described below, we were a non-operating shell company.
On August 12, 2010, we entered into a Share Exchange Agreement (referred to as the Share Exchange Agreement) with Global Pharm BVI Enterprise Group Limited (referred to as Global Pharm BVI), a British Virgin Islands company formed on June 14, 2010. Pursuant to the Share Exchange Agreement, we issued 1,800,000 of our restricted shares to acquire all of the issued and outstanding shares of Global Pharm BVI. Immediately subsequent to the merger, the former stockholders and key management of Global Pharm BVI were given certain call rights to acquire an aggregate of 80.36% of our outstanding common stock at four different occurrence dates, contingent on the attainment of various targets. In addition, all of the officers and directors of Global Pharm BVI were appointed as our officers and directors immediately following the merger. Subsequent to the merger, all of the targets were attained and, upon the exercise of the call rights, the former stockholders and key management of Global Pharm BVI owned an aggregate of 80.36% of our outstanding common stock.
The merger of a private operating company into a non-operating public shell company with nominal net assets is considered to be a capital transaction in substance, rather than a business combination, for accounting purposes. Accordingly, we treated this transaction as a reverse merger, referred to as the Reverse Merger. These transactions are considered to be capital transactions in substance, rather than business combinations. Accordingly, the Share Exchange Agreement has been accounted for as a recapitalization and, for accounting purposes, Global Pharma BVI is considered the acquirer in the Reverse Merger. The historical consolidated financial statements are those of Global Pharma BVI.
22
We are engaged in the wholesale and distribution of pharmaceutical-related products and herbal cultivation business in China through our indirectly owned Chinese subsidiaries, including Tonghua Tongdetang Pharmaceutical and Medicinal Material Co., Ltd. (referred to as Tongdetang), Anhui Xuelingxian Pharmaceutical Co., Ltd. (referred to as Xuelingxian), Shandong Global Pharm Co., Ltd. (referred to as Shandong Global), Zibo Global Pharm Co., Ltd. (referred to Zibo Global), Tai’an Global Pharm Co., Ltd. (referred to Tai’an Global), Bozhou Xinghe Pharmaceutical Co., Ltd (referred to as Bozhou Xinghe), Shandong Hua Wei Pharmaceutical Col, Ltd. (referred to as Shandong Hua Wei), Guangdong Guoyao Pharmaceutical Franchises Co., Ltd. (referred to as GDGY), Anhui Sino-Green TCM Tech Development Co., Ltd. (referred to as Anhui Sino-Green TCM Tech) and Shandong Sino-Green TCM Tech Development Co., Ltd. (referred to as Shandong Sino-Green TCM Tech, together with Tongdetang, Xuelingxian, Shandong Global, Zibo Global, Tai’an Global, Bozhou Xinghe, Shandong Hua Wei, GDGY and Anhui Sino-Green TCM Tech, referred to as the PRC Subsidiaries).
Pharmaceutical Product Distribution Segment
Our products include prescription drugs, over-the-counter, or OTC, drugs and nutritional supplements. For the six months ended June 30, 2011, we sold approximately 11,800 different types of products and had more than 4,250 clients that spanned hospitals, clinics, pharmacies and drugstores, and other healthcare institutions.
For the six months ended June 30, 2011 and 2010, the sales from our pharmaceutical product distribution segment accounted for 82.5% and 79.9% of our total sales, respectively. Shandong Global, Tongdetang, Tai’an Global, Zibo Global, Shandong Hua Wei and GDGY are focused primarily on the distribution business. They purchase pharmaceutical-related products from manufacturers and wholesalers and sell the products to hospitals, other distributors, health clinics, chain and individual drug stores, among others.
In January 2011, we renewed the exclusive distribution agreements with each of Xiuzheng Pharmaceutical Group Marketing Co., Ltd., or Xiuzheng, and Hainan Lingkang Pharmaceutical Co., Ltd., or Lingkang, for a one-year term.
TCM Processing and Distribution Segment
We process approximately 500 varieties of Chinese natural herbs that are purchased from the Bozhou TCM raw materials transaction market, and sell these processed herbs to pharmaceutical distributors, hospitals or various types of medical institutions. These treated herbs are often called “prepared slices” and can be immediately used as herbal medicine. The kind of treatment applied to the herbs varies according to the type of herb. Our subsidiaries, Xuelingxian and Bozhou Xinghe, are focused on the TCM processing and distribution business. For the six months ended June 30, 2011 and 2010, the sales from our TCM processing and distribution segment accounted for 11.9% and 15.2% of our total sales, respectively.
23
Herbal Cultivation and Sales Segment
We also grow several varieties of Chinese herbs such as Chrysanthemum, Salvia, Saposhnikoviadivaricata angelica dahurica, Cortex, and similar items, and sell them at the Bozhou TCM raw materials transaction market. On January 1, 2011, we leased two parcels of land from Mengwang Village Committee and Limenlou Village Committee of Boxhou City in Anhui Province in replacement of two parcels of land we had previously leased in 2010 to continue conducting our herbal cultivation business. The aggregate area for both parcels of land was approximately 1,800 acres, with each lease for a term of five years. On April 29, 2011, we leased one parcel of land, approximately 353 acres, from Mashan Town in Shandong with a 30-year term for herbal planting. On June 10, 2011, we leased 330 acres of land from Qiaocheng District Shibali Town in Anhui Province with a 10-year term for purposes of expanding our herbal cultivation business in that location. The aggregate area of the combined parcels of land consisted of 2,480 acres. None of the parcels generated revenue for the six months ended June 30, 2011. Our subsidiaries, Xuelingxian, Anhui Sino-Green TCM Tech and Shandong Sino-Green TCM Tech, are focused on the herbal cultivation and sales. For the six months ended June 30, 2011, the sales from our herbal cultivation and sales segment, which related to the land that Xuelingxian leased in 2010, accounted for 5.3% of our total sales. There were no sales for the six months ended June 30, 2010.
According to the statistics report of China Association of Traditional Chinese Medicine released on April 15, 2011, the retail price of 399 most commonly used herbal products increased during the 12-month period from April 2010 to March 2011. The prices of 86 herbal products increased in amounts ranging from 5% to 20% and the prices of 154 herbal products increased in amounts ranging from 21% to 50%. The prices of 96 herbal products increased in amounts ranging from 50% to 100% and prices of 57 herbal products increased in amounts in excess of 101%. In the same period, the prices of the 100 most commonly used herbal products decreased, in amounts ranging from 1% to 100%. The prices of all of our herbal products cultivated in 2010 increased during the last 12 months.
Flower Tea Bags Segment
The current production of flower tea bags includes basic processing, screening and bagging. For the six months ended June 30, 2011, the sales from the flower tea bags segment accounted for 0.3% of our total sales, a decrease of $2.6 million or 90.5% as compared to the comparable period in 2010, which accounted for 4.9% of our total sales. The decrease was primarily due to the entry and expansion of competitive products, the geographical limitation of our products, and the rough and plain design and packaging of our products that was less attractive to the consumer compared to competitors’ products, as well as our insufficient marketing. On April 25, 2011, we decided to suspend our flower tea bags sales and operations. Our decision was based on the intentions of the local government of Bozhou, in conjunction with another pharmaceutical company, to expand the industry development park in Bozhou, that would utilize the site where Xuelingxian is currently located. The factory buildings and relevant land on which Xuelingxian is situated will be expropriated and Xuelingxian will be required to relocate to a new commercial address. We are currently evaluating potential new locations and undergoing market research on the flower tea bags market. Since we recently completed the acquisition of Bozhou Xinghein July 2011, management is considering relocating the flower tea bags business to Bozhou Xinghe if the new facility is suitable for processing flower tea bags. Management is evaluating the situation, and will either re-commence or permanently cease the flower tea bags business after research and evaluation is completed, which we contemplate will be the end of 2011.
24
Recent Developments
Joint Ventures
On April 6, 2011, we obtained the business license of Anhui Sino-Green TCM Tech. Hong Kong Wisdom Fortune Medicine Holding Group Limited (referred to as Wisdom Fortune), together with Anhui Qianyi Pharmaceutical Co., Ltd. (referred to as Qianyi Pharmaceutical) established the joint venture, Anhui Sino-Green TCM Tech, in Bozhou City, Anhui Province. Anhui Sino-Green TCM Tech is primarily focused on herbal cultivation business. The registered capital of Anhui Sino-Green TCM Tech is $10 million. Wisdom Fortune invested US $9.7 million and Qianyi Pharmaceutical invested US $0.3 million, which reflect a 97 percent and 3 percent ownership interest of Anhui Sino-Green TCM Tech, respectively. As of July 6, 2011, we paid US $1.5 million of the registered capital and the remaining $8.2 million is due by April 6, 2013. We will fund the remaining registered capital by using our working capital.
On April 21, 2011, we obtained the business license of Shandong Sino-Green TCM Tech. Shandong Global together with Jinan Linong TCM Plantation Co., Ltd. (referred to as Jinan Linong) established the joint venture, Shandong Sino-Green TCM Tech, in Jinan City, Shandong Province. Shandong Sino-Green TCM Tech is primarily focused on herbal cultivation business. The registered capital of Shandong Sino-Green TCM Tech is RMB 10 million (approximately US $1.4 million). Shandong Global invested RMB 9.7 million (approximately US $1.4 million) and Jinan Linong invested RMB 0.3 million (approximately US $0.1 million), which reflect a 97 percent and 3 percent ownership interest of Shandong Sino-Green TCM Tech, respectively. On April 20, 2011, Shandong Global paid RMB 9.7 million (approximately US $1.5 million) in registered capital.
On April 25, 2011, we suspended our flower tea bags and sales operations. Our decision was based on the intentions of the local government of Bozhou, in conjunction with another pharmaceutical company, to expand the industry development park in Bozhou that will utilize the site where Xuelingxian is currently located. The factory buildings and relevant land on which Xuelingxian is situated will be expropriated and Xuelingxian will relocate to a new commercial address.
Establishing joint ventures with local companies in Bozhou City and Mashan town, represent a new stage for the our development of the TCM cultivation base projects. In addition, both projects are a further step to obtain the quality TCM variety that is certified with National Geographical Place of Origin Trademark. The savings related to obtaining TCM herbal related raw materials directly from the place of origin will significantly enhance the our products portfolio, and create a significant synergy between our herbal cultivation business and pharmaceutical products distribution business.
Acquisitions
On May 30, 2011, we acquired the 100% equity interest of Tai’an Global through our subsidiary, Shandong Global, for cash consideration of RMB 7 million (approximately US $1.1 million). As of June 30, 2011, we have paid RMB 2.3 million (approximately US $0.4 million) to the former shareholder of Tai’an Global with the remaining RMB 4.7 million (approximately US $0.7 million) to be paid before September 15, 2011. We will fund the remaining balance with our working capital.
On May 31, 2011, we acquired the 100% equity interest of Zibo Global through our subsidiary, Shandong Global, for cash consideration of RMB 8 million (approximately US $1.2 million). As of June 30, 2011, we have paid RMB 2.1 million (approximately US $0.3 million) to the former shareholder of Zibo Global with the remaining RMB 5.9 million (approximately US $0.9 million) to be paid to before September 30, 2011. We will fund the remaining balance with our working capital.
With the acquisition of Tai’an Global and Zibo Global, we enhanced the depth and breadth of our sales coverage in Shandong Province and the expansion of our distribution network into the cities of Tai'an and Zibo. In addition, the two newly acquired companies will broaden their products portfolios by having access to our other product lines.
On July 4, 2011, we completed the acquisition of the 100% equity interest of Bozhou Xinhe for cash consideration of RMB 30 million (approximately US $4.6 million). On August 8, 2011, we had paid RMB 10 million (approximately US $1.5 million) and will pay another RMB 10 million to the former shareholders of Bozhou Xinghe before August 30, 2011 with the remaining RMB 10 million to be paid before April 5, 2012. We will fund the unpaid acquisition cost from working capital.
25
The acquisition of Bozhou Xinghe represents a direct complement to our TCM plantation business in the cities of Bozhou and Jinan by the addition of a critical production capability, so that our cultivated raw herbs can be processed directly at our own plant. In addition, this facility offers us a potential platform to produce TCM pharmaceutical products in the near future. The combination of this direct-processing capability and our stringent quality control will serve to further enhance our product quality, which enables us to command a premium price in the market. The new plant will also allow us to customize some herbal pieces products upon distribution customers' request, therefore expanding our distributed product portfolio. We believe we will be able to offer more quality products for our rapidly growing sales channels.
On August 3, 2011, we entered into a Share Purchase Agreement (referred to as the Acquisition Agreement) with each of the persons set forth in Schedule B-1 thereto (each a “Quantum Seller” and collectively referred to as the Quantum Sellers). Pursuant to the Acquisition Agreement, the Quantum Sellers agreed to sell and we agreed to purchase the aggregate of 50,000 ordinary shares (referred to as Sale Shares) in Quantum Magic Integrator Fund Co., Limited, a company incorporated and existing under the laws of the British Virgin Islands, or Quantum, representing the entire issued share capital of Quantum. The consideration for the Sale Shares is US $9,000,000, to be paid in full by us by issuing the Consideration Shares (as defined under the Acquisition Agreement) to the Quantum Sellers within 90 days after the Closing Date (as defined under the Acquisition Agreement). The number of the Consideration Shares to be issued to the Quantum Sellers shall be equal to US $9,000,000 divided by the fair market value of our issued and outstanding common stock as at the Closing Date, as determined by a third-party valuer selected by us at our discretion. As of the date of this report, we are in the process of obtaining third-party valuation for our common stock as of such date of execution. Under the Quantum Share Purchase Agreement, 80% of the total shares to be issued will be issued to the original stockholders of Quantum within 90 days after the date of the Quantum Share Purchase Agreement and the remaining 20% to be pledged to the Company. The pledged shares shall be transferred to the original shareholders of Quantum if Shandong Hua Wei achieves certain revenue targets for 2010 and 2011.
On the date of the Acquisition Agreement, we and the Quantum Sellers also entered into a Share Pledge Agreement pursuant to which the Sellers pledge 10% of the Consideration Shares to us to secure the Sellers’ covenants and undertakings in relation to Quantum’s financial performance for the fiscal year ending December 31, 2011 as set forth in the Acquisition Agreement.
Quantum, a company incorporated in the British Virgin Islands on April 19, 2010, held the 100% equity interest of Hong Kong Celestial Asia Pharmaceutical Investment Group Limited, or Celestial Asia Pharm. Celestial Asia Pharm, a Hong Kong holding company, was incorporated on August 24, 2009 under the laws of Hong Kong, and held the 100% equity interest of Shandong Hua Wei). Shandong Hua Wei was incorporated on March 18, 1998 under the laws of the PRC and engages in the pharmaceutical-related products distribution business in China. Upon execution of the Quantum Share Purchase Agreement, Shandong Hua Wei became our wholly owned subsidiary.
26
On August 1, 2011, we entered into a Share Purchase Agreement (referred to as the Acquisition Agreement) with each of the persons set forth in Schedule B-1 thereto (each a “Pacific Asia Seller” and collectively referred to as the Pacific Asia Sellers). Pursuant to the Acquisition Agreement, the Pacific Asia Sellers agreed to sell and we agreed to purchase the aggregate of 50,000 ordinary shares, or Sale Shares, in Pacific Asia Pharm Investment Group Co., Limited, a company incorporated and existing under the laws of the British Virgin Islands (referred to as Pacific Asia), representing the entire issued share capital of Pacific Asia. The consideration for the Sale Shares is US $42,000,000, to be paid in full by us by issuing the Consideration Shares (as defined under the Acquisition Agreement) to the Pacific Asia Sellers within 90 days after the Closing Date (as defined under the Acquisition Agreement). The number of the Consideration Shares to be issued to the Pacific Asia Sellers shall be equal to US $42,000,000 divided by the fair market value of our issued and outstanding common stock as at the Closing Date, as determined by a third-party valuer selected by us at our discretion.
On the date of the Acquisition Agreement, we and the Pacific Asia Sellers also entered into a Share Pledge Agreement pursuant to which the Sellers pledge 10% of the Consideration Shares to us to secure the Pacific Asia Sellers’ covenants and undertakings in relation to Pacific Asia’s financial performance for the fiscal year ending December 31, 2011 as set forth in the Acquisition Agreement.
The acquisition of Hua Wei will continuously expand our sales coverage in Shandong Province.
Pacific Asia, a company incorporated in the British Virgin Islands on April 8, 2010, held the 100% equity interest of Hong Kong Rich Fortune Chain Drugstores Assets Management Co., Ltd., or Rich Fortune. Rich Fortune, a Hong Kong holding company, was incorporated on January 12, 2009 under the laws of Hong Kong, held the 100% equity interest of Guangzhou Hairui Xiexin Investment Consulting Co., Ltd., or Hairui Xiexin. Hairui Xiexin was incorporated on June 3, 2011 under the laws of the PRC.
Guangdong Guo Yao Pharmaceutical Franchises Co. Ltd., or GDGY, a pharmaceutical-related products distributor, was incorporated on June 6, 2001 under the laws of the PRC. As of August 1, 2011, GDGY manages a chain of 1,234 drug stores in the Guangdong Province and manages these drug stores through a target management contract entered into with the manager of each store, pursuant to which the managers are the primary beneficiary of each drug store and assume full responsibility for the operating and legal risks of each drug stores. The drug stores shall purchase pharmaceutical-related products from GDGY directly at market price; otherwise the drug stores must pay a franchise fee of a pre-determined sum to GDGY.
Effective as of July 11, 2011, Hairui Xiexin entered into a series of contractual arrangements with GDGY and the shareholders of GDGY, pursuant to which Hairui Xiexin will act as the management company and operation trustee for GDGY, while GDGY conducts the principal operations of the business. The contractual agreements effectively transferred the economic benefits of GDGY’s business to Hairui Xiexin, and Hairui Xiexin assumed effective control and management of GDGY.
With the acquisition of Pacific Asia, we will have opportunity to extend our integrated value chain into pharmaceutical retailing sector. The acquisition will also enhance our goods purchase power and increase the sales volume of high profit TCM products. The acquisition of Pacific Asia will increase the value for our distribution business segment and offers extensive retail channel for our quality TCM herbs products obtained directly from our TCM business entities in Bozhou City.
27
Result of Operations
The following table presents certain information derived from our consolidated financial statements for the three months ended June 30, 2011 and 2010.
|
For the three months ended June 30,
|
||||||||||||||||||||||||
|
in US $ except percentage
|
2011
|
2010
|
Change
|
|||||||||||||||||||||
|
% of net
revenue
|
% of net
revenue
|
Amount
|
Percentage
|
|||||||||||||||||||||
|
Revenues, net
|
$ | 45,386,335 | 100.0 | $ | 30,530,977 | 100.0 | $ | 14,855,358 | 48.7 | |||||||||||||||
|
Cost of goods sold
|
38,003,386 | 83.7 | 24,989,792 | 81.9 | 13,013,594 | 52.1 | ||||||||||||||||||
|
Gross profit
|
7,382,949 | 16.3 | 5,541,185 | 18.1 | 1,841,764 | 33.2 | ||||||||||||||||||
|
Operating expenses
|
936,732 | 2.1 | 233,371 | 0.8 | 703,361 | 301.4 | ||||||||||||||||||
|
General and administrative
|
987,391 | 2.2 | 1,794,759 | 5.9 | (807,368 | ) | (45.0 | ) | ||||||||||||||||
|
Income from operations
|
5,458,826 | 12.0 | 3,513,055 | 11.4 | 1,945,771 | 55.4 | ||||||||||||||||||
|
Interest income (expense)
|
843 | 0.0 | 13,226 | 0.0 | (12,383 | ) | (93.6 | ) | ||||||||||||||||
|
Miscellaneous (expense)/income
|
(28,418 | ) | (0.1 | ) | - | - | (28,418 | ) |
NA
|
|||||||||||||||
|
Income before income taxes
|
5,431,251 | 11.9 | 3,526,281 | 11.4 | 1,904,970 | 54.0 | ||||||||||||||||||
|
Provision for income taxes
|
1,513,005 | 3.3 | 1,255,682 | 4.1 | 257,323 | 20.5 | ||||||||||||||||||
|
Net income
|
3,918,246 | 8.6 | 2,270,599 | 7.3 | 1,647,647 | 72.6 | ||||||||||||||||||
|
Less: net loss attributable to non-controlling interest
|
(1,361 | ) | 0.0 | - | 0.0 | (1,361 | ) |
NA
|
||||||||||||||||
|
Net income attributable to Global Pharm Holdings Group, Inc.
|
$ | 3,919,607 | 8.6 | $ | 2,270,599 | 7.3 | $ | 1,649,008 | 72.6 | |||||||||||||||
|
For the three months ended June 30 - Net revenue
|
||||||||||||||||||||||||
|
in US $ except percentage
|
2011
|
2010
|
Change
|
|||||||||||||||||||||
|
% of net
revenue
|
% of net
revenue
|
%
|
||||||||||||||||||||||
|
Pharmaceutical products distribution
|
$ | 39,738,572 | 87.6 | $ | 24,338,686 | 79.7 | $ | 15,399,886 | 63.3 | |||||||||||||||
|
TCM processing and distribution
|
5,647,763 | 12.4 | 4,314,919 | 14.1 | 1,332,844 | 30.9 | ||||||||||||||||||
|
Herbal cultivation and sales
|
- | - | - | - | - |
NA
|
||||||||||||||||||
|
Flower tea bags
|
- | 0.0 | 1,877,372 | 6.1 | (1,877,372 | ) |
NA
|
|||||||||||||||||
|
Total
|
$ | 45,386,335 | 100.0 | $ | 30,530,977 | 100.0 | $ | 14,855,358 | 48.7 | |||||||||||||||
28
|
For the three months ended June 30 - Cost of goods sold
|
||||||||||||||||||||||||
|
in US $ except percentage
|
2011
|
2010
|
Change
|
|||||||||||||||||||||
|
% of COGS
|
% of COGS
|
%
|
||||||||||||||||||||||
|
Pharmaceutical products distribution
|
$ | 33,476,543 | 88.1 | $ | 20,072,452 | 80.3 | $ | 13,404,091 | 66.8 | |||||||||||||||
|
TCM processing and distribution
|
4,526,843 | 11.9 | 3,547,611 | 14.2 | 979,232 | 27.6 | ||||||||||||||||||
|
Herbal cultivation and sales
|
- | - | - | - | - |
NA
|
||||||||||||||||||
|
Flower tea bags
|
- | - | 1,369,729 | 5.5 | (1,369,729 | ) |
NA
|
|||||||||||||||||
|
Total
|
$ | 38,003,386 | 100.0 | $ | 24,989,792 | 100.0 | $ | 13,013,594 | 52.1 | |||||||||||||||
|
For the three months ended June 30 - Net income
|
||||||||||||||||||||||||
|
in US $ except percentage
|
2011
|
2010
|
Change
|
|||||||||||||||||||||
|
% of net
income
|
% of net
income
|
%
|
||||||||||||||||||||||
|
Pharmaceutical products distribution
|
$ | 3,769,281 | 96.1 | $ | 2,893,228 | 127.4 | $ | 876,053 | 30.3 | |||||||||||||||
|
TCM processing and distribution
|
696,485 | 17.8 | 547,607 | 24.1 | 148,878 | 27.2 | ||||||||||||||||||
|
Herbal cultivation and sales
|
(44,000 | ) | (1.1 | ) | - | - | (44,000 | ) |
NA
|
|||||||||||||||
|
Flower tea bags
|
- | - | 321,864 | 14.2 | (321,864 | ) | (100.0 | ) | ||||||||||||||||
|
Corporate
|
(502,159 | ) | (12.8 | ) | (1,492,100 | ) | (65.7 | ) | 989,941 | (66.3 | ) | |||||||||||||
|
Total
|
$ | 3,919,607 | 100.0 | $ | 2,270,599 | 100.0 | $ | 1,649,008 | 72.6 | |||||||||||||||
The increase (decrease) in net revenue and net income was accounted for by an increase (decrease) in certain of our segments as indicated below:
Revenue. Our net revenue increased by $14.9 million, or 48.7%, for the three months ended June 30, 2011 compared to the comparable period ended June 30, 2010. The increase in revenue was attributable to our reportable segments as follows:
Pharmaceutical products distribution –The contribution from our pharmaceutical products distribution segment was $39.7 million, or 87.6% of our net revenues, for the three months ended June 30, 2011, compared to $24.3 million, or 79.7% of our net revenues, for the comparable period in 2010. The net revenue increased $15.4 million, or approximately 63.3%, for the three months ended June 30, 2011, as compared to the comparable period in 2010. The increase was primarily due to a series of marketing activities to promote sales, a broader product portfolio offered to customers and improved efficiency in fulfilling sales orders.
29
TCM processing and distribution – Revenue from this segment was $5.6 million for the three months ended June 30, 2011, compared to $4.3 million for the comparable period in 2010, an increase of $1.3 million, or approximately 30.9%.
Herbal cultivation and sales – Revenue from our herbal cultivation and sales segment was nil for the three months ended June 30, 2011 and June 30, 2010, respectively. We sold our entire herbal inventory in the first three months in 2011 and 2010. All of our herbs were at the cultivation stage for the three months ended June 30, 2011 and 2010.
Flower tea bags – We had nil revenue from our flower tea bags segment for the three months ended June 30, 2011, as compared to sales of $1.9 million for the three months ended June 30, 2010. The flower tea bags operations have been suspended since April 25, 2011. Our decision was based on the intentions of the local government of Bozhou, in conjunction with another pharmaceutical company, to expand the industry development park in Bozhou that would utilize the site where Xuelingxian is currently located. The factory buildings and relevant land on which Xuelingxian is situated will be expropriated and Xuelingxian will be required to relocate to a new commercial address. We are currently evaluating potential new locations and undergoing market research on the flower tea bags market. Since we recently completed the acquisition of Bozhou Xinghe in July 2011, management is considering relocating the flower tea bags business to Bozhou Xinghe if the new facility is suitable for processing flower tea bags. Management is evaluating the situation and will either re-commence or permanently cease the flower tea bags business after research and valuation is completed, which we contemplate will be the end of 2011.
Cost of Goods Sold. Our cost of goods sold increased by $13.0 million, or 52.1%, to $38.0 million for the three months ended June 30, 2011 from $25.0 million for the comparable period in 2010, which was consistent with the increase in our revenue. More specifically:
Pharmaceutical products distribution –The cost of goods sold for this segment was $33.5 million, or 88.1% of our total cost of goods sold, for the three months ended June 30, 2011, compared to $20.1 million, or 80.3% of our total costs of goods sold, for the comparable period in 2010, an increase of $13.4 million, or approximately 66.8%. The increase was primarily due to our greater sales volume for the three months ended June 30, 2011 compared to the comparable period in 2010, consistent with the increase in revenue of this segment. The increase of costs of goods sold was also a direct result of the increase of the purchase price of TCM type pharmaceutical products.
TCM processing and distribution – The cost of goods sold for this segment was $4.5 million for the three months ended June 30, 2011, compared to $3.5 million for the comparable period in 2010, an increase of $1.0 million, or approximately 27.6%.
Herbal cultivation and sales – As there were no sales, the cost of goods sold for our herbal cultivation segment was nil for the three months ended June 30, 2011 and 2010, respectively.
Flower tea bags – As there were no sales due to the suspension of our operations for this segment, the cost of goods sold for our flower tea bags segment was nil for the three months ended June 30, 2011, as compared to $1.4 million for the comparable period in 2010.
Gross Profit. Our gross profit increased by $1.8 million, or 33.2%, to $7.4 million for the three months ended June 30, 2011 from $5.5 million for the comparable period in 2010. Our gross profit margin decreased to 16.3% for the three months ended June 30, 2011 from 18.1% for the comparable period in 2010. The decrease is primarily attributable to the increase of cost of our TCM products and the sales price reduction as a result of competition. The decrease was also affected by the change in sales volume to different types of products as well as the revenue shift from hospital customers to health clinic, chain drug stores, and retail drug stores. The gross margin for hospital customers is usually higher than other customers.
30
Operating Expenses. Our operating expenses increased by $0.7 million, or 301.4%, to $0.9 million for the three months ended June 30, 2011 from $0.2 million for the comparable period in 2010. The increase is primarily due to increased advertising, freight cost and employment costs, consistent with the increase in our sales volume and expansion of our business.
General and Administrative. Our general and administrative expenses decreased by $0.8 million, or 45.6%, to $1.0 million for the three months ended June 30, 2011 from $1.8 million for the comparable period in 2010. The decrease is due to the stock compensation cost of $1.5 million recorded in the second quarter of 2010, offsetting against the increase of approximately $0.7 million in operating costs for the three months ended June 30, 2011 during normal course of business as a result of higher sales volume and broader operation scales, and the increase in professional service fees, such as legal, accounting and investor relations as a result of us becoming a public company.
Income from Operations. As a result of the foregoing, our income from operations increased to $5.5 million for the three months ended June 30, 2011 from $3.5 million for the comparable period in 2010, an increase of $2.0 million, or 55.7%.
Income Taxes. Our income tax expense increased to $1.5 million for the three months ended June 30, 2011 from $1.3 million for the comparable period in 2010, consistent with the increased revenue.
Net Income. Our net income increased by $1.7 million, to $3.9 million, for the three months ended June 30, 2011 from $2.3 million for the comparable period in 2010. Our net profit margin increased to 8.7% for the three months ended June 30, 2011 from 7.4% of net revenues for the comparable period in 2010. The slight increase in profit margin was primarily due to our increased sales of certain prescription products and herbal products, which had higher profit margins, in the three months ended June 30, 2011.
The following table presents certain information derived from our consolidated financial statements for the six months ended June 30, 2011 and 2010.
|
For the six months ended June 30,
|
||||||||||||||||||||||||
|
in US $ except percentage
|
2011
|
2010
|
Change
|
|||||||||||||||||||||
|
% of net
revenue
|
% of net
revenue
|
Amount
|
Percentage
|
|||||||||||||||||||||
|
Revenues, net
|
$ | 87,490,082 | 100.0 | $ | 59,259,637 | 100.0 | $ | 28,230,445 | 47.6 | |||||||||||||||
|
Cost of goods sold
|
72,279,229 | 82.6 | 48,632,162 | 82.1 | 23,647,067 | 48.6 | ||||||||||||||||||
|
Gross profit
|
15,210,853 | 17.4 | 10,627,475 | 17.9 | 4,583,378 | 43.1 | ||||||||||||||||||
|
Operating expenses
|
1,352,645 | 1.5 | 364,999 | 0.6 | 987,646 | 270.6 | ||||||||||||||||||
|
General and administrative
|
1,720,080 | 2.0 | 2,165,148 | 3.7 | (445,068 | ) | (20.6 | ) | ||||||||||||||||
|
Income from operations
|
12,138,128 | 13.9 | 8,097,328 | 13.6 | 4,040,800 | 49.9 | ||||||||||||||||||
|
Interest (expense) income
|
(3,381 | ) | 0.0 | 17,874 | 0.0 | (21,255 | ) | (118.9 | ) | |||||||||||||||
|
Miscellaneous expense
|
(30,239 | ) | (0.0 | ) | - | 0.0 | (30,239 | ) |
NA
|
|||||||||||||||
|
Income before income taxes
|
12,104,508 | 13.9 | 8,115,202 | 13.6 | 3,989,306 | 49.2 | ||||||||||||||||||
|
Provision for income taxes
|
2,887,305 | 3.3 | 2,419,451 | 4.1 | 467,854 | 19.3 | ||||||||||||||||||
|
Net income
|
9,217,203 | 10.6 | 5,695,751 | 9.5 | 3,521,452 | 61.8 | ||||||||||||||||||
|
Less: net expenses attributable to non-controlling interest
|
(1,353 | ) | 0.0 | - | 0.0 | (1,353 | ) |
NA
|
||||||||||||||||
|
Net income attributable to Global Pharm Holdings Group, Inc.
|
$ | 9,218,556 | 10.6 | $ | 5,695,751 | 9.5 | $ | 3,522,805 | 61.8 | |||||||||||||||
31
|
For the six months ended June 30 - Net revenue
|
||||||||||||||||||||||||
|
in US $ except percentage
|
2011
|
2010
|
Change
|
|||||||||||||||||||||
|
% of net
revenue
|
% of net
revenue
|
%
|
||||||||||||||||||||||
|
Pharmaceutical products distribution
|
$ | 72,169,822 | 82.5 | $ | 47,360,171 | 79.9 | $ | 24,809,651 | 52.4 | |||||||||||||||
|
TCM processing and distribution
|
10,365,812 | 11.9 | 9,000,270 | 15.2 | 1,365,542 | 15.2 | ||||||||||||||||||
|
Herbal cultivation and sales
|
4,679,373 | 5.3 | - | - | 4,679,373 |
NA
|
||||||||||||||||||
|
Flower tea bags
|
275,075 | 0.3 | 2,899,196 | 4.9 | (2,624,121 | ) | (90.5 | ) | ||||||||||||||||
|
Total
|
$ | 87,490,082 | 100.0 | $ | 59,259,637 | 100.0 | $ | 28,230,445 | 47.6 | |||||||||||||||
|
For the six months ended June 30 - Cost of goods sold
|
||||||||||||||||||||||||
|
in US $ except percentage
|
2011
|
2010
|
Change
|
|||||||||||||||||||||
|
% of COGS
|
% of COGS
|
%
|
||||||||||||||||||||||
|
Pharmaceutical products distribution
|
$ | 60,530,364 | 83.7 | $ | 39,168,261 | 80.5 | $ | 21,362,103 | 54.5 | |||||||||||||||
|
TCM processing and distribution
|
8,339,098 | 11.5 | 7,367,955 | 15.2 | 971,143 | 13.2 | ||||||||||||||||||
|
Herbal cultivation and sales
|
3,228,238 | 4.5 | - | - | 3,228,238 |
NA
|
||||||||||||||||||
|
Flower tea bags
|
181,529 | 0.3 | 2,095,946 | 4.3 | (1,914,417 | ) | (91.3 | ) | ||||||||||||||||
|
Total
|
$ | 72,279,229 | 100.0 | $ | 48,632,162 | 100.0 | $ | 23,647,067 | 48.6 | |||||||||||||||
32
|
For the six months ended June 30 - Net income
|
||||||||||||||||||||||||
|
in US $ except percentage
|
2011
|
2010
|
Change
|
|||||||||||||||||||||
|
% of net
income
|
% of net
income
|
%
|
||||||||||||||||||||||
|
Pharmaceutical products distribution
|
$ | 7,306,147 | 79.3 | $ | 5,586,817 | 98.1 | $ | 1,719,330 | 30.8 | |||||||||||||||
|
TCM processing and distribution
|
1,314,860 | 14.3 | 1,115,456 | 19.6 | 199,404 | 17.9 | ||||||||||||||||||
|
Herbal cultivation and sales
|
1,299,417 | 14.1 | - | - | 1,299,417 |
NA
|
||||||||||||||||||
|
Flower tea bags
|
76,759 | 0.8 | 529,936 | 9.3 | (453,177 | ) | (85.5 | ) | ||||||||||||||||
|
Corporate
|
(778,627 | ) | (8.5 | ) | (1,536,458 | ) | (27.0 | ) | 757,831 | (49.3 | ) | |||||||||||||
|
Total
|
$ | 9,218,556 | 100.0 | $ | 5,695,751 | 100.0 | $ | 3,522,805 | 61.8 | |||||||||||||||
The increase (decrease) in net revenue and net income were accounted for by an increase (decrease) in certain of our segments as indicated below:
Revenue. Our net revenue increased by $28.2 million, or 47.6%, for the six months ended June 30, 2011 compared to the six months ended June 30, 2010. The increase in revenue was attributable to our reportable segments as follows:
Pharmaceutical products distribution –The contribution from our pharmaceutical products distribution segment was $72.2 million, or 82.5% of our total net revenues, for the six months ended June 30, 2011, compared to $47.4 million, or 79.9% of our total net revenues, for the comparable period in 2010. The net revenue increased $24.8 million, or approximately 52.4%, for the six months ended June 30, 2011, as compared to the comparable period in 2010. The increase was primarily due to a series of marketing activities to promote sales, a broader product portfolio offered to customers, and improved efficiency in fulfilling sales orders.
TCM processing and distribution –Revenue from this segment was $10.4 million for the six months ended June 30, 2011, compared to $9.0 million for the comparable period in 2010, an increase of $1.4 million, or approximately 15.2%.
Herbal cultivation and sales –Revenue from our herbal cultivation and sales segment was $4.7 million for the six months ended June 30, 2011 as compared to nil sales for the six months ended June 30, 2010. For the year ended December 31, 2009, we sold all of our herbal products and had no herbal sales for the first six months ended June 30, 2010. We sold our entire herbal inventory in the first three months in 2011 and all of our herbs were at cultivation stage for the three months ended June 30, 2011 and 2010.
Flower tea bags –We had net revenue of $0.3 million revenue from our flower tea bags segment for the six months ended June 30, 2011 as compared to $2.9 million for the six months ended June 30, 2010. The decrease was primarily due to the entry and expansion of competitive products, the geographical limitation of our products, and the rough and plain design and packaging of our products that was less attractive to the consumer compared to competitors’ products, as well as our insufficient marketing. In addition, we suspended our flower tea bags operations since April 25, 2011.
33
Cost of Goods Sold. Our cost of goods sold increased by $23.6 million, or 48.6%, to $72.3 million for the six months ended June 30, 2011 from $48.6 million for the comparable period in 2010, which was consistent with the increase in our revenue. More specifically:
Pharmaceutical products distribution –The cost of goods sold for this segment was $60.5 million, or 83.7% of our total cost of goods sold, for the six months ended June 30, 2011, compared to $39.2 million, or 80.5% of our total costs of goods sold, for the comparable period in 2010, an increase of $21.4 million, or approximately 54.5%. The increase was primarily due to our greater sales volume during the six months of 2011 compared to the comparable period in 2010, consistent with the increase in revenue for this segment. The increase of costs of goods sold was also a direct result of the increase of the purchase price of TCM type pharmaceutical products.
TCM processing and distribution – The cost of goods sold for this segment was $8.3 million for the six months ended June 30, 2011, compared to $7.4 million for the comparable period in 2010, an increase of $1.0 million, or approximately 13.2%.
Herbal cultivation and sales – The cost of goods sold for this segment was $3.2 million for the six months ended June 30, 2011, primarily due to the inventories brought forward from the 2010 year end, that were sold during the first quarter of 2011. As there were no sales of the inventories brought forward from the 2009 year end, the cost of goods sold for this segment was nil for the six months ended June 30, 2010.
Flower tea bags – The cost of goods sold for this segment was $0.2 million for the six months ended June 30, 2011, as compared to $2.1 million for the comparable period in 2010. The decrease of $1.9 million was due to our suspension of operations for this segment since April 25, 2011.
Gross Profit. Our gross profit increased by $4.6 million, or 43.1%, to $15.2 million for the six months ended June 30, 2011 from $10.6 million for the comparable period in 2010. Our gross profit margin decreased to 17.4% for the six months ended June 30, 2011 from 17.9% for the comparable period in 2010. The decrease is primarily attributable to the increase in the costs of our TCM products and the sales price reduction as a result of competition. The decrease was also affected by the change in sales volume to different types of products as well as the revenue shift from hospital customers to health clinic, chain drug stores, and retail drug stores. The gross margin for hospital customers is usually higher than other customers.
Operating Expenses. Our operating expenses increased by $1.0 million, or 270.6%, to $1.4 million for the six months ended June 30, 2011 from $0.4 million for the comparable period in 2010. The increase is primarily due to increased advertising, freight cost and employment costs, consistent with the increase in our sales volume and expansion of our business.
General and Administrative. Our general and administrative expenses decreased by $0.5 million, or 21%, to $1.7 million for the six months ended June 30, 2011 from $2.2 million for the comparable period in 2010. The decrease is due to the stock compensation cost of $1.5 million booked in the second quarter of 2010, offset against the increase of approximately $1.0 million in operating costs during normal course of business in the second quarter of 2011 as a result of higher sales volume and broader operation scales, and the increase in professional service fees, such as legal, accounting and investor relations, as a result of us becoming a public company.
34
Income from Operations. As a result of the foregoing, our income from operations increased to $12.1 million for the six months ended June 30, 2011 from $8.1 million for the comparable period in 2010, an increase of $4.1 million, or 50.0%.
Income Taxes. Our income tax expense increased to $2.9 million for the six months ended June 30, 2011 from $2.4 million for the comparable period in 2010, consistent with the increased revenue.
Net Income. Our net income increased by $3.5 million, to $9.2 million, for the six months ended June 30, 2011 from $5.7 million for the comparable period in 2010. Our net profit margin increased to 10.6% for the six months ended June 30, 2011 from 9.5% for the comparable period in 2010. The increase in profit margin was primarily due to our increased sales of certain prescription products and herbal products, which had higher profit margins, in the first six months of 2011.
Liquidity and Capital Resources
The following table sets forth a summary of our net cash flow information for the periods indicated:
|
For the six months ended June 30,
|
||||||||||||||||
|
in US $ except percentage
|
2011
|
2010
|
Change
|
%
|
||||||||||||
|
Net cash provided by operating activities
|
$ | 5,258,346 | $ | 5,774,627 | $ | (516,281 | ) | (8.9 | ) | |||||||
|
Net cash used in investing activities
|
(870,109 | ) | (9,063 | ) | (861,046 | ) | 95.0 | |||||||||
|
Net cash provided by (used in) financing activities
|
299,730 | (3,038,036 | ) | 3,337,766 | (109.9 | ) | ||||||||||
|
Net increase in cash
|
4,687,967 | 2,727,528 | 1,960,439 | 71.9 | ||||||||||||
|
Cash and cash equivalents at the end of the period
|
$ | 9,144,834 | $ | 10,169,823 | $ | (1,024,989 | ) | (10.1 | ) | |||||||
Our net working capital was $26.3 million as of June 30, 2011, an increase of $8.9 million, or 51.1%, from $17.4 million as of December 31, 2010. Our cash and liquidity needs are funded primarily by cash generated from operations. We believe that the funds and cash generated from operations available to us are adequate to meet our operating needs for the remainder of 2011.
For the six months ended June 30, 2011, cash and cash equivalents increased by $4.7 million, as compared to December 31, 2010, primarily attributable to various factors, including:
35
Net cash provided by operating activities
For the six months ended June 30, 2011, we generated $5.3 million in net cash from operating activities, having no significant variance as compared to $5.8 million for the comparable period in 2010. The net income for the six months ended June 30, 2011 was $9.2 million, an increase of $3.5 million from $5.7 million for the comparable period in 2010. In addition to net income, the cash generated from operating activities was the net effect of the decrease in accounts receivables of approximately $4.2 million, the decrease in inventories of $1.6 million, and the increase in accounts payable and accruals of $0.2 million.
Net cash used in investing activities
We used $0.9 million in investing activities for the six months ended June 30, 2011, as compared to $9,000 for the comparable period in 2010, primarily as a result of increased expenditures relating to purchases of new subsidiaries and equipment.
Net cash (provided by) used in financing activities
Net cash provided by financing activities was $0.3 million for the six months ended June 30, 2011, as compared to $3.0 million used for the comparable period in 2010. The cash used in financing activities for the six months ended June 30, 2011 was the net effect of the repayment of a bank loan to Shandong Qilu Bank of approximately $1.5 million, the credit from the bank acceptance of approximately $1.5 million and the contribution from non-controlling interest of approximately $0.3 million. The cash used in financing activities for the six months ended June 30, 2010 was primarily due to the payment of dividends to former stockholders of our operating subsidiaries.
Capital Resources
The outstanding balances of the short-term loans we obtained from Shandong Qilu Bank and Construction Bank of China in 2010 were fully paid in January 2011 and May 2011.
As of June 30, 2011, we had one outstanding short-term loan obtained for our general working capital purposes:
Loan obtained on December 31, 2010 with Shandong Qilu Bank. The outstanding amount is RMB 3 million, or $464,145, as of June 30, 2011, which is due on December 30, 2011. The loan bears an annual interest of 6.972%, payable on a monthly basis. The loan is secured by a pledge on our inventory valued at RMB 6 million or $928,290, the terms of which are similar to that of the loan. Shandong Qilu Bank has authorized Shandong Woerde Guarantee Company to monitor the pledged inventories.
Working Capital Requirements
Historically, cash generated from operations have been sufficient to meet our general cash needs. We believe that we will be able to continue to generate revenue from our operations, which will provide the necessary cash flow to meet anticipated working capital requirements. However, our actual short- and long-term working capital requirements will depend upon numerous factors, including operating results, competition, the opportunity to acquire or start up new businesses and the availability of credit facilities, none of which can be predicted with certainty. Due to our rapid growth and expansion, our need for additional capital may arise and our management will seek to raise capital for the maintenance and expansion of our operations through the issuance of debt or equity, if necessary.
36
Our management’s discussion and analysis of our financial condition and results of operations are based on our financial statements that have been prepared in accordance with accounting principles generally accepted in the United States of America, or U.S. GAAP. The preparation of these financial statements requires us to make estimates and assumptions that affect the reported amounts of assets and liabilities and the disclosure of contingent assets and liabilities at the date of the financial statements as well as the reported net sales and expenses during the reporting periods. On an ongoing basis, we evaluate our estimates and assumptions. We base our estimates on historical experience and on various other factors that we believe are reasonable under the circumstances, the results of which form the basis for making judgments about the carrying value of assets and liabilities that are not readily apparent from other sources. Actual results may differ from these estimates under different assumptions or conditions.
Revenue Recognition
We recognize revenues in compliance with Staff Accounting Bulletin 104. Sales revenue is recognized when all of the following have occurred: (i) persuasive evidence of an arrangement exists, (ii) delivery has occurred or services have been rendered, (iii) the price is fixed or determinable and (iv) the ability to collect is reasonably assured. These criteria are generally satisfied at the time of shipment when risk of loss and title passes to the customer. Our four segments have the same revenue recognition policy. Revenues are recorded net of value-added taxes.
Accounts Receivable
We record accounts receivable, net of an allowance for doubtful accounts, if any. We maintain allowances for doubtful accounts for estimated losses. We review the accounts receivable on a quarterly basis and make general and specific allowances when there is doubt as to the collectability of individual balances. In evaluating the collectability of individual receivable balances, we consider many factors, including the age of the balance, customer's historical payment history, our current creditworthiness and current economic trends. The amount of the provision, if any, is recognized in the consolidated statement of income within "General and administrative." Accounts are written off after exhaustive efforts at collection. As of June 30, 2011 and 2010, all of the trade receivable balances were aged less than one year. Therefore, management concluded that no allowance for uncollectible amounts was required.
Purchase Accounting and Business Combinations
The Company accounts for its business combinations using the purchase method of accounting which requires that intangible assets be recognized apart from goodwill if they are contractual in nature or separately identifiable. Acquisitions are measured on the fair value of consideration exchanged and, if the consideration given is not cash, measurement is based on the fair value of the consideration given or the fair value of the assets acquired, whichever is more reliably measurable. The excess of cost of an acquired entity over the fair value of identifiable acquired assets and liabilities assumed is allocated to goodwill.
The valuation and allocation process relies on significant assumptions made by management. In certain situations, the allocations of excess purchase price are based upon preliminary estimates and assumptions. Accordingly, the allocations are subject to revision when the Company receives updated information, including appraisals and other analyses, which are completed within one year of the acquisition. Revisions to the fair values, which may be significant, are recorded when pending information is finalized, within one year from the acquisition date.
Income Taxes
We are subject to income taxes, primarily in the PRC. We believe we have adequately provided for all taxes due but amounts asserted by tax authorities could be greater or less than the amounts we have accrued. We have concluded all PRC corporate income tax matters for the six months ended June 30, 2011and do not anticipate adjustments as a result of any tax audits within the next 12 months.
37
Segments
Segments are defined as components of our business for which separate financial information is available that is evaluated by our chief operating decision-maker (our CEO) in deciding how to allocate resources and assess performance. We presently have four operating segments, consisting of (i) pharmaceutical products distribution, (ii) TCM, processing and distribution, (iii) herbal cultivation and sales and (iv) flower tea bags. Currently, we do not have intersegment sales. On April 25, 2011, we decided to suspend our flower tea bags and sales operations. Our decision was based on the intentions of the local government of Bozhou, in conjunction with another pharmaceutical company, to expand the industry development park in Bozhou that would utilize the site where Xuelingxian is currently located. The factory buildings and relevant land on which Xuelingxian is situated will be expropriated and Xuelingxian will be required to relocate to a new commercial address. We are currently evaluating potential new locations and undergoing market research on the flower tea bags market. Since we recently completed the acquisition of Bozhou Xinghe in July 2011, management is considering relocating the flower tea bags business to Bozhou Xinghe if the new facility is suitable for processing flower tea bags. Management is evaluating the situation and will either re-commence or permanently cease the flower tea bags business after research and valuation is completed, which we contemplate will be the end of 2011.
Off-Balance Sheet Arrangements
We do not have any off-balance sheet arrangements that have or are reasonably likely to have a current or future effect on our financial condition, changes in financial condition, revenues or expenses, results of operations, liquidity or capital expenditures or capital resources that are material to an investor in our securities.
Item 3. Quantitative and Qualitative Disclosures About Market Risk
Item 4. Controls and Procedures
Disclosure Controls and Procedures
During and subsequent to the reporting period covered by this report, and under the supervision and with the participation of our management, including our principal executive officer and our principal financial officer, we conducted an evaluation of our disclosure controls and procedures that were in effect at the end of the period covered by this report. Disclosure controls and procedures is defined under Rule 13a-15(e) and Rule 15d-15(e) of the Securities Exchange Act of 1934, as amended (the “Exchange Act”), as those controls and other procedures of an issuer that are designed to ensure that information required to be disclosed by an issuer in the reports that it files or submits under the Exchange Act is recorded, processed, summarized and reported within the time periods specified in the rules and forms of the Securities and Exchange Commission. Disclosure controls and procedures include, without limitation, controls and procedures designed to ensure that information required to be disclosed by an issuer in the reports that it files or submits under the Exchange Act is accumulated and communicated to the issuer's management, including its principal executive officer and principal financial officer, as appropriate, to allow timely decisions regarding required disclosure. Based on their evaluation and as discussed below, our principal executive officer and principal financial officer have concluded that our disclosure controls and procedures that were in effect on June 30, 2011 were effective.
Management’s Remediation Initiatives
In our Annual Report on Form 10-K for the year ended December 31, 2010 (the “2010 Form 10-K”) filed with the SEC on April 13, 2011, the following material weakness in our internal control over financial reporting was identified as of December 31, 2010:
38
“The Company did not have appropriate policies and procedures in place to identify and give disclosures relating to the basis for applying the reverse acquisition accounting to the Company’s acquisitions of three PRC operating subsidiaries pursuant to an Earn-In Agreement, as thereafter amended, and to properly accrue for dividends declared by the PRC operating company prior to the Earn-In Agreement and properly recognize certain transactions. Therefore, the Company was not able to effectively identify all necessary and appropriate disclosures and to effectively capture all financial data for the purposes of preparing its financial statements in accordance with U.S. GAAP.”
The material weakness identified in the 2010 Form 10-K as of December 31, 2010 was the result of a transaction in conjunction with the Reverse Merger, which had not occurred prior thereto, nor have any such activities been identified on an ongoing day-to-day basis thereafter. Subsequent to the year ended December 31, 2010, following the identification of the material weakness, our management has established financial reporting policies and procedures to facilitate the effective identification and capture of complex and significant transactions (similar to the isolated transaction described above, in which lack of proper financial reporting policies and procedures had resulted in a material weakness at December 31, 2010). Based on our current financial reporting policies and procedures, we do not anticipate that such a similar material weakness will occur on a going-forward basis.
In response to the above-identified material weakness and to strengthen our internal control over financial reporting, we have taken the following remediation initiatives:
● formed an Audit Committee in February 2011, chaired by an accounting expert with adequate knowledge and experience in U.S. GAAP and SEC reporting requirements, to advise the management on matters relating to the Company’s internal control over financial reporting.
● engaged an internal control expert in February 2011 with eight years of audit experience (including five years of “Big Four” accounting firm experience focused primarily on internal control audit issues) to assist management in evaluating complex accounting issues on an as-needed basis, and to ensure proper disclosure and reporting is made in a timely manner.
In addition, going forward, in order to address any potential material weaknesses in our internal controls over financial reporting, we plan to make the following necessary change and improvement:
● provide training to our finance team and other relevant personnel of the Company on the U.S. GAAP accounting guidance applicable to the Company’s financial statements.
As of June 30, 2011, the Company continued to reassess its internal controls and procedures on an ongoing basis.
Changes in Internal Control over Financial Reporting
There was no change in our internal control over financial reporting during the period ended June 30, 2011 that has materially affected, or is reasonably likely to materially affect, our internal control over financial reporting.
39
PART II - OTHER INFORMATION
Item 1. Legal Proceedings
Item 1A. Risk Factors
There have not been any material changes to the Company’s risk factors from our Annual Report on Form 10-K for the year ended December 31, 2010 filed with the SEC on April 13, 2011.
Item 2. Unregistered Sales of Equity Securities and Use of Proceeds
None.
Item 3. Defaults Upon Senior Securities
None.
Item 4. (Removed and Reserved)
Item 5. Other Information
Not applicable.
Item 6. Exhibits
Copies of the following documents are included as exhibits to this report pursuant to Item 601 of Regulation S-K.
|
Exhibit
Number
|
Description
|
|
|
10.1
|
Credit Granting Maximum Amount Guarantee Contract of Legal Person, dated April 27, 2011, by and between Shandong Global Pharm and Jinan East Lishan Road Branch of Qilu Bank Co., Ltd.
|
|
|
10.2
|
Credit Granting Contract of Legal Person, dated April 27, 2011, by and between Shandong Global Pharm and Jinan East Lishan Road Branch of Qilu Bank Co., Ltd.
|
|
|
10.3
|
Mortgage Contract of Maximum Amount for Goods Control and Financing, dated April 27, 2011, by and between Shandong Global Pharm and Jinan East Lishan Road Branch of Qilu Bank Co., Ltd.
|
40
|
10.4
|
Warehouse and Storage Supervision and Management Agreement, dated April 27, 2011, by and between Shandong Global Pharm and Jinan East Lishan Road Branch of Qilu Bank Co., Ltd. and Shandong Yayin Assets Management Co., Ltd.
|
|
|
10.5
|
Lease Contract, dated March 1, 2009, by and between Taian Senlin Pharmaceutical Co., Ltd. and Dabaiyu Resident Committee
|
|
|
10.6
|
Lease Contract, dated January 1, 2011, by and between Zibo Hongmao Pharmaceutical Co., Ltd. and Zibo Drug Purchasing & Supply Station of Shandong Province
|
|
|
10.7
|
Lease Contract, dated May 20, 2011, by and between Anhui Sino-Green and Li Wanzhi
|
|
|
10.8
|
Lease Contract, dated April 10, 2011, by and between Shandong Sino-Green and People’s Government of Mashan Town
|
|
|
10.9
|
Land Transfer Agreement, dated April 29, 2011, by and between Shandong Sino-Green and Chanqging District, Mashan Town
|
|
|
10.10
|
Land Transfer Contract, dated June 10, 2011, by and between Anhui Sino-Green and Shibali Town Government of Qiaocheng District, Bozhou City
|
|
|
10.11
|
M&A Agreement dated May 25, 2011, by and between Shandong Global Pharm and Taian Senlin Pharmaceutical Co., Ltd.
|
|
|
10.11A
|
Supplementary Agreement, dated May 25, 2011, by and between Shandong Global Pharm and Taian Senlin Pharmaceutical Co., Ltd.
|
|
|
10.12
|
M&A Agreement dated May 25, 2011, by and between Shandong Global Pharm and Zibo Hongmao Pharmaceutical Sales Co., Ltd.
|
|
|
10.12A
|
Supplementary Agreement, dated May 25, 2011, by and between Shandong Global Pharm and Zibo Hongmao Pharmaceutical Sales Co., Ltd.
|
|
|
10.13
|
M&A Agreement, dated July 4, 2011, by and between Shandong Global Pharm and Bozhou Xinghe Pharmaceutical Co., Ltd.
|
|
|
10.13A
|
Supplementary Agreement, dated July 5, 2011, by and between Shandong Global Pharm and Bozhou Xinghe Pharmaceutical Co., Ltd.
|
|
|
10.14
|
Equity Transfer Agreement, dated May 25, 2011, by and between Shandong Global Pharm and Kong Lingjin (for Taian Senlin)
|
|
|
10.15
|
Equity Transfer Agreement, dated May 25, 2011, by and between Shandong Global Pharm and Lv Xinjuan (for Taian Senlin)
|
|
|
10.16
|
Equity Transfer Agreement, dated May 31, 2011, by and between Shandong Global Pharm and Chen Hongsheng (for Zibo Hongmao)
|
|
|
10.17
|
Equity Transfer Agreement, dated July 4, 2011, by and between Shandong Global Pharm and Han Lingzhi (for Bozhou Xinghe)
|
|
|
10.18
|
Equity Transfer Agreement, dated July 4, 2011, by and between Shandong Global Pharm and Gu Quanhui (for Bozhou Xinghe)
|
|
|
10.19
|
Lease Contract, dated January 1, 2010, by and between Zibo Hongmao Pharmaceutical Co., Ltd. and Zibo Drug Purchasing & Supply Station of Shandong Province | |
|
31.1
|
Certification of the Principal Executive Officer pursuant to Section 302 of the Sarbanes-Oxley Act of 2002 *
|
|
|
31.2
|
Certification of the Principal Financial Officer pursuant to Section 302 of the Sarbanes-Oxley Act of 2002 *
|
41
|
32.1
|
Certification of the Principal Executive Officer pursuant to U.S.C. Section 1350 as adopted pursuant to Section 906 of the Sarbanes-Oxley Act of 2002*
|
|
|
32.2
|
Certification of the Principal Financial Officer pursuant to U.S.C. Section 1350 as adopted pursuant to Section 906 of the Sarbanes-Oxley Act of 2002*
|
* The referenced exhibits marked by an “*” attached to this Form 10-Q shall not be deemed "filed" for purposes of Section 18 of the Securities Exchange Act of 1934 (the "Exchange Act") or otherwise subject to liability under that section, nor shall it be deemed incorporated by reference in any filing under the Securities Act of 1933, as amended, or the Exchange Act, except as expressly set forth by specific reference in such filing.
SIGNATURES
In accordance with the Exchange Act, the registrant caused this report to be signed on its behalf by the undersigned thereunto duly authorized.
|
GLOBAL PHARM HOLDINGS GROUP, INC.
|
||
|
Date: August 12, 2011
|
/s/ Yunlu Yin
|
|
|
Yunlu Yin
|
||
|
Chief Executive Officer and President
|
||
|
(Principal Executive Officer)
|
||
|
Date: August 12, 2011
|
/s/ An Fu
|
|
|
An Fu
|
||
|
Chief Financial Officer
|
||
|
(Principal Financial Officer)
|
42