Attached files
Table of Contents
UNITED STATES
SECURITIES AND EXCHANGE COMMISSION
Washington, D.C. 20549
FORM 10-K
(Mark One)
| x | ANNUAL REPORT PURSUANT TO SECTION 13 OR 15(d) OF THE SECURITIES EXCHANGE ACT OF 1934 |
For the fiscal year ended May 31, 2011.
OR
| ¨ | TRANSITION REPORT PURSUANT TO SECTION 13 OR 15(d) OF THE SECURITIES EXCHANGE ACT OF 1934 |
For the transition period from to .
Commission File Number 001-15601
BIOMET, INC.
(Exact name of registrant as specified in its charter)
| Indiana | 35-1418342 | |
| (State or other jurisdiction of incorporation or organization) |
(I.R.S. Employer Identification No.) | |
| 56 East Bell Drive, Warsaw, Indiana | 46582 | |
| (Address of principal executive offices) | (Zip Code) | |
(574) 267-6639
(Registrant’s telephone number, including area code)
Securities registered pursuant to Section 12(b) of the Act: None
Securities registered pursuant to Section 12(g) of the Act: None
Indicate by check mark if the registrant is a well-known seasoned issuer, as defined in Rule 405 of the Securities Act. Yes ¨ No x
Indicate by check mark if the registrant is not required to file reports pursuant to Section 13 or Section 15(d) of the Act. Yes ¨ No x
Indicate by check mark whether the registrant (1) has filed all reports required to be filed by Section 13 or 15(d) of the Securities Exchange Act of 1934 during the preceding 12 months (or for such shorter period that the registrant was required to file such reports), and (2) has been subject to such filing requirements for the past 90 days. Yes x No ¨
Indicate by check mark whether the registrant has submitted electronically and posted on its corporate Website, if any, every Interactive Data File required to be submitted and posted pursuant to Rule 405 of Regulation S-T (§ 232.405 of this chapter) during the preceding 12 months (or for such shorter period that the registrant was required to submit and post such files). Yes ¨ No ¨
Indicate by check mark if disclosure of delinquent filers pursuant to Item 405 of Regulation S-K (§ 229.405 of this chapter) is not contained herein, and will not be contained, to the best of registrant’s knowledge, in definitive proxy or information statements incorporated by reference in Part III of this Form 10-K or any amendment to this Form 10-K. x
Indicate by check mark whether the registrant is a large accelerated filer, an accelerated filer, a non-accelerated filer, or a smaller reporting company. See the definitions of “large accelerated filer,” “accelerated filer” and “smaller reporting company” in Rule 12b-2 of the Exchange Act. (Check one):
| Large accelerated filer | ¨ | Accelerated filer | ¨ | |||
| Non-accelerated filer | x (Do not check if a smaller reporting company) | Smaller reporting company | ¨ | |||
Indicate by check mark whether the registrant is a shell company (as defined in Rule 12b-2 of the Act). Yes ¨ No x
As of May 31, 2011, there was no established public trading market for any of the common stock of the registrant. As of May 31, 2011, there were 1,000 shares of common stock of the registrant outstanding, 100% of which were owned by LVB Acquisition, Inc.
DOCUMENTS INCORPORATED BY REFERENCE
None.
Table of Contents
2
Table of Contents
FORWARD-LOOKING STATEMENTS
This annual report contains forward-looking statements within the meaning of the U.S. federal securities laws. Statements that are not historical facts, including statements about our beliefs and expectations, are forward-looking statements. Forward-looking statements include statements generally preceded by, followed by, or that include the words “believe,” “could,” “expect,” “forecast,” “intend,” “may,” “anticipate,” “plan,” “predict,” “possibly,” “project,” “potential,” “estimate,” “should,” “will” or similar expressions. These statements include, but are not limited to, statements related to:
| • | the timing and number of planned new product introductions; |
| • | the effect of anticipated changes in the size, health and activities of the population or on the demand for our products; |
| • | assumptions and estimates regarding the size and growth of certain market categories; |
| • | our ability and intent to expand in key international markets; |
| • | the timing and anticipated outcome of clinical studies; |
| • | assumptions concerning anticipated product developments and emerging technologies; |
| • | the future availability of raw materials; |
| • | the anticipated adequacy of our capital resources to meet the needs of our business; |
| • | our continued investment in new products and technologies; |
| • | the ultimate marketability of products currently being developed; |
| • | our ability to successfully implement new technologies and transition certain manufacturing operations to China; |
| • | our ability to manage working capital and generate adequate cash flows to service outstanding debt; |
| • | our ability to sustain sales and earnings growth; |
| • | our success in achieving timely approval or clearance of our products with domestic and foreign regulatory entities; |
| • | our success in implementing our operational improvement programs; |
| • | the stability of certain foreign economic markets; |
| • | the impact of anticipated changes in the musculoskeletal industry and our ability to react to and capitalize on those changes; |
| • | our ability to successfully implement desired organizational changes; |
| • | the impact of our managerial changes; and |
| • | our ability to take advantage of technological advancements. |
Forward-looking statements reflect our current expectations and are not guarantees of performance. These statements are based on our management’s beliefs and assumptions, which in turn are based on currently available information. Important assumptions relating to these forward-looking statements include, among others, assumptions regarding demand for our products, expected pricing levels, raw material costs, the timing and cost of planned capital expenditures, future regulatory reforms affecting the healthcare industry, expected outcomes of pending litigation and regulatory matters, the solvency of our insurers and the ultimate resolution of allocation and coverage issues with those insurers, competitive conditions and general economic conditions. Readers of this annual report are cautioned that reliance on any forward-looking statement involves risks and uncertainties. Although we believe that the assumptions on which the forward-looking statements contained herein are based
3
Table of Contents
are reasonable, any of those assumptions could prove to be inaccurate given the inherent uncertainties as to the occurrence or nonoccurrence of future events. There can be no assurance that the forward-looking statements contained in this annual report will prove to be accurate. The inclusion of a forward-looking statement in this annual report should not be regarded as a representation by us that our objectives will be achieved. Forward-looking statements also involve risks and uncertainties, which could cause actual results to differ materially from those projected by any forward-looking statement. Many of these factors are beyond our ability to control or predict and could, among other things, cause actual results to differ from those contained in forward-looking statements made in this annual report and presented elsewhere by management from time to time. Such factors, among others, may have a material adverse effect upon our business, financial condition, results of operations and cash flows and may include, but are not limited to, factors discussed under the heading “Risk Factors” and the following:
| • | changes in general economic conditions and interest rates; |
| • | changes in the availability of capital and financing sources; |
| • | changes in competitive conditions and prices in our markets; |
| • | changes to the regulatory environment for our products, including national health care reform; |
| • | the effects of incurring or having incurred a substantial amount of indebtedness under our senior secured credit facilities, our senior notes, senior toggle notes and senior subordinated notes; |
| • | the effects upon us of complying with the covenants contained in our senior secured credit facilities and the indentures governing our senior notes, senior toggle notes and senior subordinated notes; |
| • | restrictions the terms and conditions of our senior secured credit facilities may place on our ability to respond to changes in our business or take certain actions; |
| • | changes in the relationship between supply of and demand for our products; |
| • | fluctuations in costs of raw materials and labor; |
| • | changes in other significant operating expenses; |
| • | decreases in sales of our principal product lines; |
| • | slow downs or inefficiencies in our product research and development efforts; |
| • | increases in expenditures related to increased government regulation of our business; |
| • | developments adversely affecting our sales activities inside or outside the United States; |
| • | decreases in reimbursement levels by our customers, including certain of our foreign government customers that are experiencing fiscal distress; |
| • | difficulties in transitioning certain manufacturing operations to China and other locations; |
| • | challenges in effectively implementing restructuring and cost saving initiatives; |
| • | increases in cost-containment efforts by group purchasing organizations; |
| • | loss of our key management and other personnel or inability to attract such management and other personnel; |
| • | increases in costs of retaining existing independent sales agents of our products; |
| • | potential future goodwill and/or intangible impairment charges; |
| • | unanticipated expenditures related to litigation, including investigations by the U.S. Department of Justice; and |
| • | failure to comply with the terms of the Corporate Integrity Agreement. |
4
Table of Contents
We caution you not to place undue reliance on these forward-looking statements, which speak only as of the date they were made. We do not undertake any obligation to publicly release any revisions to these forward-looking statements to reflect events or circumstances after the date of this annual report or to reflect the occurrence of unanticipated events. We intend to take advantage of the safe harbor provisions of the Private Securities Litigation Reform Act of 1995 regarding our forward-looking statements, and are including this sentence for the express purpose of enabling us to use the protections of the safe harbor with respect to all forward-looking statements.
5
Table of Contents
| Item 1. | Business. |
General
Biomet, Inc., an Indiana corporation incorporated in 1977, is one of the largest orthopedic medical device companies in the United States and worldwide with operations in more than 50 locations throughout the world and distribution in approximately 90 countries. Our principal subsidiaries include Biomet Orthopedics, LLC; Biomet Manufacturing Corp.; Biomet Europe BV; EBI, LLC; Biomet 3i, LLC; Biomet International Ltd.; Biomet Microfixation, LLC; Biomet Sports Medicine, LLC; Biomet Trauma, LLC; and Biomet Biologics, LLC. Unless the context requires otherwise, the term “Biomet,” “Company,” “we,” “our”, or “us” refers to Biomet, Inc. and all of its subsidiaries. We design, manufacture and market a comprehensive range of both surgical and non-surgical products used primarily by orthopedic surgeons and other musculoskeletal medical specialists. For over 30 years, we have applied advanced engineering and manufacturing technology to the development of highly durable joint replacement systems.
Transactions with the Sponsor Group
On December 18, 2006, we entered into an Agreement and Plan of Merger with LVB Acquisition, LLC, a Delaware limited liability company, which was subsequently converted to a corporation, LVB Acquisition, Inc. (“Parent”), and LVB Acquisition Merger Sub, Inc., an Indiana corporation and a wholly-owned subsidiary of Parent (“Purchaser”), which agreement was amended and restated as of June 7, 2007 and which we refer to as the “Merger Agreement”. Pursuant to the Merger Agreement, on June 13, 2007, Purchaser commenced a cash tender offer (the “Offer”) to purchase all of our outstanding common shares, without par value (the “Shares”) at a price of $46.00 per Share (the “Offer Price”) without interest and less any required withholding taxes. In connection with the Offer, Purchaser entered into a credit agreement dated as of July 11, 2007 for a $6,165.0 million senior secured term loan facility (the “Tender Facility”), maturing on June 6, 2008, and pursuant to which it borrowed approximately $4,181.0 million to finance a portion of the Offer and pay related fees and expenses. Approximately 82% of the outstanding Shares were tendered to Purchaser in the Offer. At our special meeting of shareholders held on September 5, 2007, more than 91% of our shareholders voted to approve the proposed merger, and Parent acquired us on September 25, 2007 through a reverse subsidiary merger with Biomet, Inc. being the surviving company (the “Merger”). Subsequent to the acquisition, we became a subsidiary of Parent, which is controlled by LVB Acquisition Holding, LLC, or “Holding,” an entity controlled by a consortium of private equity funds affiliated with The Blackstone Group, Goldman, Sachs & Co., Kohlberg Kravis Roberts & Co., and TPG Capital (each a “Sponsor” and collectively, the “Sponsors”), and their co-investors.
The Merger was completed on September 25, 2007 and was financed through:
| • | the proceeds from the initial offering of our 10% Senior Notes due 2017, which we refer to as our “original senior cash pay notes,” our 10 3/8%/11 1/8% Senior Toggle Notes due 2017, which we refer to as our “original senior toggle notes,” and our 11 5/8% Senior Subordinated Notes due 2017, which we refer to as our “original senior subordinated notes” and collectively with our original senior cash pay notes and original senior toggle notes, our “original notes”; |
| • | initial borrowings under our senior secured credit facilities and our senior unsecured bridge facilities; |
| • | equity investments funded by direct and indirect equity investments from certain investment funds associated with or designated by the Sponsors, or the “Sponsor Funds,” certain investors who have agreed to co-invest with the Sponsor Funds, including investment funds affiliated with certain of the initial purchasers of the original notes, or the “Co-Investors,” and certain of our executive officers and members of our senior management, or the “Management Participants,” who rolled over existing equity interests and/or made cash equity contributions; and |
| • | cash on hand. |
6
Table of Contents
On October 16, 2007, the borrowings under our senior unsecured cash pay bridge facility, our senior unsecured payment-in-kind (“PIK”) option bridge facility and our senior subordinated unsecured bridge facility were repaid with the proceeds from the follow-on offering of equal amounts of additional original senior cash pay notes, original senior toggle notes and original senior subordinated notes, respectively.
We refer to these transactions, including the Merger and our payment of any fees and expenses related to these transactions, collectively as the “Transactions.”
In connection with the Transactions, we incurred significant indebtedness and became highly leveraged. See “Management’s Discussion and Analysis of Financial Condition and Results of Operations—Liquidity and Capital Resources.” In addition, we allocated the purchase price to the fair value of the assets and liabilities of Biomet based on estimated fair value. The purchase accounting adjustments increased the carrying value of our property and equipment, inventory and established intangible assets (such as corporate and product trade names, core and completed technology, and customer relationships), among other things. Subsequent to the Transactions, interest expense and non-cash depreciation and amortization charges have significantly increased. As a result, our successor financial statements subsequent to the Transactions are not comparable to our predecessor financial statements.
Exchange Offer
On May 21, 2008, we commenced an exchange offer for all of our outstanding original notes for an equal principal amount of our 10% Senior Notes due 2017, which we refer to as our “exchange senior cash pay notes,” our 10 3/8%/11 1/8% Senior Toggle Notes due 2017, which we refer to as our “exchange senior toggle notes,” and our 11 5/8% Senior Subordinated Notes due 2017, which we refer to as our “exchange senior subordinated notes,” which notes were registered under the Securities Act of 1933, as amended, and which we refer to collectively as our “exchange notes.” On July 1, 2008, we announced the completion of the exchange offer, pursuant to which $775,000,000 of the $775,000,000 aggregate principal amount of original senior cash pay notes, $774,999,500 of the $775,000,000 aggregate principal amount of original senior toggle notes and $1,014,999,500 of the $1,015,000,000 aggregate principal amount of our original senior subordinated notes were tendered and accepted for exchange. We refer to the original senior cash pay notes and the exchange senior cash pay notes as the “senior cash pay notes,” the original senior toggle notes and the exchange senior toggle notes as the “senior toggle notes,” the original senior subordinated notes and the exchange senior subordinated notes as the “senior subordinated notes” and the original notes and the exchange notes collectively as the “notes.” We also refer to the senior cash pay notes and the senior toggle notes as the “senior notes.”
Competitive Strengths
We believe we have a number of competitive strengths that will enable us to further enhance our position in the orthopedic medical device market.
Broad Market Leadership. We are the fourth largest player in the U.S. orthopedic reconstructive market and have maintained this position for over a decade. We have a large presence at U.S. hospitals, supplying products to over 60% of hospitals performing joint replacement surgery. In addition, we are the third largest manufacturer and marketer of dental reconstructive devices worldwide and maintain market leadership positions in the electrical stimulation and craniomaxillofacial fields.
Strong Relationships with Surgeon Customers. Based on their satisfaction with our products, we enjoy long-standing relationships with our surgeon customers, many of which commence during the surgeons’ residency training programs. Our support of medical education programs provides important training opportunities for orthopedic surgeons early in their careers. Supporting “hands-on” training provides opportunities for residents, fellows and attending surgeons to experience the clinical benefits of our products. Surgeons have historically exhibited limited willingness to switch manufacturers, as successful patient outcomes are related to the practitioners’ familiarity with the procedural characteristics and instrumentation of certain implants.
7
Table of Contents
Consistently Strong Operating Cash Flow Generation. Our business is characterized by consistently strong operating cash flows due to our robust operating history and moderate capital intensity. We have continually increased revenues, with fiscal 2011 representing our 33rd consecutive year of year over year net sales growth. Over the last 20 years, from fiscal 1991 through fiscal 2011, we increased net sales at a compounded annual growth rate of approximately 14%. We have sustained growth through multiple macro-economic cycles, demonstrating a stable business profile. In addition, we have historically had modest capital expenditures and working capital requirements, providing for strong operating cash flow conversion.
Experienced and Dedicated Management Team. We have a highly experienced management team at both the corporate and operational level. Our team is led by Jeffrey R. Binder, a 19-year veteran of the orthopedic medical device industry, who was appointed President and Chief Executive Officer in February 2007. Daniel P. Florin was appointed Senior Vice President and Chief Financial Officer in June 2007 and brings 20 years of financial officer/controller experience in the medical device industry and five years of public accounting and auditing experience to Biomet. Glen A. Kashuba was appointed Senior Vice President and President of Biomet Spine & Bone Healing Technologies in April 2007, having previously served as Worldwide President of Cordis Endovascular, a division of Johnson & Johnson. In February 2008, Jon C. Serbousek was appointed President of Biomet Orthopedics and was recently appointed as Group President, Biomet Orthopedics, having spent 8 years with Medtronic and 13 years with DePuy, for a total of 24 years in the medical device industry. Even though each of Messrs. Binder, Florin, Kashuba and Serbousek has been with us for less than five years, collectively the members of our senior management team have an average tenure of 20 years in the medical device industry.
Premier Equity Sponsorship. The Blackstone Group, Goldman, Sachs & Co., Kohlberg Kravis Roberts & Co. and TPG Capital are among the most well-known and respected financial sponsors in the world. The Sponsors have made investments in over 950 companies. The Sponsors and the Co-Investors contributed approximately $5,387.5 million of equity in connection with the Transactions, representing 46% of the total funding for the Transactions, as part of one of the largest private equity investments in history. The Sponsors have considerable experience in the healthcare sector with investments in companies such as Accellent Inc., HCA Inc., IASIS Healthcare Corporation, Quintiles Transnational Corp., DJO Inc. and Vanguard Health Systems, Inc., among others.
Economic Uncertainties
Our results of operations could be substantially affected not only by global economic conditions, but also by local operating and economic conditions, which can vary substantially by market. Unfavorable conditions can depress sales in a given market and may result in actions that adversely affect our margins, constrain our operating flexibility or result in charges which are unusual or non-recurring. Certain macroeconomic events, such as the current adverse conditions in the global economy, including most recently with the market disruption caused by the downgrade by Standard & Poor’s of the U.S. debt rating from AAA to AA+, could have a more wide-ranging and prolonged impact on the general business environment, which could also adversely affect us.
We believe the global uncertainty or recessionary environment has impacted the year-over-year market growth rates of the orthopedic reconstructive device industry from the historical rates in the high single digits to current market growth rates in the flat-to-low single digits. Because of this, management has implemented cost savings initiatives to be able to manage expenses more conservatively.
Regulatory and Other Uncertainties
In the United States, healthcare providers that purchase our products (e.g., hospitals, physicians, dentists and other health care providers) generally rely on payments from third-party payors (principally federal Medicare, state Medicaid and private health insurance plans) to cover all or a portion of the cost of our musculoskeletal products. In March 2010, comprehensive health care reform legislation was enacted through the passage of the Patient Protection and Affordable Health Care Act (H.R. 3590) and the Health Care and Education
8
Table of Contents
Reconciliation Act (H.R. 4872). Among other initiatives, these laws impose a 2.3% excise tax on domestic sales of medical devices following December 31, 2012, which is estimated to contribute approximately $27 billion to healthcare reform. Various healthcare reform proposals have also emerged at the state level. Outside of the excise tax, which will impact our results of operations and cash flows following December 31, 2012, we cannot predict with certainty what healthcare initiatives, if any, will be implemented at the state level, or what the ultimate effect of federal health care reform or any future legislation or regulation will have on us. However, an expansion in government’s role in the U.S. healthcare industry may lower reimbursements for our products, reduce medical procedure volumes and adversely affect our business, results of operations and cash flows, possibly materially.
Outside the United States, reimbursement systems vary significantly from country to country. If adequate levels of reimbursement from third-party payors outside the United States are not obtained, international sales of our products may decline. Many foreign markets, including Canada and some European and Asian countries, have tightened reimbursement rates. Our ability to continue to sell certain products profitably in these markets may diminish if the government-managed healthcare systems continue to reduce reimbursement rates, which can decrease pricing and procedural volume.
We continue to monitor economic conditions, including the volatility associated with international sovereign economies, and associated impacts on the financial markets and our business, especially in light of the global economic downturn and the European sovereign debt crisis. We believe the credit and economic conditions within Greece, Ireland, Italy, Portugal, Spain and Turkey, among other members of the European Union, have continued to deteriorate. These conditions have resulted in, and may continue to result in, an increase in the average length of time that it takes to collect on our accounts receivable outstanding in these countries.
As of May 31, 2011, our orthopedic net accounts receivable in these countries totaled over $70.0 million. To date, we have not experienced any significant cash losses with respect to the collection of our accounts receivable related to sales within these countries. However, during fiscal 2010 we did recognize $9.3 million of expense to adjust our public accounts receivable in Greece to its expected net realizable value based upon the proposal by the Greek government to settle certain past due healthcare liabilities with long-term zero coupon bonds. We received $45.5 million face-value zero coupon bonds from the Greek government as payment for the outstanding accounts receivable balance from 2007-2009 related to certain government sponsored institutions in a non-cash transaction. Upon receipt, the bonds had a fair value of $33.8 million, with maturity dates of one to three years. The bonds are designated as available-for-sale securities. The one year bonds are due to mature in December 2011 and we are unable to predict if the Greek government will be able to settle its obligations upon maturity or otherwise.
Business Strategy
We intend to enhance our position as a leading orthopedic medical device company by pursuing the following strategic initiatives:
Continue to Develop and Launch New Products and Technologies. In May 2009, we launched our New Product Introduction, or NPI, process worldwide. The NPI process is a global portfolio and project management approach that helps bring visibility and control to all commercial aspects of new product development projects. The process breaks each project down into six stages of work and further divides these stages by formal review gates. We have a single database of all of our development projects that is easily filtered and sorted to generate customized project roadmaps that serve as communication tools providing visibility to all functional teams. The database is designed to prioritize and focus the portfolio and also ensure that the workload is properly resourced and managed across the business. Projects are assessed against pre-determined gate criteria. Functional teams, along with the global portfolio review teams, select and prioritize projects that are expected to help deliver the growth target, meet strategic drivers, can be adequately resourced, provide a balanced portfolio, and meet specific hurdle rates.
9
Table of Contents
Enhance Surgeon Customer Relationships through Product Performance and Innovation. We intend to continue to meet the needs of our surgeon customers and hospital customers by providing clinically superior and innovative products that offer a cost-effective means of treating patients. Our success has been built on responsiveness to the needs of the health care community, the clinical performance of our products and our ongoing commitment to continued product innovation.
Expand Our Global Reach. We intend to continue to increase the geographic presence of each of our business categories. We believe there are considerable opportunities for global expansion as healthcare spending increases in international markets—the United States accounted for approximately 58% of the global orthopedic market in 2010, but only approximately 5% of the world’s population. We particularly plan to focus on deepening our position in under-penetrated regions where we believe there are attractive opportunities for growth, including Asia and Latin America, by deploying more resources to capture market opportunities, as well as by leveraging our established worldwide manufacturing facilities and sales force. We believe we can successfully grow our presence in these regions by differentiating ourselves as a provider with a comprehensive portfolio of leading musculoskeletal products.
Focus on Operational Efficiency. We believe we have identified significant opportunities to streamline operations. We believe the historically decentralized nature of our management and decision-making structure creates opportunities to improve operational efficiency as we centralize operations and increase focus, coordination and accountability throughout the organization. Plans include manufacturing footprint optimization, implementation of Six Sigma and Lean Manufacturing, procurement and offshoring initiatives, as well as reduction in overhead expenses. These changes were initiated during fiscal 2008 and will continue through fiscal 2012 and beyond, and we believe these changes will enable us to maximize asset utilization, optimize working capital and increase cash flow, as well as accelerate product development and enhance customer service. During fiscal 2011 we initiated a reorganization of our global reconstructive product organization.
Maximize Operating Cash Flow. We are focused on maximizing our operating cash flow. Over the last 20 years, we have generated significant operating cash flow due to our business growth, strong operating margins and modest capital expenditure and other cash requirements. These business fundamentals have been supplemented by working capital improvement initiatives, which historically had not been a primary focus area of management. In addition, we have benefited and believe we will continue to benefit from identified cost savings as we enhance operational efficiencies. We plan to use available cash after capital expenditures primarily to reduce leverage, strengthen our balance sheet and make strategic acquisitions.
Products
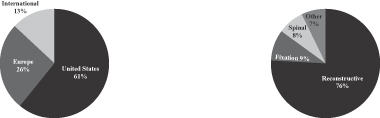
We operate in one business segment, musculoskeletal products, which includes the design, manufacture and marketing of products in four major categories: Reconstructive Products, Fixation Devices, Spinal Products and Other Products. We have three reportable geographic markets: United States, Europe and International.
The following charts set forth our net sales by product category and geographic markets for the fiscal year ended May 31, 2011. For certain financial information concerning our product categories and geographic markets, see Note 13 to our audited consolidated financial statements included elsewhere herein.
10
Table of Contents
Reconstructive Products
Orthopedic reconstructive implants are used to replace joints that have deteriorated as a result of disease (principally osteoarthritis) or injury. Reconstructive joint surgery involves the modification of the area surrounding the affected joint and the implantation of one or more manufactured components, and may involve the use of bone cement. Our primary orthopedic reconstructive joints are knees, hips and shoulders, but we produce other joints as well. We also produce the associated instruments required by orthopedic surgeons to implant our reconstructive products, as well as bone cements and cement delivery systems. In addition, dental reconstructive devices and associated instrumentation are used for oral rehabilitation through the replacement of teeth and repair of hard and soft tissues.
Knee Systems. A total knee replacement typically includes a femoral component, a patellar component, a tibial component and an articulating surface. Total knee replacement may occur as an initial joint replacement procedure or as a revision procedure, which may be required to replace, repair or enhance the initial implant. Partial, traditionally referred to as unicompartmental, knee replacement is an option when only a portion of the knee requires replacement.
Our most comprehensive total knee system, the Vanguard® Complete Knee System, accommodates up to 145 degrees of flexion and offers full interchangeability of the system’s components to provide for a precise fit for each patient. The Vanguard® Complete Knee System is supported by five instrumentation platforms: Microplasty®, Premier™, Microplasty® Elite, Vanguard® Tensor and Vanguard® Anterior Referencing systems, accommodating a number of workflows and techniques.
During fiscal 2011, we started the clinical evaluation of our newest revision knee offering, Vanguard® SSK 360 Revision System. This innovative system, which is an extension of our Vanguard® Complete Knee System, offers optimum stability, while maximizing options for intraoperative flexibility.
In February 2011, we received clearance to resume marketing the Signature™ System which was initially designed for use in primary knee procedures and is also being developed for use in partial knee applications. The Signature™ System uses a patient’s MRI or CT data to deliver patient-specific positioning guides to the surgeon for improved pre-operative planning, custom positioning of the implants, and improved surgical efficiency. The Signature™ System was developed through a partnership with Materialise and we believe this technology will be expanded to other orthopedic applications.
During fiscal 2011, E1® Antioxidant Infused Technology Tibial Bearings continued to receive strong market demand. The E1® technology provides Vitamin E infused highly cross-linked polyethylene, which is designed to offer strength and oxidative stability for improved implant longevity.
We continue to be a market leader for products accommodating minimally-invasive knee techniques. The Oxford® Partial Knee, which was introduced in the United States during fiscal 2005, is currently the only free-floating meniscal bearing unicompartmental knee system approved by the United States Food and Drug Administration, or “FDA,” for use in the United States. Our offering of minimally-invasive partial knee systems also includes the Alpina™ Unicompartmental Knee (which is not currently available in the United States); the Vanguard M™ Series Unicompartmental Knee System, a modified version of the Oxford® Partial Knee that incorporates a fixed-bearing tibial component as opposed to a free-floating tibial bearing; and the Repicci II® Knee System that is distributed by our sports medicine subsidiary.
Hip Systems. A total hip replacement involves the replacement of the head and neck of the femur and the acetabulum and may occur as an initial joint replacement procedure, or as a revision procedure, which may be required to replace, repair or enhance the initial implant. A femoral hip prosthesis consists of a femoral head and stem, which can be cast, forged or wrought, depending on the design and material used. Many of the femoral prostheses utilize our proprietary PPS® Porous Plasma Spray coating, which enables cementless fixation.
11
Table of Contents
Acetabular components include a prosthetic replacement of the socket portion, or acetabulum, of the pelvic bone. Because of variations in human anatomy and differing design preferences among surgeons, we manufacture femoral and acetabular prostheses in a variety of sizes and configurations. We offer a broad array of total hip systems, most of which utilize titanium or cobalt chromium alloy femoral components and our ArCom®, ArComXL® or E1® polyethylene-lined, metal-on-metal or ceramic-on-ceramic acetabular components.
From our broad product platform of hip stem offerings, the Taperloc® Hip System has become our best-selling component. The Taperloc® Stem is marketed for non-cemented use in patients undergoing primary or revision hip replacement surgery as a result of noninflammatory degenerative joint disease. The Taperloc® femoral component is a collarless, flat, wedge-shaped device that is relatively simple to implant and is particularly well-suited for minimally-invasive procedures. During the fourth quarter of fiscal 2011, we initiated the rollout of the Taperloc Complete stem, which combines the proven clinical data of the Taperloc stem with subtle design changes to better address the fit and biomechanics of active patients. We also offer the Taperloc® Microplasty® Stem that addresses the demand for a minimally-invasive, bone-conserving total hip implant. The shorter length of the Microplasty® Stem, compared to a traditional hip stem, allows for preservation of distal bone, while maintaining proximal femoral bone fixation.
Our comprehensive Microplasty® Minimally Invasive Hip Program includes proprietary products from our broad array of hip implants, as well as a distinctive training program and uniquely-designed instruments for a minimally-invasive approach. Our minimally-invasive hip development efforts have been focused on various surgical approaches, including an anterior supine intermuscular surgical approach.
During the second half of fiscal 2009, we launched the Echo® Bi-Metric® stem which is a cementless press-fit stem for primary total hip procedures. The Echo® Bi-Metric® stem utilizes proven features of the Integral® and Bi-Metric® stems, while integrating new design features to further enhance clinical performance by accommodating a wider range of femoral canals, allowing for increased range of motion, and providing standard and lateralized offset options to restore biomechanics.
In our acetabular portfolio, our M2a-Magnum™ Articulation System incorporates large diameter metal-on-metal components to more closely resemble the natural anatomy, offering joint mechanic restoration designed to improve range of motion and joint stability. We market ArComXL® polyethylene, which is a highly crosslinked polyethylene bearing material based on our proven ArCom® polyethylene. ArComXL® polyethylene has demonstrated excellent wear characteristics without measurable oxidation after accelerated aging. During fiscal 2007, we received FDA clearance to market acetabular hip liners manufactured from E1® material. Vitamin E is a natural antioxidant and is expected to provide optimal oxidation resistance for the implant bearings used in our total joint replacements.
The ReCap® Total Resurfacing System is a bone-conserving hip product currently marketed outside the United States for patients in the early stages of degenerative joint disease, including osteoarthritis, rheumatoid arthritis and avascular necrosis. We commenced a clinical study for the ReCap® Total Resurfacing System in the United States during fiscal 2006 and as of May 31, 2010, patient enrollment had been completed with 272 patients enrolled in the study. The FDA accepted the inclusion of European clinical data to support our U.S. Pre-Market Approval submission, subject to further review of the data after submission. We believe the potential exists to bring this product to the U.S. market during the calendar year 2012.
We introduced the Regenerex® RingLoc®+ Modular Acetabular System during fiscal 2008 and it received strong market demand during fiscal years 2009, 2010 and 2011. The Regenerex® Construct unites the proven clinical history of titanium with an enhanced interconnecting pore structure, resulting in an innovative material that provides for high levels of biologic fixation and provides design flexibility and solutions for difficult primary and revision procedures. The advanced titanium scaffold structure of the Regenerex® Construct is a continuous three-dimensional matrix comprised of industry-standard Ti-6AL-4V. Titanium is a clinically proven material in the orthopedic market, with optimal biological fixation, and the Regenerex® construct is expected to be the material of choice for porous metal constructs.
12
Table of Contents
We introduced our Active Articulation™ E1® System and our Active Articulation™ ArcomXL® System late in fiscal 2011. This system is a dual-mobility acetabular system that is designed to provide the benefits of a large head design, including low wear and low risk of dislocation.
We also introduced our Arcos® Modular Femoral Revision System in fiscal 2011, which contributed to our revision hip sales growth for the year. The Arcos® System offers surgeons the ability to select from a range of interchangeable components intraoperatively, using a single set of instruments.
Extremity Systems. We offer a variety of shoulder systems including the Absolute® Bi-Polar, Bi-Angular®, Bio-Modular®, Comprehensive®, Copeland™, Integrated™ and Mosaic™ Shoulder Systems, as well as uniquely-designed elbow replacement systems.
The Copeland™ Humeral Resurfacing Head was developed to minimize bone removal in shoulder procedures and has approximately 20 years of positive clinical results in the United Kingdom. This system was expanded to include the Copeland™ EAS™ Extended Articular Surface Humeral Resurfacing Head designed to address rotator cuff arthropathy.
The initial release of the Comprehensive® Primary Shoulder occurred at the end of fiscal 2007 and included the standard and mini length Comprehensive® Primary Stems and the Versa-Dial® Heads, as well as the Hybrid® glenoids. The Comprehensive® Primary System was fully released by the end of fiscal 2008 and continued to receive high levels of market demand during fiscal years 2009, 2010 and 2011.
During the fourth quarter of fiscal 2009, we introduced the Comprehensive® Reverse Shoulder System which offers excellent intraoperative flexibility. This is our first reverse shoulder introduction that will utilize the Comprehensive® platform stems, providing for cemented or cementless use. This system was designed to eliminate scapular notching by incorporating a more anatomic center of rotation utilizing our Versa-Dial® glenospheres.
Our T.E.S.S.™ Total Evolutive Shoulder System continued to receive strong market demand in Europe during fiscal 2011. The T.E.S.S.™ System, which is only available outside the United States, is a complete system that can be used in all indications of shoulder arthroplasty.
Dental Reconstructive Devices. Through our subsidiary, Biomet 3i, LLC, or Biomet 3i, we develop, manufacture and market products designed to enhance oral rehabilitation through the replacement of teeth and the repair of hard and soft tissues. These products include dental reconstructive devices and related instrumentation, bone substitute materials, and regenerative products and materials. A dental implant is a small screw, normally constructed of titanium or titanium alloy, which is surgically placed in the bone of the jaw to replace the root of a missing tooth and to provide an anchor for an artificial tooth.
Our historical flagship product, the OSSEOTITE® product line, features a micro-roughened surface technology, which allows for early/immediate loading and improved bone integration to the surface of the implant as compared to machined surfaced implants. In fiscal 2007, we further enhanced implant surface technology with the introduction of the NanoTite™ Implant. The surface features the application of nanometer scale crystals of calcium phosphate to the existing OSSEOTITE® surface. The NanoTite™ Implant was initially introduced in the Certain® Implant configuration, which is an internal connection system that, through the use of the QuickSeat® connection, provides audible and tactile feedback when restorative abutments and ancillary components are seated into the implant. In addition, the 6 / 12 point hex connection design of the Certain® Implant System offers enhanced flexibility in placing the implant when pre-angled abutments are used. In fiscal 2009, we continued to expand the NanoTite™ Implant line by introducing the NanoTite™ Certain® Tapered PREVAIL® Implant. This implant, with integrated Platform Switching, is designed for crestal bone preservation and aesthetic results by limiting hard and soft tissue recession. This is our first tapered geometry implant available commercially that integrates the platform switching concept.
13
Table of Contents
Launched in 2011, the OSSEOTITE® 2 Implant is an enhancement to the legacy OSSEOTITE® Implant. With more surface area in direct contact with the osteotomy wall, this implant is designed for greater bone-to-implant contact for primary stability, an important clinical consideration when pursuing more challenging surgical protocols such as immediate loading or immediate extraction and placement cases. Also in 2011, the Tapered Certain® Implant manufactured from commercially pure titanium was introduced. Complementing the titanium alloy Tapered Certain® Implant, the commercially pure titanium tapered implant line extension is intended for markets (particularly Europe) where there is a strong preference for implant systems made from this material.
In the site preparation category of the dental product portfolio, we commercially launched our Navigator® Instrumentation for guided surgery during the third quarter of fiscal 2008. In 2010, the line was extended with the addition of guided instrumentation for use with our Tapered Implant line. This open architecture instrumentation is designed to interface with the software and surgical guide solutions offered by existing entities in the marketplace. As planning and guide fabrication are based upon computed tomography scans, this can result in more accurate implant placement when combined with the depth and rotational control offered by our instrumentation. As implant placement position can be replicated as planned, this can also provide the opportunity for fabrication of a provisional prosthesis in advance of surgery, thereby allowing for a complete implant restoration in one patient visit.
On the regenerative side of the site preparation portfolio, we have continued to expand and improve our comprehensive bone grafting product and service offering. The portfolio now offers a variety of grafting materials (i.e., allografts, allograft putty, xenografts, and synthetics) and a resorbable collagen membrane, the OsseoGuard® Membrane. Inl 2009, we introduced a larger granule size (1000—2000mm) for Endobon® Xenograft Granules. This larger particle size range of bovine-derived particulate bone grafting material is suitable for use in large defects, such as sinus augmentation procedures. Recently, we began offering the irradiated version of our RegenerOss® Allograft particulate. RegenerOss® Allograft Irradiated material undergoes the same processing as aseptic RegenerOss® Allograft items, with the addition of a step for sterilization.
Regarding our restorative segment, we launched the Low Profile Abutment for screw-retained restorations in 2011. Screw-retained abutments are designed to provide clearer access to, and retrievability of, single and multiple-unit implant restorations. In addition, certain patient situations may require the benefits of screw-retained restorations such as full mouth reconstruction and immediate loading techniques.
Within Digital Dentistry, we launched our Encode® Impression System patient-specific abutment technology in fiscal 2009. This enhancement of the baseline Encode® Abutment offering allows us to fabricate an abutment and orient implant body analogs into the proper position in a stone master model. This can enable the complete fabrication of a restoration from one supragingival impression, which is significantly easier than present techniques and a potential opportunity for more general dentists to become involved in implant therapy. The quality of these abutments and the ability to save significant chair time are also potential benefits to more experienced restorative dentists. The material choice for Encode® Impression System abutment fabrication was expanded in fiscal 2009 to include Zirconia options for the fabrication of aesthetic, all-ceramic restorations.
Other Reconstructive Products and Services. Our PMI® Patient-Matched Implant services group designs, manufactures and delivers patient-specific reconstructive devices to orthopedic specialists. We believe this service continues to enhance our reconstructive sales by strengthening our business relationships with orthopedic surgeons and augmenting our reputation as a responsive company committed to excellent product design. In order to assist orthopedic surgeons and their surgical teams in preoperative planning, our PMI® group utilizes a three-dimensional, or 3-D, bone reconstruction imaging system. We use computed tomography, or CT, data to produce 3-D reconstructions for the design and manufacture of patient-matched implants. With this imaging and model-making technology, our PMI® group is able to assist the physician prior to surgery by creating 3-D models. Within strict deadlines, the model is used by engineers, working closely with the surgeon, to create a PMI® design for the actual manufacturing of the implant for each specific patient.
14
Table of Contents
We are involved in the ongoing development of bone cements and delivery systems. We have broadened the range of our internally developed and manufactured bone cement product offerings. Cobalt™ HV (High Viscosity) Bone Cement, which was introduced in the United States during fiscal 2006, and Cobalt™ MV (Medium Viscosity) Bone Cement, which was introduced in the United States during fiscal 2010, are particularly well suited for use in minimally-invasive surgery, but may be used in all applicable joint replacement procedures. The excellent handling characteristics and high optical contrast of Cobalt™ HV Bone Cement and Cobalt™ MV Bone Cement are well suited to the current trends in orthopedic surgery. The SoftPac™ monomer packaging offers the only alternative to glass vial packaging, which is inherently less safe due to the necessity to break the glass vial to deliver the monomer. We offer our internally developed and manufactured bone cements with and without antibiotics.
In Europe, we introduced the OptiPac™ pre-loaded bone cement and delivery system during fiscal 2008. During fiscal 2011, the OptiPac™ closed vacuum system continued to receive strong market demand, reinforcing our position as the leader in the European bone cement market. During fiscal 2011 we increased focus on strengthening our position in the revision segment, including through the launch of our StageOne™ Select Hip Cement Spacer Molds, which are single-use molds designed to create a temporary cement spacer for patients undergoing a two-stage revision.
Autologous Therapy Products and Services. We manufacture and market a line of autologous therapy products through our subsidiary, Biomet Biologics, LLC, or Biomet Biologics, including autologous blood processing disposables, as well as offering bone grafting materials. Our offering is comprised of six core technologies including the GPS® III System, the Plasmax® Plasma Concentration System, the BioCUE™ Platelet Concentration System, the Bonus® DBM, and the Clotalyst® Autologous Serum Collection System.
The GPS® III System is a device that collects platelet concentrate from a small volume of the patient’s blood using a fast, single centrifuge cycle process. The GPS® III System is designed to provide a high percentage of platelet concentrate and we believe that this device has broad potential applications in the reconstructive and spine markets.
Additional products and services for reconstructive indications include bone substitute materials and services related to allograft material. Our allograft services address several market segments, including the orthopedic and dental reconstructive segments, as well as the spinal, craniomaxillofacial and sports medicine segments.
Fixation Devices
Our fixation products include electrical stimulation devices (excluding spine applications), external fixation devices, craniomaxillofacial fixation systems, internal fixation devices and bone substitute materials utilized in fracture fixation applications. Our craniomaxillofacial fixation products are marketed by our subsidiary, Biomet Microfixation, LLC, or Biomet Microfixation.
Electrical Stimulation Systems. Bone growth stimulation is a method of delivering a low level electrical current or ultrasound to a nonunion fracture site to promote bone growth.
The EBI Bone Healing System® is indicated for the treatment of nonunion fractures, failed fusions and congenital pseudarthrosis in the appendicular system. A nonunion is considered to be established when there are no visible progressive signs of healing. The EBI Bone Healing System® utilizes Pulsed Electromagnetic Fields (PEMF) for the treatment of fracture non-unions. Treatment is delivered through an anatomically configured therapeutic treatment coil.
The OrthoPak® 2 Bone Growth Stimulator is indicated for the treatment of an established nonunion acquired secondary to trauma, excluding vertebrae and all flat bones, where the width of the nonunion defect is less than one-half the width of the bone to be treated. The OrthoPak® 2 Bone Growth Stimulator utilizes
15
Table of Contents
capacitive coupling technology, which involves the upregulation of growth factors that modulate bone healing. The device consists of a small, lightweight generator worn outside the body that is connected to wafer-thin electrodes applied over the nonunion site.
We also offer an implantable option when bone growth stimulation is required in conjunction with, or subsequent to, surgical intervention. The Biomet® OsteoGen™ surgically implanted bone growth stimulator is indicated for the treatment of long bone non-unions. Specifically, the device is only to be used to treat multiple non-unions or a severely comminuted non-union where a single cathode cannot span the entire breadth of the non-union site.
The trauma hardware market can be segmented into two product classifications: External Fixation Devices and Internal Fixation Devices.
External Fixation Devices. External fixation devices are used to stabilize fractures when alternative methods of fixation are not suitable, due to a variety of clinical indications, including treatment of open fractures. Biomet offers a complete line of solutions for various segments of the fracture and reconstructive external fixation markets.
Biomet external fixation products are modular devices intended for use in simple and/or complex fractures of upper extremities, the pelvis and lower extremities. The Biomet® Vision™ Unilateral Fixator is a carbon-based external fixation device intended for use in the treatment of bone conditions including leg lengthening, osteotomies, arthrodesis and fracture fixation addressing periarticular, diaphyseal and other fractures amenable to temporary, or to definitive external fixation measures. This device offers serrated mechanical locks that allow for up to 120° of articulation for controlled fracture reduction and radiolucency for unobstructed radiographic imaging of the fracture site.
When stabilizing fractures is critical, the Biomet® Vision™ Pin to Bar system offers an MRI/CT safe modality. The Biomet® Vision™ Pin to Bar system is indicated for stabilization of long bone and pelvic fractures.
Internal Fixation Devices. Internal fixation devices include products such as intramedullary (IM) nails, plates, screws, pins and wires designed to stabilize traumatic bone injuries. These devices are used by orthopedic surgeons to provide an accurate means of setting and stabilizing fractures and for other reconstructive procedures. They are intended to aid in the healing process and may be removed when healing is complete. Internal fixation devices are not intended to replace normal body structures.
Biomet develops, manufactures and distributes innovative products for the internal fixation market. Its flagship product used for treating hip fractures is the Biomet® PTN (Peritrochanteric Nail), which incorporates an innovative single telescoping lag screw and preassembled embedded setscrew used in conjunction to minimize soft tissue impingement. In late fiscal year 2009, Biomet launched PTN Lag Screws with OSSEOTITE® surface treatment. The OSSEOTITE® surface is produced via a dual-acid etching process that creates a roughened titanium alloy surface on the threads of PTN lag screws. Since its original introduction for use in dental implants by Biomet 3i over a decade ago, the OSSEOTITE® surface has demonstrated a significantly higher Bone-To-Implant-Contact (BIC), than standard titanium machined implants.
Innovative IM nailing systems include the Biomet® Phoenix™ Cephalomedullary/Antegrade, Retrograde Femoral, Phoenix™ Tibial and Phoenix™ Ankle Arthrodesis Nails, all of which feature CoreLock™; technology that enables the user to lock either proximal or distal screws to the IM Nail. In addition to locking, CoreLock™ gives the Phoenix™ Tibial and Ankle Arthrodesis Nails compression capabilities used to reduce diastasis. The Phoenix™ IM Nails are intended for use in fractures to the femur and tibia and for arthrodesis of the ankle.
16
Table of Contents
In reference to locked plating, the OptiLock® Proximal Humeral Plate is a pre-contoured system designed for fixation of periarticular fractures to the proximal humerus. Its splay locked screw trajectories allow the plate to be positioned more distal in relation to the rotator cuff. Like other OptiLock® products, SphereLock™ screws allow the surgeon to place either locked or unlocked screws through any hole in the plate.
During the first quarter of fiscal year 2011, Biomet began introducing the OptiLock® VL Distal Radius Plating system, an innovative and comprehensive product for addressing complex periarticular fractures to the distal radius. It features an advanced SphereLock™ technology, giving surgeons optional variable angle locked, monoaxial locked and/or unlocked bone screw fixation.
During the fourth quarter of fiscal year 2011, Biomet launched its SMPLe™ Plating system for long bone diaphyseal fractures. Like previous OptiLock® products, the SMPLe™ Plate is receiving positive feedback from orthopedic surgeons for its simplicity and fracture fixation capabilities.
Craniomaxillofacial Fixation Systems. We manufacture and distribute craniomaxillofacial, neurosurgical and resorbable implants, along with associated surgical instrumentation, which are principally marketed to craniomaxillofacial, neurosurgical, plastic, ear/nose/throat and pediatric surgeons through Biomet Microfixation. We offer HTR-PMI Hard Tissue Replacement implants for repair of severe cranial defects and bone substitute materials for use in craniomaxillofacial and neurosurgical applications.
Biomet Microfixation markets the LactoSorb® Fixation System of resorbable plates and screws comprised of a co-polymer of poly-L-lactic acid and polyglycolic acid. As a result of its innovative material, the LactoSorb® System is comparable in strength to titanium plating systems at its initial placement and is resorbed within 9 to 15 months after implantation. The LactoSorb® System is especially beneficial in pediatric reconstruction cases by eliminating the need for additional surgery to remove the plates and screws.
We introduced the iQ® Intelligent Delivery System during the third quarter of fiscal 2011. This system is designed to increase the speed of titanium screw insertion while providing cordless drilling.
Bone Substitute Materials. Bone substitute materials offer an alternative to the creation of a graft site, as well as the costs associated with this additional surgical procedure. Depending on the specific use of the bone substitute material, it can have reconstructive, fixation or spinal applications. We also provide the InterGro® line of DBM materials (InterGro® Paste, InterGro® Putty and InterGro® Plus). The InterGro® DBM materials use lecithin as a carrier, which is a natural lipid carrier that is resistant to breakdown by bodily fluids, temperature or aggressive irrigation.
Spinal Products
Our spinal products include electrical stimulation devices for spinal applications, spinal fixation systems and orthobiologics, including allograft services, for spinal applications. These products and services are primarily marketed in the United States under the Biomet Spine & Bone Healing Technologies trade name.
Spine Fusion Stimulation Systems. Spinal fusions are surgical procedures undertaken to establish bony union between adjacent vertebrae. We distribute both non-invasive and implantable electrical stimulation devices that surgeons can use as options to provide an appropriate adjunct to surgical intervention in the treatment of spinal fusion applications. We have assembled extensive preclinical research documenting the mechanism of action for the technology utilized in our spine fusion stimulation systems.
The SpinalPak® II Spine Fusion Stimulator and Biomet® SpinalPak® Non-Invasive Spine Fusion Stimulator System are noninvasive bone growth stimulators for use as an adjunct electrical treatment to primary lumbar
17
Table of Contents
spinal fusion surgery for one or two levels. Both utilize Capacitive Coupling technology that involves the upregulation of factors that modulate bone healing, which may lead to successful fusion incorporation. These devices consist of a small, lightweight generator worn outside the body that is connected to wafer-thin electrodes applied over the fusion site. Both devices are patient-friendly and optimize compliance with the treatment regimen to help fusion success.
The SpF® Implantable Spine Fusion Stimulator is an established clinical treatment for posterolateral lumbar spine fusions, and it is the only implantable spine fusion stimulator on the market, providing a constant dose of electrical stimulation for up to six months. The surgically-implanted SpF® Spine Fusion Stimulator consists of a generator that provides a constant direct current to titanium cathodes placed where bone growth is required. The SpF® Implantable Spine Fusion Stimulator is a Class III device and is indicated as a spinal fusion adjunct that increases the probability of fusion success in one or two levels or three or more levels.
Spinal Fixation Systems. We market spinal fixation devices for various spinal fusion applications. In the thoracolumbar market segment, we offer several systems. The Array® Spinal System is available in titanium or stainless steel, provides a single locking setscrew featuring V-Force™ Thread Vertical Vector Technology designed to enhance the intraoperative ease of use for the surgeon. The Array® Deformity Spine System includes various styles of screws, hooks and rods for scoliosis correction. A more recent product offering is the Polaris™ Spinal System, a low profile, top-loading, thoracolumbar system utilizing a Helical Flange® (a registered trademark of Roger P. Jackson) closing mechanism. This feature minimizes the potential for cross-threading and seat splay, simplifying the implant closing procedure for the surgeon. The Polaris™ System is available in titanium or stainless steel in 6.35mm or 5.5mm rod diameters, with various screw, hook and rod options. With the 5.5mm diameter rod system, we market titanium, stainless steel and cobalt chrome options. These multiple rod materials and diameters provide surgeons with treatment options for various types of deformity patients. Additionally, the system features instrumentation permitting direct vertebral body rotation and correction.
We also offer a variety of spacer products for the thoracolumbar market segment. The Solitaire™ Anterior Spinal System is a stand-alone device with numerous implantation options for intraoperative flexibility when performing an Anterior Lumbar Interbody Fusion (ALIF) procedure. This system is available with implants manufactured from titanium or PEEK-OPTIMA® (a registered trademark of Invibio, Limited) polymer, an implant option for increased radiographic fusion assessment. We also offer the ESL®, C-Thru™ and Ibex™ interbody spacers. All three of these spacers feature open designs to permit ample space for bone graft placement. The ESL® System has an elliptical shape, offering optimal surface contact with the vertebral body endplates. The Ibex™ System is curved to conform to the anterior shape of the adjacent vertebral body. The ESL® and Ibex™ spacers are utilized for Posterior Lumbar Interbody Fusion (PLIF) and/or Transforaminal Interbody Fusion (TLIF) procedures. The C-Thru™ spacer is indicated for Cervical Interbody Fusion. All three interbody spacers are available in PEEK-OPTIMA® (a registered trademark of Invibio, Limited) polymer for increased radiographic fusion assessment.
For cervical fixation applications, the open design of the VueLock® Anterior Cervical Plate System provides surgeons with enhanced visualization of the bone graft both during the actual surgical procedure and postoperatively on x-ray. We also offer the C-TEK® Anterior Cervical Plate, which provides a non-constrained, semi-constrained or a completely rigid construct, depending on the surgeon’s preference. Made of titanium, the C-TEK® Plate offers both fixed and variable screws in a wide variety of diameters and lengths, and features a unique locking mechanism to prevent screw back out. Recently, we introduced the MaxAn® Anterior Cervical Plate System, which incorporates technology developed by Gary K. Michelson, M.D. This unique design allows for maximum angulation of the screws, permitting the surgeon to utilize a shorter plate, which helps optimize plate placement to potentially prevent impingement of the adjacent healthy disc.
18
Table of Contents
For cervical and upper thoracic procedures, we offer the Altius™ M-INI™ Occipito-Cervico-Thoracic Spinal Fixation System, which features top-loading screws and a 3.5mm rod for maximum strength. This system also incorporates Helical Flange® (a registered trademark of Roger P. Jackson) Locking Technology. Occipital fixation is also available with the Altius™ M-INI™ System, featuring a low-profile plate that is placed independently from the pre-contoured rod.
Minimally-invasive surgery is of growing interest in the practice of many spine surgeons. In the minimally-invasive surgery market, we offer the Ballista® Percutaneous Pedicle Screw Placement System and the AccuVision® Minimally Invasive Access System. These systems address both the mini-open and percutaneous screw placement minimally invasive approaches.
To address the vertebral body compression fracture market, we offer two systems designed for the delivery of materials to weakened bone structures, including the CDV™ and LP2™ Delivery Systems. Through a series of dilating cannulae and various instruments, the systems allow the surgeon to access the anatomy through a percutaneous approach and safely deliver commercially available bone cement under low, controlled pressure. The CDV™ Delivery System offers the ability to biopsy before delivery.
Biologics. The InterGro® DBM (Demineralized Bone Matrix) portfolio includes InterGro® DBM Paste, InterGro® DBM Putty and InterGro® DBM Plus; each providing an osteoconductive and osteoinductive matrix that may be used as an autograft extender in the spine. All InterGro® DBM forms contain human tissue or allograft bone, which has been granulated, demineralized and mixed with lecithin, a natural lipid carrier that is resistant to breakdown by bodily fluids, temperature or aggressive irrigation. Intergro® DBM has the highest DBM content by weight with validated osteoinductivity and superior handling and performance characteristics. InterGro® DBM Plus contains InterGro® DBM Paste pre-mixed with Pro Osteon® 500R granules, which provide an osteoconductive scaffold that resorbs in 6-18 months and an interconnected porosity that is similar to cancellous bone that provides continuous pathways for bony in-growth.
Pro Osteon® 500R and Pro Osteon® 200R are resorbable, biocompatible, osteoconductive bone graft substitutes made from marine coral, which has a distinct chemical composition and exhibits fully interconnected porosity. The unique pore structure provides continuous pathways for bony ingrowth that are similar to the human cancellous bone in Pro Osteon® 500R or human bicortical bone in Pro Osteon® 200R. Both are a resorbable combination of hydroxyapatite and calcium carbonate that is intended to be replaced with natural bone during the healing process. Pro Osteon® 500R is available in granules and blocks, whereas Pro Osteon® 200R is available in granules.
The Indux™ Cortical Strip is machined from a single piece of human cortical bone that is fully demineralized for optimal osteoinductivity. The design allows for increased osteoinductivity when compared to demineralized cancellous bone, and its unique cross-hatched texture creates a structure that provides both strength and flexibility. The Indux™ Cortical Strip is available in two sizes and may be rehydrated with blood, bone marrow aspirate (BMA) or saline solution and then shaped to fit a void or placed in the gutters of the posterolateral spine with local bone, DBM, and/or a bone graft substitute. Rehydration with BMA allows for the introduction of osteogenic cells and completion of the bone growth triad.
The Indux™ Cancellous Sponge is machined from human cancellous bone that is fully demineralized to expose the inherent growth factors and bone morphogenetic proteins that are essential for new bone formation (osteoinductive). The Indux™ Cancellous Sponge maintains the natural interconnected porosity of cancellous bone providing an ideal scaffold for cellular infiltration and bone formation (osteoconductive). The Indux™ Cancellous Sponge is available in various shapes and sizes for multiple applications. In addition, it may be rehydrated with blood, bone marrow aspirate (BMA) or saline solution, and it expands to fill the contours of any void, thereby minimizing the space between the graft and the host bone. Rehydration with BMA allows for the introduction of osteogenic cells and completion of the bone growth triad.
Bone Substitute and Allograft Materials. The Biomet® PlatFORM™ Demineralized Bone Matrix, or DBM, derived exclusively from human bone, is an osteoconductive, osteoinductive and osteogenic matrix. This material consists of freeze-dried flexible and pliable sheets of demineralized bone matrix putty for use as a bone void
19
Table of Contents
filler. The Biomet® PlatFORM™ DBM can be utilized alone or in combination with autologous bone or other forms of allograft and can be rehydrated with bone marrow aspirate. Since this matrix has no synthetic additives, this eliminates any surgeon concern regarding toxicity of certain carriers currently used in other DBMs.
Precision Machined Allograft. Many spinal fusion procedures, in both the lumbar and cervical spine, involve spinal fusion. Surgeons often utilize precision machined allograft spacers to fuse the interbody space. We provide services related to the OsteoStim® Cervical Allograft Spacer for anterior cervical interbody fusions, the OsteoStim® ALIF Allograft Spacer for anterior lumbar interbody fusions and the OsteoStim® PLIF Allograft Spacer for posterior lumbar interbody fusions, depending on the surgical approach. All three systems are lordotic in shape, have serrated teeth on the top and bottom for added stability, are offered in various heights and have specific instrumentation to facilitate implantation.
Motion Preservation Products. In order to address the cervical artificial disc opportunity, we are developing next-generation designs utilizing innovative materials and geometries.
Other Products
We also manufacture and distribute numerous other products, including sports medicine products, orthopedic support products (also referred to as softgoods and bracing products), operating room supplies, casting materials, general surgical instruments, wound care products and other surgical products.
Sports Medicine Products. We manufacture and market a line of arthroscopy products through our subsidiary, Biomet Sports Medicine, LLC, or Biomet Sports Medicine. Arthroscopy is a minimally-invasive orthopedic surgical procedure in which an arthroscope is inserted through a small incision to allow the surgeon direct visualization of the joint. This market is comprised of five product categories: power instruments, manual instruments, visualization products, soft tissue anchors, and procedure-specific instruments and implants.
During the fourth quarter of fiscal 2009, we introduced ZipLoop™ Technology, a weave in which a single strand of braided polyethylene is woven through itself twice in opposite directions. This construct allows the production of products that can vary in length and compression/tension addressing the individual needs of each patient. Since the surgeon has the ability to vary the length of the implant, this eliminates the need for multiple sizes and requires minimal instrumentation. The technology is now being utilized to repair injuries in the shoulder, elbow, knee and foot and ankle.
In the fourth quarter of fiscal 2010, we launched the 1.4mm JuggerKnot™ Soft Anchor for labral repair. This product represents the next generation of suture anchor technology, as it is completely suture-based and the first of its kind. The key to a labral repair is to remove the least amount of bone possible, and the smaller anchor diameter allows multiple anchors to be placed without removing large amounts of bone.
In the third quarter of fiscal 2011 we launched the new TunneLoc® Tibial Fixation Device. This device has a hands–free tensioner that maintains tension during the insertion of the implant, which we believe is a unique feature. This allows the surgeon to set the tension on the inserter as needed and once locked, the surgeon is able to cycle the knee. In addition, the graft tensioner and inserter eliminate the need for reusable instruments, saving costly preparation time for the surgeon.
Orthopedic Support Products. We distribute a line of orthopedic support products under the Biomet Bracing name, including back braces, knee braces and immobilizers, wrist and forearm splints, cervical collars, shoulder immobilizers, slings, abdominal braces, ankle supports and a variety of other orthopedic splints.
Product Development
Our research and development efforts are essentially divided into two categories: innovative new technology and evolutionary developments. Most of the innovative new technology development efforts are focused on
20
Table of Contents
biomaterial products, are managed at the corporate level and take place primarily at our Warsaw, Indiana headquarters. Evolutionary developments are driven primarily by the individual subsidiaries and include product line extensions and improvements.
We continue to aggressively conduct internal research and development efforts to generate new marketable products, technologies and materials. In addition, we believe we are well positioned to take advantage of external acquisition and development opportunities. An important component of our strategy has been the formation of strategic alliances to enhance the development of new musculoskeletal products.
For fiscal 2011, 2010 and 2009, we spent $119.4 million, $106.6 million and $93.5 million, respectively, on research and development. It is expected that research and development expenses will continue to increase. Our principal research and development efforts relate to primary and revision orthopedic reconstructive devices, spinal fixation products, dental reconstructive devices, sports medicine products, resorbable technology, biomaterial products and autologous therapies.
Patents and Trademarks
We believe patents and other intellectual property will continue to be of importance in the musculoskeletal industry. Accordingly, we continue to protect technology developed internally and to acquire intellectual property rights associated with technology developed outside the Company. We enforce our intellectual property rights consistent with our strategic business objectives. We do not believe that we have any single patent or license (or series of patents or licenses) that is material to our operations, consolidated revenues, or earnings.
BIOMET is our principal registered trademark throughout the world, and registrations have been obtained or are in process with respect to various other trademarks associated with our products. Unless otherwise noted in this annual report, all trademarks contained herein are owned by Biomet, Inc. or one of its affiliates and subsidiaries.
Government Regulation
Most aspects of our business are subject to some degree of government regulation in the countries in which our operations are conducted. It has always been our practice to comply with the regulatory requirements governing our products and operations and to conduct our affairs in an ethical manner. This practice is reflected in our Code of Business Conduct and Ethics, various other compliance policies and through the responsibility of the Audit Committee of the Board of Directors to review our systems of internal control, our process for monitoring compliance with laws and regulations and our process for monitoring compliance with our Code of Business Conduct and Ethics. For some products, and in some areas of the world such as the United States, Canada, Japan and Europe, government regulation is significant and, in general, there appears to be a trend toward more stringent regulation throughout the world, as well as global harmonization of various regulatory requirements. We devote significant time, effort and expense to addressing the extensive government and regulatory requirements applicable to our business. Governmental regulatory actions can result in the recall or seizure of products, suspension or revocation of the authority necessary for the production or sale of a product, and other civil and criminal sanctions. We believe that we are no more or less adversely affected by existing government regulations than are our competitors.
In the United States, the development, testing, marketing and manufacturing of medical devices are regulated under the Medical Device Amendments of 1976 to the Federal Food, Drug and Cosmetic Act, the Safe Medical Devices Act of 1990, the FDA Modernization Act of 1997, the Medical Device User Fee and Modernization Act of 2002, the FDA Amendments Act of 2007, and additional regulations promulgated by the FDA and various other federal, state and local agencies. In general, these statutes and regulations require that manufacturers adhere to certain standards designed to ensure the safety and efficacy of medical devices and related medical products.
21
Table of Contents
Most of our new device products require the submission of a Premarket Notification, commonly referred to as a 510(k), to the FDA prior to our marketing the product. This process requires us to demonstrate that the device is at least as safe and effective as, or “substantially equivalent” to, a legally marketed device before we can receive an order from the FDA finding substantial equivalence and clearing the new device for commercial distribution in the United States. On July 29, 2011, the Institute of Medicine (IoM) published a report of its review of the 510(k) clearance program to FDA. The IoM report recommended that the FDA pursue a legislative change from the current 510(k) process to an integrated premarket and post-market regulatory framework. It is uncertain if these recommendations will ultimately be pursued. If they are pursued, it is possible we will be required to submit additional clinical and manufacturing information with respect to premarket applications in the future, resulting in increased costs and increased delay in introducing products to the market. Other devices we develop and market fall into a class of products for which the FDA has implemented stringent clinical investigation and Premarket Approval, or PMA, requirements. The PMA process requires us to provide clinical and laboratory data that establishes that the new medical device is safe and effective. The FDA will approve the new device for commercial distribution if it determines that the data and information in the PMA relating to design, materials, bench and animal testing and human clinical data constitute valid scientific evidence and that there is reasonable assurance that the device is safe and effective for its intended use.
There are also various federal healthcare laws that apply when we or customers submit claims for items or services that are reimbursed under Medicare, Medicaid or other federally-funded healthcare programs, including among others: (1) the Anti-Kickback Statute which prohibits offers to pay or receive remuneration of any kind for the purpose of inducing or rewarding referrals of items or services reimbursable by a Federal healthcare program; (2) the False Claims Act, which prohibits the submission of false or otherwise improper claims for payment to a federally-funded health care program; and (3) the Stark law, which prohibits physicians from referring Medicare or Medicaid patients to a provider that bills these programs for the provision of certain designated health services if the physician (or a member of the physician’s immediate family) has a financial relationship with that provider. There are often similar state false claims, anti-kickback and anti-self referral and insurance laws that apply to state-funded Medicaid and other healthcare programs and private third-party payors.
We are subject to various federal and foreign laws that govern our international business practices, particularly with respect to payments to government officials. The U.S. Foreign Corrupt Practices Act, or FCPA, has been used with some frequency to prosecute companies in the United States. The FCPA prohibits U.S. companies and their officers, directors, employees, shareholders acting on their behalf and agents from offering, promising, authorizing or making payments to foreign officials for the purpose of obtaining or retaining business abroad or otherwise obtaining favorable treatment and this law requires companies to maintain records which fairly and accurately reflect transactions and to maintain internal accounting controls. In many countries, hospitals and clinics are government-owned and healthcare professionals employed by such hospitals and clinics, with whom we regularly interact, may meet the definition of a foreign official for purposes of the FCPA. On July 1, 2011, the U.K. Bribery Act 2010 became effective, which prohibits active and passive bribery, including commercial bribery, and bribery of a foreign public official for a business purpose. The Act also imposes attribution liability on companies that fail to prevent “associated persons” from committing acts of bribery and includes far-reaching jurisdiction for prosecution.
We are also subject to various federal, state and foreign laws that protect the confidentiality of certain patient health information, including patient medical records, and restrict the use and disclosure of patient health information by healthcare providers. In April 2003, the U.S. Department of Health and Human Services (HHS) published patient privacy rules under the Health Insurance Portability and Accountability Act of 1996 (HIPAA) and, in April 2005, published security rules for protected health information. The HIPAA privacy and security rules govern the use, disclosure and security of protected health information by “Covered Entities,” which include, among others, healthcare providers that submit electronic claims and health plans. In 2009, Congress passed the HITECH Act, which modified certain provisions of the HIPAA privacy and security rules for Covered Entities and their Business Associates, which is anyone that performs a service on behalf of a Covered Entity involving the use or disclosure of protected health information and is not a member of the covered entity’s
22
Table of Contents
workforce. Among other things, the HITECH Act provided that Business Associates will now be subject to the same security requirements as Covered Entities, and that with regard to both the security and privacy rule, Business Associates will be subject to direct enforcement by HHS, including civil and criminal liability, just as Covered Entities are. In the past, HIPAA has generally affected us indirectly.
Biomet is generally not a Covered Entity under HIPAA, except for our noninvasive bone growth stimulation business and our health insurance plans. We only operate as a Business Associate to Covered Entities in a limited number of instances. In those cases, the patient data that we receive and analyze may include protected health information. We are committed to maintaining the security and privacy of patients’ health information and believe that we meet the expectations of the HIPAA rules. Some modifications to our systems and policies may be necessary to address requirements for recently enacted state privacy laws, but we believe we have laid the necessary framework for such changes. We believe the ongoing costs and impacts of assuring compliance with the HIPAA privacy and security rules are not material to our business.
We believe that we are well positioned to face the changing international regulatory environment. The International Standards Organization, or the ISO, has an internationally recognized set of standards aimed at ensuring the design and manufacture of quality products. A company that has passed ISO audits and obtained ISO certification applicable to its activity sector is internationally recognized as having quality manufacturing processes. The European Union (EU) legislation requires that medical devices bear a CE mark. The CE mark is a European Union and European Free Trade Association symbol, which indicates that the product adheres to European Medical Device Directives. Compliance with ISO quality systems standards is one of the requirements for placing the CE mark on our products. Each of our principal manufacturing facilities has been certified to ISO 13485:2003. Our products sold in Europe bear the CE mark to the extent required by European law and regulations.
In addition, governmental bodies in the United States and throughout the world have expressed concern about the costs relating to healthcare and, in some cases, have focused attention on the pricing of medical devices. Government regulation regarding pricing of medical devices already exists in some countries and may be expanded in the United States and other countries in the future. We are subject to increasing pricing pressures worldwide as a result of growing regulatory pressures, as well as the expanding predominance of managed care groups and institutional and governmental purchasers. Under Title VI of the Social Security Amendments of 1983, hospitals receive a predetermined amount of Medicare reimbursement for treating a particular patient based upon the patient’s type of illness identified with reference to the patient’s diagnosis under one or more of several hundred diagnosis-related groups. Other factors affecting a specific hospital’s reimbursement rate include the size of the hospital, its teaching status and its geographic location.
While we are unable to predict the extent to which our business may be affected by future regulatory developments, we believe that our substantial experience in dealing with governmental regulatory requirements and restrictions throughout the world, our emphasis on efficient means of distribution and our ongoing development of new and technologically-advanced products should enable us to continue to compete effectively within this increasingly regulated environment.
Sales and Marketing
We have diligently worked to attract and retain qualified, well-trained and motivated sales representatives. The breadth of our product offering and the quality of our sales forces collaborate to create synergies that we believe uniquely position us to continue to efficiently penetrate the musculoskeletal market. In the United States, our products are marketed by a combination of independent third-party distributors, independent commissioned sales agents and direct sales representatives, primarily based on the specific product group being represented. In Europe, our products are promoted by sales representatives employed by subsidiaries, independent third-party distributors, and some independent commissioned sales agents, based primarily on the geographic location. In the rest of the world, we maintain direct selling organizations in eleven countries, as well as independent commissioned sales agents and independent third-party distributors in other key markets. In aggregate, our products are marketed by more than 3,000 sales representatives throughout the world.
23
Table of Contents
Seasonality
Elective surgery-related products are influenced to some degree by seasonal factors, as the number of elective procedures declines during the summer months, particularly in European countries, and the winter holiday season.
Customers
Our customers are the hospitals, surgeons, other physicians and healthcare providers who use our products in the course of their practices. Our business is dependent upon the relationships maintained by our distributors and salespersons with these customers, as well as our ability to design and manufacture products that meet the physicians’ technical requirements at a competitive price.
Inventory and Trade Accounts Receivable
We have inventory located throughout the world with our customers, our distributors and direct salespersons for their use in marketing our products and in filling customer orders. As of May 31, 2011, inventory of approximately $268.4 million was located with these distributors, salespersons and customers. We maintain trade accounts receivable balances based on credit terms that are generally consistent with industry and local market practices.
Distribution
We operate distribution facilities domestically in Warsaw, Indiana; Milford, Indiana; Irvine, California; Palm Beach Gardens, Florida; Parsippany, New Jersey; Jacksonville, Florida; Fair Lawn, New Jersey; and Braintree, Massachusetts, and internationally in Valence, France; Berlin, Germany; Dordrecht, The Netherlands; Hazeldonk, The Netherlands; Valencia, Spain; Bridgend, South Wales; Swindon, England; Tokyo, Japan; Seoul, South Korea; North Ryde, Australia; Jinhua, China; and Changzhou, China. We generally ship our orders via expedited courier service. Our backlog of firm orders is not considered material to understanding our business.
Competition
Our business is highly competitive. Competition within the industry is primarily based on service, clinical results and product design, although price competition is an important factor as healthcare providers continue to be concerned with costs. Major competitors in our four product categories are set forth below by market category.
Reconstructive Products
Our orthopedic reconstructive devices compete with those offered by DePuy, Inc. (a Johnson & Johnson company), Smith & Nephew plc, Stryker Orthopaedics (a division of Stryker Corp.) and Zimmer, Inc. (a subsidiary of Zimmer Holdings, Inc.). Management believes these four companies, together with Biomet, have the predominant share of the global orthopedic reconstructive device market. We believe that our prices for orthopedic reconstructive devices are competitive with those in the industry. We believe that our future success will depend upon, among other things, our service and responsiveness to our distributors and orthopedic specialists, the continued strong clinical results of our products, and upon our ability to design and market innovative and technologically-advanced products that meet the needs of the marketplace.
Our dental reconstructive devices compete in the areas of dental reconstructive implants and related products. The primary competitors in the dental implant market include Nobel Biocare AB, Straumann AG, Zimmer Dental (a subsidiary of Zimmer Holdings, Inc.) and Astra Tech (currently part of the AstraZeneca Group pending the sale of Astra Tech to DENTSPLY International, Inc.).
24
Table of Contents
Fixation Devices
Our electrical stimulation devices primarily compete with those offered by Orthofix, Inc. (a subsidiary of Orthofix International N.V.), DJO Inc. (formerly ReAble Therapeutics, Inc.) and Smith & Nephew plc. Competition in the electrical stimulation market is on the basis of product design, service, price and success rates of various treatment alternatives.
Our external and internal fixation devices compete with other such devices primarily on the basis of price, ease of application and clinical results. The principal competitors in the external fixation market are Smith & Nephew plc, Stryker Trauma (a division of Stryker Corp.), Synthes, Inc. and Orthofix, Inc. (a subsidiary of Orthofix International N.V.). Our internal fixation product lines compete with those of Synthes, Inc., DePuy, Inc. (a Johnson & Johnson company), Zimmer, Inc. (a subsidiary of Zimmer Holdings, Inc.), Smith & Nephew plc and Stryker Trauma (a division of Stryker Corp.).
Spinal Products
Our spinal fixation systems compete with other spinal fixation systems primarily on the basis of breadth of product line, product recognition and price. The principal competitors in this area are Medtronic Sofamor Danek, Inc. (a subsidiary of Medtronic, Inc.), DePuy Spine (a Johnson & Johnson company), Synthes, Inc., Stryker Spine (a division of Stryker Corp.), Zimmer Spine (a subsidiary of Zimmer Holdings, Inc.) and others.
Other Products
Our craniomaxillofacial fixation products, specialty surgical instrumentation and neurosurgical cranial flap fixation products compete with those offered by Synthes, Inc., Stryker Leibinger Micro Implants (a division of Stryker Corp.), KLS-Martin, L.P., Osteomed Corp., Aesculap, Inc., Medtronic, Inc. and Codman (a Johnson & Johnson company).
Our sports medicine products compete primarily in the areas of procedure-specific implants and instruments, manual instruments and power instruments. Competitors include Smith & Nephew Endoscopy (a division of Smith & Nephew plc), Stryker Corp., Linvatec Corp. (a subsidiary of CONMED Corporation), Mitek (a division of Ethicon, a Johnson & Johnson company), Arthrocare Corp. and Arthrex, Inc.
Our orthopedic support products consist primarily of back braces, knee braces and immobilizers, wrist and forearm splints, cervical collars, shoulder immobilizers, slings, abdominal braces and ankle supports that compete with those offered by Orthofix, Inc. (a subsidiary of Orthofix International N.V.), DJO Inc. and Ossur.
Raw Materials and Supplies
Our suppliers are a critical element of Biomet’s supply chain. We have established strategic partnerships with key suppliers. This has enabled us to leverage our buying power, establish vendor managed inventory arrangements, enhance product innovation and reduce our risk. Long-term contracts allow us to develop mutually advantageous relationships with our suppliers by providing them with more visibility into our future demand and new product needs. Our Sales, Inventory and Operations Planning “SIOP” process, balances our inventory position and supply capacity with our forward looking sales plan via an integrated reconciliation process. On a monthly basis, our SIOP process in each business unit reviews demand, supply, and inventory, and identifies potential future capacity or material gaps so that the proper corrective actions can be put in place.
The raw materials used in the manufacture of our orthopedic reconstructive, trauma, spine, and dental devices are principally nonferrous metallic alloys, stainless steel and polyethylene powder. With a few exceptions, none of our raw material requirements are limited to any material extent by critical supply or single origins. The demand for certain raw materials used by us, such as cobalt-chromium alloy and titanium may vary. The primary buyers of these metallic alloys are in the aerospace industry. If the demands of the aerospace industry should increase dramatically, we could experience complications in obtaining these raw materials.
25
Table of Contents
However, based on our current relationship with our suppliers, we do not anticipate a material shortage in the foreseeable future. Further, we believe that our inventory of raw materials is sufficient to meet any short-term supply shortages of metallic alloys. The results of our operations are not materially dependent on raw material costs.
We purchase all components of our electrical stimulators from outside suppliers, approximately 20% of which are the single source of supply for the particular item. In most cases, we believe that all components are replaceable with similar components. In the event of a shortage, there are alternative sources of supply available for all components, but some time would likely elapse before our orders could be filled.
Safety stock levels of critical materials are reviewed on a quarterly basis to ensure these stocks are appropriately set. Factors that determine these stock levels include future usage estimates, lead times, forecast accuracy, commodity pricing trends, worldwide market conditions and risk mitigation. In the case of single sourced materials, stock levels are established taking into account potential disruption to supply and, where practical, back-up supply points are identified for contingency.
Environmental Matters
We are subject to various federal, state and local laws and regulations regulating the discharge of materials into the environment and otherwise relating to the protection of the environment. We do not believe that we will be required to spend any material amounts in order to comply with these laws and regulations or that compliance with such laws and regulations will materially affect our capital expenditures, results of operations, financial condition or cash flows.
Employees
As of May 31, 2011, our domestic operations (including Puerto Rico) employed 3,233 persons, of whom 1,763 were engaged in production and 1,470 in research and development, sales, marketing, administrative and clerical efforts. Our international subsidiaries employed 4,445 persons, of whom 2,292 were engaged in production and 2,153 in research and development, sales, marketing, administrative and clerical efforts. None of our principal domestic manufacturing employees are represented by a labor union. The production employees at our Bridgend, South Wales facility are organized. Employees working at the facilities in Berlin, Germany; Valence, France; Swindon, United Kingdom and Valencia, Spain are represented by Workers’ Councils. We believe that our relationship with our employees is satisfactory.
The establishment of our domestic orthopedic reconstructive manufacturing operations in north central Indiana, near other members of the orthopedic industry, provides access to the highly skilled machine operators required for the manufacture of our products. Our European manufacturing locations in South Wales, England, France, Spain and Germany also provide good sources for skilled manufacturing labor. Our Puerto Rican operations principally involve the assembly of purchased components into finished products using a skilled labor force. Our manufacturing operations in Jinhua, Zhejiang Province, and Changzhou, Jiangsu Province, China are growing and currently include approximately 850 persons who are included in the numbers above.
Available Information
Our reports filed or furnished pursuant to Section 13 or 15(d) of the Securities Exchange Act of 1934, as amended, or the Exchange Act, are available free of charge in, or may be accessed through, the “Investors” section of our website at www.biomet.com as soon as reasonably practicable after we file or furnish such material with or to the Securities and Exchange Commission, or the SEC. Any materials we file with the SEC are also available to the public at the SEC’s Public Reference Room at 100 F Street, NE, Washington, D.C. 20549. In addition, copies of these reports will be made available free of charge, upon written request to our Investor Relations Department at 56 East Bell Drive, Warsaw, IN 46582.
The information on Biomet’s website is not included as part of, nor incorporated by reference into, this Annual Report on Form 10-K except to the extent such information is separately set forth herein.
26
Table of Contents
| Item 1A. | Risk Factors |
The following factors, among others, could cause our future results to differ from those contained in forward-looking statements made in this report and presented elsewhere by management from time to time. Such factors, among others, may have a material adverse effect on our business, financial condition, results of operations and cash flows. The risks identified in this section are not exhaustive. We operate in a dynamic and competitive environment. New risk factors affecting us emerge from time to time and it is not possible for management to predict all such risk factors. Further, it is not possible to assess the impact of all risk factors on our business or the extent to which any single factor or combination of factors may cause actual results to differ materially from those contained in any forward-looking statements. Given these inherent risks and uncertainties, investors are cautioned not to place undue reliance on forward-looking statements as a prediction of actual results. Additional risks and uncertainties not currently known to us or that we currently deem to be immaterial may also materially and adversely affect our business or results of operations in the future. In addition, we undertake no obligation to publicly update or revise any forward-looking statements, whether as a result of new information, future events or otherwise. The following discussion of our risk factors speaks only as of the date on which they were made and should be read in conjunction with the consolidated financial statements and related notes included herein. Because of these and other factors, past financial performance should not be considered an indication of future performance. Any of the following risks could materially adversely affect our business, financial condition, results of operations or cash flows.
Risks Relating to Our Business
Our future profitability depends on the success of our reconstructive products.
Sales of our reconstructive products accounted for approximately 76% of our net sales for the year ended May 31, 2011, 76% of our net sales for the year ended May 31, 2010, and 75% of our net sales for the year ended May 31, 2009. We expect sales of reconstructive products to continue to account for a significant portion of our aggregate sales. Any event adversely affecting the sale of reconstructive products may, as a result, adversely affect our business, financial condition, results of operations and cash flows.
If we are unable to continue to develop and market new products and technologies in a timely manner or at all, the demand for our products may decrease or our products could become obsolete, and our revenue and profitability may decline.
The market for our products is highly competitive and dominated by a small number of large companies. We are continually engaged in product development, research and improvement efforts. New products and line extensions of existing products represent a significant component of our growth rate. Our ability to continue to grow sales effectively depends on our capacity to keep up with existing or new products and technologies in the musculoskeletal products market. The process of obtaining regulatory approvals to market a medical device, particularly from the FDA and certain foreign governmental authorities, can be costly and time consuming and approvals and clearances might not be granted for future products on a timely basis, if at all. On July 29, 2011, the Institute of Medicine (IoM) published a report of its review of the 510(k) clearance program to FDA. The IoM report recommended that the FDA pursue a legislative change from the current 510(k) process to an integrated premarket and post-market regulatory framework. It is uncertain if these recommendations will ultimately be pursued. If they are pursued, it is possible we will be required to submit additional clinical and manufacturing information with respect to premarket applications in the future, resulting in increased costs and increased delay in introducing products to the market. Other devices we develop and market fall into a class of products for which the FDA has implemented stringent clinical investigation and Premarket Approval, or PMA, requirements. The PMA process requires us to provide clinical and laboratory data that establishes that the new medical device is safe and effective. The FDA will approve the new device for commercial distribution if it determines that the data and information in the PMA relating to design, materials, bench and animal testing and human clinical data constitute valid scientific evidence and that there is reasonable assurance that the device is safe and effective for its intended use. In addition, if our competitors’ new products and technologies reach the market before our products, they may gain a competitive advantage or render our products obsolete. See
27
Table of Contents
“Business—Competition” elsewhere in this annual report for more information about our competitors. The ultimate success of our product development efforts will depend on many factors, including, but not limited to, our ability to create innovative designs and materials, provide innovative surgical techniques, accurately anticipate and meet customers’ needs, commercialize new products in a timely manner, and manufacture and deliver products and instrumentation in sufficient volumes on time.
Moreover, research and development efforts may require a substantial investment of time and resources before we are adequately able to determine the commercial viability of a new product, technology, material or other innovation. Even in the event that we are able to successfully develop innovations, they may not produce revenue in excess of the costs of development and may be quickly rendered obsolete as a result of changing customer preferences or the introduction by our competitors of products embodying new technologies or features.
In addition to the impact of the 2.3% excise tax on our results of operations beginning in our fiscal year ending May 31, 2013 following enactment of the Patient Protection and Affordable Health Care Act (H.R. 3590), our business, financial condition, results of operations and cash flows could be significantly and adversely affected if this legislation ultimately results in lower reimbursements for our products or reduced medical procedure volumes or if certain other types of healthcare reform programs are adopted in our key markets.
In the United States, healthcare providers that purchase our products (e.g., hospitals, physicians, dentists and other health care providers) generally rely on payments from third-party payors (principally federal Medicare, state Medicaid and private health insurance plans) to cover all or a portion of the cost of our musculoskeletal products. These third-party payors may deny reimbursement if they determine that a device used in a procedure was not in accordance with cost-effective treatment methods, as determined by the third-party payor, or was used for an unapproved indication. Third-party payors may also decline to reimburse for experimental procedures and devices. In the event that third-party payors deny coverage or reduce their current levels of reimbursement, we may be unable to sell certain products on a profitable basis, thereby materially adversely impacting our results of operations. Further, third-party payors are continuing to carefully review their coverage policies with respect to existing and new therapies and can, without notice, deny coverage for treatments that may include the use of our products.
In March 2010, the U.S. Congress adopted and President Obama signed into law comprehensive health care reform legislation through the passage of the Patient Protection and Affordable Health Care Act (H.R. 3590) and the Health Care and Education Reconciliation Act (H.R. 4872). Among other initiatives, these bills impose a 2.3% excise tax on domestic sales of medical devices following December 31, 2012, which is estimated to contribute approximately $27 billion to healthcare reform. Various healthcare reform proposals have also emerged at the state level. Outside of the excise tax, which will impact results of operations following December 31, 2012, we cannot predict with certainty what healthcare initiatives, if any, will be implemented at the state level, or what the ultimate effect of federal health care reform or any future legislation or regulation will have on us. However, an expansion in government’s role in the U.S. healthcare industry may lower reimbursements for our products, reduce medical procedure volumes and adversely affect our business and results of operations, possibly materially.
Outside of the United States, reimbursement systems vary significantly from country to country. In the majority of the international markets in which our products are sold, government-managed healthcare systems mandate the reimbursement rates and methods for medical devices and procedures. If adequate levels of reimbursement from third-party payors outside of the United States are not obtained, international sales of our products may decline. Many foreign markets, including Canada, and some European and Asian countries, have tightened reimbursement rates. Our ability to continue to sell certain products profitably in these markets may diminish if the government-managed healthcare systems continue to reduce reimbursement rates.
28
Table of Contents
Our business, financial condition, results of operations and cash flows could be significantly and negatively affected by substantial government regulations.
Our products are subject to rigorous regulation by the FDA and numerous other federal, state and foreign governmental authorities. Overall, there appears to be a trend toward more stringent regulation throughout the world, and we do not anticipate this trend to dissipate in the near future.
In general, the development, testing, manufacturing and marketing of our products are subject to extensive regulation and review by numerous governmental authorities both in the United States and abroad. The regulatory process requires the expenditure of significant time, effort and expense to bring new products to market. In addition, we are required to implement and maintain stringent reporting, labeling and record keeping procedures. The medical device industry also is subject to a myriad of complex laws and regulations governing Medicare and Medicaid reimbursement and health care fraud and abuse laws, with these laws and regulations being subject to interpretation. In many instances, the industry does not have the benefit of significant regulatory or judicial interpretation of these laws and regulations. In certain public statements, governmental authorities have taken positions on issues for which little official interpretation was previously available. Some of these positions appear to be inconsistent with common practices within the industry but have not previously been challenged.
Various federal and state agencies have become increasingly vigilant in recent years in their investigation of various business practices. Governmental and regulatory actions against us can result in various actions that could adversely impact our operations, including:
| • | the recall or seizure of products; |
| • | the suspension or revocation of the authority necessary for the production or sale of a product; |
| • | the suspension of shipments from particular manufacturing facilities; |
| • | the imposition of fines and penalties; |
| • | the delay of our ability to introduce new products into the market; |
| • | the exclusion of our products from being reimbursed by federal and state health care programs (such as Medicare, Medicaid, Veterans Administration health programs and Civilian Health and Medical Program Uniformed Service, or CHAMPUS); and |
| • | other civil or criminal sanctions against us. |
Any of these actions, in combination or alone, or even a public announcement that we are being investigated for possible violations of these laws, could have a material adverse effect on our business, financial condition, results of operations and cash flows.
In many of the foreign countries in which we market our products, we are subject to regulations affecting, among other things, clinical efficacy, product standards, packaging requirements, labeling requirements, import/export restrictions, tariff regulations, duties and tax requirements. Many of the regulations applicable to our devices and products in these countries, such as the European Medical Devices Directive, are similar to those of the FDA. In addition, in many countries the national health or social security organizations require our products to be qualified before they can be marketed with the benefit of reimbursement eligibility. Failure to receive or delays in the receipt of relevant foreign qualifications also could have a material adverse effect on our business, financial condition, results of operations and cash flows.
As both the U.S. and foreign government regulators have become increasingly stringent, we may be subject to more rigorous regulation by governmental authorities in the future. Our products and operations are also often subject to the rules of industrial standards bodies, such as the International Standards Organization. If we fail to adequately address any of these regulations, our business will be harmed.
29
Table of Contents
We, like other companies in the orthopedic industry, are involved in ongoing governmental investigations, the results of which may adversely impact our business and results of operations.
In September 2010, we received a Civil Investigative Demand (“CID”) issued by the U.S. Department of Justice—Civil Division pursuant to the False Claims Act. The CID requests that we provide documents and testimony related to allegations that we and OtisMed Corp. and Stryker Corp. have violated the False Claims Act relating to the marketing of, and payment submissions for, OtisMed’s OtisKnee™ (a registered trademark of Otis Med) knee replacement system. We have produced responsive documents and are fully cooperating in the investigation. We can make no assurances as to the time or resources that will be needed to devote to this inquiry or its final outcome.
In February 2010, we received a subpoena from the Office of the Inspector General of the U.S. Department of Health and Human Services requesting various documents relating to agreements or arrangements between physicians and our Interpore Cross subsidiary for the period from 1999 through the present and the marketing and sales activities associated with Interpore Cross’ spinal products. We are cooperating with the request of the Office of the Inspector General. We can make no assurances as to the time or resources that will be needed to devote to this inquiry or its final outcome.
In April 2009, we received an administrative subpoena from the U.S. Attorney’s Office for the District of Massachusetts requesting various documents relating primarily to the Medicare reimbursement of and certain business practices related to our EBI subsidiary’s non-invasive bone growth stimulators. It is our understanding that competitors in the non-invasive bone growth stimulation market received similar subpoenas. We received subsequent subpoenas in connection with the investigation in September 2009, June 2010 and February 2011 along with several informal requests for information. We are producing responsive documents and are fully cooperating in the investigation. We can make no assurances as to the time or resources that will be needed to devote to this investigation or its final outcome.
In April 2009, we became aware of a qui tam complaint alleging violations of the federal and various state False Claims Acts filed in the United States District Court for the District of Massachusetts, where it is currently pending. Biomet, its parent company LVB Acquisition, Inc., and several of our competitors in the non-invasive bone growth stimulation market were named as defendants in this action. The allegations in the complaint are similar in nature to certain categories of requested documents in the above-referenced administrative subpoenas. The U.S. government has not intervened in the action. We are vigorously defending this matter and intend to continue to do so. We can make no assurances as to the time or resources that will be needed to devote to this investigation or its final outcome.
On September 25, 2007, we received a letter from the SEC informing us that it is conducting an informal investigation regarding possible violations of the Foreign Corrupt Practices Act, or FCPA, in the sale of medical devices in certain foreign countries by companies in the medical devices industry. The FCPA prohibits U.S. companies and their officers, directors, employees, shareholders acting on their behalf and agents from offering, promising, authorizing or making payments to foreign officials for the purpose of obtaining or retaining business abroad or otherwise obtaining favorable treatment and this law requires companies to maintain records which fairly and accurately reflect transactions and to maintain internal accounting controls. In many countries, hospitals and clinics are government-owned and healthcare professionals employed by such hospitals and clinics, with whom we regularly interact, may meet the definition of a foreign official for purposes of the FCPA. If we are found to have violated the FCPA, we may face sanctions including fines, criminal penalties, disgorgement of profits and suspension or debarment of our ability to contract with government agencies or receive export licenses. On November 9, 2007, we received a letter from the Department of Justice requesting any information provided to the SEC be provided to the Department of Justice on a voluntary basis. We believe we have fully cooperated with both requests and have conducted our own review relating to these matters in certain countries in which we and our distributors conduct business. We can make no assurances as to the time or resources that will be needed to devote to this inquiry or its final outcome.
30
Table of Contents
From time to time, we have been, and may be in the future, the subject of additional investigations. If, as a result of these investigations described above or any additional investigations, we are found to have violated one or more applicable laws, our business, financial condition, results of operations and cash flows could be materially adversely affected. If some of our existing business practices are challenged as unlawful, we may have to modify those practices, which could have a material adverse effect on our business, financial condition, results of operations and cash flows.
Compliance with the terms of the Corporate Integrity Agreement requires cooperation by many employees and others and may divert substantial financial and human resources from our other business activities.
On September 27, 2007 we entered into a Deferred Prosecution Agreement with the U.S. Attorney’s Office for the District of New Jersey. The agreement concluded the government’s investigation into whether consulting agreements between the largest orthopedic manufacturers and orthopedic surgeons who use joint reconstruction and replacement products may have violated the federal Anti-Kickback Statute. Through the agreement, the U.S. Attorney’s Office agreed not to prosecute Biomet, Inc. and our wholly-owned subsidiary Biomet Orthopedics, LLC in connection with this matter, provided that we satisfied our obligations under the agreement for 18 months subsequent to September 27, 2007. The agreement called for the appointment of an independent monitor to review our compliance with the agreement, particularly in relation to our consulting agreements. The independent monitor filed a final report with the U.S. Attorney’s Office for the period from September 27, 2007 through March 1, 2009. On March 27, 2009, the Deferred Prosecution Agreement expired and the complaint was dismissed with prejudice.
As part of the resolution of this matter, we entered into a Corporate Integrity Agreement with the Office of the Inspector General of the U.S. Department of Health and Human Services, or OIG-HHS. The agreement requires us for five years subsequent to September 27, 2007 to continue to adhere to our Code of Business Conduct and Ethics and certain other provisions, including reporting requirements.
We are committed to continuing to devote sufficient resources to meet our obligations under the Corporate Integrity Agreement. Compliance with this agreement requires substantial cooperation of our employees, distributors and sales agents and the healthcare professionals with whom they interact. These efforts not only involve expense, but also require management and other key employees to focus extensively on these matters.
We could be subject to further governmental investigations or actions by other third parties as a result of our settlement with the Department of Justice and OIG-HHS.
As discussed in “Business—Government Regulation”, we are subject to various federal and state laws concerning healthcare fraud and abuse, including false claims laws and anti-kickback laws. Violations of these laws are punishable by criminal and/or civil sanctions, including, in some instances, fines, imprisonment and, within the United States, exclusion from participation in government healthcare programs, including Medicare, Medicaid and Veterans Administration (VA) health programs. These laws are administered by, among others, the U.S. Department of Justice, the Office of Inspector General of the Department of Health and Human Services and state attorneys general. Many of these agencies have increased their enforcement activities with respect to medical device manufacturers in recent years.
As discussed in Note 16, Contingencies, to the condensed consolidated financial statements contained in Part I, Item 1 of this report, the SEC has commenced an informal investigation into sales by us and other companies of medical devices in foreign countries. In addition, we are in the process of conducting our own review relating to these matters and are also cooperating with the U.S. Department of Justice. We intend to review and take appropriate actions with respect to any such investigations or proceedings; however, we cannot assure that the costs of defending or fines imposed in resolving those civil or criminal investigations or proceedings would not have a material adverse effect on our financial condition, results of operations and cash flows.
31
Table of Contents
The current global economic uncertainties may adversely affect our results of operations.
Our results of operations could be substantially affected not only by global economic conditions, but also by local operating and economic conditions, which can vary substantially by market. Unfavorable conditions can depress sales in a given market and may result in actions that adversely affect our margins, constrain our operating flexibility or result in charges which are unusual or non-recurring. Certain macroeconomic events, such as the current adverse conditions in the global economy, including most recently with the market disruption caused by the downgrade by Standard & Poor’s of the U.S. debt rating from AAA to AA+, could have a more wide-ranging and prolonged impact on the general business environment, which could also adversely affect us. These economic developments could affect us in numerous ways, many of which we cannot predict. Among the potential effects could be an increase in our variable interest rates, an inability to access credit markets should we require external financing, and further impairments of our goodwill and other intangible assets. In addition, it is possible that further deteriorating economic conditions, and resulting federal budgetary concerns, could prompt the federal government to make significant changes in the Medicare program, which could adversely affect our results of operations. We are unable to predict the likely duration and severity of the current disruption in financial markets and adverse economic conditions, or the effects these disruptions and conditions could have on us.
We have a significant amount of trade receivables with national healthcare systems in many countries. We continue to monitor the collectability of such receivables in view of the current economic state of many foreign countries as payment is dependent upon the financial stability of the economies of those countries. For instance, we believe the credit and economic conditions within Greece, Ireland, Italy, Portugal, Spain and Turkey, among other members of the European Union, have continued to deteriorate. These conditions have resulted in, and may continue to result in, an increase in the average length of time that it takes to collect on our accounts receivable outstanding in these countries. As of May 31, 2011, our orthopedic net accounts receivable in these countries totaled over $70.0 million. To date, we have not experienced any significant cash losses with respect to the collection of our accounts receivable related to sales within these countries. However, during fiscal 2010 we did recognize $9.3 million of expense to adjust our public accounts receivable in Greece to its expected net realizable value based upon the Greek government’s settlement of certain past due healthcare liabilities with long-term zero coupon bonds. We received $45.5 million face-value zero coupon bonds from the Greek government as payment for the outstanding accounts receivable balance from 2007-2009 related to certain government sponsored institutions in a non-cash transaction. Upon receipt, the bonds had a fair value of $33.8 million, with maturity dates of one to three years. The bonds are designated as available-for-sale securities. The one year bonds are due to mature in December 2011 and we are unable to predict if the Greek government will be able to settle its obligations upon maturity or otherwise.
We are subject to cost-containment efforts of group purchasing organizations, which may have a material adverse effect on our financial condition, results of operations and cash flows.
Many customers of our products have joined group purchasing organizations in an effort to contain costs. Group purchasing organizations negotiate pricing arrangements with medical supply manufacturers and distributors, and these negotiated prices are made available to a group purchasing organization’s affiliated hospitals and other members. If we are not one of the providers selected by a group purchasing organization, affiliated hospitals and other members may be less likely to purchase our products, and if the group purchasing organization has negotiated a strict compliance contract for another manufacturer’s products, we may be precluded from making sales to members of the group purchasing organization for the duration of the contractual arrangement. Our failure to respond to the cost-containment efforts of group purchasing organizations may cause us to lose market share to our competitors and could have a material adverse effect on our sales, financial condition, results of operations and cash flows.
We conduct a significant amount of our sales activity outside of the United States, which subjects us to additional business risks and may adversely affect our results due to increased costs.
During the years ended May 31, 2011, 2010 and 2009, we derived approximately $1,072.2 million, or 39% of our net sales, $1,053.9 million, or 39% of our net sales, and $976.2 million, or 39% of our net sales,
32
Table of Contents
respectively, from sales of our products outside of the United States. We intend to continue to pursue growth opportunities in sales internationally, which could expose us to additional risks associated with international sales and operations. Our international operations are, and will continue to be, subject to a number of risks and potential costs, including:
| • | changes in foreign medical reimbursement policies and programs; |
| • | unexpected changes in foreign regulatory requirements; |
| • | differing local product preferences and product requirements; |
| • | diminished protection of intellectual property in some countries outside of the United States; |
| • | differing payment cycles; |
| • | trade protection measures and import or export licensing requirements; |
| • | difficulty in staffing, training and managing foreign operations; |
| • | differing legal regulations and labor relations; |
| • | potentially negative consequences from changes in tax laws (including potential taxes payable on earnings of foreign subsidiaries upon repatriation); and |
| • | political and economic instability. |
In addition, we are subject to risks arising from currency exchange rate fluctuations, which could increase our costs and may adversely affect our results. The U.S. dollar value of our foreign-generated revenues varies with currency exchange rate fluctuations. Measured in local currency, the majority of our foreign-generated revenues were generated in Europe. Significant increases in the value of the U.S. dollar relative to foreign currencies could have a material adverse effect on our results of operations.
Any of these factors may, individually or collectively, have a material adverse effect on our business, financial condition, results of operations and cash flows.
We conduct manufacturing operations outside of the United States and are in the process of transitioning certain manufacturing operations to China, which will expose us to additional business risks.
In addition to our principal executive offices, we maintain more than 50 other manufacturing facilities, offices and warehouse facilities in various countries and regions, including Canada, Europe, Asia Pacific and Latin America.
We currently conduct operations in Jinhua, Zhejiang Province, China and Changzhou, Jiangsu Province, China. Our future business strategy may involve the operation of other manufacturing facilities in China. As a result of this initiative, we will be exposed to all the risks inherent in operating in an emerging market like China. In recent years the Chinese economy has undergone various developments, including beginning the transition from a more heavily government influenced-planned economy to a more market-oriented economy. Despite this transition, the Chinese government continues to own significant production assets and exercises significant control over economic growth. Our international operations, including our planned expansion in China, may be subject to greater or new political, legal and economic risks than those faced by our operations in the United States, including such risks as those arising from:
| • | unexpected changes in foreign or domestic legal, regulatory or governmental requirements or approvals, such as those related to taxation, lending, import and tariffs, environmental regulations, land use rights, intellectual property and other matters; |
| • | unexpected increases in taxes, tariffs and other assessments; |
| • | diminished protection of intellectual property; |
33
Table of Contents
| • | trade protection measures and import or export licensing requirements; |
| • | difficulty in staffing, training and managing foreign operations; |
| • | differing legal and labor regulations; |
| • | political and economic instability; and |
| • | operating in a market with a less developed supply chain, transportation and distribution infrastructure. |
Due to these inherent risks, there can be no assurance that we will achieve any anticipated benefits from transitioning manufacturing operations to China and any of these factors may, individually or as a group, have a material adverse effect on our business, financial condition, results of operations and cash flows.
Our business and financial performance may be adversely affected by our inability to effectively implement our global reconstructive product reorganization initiative.
As of the fourth quarter of fiscal 2011, we commenced a global reconstructive products reorganization program. The program includes the reorganization of our domestic and international reconstructive products corporate structure. Projected costs and savings associated with this program are subject to a variety of risks, including:
| • | contemplated costs to implement this program may exceed estimates; |
| • | the reorganization program we are contemplating may require consultation with various employees, labor representatives or regulators, and such consultations may influence the timing, costs and extent of expected savings; and |
| • | the loss of skilled employees in connection with this program. |
While we expect to continue to implement this program, there can be no assurance that we will be able to do so successfully or that we will realize the projected benefits of this initiative. If we are unable to realize the anticipated benefits and efficiencies of the reorganization program, our business may be adversely affected. Moreover, our continued implementation of our reorganization program may have a material adverse effect on our business, financial condition, results of operations and cash flows.
If pricing pressures cause us to decrease prices for our goods and services and we are unable to compensate for such reductions through product mix and reductions to our expenses, our results of operations will suffer.
We may experience decreasing prices for our goods and services we offer due to pricing pressure exerted by our customers in response to increased cost containment efforts from managed care organizations and other third-party payors and increased market power of our customers as the medical device industry consolidates. If we are unable to offset such price reductions through product mix or reductions in our expenses, our business, financial condition, results of operations and cash flows will be adversely affected.
Quality problems with our manufacturing processes or our goods and services could significantly and adversely affect both our reputation for producing high-quality products and our results of operations.
Our ability to manufacture and supply high-quality goods and services is critical to the marketing success of our goods and services. If we fail to satisfy our ISO quality standards, our reputation could be significantly harmed, resulting in the loss of customers and market share and significantly and adversely affecting our business, financial condition, results of operations and cash flows.
Inventory may become obsolete due to shortened product life cycles, reduced product demand or changes in market conditions, resulting in inventory write-downs that may adversely affect our results of operations, possibly materially.
In our industry, inventory is routinely placed at hospitals to provide the healthcare provider with the appropriate product when needed. Because product usage tends to follow a bell curve, larger and smaller sizes of
34
Table of Contents
inventory are provided, but infrequently used. In addition, the musculoskeletal market is highly competitive, with new products, raw materials and procedures being introduced continually, which may make those products currently on the market obsolete. We make estimates regarding the future use of these products and provide a provision for excess and obsolete inventory. If actual product life cycles, product demand or market conditions are less favorable than those projected by management, additional inventory write-downs may be required, which would affect our business, financial condition, results of operations and cash flows.
Our business may be harmed as a result of product liability litigation.
Our involvement in the manufacture and sale of medical devices creates exposure to risks of product liability claims, particularly in the United States. In the past, we have received product liability claims relating to our products and anticipate that we will continue to receive claims in the future, some of which could have a material adverse impact on our business. In addition, we could experience a material design or manufacturing failure in our products, a quality system failure, other safety issues or heightened regulatory scrutiny that would warrant a recall of some of our products. Our existing product liability insurance coverage may be inadequate to satisfy liabilities we might incur. Moreover, even if any product liability loss is covered by an insurance policy, these policies have substantial self-insured retentions or deductibles that we remain responsible for. If a product liability claim or series of claims is brought against us for uninsured liabilities or is in excess of our insurance coverage limits, our business could suffer and our financial condition, results of operations and cash flow could be materially adversely impacted.
We may be subject to intellectual property litigation and infringement claims, which could cause us to incur significant expenses or prevent us from selling our products.
The musculoskeletal products industry is highly litigious with respect to the enforcement of patents and other intellectual property rights. In some cases, intellectual property litigation may be used to gain a competitive advantage. We have in the past and may in the future become a party to lawsuits involving patents or other intellectual property. A legal proceeding, regardless of the outcome, could put pressure on our financial resources and divert the time, energy and efforts of our management.
A successful claim of patent or other intellectual property infringement against us could adversely affect our growth and results of operations, in some cases materially. From time to time, we receive notices from third parties of potential infringement and receive claims of potential infringement. We may be unaware of intellectual property rights of others that may cover some of our technology. If someone claims that our products infringed their intellectual property rights, any resulting litigation could be costly and time consuming and would divert the attention of management and key personnel from other business issues.
The complexity of the technology involved and the uncertainty of intellectual property litigation increase these risks. Claims of intellectual property infringement also might require us to enter into costly royalty or license agreements. However, we may be unable to obtain royalty or license agreements on terms acceptable to us or at all. We also may be subject to significant damages or an injunction preventing us from manufacturing, selling or using some of our products in the event of a successful claim of patent or other intellectual property infringement. Any of these adverse consequences could have a material adverse effect on our business, financial condition, results of operations and cash flows.
In January 2009, Heraeus Kulzer GmbH initiated legal proceedings in Germany against Biomet Inc. and our subsidiary, Biomet Europe BV, alleging that we and Biomet Europe BV misappropriated Heraeus Kulzer trade secrets when developing our new lines of European bone cements. The lawsuit seeks damages in excess of €30 million and injunctive relief to preclude us from producing our current line of European bone cements. We are vigorously defending this matter and intend to continue to do so. We can make no assurance as to the time or resources that will be needed to devote to this litigation or its final outcome.
35
Table of Contents
The conditions of the U.S. and international capital markets may adversely affect our ability to draw on our current revolving credit facilities as well as the value of certain of our investments.
We believe that our cash, other liquid assets and operating cash flow, together with available borrowings and potential access to credit and capital markets, will be sufficient to meet our operating expenses, research and development costs and capital expenditures and service our debt requirements as they become due. However, our ongoing ability to meet our substantial debt service and other obligations will be dependent upon our future performance, which will be subject to business, financial and other factors. We will not be able to control many of these factors, such as economic conditions in the markets where we operate and pressure from competitors. We cannot be certain that our cash flow will be sufficient to allow us to pay principal and interest on our debt, support our operations and meet our other obligations. If we do not have enough money, we may be required to refinance all or part of our existing debt, sell assets or borrow more money. We cannot guarantee that we will be able to do so on terms acceptable to us, if at all. In addition, the terms of existing or future debt agreements may restrict us from pursuing any of these alternatives.
If financial institutions that have extended credit commitments to us are adversely affected by the conditions of the U.S. and international capital markets, they may become unable to fund borrowings under their credit commitments to us, which could have a material adverse impact on our financial condition and our ability to borrow additional funds, if needed, for working capital, capital expenditures, acquisitions, research and development and other corporate purposes.
Loss of our key management and other personnel, or an inability to attract such management and other personnel, could impact our business.
We depend on our senior managers and other key personnel to run our business and on technical experts to develop new products and technologies. The loss of any of these senior managers or other key personnel could adversely affect our operations. Competition for qualified employees is intense, and the loss of qualified employees or an inability to attract, retain and motivate additional highly skilled employees required for the management, operation and expansion of our business could hinder our ability to expand, conduct research and development activities successfully and develop marketable products.
If we fail to retain our existing relationships with our independent sales agents and distributors or establish relationships with different agents and distributors, our results of operations may be negatively impacted.
Our revenues and profitability depend largely on the ability of independent sales agents and distributors to sell our products to customers. Typically, these agents and distributors have developed long-standing relationships with our customers and provide our customers with the necessary training and product support relating to our products. If we fail to retain our existing relationships with these agents and distributors or establish relationships with different agents and distributors, our results of operations may be negatively impacted.
We may record future goodwill and/or intangible impairment charges related to one or more of our business units, which could materially adversely impact our results of operations.
We test our goodwill and indefinite lived intangible asset balances as of March 31 of each fiscal year for impairment. We test these balances more frequently if indicators are present or changes in circumstances suggest that impairment may exist. In evaluating the potential for impairment we make assumptions regarding revenue projections, growth rates, cash flows, tax rates, and discount rates. These assumptions are uncertain and by nature can vary from actual results. Various future events could have a negative impact on the fair value of our reporting units’ goodwill and indefinite lived intangibles when the annual or interim impairment test is completed. The events include, but are not limited to:
| • | our ability to sustain sales and earnings growth; |
| • | the effect of anticipated changes in the size, health and activities of the population or on the demand for our products; |
36
Table of Contents
| • | our ability and intent to expand in key international markets; |
| • | the timing and anticipated outcome of clinical studies; |
| • | assumptions concerning anticipated product developments and emerging technologies; |
| • | our continued investment in new products and technologies; |
| • | the ultimate marketability of products currently being developed; |
| • | our success in achieving timely approval or clearance of our products with domestic and foreign regulatory entities; and |
| • | the stability of certain foreign economic markets. |
The estimates and assumptions used in our impairment tests are consistent with those we use in our internal planning. These estimates and assumptions may change from period to period. If we use different estimates and assumptions in the future, future impairment charges may occur and could be material.
A natural or man-made disaster could have a material adverse effect on our business.
We have 15 manufacturing operations located throughout the world. However, a significant portion of our products are produced at and shipped from our facility in Warsaw, Indiana. In the event that this facility is severely damaged or destroyed as a result of a natural or man-made disaster, we would be forced to shift production to our other facilities and/or rely on third-party manufacturers. Our existing business interruption insurance coverage may be inadequate to satisfy liabilities we might incur in such a situation. If a business interruption claim or series of claims is in excess of our insurance coverage limits, or is not otherwise covered in whole or in part by our insurance coverage, our business could suffer and our financial condition, results of operations and cash flow could be materially adversely impacted.
Any expansion or acquisition may prove risky for us.
We may, from time to time, consider and take advantage of selected opportunities to grow by acquiring businesses whose operations or product lines fit well within our existing businesses or whose geographic location or market position would enable us to expand into new markets. Our ability to implement this expansion strategy will, however, depend on whether any suitable businesses are available at suitable valuations, how much money we can spend and maintaining our customer base. Any acquisition that we make could be subject to a number of risks, including failing to discover liabilities of the acquired company for which we may be responsible as a successor owner or operator despite any investigation we may make before the acquisition, our inability to assimilate the operations and personnel of the acquired company, the loss of key personnel in the acquired company and any adverse impact on our financial statements from the amortization of acquired intangible assets or the creation of reserves or write-downs. We may not be able to adequately meet these challenges, and any failure to do so could adversely affect our business, financial condition, results of operations and cash flows. In addition, if we incur additional indebtedness to finance these acquisitions, the related risks we face from our already substantial level of indebtedness could intensify.
37
Table of Contents
Risks Related to Our Indebtedness
Our substantial level of indebtedness could materially adversely affect our ability to generate sufficient cash to fulfill our obligations under the notes, our ability to react to changes in our business and our ability to incur additional indebtedness to fund future needs.
We are highly leveraged. As of May 31, 2011, we had total indebtedness of $6,020.3 million. The following chart shows our level of indebtedness as of May 31, 2011:
| (in millions) | ||||
| European facilities |
$ | 5.6 | ||
| Term loan facilities |
3,464.4 | |||
| Cash flow revolving credit facilities |
— | |||
| Asset-based revolving credit facility |
— | |||
| Senior cash pay notes |
761.0 | |||
| Senior PIK toggle notes |
771.0 | |||
| Senior subordinated notes |
1,015.0 | |||
| Premium on debt |
3.3 | |||
|
|
|
|||
| Total |
$ | 6,020.3 | ||
|
|
|
|||
As of May 31, 2011, we had outstanding approximately $3,464.4 million in aggregate principal amount of indebtedness under our senior secured credit facilities that bears interest at a floating rate. We have entered into a series of interest rate swap agreements to fix the interest rates on approximately 63% of the borrowings under our senior secured credit facilities.
Our substantial level of indebtedness increases the possibility that we may be unable to generate cash sufficient to pay, when due, the principal of, interest on or other amounts due in respect of our indebtedness. Our substantial indebtedness, combined with our other financial obligations and contractual commitments, could have important consequences. For example, it could:
| • | make it more difficult for us to satisfy our obligations with respect to our indebtedness, including the notes, and any failure to comply with the obligations under any of our debt instruments, including restrictive covenants, could result in an event of default under the indentures governing the notes and the agreements governing such other indebtedness; |
| • | require us to dedicate a substantial portion of our cash flow from operations to payments on our indebtedness, thereby reducing funds available for working capital, capital expenditures, acquisitions, research and development and other purposes; |
| • | increase our vulnerability to adverse economic and industry conditions, which could place us at a competitive disadvantage compared to our competitors that have relatively less indebtedness; |
| • | increase the risk we assess with our counterparties which could affect the fair value of our derivative instruments related to our debt facilities noted above; |
| • | limit our flexibility in planning for, or reacting to, changes in our business and the industries in which we operate; |
| • | limit our noteholders’ rights to receive payments under the notes if secured creditors have not been paid; |
| • | limit our ability to borrow additional funds, or to dispose of assets to raise funds, if needed, for working capital, capital expenditures, acquisitions, research and development and other corporate purposes; and |
| • | prevent us from raising the funds necessary to repurchase all notes tendered to us upon the occurrence of certain changes of control, which would constitute a default under the indentures governing the notes. |
38
Table of Contents
Restrictions imposed by the indentures governing the notes, our senior secured credit facilities and our other outstanding indebtedness may limit our ability to operate our business and to finance our future operations or capital needs or to engage in other business activities.
The terms of our senior secured credit facilities and the indentures governing the notes restrict us and our subsidiaries from engaging in specified types of transactions. These covenants restrict our and our restricted subsidiaries’ ability, among other things, to:
| • | incur additional indebtedness; |
| • | pay dividends on our capital stock or redeem, repurchase or retire our capital stock or indebtedness; |
| • | make investments, loans, advances and acquisitions; |
| • | create restrictions on the payment of dividends or other amounts to us from our restricted subsidiaries; |
| • | engage in transactions with our affiliates; |
| • | sell assets, including capital stock of our subsidiaries; |
| • | consolidate or merge; |
| • | create liens; and |
| • | enter into sale and lease-back transactions. |
In addition, although the agreements governing our senior secured credit facilities and the indentures governing the notes do not require us to comply with any financial ratio maintenance covenants, if less than $35.0 million (plus 10% of any increased commitments thereunder) were available under our asset-based revolving credit facility at any time, we would not be permitted to borrow any additional amounts under our asset-based revolving credit facility unless we maintain a certain pro forma ratio of (a) Consolidated Adjusted EBITDA minus Capital Expenditures minus Cash Taxes to (b) Consolidated Fixed Charges (as such terms are defined in our asset-based revolving credit facility). In the event of a default under any of our senior secured credit facilities, the lenders could elect to declare all amounts outstanding under the agreements governing our senior secured credit facilities to be immediately due and payable. If the indebtedness under our senior secured credit facilities or the notes were to be accelerated, our assets may not be sufficient to repay such indebtedness in full. In particular, noteholders will be paid only if we have assets remaining after we pay amounts due on our secured indebtedness, including our senior secured credit facilities.
We, including our subsidiaries, have the ability to incur substantially more indebtedness, including senior secured indebtedness, and our noteholders’ right to receive payments on each series of notes is effectively junior to the right of lenders who have a security interest in our assets to the extent of the value of those assets.
Our obligations under the notes and our guarantors’ obligations under their guarantees of the notes are unsecured, but our obligations under our senior secured credit facilities and each guarantor’s obligations under its guarantee of our senior secured credit facilities are secured by a security interest in substantially all of our domestic tangible and intangible assets, including the stock of substantially all of our wholly-owned U.S. subsidiaries and a portion of the stock of certain of our non-U.S. subsidiaries. If we are declared bankrupt or insolvent, or if we default under our senior secured credit facilities, the lenders could declare all of the funds borrowed thereunder, together with accrued interest, immediately due and payable. If we were unable to repay such indebtedness, the lenders could foreclose on the pledged assets to the exclusion of holders of the notes, even if an event of default exists under the indentures governing the notes at such time. Furthermore, if the lenders foreclose and sell the pledged equity interests in any guarantor under the notes, then that guarantor will be released from its guarantee of the notes automatically and immediately upon such sale. In any such event, because the notes are not secured by any of our assets or the equity interests in the guarantors, it is possible that there would be no assets remaining from which noteholders’ claims could be satisfied or, if any assets remained, they might be insufficient to satisfy noteholders’ claims in full.
39
Table of Contents
Subject to the restrictions in our senior secured credit facilities and the indentures governing the notes, we, including our subsidiaries, may incur significant additional indebtedness. As of May 31, 2011:
| • | we and the guarantors had approximately $377.8 million available for borrowing under our cash flow revolving credit facilities, which, if borrowed, would be senior secured indebtedness; |
| • | we and the guarantors had $335.4 million available for borrowing under our asset-based revolving credit facility, subject to borrowing base limitations, which, if borrowed, would be senior secured indebtedness; |
| • | we and the guarantors have the option to incur additional incremental term loans or increase the cash flow revolving credit facilities commitments under our senior secured credit facilities up to an amount that would cause our Senior Secured Leverage Ratio (as defined in our senior secured credit facilities) to be equal to or less than 4.50 to 1.00, which, if borrowed, would be senior secured indebtedness; |
| • | we and the guarantors have the option to increase the asset-based revolving credit facility commitments under our asset-based revolving credit facility by up to $100.0 million, which, if borrowed, would be senior secured indebtedness; and |
| • | we and the guarantors have $142.8 million available for borrowing under our non-US facilities. |
In addition, under the senior PIK toggle notes, we have the option to elect to pay PIK interest for five years after the closing date for any interest period. In the event we make a PIK interest election in any period in which we are entitled to make such an election, our debt will increase by the amount of such interest.
Although the terms of our senior secured credit facilities and the indentures governing the notes contain restrictions on the incurrence of additional indebtedness, these restrictions are subject to a number of important exceptions, and indebtedness incurred in compliance with these restrictions could be substantial. If we and our restricted subsidiaries incur significant additional indebtedness, the related risks that we face could intensify.
We may not be able to generate sufficient cash to service all of our indebtedness, including the notes, and may be forced to take other actions to satisfy our obligations under our indebtedness, which may not be successful.
Our ability to make scheduled payments on or to refinance our debt obligations depends on our financial condition and operating performance, which is subject to prevailing economic and competitive conditions and to certain financial, business and other factors beyond our control. We may not be able to maintain a level of cash flows from operating activities sufficient to permit us to pay the principal, premium, if any, and interest on our indebtedness, including the notes.
If our cash flows and capital resources are insufficient to fund our debt service obligations, we may be forced to reduce or delay investments and capital expenditures or to sell assets, seek additional capital or restructure or refinance our indebtedness, including the notes. Our ability to restructure or refinance our debt will depend on the condition of the capital markets and our financial condition at such time. Any refinancing of our debt could be at higher interest rates and may require us to comply with more onerous covenants, which could further restrict our business operations. The terms of existing or future debt instruments and the indentures governing the notes may restrict us from adopting some of these alternatives. In addition, any failure to make payments of interest and principal on our outstanding indebtedness on a timely basis would likely result in a reduction of our credit rating, which could harm our ability to incur additional indebtedness. In the absence of such operating results and resources, we could face substantial liquidity problems and might be required to dispose of material assets or operations to meet our debt service and other obligations. Our senior secured credit facilities and the indentures governing the notes restrict our ability to dispose of assets and use the proceeds from the disposition. We may not be able to consummate those dispositions or to obtain the proceeds that we could realize from them and these proceeds may not be adequate to meet any debt service obligations then due. These alternative measures may not be successful and may not permit us to meet our scheduled debt service obligations.
40
Table of Contents
Repayment of our debt, including the notes, is dependent on cash flow generated by our subsidiaries.
Our subsidiaries own a significant portion of our assets and conduct a significant portion of our operations. Accordingly, repayment of our indebtedness, including the notes, is dependent, to a significant extent, on the generation of cash flow by our subsidiaries and their ability to make such cash available to us, by dividend, debt repayment or otherwise. Unless they are guarantors of the notes, our subsidiaries do not have any obligation to pay amounts due on the notes or to make funds available for that purpose. Our subsidiaries may not be able to, or may not be permitted to, make distributions to enable us to make payments in respect of our indebtedness, including the notes. Each subsidiary is a distinct legal entity and, under certain circumstances, legal and contractual restrictions may limit our ability to obtain cash from our subsidiaries. While the indentures governing the notes limit the ability of our subsidiaries to incur consensual restrictions on their ability to pay dividends or make other intercompany payments to us, these limitations are subject to certain qualifications and exceptions. In the event that we do not receive distributions from our subsidiaries, we may be unable to make required principal and interest payments on our indebtedness, including the notes.
Claims of noteholders will be structurally subordinated to claims of creditors of all our non-U.S. subsidiaries and some of our U.S. subsidiaries because they will not guarantee the notes.
The notes are not guaranteed by any of our non-U.S. subsidiaries or any of our less than wholly-owned U.S. subsidiaries. Accordingly, claims of holders of the notes will be structurally subordinated to the claims of creditors of these non-guarantor subsidiaries, including trade creditors. Therefore, all obligations of our non-guarantor subsidiaries will have to be satisfied before any of the assets of such subsidiaries would be available for distribution, upon a liquidation or otherwise, to us or a guarantor of the notes.
For the years ended May 31, 2011, 2010 and 2009, our non-guarantor subsidiaries accounted for $1,015.7 million, or 37% of our consolidated net sales, $987.6 million, or 37% of our consolidated net sales, $915.0 million, or 37% of our consolidated net sales, for such periods, respectively. As of May 31, 2011, our non-guarantor subsidiaries accounted for approximately $3,370.0 million, or 30%, of our consolidated assets. All amounts are presented after giving effect to intercompany eliminations.
The lenders under our senior secured credit facilities will have the discretion to release any guarantors under these facilities in a variety of circumstances, which will cause those guarantors to be released from their guarantees of the notes.
While any obligations under our senior secured credit facilities remain outstanding, any guarantee of the notes may be released without action by, or consent of, any holder of the notes or the trustee under the indentures governing the notes, at the discretion of lenders under our senior secured credit facilities, if the related guarantor is no longer a guarantor of obligations under our senior secured credit facilities or any other indebtedness. The lenders under our senior secured credit facilities will have the discretion to release the guarantees under our senior secured credit facilities in a variety of circumstances. Noteholders will not have a claim as a creditor against any subsidiary that is no longer a guarantor of the notes, and the indebtedness and other liabilities, including trade payables, whether secured or unsecured, of those subsidiaries will effectively be senior to claims of noteholders.
Our noteholders’ right to receive payments on the senior subordinated notes is junior to the rights of the lenders under our senior secured credit facilities and all of our other senior debt (including the senior notes) and any of our future senior indebtedness.
The senior subordinated notes are general unsecured senior subordinated obligations that rank junior in right of payment to all of our existing and future senior indebtedness. As of May 31, 2011, we had:
| • | approximately $4,998.2 million of senior indebtedness outstanding (including $1,533.8 million in aggregate principal amount of the senior notes and $3,464.4 million of borrowings under our senior secured credit facilities); |
41
Table of Contents
| • | an additional approximately $377.8 million of borrowing capacity under our cash flow revolving credit facilities, which, if borrowed, would be senior indebtedness; |
| • | an additional $335.4 million available for borrowing under our asset-based revolving credit facility, subject to borrowing base limitations, which, if borrowed, would be senior indebtedness; |
| • | the option to incur additional incremental term loans or increase the cash flow revolving credit facilities commitments under our senior secured credit facilities of up to an amount that would cause our Senior Secured Leverage Ratio (as defined in our senior secured credit facilities) to be equal to or less than 4.50 to 1.00, which, if borrowed, would be senior indebtedness; |
| • | the option to increase the asset-based revolving credit facility commitments under our asset-based revolving credit facility by up to $100.0 million, which, if borrowed would be senior indebtedness; and |
| • | an additional $142.8 million available for borrowing under our non-U.S. credit facilities, which, if borrowed, would be senior indebtedness. |
In addition, under the senior PIK toggle notes, we will have the option to elect to pay PIK interest for five years after the closing date for any interest period other than the initial interest period. In the event we make a PIK interest election in any period in which we are entitled to make such an election, our debt will increase by the amount of such interest.
We may not pay principal, premium, if any, interest or other amounts on account of the senior subordinated notes in the event of a payment default or certain other defaults in respect of certain of our senior indebtedness, including the senior notes and borrowings under our senior secured credit facilities, unless the senior indebtedness has been paid in full or the default has been cured or waived. In addition, in the event of certain other defaults with respect to certain of our senior indebtedness, we may not be permitted to pay any amount on account of the senior subordinated notes for a designated period of time.
Because of the subordination provisions in the senior subordinated notes, in the event of our bankruptcy, liquidation or dissolution, our assets will not be available to pay obligations under the senior subordinated notes until we have made all payments in cash on our senior indebtedness. Sufficient assets may not remain after all these payments have been made to make any payments on the senior subordinated notes, including payments of principal or interest when due.
If we default on our obligations to pay our other indebtedness, we may not be able to make payments on the notes.
Any default under the agreements governing our indebtedness, including a default under our senior secured credit facilities that is not waived by the required lenders, and the remedies sought by the holders of such indebtedness, could prevent us from paying principal, premium, if any, and interest on the notes and substantially decrease the market value of the notes. If we are unable to generate sufficient cash flow and are otherwise unable to obtain funds necessary to meet required payments of principal, premium, if any, and interest on our indebtedness, or if we otherwise fail to comply with the various covenants, including financial and operating covenants in the instruments governing our indebtedness (including covenants in our senior secured credit facilities and the indentures governing the notes), we could be in default under the terms of the agreements governing such indebtedness, including our senior secured credit facilities and the indentures governing the notes. In the event of such default:
| • | the holders of such indebtedness may be able to cause all of our available cash flow to be used to pay such indebtedness and, in any event, could elect to declare all the funds borrowed thereunder to be due and payable, together with accrued and unpaid interest; |
| • | the lenders under our senior secured credit facilities could elect to terminate their commitments thereunder, cease making further loans and institute foreclosure proceedings against our assets; |
42
Table of Contents
| • | we could be forced into bankruptcy or liquidation; and |
| • | the subordination provisions in the senior subordinated notes may prevent us from paying any obligation with respect to such notes. |
If our operating performance declines, we may in the future need to obtain waivers from the required lenders under our senior secured credit facilities to avoid being in default. If we breach our covenants under our senior secured credit facilities and seek a waiver, we may not be able to obtain a waiver from the required lenders. If this occurs, we would be in default under our senior secured credit facilities, the lenders could exercise their rights, as described above, and we could be forced into bankruptcy or liquidation.
We may not be able to repurchase the notes upon a change of control.
Upon the occurrence of specific kinds of change of control events, we will be required to offer to repurchase all outstanding notes at 101% of their principal amount plus accrued and unpaid interest, if any. The source of funds for any such purchase of the notes will be our available cash or cash generated from our subsidiaries’ operations or other sources, including borrowings, sales of assets or sales of equity. We may not be able to repurchase the notes upon a change of control because we may not have sufficient financial resources to purchase all of the notes that are tendered upon a change of control. Further, we will be contractually restricted under the terms of our senior secured credit facilities from repurchasing all of the notes tendered by holders upon a change of control. Accordingly, we may not be able to satisfy our obligations to purchase the notes unless we are able to refinance or obtain waivers under our senior secured credit facilities. Our failure to repurchase the notes upon a change of control would cause a default under the indentures governing the notes and a cross default under our senior secured credit facilities. Our senior secured credit facilities also provide that a change of control will be a default that permits lenders to accelerate the maturity of borrowings thereunder. Any of our future debt agreements may contain similar provisions.
The trading prices for the notes will be directly affected by many factors, including our credit rating.
Credit rating agencies continually revise their ratings for companies they follow. The condition of the financial and credit markets and prevailing interest rates have fluctuated in the past and are likely to fluctuate in the future. Any such fluctuation may impact the trading price of the notes. In addition, developments in our business and operations could lead to a ratings downgrade which could adversely affect the trading price of the notes, or the trading market for the notes.
Federal and state fraudulent transfer laws may permit a court to void the notes and the guarantees, subordinate claims in respect of the notes and the guarantees and require noteholders to return payments received. If this occurs, noteholders may not receive any payments on the notes.
Federal and state fraudulent transfer and conveyance statutes may apply to the issuance of the notes and the incurrence of any guarantees. Under federal bankruptcy law and comparable provisions of state fraudulent transfer or conveyance laws, which may vary from state to state, the notes or guarantees could be voided as a fraudulent transfer or conveyance if (1) we or any of the guarantors, as applicable, issued the notes or incurred the guarantees with the intent of hindering, delaying or defrauding creditors or (2) we or any of the guarantors, as applicable, received less than reasonably equivalent value or fair consideration in return for either issuing the notes or incurring the guarantees and, in the case of (2) only, one of the following is also true at the time thereof:
| • | we or any of the guarantors, as applicable, were insolvent or rendered insolvent by reason of the issuance of the notes or the incurrence of the guarantees; |
| • | the issuance of the notes or the incurrence of the guarantees left us or any of the guarantors, as applicable, with an unreasonably small amount of capital to carry on the business; |
| • | we or any of the guarantors intended to, or believed that we or such guarantor would, incur debts beyond our or such guarantor’s ability to pay such debts as they mature; or |
43
Table of Contents
| • | we or any of the guarantors was a defendant in an action for money damages, or had a judgment for money damages docketed against us or such guarantor if, in either case, after final judgment, the judgment is unsatisfied. |
A court would likely find that we or a guarantor did not receive reasonably equivalent value or fair consideration for the notes or such guarantee if we or such guarantor did not substantially benefit directly or indirectly from the issuance of the notes or the applicable guarantee. As a general matter, value is given for a transfer or an obligation if, in exchange for the transfer or obligation, property is transferred or an antecedent debt is secured or satisfied. A debtor will generally not be considered to have received value in connection with a debt offering if the debtor uses the proceeds of that offering to make a dividend payment or otherwise retire or redeem equity securities issued by the debtor.
We cannot be certain as to the standards a court would use to determine whether or not we or the guarantors were solvent at the relevant time or, regardless of the standard that a court uses, that the issuance of the guarantees would not be further subordinated to our or any of our guarantors’ other debt. Generally, however, an entity would be considered insolvent if, at the time it incurred indebtedness:
| • | the sum of its debts, including contingent liabilities, was greater than the fair saleable value of all its assets; |
| • | the present fair saleable value of its assets was less than the amount that would be required to pay its probable liability on its existing debts, including contingent liabilities, as they become absolute and mature; or |
| • | it could not pay its debts as they become due. |
If a court were to find that the issuance of the notes or the incurrence of the guarantee was a fraudulent transfer or conveyance, the court could void the payment obligations under the notes or such guarantee or further subordinate the notes or such guarantee to presently existing and future indebtedness of ours or of the related guarantor, or require the holders of the notes to repay any amounts received with respect to such guarantee. In the event of a finding that a fraudulent transfer or conveyance occurred, noteholders may not receive any repayment on the notes. Further, the voidance of the notes could result in an event of default with respect to our and our subsidiaries’ other debt that could result in acceleration of such debt.
Although each guarantee entered into by a guarantor will contain a provision intended to limit that guarantor’s liability to the maximum amount that it could incur without causing the incurrence of obligations under its guarantee to be a fraudulent transfer, this provision may not be effective to protect those guarantees from being voided under fraudulent transfer law, or may reduce that guarantor’s obligation to an amount that effectively makes its guarantee worthless.
We are indirectly owned and controlled by the Sponsors, and the Sponsors’ interests as equity holders may conflict with the interests of noteholders as creditors.
We are a subsidiary of Parent and the Sponsors have the ability to control our policies and operations. The interests of the Sponsors may not in all cases be aligned with our noteholders’ interests. For example, if we encounter financial difficulties or are unable to pay our debts as they mature, the interests of our equity holders might conflict with our noteholders’ interests. In addition, our equity holders may have an interest in pursuing acquisitions, divestitures, financings or other transactions that, in their judgment, could enhance their equity investments, even though such transactions might involve risks to holders of the notes. Furthermore, the Sponsors may in the future own businesses that directly or indirectly compete with us. The Sponsors also may pursue acquisition opportunities that may be complementary to our business, and as a result, those acquisition opportunities may not be available to us. For information concerning our arrangements with the Sponsors following the Transactions, see “Certain Relationships and Related Party Transactions.”
44
Table of Contents
Our noteholders will be required to pay U.S. federal income tax on the senior PIK toggle notes even if we do not pay cash interest.
None of the interest payments on the senior PIK toggle notes will be qualified stated interest for U.S. federal income tax purposes, even if we never exercise the option to pay PIK interest, because the senior PIK toggle notes provide us with the option to pay cash interest or PIK interest for any interest payment period after the initial interest payment and prior to October 15, 2012. Consequently, the senior PIK toggle notes will be treated as issued with original issue discount for U.S. federal income tax purposes, and U.S. holders will be required to include the original issue discount in gross income on a constant yield to maturity basis, regardless of whether interest is paid currently in cash. See “Certain Material United States Federal Income Tax Considerations.”
| Item 1B. | Unresolved Staff Comments. |
Not applicable.
45
Table of Contents
| Item 2. | Properties. |
Our Facilities
Our principal executive offices are at 56 East Bell Drive, Warsaw, Indiana. In addition, we maintain more than 50 other manufacturing facilities, offices and warehouse facilities in various countries, including Canada and numerous countries within Europe, Asia Pacific and Latin America. We believe that all of our facilities are adequate, well maintained and suitable for the development, manufacture, distribution and marketing of all our products. The following is a list of our principal properties as of May 31, 2011:
| FACILITY |
LOCATION |
SQUARE FEET |
OWNED/ LEASED | |||||
| Corporate headquarters of Biomet, Inc.; manufacturing, storage and research and development facilities of Biomet Manufacturing Corp.; manufacturing & storage facilities of Microfixation, LLC; distribution center and offices of Biomet Orthopedics, LLC; distribution center and offices of Biomet Sports Medicine, LLC; distribution center and offices of Biomet Biologics, LLC and distribution center of EBI, LLC |
(1) Warsaw, Indiana (2) Warsaw, Indiana (3) Milford, Indiana |
|
541,699 13,300 54,880 |
|
Owned Leased Leased | |||
| Administrative, manufacturing and distribution facility of EBI, LLC and administrative offices of Electro-Biology, LLC |
(1) Parsippany, New Jersey (2) Parsippany, New Jersey (a) |
|
22,035 213,750 |
|
Leased Owned | |||
| Administrative, manufacturing and distribution facility of Biomet Microfixation, LLC |
Jacksonville, Florida | 82,500 | Owned | |||||
| Office, manufacturing and distribution facility of Biomet 3i, LLC |
(1) Palm Beach Gardens, Florida (2) Palm Beach Gardens, Florida (b) |
|
117,000 69,000 |
|
Owned Owned | |||
| Office, manufacturing and distribution facility of Citra Labs, LLC |
Braintree, Massachusetts | 32,150 | Leased | |||||
| Manufacturing facility of Biomet Fair Lawn, LLC |
Fair Lawn, New Jersey | 40,000 | Owned | |||||
| Office and manufacturing facility of Electro-Biology, LLC |
Guaynabo, Puerto Rico | 34,700 | Owned | |||||
| Office, manufacturing and distribution facilities of Interpore Spine Ltd. |
(1) Irvine, California (2) Irvine, California |
|
36,800 2,700 |
|
Leased Leased | |||
| Office and warehouse facilities of Biomet Europe B.V. |
Hazeldonk, The Netherlands | 131,320 | Leased | |||||
| Office, manufacturing and warehouse facility of Biomet France Sarl |
Valence, France | 86,100 | Owned | |||||
| Office, manufacturing and warehouse facilities of Biomet Deutschland GmbH |
Berlin, Germany | 49,900 | Owned | |||||
| Administrative offices of Biomet Europe B.V. and office and warehouse facility of Biomet Nederland B.V. and Biomet Microfixation Europe B.V. |
Dordrecht, The Netherlands | 37,700 | Owned | |||||
| Office and manufacturing facility of Biomet Spain Orthopedics S.L. |
Valencia, Spain | 69,600 | Owned | |||||
| Manufacturing and administrative facilities of Biomet UK Ltd. |
(1) Bridgend, South Wales (2) Swindon, England |
|
111,956 54,800 |
|
Owned Owned | |||
| Manufacturing, administrative and warehouse facilities of Zhejiang Biomet |
Jinhua, China | 110,000 | Owned | |||||
| Manufacturing, administrative and warehouse facilities of Changzhou Biomet |
Changzhou, China | 82,000 | Owned | |||||
| Administrative office facilities for China operations |
Shanghai, China | 4,500 | Leased | |||||
| (a) | Currently held as available for sale |
| (b) | Includes 23,000 square feet of space in this facility that is leased to other parties. |
46
Table of Contents
Our properties in Warsaw, Indiana; Parsippany, New Jersey and Palm Beach Gardens, Florida secure our obligations under our senior secured cash flow facilities. We believe our headquarters, manufacturing and other facilities are suitable for their respective uses and are, in all material respects, adequate for our present needs. Our properties are subject to various federal, state, foreign and local laws and regulations regulating their operation. We do not believe that compliance with such laws and regulations will materially affect our financial position or results of operations.
| Item 3. | Legal Proceedings. |
Information with respect to legal proceedings can be found in Note 16, Contingencies, to the condensed consolidated financial statements contained in Part II, Item 8 of this report and is hereby incorporated by reference herein.
| Item 4. | Reserved. |
47
Table of Contents
| Item 5. | Market for Registrant’s Common Equity, Related Stockholder Matters, and Issuer Purchases of Equity Securities. |
Market and other information
We are a privately-owned company with no established public trading market for our common stock.
On May 6, 2008, we filed a registration statement on Form S-1, which was declared effective on May 21, 2008, with respect to an indeterminate amount of our senior cash pay notes, senior toggle notes, and senior subordinated notes. On May 20, 2009, September 16, 2009 and October 27, 2010, we filed post-effective amendments to our registration statement on Form S-1, which were declared effective on May 28, 2009, September 21, 2009 and November 9, 2010, respectively. The prospectus included in the registration statement had been prepared for Goldman, Sachs & Co. and any affiliates of Goldman, Sachs & Co. in connection with offers and sales of the notes related to market-making transactions in the notes effected from time to time, beginning May 21, 2008. We have not and will not receive any proceeds from such sales. Goldman, Sachs & Co. or its affiliates may act as principal or agent in such transactions, including as agent for the counterparty when acting as principal or as agent for both counterparties, and may receive compensation in the form of discounts and commissions, including from both counterparties, when it acts as agents for both. Such sales will be made at prevailing market prices at the time of sale, at price related thereto or at negotiated prices.
Holders
As of May 31, 2011, there was one holder of our common stock, LVB Acquisition, Inc., and 515 holders of LVB Acquisition, Inc.’s common stock on a fully diluted basis. See Item 12, “Security Ownership of Certain Beneficial Owners and Management and Related Stockholder Matters” for additional information about the ownership of LVB Acquisition, Inc.’s common stock.
Dividends
We are currently restricted in our ability to pay dividends under various covenants of our debt agreements, including our credit facilities and the indentures governing our notes. We do not expect for the foreseeable future to pay dividends on our common stock. Any future determination to pay dividends will depend upon, among other factors, our results of operations, financial condition, cash flows, capital requirements, any contractual restrictions and any other considerations our Board of Directors deems relevant.
Securities authorized for issuance under equity compensation plans
As of May 31, 2011
| Plan category |
Number of securities to be issued upon exercise of outstanding options, warrants and rights |
Weighted- average exercise price of outstanding options, warrants and rights |
Number of securities remaining available for future issuance under equity compensation plans (excluding securities reflected in first column) |
|||||||||
| Equity compensation plans approved by security holders |
36,203,625 | $ | 10.00 | 2,380,375 | ||||||||
| Equity compensation plans not approved by security holders |
— | — | — | |||||||||
|
|
|
|
|
|
|
|||||||
| Total |
36,203,625 | $ | 10.00 | 2,380,375 | ||||||||
See Item 12, “Security Ownership of Certain Beneficial Owners and Management and Related Stockholder Matters” for a description of our authorized shares under our management equity plans.
48
Table of Contents
| Item 6. | Selected Financial Data. |
The Transactions
On December 18, 2006, we entered into the Merger Agreement with Parent and Purchaser. Pursuant to the Merger Agreement, on June 13, 2007, Purchaser commenced the Offer to purchase all of our outstanding Shares, without par value, at the Offer Price without interest and less any required withholding taxes. The Offer was made pursuant to Purchaser’s offer to purchase dated June 13, 2007 and the related letter of transmittal. The Offer expired on July 11, 2007, with approximately 82% of the outstanding Shares having been tendered to Purchaser. At a special meeting of shareholders held on September 5, 2007, more than 91% of our shareholders voted to approve the Merger, and Parent acquired us on September 25, 2007 through a reverse subsidiary merger with Biomet, Inc. being the surviving company. Subsequent to the acquisition, we became a subsidiary of our Parent, which is controlled by Holding, an entity controlled by the Sponsors and their Co-Investors. Parent’s sole asset is 100% of our capital stock. Accordingly, a separate discussion of Parent’s financial condition and results of operations is not provided since we are representative of Parent’s consolidated operations.
The Offer for Biomet’s Shares was completed successfully on July 11, 2007. Although Biomet continues as the same legal entity after the Merger, Parent’s cost of acquiring Biomet was used to establish a new accounting basis for Biomet. Accordingly, the financial information in the tables and discussion below for the year ended May 31, 2008 is presented separately for the period prior to the completion of the Offer (the fiscal year ended May 31, 2007 and June 1, 2007 through July 11, 2007, the “Predecessor Period”) and the period after the completion of the Offer (July 12, 2007 through May 31, 2008 and the fiscal years ended May 31, 2011, 2010 and 2009, or the “Successor Period”). In connection with the Transactions, we incurred significant indebtedness and became highly leveraged; see “Liquidity and Capital Resources.” In addition, the purchase price paid in connection with the acquisition was allocated to state the acquired assets and liabilities at fair value. We allocated the purchase price to the fair value of the assets and liabilities of Biomet based on estimated fair values utilizing generally accepted valuation methodologies. Both assets and liabilities were valued as of July 11, 2007. As noted in the purchase price allocation, in-process research and development projects were acquired. The most significant projects acquired occurred in the hip, knee and spine divisions. We expect to use these products to leverage and build on those products that have been in the market for a number of years. The purchase accounting adjustments increased the carrying value of our property and equipment, inventory and established intangible assets for the Successor Period (such as corporate and product trade names, core and completed technology and customer relationships), among other things. Subsequent to the Transactions, interest expense and non-cash depreciation and amortization charges have significantly increased. As a result, our financial statements for the Successor Period are not comparable to our financial statements for the Predecessor Period.
The purchase price allocation was based on information currently available to us, and expectations, assumptions and valuation methodologies deemed reasonable by our management. No assurance can be given, however, that the underlying assumptions used to estimate expected technology-based product revenues, development costs or profitability, or the events associated with such technology, will occur as projected. Certain other fair value estimates related to intellectual property and other matters, investments, and inventory and instruments associated with brands we are considering to discontinue were also performed.
49
Table of Contents
Statement of Operations Data
Fiscal Years Ended 2011, 2010 and 2009, Periods July 12, 2007 to May 31, 2008 and June 1, 2007 to July 11, 2007, and Fiscal Year Ended 2007
| (in millions) |
2011 (Successor) |
2010 (Successor) |
2009 (Successor) |
July 12, 2007 to May 31, 2008 (Successor) (2) |
June 1, 2007 to July 11, 2007 (Predecessor) (2) |
2007 (Predecessor) |
||||||||||||||||||||
| Net sales |
$ | 2,732.2 | $ | 2,698.0 | $ | 2,504.1 | $ | 2,134.5 | $ | 248.8 | $ | 2,107.4 | ||||||||||||||
| Cost of sales |
838.7 | 819.9 | 828.4 | 814.7 | 102.3 | 642.3 | ||||||||||||||||||||
|
|
|
|
|
|
|
|
|
|
|
|
|
|||||||||||||||
| Gross profit |
1,893.5 | 1,878.1 | 1,675.7 | 1,319.8 | 146.5 | 1,465.1 | ||||||||||||||||||||
| Selling, general and administrative expense |
1,041.7 | 1,042.3 | 1,003.6 | 1,097.6 | 194.2 | 881.1 | ||||||||||||||||||||
| Research and development expense |
119.4 | 106.6 | 93.5 | 82.2 | 34.0 | 85.6 | ||||||||||||||||||||
| In-process research and development |
— | — | — | 479.0 | — | — | ||||||||||||||||||||
| Amortization (1) |
367.9 | 372.6 | 375.8 | 329.3 | 0.5 | 8.8 | ||||||||||||||||||||
| Goodwill and intangible assets impairment charge |
941.4 | — | 551.1 | — | — | — | ||||||||||||||||||||
|
|
|
|
|
|
|
|
|
|
|
|
|
|||||||||||||||
| Operating income (loss) |
(576.9 | ) | 356.6 | (348.3 | ) | (668.3 | ) | (82.2 | ) | 489.6 | ||||||||||||||||
| Interest expense |
498.9 | 516.4 | 550.3 | 516.3 | 0.3 | 9.3 | ||||||||||||||||||||
| Other (income) expense |
(11.2 | ) | (18.1 | ) | 21.8 | 9.7 | (0.6 | ) | (21.3 | ) | ||||||||||||||||
|
|
|
|
|
|
|
|
|
|
|
|
|
|||||||||||||||
| Income (loss) before taxes |
(1,064.6 | ) | (141.7 | ) | (920.4 | ) | (1,194.3 | ) | (81.9 | ) | 501.6 | |||||||||||||||
| Provision on (benefit) for income taxes |
(214.8 | ) | (94.1 | ) | (171.2 | ) | (230.1 | ) | (27.3 | ) | 165.7 | |||||||||||||||
|
|
|
|
|
|
|
|
|
|
|
|
|
|||||||||||||||
| Net income (loss) |
$ | (849.8 | ) | $ | (47.6 | ) | $ | (749.2 | ) | $ | (964.2 | ) | $ | (54.6 | ) | $ | 335.9 | |||||||||
|
|
|
|
|
|
|
|
|
|
|
|
|
|||||||||||||||
| (1) | Amortization expense was classified within research and development prior to June 1, 2007; therefore, the prior years have been reclassified to conform to the presentation for the periods after June 1, 2007. |
| (2) | The Successor and Predecessor periods together are not comparable to the preceding Predecessor period presented above due to a new basis of accounting on July 12, 2007. |
Balance Sheet Data At May 31,
| (Successor) | (Predecessor) | |||||||||||||||||||||
| (in millions) |
2011 | 2010 | 2009 | 2008 | 2007 | |||||||||||||||||
| Current assets less current liabilities |
$ | 1,079.0 | $ | 786.5 | $ | 756.9 | $ | 785.2 | $ | 1,105.9 | ||||||||||||
| Total assets |
11,357.0 | 11,969.0 | 12,600.9 | 13,781.8 | 2,457.9 | |||||||||||||||||
| Total debt |
6,020.3 | 5,896.5 | 6,212.7 | 6,300.8 | 81.8 | |||||||||||||||||
| Shareholder’s equity |
3,175.1 | 3,733.5 | 3,840.3 | 4,836.3 | 2,049.2 | |||||||||||||||||
50
Table of Contents
| Item 7. | Management’s Discussion and Analysis of Financial Condition and Results of Operations. |
The following discussion and analysis of our financial condition and results of operations contains forward-looking statements, which are subject to numerous risks and uncertainties, including, but not limited to, those described in “Risk Factors” and “Forward-Looking Statements” of this annual report. Actual results may differ materially from those contained in any forward-looking statements.
Executive Overview
Our net sales increased 1% for the year ended May 31, 2011 to $2,732.2 million, compared to $2,698.0 million for the year ended May 31, 2010. The effect of foreign currency fluctuations negatively impacted reported net sales for fiscal 2011 by $0.5 million, with Europe reported net sales negatively impacted by $21.9 million, or 3%, and International reported net sales positively impacted by $21.4 million, or 7%. Global pricing was slightly negative with volume being favorable. The following represents key sales growth statistics for the year ended May 31, 2011 compared to the year ended May 31, 2010:
| • | Reconstructive product sales increased 2% worldwide and in the U.S. |
| • | Knee sales increased 1% worldwide and were flat in the U.S. |
| • | Hip sales increased 1% worldwide and in the U.S. |
| • | Extremity sales increased 20% worldwide and 30% in the U.S. |
| • | Dental sales increased 2% worldwide and 3% in the U.S. |
| • | Fixation product sales decreased 4% worldwide and decreased 3% in the U.S. |
| • | Spinal product sales decreased 3% worldwide and in the U.S. |
Our operating loss for the year ended May 31, 2011 was $576.9 million, compared to an operating income of $356.6 million for the year ended May 31, 2010. The decrease was primarily due to a goodwill and intangible assets impairment charge of $941.4 million in fiscal 2011, due to the continued financial and credit challenges in some European countries, which also continue to impact our sales growth.
Our interest expense for the year ended May 31, 2011 was $498.9 million, compared to $516.4 million for the year ended May 31, 2010, primarily due to a lower average interest rate on our outstanding floating rate debt.
Net cash provided by operating activities was $380.1 million for the year ended May 31, 2011, as compared to net cash provided of $321.5 million for the year ended May 31, 2010. The increase is primarily due to an increase in cash provided by working capital of $2.1 million as of May 31, 2011, as compared to cash used in working capital of $89.2 million as of May 31, 2010. The increase is partially offset by an increase in the net loss, excluding the impairment charge of $941.4, of $91.6 as of May 31, 2011, as compared to $47.6 as of May 31, 2010.
Our Business
We design, manufacture and market a comprehensive range of both surgical and non-surgical products used primarily by orthopedic surgeons and other musculoskeletal medical specialists. We operate in one reportable business segment, musculoskeletal products, which includes the design, manufacture and marketing of products in four major product categories: reconstructive products, fixation devices, spinal products and other products. We have three reportable geographic markets: United States, Europe and International. Our product categories include:
| • | Reconstructive products, which represented 76% of our net sales for fiscal 2011, 76% of our net sales for fiscal 2010 and 75% of our net sales for fiscal 2009, include knee, hip and extremity joint replacement systems, as well as dental reconstructive implants, bone cements and accessories, cement delivery systems, and autologous therapies. |
| • | Fixation devices, which represented 9% of our net sales for fiscal 2011, 2010 and 2009, include internal and external fixation devices, craniomaxillofacial fixation systems, bone substitute materials, and electrical stimulation devices that do not address the spine. |
51
Table of Contents
| • | Spinal products, which represented 8% of our net sales for fiscal 2011and 2010 and 9% of our net sales for fiscal 2009, include spinal fixation systems for cervical, thoracolumbar, deformity correction and spacer applications, electrical stimulation devices and allograft services for spinal applications, bone substitute materials, and orthobiologics for the spine. |
| • | The other product sales category, which represented 7% of our net sales for fiscal 2011, 2010 and 2009, includes sports medicine products, softgoods and bracing products, casting materials, general surgical instruments, operating room supplies, wound care products and other surgical products. |
Depending on the intended application, we report sales of bone substitute materials in the reconstructive product, fixation device or spinal product category.
We have operations in over 50 locations, distribute our products in approximately 90 countries throughout the world and manage our operations through three reportable geographic markets mentioned above. We are the fourth largest competitor in the U.S. orthopedic reconstructive market and have maintained this position for over ten years. We supply products to over 60% of U.S. hospitals performing joint replacement surgery. In addition, we are the third largest manufacturer and marketer of dental reconstructive devices worldwide and maintain leadership positions in the electrical stimulation and craniomaxillofacial fields. We have a long history of innovation, engineering quality and successful new product launches.
Opportunities and Challenges
Our results of operations could be substantially affected not only by global economic conditions, but also by local operating and economic conditions, which can vary substantially by market. Unfavorable conditions can depress sales in a given market and may result in actions that adversely affect our margins, constrain our operating flexibility or result in charges which are unusual or non-recurring. Certain macroeconomic events, such as the current adverse conditions in the global economy, could have a more wide-ranging and prolonged impact on the general business environment, which could also adversely affect us.
We believe the global uncertainty or recessionary environment has impacted the year-over-year market growth rates of the orthopedic reconstructive device industry from the historical rates in the high single digits to current market growth rates in the flat-to-low single digits. Because of this, management has implemented cost savings initiatives to be able to manage expenses more conservatively.
In the United States, healthcare providers that purchase our products (e.g., hospitals, physicians, dentists and other health care providers) generally rely on payments from third-party payors (principally federal Medicare, state Medicaid and private health insurance plans) to cover all or a portion of the cost of our musculoskeletal products. In March 2010, comprehensive health care reform legislation was enacted through the Patient Protection and Affordable Health Care Act (H.R. 3590) and the Health Care and Education Reconciliation Act (H.R. 4872). Among other initiatives, these bills impose a 2.3% excise tax on domestic sales of medical devices following December 31, 2012, which is estimated to contribute approximately $27 billion to healthcare reform. Various healthcare reform proposals have also emerged at the state level. Outside of the excise tax, which will impact results of operations following December 31, 2012, we cannot predict with certainty what healthcare initiatives, if any, will be implemented at the state level, or what the ultimate effect of federal health care reform or any future legislation or regulation will have on us. However, an expansion in government’s role in the U.S. healthcare industry may lower reimbursements for our products, reduce medical procedure volumes and adversely affect our business and results of operations, possibly materially.
Outside the United States, reimbursement systems vary significantly from country to country. If adequate levels of reimbursement from third-party payors outside the United States are not obtained, international sales of our products may decline. Many foreign markets, including Canada and some European and Asian countries, have decreased reimbursement rates. Our ability to continue to sell certain products profitably in these markets may diminish if the government-managed healthcare systems continue to reduce reimbursement rates, which can decrease pricing and procedural volume.
52
Table of Contents
European Sovereign Debt Crisis
We continue to monitor economic conditions, including the volatility associated with international sovereign economies, and associated impacts on the financial markets and our business, especially in light of the global economic downturn and European sovereign debt crisis. We believe the credit and economic conditions within Greece, Ireland, Italy, Portugal, Spain and Turkey, among other members of the European Union, have continued to deteriorate. These conditions have resulted in, and may continue to result in, an increase in the average length of time that it takes to collect on our accounts receivable outstanding in these countries.
As of May 31, 2011, our orthopedic net accounts receivable in these countries totaled over $70.0 million. To date, we have not experienced any significant cash losses in the current fiscal year with respect to the collection of our accounts receivable related to sales within these countries.
We received $45.5 million face value zero coupon bonds from the Greek government as payment for the outstanding accounts receivable balance from 2007-2009 related to certain government sponsored institutions in a non-cash transaction. Upon receipt, the bonds had a fair value of $33.8 million, with maturity dates of one to three years. The bonds are designated as available-for-sale securities. The one year bonds are due to mature in December 2011 and we are unable to predict if the Greek government will be able to settle its obligations upon maturity or otherwise.
Seasonality
Our business is somewhat seasonal in nature, as many of our products are used in elective procedures, which typically decline during the summer months, particularly in European countries, and the winter holiday season.
Impact of Inflation
We attempt to minimize the annual effects of inflation through appropriate planning, operating practices, and product pricing. Inflation during fiscal 2011 and 2010 was not material to our results of operations. Although we experienced higher than normal inflationary costs during fiscal 2009, we do not believe the impact was material to the consolidated financial statements.
Results of Operations
For the Year Ended May 31, 2011 Compared to the Year Ended May 31, 2010
| (in millions, except percentages) | Year Ended May 31, 2011 |
Percentage of Net Sales |
Year Ended May 31, 2010 |
Percentage of Net Sales |
Percentage Increase/ (Decrease) |
|||||||||||||||
| Net sales |
$ | 2,732.2 | 100 | % | $ | 2,698.0 | 100 | % | 1 | % | ||||||||||
| Cost of sales |
838.7 | 31 | 819.9 | 30 | 2 | |||||||||||||||
|
|
|
|
|
|
|
|
|
|
|
|||||||||||
| Gross profit |
1,893.5 | 69 | 1,878.1 | 70 | 1 | |||||||||||||||
| Selling, general and administrative expense |
1,041.7 | 38 | 1,042.3 | 39 | — | |||||||||||||||
| Research and development expense |
119.4 | 4 | 106.6 | 4 | 12 | |||||||||||||||
| Amortization |
367.9 | 13 | 372.6 | 14 | (1 | ) | ||||||||||||||
| Goodwill & intangible assets impairment charge |
941.4 | 34 | — | — | N/A | |||||||||||||||
|
|
|
|
|
|
|
|
|
|
|
|||||||||||
| Operating income (loss) |
(576.9 | ) | (21 | ) | 356.6 | 13 | N/A | |||||||||||||
| Interest expense |
498.9 | 18 | 516.4 | 19 | (3 | ) | ||||||||||||||
| Other (income) expense |
(11.2 | ) | — | (18.1 | ) | (1 | ) | (38 | ) | |||||||||||
|
|
|
|
|
|
|
|
|
|
|
|||||||||||
| Other expense, net |
487.7 | 18 | 498.3 | 18 | (2 | ) | ||||||||||||||
|
|
|
|
|
|
|
|
|
|
|
|||||||||||
| Loss before income taxes |
(1,064.6 | ) | (39 | ) | (141.7 | ) | (5 | ) | N/A | |||||||||||
| Benefit from income taxes |
(214.8 | ) | (8 | ) | (94.1 | ) | (3 | ) | N/A | |||||||||||
|
|
|
|
|
|
|
|
|
|
|
|||||||||||
| Net loss |
$ | (849.8 | ) | (31 | )% | $ | (47.6 | ) | (2 | )% | N/A | |||||||||
|
|
|
|
|
|
|
|
|
|
|
|||||||||||
53
Table of Contents
Sales
Net sales were $2,732.2 million for the year ended May 31, 2011, and $2,698.0 million for the year ended May 31, 2010. The following tables provide net sales by geography and product category:
Geography Sales Summary
| (in millions, except percentages) | Year Ended May 31, 2011 |
Percentage of Net Sales |
Year Ended May 31, 2010 (1) |
Percentage of Net Sales |
Percentage Increase/ (Decrease) |
|||||||||||||||
| United States |
$ | 1,660.0 | 61 | % | $ | 1,644.1 | 61 | % | 1 | % | ||||||||||
| Europe |
697.8 | 26 | 724.5 | 27 | (4 | ) | ||||||||||||||
| International (2) |
374.4 | 13 | 329.4 | 12 | 14 | |||||||||||||||
|
|
|
|
|
|
|
|
|
|
|
|||||||||||
| Total |
$ | 2,732.2 | 100 | % | $ | 2,698.0 | 100 | % | 1 | % | ||||||||||
|
|
|
|
|
|
|
|
|
|
|
|||||||||||
| (1) | Certain amounts have been adjusted to conform to the current presentation. Specifically, International net sales increased, and Europe net sales decreased, $4.3 million for the year ended May 31, 2010. The current presentation aligns with how the Company presently manages and markets its products. |
| (2) | International primarily includes Canada, South America, Mexico and the Asia Pacific. |
Product Category Summary
| (in millions, except percentages) | Year Ended May 31, 2011 |
Percentage of Net Sales |
Year Ended May 31, 2010 (1) |
Percentage of Net Sales |
Percentage Increase/ (Decrease) |
|||||||||||||||
| Reconstructive |
$ | 2,084.2 | 76 | % | $ | 2,046.4 | 76 | % | 2 | % | ||||||||||
| Fixation |
232.9 | 9 | 242.0 | 9 | (4 | ) | ||||||||||||||
| Spinal |
224.9 | 8 | 232.0 | 8 | (3 | ) | ||||||||||||||
| Other |
190.2 | 7 | 177.6 | 7 | 7 | |||||||||||||||
|
|
|
|
|
|
|
|
|
|
|
|||||||||||
| Total |
$ | 2,732.2 | 100 | % | $ | 2,698.0 | 100 | % | 1 | % | ||||||||||
|
|
|
|
|
|
|
|
|
|
|
|||||||||||
| (1) | Certain amounts have been adjusted to conform to the current presentation. Specifically, reconstructive product net sales increased, and other product net sales decreased, $21.9 million for the year ended May 31, 2010. Fixation product net sales increased, and spinal product net sales decreased, $4.2 million for the year ended May 31, 2010. The current presentation aligns with how the Company presently manages and markets its products. |
Reconstructive
Our worldwide sales of reconstructive products continued to be a significant percentage of total net sales. Net sales of reconstructive products for the year ended May 31, 2011 was $2,084.2 million, or 76% of net sales, representing a 2% increase compared to net sales of $2,046.4 million, or 76% of net sales, during the year ended May 31, 2010. The effect of foreign currency fluctuations positively impacted our reconstructive growth on a reported basis by $0.9 million.
Our growth rates for global knee and hip product sales were in the low single digits during the year ended May 31, 2011, compared to high single to low double-digit growth rates in prior periods. Certain events, such as the current adverse conditions in the global economy, including high unemployment rates, employed patients’ concerns about taking medical leave during the slow economy, increased deductibles and co-pays and the expiration of COBRA subsidies may have contributed to the declining growth rates. In addition, the litigious environment in the industry surrounding metal-on-metal hips, as well as our inability to market our Signature™ Personalized Patient Care System to new customers for most of the first three quarters of fiscal 2011, also impacted growth rates. In July 2010, we received a Warning Letter from the FDA regarding the Signature™ Personalized Patient Care system, alleging that we did not have appropriate clearance or approval to market the
54
Table of Contents
system in the United States. In September 2010, we met with the FDA and we agreed on a course of corrective action and an additional 510(k) application for our Signature™ Personalized Patient Care System was submitted to the FDA in September 2010. During the FDA’s review of the 510(k), we ceased all promotional activities regarding the system as well as sales to new customers in the United States. The FDA granted the 510(k) clearance in a letter sent to Materialise NV, the manufacturer of the Signature™ system, on February 8, 2011, which resolved the warning letter sent to Biomet in July 2010.
Global knee product sales increased 1% worldwide and were flat in the United States during the year ended May 31, 2011, compared to the year ended May 31, 2010. The primary contributors of net sales included the Vanguard® Complete Knee System with E1® antioxidant infused tibial bearings.
Global hip product sales increased 1% worldwide and in the United States during the year ended May 31, 2011, compared to the year ended May 31, 2010. The primary contributors of net sales included the Ringloc® and Regenerex® RingLoc®+ Acetabular Systems, E1® Antioxidant Infused Technology Bearings, the Taperloc® Microplasty® Hip System and the Echo® Hip System, as well as the Arcos® Modular Femoral Revision System.
Global extremity product sales increased 20% worldwide, with a 30% sales increase in the United States, during the year ended May 31, 2011, compared to the year ended May 31, 2010. The Comprehensive® Primary Reverse and Fracture Shoulder Systems continued to drive strong growth for the extremity product category.
Dental sales increased 2% worldwide and increased 3% in the United States during the year ended May 31, 2011, compared to the year ended May 31, 2010. The OSSEOTITE® product line, our flagship dental reconstructive implant system, was a key contributor to our fiscal year dental sales.
Fixation
Worldwide net sales of fixation products for the year ended May 31, 2011 were $232.9 million, or 9% of net sales, representing a 4% decrease compared to net sales of $242.0 million, or 9% of net sales, during the year ended May 31, 2010. The decrease was primarily due to a decline in pricing, which was partially offset by an increase in volume, with virtually no impact from fluctuations in foreign currency. The primary contributors of worldwide fixation net sales in the fiscal year were craniomaxillofacial fixation devices, principally our titanium plating systems.
Spinal
Worldwide net sales of spinal products for the year ended May 31, 2011 were $224.9 million, or 8% of net sales, representing a 3% decrease compared to net sales of $232.0 million, or 8% of net sales, for the year ended May 31, 2010. We believe the spine market continued to be affected by mid-single-digit price erosion, the slowdown in volumes due to the general economy, a challenging reimbursement environment for some fusion procedures, and the continued trend toward physician-owned distributorships.
Other
Worldwide net sales of other products for the year ended May 31, 2011 were $190.2 million, or 7% of net sales, compared to net sales of $177.6 million, or 7% of net sales, during the year ended May 31, 2010. The effect of foreign currency fluctuations negatively impacted our other product category’s growth on a reported basis by $1.0 million. The primary contributors of other product sales during the year ended May 31, 2011 consisted of products from our sports medicine division, which reported double digit sales growth, including the JuggerKnot™ Soft Anchor, the ComposiTCP™ Interference Screw, the MaxFire™ MarXmen™ Meniscal Repair Device, the ToggleLoc™ Femoral Fixation Device with ZipLoop™ Technology, and the ALLthread™ Knotless Suture Anchor.
55
Table of Contents
Gross Profit
Gross profit for the year ended May 31, 2011 increased to $1,893.5 million compared to gross profit for the year ended May 31, 2010 of $1,878.1 million, or 69% and 70% of net sales, respectively. Gross profit as a percentage of net sales was slightly down due to a decrease in average selling prices compared to the year ended May 31, 2010.
Selling, General and Administrative Expense
Selling, general and administrative expense during the years ended May 31, 2011 and 2010 were $1,041.7 million and $1,042.3 million, respectively, or 38% and 39% of net sales, respectively. The expense was slightly down year over year due to continued cost containment strategies worldwide.
Research and Development Expense
Research and development expense during the years ended May 31, 2011 and 2010 was $119.4 million and $106.6 million, respectively, or 4% of net sales for both periods. This increase in research and development expenses for the year ended May 31, 2011 primarily related to our ongoing commitment to increase investment in clinical research and regulatory affairs within our business. Our principal research and development efforts relate to primary and revision orthopedic reconstructive devices, spinal fixation products, dental reconstructive devices, sports medicine products, resorbable technology, biomaterial products and autologous therapies. Expenses during the year ended May 31, 2011 have primarily been related to the following research and development projects: E1® Antioxidant Infused Technology Tibial bearings (Reconstructive-Knees), Vanguard® SSK 360 Revision System (Reconstructive-Knees), Arcos® Modular Revision Hip System (Reconstructive-Hips), Taperloc® Complete Hip System (Reconstructive-Hips) OrthoPak® and SpinalPak® stimulation platform technologies (Fixation-Stimulation) and iQ® Intelligent Delivery System (Fixation-Craniomaxillofacial).
Amortization
Amortization expense for the year ended May 31, 2011 was $367.9 million or 13% of net sales, compared to $372.6 million for the year ended May 31, 2010, or 14% of net sales. This decrease is primarily due to the accelerated method for amortizing customer relationship intangibles as the value for those relationships is greater at the beginning of their life cycle and the decrease in amortization in the fourth quarter due to the intangible impairment charge taken in the fourth quarter of fiscal 2011 related to our Europe business and described below.
Goodwill and Intangible Assets Impairment Charge
During fourth quarter of fiscal 2011, we recorded a $941.4 million goodwill and definite and indefinite-lived intangible assets impairment charge primarily related to our Europe business due to the continued market slowdown in Europe relative to our original purchase accounting assumptions at the time of the Merger due to the continued financial and credit challenges in some European countries, which continue to impact our sales growth.
Interest Expense
Interest expense was $498.9 million for the year ended May 31, 2011, compared to interest expense of $516.4 million for the year ended May 31, 2010. The decrease in interest expense was primarily due to a lower average interest rate on our outstanding floating rate debt.
Other (Income) Expense
Other (income) expense was income of $11.2 million for the year ended May 31, 2011, compared to income of $18.1 million for the year ended May 31, 2010. The decrease is primarily due to a decrease in currency transaction gains of $5.6 million.
56
Table of Contents
Benefit from Income Taxes
Our effective income tax rate decreased to 20.2% for the year ended May 31, 2011 compared to 66.4% for the year ended May 31, 2010. The fiscal 2011 tax rate is lower than statutory tax rates due to amounts deducted for financial reporting purposes that are not deductible for tax purposes. In fiscal 2011, $422.8 million of the $941.4 million impairment charge taken on the European business unit was a non-deductible permanent difference. This rate also decreased due to an increase in valuation allowance relating to state and foreign net operating loss carryforwards and an increase in uncertain tax benefits, offset by reductions to our state effective tax rate (primarily due to New Jersey’s change to single-sales factor) as well as the reduction in United Kingdom corporate tax rates. The Company’s effective tax rate in fiscal 2010 was higher than statutory rates primarily due to the Company’s mix of profits and losses in certain foreign and domestic jurisdictions, specifically a higher pre-tax loss in the U.S. as a percent of the total worldwide loss before income taxes.
For the Year Ended May 31, 2010 Compared to the Year Ended May 31, 2009
| (in millions, except percentages) | Year Ended May 31, 2010 |
Percentage of Net Sales |
Year Ended May 31, 2009 |
Percentage of Net Sales |
Percentage Increase/ (Decrease) |
|||||||||||||||
| Net sales |
$ | 2,698.0 | 100 | % | $ | 2,504.1 | 100 | % | 8 | % | ||||||||||
| Cost of sales |
819.9 | 30 | 828.4 | 33 | (1 | ) | ||||||||||||||
|
|
|
|
|
|
|
|
|
|
|
|||||||||||
| Gross profit |
1,878.1 | 70 | 1,675.7 | 67 | 12 | |||||||||||||||
| Selling, general and administrative expense |
1,042.3 | 39 | 1,003.6 | 40 | 4 | |||||||||||||||
| Research and development expense |
106.6 | 4 | 93.5 | 4 | 14 | |||||||||||||||
| Amortization |
372.6 | 14 | 375.8 | 15 | (1 | ) | ||||||||||||||
| Goodwill & intangible assets impairment charge |
— | — | 551.1 | 22 | N/A | |||||||||||||||
|
|
|
|
|
|
|
|
|
|
|
|||||||||||
| Operating income (loss) |
356.6 | 13 | (348.3 | ) | (14 | ) | N/A | |||||||||||||
| Interest expense |
516.4 | 19 | 550.3 | 22 | (6 | ) | ||||||||||||||
| Other (income) expense |
(18.1 | ) | (1 | ) | 21.8 | 1 | N/A | |||||||||||||
|
|
|
|
|
|
|
|
|
|
|
|||||||||||
| Other expense, net |
498.3 | 18 | 572.1 | 23 | (13 | ) | ||||||||||||||
|
|
|
|
|
|
|
|
|
|
|
|||||||||||
| Loss before income taxes |
(141.7 | ) | (5 | ) | (920.4 | ) | (37 | ) | (85 | ) | ||||||||||
| Benefit from income taxes |
(94.1 | ) | (3 | ) | (171.2 | ) | (7 | ) | (45 | )% | ||||||||||
|
|
|
|
|
|
|
|
|
|
|
|||||||||||
| Net loss |
$ | (47.6 | ) | (2 | )% | $ | (749.2 | ) | (30 | )% | (94 | )% | ||||||||
|
|
|
|
|
|
|
|
|
|
|
|||||||||||
Sales
Net sales were $2,698.0 million for the year ended May 31, 2010, and $2,504.1 million for the year ended May 31, 2009. The following tables provide net sales by geography and product category:
Geography Sales Summary
| (in millions, except percentages) |
Year Ended May 31, 2010 (1) |
Percentage of Net Sales |
Year Ended May 31, 2009 (1) |
Percentage of Net Sales |
Percentage Increase/ (Decrease) |
|||||||||||||||
| United States |
$ | 1,644.1 | 61 | % | $ | 1,527.9 | 61 | % | 8 | % | ||||||||||
| Europe |
724.5 | 27 | 708.4 | 28 | 2 | |||||||||||||||
| International (2) |
329.4 | 12 | 267.8 | 11 | 23 | |||||||||||||||
|
|
|
|
|
|
|
|
|
|
|
|||||||||||
| Total |
$ | 2,698.0 | 100 | % | $ | 2,504.1 | 100 | % | 8 | % | ||||||||||
|
|
|
|
|
|
|
|
|
|
|
|||||||||||
57
Table of Contents
| (1) | Certain amounts have been adjusted to conform to the current presentation. Specifically, International net sales increased, and Europe net sales decreased, $4.3 million and $3.3 million for the years ended May 31, 2010 and 2009, respectively. The current presentation aligns with how the Company presently manages and markets its products. |
| (2) | International primarily includes Canada, South America, Mexico and the Asia Pacific. |
Product Category Summary
| (in millions, except percentages) |
Year Ended May 31, 2010 (1) |
Percentage of Net Sales |
Year Ended May 31, 2009 (2) |
Percentage of Net Sales |
Percentage Increase/ (Decrease) |
|||||||||||||||
| Reconstructive |
$ | 2,046.4 | 76 | % | $ | 1,873.1 | 75 | % | 9 | % | ||||||||||
| Fixation |
242.0 | 9 | 236.4 | 9 | 2 | |||||||||||||||
| Spinal |
232.0 | 8 | 216.9 | 9 | 7 | |||||||||||||||
| Other |
177.6 | 7 | 177.7 | 7 | — | |||||||||||||||
|
|
|
|
|
|
|
|
|
|
|
|||||||||||
| Total |
$ | 2,698.0 | 100 | % | $ | 2,504.1 | 100 | % | 8 | % | ||||||||||
|
|
|
|
|
|
|
|
|
|
|
|||||||||||
| (1) | Certain amounts have been adjusted to conform to the current presentation. Specifically, reconstructive product net sales increased, and other product net sales decreased, $21.9 million for the year ended May 31, 2010. Fixation product net sales increased, and spinal product net sales decreased, $4.2 million for the year ended May 31, 2010. The current presentation aligns with how the Company presently manages and markets its products. |
| (2) | Certain amounts have been adjusted to conform to the current presentation. Specifically, reconstructive product net sales increased by $22.1 million, fixation product net sales increased by $2.3 million, spinal product net sales decreased by $5.2 million and other product net sales decreased by $19.2 million for the year ended May 31, 2009. The current presentation aligns with how the Company presently manages and markets its products. |
Reconstructive
Our worldwide sales of reconstructive products continued to be a significant percentage of total net sales. Net sales of reconstructive products for the year ended May 31, 2010 were $2,046.4 million, or 76% of net sales, representing a 9% increase compared to net sales of $1,873.1 million, or 75% of net sales, during the year ended May 31, 2009. The effect of foreign currency fluctuations positively impacted growth on a reported basis of this product category by $22.7 million, or 1%.
Global knee product sales increased 13% worldwide and increased 11% in the United States during the year ended May 31, 2010. There was continued strong market demand for the Vanguard® Complete Knee System and the Vanguard® SSK Revision Knee System, with positive market acceptance of the E1®Antioxidant Infused Technology Tibial Bearings, the Signature™ Personalized Patient Care system, and the Regenerex® Primary Tibial Trays. E1® Antioxidant Infused Technology Tibial Bearings provide Vitamin E-infused highly crosslinked polyethylene, which is designed to offer strength and oxidative stability for improved wear characteristics. The advanced porous metal technology of Regenerex® Primary Tibial Trays provides rigid fixation to complete the porous primary knee construct. In addition, Europe knee sales were driven by the Vanguard® Complete Knee System, the Biomet® Modular Tray and the Oxford® Partial Knee System.
Global hip product sales increased 7% worldwide, with a 6% sales increase in the United States during the year ended May 31, 2010. The primary drivers of the global hip sales growth included the Regenerex® RingLoc®+ Modular Acetabular Systems, E1™ Antioxidant Infused Technology Bearings, the Biolox delta® (a trademark of CeramTec AG) Ceramic Femoral Heads, the conventional and Microplasty® versions of the Taperloc® Hip System as well as the Echo® Hip System. In addition, Europe hip sales were principally driven by demand for the Bi-Metric® stem and the Exceed™ ABT Advanced Bearing Technologies Acetabular System.
58
Table of Contents
Global extremity product sales increased 29% worldwide, with a 44% sales increase in the United States during the year ended May 31, 2010. The primary drivers of sales growth included the Comprehensive® Primary and Reverse Shoulder Systems, the Comprehensive® Fracture System, the Copeland™ Shoulder, the Discovery® Elbow System and the ExploR® Modular Radial Head. In addition, Europe extremity sales were primarily driven by the anatomical and reverse versions of the T.E.S.S. Shoulder System.
Dental sales decreased 2% worldwide and in the United States during the year ended May 31, 2010. The decrease is primarily due to the economy impacting elective procedures continuing from fiscal 2009 into fiscal 2010.
Fixation
Worldwide net sales of fixation products for the year ended May 31, 2010 were $242.0 million, or 9% of net sales, compared to net sales of $236.4 million, also 9% of net sales, during the year ended May 31, 2009. The effect of foreign currency fluctuations did not materially impact growth of this product category. Sales of fixation products reflected double digit growth of craniomaxillofacial fixation sales and high single digit growth of internal fixation sales offset by decreased sales of external fixation and electrical stimulation products. During the year ended May 31, 2010, there was continued strong market demand for the TraumaOne™ System, which contributed to the sales growth for craniomaxillofacial fixation. Other key craniomaxillofacial fixation products that contributed to sales growth included the TMJ Replacement System and the OnPoint™ Diagnostic Scope System. Key internal fixation products included the Phoenix™ Ankle Arthrodesis Nail, the Forerunner™ Plating System and the OptiLock® Proximal Humeral Plates.
Spinal
Worldwide net sales of spinal products for the year ended May 31, 2010 were $232.0 million, or 8% of net sales, representing a 7% increase compared to net sales of $216.9 million, or 9% of net sales, for the year ended May 31, 2009 primarily due to increased sales volume of the three major spine implant segments: spacer, thoracolumbar and cervical.
Sales of spacer products increased primarily due to the strength in sales of the Solitaire™ Anterior Spine System, which includes the PEEK-OPTIMA® (a registered trademark of Invibio® Limited) version of the Solitaire™ Spine System for Anterior Lumbar Interbody Fusions. Sales of thoracolumbar products continue to grow with strong market acceptance of the Polaris™ product line, including the Polaris™ Deformity System, which features Trivium™ Derotation instruments. Sales of cervical products increased primarily due to the strength in sales of the MaxAn® Anterior Cervical Plate System (the MaxAn® Anterior Cervical Plate System incorporates technology developed by Gary K. Michelson, M.D.). In addition, products that contributed to spinal sales in Europe included the Synergy™ Spinal System and the Array® Spinal System.
Other
Worldwide net sales of other products for the year ended May 31, 2010 were $177.6 million, or 7% of net sales, compared to net sales of $177.7 million, or 7% of net sales, during the year ended May 31, 2009. The primary contributors of other product sales during the year ended May 31, 2010 consisted of products from our sports medicine division, which reported double digit sales growth, including the MicroMax™ Flex Suture Anchor, the ComposiTCP™ Interference Screw, the ZipTight™ Fixation Device, the MaxFire™ Meniscal Repair Device, and the ToggleLoc™ Femoral Fixation Device with ZipLoop™ Technology. In addition, Europe sales growth drivers for our sports medicine product category included the Gentle Threads™ Interference Screws and the EZLoc™ Femoral Fixation Device.
Gross Profit
Gross profit for the year ended May 31, 2010 increased to $1,878.1 million compared to gross profit for the year ended May 31, 2009 of $1,675.7 million, or 70% and 67% of net sales, respectively. Gross profit for the
59
Table of Contents
year ended May 31, 2009 was negatively impacted by $67.5 million of product-related litigation expenses for settlements and reserves associated with product liability litigation and a $20.5 million product rationalization charge related to our Biomet Trauma and Biomet Spine & Bone Healing Technologies businesses. The increase from the prior year was partially offset by operational restructuring costs related to our operational improvement initiatives, which included abnormal manufacturing variances related to temporary redundant overhead costs within our plant network as we continued to rationalize and move production to our larger operating locations in order to increase manufacturing efficiency.
Selling, General and Administrative Expense
Selling, general and administrative expenses were 39% of net sales for the year ended May 31, 2010, compared to 40% of net sales for the year ended May 31, 2009. This decrease in selling, general and administrative expenses for the year ended May 31, 2010 primarily related to lower costs associated with our operational restructuring and consulting expenses related to operational improvement initiatives and a decrease in our share-based compensation expense compared to the prior year. Selling, general and administrative expenses for fiscal 2010 were negatively impacted by a $9.3 million bad debt expense charge related to the proposal the Greek government announced on June 15, 2010 to settle their outstanding debts from 2007 through 2009 primarily by issuing long-term zero-coupon bonds.
Research and Development Expense
Research and development expense during the years ended May 31, 2010 and 2009 was $106.6 million and $93.5 million, respectively, or 4% of net sales for both periods. This increase in research and development expenses for the year ended May 31, 2010 primarily related to our ongoing commitment to increase investment in clinical research and regulatory affairs within our business. Expenses during the year ended May 31, 2010 primarily related to the following research and development projects: E1® Antioxidant Infused Technology Tibial bearings (Reconstructive-Knees), Arcos® Modular Revision Hip System (Reconstructive-Hips), Cobalt™ MV Bone Cement (Reconstructive-Other), OrthoPak® and SpinalPak® stimulation platform technologies (Fixation-Stimulation), ZipTight™ Fixation Device and JuggerKnot™ Soft Suture Anchor Technology (Other-Sports Medicine). In addition, European expenses primarily related to additional research and development projects for the Alpina™ Unicompartmental Lateral upgrades.
Amortization
Amortization expense for the year ended May 31, 2010 was $372.6 million or 14% of net sales, compared to $375.8 million for the year ended May 31, 2009, or 15% of net sales. This decrease is primarily due to the accelerated method for amortizing customer relationship intangibles as the value for those relationships is greater at the beginning of their life cycle.
Goodwill and Intangible Assets Impairment Charge
During fiscal 2009, we recorded a $551.1 million goodwill and definite and indefinite-lived intangible asset impairment charge associated with the dental reconstructive business unit. The decline in sales volume during the third quarter of fiscal 2009 created an indication of potential impairment of our long-lived assets; therefore, we performed a preliminary impairment test as of February 28, 2009. Key factors contributing to the impairment charge included disruptions in the credit and equity market, and changes in the dental reconstructive market demand relative to our original assumptions at the time of the Merger. We finalized the impairment test during the fourth quarter of fiscal 2009. We completed our annual impairment tests as of March 31, 2010, in accordance with our standard timing of testing, and no additional impairment of goodwill or other intangible assets was indicated for fiscal 2010.
60
Table of Contents
Interest Expense
Interest expense was $516.4 million for the year ended May 31, 2010, compared to interest expense of $550.3 million for the year ended May 31, 2009. The decrease in interest expense was due to the following: 1) a decrease in interest rates on variable rate debt and 2) a lower average debt balance of $6,117.9 million for the year ended May 31, 2010, compared to $6,245.3 million for the year ended May 31, 2009.
Other (Income) Expense
Other (income) expense was income of $18.1 million for the year ended May 31, 2010, compared to other expense of $21.8 million for the year ended May 31, 2009. The increase in other income for the year ended May 31, 2010 primarily related to currency transaction gains of $10.4 million compared to currency transaction losses of $7.0 million for the year ended May 31, 2009, as well as $5.2 million of other-than-temporary impairment (OTTI) on our investments and the write-down of auction-rate securities of $9.4 million in fiscal 2009. The currency transaction gains and losses related to our foreign operations were primarily due to the change in the exchange rate of the euro compared to the U.S. dollar on intercompany inventory purchases.
Benefit from Income Taxes
The effective income tax rate increased to 66.4% for the year ended May 31, 2010 compared to 18.6% for the year ended May 31, 2009. The fiscal 2010 tax rate was higher than the federal statutory tax rate primarily due to the benefit of foreign earnings taxed at rates lower than the U.S. federal rate, an increase in deferred tax benefit relating to changes in state statutory rate estimates, and the generation of additional foreign tax and general business credits. The effective tax rate increase was partially offset by the increase in valuation allowance relating to state and foreign net operating loss carryforwards and an increase in uncertain tax benefits. In fiscal 2009, $495.6 million of the $551.1 million impairment charge taken on the dental reconstructive business unit was a non-deductible permanent difference, which decreased the effective tax rate. The increase in the tax rate in fiscal 2010 compared to the prior periods is also partially attributable to changes in the Company’s mix of profits and losses in certain foreign and domestic jurisdictions in the current year, primarily the loss in the U.S. as a percent of the total loss before income taxes decreasing in fiscal 2010 compared to fiscal 2009.
Liquidity and Capital Resources
Cash Flows
The following is a summary of the cash flows by activity for the years ended May 31, 2011, 2010, and 2009:
| (in millions) |
Year Ended May 31, 2011 |
Year Ended May 31, 2010 |
Year Ended May 31, 2009 |
|||||||||
| Net cash provided by (used in): |
||||||||||||
| Operating activities |
$ | 380.1 | $ | 321.5 | $ | 243.8 | ||||||
| Investing activities |
(205.0 | ) | (182.0 | ) | (194.9 | ) | ||||||
| Financing activities |
(51.4 | ) | (159.9 | ) | 42.5 | |||||||
| Effect of exchange rate changes on cash |
15.0 | (6.1 | ) | (3.4 | ) | |||||||
|
|
|
|
|
|
|
|||||||
| Change in cash and cash equivalents |
$ | 138.7 | $ | (26.5 | ) | $ | 88.0 | |||||
|
|
|
|
|
|
|
|||||||
For the Year Ended May 31, 2011 Compared to the Year Ended May 31, 2010
Our cash and cash equivalents were $327.8 million as of May 31, 2011 compared to $189.1 million as of May 31, 2010. We maintain our cash and cash equivalents and investments in money market funds, time deposits, corporate bonds and debt instruments. We are exposed to interest rate risk on certain debt instruments.
61
Table of Contents
Operating Cash Flows
Net cash provided by operating activities was $380.1 million for the year ended May 31, 2011, compared to cash flows provided of $321.5 million for the year ended May 31, 2010. Cash generated by operating activities continued to be a source of funds for deleveraging and investing in our growth. The increase in cash provided by operating activities of $58.6 million was primarily due to working capital improvement initiatives and the prior year being negatively impacted by $53.0 million related to a previously disclosed litigation settlement. Net cash provided by operating activities for the year ended May 31, 2011 included a net loss of $849.8 million, offset by non-cash amounts of $1,227.8 million (primarily goodwill and intangible asset impairment charge, depreciation and amortization, and partially offset by deferred income taxes), and cash provided by working capital of $2.1 million. Net cash provided by operating activities for the year ended May 31, 2010 included a net loss of $47.6 million, offset by non-cash amounts of $458.3 million (primarily depreciation and amortization and stock based compensation, partially offset by deferred income taxes), and cash used in working capital of $89.2 million.
Investing Cash Flows
Net cash used in investing activities was $205.0 million for the year ended May 31, 2011 and $182.0 million for the year ended May 31, 2010. Cash generated by operating activities continued to be a source of funds for deleveraging and investing in our growth. The increase in cash provided by operating activities of $58.6 million was primarily due to working capital improvement initiatives and the prior year being negatively impacted by $53.0 million related to a previously disclosed litigation settlement. Net cash used in investing activities for the years ended May 31, 2011 and 2010 primarily related to capital expenditures of $174.0 million and $186.4 million, respectively, and purchases of investments of $78.7 million and $13.3 million, respectively, partially offset by proceeds from the sale/maturity of investments of $59.3 million and $24.9 million, respectively.
Financing Cash Flows
Net cash used in financing activities was $51.4 million for the year ended May 31, 2011, compared to $159.9 million for the year ended May 31, 2010. Net cash used in financing activities for the year ended May 31, 2011 primarily related to required payments under the senior secured credit facilities of $34.8 million and a discretionary repurchase of $10.0 million par value of senior cash pay notes for $11.2 million. Net cash used in financing activities for the year ended May 31, 2010 primarily related to required payments under the senior secured credit facilities of $35.8 million, discretionary payments under the revolving credit facilities of $68.9 million, and discretionary payments under the asset-based revolver of $65.2 million, partially offset by proceeds under the revolving credit facilities of $20.4 million.
Balance Sheet Metrics
Cash flows from operations are impacted by profitability and changes in operating working capital. Management monitors operating working capital with particular focus on certain metrics, including days sales outstanding (“DSO”) and inventory turns. The following is a summary of our DSO and inventory turns for the years ended May 31, 2011 and 2010.
| Year Ended May 31, 2011 |
Year Ended May 31, 2010 |
|||||||
| Days Sales Outstanding |
62.3 | 65.2 | ||||||
| Inventory Turns |
1.54 | 1.59 | ||||||
We use DSO as a measure that places emphasis on how quickly we collect our accounts receivable balances from customers. Our improved DSO in fiscal 2011, despite the challenging economic environment, is primarily
62
Table of Contents
due to improved management and increased factoring in our European countries. We use inventory turns as a measure that places emphasis on how efficiently we are managing our inventory levels. These measures may not be computed the same as similarly titled measures used by other companies.
For the Year Ended May 31, 2010 Compared to the Year Ended May 31, 2009
Our cash and cash equivalents was $189.1 million as of May 31, 2010, compared to $215.6 million as of May 31, 2009. We maintained our cash and investments in money market funds, certificates of deposit, corporate bonds and debt instruments.
Operating Cash Flows
Net cash provided by operating activities was $321.5 million for the year ended May 31, 2010, compared to cash flows provided of $243.8 million for the year ended May 31, 2009. Cash generated by operating activities continued to be a source of funds for deleveraging and investing in our growth. Net cash provided by operating activities for the year ended May 31, 2010 included a net loss of $47.6 million, offset by non-cash amounts of $458.3 million (primarily depreciation and amortization and stock based compensation, partially offset by deferred income taxes), and cash used in working capital of $89.2 million. This compared to the year ended May 31, 2009 which included a net loss of $749.2 million, offset by non-cash amounts of $927.3 million (primarily goodwill and intangible asset impairment charge, depreciation and amortization, deferred income taxes and stock based compensation), and cash provided by working capital of $65.7 million. The increase in cash provided by operating activities of $77.7 million was primarily due to the following:
| • | $232.6 million decrease in net loss after taking into consideration noncash items offset by: |
| ¡ | $61.0 million payment on previously disclosed litigation accrued for in fiscal 2009; and |
| ¡ | $17.2 million additional income taxes paid. |
Investing Cash Flows
Net cash used in investing activities was $182.0 million for the year ended May 31, 2010 and $194.9 million for the year ended May 31, 2009. Net cash used in investing activities for the years ended May 31, 2010 and 2009 primarily related to capital expenditures of $186.4 million and $185.0 million, respectively, and purchases of investments of $13.3 million, partially offset by proceeds from sales of available-for-sale securities of $24.9 million.
Financing Cash Flows
Net cash used in financing activities was $159.9 million for the year ended May 31, 2010, compared to net cash provided by financing activities of $42.5 million for the year ended May 31, 2009. Net cash used in financing activities for the year ended May 31, 2010 primarily related to required payments under the senior secured credit facility of $35.8 million, discretionary payments under the revolving credit facilities of $68.9 million, and discretionary payments under the asset-based revolver of $65.2 million, partially offset by proceeds under the revolving credit facilities of $20.4 million. Net cash provided by financing activities for the year ended May 31, 2009 primarily related to proceeds under the revolving credit facilities of $48.2 million and under the asset-based revolver of $165.4 million, partially offset by required payments under the senior secured credit facility of $35.7 million, discretionary payments under the revolving credit facilities of $38.0 million, and discretionary payments under the asset-based revolver of $100.2 million.
63
Table of Contents
Non-GAAP disclosures
We use certain non-GAAP financial measures to evaluate our performance using information that differs from what is required under U.S. generally accepted accounting principles or “GAAP”. These non-GAAP financial measures may not be comparable to similar measures reported by other companies and should be considered in addition to, and not as a substitute for, or superior to, other measures prepared in accordance with GAAP.
The senior secured leverage ratio provides a measure of our financial ability to meet our debt service obligations. The ratio level determines the interest rate charged on our asset-based revolving credit facility, cash flow revolving credit facilities, and letters of credit fees. In addition to determining the current interest rate on our revolving credit facilities, the ratio is also used as a benchmark in our credit agreements to determine maximum levels of additional indebtedness we may incur. We believe the directional trend of this ratio provides valuable insight to understanding our operational performance and financial position with respect to our debt obligations.
| (in millions, except ratios) | May 31, 2011 | May 31, 2010 | ||||||
| USD Term Loan B |
$ | 2,258.1 | $ | 2,281.5 | ||||
| EUR Term Loan B |
1,206.3 | 1,047.3 | ||||||
|
|
|
|
|
|||||
| Consolidated Senior Secured Debt |
$ | 3,464.4 | $ | 3,328.8 | ||||
|
|
|
|
|
|||||
| LTM Adjusted EBITDA |
$ | 1,010.4 | $ | 1,000.0 | ||||
| “Run Rate” Cost Savings (2) |
— | 12.6 | ||||||
|
|
|
|
|
|||||
| LTM Adjusted EBITDA, plus cost savings |
$ | 1,010.4 | $ | 1,012.6 | ||||
|
|
|
|
|
|||||
| Senior Secured Leverage Ratio (1) |
3.43 | 3.29 | ||||||
| (1) | Our senior secured leverage ratio is defined by our credit agreement as total consolidated senior secured debt divided by the total of the last twelve months, or “LTM,” adjusted EBITDA plus “run rate” cost savings. |
| (2) | As defined by the Credit Agreement dated September 25, 2007. |
The increase in the senior secured leverage ratio at May 31, 2011 as compared to May 31, 2010 is primarily due to the increase in the euro exchange rates, partially offset by debt service payments.
We use adjusted EBITDA, among other measures, to evaluate the performance of our core operations, establish operational goals and forecasts that are used in allocating resources and to evaluate our performance period over period, including for incentive program purposes. The term “as adjusted,” a non-GAAP financial measure, refers to financial performance measures that exclude certain income statement line items, such as interest, taxes, depreciation or amortization and/or exclude certain expenses as defined by our credit agreement, such as restructuring charges, non-cash impairment charges, integration and facilities opening costs or other business optimization expenses, new systems design and implementation costs, certain start-up costs and costs related to consolidation of facilities, certain non-cash charges, advisory fees paid to the private equity owners, certain severance charges, purchase accounting costs, stock-based compensation and payments, litigation costs, and other related charges.
64
Table of Contents
Adjusted EBITDA for the fiscal years ended May 31, 2011, 2010 and 2009 is calculated as follows:
| (in millions) | Year Ended May 31, 2011 |
Year Ended May 31, 2010 |
Year Ended May 31, 2009 |
|||||||||
| Net loss |
$ | (849.8 | ) | $ | (47.6 | ) | $ | (749.2 | ) | |||
| Depreciation |
181.1 | 175.0 | 161.9 | |||||||||
| Amortization |
367.9 | 372.6 | 375.8 | |||||||||
| Interest expense |
498.9 | 516.4 | 550.3 | |||||||||
| Other (income) expense, net |
(11.2 | ) | (18.1 | ) | 21.8 | |||||||
| Income tax benefit |
(214.8 | ) | (94.1 | ) | (171.2 | ) | ||||||
|
|
|
|
|
|
|
|||||||
| EBITDA |
$ | (27.9 | ) | $ | 904.2 | $ | 189.4 | |||||
|
|
|
|
|
|
|
|||||||
| Special items adjustments: |
||||||||||||
| Stock-based compensation expense (1) |
$ | 12.7 | $ | 22.4 | $ | 33.9 | ||||||
| Distributor agreements (2) |
— | — | 2.0 | |||||||||
| Litigation settlements and reserves and other legal fees (3) |
12.5 | 10.7 | 82.1 | |||||||||
| Operational restructuring and consulting expenses related to operational initiatives (severance, building impairments, abnormal manufacturing variances and other related costs) (4) |
61.6 | 43.3 | 58.7 | |||||||||
| Sponsor fee (5) |
10.1 | 10.1 | 9.2 | |||||||||
| Greece bad debt expense (6) |
— | 9.3 | — | |||||||||
| Goodwill and intangible assets impairment charge (7) |
941.4 | — | 551.1 | |||||||||
|
|
|
|
|
|
|
|||||||
| Adjusted EBITDA (8) |
$ | 1,010.4 | $ | 1,000.0 | $ | 926.4 | ||||||
|
|
|
|
|
|
|
|||||||
| (1) | Stock-based compensation expense is excluded from non-GAAP measures primarily because it is a non-cash expense. We believe that excluding this item is useful to investors in that it facilitates comparisons to competitors’ operating results. |
| (2) | Payments to distributors that are not in the ordinary course of business are excluded in non-GAAP measures, as they are not reflective of our ongoing operational performance. We believe the exclusion of this information in the applicable non-GAAP financial measure is useful to investors in that it provides period-over-period comparability. |
| (3) | We exclude certain litigation-related expenses from non-GAAP measures that are not reflective of our ongoing operational performance. We believe this information is useful to investors in that it provides period-over-period comparability. |
| (4) | Restructuring charges relate principally to employee severance and facility consolidation costs resulting from the closure of facilities and other workforce reductions attributable to our efforts to reduce costs. Operational restructuring charges also include abnormal manufacturing variances related to temporary redundant overhead costs within our plant network as we continue to rationalize and move production to our larger operating locations in order to increase manufacturing efficiency. We exclude these costs from non-GAAP measures primarily because they are not reflective of the ongoing operating results and they are not used by management to assess ongoing operational performance. We believe the exclusion of this information in the applicable non-GAAP financial measure is useful to investors in that it provides period-over-period comparability. |
| (5) | Upon completion of the Merger, we entered into a management services agreement with certain affiliates of the Sponsors, pursuant to which such affiliates of the Sponsors or their successors, assigns, affiliates, officers, employees, and/or representatives and third parties (collectively, the “Managers”) provide management, advisory, and consulting services to us. Pursuant to such agreement, the Managers received a transaction fee equal to 1% of total enterprise value of the Transactions for the services rendered by such entities related to the Transactions upon entering into the agreement, and the Sponsors receive an annual monitoring fee equal to 1% of the Company’s annual adjusted EBITDA as compensation for the services rendered and reimbursement for out-of-pocket expenses incurred by the Managers in connection with the |
65
Table of Contents
| agreement and the Transactions. We exclude these costs from non-GAAP measures primarily because they are not reflective of the ongoing operating results and they are not used by management to assess ongoing operational performance. We believe the exclusion of this information in the applicable non-GAAP financial measure is useful to investors in that it provides period-over-period comparability. |
| (6) | This charge is related to the proposal the Greek government announced on June 15, 2010 to settle their outstanding debts from 2007 through 2009 primarily by issuing zero-coupon bonds. We exclude this charge from non-GAAP measures primarily because it is not reflective of ongoing operating results. |
| (7) | During fiscal 2011, we recorded a $941.4 million goodwill and definite and indefinite-lived intangible asset impairment charge primarily associated with our Europe reporting unit. During fiscal 2009, we recorded a $551.1 million goodwill and definite and indefinite-lived intangible asset impairment charge associated with our dental reconstructive reporting unit. We exclude these non-cash charges from non-GAAP measures because they are not reflective of our ongoing operational performance or liquidity. We believe the exclusion of this information in the applicable non-GAAP financial measure is useful to investors in that it provides period-over-period comparability. |
| (8) | As defined in our credit agreement. |
Credit Facilities
Senior Secured Credit Facilities. On September 25, 2007, we entered into a credit agreement and related security and other agreements providing for (a) a $2,340.0 million U.S. dollar-denominated term loan facility and a €875.0 million (approximately $1,207.4 million at September 25, 2007) euro-denominated term loan facility and (b) $400.0 million cash flow revolving credit facilities with Bank of America, N.A. as administrative agent and collateral agent. We refer to our term loan facilities and our cash flow revolving credit facilities collectively as the “senior secured credit facilities.”
We borrowed the full amount available under our term loan facilities on September 25, 2007. During the year ended May 31, 2011, we repaid $23.4 million of outstanding loans under our U.S. dollar-denominated term loan facility and $11.4 million of outstanding loans under the euro-denominated term loan facility. During the year ended May 31, 2010, we repaid $23.2 million of outstanding loans under our U.S. dollar-denominated term loan facility and $12.6 million of outstanding loans under the euro-denominated term loan facility.
The cash flow revolving credit facilities include a $100.0 million sub-facility for letters of credit and a $100.0 million sub-capacity for borrowings on same-day notice, referred to as swingline loans. We borrowed approximately $131.0 million under our cash flow revolving credit facilities on September 25, 2007 to pay a portion of the Transactions. As of May 31, 2011, we had no outstanding borrowings under our cash flow revolving credit facilities.
Borrowings under our cash flow revolving credit facilities bear interest at a rate per annum equal to an applicable margin plus, at our option, either (1) a base rate determined by reference to the higher of (a) the prime rate of Bank of America, N.A. and (b) the federal funds effective rate plus 1/2 of 1.00% or (2) a LIBOR or Eurocurrency rate determined by reference to the cost of funds for deposits in the currency of such borrowing for the interest period relevant to such borrowing adjusted for certain additional costs. At May 31, 2011, the applicable margin for borrowings under our term loan facilities was 2.00% with respect to base rate borrowings and 3.00% with respect to LIBOR or Eurocurrency borrowings, and our cash flow revolving credit facilities were 1.25% with respect to base rate borrowings and 2.25% with respect to LIBOR or Eurocurrency borrowings. In connection with our term loan facilities, we entered into a series of interest rate swap agreements and at May 31, 2011 had (1) an aggregate notional amount of $1,630.0 million to fix the interest rates on a portion of the borrowings under the $2,340.0 million U.S. dollar-denominated term loan facility and (2) an aggregate notional amount of €385.0 million (approximately $549.9 million outstanding at May 31, 2011) to fix the interest rates on a portion of the borrowings under the €875.0 million (approximately $1,206.3 million outstanding at May 31, 2011) euro-denominated term loan facility. See “Management’s Discussion and Analysis of Financial Condition and Results of Operations—Quantitative and Qualitative Disclosures about Market Risk—Interest Rate Risk.”
66
Table of Contents
The credit agreement governing our senior secured credit facilities requires us to prepay outstanding term loans, subject to certain exceptions: (1) after our first full fiscal year after the Closing Date, 50% (which percentage may be reduced to 25% if our senior secured leverage ratio is less than a specified ratio and may be further reduced to 0% if our senior secured leverage ratio is less than a specified ratio) of our annual excess cash flow (as defined in our senior secured credit facilities); (2) if our senior secured leverage ratio is greater than a specified ratio, 100% (which percentage may be reduced to 50% if our senior secured leverage ratio is less than a specified ratio and may be further reduced to 0% if our senior secured leverage ratio is less than a specified ratio) of the net cash proceeds of certain non-ordinary course asset sales and casualty and condemnation events, if we do not reinvest those proceeds in assets to be used in our business or to make certain other permitted investments; and (3) 100% of the net cash proceeds of any incurrence of debt other than debt permitted under our senior secured credit facilities. All obligations under our senior secured credit facilities are unconditionally guaranteed by Parent, and, subject to certain exceptions, each of our existing and future direct and indirect wholly-owned domestic subsidiaries. All obligations under our senior secured credit facilities, and the guarantees of those obligations, are secured, subject to certain exceptions, by substantially all of our assets and the assets of Parent and the subsidiary guarantors. No prepayments on the above mentioned debt were required under the credit agreement in fiscal 2011.
Our senior secured credit facilities contain a number of covenants that, among other things are subject to certain exceptions, will restrict our ability and the ability of our restricted subsidiaries to: (1) incur additional indebtedness; (2) pay dividends on our capital stock or redeem, repurchase or retire our capital stock or indebtedness; (3) make investments, loans, advances and acquisitions; (4) create restrictions on the payment of dividends or other amounts to us from our restricted subsidiaries; (5) engage in transactions with our affiliates; (6) sell assets, including capital stock of our subsidiaries; (7) consolidate or merge; (8) create liens; and (9) enter into sale and lease-back transactions. The credit agreement governing our senior secured credit facilities does not require us to comply with any financial ratio maintenance covenants. As of May 31, 2011, we were in compliance with our covenants and intend to maintain compliance.
The credit agreement governing our senior secured credit facilities also contains certain customary affirmative covenants and events of default.
Asset-based Revolving Credit Facility. On September 25, 2007, we entered into a credit agreement and related security and other agreements for an asset-based revolving credit facility with Bank of America, N.A. as administrative agent and collateral agent. Our asset-based revolving credit facility provides senior secured financing of up to $350.0 million, subject to borrowing base limitations. The borrowing base at any time will equal the sum of 85% of eligible accounts receivable and 85% of the net orderly liquidation value of eligible inventory (not to exceed 65% of the borrowing base), less certain reserves and subject to certain limitations on consigned inventory and accounts receivable owed by non-U.S. persons. Our asset-based revolving credit facility includes a $100.0 million sub-facility for letters of credit and a $35.0 million sub-facility for borrowings on same-day notice, referred to as swingline loans. We did not draw on our asset-based revolving credit facility at the closing of the Transactions. As of May 31, 2011, the borrowing base under our asset-based revolving credit facility was $335.4 million, which is net of borrowing base limitations relating to the asset-based revolving credit facility.
Borrowings under our asset-based revolving credit facility bear interest at a rate per annum equal to the applicable margin plus, at our option, either (1) a base rate determined by reference to the higher of (a) the prime rate of Bank of America, N.A. and (b) the federal funds effective rate plus 1/2 of 1.00% or (2) a LIBOR or Eurocurrency rate determined by reference to the cost of funds for deposits in the currency of such borrowing for the interest period relevant to such borrowing adjusted for certain additional costs. The initial applicable margin for borrowings under our asset-based revolving credit facility is 0.75% with respect to base rate borrowings and 1.75% with respect to LIBOR or Eurocurrency borrowings. The applicable margin may be reduced based on our achievement of certain specified ratios.
67
Table of Contents
If at any time the aggregate amount of outstanding loans, unreimbursed letter of credit drawings and undrawn letters of credit under our asset-based revolving credit facility exceeds the lesser of (1) the commitment amount and (2) the borrowing base, we will be required to repay outstanding loans or cash collateralize letters of credit in an aggregate amount equal to such excess, with no reduction of the commitment amount. If the aggregate amount available under our asset-based revolving credit facility and our cash flow revolving credit facilities is less than $75.0 million plus 10% of any additional commitments under this facility or certain events of default have occurred under our asset-based revolving credit facility, we will be required to repay outstanding loans and cash collateralize letters of credit with the cash we are required to deposit daily in a collection account maintained with the agent under the facility. All obligations under our asset-based revolving credit facility are unconditionally guaranteed by Parent. All obligations under our asset-based revolving credit facility are secured, subject to certain exceptions, by a first-priority security interest in substantially all of our assets and the assets of the subsidiary borrowers that consist of all accounts receivable, inventory, cash, deposit accounts and certain related intangible assets and proceeds of the foregoing.
Like our senior secured credit facilities described above, our asset-based revolving credit facility contains a number of covenants that restrict our ability and the ability of our restricted subsidiaries. The covenants limiting (1) dividends and other restricted payments, (2) investments, loans, advances and acquisitions and (3) prepayments or redemptions of other indebtedness each permit the restricted actions in an unlimited amount, subject to the satisfaction of certain payment conditions, principally that we must have at least $112.5 million plus 15% of any additional commitments under this facility of pro forma excess availability under our asset-based revolving credit facility and our cash flow revolving credit facilities in the aggregate, and that we must be in pro forma compliance with the fixed charge coverage ratio described in the next sentence. Although the credit agreement governing our asset-based revolving credit facility does not require us to comply with any financial ratio maintenance covenants, if less than $35.0 million plus 10% of any additional commitments under this facility were available under our asset-based revolving credit facility at any time, we would not be permitted to borrow any additional amounts unless our pro forma ratio of (a) Consolidated adjusted EBITDA minus Capital Expenditures minus Cash Taxes to (b) Fixed Charges (as such terms are defined in the credit agreement and in each case for the most recently ended four quarter period) were at least 1.0 to 1.0. The credit agreement governing our asset-based revolving credit facility also contains certain customary affirmative covenants and events of default. As of May 31, 2011, we were in compliance with our covenants and intend to maintain compliance.
Notes. We issued an aggregate of $2,348.0 million of original notes on September 25, 2007 and an aggregate of $217.0 million of original notes on October 16, 2007 (which were issued at a premium above par of $6.0 million). The notes are our unsecured obligations, with $1,550.0 million being our senior obligations (consisting of $775.0 million of senior cash pay notes and $775.0 million of senior PIK toggle notes) and $1,015.0 million being our senior subordinated obligations. All of the notes are guaranteed by each of our existing and future wholly-owned domestic subsidiaries that guarantee our obligations under our senior secured credit facilities. Interest is payable in cash, except with respect to our ability to elect to pay PIK interest on the senior PIK toggle notes, subject to certain exceptions.
The indentures governing the notes, among other things, limit our and our restricted subsidiaries’ ability to incur additional indebtedness or issue certain preferred stock, pay dividends and make other restricted payments, make certain investments, sell assets, create liens, consolidate, merge or sell all or substantially all of our assets, enter into transactions with affiliates and designate subsidiaries as unrestricted subsidiaries. These covenants are subject to important exceptions during any period of time for which (i) the respective notes have received investment grade ratings from certain specified rating agencies and (ii) no default has occurred and is continuing under the indentures that govern the respective notes. As of May 31, 2011, we were in compliance with our covenants and intend to maintain compliance.
Non-US Credit Facilities. As of May 31, 2011, we had (1) a non-US facility in the amount of €100.0 million (approximately $142.8 million), and (2) a loan in Spain, together referred to as the non-US facilities. Outstanding
68
Table of Contents
borrowings under our non-U.S. facilities primarily bear interest at a variable rate of the lender’s interbank rate plus an applicable margin. As of May 31, 2011, we had $5.6 million in outstanding borrowings under our non-U.S. facilities.
Future Financing Activities
As of May 31, 2011, we had (1) approximately $377.8 million available for borrowing under our cash flow revolving credit facilities, (2) $335.4 million available for borrowing under our asset-based revolving credit facility, (3) the option to incur additional incremental term loans or increase the cash flow revolving credit facilities commitments under our senior secured credit facilities of up to an amount that would cause our senior secured leverage ratio (as defined in our senior secured credit facilities) to be equal to or less than 4.50 to 1.00, (4) the option to increase the asset-based revolving credit commitments under our asset-based revolving credit facility by up to $100.0 million and (5) $142.8 million available for borrowing under our non-U.S. facilities. However, our ongoing ability to meet our substantial debt service and other obligations will be dependent upon our future performance, which will be subject to business, financial and other factors. We will not be able to control many of these factors, such as economic conditions in the markets where we operate and pressure from competitors. We cannot be certain that our cash flows will be sufficient to allow us to pay principal and interest on our debt, support our operations and meet our other obligations. If we do not have sufficient liquidity, we may be required to refinance all or part of our existing debt, sell assets or borrow more money. We cannot guarantee that we will be able to do so on terms acceptable to us, if at all. In addition, the terms of existing or future debt agreements may restrict us from pursuing any of these alternatives.
Capital Expenditures and Investments
We maintain our cash and investments in money market funds, certificates of deposit, equity securities, Greek bonds, and a time deposit. We are exposed to interest rate risk on our corporate bonds and debt instruments. We see the growth prospects in our markets and intend to invest in an effort to improve our worldwide market position. We expect to spend in excess of $500.0 million over the next two fiscal years for capital expenditures (including instrumentation issued to the field) and research and development costs in an effort to develop products and technologies that further enhance musculoskeletal procedures. Funding of these and other activities is expected to come from currently available funds, cash flows generated from operations, and currently available credit lines.
Contractual Obligations
Summarized in the table below are our long-term obligations and commitments as of May 31, 2011. We have issued notes, entered into senior secured credit facilities, including term loan facilities and cash flow revolving credit facilities, and an asset-based revolving facility, all in connection with the Transactions, all of which are primarily classified as long-term obligations. There were no borrowings under our asset-based revolving facility as of May 31, 2011. Our term loan facilities require payments each year in an amount equal to 1% of the original principal in equal quarterly installments for the first seven years and three months. As of May 31, 2011, required principal payments of $35.9 million are due within the next twelve months.
Our revolving borrowing base available under all debt facilities at May 31, 2011 was $856.0 million, which is net of the remaining $22.3 million commitment of the subsidiaries of Lehman Brothers Holding Inc.(which we expect will not be funded) and borrowing base limitations relating to the asset-based revolving credit facility.
69
Table of Contents
| (in millions) | Total | 2012 | 2013 and 2014 |
2015 and 2016 |
2017 and Thereafter |
|||||||||||||||
| Contractual obligations (1) |
||||||||||||||||||||
| Projected future pension benefit payments |
$ | 21.2 | $ | 6.3 | $ | 5.2 | $ | 6.2 | $ | 3.5 | ||||||||||
| Long-term debt (including current maturities) |
6,020.3 | 37.4 | 71.8 | 3,356.7 | 2,554.4 | |||||||||||||||
| Interest payments (2) |
2,375.9 | 470.0 | 843.6 | 651.2 | 411.1 | |||||||||||||||
| Material purchase commitments |
63.4 | 43.6 | 18.5 | 1.3 | — | |||||||||||||||
| Outsourcing contract obligation |
11.8 | 5.6 | 6.2 | — | — | |||||||||||||||
|
|
|
|
|
|
|
|
|
|
|
|||||||||||
| Total contractual obligations |
$ | 8,492.6 | $ | 562.9 | $ | 945.3 | $ | 4,015.4 | $ | 2,969.0 | ||||||||||
|
|
|
|
|
|
|
|
|
|
|
|||||||||||
| (1) | The total amounts of capital lease obligations and operating lease obligations are not significant. |
| (2) | Amounts include the effect of interest rate swaps currently in place. |
In addition, due to the uncertainty with respect to the timing of future cash flows associated with our unrecognized tax benefits at May 31, 2011, we are unable to make reasonably reliable estimates of the period of cash settlement with the respective taxing authorities. Therefore, $90.9 million of unrecognized tax benefits have been excluded from the contractual obligations table above.
We believe that our cash, other liquid assets and operating cash flow, together with available borrowings and potential access to credit and capital markets, will be sufficient to meet our operating expenses, research and development costs, capital expenditures and to service our debt requirements as they become due. However, our ongoing ability to meet our substantial debt service and other obligations will be dependent upon our future performance, which will be subject to business, financial, economic, regulatory and other factors. We will not be able to control many of these factors, such as economic conditions and regulatory changes in the markets where we operate and pressure from competitors. We cannot be certain that our cash flow will be sufficient to allow us to pay principal and interest on our debt, support our operations and meet our other obligations. If we do not have sufficient liquidity, we may be required to refinance all or part of our existing debt, sell assets or borrow more money. We cannot guarantee that we will be able to do so on terms acceptable to us, if at all. In addition, the terms of existing or future debt agreements may restrict us from pursuing any of these alternatives. See “Risk Factors—Risks Related to Our Indebtedness.”
Off-Balance Sheet Arrangements
We do not currently have any off-balance sheet arrangements that have or are reasonably likely to have a material current or future effect on our financial condition, results of operations, liquidity, capital expenditures or capital resources.
Critical Accounting Policies and Estimates
Management’s discussion and analysis of our financial position and results of operations are based upon our consolidated financial statements, which have been prepared in accordance with accounting principles generally accepted in the United States of America. The preparation of these financial statements requires management to make estimates and judgments that affect the reported amounts of assets, liabilities, revenues and expenses, and related disclosure of contingent assets and liabilities. Our significant accounting policies are discussed in Note 1 of the notes to our consolidated financial statements included elsewhere in this annual report. In management’s opinion, our critical accounting policies include revenue recognition, excess and obsolete inventory, goodwill and intangible assets, legal proceedings and other loss contingencies and income taxes.
Revenue Recognition
We sell product through four principal channels: (1) direct to healthcare institutions, referred to as direct channel accounts, (2) through stocking distributors and healthcare dealers, (3) indirectly through insurance
70
Table of Contents
companies and (4) directly to dental practices and dental laboratories. Sales through the direct and distributor/dealer channels account for a majority of net sales. Through these channels, inventory is consigned to sales agents or customers so that products are available when needed for surgical procedures. Revenue is not recognized upon the placement of inventory into consignment as we retain title and maintain the inventory on the balance sheet; however, it is recognized upon implantation and receipt of proper purchase order and/or purchase requisition documentation. Pricing for products is predetermined by contracts with customers, agents acting on behalf of customer groups or by government regulatory bodies, depending on the market. Price discounts under group purchasing contracts are linked to volume of implant purchases by customer healthcare institutions within a specified group. At negotiated thresholds within a contract buying period, price discounts may increase.
At certain locations we record a contractual allowance that is offset against revenue for each sale to a non-contracted payor so that revenue is recorded at the estimated determinable price at the time of the sale. Those non-contracted payors and insurance companies in some cases do not have contracted rates for products sold, but may have pricing available for certain products through their respective web sites. We will invoice at its list price and establish the contractual allowance to estimate what the non-contracted payor will settle the claim for based on the information available as noted above. At certain locations, revenue is recognized on sales to stocking distributors, healthcare dealers, dental practices and dental laboratories when title to product passes to them, generally upon shipment. Certain subsidiaries allow customers to return product in the event that we terminate the relationship. Under those circumstances, we record an estimated sales return in the period in which constructive notice of termination is given to a distributor. Product returns were not significant for any period presented.
We also maintain a separate allowance for doubtful accounts for estimated losses based on our assessment of the collectability of specific customer accounts and the aging of the accounts receivable. We analyze accounts receivable and historical bad debts, customer concentrations, customer solvency, current economic and geographic trends, and changes in customer payment terms and practices when evaluating the adequacy of our current and future allowance. In circumstances where we are aware of a specific customer’s inability to meet its financial obligations, a specific allowance for bad debt is estimated and recorded, which reduces the recognized receivable to the estimated amount we believe will ultimately be collected. We monitor and analyze the accuracy of the allowance for doubtful accounts estimate by reviewing past collectability and adjust it for future expectations to determine the adequacy of our current and future allowance. Our reserve levels have generally been sufficient to cover credit losses.
Excess and Obsolete Inventory
In our industry, inventory is routinely placed at hospitals to provide the healthcare provider with the appropriate product when needed. Because product usage tends to follow a bell curve, larger and smaller sizes of inventory are provided, but infrequently used. In addition, the musculoskeletal market is highly competitive, with new products, raw materials and procedures being introduced continually, which may make those products currently on the market obsolete. We make estimates regarding the future use of these products and provide a provision for excess and obsolete inventory. If actual product life cycles, product demand or market conditions are less favorable than those projected by management, additional inventory write-downs may be required which would affect future operating results.
Goodwill and Other Intangible Assets
During the fourth quarter of fiscal 2011, we recorded a $941.4 million goodwill and definite and indefinite-lived intangible asset impairment charge primarily associated with our Europe reporting unit. As of February 28, 2011, we concluded that certain indicators were present that suggested impairment may exist for our Europe reporting unit’s goodwill and intangibles. The indicators of potential impairment in our Europe reporting unit included:
| • | recent reductions in revenue growth rates for the reporting unit’s knee and hip products; |
71
Table of Contents
| • | recent market pressure resulting in reduced average selling prices of the reporting unit’s products; |
| • | evidence of declining industry market growth rates for many countries; and |
| • | certain European governments actively pursuing healthcare spend restructuring programs. |
The impact of these recent items resulted in management initiating an interim preliminary impairment test as of February 28, 2011. However, the preliminary result of this interim test of impairment for the Europe reporting unit’s goodwill and intangibles was inconclusive. We finalized impairment tests during the fourth quarter of fiscal 2011.
We used only the income approach, specifically the discounted cash flow method, to determine the fair value of the Europe reporting unit and related intangible assets and the amount of the impairment charges. This approach calculates fair value by estimating the after-tax cash flows attributable to a reporting unit and then discounting these after-tax cash flows to a present value using a risk-adjusted discount rate. This methodology is consistent with how we estimate the fair value of our reporting units during our annual goodwill and definite lived intangible asset impairment tests. In applying the income approach to calculate the fair value of the Europe reporting unit, we used assumptions about future revenue contributions and cost structures. In addition, the application of the income approach for both goodwill and intangibles requires judgment in determining a risk-adjusted discount rate at the reporting unit level. We based this determination on estimates of weighted-average costs of capital of market participants. We performed a peer company analysis and considered the industry weighted-average return on debt and equity from a market participant perspective. A key factor contributing to the impairment charges in the Europe reporting unit was a change in expected market demand relative to the original assumptions at the time of the Merger.
To calculate the amount of the impairment charge related to the Europe reporting unit, we allocated the reporting unit’s fair value to all of its assets and liabilities, including certain unrecognized intangible assets, in order to determine the implied fair value of goodwill. This allocation process required judgment and the use of additional valuation assumptions in deriving the individual fair values of our Europe reporting unit’s assets and liabilities as if the reporting unit had been acquired in a business combination.
We also performed our annual assessment for impairment as of March 31, 2011 for all eight reporting units. We utilized discount rates of 10.0% to 11.0%. Based on the discount rate used in our most recent test for impairment, if the discount rate increased by 1% the fair value of the consolidated company could be lower by approximately $1.3 billion and a decrease in the discount rate of 1% results in an increase in fair value of $1.7 billion. The step one test also includes assumptions derived from competitor market capitalization and beta values as the twenty year Treasury bill rate as of March 31, 2011. All eight reporting units passed step one of the impairment tests for both goodwill and other intangibles on March 31, 2011; therefore it was not necessary to perform step two analyses.
The estimates and assumptions underlying the fair value calculations used in our annual impairment tests are uncertain by their nature and can vary significantly from actual results. Factors that management must estimate include, but are not limited to, industry and market conditions, sales volume and pricing, raw material costs, capital expenditures, working capital changes, cost of capital, and tax rates. These factors are especially difficult to predict when global financial markets are volatile. The estimates and assumptions used in our impairment tests are consistent with those we use in our internal planning. These estimates and assumptions may change from period to period. If we use different estimates and assumptions in the future, future impairment charges may occur and could be material.
We have identified a total of four reporting units with a material amount of goodwill that are at a higher risk of potential failure of step one of the goodwill impairment test in the future. These reporting units include our U.S. Orthopedic reporting unit ($2,750.6 million of goodwill), our International reporting unit ($568.3 million of goodwill), our Dental Reconstruction reporting unit ($443.0 million of goodwill), and our Europe reporting unit ($257.7 million). The level of excess fair value over carrying value for these higher risk reporting units were each less than 10% for the latest step one impairment test.
72
Table of Contents
Other Loss Contingencies
We accrue anticipated costs of settlement, damages, and loss of product liability claims based on historical experience or to the extent specific losses are probable and estimable. If the estimate of a probable loss is in a range and no amount within the range is more likely, we accrue the minimum amount of the range. Such estimates and any subsequent changes in estimates may result in adjustments to our operating results in the future. We have self-insured reserves against product liability claims with insurance coverage above the retention limits. There are various other claims, lawsuits and disputes with third parties, investigations and pending actions involving various allegations against it. Product liability claims are routinely reviewed by our insurance carriers and management routinely reviews all claims for purposes of establishing ultimate loss estimates.
Income Taxes
We record income tax estimates in accordance with guidance issued by the Financial Accounting Standards Board (“FASB”), however, there are inherent risks that could create uncertainties related to the estimates. We adjust estimates based on normal operating circumstances and conclusions related to tax audits. While we do not believe any audit finding could materially affect our financial position, there could be a material impact on our consolidated results of operations and cash flows of a given period.
Our operations are subject to the tax laws, regulations and administrative practices of the United States, U.S. state jurisdictions and other countries in which we do business. We must make estimates and judgments in determining the provision for taxes for financial statement purposes. These estimates and judgments occur in the calculation of tax credits, benefits, and deductions, and in the calculation of certain tax assets and liabilities that arise from differences in the timing of recognition of revenue and expense for tax and financial statement purposes, as well as the interest and penalties related to uncertain tax positions. Significant changes in these estimates may result in an increase or decrease to our tax provision in a subsequent period.
The calculation of our tax liabilities involves dealing with uncertainties in the application of complex tax regulations. We recognize liabilities for uncertain tax benefits (“UTBs”) based on a two-step process. We recognize the tax benefit from an UTB only if it is more likely than not that the tax position will be sustained on examination by the taxing authorities based on the technical merits of the position. The amount of UTBs is measured as appropriate for changes in facts and circumstances, such as significant amendments to existing tax law, new regulations or interpretations by the taxing authorities, new information obtained during a tax examination, or resolution of an examination. We believe our estimates for UTBs are appropriate and sufficient for any assessments that may result from examinations of our tax returns. We recognize both accrued interest and penalties, where appropriate, related to UTBs as a component of income tax expense.
Certain items are included in our tax return at different times than they are reflected in our financial statements. Such timing differences create deferred tax assets and liabilities. Deferred tax assets are generally items that can be used as a tax deduction or credit in the tax return in future years but for which we have already recorded the tax benefit in the financial statements. We have recorded valuation allowances against certain of our deferred tax assets, primarily those that have been generated from net operating losses and tax credit carryforwards in certain taxing jurisdictions. In evaluating whether we would more likely than not recover these deferred tax assets, we have not assumed any future taxable income or tax planning strategies in the jurisdictions associated with these carryforwards where history does not support such an assumption. Implementation of tax planning strategies to recover these deferred tax assets or future income generation in these jurisdictions could lead to the reversal of these valuation allowances and a reduction of income tax expense. Deferred tax liabilities are either: (i) a tax expense recognized in the financial statements for which payment has been deferred; or (ii) an expense for which we have already taken a deduction on the tax return, but have not yet recognized the expense in the financial statements.
As of May 31, 2011, we have not made a provision for U.S. or additional foreign taxes on the excess of the amount for financial reporting over the tax basis of investments in foreign subsidiaries. It is our practice and
73
Table of Contents
intention to permanently reinvest a substantial portion of the earnings of our non-U.S. subsidiaries in non-US operations. It is not practicable to estimate the amount of deferred tax liability related to these permanently reinvested earnings. We have analyzed the implications of repatriating any earnings which are not permanently reinvested and determined that there should be no U.S. or additional foreign tax cost associated with these distributions under current tax law. If future events, including material changes in estimates of cash, working capital and long-term investment requirements necessitate repatriation of portions of the earnings currently treated as permanently reinvested, under current tax laws an additional tax provision may be required which could have a material effect on our financial results.
| Item 7A. | Quantitative and Qualitative Disclosures About Market Risk. |
In the normal course of business, our operations are exposed to fluctuations in interest rates and foreign currencies. These fluctuations can vary the cost of financing, investment yields and our operations.
Interest Rate Risk
Our principal exposure to interest rate risk arises from variable rates associated with our credit facilities and we periodically enter into interest rate swap agreements to manage our exposure to these fluctuations. For a description of these facilities, refer to Note 8 to the consolidated financial statements included in this annual report.
During August 2007 and March 2008, we entered into a series of interest rate swap agreements with an aggregate notional amount of $1,890.0 million to fix the interest rates on a portion of the borrowings under the $2,340.0 million U.S. dollar-denominated term loan facility and we entered into a series of interest rate swap agreements with an aggregate notional amount of €635.0 million to fix the interest rates on a portion of the borrowings under the €875.0 million (approximately $1,207.4 million at September 25, 2007) euro-denominated term loan facility. During December 2008 and February 2009, we entered into two additional interest rate swap agreements with a total notional amount of $520.0 million to fix the interest rates on a portion of the borrowings under the $2,340.0 million U.S. dollar-denominated term loan facility. As of May 31, 2011, the fair value of the interest rate swap agreements relating to our U.S. dollar-denominated term loan facility was a $78.3 million net unrealized loss, and the fair value of the interest rate swap agreements relating to our euro-denominated term loan facility was a €13.4 million (approximately $19.1 million) net unrealized loss. Net of our $0.6 million credit valuation adjustment, we have a liability of $96.8 million.
Our trading securities are invested in equity securities. Our non-trading investments, excluding cash and cash equivalents, are equity securities, Greek bonds and a time deposit. These financial instruments are subject to market risk in that changes in interest rates would impact the market value of such investments.
Based on our overall interest rate exposure at May 31, 2011, including variable rate debt, a hypothetical 10% increase or decrease in interest rates applied to the fair value of the financial instruments discussed above as of May 31, 2011 would cause a $4.8 million increase in or savings in interest expense.
Foreign Currency Risk
Certain assets, liabilities and forecasted transactions are exposed to foreign currency risk, primarily the fluctuation of the U.S. dollar against European currencies. We face transactional currency exposures that arise when our foreign subsidiaries (or the Company itself) enter into transactions, primarily on an intercompany basis, denominated in currencies other than their local currency. We also face currency exposure that arises from translating the results of our global operations to the U.S. dollar at exchange rates that have fluctuated from the beginning of the period. We have hedged a portion of our net investment in our European subsidiaries with the issuance of €875.0 million (approximately $1,207.4 million at September 25, 2007) principal amount euro term loan on September 25, 2007. Our net investment in our European subsidiaries at the hedging date of September 25, 2007 was $1,690.0 million (€1,238.0 million). As of May 31, 2011, our net investment in
74
Table of Contents
European subsidiaries totaled €1,789.2 million ($2,555.6 million) and the outstanding principal balance of the euro term loan was €844.4 million ($1,206.3 million). The difference of €944.8 million ($1,349.3 million) remained unhedged as of May 31, 2011. Hedge effectiveness is tested quarterly to determine whether hedge treatment is still appropriate. We test effectiveness on this net investment hedge by determining if the net investment in our European subsidiaries is greater than the outstanding euro-denominated debt balance. Any amount under hedges determined to be ineffective is recorded as other (income) expense in the consolidated statement of operations.
Based on our overall exposure for foreign currency at May 31, 2011, a hypothetical 10% change up or down in foreign currency rates would have a $6.9 million effect on interest expense. We do not consider this effect material to our consolidated financial position, results of operations or cash flows.
Price Risk
We regularly purchase raw material commodities such as cobalt chromium, titanium, stainless steel, polyethylene powder and sterile packaging. We generally enter into 12 to 24 month term supply contracts, when possible, on these commodities to alleviate the effect of market fluctuation in prices. As part of our risk management program, we perform sensitivity analyses on potential commodity price changes. A 10% change across all of these commodities would not have a material effect on our consolidated financial position, results of operations or cash flows.
75
Table of Contents
| Item 8. | Financial Statements and Supplementary Data |
BIOMET, INC.
| Index |
Page Number |
|||
| Consolidated Financial Statements: |
||||
| 77 | ||||
| 78 | ||||
| Consolidated Statements of Operations for the years ended May 31, 2011, 2010 and 2009 |
79 | |||
| Consolidated Statements of Shareholder’s Equity for the years ended May 31, 2011, 2010 and 2009 |
80 | |||
| Consolidated Statements of Cash Flows for the years ended May 31, 2011, 2010, and 2009 |
81 | |||
| 82 | ||||
| 121 | ||||
| 121 | ||||
Schedules other than those listed above are omitted because they are not applicable or the required information is shown in the financial statements or notes thereto.
76
Table of Contents
Report of Independent Registered Public Accounting Firm
To the Board of Directors and Shareholder of Biomet, Inc.
Warsaw, Indiana
We have audited the consolidated balance sheets of Biomet, Inc. and subsidiaries (“Biomet”) as of May 31, 2011 and 2010, and the related consolidated statements of income, shareholder’s equity, and cash flows for each of the three years in the period ended May 31, 2011. Our audit also included the financial statement schedule listed in the Index at Item 15. These consolidated financial statements and financial statement schedule are the responsibility of the Company’s management. Our responsibility is to express an opinion on the consolidated financial statements and financial statement schedule based on our audits.
We conducted our audits in accordance with the standards of the Public Company Accounting Oversight Board (United States). Those standards require that we plan and perform the audit to obtain reasonable assurance about whether the financial statements are free of material misstatement. The Company is not required to have, nor were we engaged to perform, an audit of its internal control over financial reporting. Our audits included consideration of internal control over financial reporting as a basis for designing audit procedures that are appropriate in the circumstances, but not for the purpose of expressing an opinion on the effectiveness of the Company’s internal control over financial reporting. Accordingly, we express no such opinion. An audit also includes examining, on a test basis, evidence supporting the amounts and disclosures in the financial statements, assessing the accounting principles used and significant estimates made by management, as well as evaluating the overall financial statement presentation. We believe that our audits provide a reasonable basis for our opinion.
In our opinion, the consolidated financial statements present fairly, in all material respects, the financial position of Biomet, Inc. and subsidiaries as of May 31, 2011 and 2010, and the results of their operations and their cash flows for each of the three years ended May 31, 2011, in conformity with accounting principles generally accepted in the United States of America. Also, in our opinion, such financial statement schedule, when considered in relation to the basic consolidated financial statements taken as a whole, presents fairly in all material respects the information set forth therein.
/s/ DELOITTE & TOUCHE LLP
Indianapolis, Indiana
August 12, 2011
77
Table of Contents
Biomet, Inc. and Subsidiaries Consolidated Balance Sheets.
(in millions)
| May 31, 2011 | May 31, 2010 | |||||||
| Assets |
||||||||
| Current assets: |
||||||||
| Cash and cash equivalents |
$ | 327.8 | $ | 189.1 | ||||
| Accounts receivable, less allowance for doubtful receivables of $38.2 ($40.6 in 2010) |
480.1 | 452.5 | ||||||
| Investments |
41.4 | — | ||||||
| Income tax receivable |
5.4 | 19.2 | ||||||
| Inventories, net |
582.5 | 507.3 | ||||||
| Deferred income taxes |
71.5 | 64.3 | ||||||
| Prepaid expenses and other |
109.7 | 72.6 | ||||||
|
|
|
|
|
|||||
| Total current assets |
1,618.4 | 1,305.0 | ||||||
| Property, plant and equipment, net |
638.4 | 622.0 | ||||||
| Investments |
33.1 | 23.3 | ||||||
| Intangible assets, net |
4,534.4 | 5,190.3 | ||||||
| Goodwill |
4,470.1 | 4,707.5 | ||||||
| Other assets |
62.6 | 120.9 | ||||||
|
|
|
|
|
|||||
| Total assets |
$ | 11,357.0 | $ | 11,969.0 | ||||
|
|
|
|
|
|||||
| Liabilities & Shareholder’s Equity |
||||||||
| Current liabilities: |
||||||||
| Current portion long-term debt |
$ | 37.4 | $ | 35.6 | ||||
| Accounts payable |
91.1 | 86.3 | ||||||
| Accrued interest |
64.1 | 70.2 | ||||||
| Accrued wages and commissions |
105.0 | 111.3 | ||||||
| Other accrued expenses |
241.8 | 215.1 | ||||||
|
|
|
|
|
|||||
| Total current liabilities |
539.4 | 518.5 | ||||||
| Long-term liabilities: |
||||||||
| Long-term debt, net of current portion |
5,982.9 | 5,860.9 | ||||||
| Deferred income taxes |
1,487.6 | 1,674.9 | ||||||
| Other long-term liabilities |
172.0 | 181.2 | ||||||
|
|
|
|
|
|||||
| Total liabilities |
8,181.9 | 8,235.5 | ||||||
| Commitments and contingencies |
— | — | ||||||
| Shareholder’s equity: |
||||||||
| Contributed and additional paid-in capital |
5,614.1 | 5,605.1 | ||||||
| Accumulated deficit |
(2,610.8 | ) | (1,761.0 | ) | ||||
| Accumulated other comprehensive income (loss) |
171.8 | (110.6 | ) | |||||
|
|
|
|
|
|||||
| Total shareholder’s equity |
3,175.1 | 3,733.5 | ||||||
|
|
|
|
|
|||||
| Total liabilities and shareholder’s equity |
$ | 11,357.0 | $ | 11,969.0 | ||||
|
|
|
|
|
|||||
The accompanying notes are an integral part of the consolidated financial statements.
78
Table of Contents
Biomet, Inc. and Subsidiaries Consolidated Statements of Operations.
(in millions)
| For the Year Ended May 31, | ||||||||||||
| 2011 | 2010 | 2009 | ||||||||||
| Net sales |
$ | 2,732.2 | $ | 2,698.0 | $ | 2,504.1 | ||||||
| Cost of sales |
838.7 | 819.9 | 828.4 | |||||||||
|
|
|
|
|
|
|
|||||||
| Gross profit |
1,893.5 | 1,878.1 | 1,675.7 | |||||||||
| Selling, general and administrative expense |
1,041.7 | 1,042.3 | 1,003.6 | |||||||||
| Research and development expense |
119.4 | 106.6 | 93.5 | |||||||||
| Amortization |
367.9 | 372.6 | 375.8 | |||||||||
| Goodwill and intangible assets impairment charge |
941.4 | — | 551.1 | |||||||||
|
|
|
|
|
|
|
|||||||
| Operating income (loss) |
(576.9 | ) | 356.6 | (348.3 | ) | |||||||
| Interest expense |
498.9 | 516.4 | 550.3 | |||||||||
| Other (income) expense |
(11.2 | ) | (18.1 | ) | 21.8 | |||||||
|
|
|
|
|
|
|
|||||||
| Other expense, net |
487.7 | 498.3 | 572.1 | |||||||||
|
|
|
|
|
|
|
|||||||
| Loss before income taxes |
(1,064.6 | ) | (141.7 | ) | (920.4 | ) | ||||||
| Benefit from income taxes |
(214.8 | ) | (94.1 | ) | (171.2 | ) | ||||||
|
|
|
|
|
|
|
|||||||
| Net loss |
$ | (849.8 | ) | $ | (47.6 | ) | $ | (749.2 | ) | |||
|
|
|
|
|
|
|
|||||||
The accompanying notes are an integral part of the consolidated financial statements.
79
Table of Contents
Biomet, Inc. and Subsidiaries Consolidated Statements of Shareholder’s Equity.
(in millions)
| Common Shares |
Contributed and Additional Paid-in Capital |
Accumulated Deficit |
Accumulated Other Comprehensive Income (Loss) |
Total Shareholder’s Equity |
||||||||||||||||
| Balance at May 31, 2008 |
1,000 | $ | 5,547.7 | $ | (964.2 | ) | $ | 252.8 | $ | 4,836.3 | ||||||||||
| Net loss |
— | (749.2 | ) | — | (749.2 | ) | ||||||||||||||
| Reclassification of impairment loss |
— | — | 4.0 | 4.0 | ||||||||||||||||
| Interest rate swap unrealized loss, net of ($50.1) tax effect |
— | — | (79.1 | ) | (79.1 | ) | ||||||||||||||
| Foreign currency related losses |
— | — | (199.2 | ) | (199.2 | ) | ||||||||||||||
| Other accumulated other comprehensive loss |
— | — | (9.2 | ) | (9.2 | ) | ||||||||||||||
|
|
|
|||||||||||||||||||
| Comprehensive loss |
— | — | — | (1,032.7 | ) | |||||||||||||||
|
|
|
|||||||||||||||||||
| Stock-based compensation expense |
33.9 | — | — | 33.9 | ||||||||||||||||
| Repurchase of LVB Acquisition, Inc. shares |
(0.9 | ) | — | — | (0.9 | ) | ||||||||||||||
| Contributed capital |
3.7 | — | — | 3.7 | ||||||||||||||||
|
|
|
|
|
|
|
|
|
|
|
|||||||||||
| Balance at May 31, 2009 |
1,000 | 5,584.4 | (1,713.4 | ) | (30.7 | ) | 3,840.3 | |||||||||||||
| Net loss |
— | (47.6 | ) | — | (47.6 | ) | ||||||||||||||
| Change in unrealized holding value on available for sale securities, net of $1.3 tax effect |
— | — | 1.8 | 1.8 | ||||||||||||||||
| Interest rate swap unrealized gain, net of $7.2 tax effect |
— | — | 11.3 | 11.3 | ||||||||||||||||
| Foreign currency related losses |
— | — | (96.5 | ) | (96.5 | ) | ||||||||||||||
| Unrecognized actuarial gain on pension assets, net of $2.9 tax effect |
— | — | 3.5 | 3.5 | ||||||||||||||||
|
|
|
|||||||||||||||||||
| Comprehensive loss |
— | — | — | (127.5 | ) | |||||||||||||||
|
|
|
|||||||||||||||||||
| Stock-based compensation expense |
22.4 | — | — | 22.4 | ||||||||||||||||
| Repurchase of LVB Acquisition, Inc. shares |
(1.7 | ) | — | — | (1.7 | ) | ||||||||||||||
|
|
|
|
|
|
|
|
|
|
|
|||||||||||
| Balance at May 31, 2010 |
1,000 | 5,605.1 | (1,761.0 | ) | (110.6 | ) | 3,733.5 | |||||||||||||
| Net loss |
— | (849.8 | ) | — | (849.8 | ) | ||||||||||||||
| Change in unrealized holding value on available for sale securities, net of ($0.9) tax effect |
— | — | (6.0 | ) | (6.0 | ) | ||||||||||||||
| Interest rate swap unrealized gain, net of $13.6 tax effect |
— | — | 19.5 | 19.5 | ||||||||||||||||
| Foreign currency related gains |
— | — | 264.4 | 264.4 | ||||||||||||||||
| Unrecognized actuarial gain on pension assets, net of $0.2 tax effect |
— | — | 4.5 | 4.5 | ||||||||||||||||
|
|
|
|||||||||||||||||||
| Comprehensive loss |
(567.4 | ) | ||||||||||||||||||
|
|
|
|||||||||||||||||||
| Stock-based compensation expense |
12.7 | — | — | 12.7 | ||||||||||||||||
| Repurchase of LVB Acquisition, Inc. shares |
(3.7 | ) | — | — | (3.7 | ) | ||||||||||||||
|
|
|
|
|
|
|
|
|
|
|
|||||||||||
| Balance at May 31, 2011 |
1,000 | $ | 5,614.1 | $ | (2,610.8 | ) | $ | 171.8 | $ | 3,175.1 | ||||||||||
|
|
|
|
|
|
|
|
|
|
|
|||||||||||
The accompanying notes are an integral part of the consolidated financial statements.
80
Table of Contents
Biomet, Inc. and Subsidiaries Consolidated Statements of Cash Flows.
(in millions)
| For the Year Ended May 31, | ||||||||||||
| 2011 | 2010 | 2009 | ||||||||||
| Cash flows provided by (used in) operating activities: |
||||||||||||
| Net loss |
$ | (849.8 | ) | $ | (47.6 | ) | $ | (749.2 | ) | |||
| Adjustments to reconcile net loss to net cash provided by operating activities: |
||||||||||||
| Depreciation and amortization |
549.0 | 547.6 | 537.7 | |||||||||
| Amortization of deferred financing costs |
11.2 | 11.3 | 11.3 | |||||||||
| Stock-based compensation expense |
12.7 | 22.4 | 33.9 | |||||||||
| Recovery of doubtful accounts receivable |
(6.2 | ) | (7.0 | ) | (10.5 | ) | ||||||
| Loss (gain) on sale of investments |
(4.9 | ) | (4.3 | ) | 14.6 | |||||||
| Goodwill and intangible assets impairment charge |
941.4 | — | 551.1 | |||||||||
| Property, plant and equipment impairment charge |
17.0 | 7.8 | — | |||||||||
| Provision for inventory obsolescence |
5.7 | (2.1 | ) | 9.9 | ||||||||
| Deferred income taxes |
(271.3 | ) | (120.1 | ) | (224.7 | ) | ||||||
| Loss on extinguishment of debt |
1.2 | — | — | |||||||||
| Other |
(28.0 | ) | 2.7 | 4.0 | ||||||||
| Changes in operating assets and liabilities: |
||||||||||||
| Accounts receivable |
14.5 | (5.6 | ) | (38.8 | ) | |||||||
| Inventories |
(49.6 | ) | (27.3 | ) | (27.9 | ) | ||||||
| Prepaid expenses |
(4.5 | ) | 6.2 | 3.1 | ||||||||
| Accounts payable |
(0.8 | ) | (9.5 | ) | 19.6 | |||||||
| Income taxes |
46.0 | 9.0 | 39.4 | |||||||||
| Accrued interest |
(6.1 | ) | (2.9 | ) | (7.8 | ) | ||||||
| Accrued expenses and other |
2.6 | (59.1 | ) | 78.1 | ||||||||
|
|
|
|
|
|
|
|||||||
| Net cash provided by operating activities |
380.1 | 321.5 | 243.8 | |||||||||
| Cash flows provided by (used in) investing activities: |
||||||||||||
| Proceeds from sales/maturities of investments |
59.3 | 24.9 | 3.1 | |||||||||
| Purchases of investments |
(78.7 | ) | (13.3 | ) | — | |||||||
| Net proceeds from sale of property and equipment |
6.8 | 3.0 | — | |||||||||
| Capital expenditures |
(174.0 | ) | (186.4 | ) | (185.0 | ) | ||||||
| Acquisitions, net of cash acquired |
(18.4 | ) | (10.2 | ) | (13.0 | ) | ||||||
|
|
|
|
|
|
|
|||||||
| Net cash used in investing activities |
(205.0 | ) | (182.0 | ) | (194.9 | ) | ||||||
| Cash flows provided by (used in) financing activities: |
||||||||||||
| Debt: |
||||||||||||
| Proceeds under European facilities |
0.3 | — | — | |||||||||
| Payments under European facilities |
(2.0 | ) | — | — | ||||||||
| Proceeds under revolving credit agreements |
— | 20.4 | 213.6 | |||||||||
| Payments under revolving credit agreements |
— | (134.1 | ) | (138.2 | ) | |||||||
| Payments under senior secured credit facilities |
(34.8 | ) | (35.8 | ) | (35.7 | ) | ||||||
| Repurchases of senior notes |
(11.2 | ) | (8.7 | ) | — | |||||||
| Equity: |
||||||||||||
| Capital contributions |
— | — | 3.7 | |||||||||
| Repurchase of LVB Acquisition, Inc. shares |
(3.7 | ) | (1.7 | ) | (0.9 | ) | ||||||
|
|
|
|
|
|
|
|||||||
| Net cash provided by (used in) financing activities |
(51.4 | ) | (159.9 | ) | 42.5 | |||||||
| Effect of exchange rate changes on cash |
15.0 | (6.1 | ) | (3.4 | ) | |||||||
|
|
|
|
|
|
|
|||||||
| Increase (decrease) in cash and cash equivalents |
138.7 | (26.5 | ) | 88.0 | ||||||||
| Cash and cash equivalents, beginning of period |
189.1 | 215.6 | 127.6 | |||||||||
|
|
|
|
|
|
|
|||||||
| Cash and cash equivalents, end of period |
$ | 327.8 | $ | 189.1 | $ | 215.6 | ||||||
|
|
|
|
|
|
|
|||||||
| Supplemental disclosures of cash flow information: |
||||||||||||
| Cash paid during the period for: |
||||||||||||
| Interest |
$ | 494.1 | $ | 508.6 | $ | 543.8 | ||||||
|
|
|
|
|
|
|
|||||||
| Income taxes |
$ | 42.3 | $ | 29.3 | $ | 12.1 | ||||||
|
|
|
|
|
|
|
|||||||
The accompanying notes are an integral part of the consolidated financial statements.
81
Table of Contents
Biomet, Inc. and Subsidiaries Notes to Consolidated Financial Statements
Note 1—Summary of Significant Accounting Policies and Nature of Operations.
General—The Company is one of the largest orthopedic medical device companies in the United States and worldwide with operations in over 50 locations throughout the world and distribution in approximately 90 countries. The Company designs, manufactures and markets a comprehensive range of both surgical and non-surgical products used primarily by orthopedic surgeons and other musculoskeletal medical specialists. For over 30 years, the Company has applied advanced engineering and manufacturing technology to the development of highly durable joint replacement systems.
Basis of Presentation—The accompanying consolidated financial statements include the accounts of Biomet, Inc. and its subsidiaries (individually and collectively referred to as “Biomet” or the “Company”). The consolidated financial statements have been prepared in accordance with accounting principles generally accepted in the United States of America.
Products—The Company operates in one reportable business segment, musculoskeletal products, which includes the design, manufacture and marketing of products in four major categories: reconstructive products, fixation devices, spinal products and other products. The Company has three reportable geographic segments: United States, Europe and International.
Reconstructive—Orthopedic reconstructive implants are used to replace joints that have deteriorated as a result of disease (principally osteoarthritis) or injury. Reconstructive joint surgery involves the modification of the area surrounding the affected joint and the implantation of one or more manufactured components, and may involve the use of bone cement. The Company’s primary orthopedic reconstructive joints are knees, hips and shoulders, but the Company manufactures other joints as well. The Company also produces the associated instruments required by orthopedic surgeons to implant the Company’s reconstructive products, as well as bone cements and cement delivery systems. In addition, dental reconstructive devices and associated instrumentation are used for oral rehabilitation through the replacement of teeth and repair of hard and soft tissues.
Fixation—Fixation devices are used for setting and stabilizing damaged bones to support and/or augment the body’s natural healing process. Electrical stimulation devices used in trauma indications offer implantable and non-invasive options to stimulate bone growth. Other products include internal fixation devices (such as nails, plates, screws, pins and wires used to stabilize traumatic bone injuries), external fixation devices (used to stabilize fractures when alternative methods of fixation are not suitable), craniomaxillofacial fixation systems and bone substitute materials.
Spinal—The Company’s spinal products include electrical stimulation devices for spinal applications, spinal fixation systems for cervical, thoracolumbar deformity correction and spacer applications, and bone substitute materials, as well as allograft services for spinal applications.
Other—The Company manufactures and distributes a number of other products, including sports medicine products (used in minimally-invasive orthopedic surgical procedures), orthopedic support products (also referred to as softgoods and bracing products), operating room supplies, casting materials, general surgical instruments, wound care products and other surgical products.
Effect of Foreign Currency—Assets and liabilities of foreign subsidiaries are translated at rates of exchange in effect at the close of their calendar month end. Revenues and expenses are translated at the average exchange rates during the period. Translation gains and losses are accumulated within accumulated other comprehensive income (loss) as a separate component of shareholder’s equity. Foreign currency transaction gains and losses are included in other (income) expense.
Cash and Cash Equivalents—The Company considers all investments that are highly liquid at the date acquired and have original maturities of three months or less to be cash equivalents.
82
Table of Contents
Biomet, Inc. and Subsidiaries Notes to Consolidated Financial Statements (continued)
Note 1—Summary of Significant Accounting Policies and Nature of Operations, Continued.
Investments—The Company invests the majority of its excess cash in time deposits and money market funds. The Company also holds Greek bonds, corporate securities, and common stocks. The Company accounts for its investments in debt and equity securities in accordance with guidance issued by the FASB, which requires certain securities to be categorized as trading, available-for-sale or held-to-maturity. The Company also accounts for its investments under guidance for fair value measurements, which establishes a framework for measuring fair value, clarifies the definition of fair value within that framework, and expands disclosures about fair value measurements. Available-for-sale securities are carried at fair value with unrealized gains and losses, net of tax, recorded within accumulated other comprehensive income (loss) as a separate component of shareholder’s equity. The Company has no held-to-maturity investments. Trading securities are carried at fair value with the realized gains and losses, recorded within other (income) expense. The cost of investment securities sold is determined by the specific identification method. Dividend and interest income are accrued as earned. The Company reviews its investments quarterly for declines in fair value that are other-than-temporary. Investments that have declined in market value that are determined to be other-than-temporary are charged to other (income) expense, by writing that investment down to fair value. Investments are classified as short-term for those expected to mature or be sold within twelve months and the remaining portion is classified in long-term investments.
Interest Rate Instruments—The Company uses interest rate swap agreements (cash flow hedges) in both U.S. dollars and euros as a means of fixing the interest rate on portions of its floating-rate debt instruments. As of May 31, 2011, the Company had a swap liability of $96.8 million, which consisted of $62.6 million short-term, and $34.8 million long-term, partially offset by a $0.6 million credit valuation adjustment.
Other Comprehensive Income (Loss)—Other comprehensive income (loss) includes net loss, currency translation adjustments, certain derivative-related activity, changes in the value of available-for-sale investments, and changes in prior service cost from pension plans. The Company generally deems its foreign investments to be permanent in nature and does not provide for taxes on currency translation adjustments arising from translating the investment in a foreign currency to U.S. dollars. When the Company determines that a foreign investment is no longer permanent in nature, estimated taxes are provided for the related deferred tax liability (asset), if any, resulting from currency translation adjustments. As of May 31, 2011, foreign investments were all permanent in nature.
Concentrations of Credit Risk and Allowance for Doubtful Receivables—The Company provides credit, in the normal course of business, to hospitals, private and governmental institutions and healthcare agencies, insurance providers, dental practices and laboratories, and physicians. The Company maintains an allowance for doubtful receivables based on estimated collection rates and charges actual losses to the allowance when incurred. The determination of estimated collection rates requires management judgment.
Other Loss Contingencies—In accordance with guidance issued by the FASB for contingencies, the Company accrues anticipated costs of settlement, damages, and loss of product liability claims based on historical experience or to the extent specific losses are probable and estimable. If the estimate of a probable loss is in a range and no amount within the range is more likely, the Company accrues the minimum amount of the range. Such estimates and any subsequent changes in estimates may result in adjustments to the Company’s operating results in the future. The Company has self-insured reserves against product liability claims with insurance coverage above the retention limits. There are various other claims, lawsuits and disputes with third parties, investigations and pending actions involving various allegations against it. Product liability claims are routinely reviewed by the Company’s insurance carriers and management routinely reviews all claims for purposes of establishing ultimate loss estimates.
Revenue Recognition—The Company sells product through four principal channels: (1) direct to healthcare institutions, referred to as direct channel accounts, (2) through stocking distributors and healthcare dealers, (3) indirectly through insurance companies and (4) directly to dental practices and dental laboratories. Sales
83
Table of Contents
Biomet, Inc. and Subsidiaries Notes to Consolidated Financial Statements (continued)
Note 1—Summary of Significant Accounting Policies and Nature of Operations, Continued.
through the direct and distributor/dealer channels account for a majority of net sales. Through these channels, inventory is consigned to sales agents or customers so that products are available when needed for surgical procedures. Revenue is not recognized upon the placement of inventory into consignment as the Company retains title and maintains the inventory on the balance sheet; however, it is recognized upon implantation and receipt of proper purchase order and/or purchase requisition documentation. Pricing for products is predetermined by contracts with customers, agents acting on behalf of customer groups or by government regulatory bodies, depending on the market. Price discounts under group purchasing contracts are linked to volume of implant purchases by customer healthcare institutions within a specified group. At negotiated thresholds within a contract buying period, price discounts may increase.
At certain locations, the Company records a contractual allowance that is offset against revenue for each sale to a non-contracted payor so that revenue is recorded at the estimated determinable price at the time of the sale. Those non-contracted payors and insurance companies in some cases do not have contracted rates for products sold, but may have pricing available for certain products through their respective web sites. The Company will invoice at its list price and establish the contractual allowance to estimate what the non-contracted payor will settle the claim for based on the information available as noted above. At certain locations, revenue is recognized on sales to stocking distributors, healthcare dealers, dental practices and dental laboratories when title to product passes to them, generally upon shipment. Certain subsidiaries allow customers to return product in the event that the Company terminates the relationship. Under those circumstances, the Company records an estimated sales return in the period in which constructive notice of termination is given to a distributor. Product returns were not significant for any period presented.
The Company also maintains a separate allowance for doubtful accounts for estimated losses based on its assessment of the collectability of specific customer accounts and the aging of the accounts receivable. The Company analyzes accounts receivable and historical bad debts, customer concentrations, customer solvency, current economic and geographic trends, and changes in customer payment terms and practices when evaluating the adequacy of its current and future allowance. In circumstances where the Company is aware of a specific customer’s inability to meet its financial obligations, a specific allowance for bad debt is estimated and recorded, which reduces the recognized receivable to the estimated amount the Company believes will ultimately be collected. The Company monitors and analyzes the accuracy of the allowance for doubtful accounts estimate by reviewing past collectability and adjusts it for future expectations to determine the adequacy of the Company’s current and future allowance. The Company’s reserve levels have generally been sufficient to cover credit losses.
Excess and Obsolete Inventory—In the Company’s industry, inventory is routinely placed at hospitals to provide the healthcare provider with the appropriate product when needed. Because product usage tends to follow a bell curve, larger and smaller sizes of inventory are provided, but infrequently used. In addition, the musculoskeletal market is highly competitive, with new products, raw materials and procedures being introduced continually, which may make those products currently on the market obsolete. The Company makes estimates regarding the future use of these products and provides a provision for excess and obsolete inventory. If actual product life cycles, product demand or market conditions are less favorable than those projected by management, additional inventory write-downs may be required which would affect future operating results.
Accounting for Shipping and Handling Revenue, Fees and Costs—The Company classifies amounts billed for shipping and handling as a component of net sales. The related shipping and handling fees and costs are included in cost of sales.
Research and Development—Research and development costs are charged to expense as incurred.
Income Taxes—The Company records income tax estimates in accordance with guidance issued by the FASB; however, there are inherent risks that could create uncertainties related to the estimates. The Company
84
Table of Contents
Biomet, Inc. and Subsidiaries Notes to Consolidated Financial Statements (continued)
Note 1—Summary of Significant Accounting Policies and Nature of Operations, Continued.
adjusts estimates based on normal operating circumstances and conclusions related to tax audits. While the Company does not believe any audit finding could materially affect its financial position, there could be a material impact on its consolidated results of operations and cash flows of a given period.
The Company’s operations are subject to the tax laws, regulations and administrative practices of the United States, U.S. state jurisdictions and other countries in which it does business. The Company must make estimates and judgments in determining the provision for taxes for financial statement purposes. These estimates and judgments occur in the calculation of tax credits, benefits, and deductions, and in the calculation of certain tax assets and liabilities that arise from differences in the timing of recognition of revenue and expense for tax and financial statement purposes, as well as the interest and penalties related to uncertain tax positions. Significant changes in these estimates may result in an increase or decrease to the Company’s tax provision in a subsequent period.
The calculation of the Company’s tax liabilities involves dealing with uncertainties in the application of complex tax regulations. The Company recognizes liabilities for uncertain tax benefits (“UTBs”) based on a two-step process. The Company recognizes the tax benefit from an UTB only if it is more likely than not that the tax position will be sustained on examination by the taxing authorities based on the technical merits of the position. The amount of UTBs is measured as appropriate for changes in facts and circumstances, such as significant amendments to existing tax law, new regulations or interpretations by the taxing authorities, new information obtained during a tax examination, or resolution of an examination. The Company believes its estimates for UTBs are appropriate and sufficient for any assessments that may result from examinations of its tax returns. The Company recognizes both accrued interest and penalties, where appropriate, related to UTBs as a component of income tax expense.
Certain items are included in the Company’s tax return at different times than they are reflected in its financial statements. Such timing differences create deferred tax assets and liabilities. Deferred tax assets are generally items that can be used as a tax deduction or credit in the tax return in future years but for which the Company has already recorded the tax benefit in the financial statements. The Company has recorded valuation allowances against certain of its deferred tax assets, primarily those that have been generated from net operating losses and tax credit carryforwards in certain taxing jurisdictions. In evaluating whether the Company would more likely than not recover these deferred tax assets, it has not assumed any future taxable income or tax planning strategies in the jurisdictions associated with these carryforwards where history does not support such an assumption. Implementation of tax planning strategies to recover these deferred tax assets or future income generation in these jurisdictions could lead to the reversal of these valuation allowances and a reduction of income tax expense. Deferred tax liabilities are either: (i) a tax expense recognized in the financial statements for which payment has been deferred; or (ii) an expense for which the Company has already taken a deduction on the tax return, but have not yet recognized the expense in the financial statements.
As of May 31, 2011, the Company has not made a provision for U.S. or additional foreign taxes on the excess of the amount for financial reporting over the tax basis of investments in foreign subsidiaries. It is the Company’s practice and intention to permanently reinvest a substantial portion of the earnings of its non-U.S. subsidiaries in non-US operations. It is not practicable to estimate the amount of deferred tax liability related to these permanently reinvested earnings. The Company has analyzed the implications of repatriating any earnings which are not permanently reinvested and determined that there should be no U.S. or additional foreign tax cost associated with these distributions under current tax law. If future events, including material changes in estimates of cash, working capital and long-term investment requirements necessitate repatriation of portions of the earnings currently treated as permanently reinvested, under current tax laws an additional tax provision may be required which could have a material effect on the Company’s financial results.
85
Table of Contents
Biomet, Inc. and Subsidiaries Notes to Consolidated Financial Statements (continued)
Note 1—Summary of Significant Accounting Policies and Nature of Operations, Continued.
Goodwill and Other Intangible Assets—The Company tests its goodwill and indefinite lived intangible asset balances as of March 31 of each fiscal year for impairment. The Company tests these balances more frequently if indicators are present or changes in circumstances suggest that impairment may exist. In performing the test on goodwill, the Company utilizes the two-step approach prescribed under guidance issued by the FASB for goodwill and other intangible assets. The first step under this guidance requires a comparison of the carrying value of the reporting units, of which the Company has identified eight in total, to the fair value of these units. The Company generally uses the income approach to determine the fair value of each reporting unit. This approach calculates fair value by estimating the after-tax cash flows attributable to a reporting unit and then discounting these after-tax cash flows to a present value using a risk-adjusted discount rate. To derive the carrying value of the Company’s reporting units, the Company assigns assets and liabilities, including goodwill, to the reporting units. These would include corporate assets, which relate to a reporting unit’s operations, and would be considered in determining fair value. The Company allocates assets and liabilities not directly related to a specific reporting unit, but from which the reporting unit benefits, based primarily on the respective revenue contribution of each reporting unit. If the carrying value of a reporting unit exceeds its fair value, the Company performs the second step of the goodwill impairment test to measure the amount of impairment loss, if any.
The second step of the goodwill impairment test compares the implied fair value of a reporting unit’s goodwill to its carrying value. If the Company is unable to complete the second step of the test prior to the issuance of its financial statements and an impairment loss is probable and could be reasonably estimated, the Company recognizes its best estimate of the loss in its current period financial statements and discloses that amount as an estimate. The Company then recognizes any adjustment to that estimate in subsequent reporting periods, once the Company has finalized the second step of the impairment test.
The Company determines the fair value of indefinite lived intangible assets using an income based approach to determine the fair value. The approach calculates fair value by estimating the after-tax cash flows attributable to the asset and then discounting these after-tax cash flows to a present value using a risk-adjusted discount rate. The calculated fair value is compared to the carrying value to determine if any impairment exists.
If events or circumstances change, a determination is made by management to ascertain whether property and equipment and finite-lived intangibles have been impaired based on the sum of expected future undiscounted cash flows from operating activities. If the estimated undiscounted net cash flows are less than the carrying amount of such assets, an impairment loss is recognized in an amount necessary to write down the assets to fair value as determined from expected future discounted cash flows.
Management’s Estimates and Assumptions—In preparing the financial statements in accordance with accounting principles generally accepted in the United States of America, management must often make estimates and assumptions that affect the reported amounts of assets, liabilities, revenues, expenses and related disclosures at the date of the financial statements and during the reporting period. Some of those judgments can be subjective and complex. Consequently, actual results could differ from those estimates.
86
Table of Contents
Biomet, Inc. and Subsidiaries Notes to Consolidated Financial Statements (continued)
Note 2—Inventories.
Inventories are stated at the lower of cost or market, with cost determined under the first-in, first-out method. The Company reviews inventory on hand and writes down excess and slow-moving inventory based on an assessment of future demand and historical experience. Inventories consisted of the following:
| (in millions) | May 31, 2011 | May 31, 2010 | ||||||
| Raw materials |
$ | 85.0 | $ | 69.1 | ||||
| Work-in-process |
44.8 | 43.6 | ||||||
| Finished goods |
575.6 | 530.2 | ||||||
|
|
|
|
|
|||||
| Total gross inventories |
705.4 | 642.9 | ||||||
| Less: Reserves |
(122.9 | ) | (135.6 | ) | ||||
|
|
|
|
|
|||||
| Inventories, net |
$ | 582.5 | $ | 507.3 | ||||
|
|
|
|
|
|||||
Note 3—Property, Plant and Equipment.
Property, plant and equipment are carried at cost less accumulated depreciation. Depreciation is computed using the straight-line method over the estimated useful lives of 3 to 30 years. Depreciation on instruments is included within cost of sales. Related maintenance and repairs are expensed as incurred.
The Company reviews property, plant and equipment for impairment whenever events or changes in circumstances indicate that the carrying value of an asset may not be recoverable. An impairment loss would be recognized when estimated undiscounted future cash flows relating to the asset, or asset group, are less than its carrying amount, with the amount of the loss equal to the excess of carrying cost of the asset, or asset group, over the estimated fair value.
Property, plant and equipment consisted of the following:
| (in millions) | May 31, 2011 | May 31, 2010 | ||||||
| Land and land improvements |
$ | 43.5 | $ | 45.7 | ||||
| Buildings and leasehold improvements |
110.9 | 124.1 | ||||||
| Machinery and equipment |
328.6 | 283.3 | ||||||
| Instruments |
573.0 | 420.6 | ||||||
| Construction in progress |
30.8 | 29.4 | ||||||
|
|
|
|
|
|||||
| Total property, plant and equipment |
1,086.8 | 903.1 | ||||||
| Accumulated depreciation |
(448.4 | ) | (281.1 | ) | ||||
|
|
|
|
|
|||||
| Total property, plant and equipment, net |
$ | 638.4 | $ | 622.0 | ||||
|
|
|
|
|
|||||
The Company recorded a property, plant and equipment impairment charge of $17.0 million during the year ended May 31, 2011, relating to an administrative, manufacturing and distribution facility located in Parsippany, New Jersey. The amount of impairment charge recorded within cost of sales and selling, general and administrative expense was $6.5 million and $10.5 million, respectively. The impairment charge reflects the Company’s change in intended use of this facility.
87
Table of Contents
Biomet, Inc. and Subsidiaries Notes to Consolidated Financial Statements (continued)
Note 4—Investments.
At May 31, 2011, the Company’s investment securities were classified as follows:
| Amortized Cost | Unrealized | |||||||||||||||
| (in millions) | Gains | Losses | Fair Value |
|||||||||||||
| Available-for-sale: |
||||||||||||||||
| Equity securities |
$ | 0.5 | $ | 0.1 | $ | (0.2 | ) | $ | 0.4 | |||||||
| Money market funds |
9.5 | — | — | 9.5 | ||||||||||||
| Time deposit |
33.1 | — | — | 33.1 | ||||||||||||
| Greek bonds |
35.6 | — | (4.5 | ) | 31.1 | |||||||||||
| Other investments |
0.3 | — | — | 0.3 | ||||||||||||
|
|
|
|
|
|
|
|
|
|||||||||
| Total available-for-sale investments |
$ | 79.0 | $ | 0.1 | $ | (4.7 | ) | $ | 74.4 | |||||||
|
|
|
|
|
|
|
|
|
|||||||||
| Amortized Cost | Realized | |||||||||||||||
| Gains | Losses | Fair Value |
||||||||||||||
| Trading: |
||||||||||||||||
| Equity securities |
$ | 0.1 | $ | — | $ | — | $ | 0.1 | ||||||||
|
|
|
|
|
|
|
|
|
|||||||||
| Total trading investments |
$ | 0.1 | $ | — | $ | — | $ | 0.1 | ||||||||
|
|
|
|
|
|
|
|
|
|||||||||
At May 31, 2010, the Company’s investment securities were classified as follows:
| Amortized Cost | Unrealized | |||||||||||||||
| (in millions) | Gains | Losses | Fair Value |
|||||||||||||
| Available-for-sale: |
||||||||||||||||
| Debt securities |
$ | 5.2 | $ | 2.4 | $ | — | $ | 7.6 | ||||||||
| Equity securities |
0.5 | — | (0.1 | ) | 0.4 | |||||||||||
| Mortgage-backed securities |
0.7 | — | — | 0.7 | ||||||||||||
| Money market funds |
9.5 | — | — | 9.5 | ||||||||||||
| Other investments |
5.1 | — | — | 5.1 | ||||||||||||
|
|
|
|
|
|
|
|
|
|||||||||
| Total available-for-sale investments |
$ | 21.0 | $ | 2.4 | $ | (0.1 | ) | $ | 23.3 | |||||||
|
|
|
|
|
|
|
|
|
|||||||||
The Company recorded proceeds on the sales/maturities of investments of $59.3 million, $24.9 million and $3.1 million for the years ended May 31, 2011, 2010 and 2009. There were purchases of investments of $78.7 million and $13.3 million for the years ended May 31, 2011 and 2010. There were no purchases of investments for the year ended May 31, 2009. The Company recorded a realized gain of $4.9 million, $4.3 million and $0.8 million on the sales/maturities of investments for the years ended May 31, 2011, 2010 and 2009, respectively, that is included in other (income) expense.
The Company received $45.5 million face value zero coupon bonds in December 2010 from the Greek government as payment for the outstanding accounts receivable balance from calendar years 2007-2009 related to certain government sponsored institutions in a non-cash transaction. Upon receipt, the bonds had a fair value of $33.8 million, with maturity dates of one to three years. The bonds are designated as available-for-sale securities. The one year bonds are due to mature in December 2011, and we are unable to predict if the Greek government will be able to settle its obligations upon maturity or otherwise.
The Company offered a new deferred compensation plan as of January 1, 2011. The investments held by the Company mirror the investment selections of the participants. The investments are held in various equity securities and are considered trading with the realized gain and realized loss being recorded through other (income) expense.
88
Table of Contents
Biomet, Inc. and Subsidiaries Notes to Consolidated Financial Statements (continued)
Note 4—Investments, Continued.
The Company reviews impairments to investment securities quarterly to determine if the impairment is “temporary” or “other-than-temporary” or “OTTI.” The Company reviews several factors to determine whether losses are other-than-temporary, including but not limited to (1) the length of time each security was in an unrealized loss position, (2) the extent to which fair value was less than cost, (3) the financial condition and near-term prospects of the issuer, and (4) the Company’s intent and ability to hold each security for a period of time sufficient to allow for any anticipated recovery in fair value.
During the year ended May 31, 2009, the Company concluded that due to the continued illiquidity of the auction-rate market, there was an impairment determined to be other-than-temporary. As a result, a $9.4 million loss was recorded in other (income) expense during fiscal year 2009. During the years ended May 31, 2011, 2010 and 2009, the market for some of these auction-rate securities recovered and a significant portion of the Company’s holdings were either redeemed by the issuer or sold by the Company for net proceeds of $5.5 million, $23.9 million and $3.1 million, respectively. The Company recorded in other (income) expense a net realized gain of $2.6 million, $4.3 million and $0.8 million for the years ended May 31, 2011, 2010 and 2009, respectively, with respect to these liquidated securities. No additional temporary or other-than-temporary impairment was recorded during the years ended May 31, 2011 and 2010. The Company does not hold any auction-rate securities at May 31, 2011.
Investment income on available-for-sale securities (included in other (income) expense) consists of the following:
| (in millions) | Year Ended May 31, 2011 |
Year Ended May 31, 2010 |
Year Ended May 31, 2009 |
|||||||||
| Interest income |
$ | 0.6 | $ | 0.3 | $ | 3.6 | ||||||
| Dividend income |
0.1 | 0.1 | 0.3 | |||||||||
| Net realized gains |
2.6 | 4.3 | 0.8 | |||||||||
| OTTI on auction-rate securities |
— | — | (9.4 | ) | ||||||||
|
|
|
|
|
|
|
|||||||
| Total investment income (loss) |
$ | 3.3 | $ | 4.7 | $ | (4.7 | ) | |||||
|
|
|
|
|
|
|
|||||||
Note 5—Goodwill and Other Intangible Assets.
During the fourth quarter of fiscal 2011, the Company recorded a $941.4 million goodwill and definite and indefinite-lived intangible asset impairment charge primarily associated with its Europe reporting unit. As of February 28, 2011, the Company concluded that certain indicators were present that suggested impairment may exist for its Europe reporting unit’s goodwill and intangibles. The indicators of potential impairment in the Company’s Europe reporting unit included:
| • | recent reductions in revenue growth rates for the reporting unit’s knee and hip products; |
| • | recent market pressure resulting in reduced average selling prices of the reporting unit’s products; |
| • | evidence of declining industry market growth rates for many countries; and |
| • | certain European governments actively pursuing healthcare spend restructuring programs. |
The impact of these recent items resulted in management initiating an interim preliminary impairment test as of February 28, 2011. However, the preliminary result of this interim test of impairment for the Europe reporting unit’s goodwill and intangibles was inconclusive. The Company finalized the impairment tests during the fourth quarter of fiscal 2011.
During fiscal 2009, the Company recorded a $551.1 million goodwill and definite and indefinite-lived intangible asset impairment charge associated with the Dental Reconstructive reporting unit. The decline in sales volume during the third quarter of fiscal 2009 created an indication of potential impairment of its long-lived assets; therefore, the Company performed an interim preliminary impairment test as of February 28, 2009. Key
89
Table of Contents
Biomet, Inc. and Subsidiaries Notes to Consolidated Financial Statements (continued)
Note 5—Goodwill and Other Intangible Assets, Continued.
factors contributing to the impairment charge included disruptions in the credit and equity market, and changes in the Dental Reconstructive market demand relative to its original assumptions at the time of the Merger. The Company finalized the impairment test during the fourth quarter of fiscal 2009.
The Company used only the income approach, specifically the discounted cash flow method, to determine the fair value of the Europe and Dental Reconstructive reporting units and the associated amount of the impairment charges. This approach calculates fair value by estimating the after-tax cash flows attributable to a reporting unit and then discounting these after-tax cash flows to a present value using a risk-adjusted discount rate. This methodology is consistent with how the Company estimates the fair value of its reporting units during its annual goodwill and indefinite lived intangible asset impairment tests. In applying the income approach to calculate the fair value of the Europe reporting unit, the Company used assumptions about future revenue contributions and cost structures. In addition, the application of the income approach for both goodwill and intangibles requires judgment in determining a risk-adjusted discount rate at the reporting unit level. The Company based this determination on estimates of the weighted-average costs of capital of market participants. The Company performed a peer company analysis and considered the industry the weighted-average return on debt and equity from a market participant perspective. A key factor contributing to the impairment charges in the Europe and Dental Reconstructive reporting units was a change in expected market demand relative to the original assumptions at the time of the Merger.
To calculate the amount of the impairment charge related to the Europe and Dental Reconstructive reporting units, the Company allocated the reporting unit’s fair value to all of its assets and liabilities, including certain unrecognized intangible assets, in order to determine the implied fair value of goodwill. This allocation process required judgment and the use of additional valuation assumptions in deriving the individual fair values of the Company’s Europe and Dental Reconstructive reporting unit’s assets and liabilities as if the reporting units had been acquired in a business combination.
The Company also performed its annual assessment for impairment as of March 31, 2011 for all eight reporting units. The Company utilized discount rates of 10.0% to 11.0%. Based on the discount rate used in its most recent test for impairment, if the discount rate increased by 1% the fair value of the consolidated company could be lower by approximately $1.3 billion and a decrease in the discount rate of 1% results in an increase in fair value of $1.7 billion. The step one test also includes assumptions derived from competitor market capitalization and beta values as well as the twenty year Treasury bill rate as of March 31, 2011. All eight reporting units passed step one of the impairment tests for both goodwill and other intangibles on March 31, 2011; therefore it was not necessary to perform step two analyses.
The estimates and assumptions underlying the fair value calculations used in the Company’s annual impairment tests are uncertain by their nature and can vary significantly from actual results. Factors that management must estimate include, but are not limited to, industry and market conditions, sales volume and pricing, raw material costs, capital expenditures, working capital changes, cost of capital, and tax rates. These factors are especially difficult to predict when global financial markets are volatile. The estimates and assumptions used in its impairment tests are consistent with those the Company use in its internal planning. These estimates and assumptions may change from period to period. If the Company uses different estimates and assumptions in the future, future impairment charges may occur and could be material.
The Company has identified a total of four reporting units with a material amount of goodwill that are at a higher risk of potential failure of step one of the goodwill impairment test in the future. These reporting units include its U.S. Orthopedic reporting unit ($2,750.6 million of goodwill), its International reporting unit ($568.3 million of goodwill), its Dental Reconstruction reporting unit ($443.0 million of goodwill), and its Europe reporting unit ($257.7 million). The level of excess fair value over carrying value for these higher risk reporting units were each less than 10% for the latest step one impairment test.
90
Table of Contents
Biomet, Inc. and Subsidiaries Notes to Consolidated Financial Statements (continued)
Note 5—Goodwill and Other Intangible Assets, Continued.
The Company uses an accelerated method for amortizing customer relationship intangibles as the value for those relationships is greater at the beginning of their life. The decrease in the net intangible asset balance is primarily due to the impairment charge and amortization, partially offset by the strengthening of the euro against the U.S. dollar.
The following tables summarize the changes in the carrying amount of goodwill:
| (in millions) | May 31, 2011 | May 31, 2010 | May 31, 2009 | |||||||||
| Beginning of period |
$ | 4,707.5 | $ | 4,780.5 | $ | 5,422.8 | ||||||
| Goodwill acquired |
— | — | 2.0 | |||||||||
| Currency translation |
185.4 | (73.0 | ) | (148.7 | ) | |||||||
| Impairment charge |
(422.8 | ) | — | (495.6 | ) | |||||||
|
|
|
|
|
|
|
|||||||
| End of period |
$ | 4,470.1 | $ | 4,707.5 | $ | 4,780.5 | ||||||
|
|
|
|
|
|
|
|||||||
| (in millions) | May 31, 2011 | May 31, 2010 | May 31, 2009 | |||||||||
| Gross carrying amount |
$ | 5,388.5 | $ | 5,203.1 | $ | 5,276.1 | ||||||
| Accumulated impairment losses |
(918.4 | ) | (495.6 | ) | (495.6 | ) | ||||||
|
|
|
|
|
|
|
|||||||
| Net carrying amount |
$ | 4,470.1 | $ | 4,707.5 | $ | 4,780.5 | ||||||
|
|
|
|
|
|
|
|||||||
Intangible assets consist of the following at May 31, 2011 and 2010:
| (in millions) | May 31, 2011 | May 31, 2010 | ||||||||||||||||||||||||||||||||||
| Gross Carrying Amount |
Impairment Charge |
New Carrying Amount |
Accumulated Amortization |
Impairment Charge |
Net Carrying Amount |
Gross Carrying Amount |
Accumulated Amortization |
Net Carrying Amount |
||||||||||||||||||||||||||||
| Core technology |
$ | 2,092.6 | $ | (243.1 | ) | $ | 1,849.5 | $ | (416.9 | ) | $ | 53.4 | $ | 1,486.0 | $ | 2,087.4 | $ | (308.9 | ) | $ | 1,778.5 | |||||||||||||||
| Completed technology |
664.9 | (70.7 | ) | 594.2 | (183.9 | ) | 21.8 | 432.1 | 664.9 | (135.3 | ) | 529.6 | ||||||||||||||||||||||||
| Product trade names |
183.7 | — | 183.7 | (41.0 | ) | — | 142.7 | 183.6 | (29.6 | ) | 154.0 | |||||||||||||||||||||||||
| Customer relationships |
2,944.6 | (300.4 | ) | 2,644.2 | (778.5 | ) | 94.5 | 1,960.2 | 2,935.4 | (583.7 | ) | 2,351.7 | ||||||||||||||||||||||||
| Non-compete contracts |
4.6 | — | 4.6 | (2.1 | ) | — | 2.5 | 4.6 | (1.2 | ) | 3.4 | |||||||||||||||||||||||||
|
|
|
|
|
|
|
|
|
|
|
|
|
|
|
|
|
|
|
|||||||||||||||||||
| Sub-total |
5,890.4 | (614.2 | ) | 5,276.2 | (1,422.4 | ) | 169.7 | 4,023.5 | 5,875.9 | (1,058.7 | ) | 4,817.2 | ||||||||||||||||||||||||
| Corporate trade names |
397.6 | (74.1 | ) | 323.5 | — | — | 323.5 | 397.6 | — | 397.6 | ||||||||||||||||||||||||||
| Currency translation |
232.4 | — | 232.4 | (45.0 | ) | — | 187.4 | (33.7 | ) | 9.2 | (24.5 | ) | ||||||||||||||||||||||||
|
|
|
|
|
|
|
|
|
|
|
|
|
|
|
|
|
|
|
|||||||||||||||||||
| Total |
$ | 6,520.4 | $ | (688.3 | ) | $ | 5,832.1 | $ | (1,467.4 | ) | $ | 169.7 | $ | 4,534.4 | $ | 6,239.8 | $ | (1,049.5 | ) | $ | 5,190.3 | |||||||||||||||
|
|
|
|
|
|
|
|
|
|
|
|
|
|
|
|
|
|
|
|||||||||||||||||||
Expected amortization expense, for the intangible assets stated above, for the years ending May 31, 2012 through 2016 is $330.4 million, $321.8 million, $311.9 million, $298.6 million, and $291.5 million, respectively.
Note 6—Debt.
The senior secured credit facilities and all of the notes are guaranteed by the Company, and subject to certain exceptions, each of its existing and future wholly-owned domestic subsidiaries. The asset-based revolving credit facility is guaranteed by the Company and secured, subject to certain exceptions, by a first-priority security interest in substantially all of the Company’s assets and the assets of subsidiary borrowers that consist of all accounts receivable, inventory, cash, deposit accounts, and certain intangible assets. The facilities and notes bear interest at the rates set forth below. Interest is payable in cash, except with respect to the Company’s ability to elect to pay PIK (payment-in-kind) interest, rather than cash interest, on the senior PIK toggle notes through October 15, 2012. The Company has not made this election as of May 31, 2011. The terms and carrying value of each debt instrument at May 31, 2011 are set forth below:
91
Table of Contents
Biomet, Inc. and Subsidiaries Notes to Consolidated Financial Statements (continued)
Note 6—Debt, Continued.
| (U.S. dollars and euros in millions) | Maturity Date |
Interest Rate |
Currency |
May 31, 2011 |
May 31, 2010 |
|||||||||
| Debt Instruments |
||||||||||||||
| European facilities |
No Maturity Date | Primarily | EUR | € | 3.9 | € | 5.1 | |||||||
| Euribor + 1.90% | $ | 5.6 | $ | 6.3 | ||||||||||
| Term loan facility |
March 25, 2015 | LIBOR + 3.00% | USD | $ | 2,258.1 | $ | 2,281.5 | |||||||
| Term loan facility |
March 25, 2015 | LIBOR + 3.00% | EUR | € | 844.4 | € | 853.1 | |||||||
| $ | 1,206.3 | $ | 1,047.3 | |||||||||||
| Cash flow revolving credit facility |
September 25, 2013 | LIBOR + 2.25% | USD | — | — | |||||||||
| Cash flow revolving credit facility |
September 25, 2013 | LIBOR + 2.25% | USD/EUR | $/€ | — | $/€ | — | |||||||
| Asset-based revolving credit facility |
September 25, 2013 | LIBOR0 + 1.25% | USD | — | — | |||||||||
| Senior cash pay notes |
October 15, 2017 | 10% | USD | $ | 761.0 | $ | 771.0 | |||||||
| Senior PIK toggle notes |
October 15, 2017 | 10 3/8% /11 1/8% | USD | $ | 771.0 | $ | 771.0 | |||||||
| Senior subordinated notes |
October 15, 2017 | 11 5 /8% | USD | $ | 1,015.0 | $ | 1,015.0 | |||||||
| Premium on notes |
$ | 3.3 | $ | 4.4 | ||||||||||
|
|
|
|
|
|||||||||||
| Total debt |
$ | 6,020.3 | $ | 5,896.5 | ||||||||||
|
|
|
|
|
|||||||||||
The Company currently elects to use 3-month LIBOR for setting the interest rates on the majority of its U.S. dollar and euro term loans. The 3-month LIBOR rate for the U.S. dollar term loan as of May 31, 2011 was 0.31%. The euro term loan had a 3-month LIBOR rate of 1.14% as of May 31, 2011. The Company’s term loan facilities require payments each year in an amount equal to 1% of the original principal in equal calendar quarterly installments for the first seven years and three months of the facilities. During the year ended May 31, 2011, the total amount of required payments under our term loan facilities was $34.8 million. There were no borrowings under the asset-based revolving credit facility as of May 31, 2011. The cash flow and asset-based revolving credit facilities and the notes do not have terms for mandatory principal pay downs. To calculate the U.S. dollar equivalent on outstanding balances, the Company used a currency conversion rate of 1 euro to $1.4284 and $1.2276, which represents the currency exchange rate from euros to U.S. dollars on May 31, 2011 and May 31, 2010.
The Company has the option to choose the frequency with which it resets and pays interest on its term loans. The Company currently pays interest on the majority of its term loans and interest rate swaps each calendar quarter. The remaining term loan interest is paid monthly. The interest on the bonds is paid semiannually in October and April.
During the year ended May 31, 2011, the Company repurchased certain senior cash pay notes having a par value of $10.0 million. The Company paid $11.2 million to settle the transaction and retire the debt on November 3, 2010, which included accrued interest of $0.1 million and a loss on the extinguishment of the debt of $1.2 million recorded in other (income) expense. In conjunction with this transaction, the Company wrote off debt financing costs of $0.1 million and premium on notes of $0.3 million.
During the year ended May 31, 2010, the Company repurchased certain senior cash pay notes having a par value of $4.0 million and certain senior PIK toggle notes having a par value of $4.0 million. The Company paid $8.9 million to settle the transaction and retire the debt on February 2, 2010, which included accrued interest of $0.2 million and a loss on the extinguishment of the debt of $0.7 million. In conjunction with this transaction, the Company wrote off debt issuance costs of $0.1 million and bond premiums of $0.2 million.
Our revolving borrowing base available under all debt facilities at May 31, 2011 was $856.0 million, which is net of the remaining $22.3 million commitment of the subsidiaries of Lehman Brothers Holding Inc. and borrowing base limitations relating to the asset-based revolving credit facility.
As of May 31, 2011, $45.6 million of financing fees related to the Company’s credit agreement remained in long-term assets and continue to be amortized through interest expense over the remaining life of the credit agreement.
92
Table of Contents
Biomet, Inc. and Subsidiaries Notes to Consolidated Financial Statements (continued)
Note 6—Debt, Continued.
As of May 31, 2011 and 2010, short-term borrowings consisted of the following:
| (in millions) | May 31, 2011 |
May 31, 2010 |
||||||
| Senior secured credit facilities |
$ | 35.9 | $ | 34.1 | ||||
| Non-U.S. facilities |
1.5 | 1.5 | ||||||
|
|
|
|
|
|||||
| Total |
$ | 37.4 | $ | 35.6 | ||||
|
|
|
|
|
|||||
Summarized in the table below are the Company’s long-term obligations as of May 31, 2011:
| (in millions) | Total | 2012 | 2013 and 2014 |
2015 and 2016 |
2017 and thereafter |
|||||||||||||||
| Long-term debt (including current maturities) |
$ | 6,020.3 | $ | 37.4 | $ | 71.8 | $ | 3,356.7 | $ | 2,554.4 | ||||||||||
The Company currently is restricted in its ability to pay dividends under various covenants of its debt agreements, including its credit facilities and the indentures governing its notes. The Company does not expect for the foreseeable future to pay dividends on its common stock, and did not during fiscal 2011 or fiscal 2010. Any future determination to pay dividends will depend upon, among other factors, its results of operations, financial condition, cash flows, capital requirements, any contractual restrictions and any other considerations the Company’s Board of Directors deems relevant.
Note 7—Fair Value Measurements.
Assets and Liabilities Measured at Fair Value on a Recurring Basis
Fair value measurements are principally applied to (1) financial assets and liabilities such as marketable equity securities and debt securities, (2) investments in equity and other securities, and (3) derivative instruments consisting of interest rate swaps. These items are marked-to-market at each reporting period at fair value. The information in the following paragraphs and tables primarily addresses matters relative to these financial assets and liabilities.
| • | Level 1 – Inputs are quoted prices in active markets for identical assets or liabilities. The Company’s Level 1 assets include money market investments and marketable equity securities. |
| • | Level 2 – Inputs include quoted prices for similar assets or liabilities in active markets, quoted prices for identical or similar assets or liabilities in markets that are not active, and inputs (other than quoted prices) that are observable for the asset or liability, either directly or indirectly. The Company’s Level 2 assets and liabilities primarily include agency bonds, corporate debt securities, asset-backed securities, certain mortgage-backed securities, time deposits, Greek bonds, interest rate swaps, pension plan assets (equity securities, debt securities and other) and foreign currency exchange contracts whose value is determined using a pricing model with inputs that are observable in the market or can be derived principally from or corroborated by observable market data. |
| • | Level 3 – Inputs are unobservable for the asset or liability. The Company’s Level 3 assets include other equity investments. See the section below titled Level 3 Valuation Techniques for further discussion of how the Company determines fair value for investments classified as Level 3. |
93
Table of Contents
Biomet, Inc. and Subsidiaries Notes to Consolidated Financial Statements (continued)
Note 7—Fair Value Measurements, Continued.
The following table provides information by level for assets and liabilities that are measured at fair value on a recurring basis at May 31, 2011 and May 31, 2010:
| Fair Value at | Fair Value Measurements Using Inputs Considered as |
|||||||||||||||
| (in millions) | May 31, 2011 | Level 1 | Level 2 | Level 3 | ||||||||||||
| Assets: |
||||||||||||||||
| Corporate debt securities |
$ | 0.3 | $ | — | $ | 0.3 | $ | — | ||||||||
| Money market funds |
132.5 | 132.5 | — | — | ||||||||||||
| Time deposit |
47.4 | — | 47.4 | — | ||||||||||||
| Greek bonds |
31.1 | — | 31.1 | — | ||||||||||||
| Pension plan assets |
104.1 | — | 104.1 | — | ||||||||||||
| Foreign currency exchange contracts |
0.2 | — | 0.2 | — | ||||||||||||
| Other |
0.5 | 0.3 | — | 0.2 | ||||||||||||
|
|
|
|
|
|
|
|
|
|||||||||
| Total assets |
$ | 316.1 | $ | 132.8 | $ | 183.1 | $ | 0.2 | ||||||||
|
|
|
|
|
|
|
|
|
|||||||||
| Liabilities: |
||||||||||||||||
| Interest rate swaps |
$ | 96.8 | $ | — | $ | 96.8 | $ | — | ||||||||
| Foreign currency exchange contracts |
0.1 | — | 0.1 | — | ||||||||||||
|
|
|
|
|
|
|
|
|
|||||||||
| Total liabilities |
$ | 96.9 | $ | — | $ | 96.9 | $ | — | ||||||||
|
|
|
|
|
|
|
|
|
|||||||||
| Fair Value Measurements Using Inputs Considered as |
||||||||||||||||
| (in millions) | Fair Value at May 31, 2010 |
Level 1 | Level 2 | Level 3 | ||||||||||||
| Assets: |
||||||||||||||||
| Corporate debt securities |
$ | 2.6 | $ | — | $ | 2.6 | $ | — | ||||||||
| Auction-rate securities |
5.5 | — | — | 5.5 | ||||||||||||
| Money market funds |
64.5 | 64.5 | — | — | ||||||||||||
| Pension plan assets |
82.1 | — | 82.1 | — | ||||||||||||
| Other |
5.7 | 4.7 | 0.8 | 0.2 | ||||||||||||
|
|
|
|
|
|
|
|
|
|||||||||
| Total assets |
$ | 160.4 | $ | 69.2 | $ | 85.5 | $ | 5.7 | ||||||||
|
|
|
|
|
|
|
|
|
|||||||||
| Liabilities: |
||||||||||||||||
| Interest rate swaps |
$ | 129.9 | $ | — | $ | 129.9 | $ | — | ||||||||
|
|
|
|
|
|
|
|
|
|||||||||
| Total liabilities |
$ | 129.9 | $ | — | $ | 129.9 | $ | — | ||||||||
|
|
|
|
|
|
|
|
|
|||||||||
Level 3 Valuation Techniques
Financial assets are considered Level 3 when their fair values are determined using pricing models, discounted cash flow methodologies or similar techniques and at least one significant model assumption or input is unobservable. Level 3 financial assets also include certain investment securities for which there is limited market activity where the determination of fair value requires significant judgment or estimation. Level 3 investment securities primarily include other equity investments for which there was a decrease in the observation of market pricing. As of May 31, 2011 and May 31, 2010, these securities were valued primarily using internal cash flow valuation that incorporates transaction details such as contractual terms, maturity, timing and amount of future cash flows, as well as assumptions about liquidity and credit valuation adjustments of marketplace participants.
94
Table of Contents
Biomet, Inc. and Subsidiaries Notes to Consolidated Financial Statements (continued)
Note 7—Fair Value Measurements, Continued.
The following table provides a reconciliation of the beginning and ending balances of items measured at fair value on a recurring basis in the tables above that used significant unobservable inputs (Level 3) as of May 31, 2011 and May 31, 2010:
| (in millions) | ||||
| Balance at June 1, 2009 |
$ | 22.7 | ||
| Total net gains included in earnings |
4.3 | |||
| Total unrealized gains included in other comprehensive income |
2.6 | |||
| Total proceeds from sale of Level 3 investments |
(23.9 | ) | ||
|
|
|
|||
| Balance at May 31, 2010 |
$ | 5.7 | ||
| Total net gains included in earnings |
2.6 | |||
| Total unrealized gains included in other comprehensive income |
(2.6 | ) | ||
| Total proceeds from sale of Level 3 investments |
(5.5 | ) | ||
|
|
|
|||
| Balance at May 31, 2011 |
$ | 0.2 | ||
|
|
|
|||
The estimated fair value of the Company’s long-term debt, including the current portion, at May 31, 2011 was $6,314.9 million, compared to a carrying value of $6,020.3 million, and was $6,060.8 million, compared to a carrying value of $5,896.5 million at May 31, 2010. The fair value of the Company’s traded debt was estimated using quoted market prices for the same or similar instruments. The fair value of the Company’s variable rate term debt was estimated using the carrying value as this debt has rates which approximate market interest rates. In determining the fair values and carrying values, the Company considers the terms of the related debt and excludes the impacts of debt discounts and interest rate swaps.
Assets and Liabilities that are Measured at Fair Value on a Nonrecurring Basis
During the year ended May 31, 2011, the Company measured nonfinancial long-lived assets and liabilities at fair value in conjunction with the impairment of the Europe reporting unit. The Company used the income approach to measure the fair value of the Europe reporting unit and related intangible assets. See Note 5 for a full description of key assumptions. The inputs used in the impairment fair value analysis fall within Level 3 due to the significant unobservable inputs used to determine fair value. During the year ended May 31, 2010, the Company had no significant measurements of nonfinancial assets or liabilities at fair value on a nonrecurring basis subsequent to their initial recognition.
The Company is exposed to certain market risks relating to its ongoing business operations, including foreign currency risk, interest rate risk and commodity price risk. The Company currently manages foreign currency risk and interest rate risk through the use of derivatives.
Note 8—Derivative Instruments and Hedging Activities.
Derivatives Designated as Hedging Instruments
Foreign Currency Instruments—Certain assets, liabilities and forecasted transactions are exposed to foreign currency risk, primarily the fluctuation of the U.S. dollar against the euro. The Company has hedged a portion of its net investment in its European subsidiaries with the issuance of a €875.0 million (approximately $1,207.4 million at September 25, 2007) principal amount euro term loan on September 25, 2007. The Company’s net investment in its European subsidiaries at the hedging date of September 25, 2007 was €1,238.0 million ($1,690.0 million). As of May 31, 2011, the Company’s net investment in European subsidiaries totaled
95
Table of Contents
Biomet, Inc. and Subsidiaries Notes to Consolidated Financial Statements (continued)
Note 8—Derivative Instruments and Hedging Activities, Continued.
€1,789.2 million ($2,555.6 million) and the outstanding principal balance of the euro term loan was €844.4 million ($1,206.3 million). The difference of €944.8 million ($1,349.3 million) is unhedged as of May 31, 2011. Hedge effectiveness is tested quarterly to determine whether hedge treatment is still appropriate. The Company tests effectiveness on this net investment hedge by determining if the net investment in its European subsidiaries is greater than the outstanding euro-denominated debt balance. Any amount of a derivative instrument designated as a hedge determined to be ineffective is recorded as other (income) expense.
Interest Rate Instruments—The Company uses interest rate swap agreements (cash flow hedges) in both U.S. dollars and euros as a means of fixing the interest rate on portions of its floating-rate debt instruments. As of May 31, 2011, the Company had a swap liability of $96.8 million, which consisted of $62.6 million short-term, and $34.8 million long-term, partially offset by a $0.6 million credit valuation adjustment. As of May 31, 2010, the Company had a swap liability of $129.9 million, which consisted of $64.9 million short-term, and $69.4 million long-term, partially offset by a $4.4 million credit valuation adjustment. The table below summarizes existing swap agreements:
| (U.S. dollars and in millions) Structure |
Currency | Notional Amount |
Effective Date | Termination Date | Fair Value at May 31, 2011 Asset (Liability) |
Fair Value at May 31, 2010 Asset (Liability) |
||||||||||||||||||
| 3 year |
EUR | € | 75.0 | September 25, 2007 | September 25, 2010 | $ | — | $ | (1.8 | ) | ||||||||||||||
| 3 year |
EUR | 50.0 | March 25, 2008 | March 25, 2011 | — | (1.9 | ) | |||||||||||||||||
| 4 year |
EUR | 75.0 | September 25, 2007 | September 25, 2011 | (1.7 | ) | (4.9 | ) | ||||||||||||||||
| 4 year |
EUR | 40.0 | March 25, 2008 | March 25, 2012 | (1.4 | ) | (2.9 | ) | ||||||||||||||||
| 5 year |
EUR | 230.0 | September 25, 2007 | September 25, 2012 | (13.6 | ) | (23.4 | ) | ||||||||||||||||
| 5 year |
EUR | 40.0 | March 25, 2008 | March 25, 2013 | (2.5 | ) | (4.0 | ) | ||||||||||||||||
| 3 year |
USD | $ | 195.0 | September 25, 2007 | September 25, 2010 | — | (2.8 | ) | ||||||||||||||||
| 3 year |
USD | 110.0 | March 25, 2008 | March 25, 2011 | — | (1.7 | ) | |||||||||||||||||
| 4 year |
USD | 195.0 | September 25, 2007 | September 25, 2011 | (3.1 | ) | (10.9 | ) | ||||||||||||||||
| 4 year |
USD | 140.0 | March 25, 2008 | March 25, 2012 | (3.0 | ) | (4.7 | ) | ||||||||||||||||
| 5 year |
USD | 585.0 | September 25, 2007 | September 25, 2012 | (37.3 | ) | (52.6 | ) | ||||||||||||||||
| 5 year |
USD | 190.0 | March 25, 2008 | March 25, 2013 | (9.3 | ) | (9.1 | ) | ||||||||||||||||
| 5 year |
USD | 325.0 | December 26, 2008 | December 25, 2013 | (13.3 | ) | (6.3 | ) | ||||||||||||||||
| 5 year |
USD | 195.0 | September 25, 2009 | September 25, 2014 | (12.2 | ) | (7.3 | ) | ||||||||||||||||
| Credit valuation adjustment |
|
0.6 | 4.4 | |||||||||||||||||||||
|
|
|
|
|
|||||||||||||||||||||
| Total interest rate instruments |
|
$ | (96.8 | ) | $ | (129.9 | ) | |||||||||||||||||
|
|
|
|
|
|||||||||||||||||||||
96
Table of Contents
Biomet, Inc. and Subsidiaries Notes to Consolidated Financial Statements (continued)
Note 8—Derivative Instruments and Hedging Activities, Continued.
The interest rate swaps are recorded in other accrued expenses and other long-term liabilities. As a result of cash flow hedge treatment being applied, all unrealized gains and losses related to the derivative instruments are recorded in accumulated other comprehensive income (loss) and are reclassified into operations in the same period in which the hedged transaction affects earnings. Hedge effectiveness is tested quarterly to determine if hedge treatment is still appropriate. The amount of ineffectiveness was not material for any period presented. The tables below summarize the effective portion and ineffective portion of the Company’s interest rate swaps for the years ended May 31, 2011 and 2010:
| (in millions) Derivatives in cash flow hedging relationship |
Year Ended May 31, 2011 |
Year Ended May 31, 2010 |
||||||
| Interest rate swaps, net of tax: |
||||||||
| Amount of gain (loss) recognized in OCI |
$ | 19.5 | $ | 11.3 | ||||
| Amount of (gain) loss reclassified from accumulated OCI into interest expense (effective portion) |
— | — | ||||||
| Amount (gain) loss recognized in other income (expense) (ineffectiveportion and amount excluded from effectiveness testing) |
— | — | ||||||
As of May 31, 2011, the effective interest rate, including the applicable lending margin, on 72.2% ($1,630.0 million) of the outstanding principal of the Company’s U.S. dollar term loan was fixed at 6.92% through the use of interest rate swaps. The effective interest rate on 45.6% (€385.0 million) of the outstanding principal of the Company’s euro term loan was fixed at 7.33% through the use of interest rate swaps. The remaining unhedged balances of the U.S. dollar and euro term loans had effective interest rates of 3.19% and 4.20%, respectively. As of May 31, 2011 and 2010, the Company’s effective weighted average interest rate on all outstanding debt, including the interest rate swaps, was 7.96% and 8.16%, respectively.
Derivatives Not Designated as Hedging Instruments
Foreign Currency Instruments—The Company faces transactional currency exposures that arise when it or its foreign subsidiaries enter into transactions, primarily on an intercompany basis, denominated in currencies other than their functional currency. Beginning in fiscal 2011, the Company entered into short-term forward currency exchange contracts in order to mitigate the currency exposure related to these intercompany payables and receivables arising from intercompany trade. The Company does not designate these contracts as hedges; therefore, all forward currency exchange contracts are recorded at their fair value each period, with the resulting gains and losses recorded in other (income) expense. Any foreign currency remeasurement gains or losses recognized in a period are generally offset with gains or losses on the forward currency exchange contracts. As of May 31, 2011, the fair value of the Company’s derivatives not designated as hedging instruments on a gross basis were assets of $0.2 million recorded in prepaid expenses and other and liabilities of $0.1 million recorded in other accrued expenses.
Note 9—Retirement and Pension Plans.
The Company has a defined contribution profit sharing plan which covers substantially all of the employees, or team members, within the continental U.S. and allows participants to make contributions by salary reduction pursuant to Section 401(k) of the Internal Revenue Code. The Company currently matches 100% of the team member’s contribution, up to a maximum amount equal to 6% of the team member’s compensation. The amounts expensed under this profit sharing plan for the years ended May 31, 2011, 2010 and 2009 were $10.9 million, $8.1 million and $6.3 million, respectively.
97
Table of Contents
Biomet, Inc. and Subsidiaries Notes to Consolidated Financial Statements (continued)
Note 9—Retirement and Pension Plans, Continued.
During the 2011 fiscal year the Company’s European executive officers in certain countries were eligible to participate in its defined contribution plan. Each year, in the Company’s sole discretion, the Company may contribute a percentage of employees’ pensionable salaries based on their age at January 1st. The amounts expensed under this profit sharing plan for the years ended May 31, 2011, 2010 and 2009 was $6.9 million, $5.7 million and $3.0 million, respectively.
The Company sponsors various retirement and pension plans, including defined benefit plans, for some of its foreign operations. Many foreign employees are covered by government sponsored programs for which the direct cost to the Company is not significant. Retirement plan benefits are primarily based on the employee’s compensation during the last several years before retirement and the employee’s number of years of service for the Company. Some foreign subsidiaries have plans under which funds are deposited with trustees, annuities are purchased under group contracts or reserves are provided. The Company used May 31 for fiscal 2011 and fiscal 2010 as the measurement date for the foreign pension plans.
Net periodic benefit costs for the Company’s defined benefit plans include the following components:
| (in millions) | Year Ended May 31, 2011 |
Year Ended May 31, 2010 |
Year Ended May 31, 2009 |
|||||||||
| Net periodic benefit costs: |
||||||||||||
| Service costs |
$ | 0.8 | $ | 0.6 | $ | 2.3 | ||||||
| Interest costs |
6.8 | 6.9 | 6.6 | |||||||||
| Expected return on plan assets |
(5.1 | ) | (3.9 | ) | (4.4 | ) | ||||||
| Recognized actuarial losses |
1.1 | 3.3 | 0.8 | |||||||||
|
|
|
|
|
|
|
|||||||
| Net periodic benefit costs |
$ | 3.6 | $ | 6.9 | $ | 5.3 | ||||||
|
|
|
|
|
|
|
|||||||
The following table sets forth information related to the benefit obligation and the fair value of plan assets at May 31, 2011 and 2010 for the Company’s defined benefit retirement plans. The Company maintains no post-retirement medical or other post-retirement plans in the United States.
| (in millions) | May 31, 2011 | May 31, 2010 | ||||||
| Change in Benefit Obligation |
||||||||
| Projected benefit obligation—beginning of year |
$ | 111.6 | $ | 111.2 | ||||
| Service costs |
0.8 | 0.6 | ||||||
| Interest costs |
6.8 | 6.9 | ||||||
| Plan participant contribution |
— | — | ||||||
| Actuarial (gains)/losses |
(7.7 | ) | 1.3 | |||||
| Benefits paid from plan |
(2.2 | ) | (3.2 | ) | ||||
| Other |
— | 9.0 | ||||||
| Effect of exchange rates |
16.0 | (14.2 | ) | |||||
|
|
|
|
|
|||||
| Projected benefit obligation—end of year |
$ | 125.3 | $ | 111.6 | ||||
|
|
|
|
|
|||||
| Accumulated benefit obligation |
$ | 124.2 | $ | 110.4 | ||||
|
|
|
|
|
|||||
| Change in Plan Assets |
||||||||
| Plan assets at fair value—beginning of year |
$ | 82.1 | $ | 74.3 | ||||
| Actual return on plan assets |
6.2 | 13.0 | ||||||
| Company contribution |
6.1 | 8.3 | ||||||
| Plan participant contribution |
— | — | ||||||
| Benefits paid from plan |
(2.1 | ) | (3.1 | ) | ||||
| Effect of exchange rates |
11.8 | (10.4 | ) | |||||
|
|
|
|
|
|||||
| Plan assets at fair value—end of year |
$ | 104.1 | $ | 82.1 | ||||
|
|
|
|
|
|||||
| Funded status at end of year |
$ | 21.2 | $ | 29.5 | ||||
|
|
|
|
|
|||||
98
Table of Contents
Biomet, Inc. and Subsidiaries Notes to Consolidated Financial Statements (continued)
Note 9—Retirement and Pension Plans, Continued.
Amounts recognized in the Company’s consolidated balance sheets consist of the following:
| (in millions) | May 31, 2011 | May 31, 2010 | ||||||
| Deferred income tax asset |
$ | (0.9 | ) | $ | (5.3 | ) | ||
| Employee related obligations |
21.2 | 29.5 | ||||||
| Other comprehensive income (loss) |
1.2 | (3.3 | ) | |||||
| Year Ended May 31, 2012 |
||||
| Amounts expected to be recognized in Net Periodic Cost in the coming year for the Company’s defined benefit retirement plans (in millions) |
||||
| Amortization of net actuarial losses |
$ | 0.8 | ||
The weighted-average assumptions in the following table represent the rates used to develop the actuarial present value of the projected benefit obligation for periods presented and also the net periodic benefit cost for the following year.
| Year Ended May 31, 2011 |
Year Ended May 31, 2010 |
Year Ended May 31, 2009 |
||||||||||
| Discount rate |
5.50 | % | 5.46 | % | 6.27 | % | ||||||
| Expected long-term rate of return on plan assets |
5.57 | % | 5.54 | % | 5.66 | % | ||||||
| Rate increase in compensation levels |
2.89 | % | 2.89 | % | 2.89 | % | ||||||
The projected future benefit payments from the Company’s defined benefit retirement plans are $2.4 million for fiscal 2012, $2.5 million for fiscal 2013, $2.7 million for fiscal 2014, $3.3 million for fiscal 2015, $2.9 million for fiscal 2016 and $18.1 million for fiscal 2017 to 2021. The Company expects to pay $6.3 million into the plans during fiscal 2012. In certain countries, the funding of pension plans is not a common practice. Consequently, the Company has several pension plans which are not funded.
The Company’s retirement plan asset allocation at May 31, 2011 was 48% to debt securities, 40% to equity securities, and 12% to other. The Company’s retirement plan asset allocation at May 31, 2010 was 53% to debt securities, 38% to equity securities, and 9% to other.
Strategic asset allocations are determined by country, based on the nature of the liabilities and considering demographic composition of the plan participants (average age, years of service and active versus retiree status). The Company’s plans are considered non-mature plans and the long-term strategic asset allocations are consistent with these types of plans. Emphasis is placed on diversifying on a broad basis combined with currency matching the fixed income assets.
Note 10—Accumulated Other Comprehensive Income (Loss).
Other comprehensive income (loss) includes net loss, currency translation adjustments, certain derivative-related activity, changes in the value of available-for-sale investments, and changes in prior service cost from pension plans. The Company generally deems its foreign investments to be essentially permanent in nature and does not provide for taxes on currency translation adjustments arising from translating the investment in a foreign currency to U.S. dollars. When the Company determines that a foreign investment is no longer permanent in nature, estimated taxes are provided for the related deferred tax liability (asset), if any, resulting from currency translation adjustments. As of May 31, 2011, foreign investments were all deemed to be permanent in duration.
99
Table of Contents
Biomet, Inc. and Subsidiaries Notes to Consolidated Financial Statements (continued)
Note 10—Accumulated Other Comprehensive Income (Loss), Continued.
Accumulated other comprehensive income (loss) and the related components are included in the table below:
| (in millions) | Balance at May 31, 2010 |
Accumulated Other Comprehensive Income (Loss) |
Balance at May 31, 2011 |
|||||||||
| Unrecognized actuarial gain (loss) on pension assets, net of tax |
$ | (3.3 | ) | $ | 4.5 | $ | 1.2 | |||||
| Foreign currency translation adjustments |
(28.6 | ) | 264.4 | 235.8 | ||||||||
| Unrealized gain (loss) on interest rate swaps, net of tax |
(79.9 | ) | 19.5 | (60.4 | ) | |||||||
| OTTI on auction-rate securities |
4.0 | (4.0 | ) | — | ||||||||
| Unrealized loss on available-for-sale securities, net of tax |
(2.8 | ) | (2.0 | ) | (4.8 | ) | ||||||
|
|
|
|
|
|
|
|||||||
| Accumulated other comprehensive income (loss) |
$ | (110.6 | ) | $ | 282.4 | $ | 171.8 | |||||
|
|
|
|
|
|
|
|||||||
Note 11—Share-based Compensation and Stock Plans.
The Company expenses all share-based payments to employees and non-employee distributors, including stock options and restricted stock units, based on the grant date fair value over the required award service period using the graded vesting attribution method. For awards with a performance vesting condition, the Company recognizes expense when the performance condition is considered probable to occur. Share-based compensation expense recognized for the years ended May 31, 2011, 2010 and 2009 was $12.7 million, $22.4 million and $33.9 million, respectively. During the fourth quarter of fiscal 2011, the Company determined that it was unlikely that the performance vesting requirements would be met in current and future periods. As a result the Company did not recognize $7.6 million of share-based compensation expense for the year ended May 31, 2011.
Stock Options
The Company grants stock option awards under the LVB Acquisition, Inc. 2007 Management Equity Incentive Plan (the “2007 LVB Plan”). When the 2007 LVB Plan became effective, there were 37,520,000 shares of LVB common stock reserved for issuance in connection with LVB Awards to be granted thereunder. Effective December 31, 2010, the 2007 LVB Plan was amended to increase the authorized share pool by 1,000,000 shares. During the year ended May 31, 2011, stock options were granted with an exercise price equal to the higher of the fair value of the underlying stock or $10.00 on the date of the grant and have 10-year terms. Vesting of employee stock options are split into two categories: 1) time based options-75% of option grants generally vesting ratably over 5 years and 2) performance based options-25% of stock option grants generally vesting over 5 years, contingent upon the Company achieving certain adjusted EBITDA targets in each of those years. As of May 31, 2011, there were 2,380,375 shares available for issuance under the 2007 LVB Plan.
In 2008, the Board of Directors of Parent adopted an addendum to the 2007 LVB Plan, which provides for the grant of leveraged equity awards in Parent under the 2007 LVB Plan (the “LVB Leveraged Awards,” and together with the LVB Options, the “LVB Awards”) to certain of the Company’s European employees. LVB Leveraged Awards permit participants to purchase shares of LVB common stock using the proceeds of non-recourse loans from Parent, which shares remain subject to forfeiture and other restrictions prior to the participant’s repayment of the loan.
Upon termination of a participant’s employment, the 2007 LVB Plan provides that any unvested portion of a participant’s LVB Award will be forfeited, and that the vested portion of his or her LVB Award will expire on the earliest of (1) the date the participant’s employment is terminated for cause, (2) 30 days following the date the participant resigns without good reason, (3) 90 days after the date the participant’s employment is terminated
100
Table of Contents
Biomet, Inc. and Subsidiaries Notes to Consolidated Financial Statements (continued)
Note 11—Share-based Compensation and Stock Plans, Continued.
either by us for any reason other than cause, death or disability or by the participant with good reason, (4) one year after the date the participant’s employment is terminated by reason of death or disability or (5) the tenth anniversary of the grant date of the LVB Award.
In May 2009, the Board of Directors of Parent authorized an exchange offer relating to employee options outstanding at May 6, 2009 (including the options held by the Company’s named executive officers). Outstanding distributor options were not included in the exchange offer. The exchange offer was expected to provide the holders of such options with the opportunity to surrender the options for cancellation in exchange for replacement options, the terms of which were (1) different from the surrendered options with respect to the performance based and accreting exercise price options, and (2) the same as the surrendered options with respect to the time based options. The terms of the performance based and accreting exercise price options were modified in the replacement options as follows:
| • | New Performance Vesting Options (which replaced the surrendered performance based options)—Beginning in fiscal 2010, the remaining unvested options vest ratably over four to six years (depending on the date of grant) instead of the three to five years remaining under the terms of the original performance based options. The remaining options continue to vest contingent upon the Company achieving certain reduced adjusted EBITDA targets in each of those years. |
| • | New Extended Time Vesting Options (which replaced the surrendered accreting exercise price options)—These options were converted into time vesting options similar to the previously outstanding time based options. The exercise price reverted to $10.00 per share (i.e., the original grant date exercise price before it began accreting) and will no longer increase by 10% on an annual basis. The remaining unvested options vest ratably over four to six years (depending on the date of grant) instead of the three to five years remaining under the terms of the original accreting exercise price options. |
The goal of the exchange offer was to provide employees who elected to participate with new options, the terms of which preserve the original incentive effect of the Company’s option program in light of market-wide economic conditions. In October 2009, the exchange offer was completed with all active employees electing to participate. Beginning July 2009, new option grants subsequent to, and not in connection with the exchange offer, split options into 2 categories: 1) time based options: 75% of option grants generally vesting ratably over 5 years and 2) performance based options: 25% of stock option grants generally vesting over 5 years, contingent upon the Company achieving certain adjusted EBITDA targets in each of those years.
Prior to receiving shares of LVB common stock (whether pursuant to the exercise of LVB Options, purchased pursuant to an LVB Leveraged Award or otherwise), participants must execute a Management Stockholders’ Agreement, which provides that the shares are subject to certain transfer restrictions, put and call rights, and tag along and drag along rights (and, with respect to certain senior members of management, limited re-offer registration and preemptive rights).
101
Table of Contents
Biomet, Inc. and Subsidiaries Notes to Consolidated Financial Statements (continued)
Note 11—Share-based Compensation and Stock Plans, Continued.
The following table summarizes stock option activity for the years ended May 31, 2011, 2010 and 2009:
| Stock Options | Weighted Average Exercise Price |
|||||||
| Outstanding, May 31, 2008 |
31,796,000 | $ | 10.00 | |||||
| Granted |
2,844,000 | 10.00 | ||||||
| Forfeitures |
(1,650,167 | ) | 10.00 | |||||
|
|
|
|||||||
| Outstanding, May 31, 2009 |
32,989,833 | $ | 10.00 | |||||
| Granted |
4,296,500 | 10.00 | ||||||
| Forfeitures |
(1,999,833 | ) | 10.00 | |||||
|
|
|
|||||||
| Outstanding, May 31, 2010 |
35,286,500 | $ | 10.00 | |||||
| Granted |
2,274,000 | 10.00 | ||||||
| Forfeitures |
(1,356,875 | ) | 10.00 | |||||
|
|
|
|||||||
| Outstanding, May 31, 2011 |
36,203,625 | $ | 10.00 | |||||
|
|
|
|||||||
The weighted average fair value of options granted during the years ended May 31, 2011, 2010 and 2009, was $3.21, $3.28, and $2.85, respectively. The Company estimates the fair value of each option primarily using the Black-Scholes option pricing model. Expected volatilities for grants are generally based on historical volatility of the Company’s competitors’ stock. The risk-free rates for periods within the expected life of the option are based on the U.S. Treasury yield curve in effect at the time of grant. As of May 31, 2011, there was approximately $15.7 million of unrecognized share-based compensation expense related to nonvested employee stock options granted under the Company’s plan and is expected to be recognized over a weighted average period of 1.6 years.
The fair value estimates are based on the following weighted average assumptions:
| May 31, 2011 | May 31, 2010 | |||||||
| Risk-free interest rate |
1.85 | % | 2.64 | % | ||||
| Dividend yield |
— | — | ||||||
| Expected volatility |
31.58 | % | 34.27 | % | ||||
| Expected life in years |
6.00 | 5.91 | ||||||
The following table summarizes information about outstanding stock options, as of May 31, 2011 and 2010, that were (a) vested and (b) exercisable:
| Outstanding Stock Options Already Vested and Expected to Vest |
Options that are Exercisable |
|||||||||||||||
| 2011 | 2010 | 2011 | 2010 | |||||||||||||
| Number of outstanding options |
36,203,625 | 35,286,500 | 19,488,874 | 12,332,969 | ||||||||||||
| Weighted average remaining contractual life |
7.1 years | 7.9 years | 6.8 years | 7.8 years | ||||||||||||
| Weighted average exercise price per share |
$ | 10.00 | $ | 10.00 | $ | 10.00 | $ | 10.00 | ||||||||
| Intrinsic value |
$ | — | $ | — | $ | — | $ | — | ||||||||
Restricted Stock Units
Effective February 10, 2011, the Board of Directors of Parent adopted and approved a Restricted Stock Unit Plan (the “RSU Plan”). The purpose of the RSU Plan is to provide executives and certain key employees with the
102
Table of Contents
Biomet, Inc. and Subsidiaries Notes to Consolidated Financial Statements (continued)
Note 11—Share-based Compensation and Stock Plans, Continued.
opportunity to receive stock-based performance incentives to retain qualified individuals and to align their interests with the interests of the stockholders. The maximum number of shares of common stock, par value $0.01 per share, that may be issued under the RSU Plan is 4,000,000, subject to adjustment as described in the RSU Plan. Under the terms of the RSU Plan, the Compensation Committee of the Board of Directors may grant participants restricted stock units each of which represents the right to receive one share of common stock, subject to certain vesting restrictions and risk of forfeiture. There have been 3,835,000 restricted stock units granted as of May 31, 2011 at an average grant date value of $10 per share. Once granted, the restricted stock units will be expensed over the required award service period. The restricted stock units vest under certain time-vesting and liquidity event conditions.
The following table summarizes RSU activity for the year ended May 31, 2011:
| RSUs | Weighted Average Grant Date Fair Value |
|||||||
| Outstanding at June 1, 2010 |
— | $ | — | |||||
| Granted |
3,835,000 | 10.00 | ||||||
| Vested |
— | — | ||||||
| Forfeited |
— | — | ||||||
|
|
|
|
|
|||||
| Oustanding at May 31, 2011 |
3,835,000 | $ | 10.00 | |||||
|
|
|
|
|
|||||
The restricted stock units are measured at their grant date fair value. The expense is recognized for the restricted stock units ultimately expected to vest, using the straight line method over the service period, which is estimated at approximately five years from the initial grant date for the grants made in the year ended May 31, 2011. As of May 31, 2011, there was approximately $34.4 million of unrecognized share-based compensation expense related to nonvested restricted stock units granted under the RSU Plan and is expected to be recognized over a weighted average period of 5.0 years.
Note 12—Income Taxes
The components of loss before income taxes are as follows:
| (in millions) | Year Ended May 31, 2011 |
Year Ended May 31, 2010 |
Year Ended May 31, 2009 |
|||||||||
| Domestic |
$ | (238.2 | ) | $ | (201.7 | ) | $ | (510.4 | ) | |||
| Foreign |
(826.4 | ) | 60.0 | (410.0 | ) | |||||||
|
|
|
|
|
|
|
|||||||
| Total loss before income taxes |
$ | (1,064.6 | ) | $ | (141.7 | ) | $ | (920.4 | ) | |||
|
|
|
|
|
|
|
|||||||
103
Table of Contents
Biomet, Inc. and Subsidiaries Notes to Consolidated Financial Statements (continued)
Note 12—Income Taxes, Continued.
The income tax benefit is summarized as follows:
| (in millions) | Year Ended May 31, 2011 |
Year Ended May 31, 2010 |
Year Ended May 31, 2009 |
|||||||||
| Current: |
||||||||||||
| Federal |
$ | (13.3 | ) | $ | 3.9 | $ | 26.7 | |||||
| State |
11.1 | 0.9 | 1.4 | |||||||||
| Foreign |
53.9 | 50.2 | 42.8 | |||||||||
|
|
|
|
|
|
|
|||||||
| Subtotal |
51.7 | 55.0 | 70.9 | |||||||||
| Deferred: |
||||||||||||
| Federal |
(43.1 | ) | (98.7 | ) | (160.7 | ) | ||||||
| State |
(51.2 | ) | (15.7 | ) | (23.3 | ) | ||||||
| Foreign |
(172.2 | ) | (34.7 | ) | (58.1 | ) | ||||||
|
|
|
|
|
|
|
|||||||
| Subtotal |
(266.5 | ) | (149.1 | ) | (242.1 | ) | ||||||
|
|
|
|
|
|
|
|||||||
| Total income tax benefit |
$ | (214.8 | ) | $ | (94.1 | ) | $ | (171.2 | ) | |||
|
|
|
|
|
|
|
|||||||
A reconciliation of the statutory federal income tax rate to the Company’s U.S. effective tax rate is as follows:
| Year Ended May 31, 2011 |
Year Ended May 31, 2010 |
Year Ended May 31, 2009 |
||||||||||
| U.S. statutory income tax rate |
(35.0 | )% | (35.0 | )% | (35.0 | )% | ||||||
| State taxes, net of federal deduction |
(0.6 | ) | (8.4 | ) | (2.6 | ) | ||||||
| Foreign income taxed at rates different from the U.S. statutory rate |
(2.8 | ) | (19.8 | ) | (1.5 | ) | ||||||
| Tax benefit relating to operations in Puerto Rico |
— | — | (0.5 | ) | ||||||||
| Tax credits and other carryovers |
(0.1 | ) | (4.3 | ) | (0.2 | ) | ||||||
| Change in liability for uncertain tax positions |
1.7 | 9.6 | — | |||||||||
| Adjustment of prior estimates, net of valuation allowance |
5.2 | (5.6 | ) | — | ||||||||
| Goodwill impairment |
13.9 | — | 18.8 | |||||||||
| Change in tax laws and rates |
(4.4 | ) | (7.1 | ) | — | |||||||
| Losses and other expenses not deductible for tax |
2.6 | 7.0 | — | |||||||||
| Tax on foreign earnings, net of foreign tax credits |
0.5 | (0.4 | ) | — | ||||||||
| Other |
(1.2 | ) | (2.4 | ) | 2.4 | |||||||
|
|
|
|
|
|
|
|||||||
| Effective tax rate |
(20.2 | )% | (66.4 | )% | (18.6 | )% | ||||||
|
|
|
|
|
|
|
|||||||
104
Table of Contents
Biomet, Inc. and Subsidiaries Notes to Consolidated Financial Statements (continued)
Note 12—Income Taxes, Continued.
The components of the net deferred income tax assets and liabilities at May 31, 2011 and 2010 are as follows:
| (in millions) | 2011 | 2010 | ||||||
| Deferred income tax assets: |
||||||||
| Accounts receivable |
$ | 19.1 | $ | 18.2 | ||||
| Inventories |
47.5 | 45.9 | ||||||
| Accrued expenses |
50.1 | 67.1 | ||||||
| Tax benefit of net operating losses, tax credits and other carryforwards |
41.5 | 99.8 | ||||||
| Future benefit of uncertain tax positions |
20.3 | 18.2 | ||||||
| Share-based compensation |
33.3 | 30.2 | ||||||
| Swap liability |
36.9 | 50.1 | ||||||
| Other |
33.5 | 5.6 | ||||||
|
|
|
|
|
|||||
| Deferred income tax assets |
$ | 282.2 | $ | 335.1 | ||||
| Less: Valuation allowance |
(38.1 | ) | (38.6 | ) | ||||
|
|
|
|
|
|||||
| Total deferred income tax assets |
$ | 244.1 | $ | 296.5 | ||||
| Deferred income tax liabilities: |
||||||||
| Property, plant, equipment and intangibles |
(1,642.0 | ) | (1,892.0 | ) | ||||
| Other |
(18.2 | ) | (15.1 | ) | ||||
|
|
|
|
|
|||||
| Total deferred income tax liabilities |
(1,660.2 | ) | (1,907.1 | ) | ||||
|
|
|
|
|
|||||
| Total net deferred income tax liabilities |
$ | (1,416.1 | ) | $ | (1,610.6 | ) | ||
|
|
|
|
|
|||||
The Company’s deferred tax assets include federal, state, and foreign net operating loss carryforwards of $22.7 million, $36.3 million ($23.6 million, net of federal benefit) and $107.3 million, respectively. Federal net operating loss carryforwards available are $64.9 million, which begin to expire in 2028. The Company believes it is more likely than not that it will be able to utilize the federal net operating loss carryforwards. The state and foreign net operating loss carryforwards are from various jurisdictions with various carryforward periods.
Deferred tax assets related to tax credits and other carryforwards total $16.7 million as of May 31, 2011. This includes a deferred tax asset for foreign tax credit carryforwards in the amount of $25.9 million, which begin to expire in 2018. The Company believes it is more likely than not that it will be able to utilize the foreign tax credit carryforwards.
As of May 31, 2011, the Company has a $38.1 million valuation allowance against deferred tax assets. This valuation allowance consists of $32.2 million relating to net deferred tax assets for unrealized losses on investments, $129.3 million for net deferred tax assets related to state and foreign net operating losses that management believes, more likely than not, will not be realized, and $0.7 million relating to realized capital losses for which capital gains are not currently expected in the future.
The Company has not provided for deferred taxes on certain of its excess of financial reporting over the tax basis of its investments in foreign subsidiaries that are essentially permanent in duration. Upon distribution of those earnings in the form of dividends or otherwise, the Company would be subject to U.S. income taxes (subject to an adjustment for foreign tax credits) and withholding taxes payable to the various foreign countries. Determination of the amount of any unrecognized deferred income tax liability on these undistributed earnings is not practicable.
105
Table of Contents
Biomet, Inc. and Subsidiaries Notes to Consolidated Financial Statements (continued)
Note 12—Income Taxes, Continued.
The Company has not recorded deferred taxes on its excess of financial reporting over the tax basis on certain of its investments in foreign subsidiaries related to current period earnings that are not considered to be indefinitely reinvested. The Company believes that there will not be a significant additional cost associated with the future repatriation of such foreign earnings.
A reconciliation of the beginning and ending amount of unrecognized tax benefits is as follows:
| (in millions) | May 31, 2011 | May 31, 2010 | May 31, 2009 | |||||||||
| Unrecognized tax benefits beginning of period |
$ | 73.8 | $ | 63.1 | $ | 50.9 | ||||||
| Gross increases - current-period tax positions |
20.0 | 13.8 | 14.8 | |||||||||
| Gross decreases - current-period tax positions |
— | — | — | |||||||||
| Gross increases - tax positions in prior period |
7.1 | 1.6 | 14.0 | |||||||||
| Gross decreases - tax positions in prior period |
(1.9 | ) | (4.3 | ) | (11.5 | ) | ||||||
| Settlements during the current period |
— | (0.2 | ) | (0.7 | ) | |||||||
| Lapse of applicable statute of limitations |
(8.1 | ) | (0.2 | ) | (4.4 | ) | ||||||
|
|
|
|
|
|
|
|||||||
| Unrecognized tax benefits, end of period |
$ | 90.9 | $ | 73.8 | $ | 63.1 | ||||||
|
|
|
|
|
|
|
|||||||
Included in the amount of unrecognized tax benefits at May 31, 2011 and 2010 are $82.9 million and $64.9 million, respectively, of tax benefits that would impact the Company’s effective tax rate, if recognized.
The Company recognizes accrued interest and penalties related to unrecognized tax benefits as a component of income tax expense. Related to unrecognized tax benefits noted above, the Company accrued interest of $3.1 million and $2.0 million during the years ended May 31, 2011 and 2010, respectively. As of May 31, 2011 and 2010, the Company has recognized a liability for interest of $12.3 million and $9.2 million, respectively. The Company accrued and recognized an immaterial amount of penalties for the years disclosed.
The Company conducts business globally and, as a result, certain of its subsidiaries file income tax returns in the U.S. federal jurisdiction, and various state and foreign jurisdictions. In the normal course of business, the Company is subject to examinations by taxing authorities throughout the world, including major jurisdictions such as Australia, Canada, France, Germany, Japan, Netherlands, Spain, the United Kingdom and the United States. In addition, certain state and foreign tax returns are under examination by various regulatory authorities. The Internal Revenue Service recently completed its examination relating to the Company’s U.S. federal income tax returns for the years ended May 31, 2007, July 11, 2007 and May 31, 2008. The Company is no longer subject to U.S. federal income tax examinations for the fiscal years prior to and including the year ended May 31, 2002, as well as May 31, 2005 and May 31, 2006.
The Company regularly reviews issues that are raised from ongoing examinations and open tax years to evaluate the adequacy of its liabilities. As the various taxing authorities continue with their audit/examination programs, the Company will adjust its reserves accordingly to reflect these settlements. As of May 31, 2011, the Company believes that it is reasonably possible that up to $23.0 million of its worldwide gross liabilities for unrecognized tax benefits (none of which are individually significant) may be recognized within the succeeding twelve months due to potential tax settlements. Based on management estimates, an additional $15.0 million to $20.0 million of worldwide gross liabilities for unrecognized tax benefits may be recorded within the succeeding 12 months.
106
Table of Contents
Biomet, Inc. and Subsidiaries Notes to Consolidated Financial Statements (continued)
Note 12—Income Taxes, Continued.
Puerto Rico Tax Legislation
On October 25, 2010, the government of Puerto Rico passed legislation that established a new excise tax on the purchases of products manufactured in Puerto Rico, effective January 1, 2011. Puerto Rico has subsequently provided an exemption to the excise tax provided certain employment levels are met. Management anticipates meeting these employment levels and thus expects the Company to be subject to an alternative income tax rather than the excise tax. Management does not expect this new alternative income tax to have a material impact on its financial statements.
United States Tax Legislation
Congress approved, and President Obama signed into law, The Tax Relief, Unemployment Insurance Reauthorization, and Job Creation Act of 2010, enacted December 17, 2010. This legislation includes temporary extensions of several business tax incentives, including the research and experimentation tax credit, the New Markets Tax Credit, 15-year straight-line cost recovery for qualified leasehold improvements, the exception for active financing income under Subpart F and look-through treatment of payments between related controlled foreign corporations. As a result, these extensions were included, where applicable, in determining the Company’s effective tax rate for the year ended May 31, 2011.
Note 13—Segment Reporting.
The Company operates in one reportable segment, musculoskeletal products, which includes the designing, manufacturing and marketing of reconstructive products, fixation devices, spinal products and other products. Other products consist primarily of softgoods and bracing products, sports medicine products, general instruments and operating room supplies. The Company operates in various geographies. These geographic markets are comprised of the United States, Europe and International. Major markets included in the International geographic market are Canada, South America, Mexico and the Asia Pacific.
Net sales by product category for the years ended May 31, 2011, 2010 and 2009 were as follows:
| (in millions) | Year Ended May 31, 2011 |
Year Ended May 31, 2010(1) |
Year Ended May 31, 2009(2) |
|||||||||
| Net sales by product: |
||||||||||||
| Reconstructive |
$ | 2,084.2 | $ | 2,046.4 | $ | 1,873.1 | ||||||
| Fixation |
232.9 | 242.0 | 236.4 | |||||||||
| Spinal |
224.9 | 232.0 | 216.9 | |||||||||
| Other |
190.2 | 177.6 | 177.7 | |||||||||
|
|
|
|
|
|
|
|||||||
| Total |
$ | 2,732.2 | $ | 2,698.0 | $ | 2,504.1 | ||||||
|
|
|
|
|
|
|
|||||||
| (1) | Certain amounts have been adjusted to conform to the current presentation. Specifically, reconstructive product net sales increased, and other product net sales decreased, $21.9 million for the year ended May 31, 2010. Fixation product net sales increased, and spinal product net sales decreased, $4.2 million for the year ended May 31, 2010. The current presentation aligns with how the Company presently manages and markets its products. |
| (2) | Certain amounts have been adjusted to conform to the current presentation. Specifically, reconstructive product net sales increased by $22.1 million, fixation product net sales increased by $2.3 million, spinal product net sales decreased by $5.2 million and other product net sales decreased by $19.2 million for the year ended May 31, 2009. The current presentation aligns with how the Company presently manages and markets its products. |
107
Table of Contents
Biomet, Inc. and Subsidiaries Notes to Consolidated Financial Statements (continued)
Note 13—Segment Reporting, Continued.
Net sales by geography for the years ended May 31, 2011, 2010 and 2009 were as follows:
| (in millions) | Year Ended May 31, 2011 |
Year Ended May 31, 2010(1) |
Year Ended May 31, 2009(1) |
|||||||||
| Net sales by geography: |
||||||||||||
| United States |
$ | 1,660.0 | $ | 1,644.1 | $ | 1,527.9 | ||||||
| Europe |
697.8 | 724.5 | 708.4 | |||||||||
| International(2) |
374.4 | 329.4 | 267.8 | |||||||||
|
|
|
|
|
|
|
|||||||
| Total |
$ | 2,732.2 | $ | 2,698.0 | $ | 2,504.1 | ||||||
|
|
|
|
|
|
|
|||||||
| (1) | Certain amounts have been adjusted to conform to the current presentation. Specifically, International net sales increased, and Europe net sales decreased, $4.3 million and $3.3 million for the years ended May 31, 2010 and 2009, respectively. The current presentation aligns with how the Company presently manages and markets its products. |
| (2) | International primarily includes Canada, South America, Mexico and the Asia Pacific. |
Long-term assets by geography as of May 31, 2011 and 2010 were as follows:
| (in millions) | May 31, 2011 | May 31, 2010 | ||||||
| Long-term assets (1) by geography: |
||||||||
| United States |
$ | 7,199.7 | $ | 7,508.0 | ||||
| Europe |
1,233.7 | 1,939.6 | ||||||
| International |
1,209.5 | 1,072.2 | ||||||
|
|
|
|
|
|||||
| Total |
$ | 9,642.9 | $ | 10,519.8 | ||||
|
|
|
|
|
|||||
| (1) | Defined as property, plant and equipment, intangibles and goodwill. |
Note 14—Guarantor and Non-guarantor Financial Statements.
Each of the Company’s existing wholly-owned domestic subsidiaries are fully, unconditionally, jointly, and severally guaranteeing the senior cash pay and PIK toggle notes on a senior unsecured basis and the senior subordinated notes on a senior subordinated unsecured basis, in each case to the extent such subsidiaries guarantee the Company’s senior secured cash flow facilities.
108
Table of Contents
Biomet, Inc. and Subsidiaries Notes to Consolidated Financial Statements (continued)
Note 14—Guarantor and Non-guarantor Financial Statements, Continued.
The following financial information illustrates the composition of the combined guarantor subsidiaries:
CONSOLIDATING BALANCE SHEETS
| May 31, 2011 | ||||||||||||||||||||
| (in millions) | Biomet, Inc. | Guarantors | Non-Guarantors | Eliminations | Total | |||||||||||||||
| Assets |
||||||||||||||||||||
| Current assets: |
||||||||||||||||||||
| Cash and cash equivalents |
$ | — | $ | 176.4 | $ | 151.4 | $ | — | $ | 327.8 | ||||||||||
| Accounts receivable, net |
— | 221.6 | 258.5 | — | 480.1 | |||||||||||||||
| Investments |
— | 33.4 | 8.0 | — | 41.4 | |||||||||||||||
| Income tax receivable |
— | 4.1 | 1.3 | — | 5.4 | |||||||||||||||
| Inventories, net |
— | 292.1 | 414.7 | (124.3 | ) | 582.5 | ||||||||||||||
| Deferred income taxes |
— | 60.3 | 11.2 | — | 71.5 | |||||||||||||||
| Prepaid expenses and other |
— | 57.1 | 52.6 | — | 109.7 | |||||||||||||||
|
|
|
|
|
|
|
|
|
|
|
|||||||||||
| Total current assets |
— | 845.0 | 897.7 | (124.3 | ) | 1,618.4 | ||||||||||||||
| Property, plant and equipment, net |
— | 332.5 | 315.8 | (9.9 | ) | 638.4 | ||||||||||||||
| Investments |
— | 10.0 | 23.1 | 33.1 | ||||||||||||||||
| Investment in subsidiaries |
9,253.9 | — | — | (9,253.9 | ) | — | ||||||||||||||
| Intangible assets, net |
— | 3,416.6 | 1,117.8 | — | 4,534.4 | |||||||||||||||
| Goodwill |
— | 3,460.8 | 1,009.3 | — | 4,470.1 | |||||||||||||||
| Other assets |
— | 56.3 | 6.3 | — | 62.6 | |||||||||||||||
|
|
|
|
|
|
|
|
|
|
|
|||||||||||
| Total assets |
$ | 9,253.9 | $ | 8,121.2 | $ | 3,370.0 | $ | (9,388.1 | ) | $ | 11,357.0 | |||||||||
|
|
|
|
|
|
|
|
|
|
|
|||||||||||
| Liabilities & Shareholder’s Equity |
||||||||||||||||||||
| Current liabilities: |
||||||||||||||||||||
| Current portion of long-term debt |
$ | 35.9 | $ | — | $ | 1.5 | $ | — | $ | 37.4 | ||||||||||
| Accounts payable |
— | 48.1 | 43.0 | — | 91.1 | |||||||||||||||
| Accrued interest |
64.1 | — | — | — | 64.1 | |||||||||||||||
| Accrued wages and commissions |
— | 56.7 | 48.3 | — | 105.0 | |||||||||||||||
| Other accrued expenses |
— | 153.5 | 88.3 | — | 241.8 | |||||||||||||||
|
|
|
|
|
|
|
|
|
|
|
|||||||||||
| Total current liabilities |
100.0 | 258.3 | 181.1 | — | 539.4 | |||||||||||||||
| Long-term debt |
5,978.8 | — | 4.1 | — | 5,982.9 | |||||||||||||||
| Deferred income taxes |
— | 1,126.1 | 361.5 | — | 1,487.6 | |||||||||||||||
| Other long-term liabilities |
— | 130.8 | 41.2 | — | 172.0 | |||||||||||||||
|
|
|
|
|
|
|
|
|
|
|
|||||||||||
| Total liabilities |
6,078.8 | 1,515.2 | 587.9 | — | 8,181.9 | |||||||||||||||
| Shareholder’s equity |
3,175.1 | 6,606.0 | 2,782.1 | (9,388.1 | ) | 3,175.1 | ||||||||||||||
|
|
|
|
|
|
|
|
|
|
|
|||||||||||
| Total liabilities and shareholder’s equity |
$ | 9,253.9 | $ | 8,121.2 | $ | 3,370.0 | $ | (9,388.1 | ) | $ | 11,357.0 | |||||||||
|
|
|
|
|
|
|
|
|
|
|
|||||||||||
109
Table of Contents
Biomet, Inc. and Subsidiaries Notes to Consolidated Financial Statements (continued)
Note 14—Guarantor and Non-guarantor Financial Statements, Continued.
| May 31, 2010 | ||||||||||||||||||||
| (in millions) | Biomet, Inc. | Guarantors | Non-Guarantors | Eliminations | Total | |||||||||||||||
| Assets |
||||||||||||||||||||
| Current assets: |
||||||||||||||||||||
| Cash and cash equivalents |
$ | — | $ | 103.5 | $ | 85.6 | $ | — | $ | 189.1 | ||||||||||
| Accounts receivable, net |
— | 248.7 | 203.8 | — | 452.5 | |||||||||||||||
| Income tax receivable |
— | 18.7 | 0.5 | — | 19.2 | |||||||||||||||
| Inventories, net |
— | 288.7 | 283.2 | (64.6 | ) | 507.3 | ||||||||||||||
| Deferred income taxes |
— | 48.6 | 15.7 | — | 64.3 | |||||||||||||||
| Prepaid expenses and other |
— | 34.5 | 38.1 | — | 72.6 | |||||||||||||||
|
|
|
|
|
|
|
|
|
|
|
|||||||||||
| Total current assets |
— | 742.7 | 626.9 | (64.6 | ) | 1,305.0 | ||||||||||||||
| Property, plant and equipment, net |
— | 374.1 | 253.8 | (5.9 | ) | 622.0 | ||||||||||||||
| Investments |
— | 23.3 | — | — | 23.3 | |||||||||||||||
| Investment in subsidiaries |
9,693.9 | — | — | (9,693.9 | ) | — | ||||||||||||||
| Intangible assets, net |
— | 3,678.5 | 1,511.8 | — | 5,190.3 | |||||||||||||||
| Goodwill |
— | 3,461.4 | 1,246.1 | — | 4,707.5 | |||||||||||||||
| Other assets |
— | 70.5 | 50.4 | — | 120.9 | |||||||||||||||
|
|
|
|
|
|
|
|
|
|
|
|||||||||||
| Total assets |
$ | 9,693.9 | $ | 8,350.5 | $ | 3,689.0 | $ | (9,764.4 | ) | $ | 11,969.0 | |||||||||
|
|
|
|
|
|
|
|
|
|
|
|||||||||||
| Liabilities & Shareholder’s Equity |
||||||||||||||||||||
| Current liabilities: |
||||||||||||||||||||
| Current portion of long-term debt |
$ | 34.1 | $ | — | $ | 1.5 | $ | — | $ | 35.6 | ||||||||||
| Accounts payable |
— | 48.8 | 37.5 | — | 86.3 | |||||||||||||||
| Accrued interest |
70.2 | — | — | — | 70.2 | |||||||||||||||
| Accrued wages and commissions |
— | 70.3 | 41.0 | — | 111.3 | |||||||||||||||
| Other accrued expenses |
— | 167.3 | 47.8 | — | 215.1 | |||||||||||||||
|
|
|
|
|
|
|
|
|
|
|
|||||||||||
| Total current liabilities |
104.3 | 286.4 | 127.8 | — | 518.5 | |||||||||||||||
| Long-term debt |
5,856.1 | — | 4.8 | — | 5,860.9 | |||||||||||||||
| Deferred income taxes |
— | 1,216.3 | 458.6 | — | 1,674.9 | |||||||||||||||
| Other long-term liabilities |
— | 147.6 | 33.6 | — | 181.2 | |||||||||||||||
|
|
|
|
|
|
|
|
|
|
|
|||||||||||
| Total liabilities |
5,960.4 | 1,650.3 | 624.8 | — | 8,235.5 | |||||||||||||||
| Shareholder’s equity |
3,733.5 | 6,700.2 | 3,064.2 | (9,764.4 | ) | 3,733.5 | ||||||||||||||
|
|
|
|
|
|
|
|
|
|
|
|||||||||||
| Total liabilities and shareholder’s equity |
$ | 9,693.9 | $ | 8,350.5 | $ | 3,689.0 | $ | (9,764.4 | ) | $ | 11,969.0 | |||||||||
|
|
|
|
|
|
|
|
|
|
|
|||||||||||
110
Table of Contents
Biomet, Inc. and Subsidiaries Notes to Consolidated Financial Statements (continued)
Note 14—Guarantor and Non-guarantor Financial Statements, Continued.
CONSOLIDATING STATEMENTS OF OPERATIONS
| Year Ended May 31, 2011 | ||||||||||||||||||||
| (in millions) | Biomet, Inc. | Guarantors | Non-Guarantors | Eliminations | Total | |||||||||||||||
| Net sales |
$ | — | $ | 1,716.5 | $ | 1,015.7 | $ | — | $ | 2,732.2 | ||||||||||
| Cost of sales |
— | 542.8 | 544.2 | (248.3 | ) | 838.7 | ||||||||||||||
|
|
|
|
|
|
|
|
|
|
|
|||||||||||
| Gross profit |
— | 1,173.7 | 471.5 | 248.3 | 1,893.5 | |||||||||||||||
| Goodwill and intangible asset impairment charge |
— | — | 941.4 | — | 941.4 | |||||||||||||||
| Operating expenses |
— | 1,002.3 | 526.7 | — | 1,529.0 | |||||||||||||||
|
|
|
|
|
|
|
|
|
|
|
|||||||||||
| Operating income (loss) |
— | 171.4 | (996.6 | ) | 248.3 | (576.9 | ) | |||||||||||||
| Other (income) expense, net |
493.9 | (9.8 | ) | 3.6 | — | 487.7 | ||||||||||||||
|
|
|
|
|
|
|
|
|
|
|
|||||||||||
| Income (loss) before income taxes |
(493.9 | ) | 181.2 | (1,000.2 | ) | 248.3 | (1,064.6 | ) | ||||||||||||
| Tax expense (benefit) |
(187.2 | ) | 109.8 | (122.1 | ) | (15.3 | ) | (214.8 | ) | |||||||||||
| Equity in earnings of subsidiaries |
(543.1 | ) | — | — | 543.1 | — | ||||||||||||||
|
|
|
|
|
|
|
|
|
|
|
|||||||||||
| Net income (loss) |
$ | (849.8 | ) | $ | 71.4 | $ | (878.1 | ) | $ | 806.7 | $ | (849.8 | ) | |||||||
|
|
|
|
|
|
|
|
|
|
|
|||||||||||
| Year Ended May 31, 2010 | ||||||||||||||||||||
| (in millions) | Biomet, Inc. | Guarantors | Non-Guarantors | Eliminations | Total | |||||||||||||||
| Net sales |
$ | — | $ | 1,710.4 | $ | 987.6 | $ | — | $ | 2,698.0 | ||||||||||
| Cost of sales |
— | 482.1 | 497.3 | (159.5 | ) | 819.9 | ||||||||||||||
|
|
|
|
|
|
|
|
|
|
|
|||||||||||
| Gross profit |
— | 1,228.3 | 490.3 | 159.5 | 1,878.1 | |||||||||||||||
| Operating expenses |
— | 996.4 | 525.1 | — | 1,521.5 | |||||||||||||||
|
|
|
|
|
|
|
|
|
|
|
|||||||||||
| Operating income (loss) |
— | 231.9 | (34.8 | ) | 159.5 | 356.6 | ||||||||||||||
| Other (income) expense, net |
514.1 | (4.0 | ) | (11.8 | ) | — | 498.3 | |||||||||||||
|
|
|
|
|
|
|
|
|
|
|
|||||||||||
| Income (loss) before income taxes |
(514.1 | ) | 235.9 | (23.0 | ) | 159.5 | (141.7 | ) | ||||||||||||
| Tax expense (benefit) |
(200.5 | ) | 87.2 | (4.2 | ) | 23.4 | (94.1 | ) | ||||||||||||
| Equity in earnings of subsidiaries |
266.0 | — | — | (266.0 | ) | — | ||||||||||||||
|
|
|
|
|
|
|
|
|
|
|
|||||||||||
| Net income (loss) |
$ | (47.6 | ) | $ | 148.7 | $ | (18.8 | ) | $ | (129.9 | ) | $ | (47.6 | ) | ||||||
|
|
|
|
|
|
|
|
|
|
|
|||||||||||
| Year Ended May 31, 2009 | ||||||||||||||||||||
| (in millions) | Biomet, Inc. | Guarantors | Non-Guarantors | Eliminations | Total | |||||||||||||||
| Net sales |
$ | — | $ | 1,589.1 | $ | 915.0 | $ | — | $ | 2,504.1 | ||||||||||
| Cost of sales |
— | 503.5 | 439.3 | (114.4 | ) | 828.4 | ||||||||||||||
|
|
|
|
|
|
|
|
|
|
|
|||||||||||
| Gross profit |
— | 1,085.6 | 475.7 | 114.4 | 1,675.7 | |||||||||||||||
| Goodwill and intangible asset impairment charge |
— | — | 551.1 | — | 551.1 | |||||||||||||||
| Operating expenses |
— | 976.4 | 496.5 | — | 1,472.9 | |||||||||||||||
|
|
|
|
|
|
|
|
|
|
|
|||||||||||
| Operating income (loss) |
— | 109.2 | (571.9 | ) | 114.4 | (348.3 | ) | |||||||||||||
| Other expense, net |
545.7 | 10.9 | 10.2 | 5.3 | 572.1 | |||||||||||||||
|
|
|
|
|
|
|
|
|
|
|
|||||||||||
| Income (loss) before income taxes |
(545.7 | ) | 98.3 | (582.1 | ) | 109.1 | (920.4 | ) | ||||||||||||
| Tax expense (benefit) |
(101.5 | ) | (2.9 | ) | (87.1 | ) | 20.3 | (171.2 | ) | |||||||||||
| Equity in earnings of subsidiaries |
(305.0 | ) | — | — | 305.0 | — | ||||||||||||||
|
|
|
|
|
|
|
|
|
|
|
|||||||||||
| Net income (loss) |
$ | (749.2 | ) | $ | 101.2 | $ | (495.0 | ) | $ | 393.8 | $ | (749.2 | ) | |||||||
|
|
|
|
|
|
|
|
|
|
|
|||||||||||
111
Table of Contents
Biomet, Inc. and Subsidiaries Notes to Consolidated Financial Statements (continued)
Note 14—Guarantor and Non-guarantor Financial Statements, Continued.
CONSOLIDATING STATEMENTS OF CASH FLOWS
| Year Ended May 31, 2011 | ||||||||||||||||||||
| (in millions) | Biomet, Inc. | Guarantor | Non-Guarantors | Eliminations | Total | |||||||||||||||
| Cash flows provided by (used in) operating activities |
$ | (844.7 | ) | $ | 284.6 | $ | 133.4 | $ | 806.8 | $ | 380.1 | |||||||||
| Cash flows provided by (used in) investing activities |
894.4 | (211.7 | ) | (80.9 | ) | (806.8 | ) | (205.0 | ) | |||||||||||
| Cash flows used in financing activities |
(49.7 | ) | — | (1.7 | ) | — | (51.4 | ) | ||||||||||||
| Effect of exchange rate changes on cash |
— | — | 15.0 | — | 15.0 | |||||||||||||||
|
|
|
|
|
|
|
|
|
|
|
|||||||||||
| Increase (decrease) in cash and cash equivalents |
— | 72.9 | 65.8 | — | 138.7 | |||||||||||||||
| Cash and cash equivalents, beginning of period |
— | 103.5 | 85.6 | — | 189.1 | |||||||||||||||
|
|
|
|
|
|
|
|
|
|
|
|||||||||||
| Cash and cash equivalents, end of period |
$ | — | $ | 176.4 | $ | 151.4 | $ | — | $ | 327.8 | ||||||||||
|
|
|
|
|
|
|
|
|
|
|
|||||||||||
| Year Ended May 31, 2010 | ||||||||||||||||||||
| (in millions) | Biomet, Inc. | Guarantor | Non-Guarantors | Eliminations | Total | |||||||||||||||
| Cash flows provided by (used in) operating activities |
$ | (40.0 | ) | $ | 391.5 | $ | 99.9 | $ | (129.9 | ) | $ | 321.5 | ||||||||
| Cash flows provided by (used in) investing activities |
151.4 | (466.9 | ) | 3.6 | 129.9 | (182.0 | ) | |||||||||||||
| Cash flows used in financing activities |
(111.4 | ) | — | (48.5 | ) | — | (159.9 | ) | ||||||||||||
| Effect of exchange rate changes on cash |
— | — | (6.1 | ) | — | (6.1 | ) | |||||||||||||
|
|
|
|
|
|
|
|
|
|
|
|||||||||||
| Increase (decrease) in cash and cash equivalents |
— | (75.4 | ) | 48.9 | — | (26.5 | ) | |||||||||||||
| Cash and cash equivalents, beginning of period |
— | 178.9 | 36.7 | — | 215.6 | |||||||||||||||
|
|
|
|
|
|
|
|
|
|
|
|||||||||||
| Cash and cash equivalents, end of period |
$ | — | $ | 103.5 | $ | 85.6 | $ | — | $ | 189.1 | ||||||||||
|
|
|
|
|
|
|
|
|
|
|
|||||||||||
| Year Ended May 31, 2009 | ||||||||||||||||||||
| (in millions) | Biomet, Inc. | Guarantor | Non-Guarantors | Eliminations | Total | |||||||||||||||
| Cash flows provided by (used in) operating activities |
$ | (746.2 | ) | $ | 431.6 | $ | 164.5 | $ | 393.9 | $ | 243.8 | |||||||||
| Cash flows provided by (used in) investing activities |
713.9 | (353.7 | ) | (161.2 | ) | (393.9 | ) | (194.9 | ) | |||||||||||
| Cash flows provided by financing activities |
32.3 | — | 10.2 | — | 42.5 | |||||||||||||||
| Effect of exchange rate changes on cash |
— | — | (3.4 | ) | — | (3.4 | ) | |||||||||||||
|
|
|
|
|
|
|
|
|
|
|
|||||||||||
| Increase in cash and cash equivalents |
— | 77.9 | 10.1 | — | 88.0 | |||||||||||||||
| Cash and cash equivalents, beginning of period |
— | 101.0 | 26.6 | — | 127.6 | |||||||||||||||
|
|
|
|
|
|
|
|
|
|
|
|||||||||||
| Cash and cash equivalents, end of period |
$ | — | $ | 178.9 | $ | 36.7 | $ | — | $ | 215.6 | ||||||||||
|
|
|
|
|
|
|
|
|
|
|
|||||||||||
112
Table of Contents
Biomet, Inc. and Subsidiaries Notes to Consolidated Financial Statements (continued)
Note 15—Restructuring
In fiscal 2009 the Company initiated a global cost savings program to better manage its cost base in response to the slowdown in consumer spending negatively affecting sales and operating margins and to improve overall operating effectiveness. The program included the termination of approximately 488 employees and the closure of certain manufacturing and distribution locations in fiscal 2009 and continuing through fiscal years 2010 and 2011.
The Company recorded $10.0 million, $6.2 million and $11.0 million in employee severance costs during the years ended May 31, 2011, 2010 and 2009, respectively. The expense during fiscal 2011 results primarily from the transition of our trauma hardware business from our Parsippany, New Jersey operations to our Warsaw, Indiana-based U.S. Orthopedics division. These restructuring charges were recorded within cost of sales, selling, general and administrative expense, and research and development expense. A summary of the severance and benefit costs in the periods presented is as follows:
| (in millions) | Employee Severance and Benefit Costs |
|||
| Restructuring Accrual: |
||||
| Balance at May 31, 2008 |
$ | — | ||
| Costs incurred and charged to expense |
11.0 | |||
| Costs paid or otherwise settled |
(5.7 | ) | ||
| Non-cash adjustments (1) |
0.3 | |||
|
|
|
|||
| Balance at May 31, 2009 |
5.6 | |||
| Costs incurred and charged to expense |
6.2 | |||
| Costs paid or otherwise settled |
(8.6 | ) | ||
| Non-cash adjustments (1) |
(0.4 | ) | ||
|
|
|
|||
| Balance at May 31, 2010 |
2.8 | |||
| Costs incurred and charged to expense |
10.0 | |||
| Costs paid or otherwise settled |
(7.0 | ) | ||
| Non-cash adjustments (1) |
0.1 | |||
|
|
|
|||
| Balance at May 31, 2011 |
$ | 5.9 | ||
|
|
|
|||
| (1) | Primarily related to foreign currency fluctuations. |
In the fourth quarter of fiscal 2011, the Company announced plans for a global reconstructive products reorganization program. The program includes the reorganization of our domestic and international reconstructive products corporate structure. In addition, the Company is in the process of a reduction of force at certain manufacturing facilities due to the continued lower than expected product sales volumes. The Company expects to eliminate up to 200 positions and expects a range of severance and other related costs of $10.0 million to $15.0 million.
Note 16—Contingencies.
U.S. Department of Justice Consulting Agreement Investigation
On September 27, 2007, the Company entered into a Deferred Prosecution Agreement with the U.S. Attorney’s Office for the District of New Jersey. The agreement concluded the government’s investigation into whether consulting agreements between the largest orthopedic manufacturers and orthopedic surgeons who use joint reconstruction and replacement products may have violated the federal Anti-Kickback Statute.
113
Table of Contents
Biomet, Inc. and Subsidiaries Notes to Consolidated Financial Statements (continued)
Note 16—Contingencies, Continued.
Through the agreement, the U.S. Attorney’s Office agreed not to prosecute the Company in connection with this matter, provided that the Company satisfied its obligations under the agreement over the 18 months following the date of the Deferred Prosecution Agreement. The agreement called for the appointment of an independent monitor to review the Company’s compliance with the agreement, particularly in relation to its consulting agreements. On March 27, 2009, the Deferred Prosecution Agreement expired and the complaint was dismissed with prejudice.
As part of the resolution of this matter, the Company also entered into a Corporate Integrity Agreement with the Office of the Inspector General of the U.S. Department of Health and Human Services. The agreement requires the Company for five years subsequent to September 27, 2007 to continue to adhere to its Code of Business Conduct and Ethics and certain other provisions, including reporting requirements.
U.S. Department of Justice EBI Products Investigations and Other Matters
In February 2010, the Company received a subpoena from the Office of the Inspector General of the U.S. Department of Health and Human Services requesting various documents relating to agreements or arrangements between physicians and the Company’s Interpore Cross subsidiary for the period from 1999 through the present and the marketing and sales activities associated with Interpore Cross’ spinal products. The Company is cooperating with the request of the Office of the Inspector General. The Company can make no assurances as to the time or resources that will be needed to devote to this inquiry or its final outcome.
In April 2009, the Company received an administrative subpoena from the U.S. Attorney’s Office for the District of Massachusetts requesting various documents relating primarily to the Medicare reimbursement of and certain business practices related to the Company’s EBI subsidiary’s non-invasive bone growth stimulators. It is the Company’s understanding that competitors in the non-invasive bone growth stimulation market received similar subpoenas. The Company received subsequent subpoenas in connection with the investigation in September 2009, June 2010 and February 2011 along with several informal requests for information. The Company is producing responsive documents and is fully cooperating in the investigation. The Company can make no assurances as to the time or resources that will be needed to devote to this inquiry or its final outcome.
In April 2009, the Company became aware of a qui tam complaint alleging violations of the federal and various state False Claims Acts filed in the United States District Court for the District of Massachusetts, where it is currently pending. The Company, its parent company LVB Acquisition, Inc., and several of the Company’s competitors in the non-invasive bone growth stimulation market were named as defendants in this action. The allegations in the complaint are similar in nature to certain categories of requested documents in the above-referenced administrative subpoenas. The U.S. government has not intervened in the action. The Company is vigorously defending this matter and intends to continue to do so. The Company can make no assurances as to the time or resources that will be needed to devote to this litigation or its final outcome.
U.S. Department of Justice Civil Division Investigation
In September 2010, the Company received a Civil Investigative Demand (“CID”) issued by the U.S. Department of Justice—Civil Division pursuant to the False Claims Act. The CID requests that the Company provide documents and testimony related to allegations that Biomet, OtisMed Corp. and Stryker Corp. have violated the False Claims Act relating to the marketing of, and payment submissions for, OtisMed’s OtisKneeTM (a registered trademark of OtisMed) knee replacement system. The Company has produced responsive documents and is fully cooperating in the investigation. The Company can make no assurances as to the time or resources that will be needed to devote to this inquiry or its final outcome.
114
Table of Contents
Biomet, Inc. and Subsidiaries Notes to Consolidated Financial Statements (continued)
Note 16—Contingencies, Continued.
U.S. Securities and Exchange Commission Informal Investigation
On September 25, 2007, the Company received a letter from the SEC informing the Company that it is conducting an informal investigation regarding possible violations of the Foreign Corrupt Practices Act in the sale of medical devices in certain foreign countries by companies in the medical devices industry. The Foreign Corrupt Practices Act prohibits U.S. companies and their officers, directors, employees, or shareholders acting on their behalf and agents from offering, promising, authorizing or making payments to foreign officials for the purpose of obtaining or retaining business abroad or otherwise obtaining favorable treatment and this law requires companies to maintain records which fairly and accurately reflect transactions and to maintain internal accounting controls. In many countries, hospitals and clinics are government-owned and healthcare professionals employed by such hospitals and clinics, with whom the Company regularly interacts, may meet the definition of a foreign official for purposes of the Foreign Corrupt Practices Act. If the Company is found to have violated the Foreign Corrupt Practices Act, the Company may face sanctions including fines, criminal penalties, disgorgement of profits and suspension or debarment of the Company’s ability to contract with government agencies or receive export licenses. On November 9, 2007, the Company received a letter from the Department of Justice requesting any information provided to the SEC be provided to the Department of Justice on a voluntary basis. The Company believes it has fully cooperated with both requests and the Company has conducted its own review relating to these matters in certain countries in which the Company and its distributors conduct business. The Company can make no assurances as to the time or resources that will be needed to devote to this investigation or its final outcome.
Other Matters
In January 2009, Heraeus Kulzer GmbH initiated legal proceedings in Germany against the Company and its subsidiary, Biomet Europe BV, alleging that the Company and Biomet Europe BV misappropriated Heraeus Kulzer trade secrets when developing its new lines of European bone cements. The lawsuit seeks damages in excess of €30 million and injunctive relief to preclude the Company from producing its current line of European bone cements. The Company is vigorously defending this matter and intends to continue to do so. The Company can make no assurance as to the time or resources that will be needed to devote to this litigation or its final outcome.
There are various other claims, lawsuits, disputes with third parties, investigations and pending actions involving various allegations against the Company incident to the operation of its business, principally product liability and intellectual property cases. Each of these matters is subject to various uncertainties, and it is possible that some of these matters may be resolved unfavorably to the Company. The Company accrues for losses that are deemed to be probable and subject to reasonable estimate. Based on the advice of the Company’s counsel in these matters, management believes that the ultimate outcome of these matters and any liabilities in excess of amounts provided will not have a material adverse impact on the Company’s consolidated financial statements taken as a whole.
Note 17—Related Parties.
Transactions with the Sponsor Group
On December 18, 2006, the Company entered into an Agreement and Plan of Merger with LVB Acquisition, LLC, a Delaware limited liability company, which was subsequently converted to a corporation, LVB Acquisition, Inc. (“Parent”), and LVB Acquisition Merger Sub, Inc., an Indiana corporation and a wholly-owned subsidiary of Parent (“Purchaser”), which agreement was amended and restated as of June 7, 2007 and which we refer to as the “Merger Agreement.” Pursuant to the Merger Agreement, on June 13, 2007, Purchaser commenced a cash tender offer (the “Offer”) to purchase all of the Company’s outstanding common shares, without par value
115
Table of Contents
Biomet, Inc. and Subsidiaries Notes to Consolidated Financial Statements (continued)
Note 17—Related Parties, Continued.
(the “Shares”) at a price of $46.00 per Share (the “Offer Price”) without interest and less any required withholding taxes. The Offer was made pursuant to Purchaser’s offer to purchase dated June 13, 2007 and the related letter of transmittal, each of which was filed with the SEC on June 13, 2007. In connection with the Offer, Purchaser entered into a credit agreement dated as of July 11, 2007 for a $6,165.0 million senior secured term loan facility (the “Tender Facility”), maturing on June 6, 2008, and pursuant to which it borrowed approximately $4,181.0 million to finance a portion of the Offer and pay related fees and expenses. The Offer expired at midnight, New York City time, on July 11, 2007, with approximately 82% of the outstanding Shares having been tendered to Purchaser. At the Company’s special meeting of shareholders held on September 5, 2007, more than 91% of the Company’s shareholders voted to approve the proposed merger, and Parent acquired the Company on September 25, 2007 through a reverse subsidiary merger with Biomet, Inc. being the surviving company (the “Merger”). Subsequent to the acquisition, the Company became a subsidiary of Parent, which is controlled by LVB Acquisition Holding, LLC, or “Holding”, an entity controlled by a consortium of private equity funds affiliated with The Blackstone Group, Goldman, Sachs & Co., Kohlberg Kravis Roberts & Co., and TPG Capital (each a “Sponsor” and collectively, the “Sponsors”), and certain investors who agreed to co-invest with the Sponsors (the “Co-Investors”). These transactions, including the Merger and the Company’s payment of any fees and expenses related to these transactions are referred to collectively as the “Transactions.”
Management Services Agreement
Upon completion of the Transactions, the Company entered into a management services agreement with certain affiliates of the Sponsors, pursuant to which such affiliates of the Sponsors or their successors assigns, affiliates, officers, employees, and/or representatives and third parties (collectively, the “Managers”) provide management, advisory, and consulting services to the Company. Pursuant to such agreement, the Managers received a transaction fee equal to 1% of total enterprise value of the Transactions for the services rendered by such entities related to the Transactions upon entering into the agreement, and the Sponsors receive an annual monitoring fee equal to 1% of the Company’s annual adjusted EBITDA (as defined in the credit agreement) as compensation for the services rendered and reimbursement for out-of-pocket expenses incurred by the Managers in connection with the agreement and the Transactions. The Company is required to pay the Sponsors the monitoring fee on a quarterly basis in arrears. The total amount of Sponsor fees was $11.1 million, $10.9 million and $11.6 million for the years ended May 31, 2011, 2010, and 2009, respectively. The Company may also pay certain subsequent fees to the Managers for advice rendered in connection with financings or refinancings (equity or debt), acquisitions, dispositions, spin-offs, split-offs, dividends, recapitalizations, an initial underwritten public offering and change of control transactions involving the Company or any of its subsidiaries. The management services agreement includes customary exculpation and indemnification provisions in favor of the Managers and their affiliates. Due to the large portfolios of the Sponsors, the Company and its employees may have transactions with the Sponsors and certain affiliates of the Sponsors independent of transactions described above.
Amended and Restated Limited Liability Company Operating Agreement of Holding
On September 27, 2007, certain investment funds associated with or designated by the Sponsors (the “Sponsor Funds”) entered into an amended and restated limited liability company operating agreement, or the “LLC Agreement,” in respect of Holding. The LLC Agreement contains agreements among the parties with respect to the election of the Company’s directors and the directors of its parent companies, restrictions on the issuance or transfer of interests in the Company and other corporate governance provisions (including the right to approve various corporate actions).
Pursuant to the LLC Agreement, each of the Sponsors has the right to nominate, and has nominated, two directors to the Company’s Board of Directors and also is entitled to appoint one non-voting observer to the Board of Directors for so long as such Sponsor remains a member of Holding. In addition to their right to appoint
116
Table of Contents
Biomet, Inc. and Subsidiaries Notes to Consolidated Financial Statements (continued)
Note 17—Related Parties, Continued.
non-voting observers to the Board of Directors, certain of the Sponsor Funds have certain other management rights to the extent that any such Sponsor Fund is required to operate as a “venture capital operating company” as defined in the regulations issued by the U.S. Department of Labor at Section 2510.3-101 of Part 2510 of Chapter XXV, Title 29 of the Code of Federal Regulations, or any successor regulations. Each Sponsor’s right to nominate directors is freely assignable to funds affiliated with such Sponsor, and is assignable to non-affiliates of such Sponsor only if the assigning Sponsor transfers its entire interest in Holding not previously transferred and only with the prior written consent of the Sponsors holding at least 70% of the membership interests in Holding, or “requisite Sponsor consent”. In addition to their rights under the LLC Agreement, the Sponsors may also appoint one or more persons unaffiliated with any of the Sponsors to the Board of Directors. Following Purchaser’s purchase of the Shares tendered in the Offer, the Sponsors jointly appointed Dane A. Miller, Ph.D. and Jeffrey R. Binder to the Board of Directors in addition to the two directors appointed by each of the Sponsors.
Pursuant to the LLC Agreement, each director has one vote for purposes of any Board of Directors action, and all decisions of the Board of Directors require the approval of a majority of the directors designated by the Sponsors. In addition, the LLC Agreement provides that certain major decisions regarding the Company or its parent companies require the requisite Sponsor consent.
The LLC Agreement includes certain customary agreements with respect to restrictions on the issuance or transfer of interests in the Company, including preemptive rights, tag-along rights and drag-along rights.
The Co-Investors have also been admitted as members of Holding, both directly and through Sponsor-controlled investment vehicles. Although the Co-Investors are therefore parties to the LLC Agreement, they have no rights with respect to the election of the Company’s directors or the approval of its corporate actions.
The Sponsors have also caused Holding and Parent to enter into an agreement with the Company obligating the Company and Parent to take all actions necessary to give effect to the corporate governance, preemptive rights, transfer restriction and certain other provisions of the LLC Agreement, and prohibiting the Company and Parent from taking any actions that would be inconsistent with such provisions of the LLC Agreement.
Registration Rights Agreement
The Sponsor Funds and the Co-Investors also entered into a registration rights agreement with Holding, Parent and the Company upon the closing of the Transactions. Pursuant to this agreement, the Sponsor Funds have the power to cause Holding, Parent and the Company to register their, the Co-Investors’ and certain other persons’ equity interests under the Securities Act and to maintain a shelf registration statement effective with respect to such interests. The agreement also entitles the Sponsor Funds and the Co-Investors to participate in any future registration of equity interests under the Securities Act that Holding, Parent or the Company may undertake.
Management Stockholders’ Agreements
On September 13, 2007 and November 6, 2007, Holding, Parent and the Sponsor Funds entered into stockholders agreements with certain of the Company’s senior executives and other management stockholders. Pursuant to the terms of the LVB Acquisition, Inc. Management Equity Incentive Plan, participants who exercise their vested options are required to become parties to the agreement dated November 6, 2007. The stockholder agreements contain agreements among the parties with respect to restrictions on the transfer and issuance of shares, including preemptive, drag-along, tag-along, and call/put rights.
117
Table of Contents
Biomet, Inc. and Subsidiaries Notes to Consolidated Financial Statements (continued)
Note 17—Related Parties, Continued.
Consulting Agreements
On January 14, 2010, the Company entered into a consulting agreement with Dr. Dane A. Miller Ph.D., pursuant to which it will pay Dr. Miller a consulting fee of $0.25 million per fiscal year for Dr. Miller’s consulting services and will reimburse Dr. Miller for out-of-pocket fees and expenses relating to an off-site office and administrative support in an amount of $0.1 million per year. The term of the agreement extends through the earlier of September 1, 2011, an initial public offering or a change of control. The agreement also contains certain restrictive covenants prohibiting Dr. Miller from competing with the Company and soliciting employees of the Company during the term of the agreement and for a period of one year following such term. A $0.25 million payment was made to Dr. Miller under the consulting agreement during the year ended May 31, 2011.
On July 13, 2010, Biomet, Inc. entered into a Retirement and Consulting Agreement with Roger Van Broeck. Prior to his retirement, Mr. Van Broeck served as the Company’s Senior Vice President and President of Biomet Europe, Middle East and Africa. Pursuant to the terms of the agreement, Biomet will pay Mr. Van Broeck €250 per hour, or a maximum of €2,000 per day, as compensation for his consulting services. In addition, Mr. Van Broeck will be reimbursed for reasonable out-of-pocket expenses related to approved travel in connection with his consulting services. The agreement contains certain restrictive covenants prohibiting Mr. Van Broeck from competing with the Company and soliciting employees of the Company during the term of the agreement, which extends through the earlier of September 1, 2012, an initial public offering or a change of control, and for a period of one year following such term.
On April 18, 2011, the Company entered into a Retirement and Consulting Agreement with Gregory W. Sasso. Prior to his retirement, Mr. Sasso served as the Company’s Senior Vice President and President of Biomet SBU Operations. Under the terms of the agreement, Biomet will pay Mr. Sasso $0.2 million annually, as compensation for his consulting services, for the first two years of the term of the agreement. Following such initial period, Biomet will pay Mr. Sasso on a fee-for-monthly service basis at a rate of $5,000 per day. In addition, Mr. Sasso will be reimbursed for reasonable out-of-pocket expenses related to approved travel in connection with his consulting services. The term of the agreement extends through April 7, 2016. During the year ended May 31, 2011, Biomet paid Mr. Sasso an aggregate $2.6 million under the terms of the agreement, comprised of a cash retirement payment and a payment to repurchase a portion of Mr. Sasso’s equity interests at fair market value.
Indemnification Priority Agreement
On January 11, 2010, the Company and LVB Acquisition, Inc. entered into an indemnification priority agreement with the Sponsors (or certain affiliates designated by the Sponsors) pursuant to which the Company and LVB Acquisition, Inc. clarified certain matters regarding the existing indemnification and advancement of expenses rights provided by the Company and LVB Acquisition, Inc. pursuant to their respective charters and the management services agreement described above. In particular, pursuant to the terms of the indemnification agreement, the Company acknowledged that as among the Company, LVB Acquisition, Inc. and the Sponsors and their respective affiliates, the obligation to indemnify or advance expenses to any director appointed by any of the Sponsors will be payable in the following priority: The Company will be the primary source of indemnification and advancement; LVB Acquisition, Inc. will be the secondary source of indemnification and advancement; and any obligation of a Sponsor-affiliated indemnitor to indemnify or advance expenses to such director will be tertiary to the Company’s and, then, LVB Acquisition, Inc. obligations. In the event that either the Company or LVB Acquisition, Inc. fails to indemnify or advance expenses to any such director in contravention of its obligations, and any Sponsor-affiliated indemnitor makes any indemnification payment or advancement of expenses to such director on account of such unpaid liability, such Sponsor-affiliated indemnitor will be subrogated to the rights of such director under any such Company or LVB Acquisition, Inc. indemnification agreement.
118
Table of Contents
Biomet, Inc. and Subsidiaries Notes to Consolidated Financial Statements (continued)
Note 17—Related Parties, Continued.
Equity Healthcare
Effective January 1, 2009, the Company entered into an employer health program agreement with Equity Healthcare LLC (“Equity Healthcare”). Equity Healthcare negotiates with providers of standard administrative services for health benefit plans as well as other related services for cost discounts and quality of service monitoring capability by Equity Healthcare. Because of the combined purchasing power of its client participants, Equity Healthcare is able to negotiate pricing terms for providers that are believed to be more favorable than the companies could obtain for themselves on an individual basis.
In consideration for Equity Healthcare’s provision of access to these favorable arrangements and its monitoring of the contracted third parties’ delivery of contracted services to the Company, the Company pays Equity Healthcare a fee of $2 per participating employee per month (“PEPM Fee”). As of May 31, 2011, the Company had approximately 3,200 employees enrolled in its health benefit plans in the United States.
Equity Healthcare may also receive a fee (“Health Plan Fees”) from one or more of the health plans with whom Equity Healthcare has contractual arrangements if the total number of employees joining such health plans from participating companies exceeds specified thresholds. If and when Equity Healthcare reaches the point at which the aggregate of its receipts from the PEPM Fee and the Health Plan Fees have covered all of its allocated costs, it will apply the incremental revenues derived from all such fees to (a) reduce the PEPM Fee otherwise payable by the Company; (b) avoid or reduce an increase in the PEPM Fee that might otherwise have occurred on contract renewal; or (c) arrange for additional services to the Company at no cost or reduced cost.
Equity Healthcare is an affiliate of Blackstone, with whom Michael Dal Bello and David McVeigh, members of the Company’s Board of Directors, are affiliated and in which they may have an indirect pecuniary interest.
Core Trust Purchasing Group Participation Agreement
Effective May 1, 2007, the Company entered into a 5-year participation agreement (“Participation Agreement”) with Core Trust Purchasing Group, a division of HealthTrust Purchasing Corporation (“CPG”), designating CPG as the Company’s exclusive “group purchasing organization” for the purchase of certain products and services from third party vendors. CPG secures from vendors pricing terms for goods and services that are believed to be more favorable than participants in the group purchasing organization could obtain for themselves on an individual basis. Under the participation agreement, the Company must purchase 80% of the requirements of its participating locations for core categories of specified products and services, from vendors participating in the group purchasing arrangement with CPG or CPG may terminate the contract. In connection with purchases by its participants (including the Company), CPG receives a commission from the vendors in respect of such purchases.
Although CPG is not affiliated with Blackstone, in consideration for Blackstone’s facilitating the Company’s participation in CPG and monitoring the services CPG provides to the Company, CPG remits a portion of the commissions received from vendors in respect of the Company’s purchases under the Participation Agreement to an affiliate of Blackstone, with whom Michael Dal Bello and David McVeigh, members of the Company’s Board of Directors, are affiliated and in which they may have an indirect pecuniary interest.
Other
The Company currently holds interest rate swaps with Goldman Sachs. As part of this relationship, the Company receives information from Goldman Sachs that allows it to perform a regression on the swaps as part of its required effectiveness testing on a quarterly basis.
119
Table of Contents
Biomet, Inc. and Subsidiaries Notes to Consolidated Financial Statements (continued)
Note 17—Related Parties, Continued.
Biomet, Inc., its subsidiaries, affiliates, employees and direct and indirect controlling stockholders may from time to time, depending upon market conditions, seek to purchase debt securities issued by the Company or its subsidiaries or affiliates in open market or privately negotiated transactions or by other means.
Periodically, the Company charters a plane indirectly owned by Dane A. Miller, Ph.D., through a non-related third party charter service, for Biomet business related use. There were no payments made during the year ended May 31, 2011. There were payments of $0.1 million for the year ended May 31, 2010. There were no payments made during the year ended May 31, 2009.
The company engaged KKR Capstone which is a related party of Kohlberg Kravis Roberts & Co to provide analysis for certain restructuring initiatives. There were payments of $0.7 million and $0.3 million made during the years ended May 31, 2011 and 2009, respectively, and no payments during the year ended May 31, 2010, under this engagement.
Capital Contributions and Share Repurchases
At the direction of Parent, the Company funded the repurchase of common shares of its parent company of $3.7 million, $1.7 million and $0.9 million for the years ended May 31, 2011, 2010 and 2009, respectively, from former employees pursuant to the LVB Acquisition, Inc. Management Stockholders’ Agreement. The Company did not receive capital contributions for the years ended May 31, 2011 and 2010. During the year ended May 31, 2009, the Company received capital contributions of $3.7 million from its parent company from the purchase of common stock of LVB Acquisition, Inc. by certain members of management and certain third party distributors.
120
Table of Contents
Biomet, Inc. and Subsidiaries Schedule II—Valuation and Qualifying Accounts
For the years ended May 31, 2011, 2010 and 2009:
| (in millions) Description |
Balance at Beginning of Period |
Charged to Costs and Expenses |
Charged to Other Accounts |
Deductions | Balance at End of Year |
|||||||||||||||
| Allowance for doubtful receivables: |
||||||||||||||||||||
| For the year ended |
||||||||||||||||||||
| May 31, 2011 |
$ | 40.6 | $ | 13.8 | $ | (12.3 | )(B) | $ | (3.9 | ) (A) | $ | 38.2 | ||||||||
|
|
|
|
|
|
|
|
|
|
|
|||||||||||
| For the year ended |
||||||||||||||||||||
| May 31, 2010 |
$ | 48.9 | $ | 22.8 | (D) | $ | (11.3) | (B)(D) | $ | (19.8 | ) (A) | $ | 40.6 | |||||||
|
|
|
|
|
|
|
|
|
|
|
|||||||||||
| For the year ended |
||||||||||||||||||||
| May 31, 2009 |
$ | 80.8 | $ | 21.9 | $ | (1.5) | (B) | $ | (52.3 | ) (A) | $ | 48.9 | ||||||||
|
|
|
|
|
|
|
|
|
|
|
|||||||||||
| Excess and obsolete inventory reserves: |
||||||||||||||||||||
| For the year ended |
||||||||||||||||||||
| May 31, 2011 |
$ | 135.6 | $ | 5.7 | $ | 0.8 | (B) | $ | (19.2 | ) (C) | $ | 122.9 | ||||||||
|
|
|
|
|
|
|
|
|
|
|
|||||||||||
| For the year ended |
||||||||||||||||||||
| May 31, 2010 |
$ | 154.3 | $ | 22.1 | $ | (8.6) | (B) | $ | (32.2 | ) (C) | $ | 135.6 | ||||||||
|
|
|
|
|
|
|
|
|
|
|
|||||||||||
| For the year ended |
||||||||||||||||||||
| May 31, 2009 |
$ | 164.8 | $ | 79.1 | $ | (7.7) | (B) | $ | (81.9 | ) (C) | $ | 154.3 | ||||||||
|
|
|
|
|
|
|
|
|
|
|
|||||||||||
Notes:
| (A) | Uncollectible accounts written off. |
| (B) | Primarily effect of foreign currency translation. |
| (C) | Inventory written off. |
| (D) | For the year ended May 31, 2010, $38.9 million of net accounts receivables related to Greece were reclassified to long-term assets due to the proposal of the Greek government to settle certain debts with the issuance of zero-coupon bonds not expected to be settled in the next twelve months. These net accounts receivables included $8.4 million of Greece allowance for doubtful receivables, which is included above in the effect of foreign currency translation amount, and also included above in the deductions amount. |
| Quarter ended | ||||||||||||||||||||
| (in millions) | August 31, 2010 | November 30, 2010 | February 28, 2011 | May 31, 2011 | Fiscal year ended May 31, 2011 |
|||||||||||||||
| Fiscal 2011 |
||||||||||||||||||||
| Net sales |
$ | 640.7 | $ | 698.3 | $ | 678.0 | $ | 715.2 | $ | 2,732.2 | ||||||||||
| Gross profit |
446.7 | 490.8 | 469.9 | 486.1 | 1,893.5 | |||||||||||||||
| Net loss |
(17.8 | ) | (7.6 | ) | (11.6 | ) | (812.8 | ) | (849.8 | ) | ||||||||||
Fiscal 2011
| • | Net loss for the fourth quarter of fiscal 2011 was impacted by a goodwill and intangible asset impairment charge of $941.4 million related primarily to the continued market slowdown in Europe relative to our original purchase accounting assumptions at the time of the Merger. |
121
Table of Contents
| Quarter ended | ||||||||||||||||||||
| Fiscal year
ended May 31, 2010 |
||||||||||||||||||||
| (in millions) | August 31, 2009 | November 30, 2009 | February 28, 2010 | May 31, 2010 | ||||||||||||||||
| Fiscal 2010 |
||||||||||||||||||||
| Net sales |
$ | 630.1 | $ | 695.6 | $ | 669.8 | $ | 702.5 | $ | 2,698.0 | ||||||||||
| Gross profit |
444.8 | 482.0 | 475.1 | 476.2 | 1,878.1 | |||||||||||||||
| Net loss |
(22.8 | ) | (7.2 | ) | (3.1 | ) | (14.5 | ) | (47.6 | ) | ||||||||||
| Item 9. | Changes in and Disagreements with Accountants on Accounting and Financial Disclosure. |
Not applicable.
| Item 9A. | Controls and Procedures. |
(a) Evaluation of Disclosure Controls and Procedures. The Company maintains disclosure controls and procedures (as defined in Rule 13a-15(e) of the Securities Exchange Act of 1934, as amended (the “Act” )) that are designed to provide reasonable assurance that information required to be disclosed by the Company, including the Company’s consolidated entities, in the reports that the Company files or submits under the Act, is recorded, processed, summarized and reported, within the time periods specified in the SEC’s rules and forms and that such information is accumulated and communicated to management, including the President and Chief Executive Officer (the “Principal Executive Officer”) and the Chief Financial Officer (the “Principal Financial Officer”), as appropriate, to allow timely decisions regarding required disclosure. Prior to the filing of this report, the Company completed an evaluation under the supervision and with the participation of senior management, including the Company’s Principal Executive Officer and its Principal Financial Officer, of the effectiveness of the design and operation of the Company’s disclosure controls and procedures as of May 31, 2011. Based on this evaluation, Biomet’s Principal Executive Officer and its Principal Financial Officer concluded that Biomet’s disclosure controls and procedures were effective as of May 31, 2011.
(b) Management’s Report on Internal Control over Financial Reporting. Management of Biomet is responsible for establishing and maintaining adequate internal control over financial reporting (as defined in Rules 13a-15(f) and 15d-15(f) under the Exchange Act). Biomet’s internal control over financial reporting is a process designed to provide reasonable assurance regarding the reliability of financial reporting and the preparation of financial statements for external purposes in accordance with GAAP. Internal control over financial reporting includes those policies and procedures that (1) pertain to the maintenance of records that, in reasonable detail, accurately and fairly reflect the transactions and dispositions of the assets of Biomet; (2) provide reasonable assurance that transactions are recorded as necessary to permit preparation of financial statements in accordance with GAAP, and that receipts and expenditures of Biomet are being made only in accordance with authorizations of management and directors of the Company; and (3) provide reasonable assurance regarding prevention or timely detection of unauthorized acquisition, use, or disposition of Biomet’s assets that could have a material effect on the interim or annual consolidated financial statements. Because of its inherent limitations, internal control over financial reporting may not prevent or detect misstatements. Also, projections of any evaluation of effectiveness to future periods are subject to the risk that controls may become inadequate because of changes in conditions, or that the degree of compliance with the policies or procedures may deteriorate.
Biomet’s management conducted an assessment of the effectiveness of Biomet’s internal control over financial reporting as of May 31, 2011. In making this assessment, management used the criteria established in the report entitled “Internal Control—Integrated Framework” issued by the Committee of Sponsoring Organizations of the Treadway Commission (the “COSO Report”). Management concluded that Biomet did maintain effective internal control over financial reporting as of May 31, 2011, based on the criteria established in the COSO Report.
122
Table of Contents
This annual report does not include an attestation report of the Company’s independent registered public accounting firm regarding internal control over financial reporting. Management’s report was not subject to attestation by the Company’s independent registered public accounting firm pursuant to rules of the Securities and Exchange Commission that permit the Company to provide only management’s report in this annual report.
(c) Changes in Internal Control. There were no changes in Biomet’s internal control over financial reporting that have materially affected, or are reasonably likely to materially affect, Biomet’s internal control over financial reporting.
| Item 9B. | Other Information. |
Not applicable.
123
Table of Contents
| Item 10. | Directors, Executive Officers and Corporate Governance. |
Directors
The following information sets forth, with respect to each individual, the name, age as of July 31, 2011, business address and current principal occupation or employment, and business experience for the past five years of Biomet’s Board of Directors.
| Jeffrey R. Binder, age 48 |
Director since 2007 |
Mr. Binder has been President and Chief Executive Officer since February 2007. Prior to this appointment, Mr. Binder served as Senior Vice President of Diagnostic Operations of Abbott Laboratories from January 2006 to February 2007. Mr. Binder previously served as President of Abbott Spine from June 2003 to January 2006, and as President and Chief Executive Officer of Spinal Concepts, Inc. from 2000 to June 2003.
| Jonathan J. Coslet, age 46 |
Director since 2007 |
Mr. Coslet has been a Partner of TPG since 1993 and is currently a senior partner and member of the firm’s Executive, Management and Investment Committees. Mr. Coslet serves on the board of directors of IASIS Healthcare Corp., The Neiman Marcus Group, Inc., Caesars Entertainment Corporation, PETCO Animal Supplies, Inc. and Quintiles Transnational Corp.
| Michael Dal Bello, age 40 |
Director since 2007 |
Mr. Dal Bello is a Managing Director in the Private Equity Group of The Blackstone Group and has been with Blackstone since 2002. Mr. Dal Bello serves on the board of directors of Alliant, Apria Healthcare Group, Catalent Pharma Solutions, Inc., Sithe Global Power, LLC, Team Finance LLC and Vanguard Health Systems, Inc.
| Adrian Jones, age 47 |
Director since 2007 |
Mr. Jones has been a Managing Director of Goldman, Sachs & Co. since 2002 and has worked at Goldman, Sachs & Co. since 1994. Mr. Jones serves on the board of directors of Dollar General Corporation, Del Taco, Education Management Corporation, HealthMarkets, Inc., Michael Foods, Inc. and Signature Hospitals Corp.
| Max C. Lin, age 30 |
Director since 2011 |
Mr. Lin is a Principal in the health care industry team at KKR. Mr. Lin joined KKR in 2005 and has been involved with the firm’s investments in HCA Holdings, Inc. and The Nielsen Company. Prior to working at KKR, he was with Morgan Stanley in its Financial Sponsors Group.
| David McVeigh, age 44 |
Director since 2007 |
Mr. McVeigh is an executive director at Blackstone in the private equity group. Mr. McVeigh joined Blackstone in 2006 from McKinsey & Company, where he spent 12 years and was a partner. At McKinsey, Mr. McVeigh was one of the leaders of the North American Chemicals practice and the Northeast Energy and Materials practice. Mr. McVeigh serves on the board of directors of HealthMarkets, Inc. and RGIS, LLC.
124
Table of Contents
| Michael Michelson, age 60 |
Director since 2007 |
Mr. Michelson has been a member of the limited liability company that serves as the general partner of KKR since 1996 and, prior thereto, was a general partner of KKR. Mr. Michelson serves on the board of directors of Jazz Pharmaceuticals, Inc. and HCA Holdings, Inc.
| Dane A. Miller, Ph.D., age 65 |
Director since 2007 |
Dr. Miller is one of our four founders and served as our President, Chief Executive Officer and a director from 1977 until 2006. Dr. Miller serves on the board of directors of ForeTravel, Inc., the Indiana Economic Development Corporation, the University of Chicago Health Systems and the World Craniofacial Foundation.
| Andrew Y. Rhee, age 34 |
Director since 2009 |
Mr. Rhee is a Vice President in the Merchant Banking Division of Goldman, Sachs & Co., and has been with Goldman since 1998. Mr. Rhee serves on the board of directors of HGI Holding, Inc.
| Todd Sisitsky, age 39 |
Director since 2007 |
Mr. Sisitsky has been a Partner of TPG since 2007. From 2003 until 2007, he was an Investor at TPG. From 2001 until 2003, he was an Investor/Associate at Forstmann Little & Co. Mr. Sisitsky serves on the board of directors of IASIS Healthcare Corp., Fenwal, Inc., Surgical Care Affiliates, IMS Health and Aptalis Pharma.
Biomet’s Board of Directors consists of ten directors. Pursuant to the amended and restated limited liability company agreement of Holding, each of Biomet’s Sponsors has the right to nominate, and have nominated, two directors to serve on the Board of Directors. Following Purchaser’s purchase of the Biomet’s shares tendered in the Offer, the Sponsors jointly appointed Dr. Miller and Jeffrey R. Binder to the Board of Directors in addition to the two directors appointed by each of the Sponsors. Biomet’s Board of Directors presently considers none of our directors to be independent (as independence is defined by Rule 4200(a)(15) of the NASDAQ Stock Market LLC marketplace rules). As discussed in “Executive Compensation” below, following the Transactions Biomet’s common stock was no longer listed on the NASDAQ National Market. For more information regarding the rights of the Sponsors to nominate directors and other related arrangements, see “Certain Relationships and Related Party Transactions—Amended and Restated Limited Liability Company Operating Agreement of LVB Acquisition Holding, LLC.” Because of these requirements, together with Parent’s 100% ownership of our common stock, we do not currently have a policy or procedures with respect to shareholder recommendations for nominees to our Board of Directors.
Each of Messrs. Coslet, Dal Bello, Jones, Lin, McVeigh, Michelson, Rhee and Sisitsky is a partner, member or employee of an entity affiliated with one of the investment funds that indirectly own all of the equity interests in LVB Acquisition Holding, LLC and generally is entitled to be indemnified by such entity for his service on Biomet’s Board pursuant to such entities’ governing documents or other arrangements, in each case in accordance with such entities’ policies.
None of the directors (other than Mr. Binder) currently holds any position with Biomet. Except as described below, none of the directors or any of their affiliates (1) has a familial relationship with any directors or executive officers of Biomet or (2) has been involved in any transactions with Biomet or any of its directors, officers or affiliates which are required to be disclosed pursuant to the rules and regulations of the SEC, except as may be disclosed herein.
Director Qualifications
Messrs. Coslet, Dal Bello, Jones, Lin, McVeigh, Michelson, Rhee and Sisitsky were appointed to the Board as a consequence of their respective relationships with investment funds affiliated with the Sponsors. They are collectively referred to as the “Sponsor Directors.” Messrs. Binder and Miller are collectively referred to as the “Management Directors.”
125
Table of Contents
When considering whether the Board’s directors and nominees have the experience, qualifications, attributes and skills, taken as a whole, to enable the Board to satisfy its oversight responsibilities effectively in light of our business and structure, the Board focused primarily on the information discussed in each of the Board members’ and nominees’ biographical information set forth above.
Each of the Company’s directors and director nominees possesses high ethical standards, acts with integrity, and exercises careful, mature judgment. Each is committed to employing their skills and abilities to aid the long-term interests of our stakeholders. In addition, our directors are knowledgeable and experienced in one or more business, governmental or civic endeavors, which further qualifies them for service as members of the Board. Alignment with our stockholders is important in building value at Biomet over time.
Each of the Sponsor Directors was elected to the Board pursuant to the Amended and Restated Limited Liability Company Agreement of Holding. Pursuant to such agreement, Messrs. Coslet and Sisitsky were appointed to the Board as a consequence of their respective relationships with TPG Capital, Messrs. Michelson and Lin were appointed to the Board as a consequence of their respective relationships with Kohlberg Kravis Roberts & Co., Messrs. McVeigh and Dal Bello were appointed to the Board as a consequence of their respective relationships with The Blackstone Group, and Messrs. Jones and Rhee were appointed to the Board as a consequence of their respective relationships with Goldman Sachs & Co.
As a group, the Sponsor Directors possess experience in owning and managing enterprises like the Company and are familiar with corporate finance, strategic business planning activities and issues involving stakeholders more generally.
The Management Directors bring leadership, extensive business, operating and policy experience, and tremendous knowledge of Biomet and our industry, to the Board. In addition, the Management Directors bring their broad strategic vision for Biomet to the Board. Mr. Binder’s service as the Chief Executive Officer of the Company and Mr. Miller’s long-time former service as Chairman and Chief Executive Officer creates a critical link between management and the Board, enabling the Board to perform its oversight function with the benefits of management’s perspectives on the business. In addition, having the Chief Executive Officer on our Board provides Biomet with ethical, decisive and effective leadership.
The Amended and Restated Limited Liability Company Agreement of Holding provides that each Sponsor has the right to designate two directors, and that the Board will include Biomet’s chief executive officer and one independent director who is approved by the holders of at least 70% of the membership units of Holding held by the Sponsors. Any directors nominated to fill the directorships selected by the Sponsors are chosen by the applicable Sponsor.
Audit Committee Financial Expert
Our Audit Committee is composed of Max C. Lin, David McVeigh, Dane A. Miller, Ph.D., Andrew Rhee and Todd Sisitsky. In light of our status as a privately held company and the absence of a public listing or trading market for our common stock, our Board has not designated any member of the Audit Committee as an “audit committee financial expert.” Though not formally considered by our Board given that our securities are not traded on any national securities exchange, based upon the listing standards of the NASDAQ National Market, the national securities exchange upon which our common stock was listed prior to the Merger, we do not believe that any of Messrs. Lin, McVeigh, Rhee or Sisitsky would be considered independent because of their relationships with certain affiliates of the Sponsors which hold significant interests in Holding, which indirectly owns more than 95% of our outstanding common stock, and, in the case of Dr. Miller, other relationships with us. See Item 13, “Certain Relationships and Related Transactions.”
126
Table of Contents
Executive Officers
The following table sets forth the name, age and position of our executive officers as of July 31, 2011.
| Name |
Age | Position | ||||
| Jeffrey R. Binder |
48 | President and Chief Executive Officer | ||||
| Daniel P. Florin |
47 | Senior Vice President and Chief Financial Officer | ||||
| Glen A. Kashuba |
48 | Senior Vice President; President of Biomet Spine & Bone Healing Technologies | ||||
| Jon C. Serbousek |
50 | Senior Vice President; Group President of Biomet Orthopedics | ||||
| Maggie Anderson |
46 | Senior Vice President; President of Biomet 3i | ||||
| Renaat Vermeulen |
54 | Senior Vice President; President of Biomet Europe, Middle East and Africa | ||||
| Bradley J. Tandy |
52 | Senior Vice President; General Counsel and Secretary | ||||
| Peggy Taylor |
55 | Senior Vice President; Human Resources | ||||
| Robert E. Durgin |
52 | Senior Vice President; Quality, Regulatory and Clinical Affairs | ||||
| Robin T. Barney |
50 | Senior Vice President; World Wide Operations | ||||
| Sujata Dayal |
48 | Corporate Vice President and Chief Compliance Officer | ||||
Jeffrey R. Binder has been a director and President and Chief Executive Officer since February 2007. Prior to this appointment, Mr. Binder served as Senior Vice President of Diagnostic Operations of Abbott Laboratories from January 2006 to February 2007. Mr. Binder previously served as President of Abbott Spine from June 2003 to January 2006, and as President and Chief Executive Officer of Spinal Concepts, Inc. from 2000 to June 2003.
Daniel P. Florin has been Senior Vice President and Chief Financial Officer since June 2007. Prior thereto, Mr. Florin served as Vice President and Corporate Controller for Boston Scientific Corporation since 2001. Prior to being appointed as Corporate Controller in 2001, Mr. Florin served in financial leadership positions within Boston Scientific Corporation and its various business units since July 1995.
Glen A. Kashuba has been Senior Vice President and President of Biomet Spine & Bone Healing Technologies since April 2007. Prior thereto, Mr. Kashuba served as Worldwide President of Cordis Endovascular, a division of Johnson & Johnson. Mr. Kashuba had been with Johnson & Johnson since 1998, also holding the positions of Worldwide President of Codman Neuro Science (from December 2002 to November 2005) and U.S. President of DePuy AcroMed, now known as DePuy Spine.
Jon C. Serbousek has been Senior Vice President; Group President of Biomet Orthopedics since May 2011 and prior thereto served as Senior Vice President; President of Biomet Orthopedics, LLC since March 2008. For the previous eight years, Mr. Serbousek held diverse general management roles with Medtronic in the areas of Spinal Reconstruction, International, New Technology Development and most recently, worldwide Vice-President and General Manager, Biologics.
Maggie Anderson has been Senior Vice President; President of Biomet 3i, LLC since August 2009. Prior to that she was a Director at TPG Capital from 2006 to 2009 and a Director at AlixPartners from 2001 to 2006. Ms. Anderson started her career as an engineer at General Motors Powertrain Division, and took roles of increasing responsibility there in operations and new product development from 1988 to 1998.
Renaat Vermeulen has been Senior Vice President; President of Biomet EMEA since July 2010. Since his arrival at the Company in 1994, Mr. Vermeulen has held many positions of increasing responsibility until his most recent position of Vice President—Sales, Marketing and R&D, Biomet Europe.
127
Table of Contents
Bradley J. Tandy has been Senior Vice President, General Counsel and Secretary since April 2007. Prior thereto, Mr. Tandy served as Senior Vice President, Acting General Counsel and Secretary from January 2007 to April 2007, and Senior Vice President, Acting General Counsel, Secretary and Corporate Compliance Officer from March 2006 to January 2007. Mr. Tandy previously served as Vice President, Assistant General Counsel and Corporate Compliance Officer at Biomet, Inc. from January 1999 to March 2006.
Peggy Taylor has been Senior Vice President, Human Resources since August 2007. Prior thereto, Ms. Taylor served as Vice President of Human Resources for the Diagnostics Division of Abbott Laboratories from April 2000 to August 2007.
Robert E. Durgin has been Senior Vice President, Quality/Regulatory/Clinical Affairs since January 2009. Prior thereto, Mr. Durgin served as Corporate Vice President, Global Quality/Clinical/Regulatory Affairs from June 2007 to January 2009, and Corporate Vice President, Global Regulatory Affairs from May 2006 to June 2007. Mr. Durgin previously served as Vice President, Regulatory Affairs and Quality Assurance from September 2003 to May 2006 and in positions in Biomet’s legal department from June 1998 to September 2003.
Robin T. Barney has been Senior Vice President, World Wide Operations since September 2008. Prior to joining Biomet in 2007, Ms. Barney served as Vice President, Worldwide Operations of DePuy, a Johnson & Johnson company. Ms. Barney joined Johnson & Johnson in 1992 and held various leadership roles within Operations for their Codman & Shurtleff, DePuy Orthopeadics and DePuy Spine units.
Sujata Dayal has been Corporate Vice President and Chief Compliance Officer since February 2009. Prior thereto, Ms. Dayal was a Partner at Karmact, LLC, a regulatory and compliance consulting firm from July 2008 to February 2009. Prior thereto, she was an Ethics and Compliance Officer—Pharmaceutical Products, Abbot Laboratories from September 2003 to May 2008.
Code of Ethics
We have a Code of Business Conduct and Ethics which is applicable to all of our directors, officers and team members (the “Code of Conduct”). The Code of Conduct is available on the Corporate Compliance pages of our website at www.biomet.com. To the extent required pursuant to applicable SEC regulations, we intend to post amendments to or waivers of our Code of Conduct (to the extent applicable to our chief executive officer, principal financial officer or principal accounting officer) at this location on our website or report the same on a Current Report on Form 8-K. Our Code of Conduct is available free of charge upon request to our Investor Relations Department at 56 East Bell Drive, Warsaw, IN 46582.
| Item 11. | Executive Compensation. |
Introduction
Compensation and related matters during the 2011 fiscal year were reviewed and approved by the Compensation Committees of Parent and our Board of Directors which we refer to, collectively or individually as the context requires, as the Compensation Committee.
Compensation Discussion and Analysis
This section includes information regarding, among other things, the overall objectives of our compensation programs and each element of compensation that we provided, in each case with respect to the 2011 fiscal year. The goal of this section is to provide a summary of our executive compensation practices and the decisions that we made during this period concerning the compensation package payable to our executive officers, including the five executives in the Summary Compensation Table. Each of the five executives listed in the Summary Compensation Table is referred to herein as a “named executive officer.” This “Compensation Discussion and Analysis” should be read in conjunction with the detailed tables and narrative descriptions under “Executive Compensation Tables” below.
128
Table of Contents
Compensation Methodology
During the 2011 fiscal year, the Compensation Committee was responsible for administering the compensation and benefit programs for our team members, including our named executive officers. The Compensation Committee annually reviews and evaluates cash compensation and equity award recommendations for our executive officers along with the rationale for such recommendations, as well as summary information regarding the aggregate compensation provided to our executive officers. The Compensation Committee examines these recommendations in relation to our overall objectives and risk profile. Our President and Chief Executive Officer was not a member of the Compensation Committee during the 2011 fiscal year and did not participate in the decisions as to his compensation package.
The most significant development in our executive compensation philosophy following the consummation of the Transactions, including during the 2011 fiscal year, has been a greater emphasis on correlating compensation to long-term equity growth. The Compensation Committee has provided significant equity investment opportunities in our Parent tied to financial objectives through (1) offering certain of our employees one-time opportunities to purchase shares of Parent at a purchase price equal to the higher of fair market value and $10.00 per share (subject to the employee’s execution of a Management Stockholders’ Agreement, as described below under “The Elements of Biomet’s Compensation Program—Stock Options and Restricted Stock Units”), (2) granting of options to purchase shares of Parent, and modifiying the structure of non-equity awards to provide greater incentives for management performance and (3) granting of restricted stock units of Parent. The Compensation Committee’s decisions for the 2011 fiscal year were made after considering compensation data of an informal peer group comprised of privately owned portfolio companies of the Sponsors and other companies in the orthopedics industry, including Zimmer Holdings Inc., Stryker Corp., and Medtronic, Inc. We refer to this group of companies throughout this Annual Report on Form 10-K as our “informal peer group.” However, the Compensation Committee did not engage in formal benchmarking as part of this informal review in making compensation decisions. In addition, as more fully discussed below, our annual non-equity incentive program has been redesigned in an effort to more closely align awards to our and our executives’ performance. The philosophy and target levels of each of the other compensation elements, including base salary, perquisites, health and welfare and retirement benefits during the 2011 fiscal year have largely continued to correspond to the levels of such awards, as compared to our informal peer group, for periods prior to the Transactions.
Executive Compensation Philosophy and Objectives
Our executive compensation practices are affected by the highly competitive nature of the orthopedics industry and the location of our executive offices in Warsaw, Indiana. The fact that a number of the leading orthopedic manufacturers in the world have significant operations in and around Warsaw, Indiana means that there are continuing opportunities for experienced orthopedic executives who reside in this area. On the other hand, the fact that Warsaw, Indiana, is a small town in a predominantly rural area can present challenges to attracting executive talent from other industries and parts of the country.
Our executive compensation policies and practices during the 2011 fiscal year reflected the compensation philosophies of our founders and were designed to help achieve the superior performance of our executive officers and management team by accomplishing the following goals:
| • | attracting, retaining and rewarding highly qualified and productive persons; |
| • | relating compensation to company, business unit and individual performance; |
| • | encouraging strong performance without incentivizing inappropriate or excessive risk-taking; |
| • | establishing compensation levels that are internally equitable and externally competitive; and |
| • | encouraging an ownership interest and instilling a sense of pride in Biomet. |
This compensation methodology was based upon one of our founding philosophies: equity incentives in the form of stock options are an excellent motivation for all team members, including executive officers, and serve to align the interests of team members, management and our equity investors.
129
Table of Contents
Based on these objectives, the compensation package of our executive officers during the 2011 fiscal year was intended to meet each of the following three criteria: (1) market levels competitive with companies of similar size and performance to us, such as the companies discussed above as our informal peer group; (2) performance based, “at risk” pay that is based on both short and long-term goals; and (3) incentives that are structured to create alignment between our equity investors and executives.
The Elements of Biomet’s Compensation Program
As a result of our compensation philosophies and objectives, the compensation package of our executive officers during the 2011 fiscal year consisted of five primary elements: (1) base salary, (2) non-equity incentive plan awards, (3) stock options and restricted stock units, (4) participation in employee benefit plans, and (5) deferred compensation elections.
Base Salary. Consistent with prior fiscal years, our practice during the 2011 fiscal year was to provide base salaries at rates that we believed to be comparable with the rates paid to executives with companies of similar size and performance to us, including the companies in our informal peer group, in each case with responsibilities similar to the responsibilities of our executives. The Compensation Committee reviewed our performance, the executive officers’ performance, our future objectives and challenges and the current competitive environment and set the base salary for each executive officer at the beginning of the fiscal year. We consider our 2011fiscal year base salaries to have been in line with our compensation objectives.
Non-equity Incentive Plan. Annual cash incentive awards to our named executive officers for the 2011 fiscal year were paid under the terms of a non-equity incentive plan approved by our Compensation Committee following consummation of the Transactions. The principal objective sought to be achieved by our non-equity incentive plan is to align awards with predetermined objectives and thereby improve performance in targeted areas. Payments under the plan are calculated based upon a percentage of the executive’s base salary, which percentages are targeted to be competitive with companies of similar size and performance to us, including the companies in our informal peer group.
Potential payments under the non-equity incentive plan for the 2011 fiscal year could have ranged from 0% to 180% based on corporate, business unit and individual performance.
Corporate and business unit targets for the 2011 fiscal year were adjusted EBITDA, adjusted operating free cash flow as a percentage of adjusted EBITDA and certain sales targets. Adjusted EBITDA for this purpose is defined as net income/loss before interest expense, income tax, depreciation and amortization, and adjusted for certain expenses as defined by our bank agreement, such as restructuring charges, non-cash impairment charges, integration and facilities opening costs or other business optimization expenses, new systems design and implementation costs, certain start-up costs and costs related to consolidation of facilities, certain non-cash charges, advisory fees paid to the private equity owners, certain severance charges, purchase accounting costs, stock-based compensation and payments, payments to distributors that are not in the ordinary course of business, litigation costs, and other related charges. All adjustments are reviewed and approved by the Compensation Committee. Adjusted free cash flow for this purpose is defined as adjusted EBITDA less capital expenditures less the change in working capital. The Compensation Committee chose these targets as an incentive metrics because they effectively measure our performance and are important valuation metrics.
Individual performance of named executive officers was determined by the Compensation Committee after considering each executive’s leadership ability and contributions to our business during the 2011 fiscal year. With respect to named executive officers other than the Chief Executive Officer, the Compensation Committee also considered the Chief Executive Officer’s assessment of their individual performance in determining an individual named executive officer’s performance. The relative weighting of company, business unit and/or individual performance goals for each named executive officer is described below. The Compensation Committee establishes the performance measures and other terms and conditions of non-equity incentive plan awards, and retains the authority to cancel or award an additional bonus amount at its discretion (a “leadership/discretionary” award).
130
Table of Contents
The chart below includes information about the named executive officers’ 2011 fiscal year non-equity incentive plan target and maximum award opportunities and actual payouts.
| Non-Equity Incentive Plan Target |
Non-Equity Incentive Plan Maximum |
Non-Equity Incentive Plan Payout (Paid in July 2011) |
||||||||||||||||||||||
| % of Base Salary |
Amounts ($) | % of Base Salary |
Amount ($) | % of Base Salary |
Amount ($) | |||||||||||||||||||
| Jeffrey R. Binder |
100 | % | $ | 717,035 | 180 | % | $ | 1,290,665 | 58 | % | $ | 416,310 | ||||||||||||
| Daniel P. Florin |
80 | % | 337,695 | 144 | % | 607,850 | 49 | % | 208,054 | |||||||||||||||
| Maggie Anderson |
80 | % | 309,020 | 144 | % | 556,236 | 75 | % | 291,251 | |||||||||||||||
| Jon C. Serbousek |
80 | % | 331,065 | 144 | % | 595,917 | 44 | % | 180,066 | |||||||||||||||
| Renaat Vermeulen |
80 | % | 279,404 | 144 | % | 502,927 | 39 | % | 137,669 | |||||||||||||||
The following chart shows the weighting assigned to the various company, business unit and individual performance goals discussed above for each named executive officer:
| Jeffrey R. Binder | Daniel P. Florin | Maggie Anderson | John C. Serbousek | Renaat Vermeulen | ||||||||||||||||||||||||||||||||||||
| Goals |
Target | Max | Target | Max | Target | Max | Target | Max | Target | Max | ||||||||||||||||||||||||||||||
| Biomet Financials |
80 | % | 160 | % | 64 | % | 128 | % | 16 | % | 29 | % | 16 | % | 29 | % | 16 | % | 29 | % | ||||||||||||||||||||
| Business Unit |
— | — | — | — | 48 | % | 86 | % | 48 | % | 86 | % | 48 | % | 86 | % | ||||||||||||||||||||||||
| Financials |
||||||||||||||||||||||||||||||||||||||||
| Individual |
20 | % | 20 | % | 16 | % | 16 | % | 16 | % | 29 | % | 16 | % | 29 | % | 16 | % | 29 | % | ||||||||||||||||||||
|
|
|
|
|
|
|
|
|
|
|
|
|
|
|
|
|
|
|
|
|
|||||||||||||||||||||
| Performance |
||||||||||||||||||||||||||||||||||||||||
| Objectives |
||||||||||||||||||||||||||||||||||||||||
| TOTAL |
100 | % | 180 | % | 80 | % | 144 | % | 80 | % | 144 | % | 80 | % | 144 | % | 80 | % | 144 | % | ||||||||||||||||||||
|
|
|
|
|
|
|
|
|
|
|
|
|
|
|
|
|
|
|
|
|
|||||||||||||||||||||
| Leadership / Discretionary |
+/10 | % | +/-10 | % | +/-10 | % | +/-10 | % | +/-10 | % | ||||||||||||||||||||||||||||||
Since corporate and business unit target performance goals are generally set consistent with our confidential operating plan for the fiscal year, actual performance above our confidential operating plan would generally result in incentive payments above the target level. Conversely, performance below our confidential operating plan would generally result in incentive payments below the target level. The Compensation Committee and management believe that the metrics for the non-equity incentive plan align well with our objective of relating compensation to company, business unit and individual performance. The specific corporate and business unit targets and ranges of acceptable performance set under the non-equity incentive plan are not disclosed because we believe disclosure of this information would cause competitive harm. These performance targets were based on our confidential operating plan for the 2011 fiscal year and, therefore, we believe that achievement of the targets was substantially uncertain at the time they were set. The targets are intended to be realistic and reasonable, but challenging, in order to drive sustainable, risk appropriate growth and individual performance.
Stock Options and Restricted Stock Units. In 2007, the Board of Directors of Parent adopted the LVB Acquisition, Inc. 2007 Management Equity Incentive Plan (the “2007 LVB Plan”), which provides for the grant of non-qualified stock options to purchase shares of common stock of Parent (the “LVB Options”) to our and our affiliates’ key employees, directors, service providers and consultants. Prior to the exchange offer relating to employee options described below, 50% of the LVB Options granted to employees vested based on continued employment, 25% vested based on continued employment and had an exercise price that increased by 10% per annum, and 25% vested based on the achievement of annual adjusted EBITDA-performance criteria established by the Compensation Committee. Following the exchange offer, generally 75% of the LVB Options granted to employees vest based on continued employment and 25% vest based on the achievement of annual adjusted EBITDA-performance criteria established by the Compensation Committee. We have also granted LVB Options to certain of our distributors, which are eligible to vest based on the achievement of specified sales targets.
131
Table of Contents
In May 2009, the Board of Directors of Parent authorized an exchange offer relating to employee options outstanding at May 6, 2009 (including the options held by our named executive officers). Outstanding distributor options were not included in the exchange offer. The exchange offer provided the holders of such options with the opportunity to surrender the options for cancellation in exchange for replacement options, the terms of which were (1) different from the surrendered options with respect to the performance based and accreting exercise price options, and (2) the same as the surrendered options with respect to the time based options. The terms of the performance based and accreting exercise price options were modified in the replacement options as follows:
| • | New Performance Vesting Options (which replaced the surrendered performance based options)—Beginning in fiscal 2010, the remaining unvested options vest ratably over four to six years (depending on the date of grant) instead of the three to five years remaining under the terms of the then outstanding performance based options. The remaining options continue to vest contingent upon the Company achieving certain reduced adjusted EBITDA targets in each of those years (new options granted subsequent to, and not in connection with, the exchange program vest ratably over five years following the grant date contingent upon the Company achieving certain adjusted EBITDA targets with respect to each such year). |
| • | New Extended Time Vesting Options (which replaced the surrendered accreting exercise price options)—These options are similar to the then outstanding time based options. The exercise price reverts to $10.00 per share (i.e., the original grant date exercise price before it began accreting) and no longer increases by 10% on an annual basis. The remaining unvested options vest ratably over four to six years (depending on the date of grant) instead of the three to five years remaining under the terms of the then outstanding accreting exercise price options. |
The goal of the exchange offer was to provide employees who elected to participate with new options, the terms of which preserved the original incentive effect of our option program in light of current market-wide economic conditions. Although the Board of Directors of Parent authorized the option exchange program in May 2009, we did not conduct the exchange offer until our 2010 fiscal year. Therefore, the exchange offer is reflected in the 2010 fiscal year compensation tables below and the financial information contained in this Annual Report on Form 10-K. All of our employees elected to participate in the exchange offer.
Upon termination of a participant’s employment, the 2007 LVB Plan provides that any unvested portion of a participant’s LVB Award will be forfeited, and that the vested portion of his or her LVB Award will expire on the earliest of (1) the date the participant’s employment is terminated for cause, (2) 30 days following the date the participant resigns without good reason, (3) 90 days after the date the participant’s employment is terminated either by us for any reason other than cause, death or disability, or by the participant with good reason, (4) one year after the date the participant’s employment is terminated by reason of death or disability or (5) the tenth anniversary of the grant date of the LVB Award. In no event will any option remain outstanding after the tenth anniversary of the original grant date of such option.
Prior to receiving shares of Parent’s common stock, participants must execute a Management Stockholders’ Agreement, which provides that the shares are subject to certain transfer restrictions, put and call rights, and tag-along and drag-along rights (and, with respect to certain senior members of management, limited registration and preemptive rights).
The Compensation Committee is responsible for administering the 2007 LVB Plan and authorizing the grant of LVB Awards pursuant thereto, and may amend the 2007 LVB Plan (and any LVB Awards) at any time. LVB Awards may not be granted under the 2007 LVB Plan on or after November 16, 2017. When the 2007 LVB Plan became effective, there were 37,520,000 shares of LVB common stock reserved for issuance in connection with LVB Awards to be granted thereunder. Effective December 31, 2010, the 2007 LVB Plan was amended to increase the authorized share pool by 1,000,000 shares. As of May 31, 2011, there were 2,380,375 shares available for issuance under the 2007 LVB Plan.
132
Table of Contents
The Board of Directors and stockholders of Parent adopted and approved a Restricted Stock Unit Plan effective December 31, 2010. The purpose of this plan is to provide executives and certain key employees with the opportunity to receive stock-based performance incentives to retain qualified individuals and to align their interests with the interests of the stockholders. The maximum number of shares of common stock, par value $0.01 per share, that may be issued under this plan is 4,000,000, subject to adjustment as described in the plan. Under the terms of the plan, the Compensation Committee of the Board of Directors may grant participants restricted stock units, each of which represents the right to receive one share of common stock, subject to certain vesting restrictions and risk of forfeiture. The restricted stock units vest under certain time-vesting and liquidity event conditions. As of May 31, 2011, there were 165,000 restricted stock units available for issuance.
Retirement Plans. During the 2011 fiscal year our executive officers in the U.S. were eligible to participate in our 401(k) plan (the “401(k) Plan”). Each year we, in our sole discretion, may match 100% of each team member’s contributions, up to a maximum amount equal to 6% of the team member’s annual cash compensation. All contributions to the 401(k) Plan are allocated to accounts maintained on behalf of each participating team member and, to the extent vested, are available for distribution to the team member or beneficiary upon retirement, death, disability or termination of service.
During the 2011 fiscal year our European executive officers in certain countries were eligible to participate in a defined contribution plan. Each year we contribute a percentage of employees’ pensionable salaries based on their age at January 1st.
We do not sponsor or maintain any pension plans applicable to our named executive officers.
Deferred Compensation. We maintain the Biomet, Inc. Deferred Compensation Plan (the “Deferred Compensation Plan”), a non-qualified deferred compensation plan, which is available for our senior management. The Deferred Compensation Plan allows eligible participants to defer pre-tax compensation to reduce current tax liability and assist those team members in their planning for retirement and other long-term savings goals in a tax effective manner. We do not make any contributions to the Deferred Compensation Plan. Under the Deferred Compensation Plan, eligible participants may defer up to 100% of their base salary and annual cash incentive award. Participants receive scheduled distributions from the Deferred Compensation Plan, which are treated as ordinary income subject to federal and state income taxation at the time of distribution. Except in circumstances of hardship, unscheduled withdrawals are not permitted. Amounts contributed to the Deferred Compensation Plan are at the participant’s election and are treated as “deemed investments,” which means that the participants have no ownership interest in the investment alternative selected. The participants’ deferrals and any notional investment gains thereon are reflected on our financial statements and are part of our unsecured general assets. The Deferred Compensation Plan is an unfunded “future promise to pay” by us. Neither Biomet nor the Deferred Compensation Plan record keeper provides any guarantee of investment return. We do not pay above-market interest rates on deferred amounts of compensation. None of our named executive officers participates in the Deferred Compensation Plan.
Perquisites. We believe that our approach to perquisites has historically been, and continues to be, comparable to other companies in our informal peer group discussed above. Our President and Chief Executive Officer and other named executive officers generally have been permitted, when practical and consistent with historical practice, to use company aircraft for business and personal travel for security reasons. On a case by case basis, we have historically reimbursed certain executives for social club dues, offered to provide a travel allowance in connection with Biomet related travel, and offered to provide relocation assistance to certain members of our senior management team who relocate their principal residence at our request. For example, we have historically, at times, provided reimbursement of moving expenses and protection against a loss on the sale of the executive’s home.
Health and Welfare Benefits. Named executive officers have historically received similar benefits to those provided to all other salaried U.S. employees, such as medical, dental, vision, life insurance and disability coverage.
133
Table of Contents
Employment Agreements. We have entered into employment agreements with each of our named executive officers to help ensure the retention of those executives critical to our future success. These agreements contain severance and change in control provisions which provide for potential future compensation depending on the circumstances of their departure from Biomet.
Policy with Respect to Deductibility of Compensation over $1 Million. Section 162(m) of the Code generally limits to $1.0 million the tax deductibility of annual compensation paid by publicly held corporations (as defined in the Code) to certain executives. However, performance based compensation can be excluded from this limit if it meets certain requirements. Prior to the Transactions, Biomet’s Compensation Committee’s policy was historically to consider the impact of Section 162(m) in establishing compensation for our senior executives. However, the committee historically retained the discretion to establish compensation, even if such compensation was not deductible under Section 162(m), if, in the committee’s judgment, such compensation was in our best interest and was reasonably expected to increase shareholder value. Following the Transactions and through the 2011 fiscal year, because we currently are not a publicly held corporation (as defined in the Code) with publicly held equity, the restrictions of Section 162(m) have not and do not presently apply to us.
Compensation Committee Report
The Compensation Committee has reviewed and discussed the foregoing Compensation Discussion and Analysis with management. Based on such review and discussion, the Compensation Committee recommended to the Board of Directors that the Compensation Discussion and Analysis be included in this Annual Report on Form 10-K.
Compensation Committee
Jonathan J. Coslet
Adrian Jones
Michael Dal Bello
Michael Michelson
Executive Compensation Tables
Summary Compensation Table
The following narrative, tables and footnotes describe the “total compensation” earned during the 2009, 2010 and 2011 fiscal years by our named executive officers. The total compensation presented below does not reflect the actual compensation received by our named executive officers or the target compensation of our named executive officers during the 2009, 2010 and 2011 fiscal years.
The individual components of the total compensation calculation reflected in the Summary Compensation Table with respect to fiscal 2011 are broken out below:
Salary. Base salary earned during the 2011 fiscal year. Refer to “The Elements of Biomet’s Compensation Program—Base Salary” above for further information concerning this element of our compensation program.
Bonus. Each named executive officer earned an annual performance-based cash incentive award as described under “Non-equity Incentive Plan Compensation” below.
Equity-Based Awards. The awards disclosed under the heading “Option Awards” consist of grants of stock options awarded under the 2007 LVB Plan and/or grants of restricted stock units awarded under the Restricted Stock Unit Plan. For further information about our equity-based award programs, refer to “The Elements of Biomet’s Compensation Program—Stock Options and Restricted Stock Units” above. In addition, details about
134
Table of Contents
equity-based awards made during the 2011 fiscal year are included in the Grants of Plan-Based Awards Table below. The dollar amounts for the awards in the Summary Compensation Table below reflect the grant date fair value of award grants made in the fiscal year. The recognized compensation expense of the equity-based awards for financial reporting purposes will likely vary from the actual amount ultimately realized by the named executive officer based on a number of factors. The factors include our actual operating performance, common share price fluctuations, differences from the valuation assumptions used and the timing of exercise or applicable vesting.
Non-equity Incentive Plan Compensation. Our named executive officers earned annual cash incentive awards for the 2011 fiscal year. Refer to “The Elements of Biomet’s Compensation Program—Non-equity Incentive Plan” above for further information concerning this element of our compensation program.
All Other Compensation. The amounts included under the “All Other Compensation” heading represent the sum of: (1) certain perquisites and other personal benefits; (2) Biomet-paid contributions to defined contribution and other retirement plans; (3) Biomet-paid insurance premiums; (4) certain tax reimbursements made by us; and (5) certain other amounts more fully described in footnote (2) to the Summary Compensation Table.
SUMMARY COMPENSATION TABLE
| Name and Principal Position |
Year | Salary ($) |
Stock Awards (1) ($) |
Option Awards (1) ($) |
Non-Equity Incentive Plan Compensation ($) |
Change in Pension Value and Non- Qualified Deferred Compensation Earnings ($) |
All Other Compensation (2) ($) |
Total ($) | ||||||||||||||||||||||||
| Jeffrey R. Binder, |
2011 | $ | 717,036 | $ | 8,500,000 | $ | — | $ | 416,310 | $ | — | $ | 393,875 | $ | 10,027,221 | |||||||||||||||||
| President and Chief Executive Officer | 2010 | 696,150 | — | 3,026,988 | 649,949 | — | 413,218 | 4,786,305 | ||||||||||||||||||||||||
| 2009 | 682,500 | — | — | 636,090 | — | 254,488 | 1,573,078 | |||||||||||||||||||||||||
| Daniel P. Florin, |
2011 | 422,118 | 1,750,000 | — | 208,054 | — | 33,216 | 2,413,388 | ||||||||||||||||||||||||
| Senior Vice President and Chief Financial Officer | 2010 | 409,824 | — | 714,420 | 305,280 | — | 13,063 | 1,442,587 | ||||||||||||||||||||||||
| 2009 | 401,788 | — | — | 297,002 | — | 13,063 | 711,853 | |||||||||||||||||||||||||
| Maggie Anderson |
2011 | 386,275 | 1,600,000 | — | 291,251 | — | 4,074 | 2,281,600 | ||||||||||||||||||||||||
| President, |
2010 | 311,270 | — | 2,074,819 | 215,331 | — | 200,063 | 2,801,483 | ||||||||||||||||||||||||
| Biomet 3i |
||||||||||||||||||||||||||||||||
| Jon C. Serbousek |
2011 | 413,831 | 1,750,000 | — | 180,066 | — | 19,430 | 2,363,327 | ||||||||||||||||||||||||
| Group President |
2010 | 401,778 | — | 465,423 | 357,686 | — | 164,358 | 1,389,245 | ||||||||||||||||||||||||
| Biomet Orthopedics |
2009 | 393,900 | — | 2,695,152 | 388,001 | — | 45,318 | 3,522,371 | ||||||||||||||||||||||||
| Renaat Vermeulen |
2011 | 377,103 | 1,250,000 | 683,278 | 137,669 | — | 126,427 | 2,574,477 | ||||||||||||||||||||||||
| President |
||||||||||||||||||||||||||||||||
| Biomet Europe |
||||||||||||||||||||||||||||||||
| (1) | For each named executive officer listed in the Summary Compensation Table above, the Stock Award’s value reflects the grant date fair value of grants made in the fiscal year. |
| (2) | The table below presents an itemized account of “All Other Compensation” provided during the 2009, 2010 and 2011 fiscal years. For each named executive officer listed below, the sum of the amounts listed in the columns in the table below reflects the total value included under the “All Other Compensation” heading in the table above. |
135
Table of Contents
| Year | Life Insurance Premiums ($) |
Retirement Plan Contributions ($) |
Medical Flex ($) |
Travel Allowance ($) (1) |
Personal Use of Company Aircraft ($) (2) |
Other ($) | Total ($) | |||||||||||||||||||||||||
| Jeffrey R. Binder |
2011 | $ | 63 | $ | 14,700 | $ | — | $ | 13,000 | $ | 366,112 | $ | — | $ | 393,875 | |||||||||||||||||
| 2010 | 63 | — | — | 13,000 | 400,155 | — | 413,218 | |||||||||||||||||||||||||
| 2009 | 63 | — | — | 13,000 | 241,425 | — | 254,488 | |||||||||||||||||||||||||
| Daniel P. Florin |
2011 | 63 | 14,033 | — | 13,000 | 6,120 | — | 33,216 | ||||||||||||||||||||||||
| 2010 | 63 | — | — | 13,000 | — | — | 13,063 | |||||||||||||||||||||||||
| 2009 | 63 | — | — | 13,000 | — | — | 13,063 | |||||||||||||||||||||||||
| Maggie Anderson |
2011 | 63 | 4,011 | — | — | — | 4,074 | |||||||||||||||||||||||||
| 2010 | 63 | — | — | — | — | 200,000 | (a) | 200,063 | ||||||||||||||||||||||||
| Jon C. Serbousek |
2011 | 63 | 6,367 | — | 13,000 | — | — | (c) | 19,430 | |||||||||||||||||||||||
| 2010 | 63 | — | — | 13,000 | 1,295 | 150,000 | (b) | 164,358 | ||||||||||||||||||||||||
| 2009 | 63 | — | — | 13,250 | 32,005 | — | 45,318 | |||||||||||||||||||||||||
| Renaat Vermeulen |
2011 | — | 81,282 | 3,491 | 41,654 | — | — | 126,427 | ||||||||||||||||||||||||
| (1) | Represents the cost to us of providing a car allowance to Messrs. Binder, Florin, and Serbousek and the cost each year for the lease car provided to Mr. Vermeulen. |
| (2) | Represents our incremental costs incurred for personal use of our aircraft. This amount is calculated by multiplying the aircraft’s hourly variable operating cost by a trip’s flight time, which includes any flight time used for an empty return flight. Variable operating costs are based on industry standard rates of our variable operating costs, including fuel and oil costs, maintenance and repairs, landing/ramp fees and other miscellaneous variable costs. On certain occasions, a spouse or other family member may accompany one of our named executive officers on a flight. No additional operating cost is incurred in such situations under the foregoing methodology. We do not pay our named executive officers any amounts in connection with taxes on income imputed to them for personal use of our aircraft. |
Pursuant to the employment agreement between us and Mr. Binder, dated June 11, 2008, we agreed to arrange, at our expense, for Mr. Binder to fly once per week to and from Mr. Binder’s Texas home and our headquarters or such other location as may be reasonably specified by us during the term of the employment agreement. We will not provide Mr. Binder with a “gross up” for taxes incurred in connection with these benefits. If, however, Mr. Binder uses a commercial flight and the income imputed in connection with the commercial flight exceeds the amount that would have been imputed to Mr. Binder if he had used our aircraft, we will provide to Mr. Binder a “gross up” for taxes incurred on the amount of such excess. Our incremental costs associated with extending these benefits to Mr. Binder are capped at $500,000 in any twelve-month period. For the purposes of applying this limitation, our incremental cost for commercial flights shall be the cost of Mr. Binder’s tickets, and for flights on Biomet-operated aircraft shall be the incremental per-hour cost associated with Mr. Binder’s flights and other incremental costs related to such flights, such as landing fees, transportation and housing costs of aircrew and other similar costs. The amount that appears under the Personal Use of Company Aircraft heading reflects the amount of this rolling twelve-month allowance that Mr. Binder used during fiscal 2011, 2010 and 2009.
During fiscal 2010 and 2009, pending Mr. Serbousek’s relocation to the Warsaw, Indiana area, we arranged for him to fly, at our expense, between his Tennessee home and our headquarters. Our incremental cost associated with providing this benefit to Mr. Serbousek were calculated as described above with respect to Mr. Binder.
| (a) | Pursuant to Ms. Anderson’s employment agreement, we paid Ms. Anderson a $200,000 sign-on bonus in August 2009. |
| (b) | We paid Mr. Serbousek a $150,000 relocation bonus in June 2010. |
136
Table of Contents
| (c) | Also pursuant to Mr. Serbousek’s employment agreement dated March 3, 2008, we agreed to purchase Mr. Serbousek’s prior residence in Tennessee at its appraised value, as determined by an independent appraiser, up to $650,000. As a result of the independent appraisal, we purchased Mr. Serbousek’s prior residence on June 25, 2010 for less than the maximum amount specified above, and Mr. Serbousek has not recognized any gain on the sale of his prior residence to us. As a result, the amount paid by us to Mr. Serbousek is not reflected in the amount shown in the table above for Mr. Serbousek under the “All Other Compensation” heading. In addition, because Mr. Serbousek recognized a loss on the sale of his house, we have not paid any “gross up” amounts to Mr. Serbousek in connection with the sale of his house. |
Grants of Plan-Based Awards Table
During the 2011 fiscal year, we granted cash incentive awards to our named executive officers under our non-equity incentive plan. Information with respect to each of these payments is set forth in the table below. For additional discussion of our non-equity incentive plan, refer to “The Elements of Biomet’s Compensation Program—Non-Equity Incentive Plan.” During the 2011 fiscal year, we granted equity-based awards to each of our named executive officers. Information with respect to these awards is set forth in the table below.
GRANTS OF PLAN-BASED AWARDS
| Name |
Grant Date | Estimated Possible
Payouts Under Non-Equity Incentive Plan Awards |
Estimated Future
Payouts Under Equity Incentive Plan Plan Awards |
All Other Stock Awards: Number of Shares of Stock or Units(1) (#) |
All Other Option Awards: Number of Securities Underlying Options(1) (#) |
Exercise of Base Price of Option Awards ($/Sh) |
Grant-Date Fair Value of Stock and Option Awards ($) |
|||||||||||||||||||||||||||||||||||
| Threshold ($) |
Target ($) |
Maximum ($) |
Threshold (#) |
Target (#) |
Maximum (#) |
|||||||||||||||||||||||||||||||||||||
| Jeffrey R. Binder |
February 10, 2011 |
— | $ | 717,035 | $ | 1,290,665 | — | — | — | 850,000 | — | $ | — | $ | 8,500,000 | |||||||||||||||||||||||||||
| Daniel P. Florin |
February 10, 2011 |
— | 337,695 | 607,850 | — | — | — | 175,000 | — | — | 1,750,000 | |||||||||||||||||||||||||||||||
| Maggie Anderson |
February 10, 2011 |
— | 309,020 | 556,236 | — | — | — | 160,000 | — | — | 1,600,000 | |||||||||||||||||||||||||||||||
| Jon C. Serbousek |
February 10, 2011 |
— | 331,065 | 595,917 | — | — | — | 175,000 | — | — | 1,750,000 | |||||||||||||||||||||||||||||||
| Renaat Vermeulen |
February 10, 2011 |
— | 279,404 | 502,927 | — | — | — | 125,000 | — | — | 1,250,000 | |||||||||||||||||||||||||||||||
| August 5, 2010 |
— | — | — | — | — | — | — | 400,000 | 10.00 | 683,278 | ||||||||||||||||||||||||||||||||
| (1) | For each named executive officer listed in the Summary Compensation Table above, the Stock Award’s value reflects the grant date fair value of grants made in the fiscal year. |
Outstanding Equity Awards at Fiscal Year-End Table
For further information on our equity-based awards and their material terms, refer to “The Elements of Biomet’s Compensation Program—Stock Options and Restricted Stock Units.”
The following table shows the equity awards granted to our named executive officers, which are comprised of stock option awards under the 2007 LVB Plan (vested and unvested) and restricted stock units under the Restricted Stock Unit Plan (vested and unvested) that were outstanding as of the end of the 2011 fiscal year.
137
Table of Contents
OUTSTANDING EQUITY AWARDS AT FISCAL YEAR END
| Name |
Number of Securities Underlying Unexercised Options (#) Exercisable (1) |
Number of Securities Underlying Unexercised Options (#) Unexercisable (2) |
Equity Incentive Plan Awards: Number of Securities Underlying Unexercised Unearned Options (#) (3) |
Option Exercise Price ($) (4) |
Option Expiration Date (5) |
Number of Shares or Units of Stock That Have Not Vested (#) |
Market Value of Shares or Units of Stock That Have Not Vested ($) |
Equity Incentive Plan Awards: Number of Unearned Shares, Units or Other Rights That Have Not Vested (#) |
Equity Incentive Plan Awards: Market or Payout Value of Unearned Shares, Units or Other Rights That Have Not Vested ($) |
|||||||||||||||||||||||||
| Jeffrey R. Binder |
1,811,250 | 1,338,750 | (a) | — | $ | 10.00 | July 11, 2017 | 850,000 | $ | 8,500,000 | — | $ | — | |||||||||||||||||||||
| 603,750 | — | 446,250 | (b) | 10.00 | July 11, 2017 | — | — | — | — | |||||||||||||||||||||||||
| Daniel P. Florin |
286,781 | 211,969 | (a) | — | 10.00 | July 11, 2017 | 175,000 | 1,750,000 | — | — | ||||||||||||||||||||||||
| 95,594 | — | 70,656 | (b) | 10.00 | July 11, 2017 | — | — | — | — | |||||||||||||||||||||||||
| 12,750 | 51,000 | (a) | — | 10.00 | October 5, 2019 | — | — | — | — | |||||||||||||||||||||||||
| 4,250 | — | 17,000 | (b) | 10.00 | October 5, 2019 | — | — | — | — | |||||||||||||||||||||||||
| Maggie Anderson |
112,500 | 450,000 | (a) | — | 10.00 | October 5, 2019 | 160,000 | 1,600,000 | — | — | ||||||||||||||||||||||||
| 37,500 | — | 150,000 | (b) | 10.00 | October 5, 2019 | — | — | — | — | |||||||||||||||||||||||||
| Jon C. Serbousek |
361,250 | 276,250 | (a) | — | 10.00 | May 8, 2018 | 175,000 | 1,750,000 | — | — | ||||||||||||||||||||||||
| 80,750 | — | 131,750 | (b) | 10.00 | May 8, 2018 | — | — | — | — | |||||||||||||||||||||||||
| Renaat Vermeulen |
172,500 | 127,500 | (a) | — | 10.00 | August 5, 2020 | 125,000 | 1,250,000 | — | — | ||||||||||||||||||||||||
| 57,500 | — | 42,500 | (b) | 10.00 | August 5, 2020 | — | — | — | — | |||||||||||||||||||||||||
| (1) | On an award-by-award basis, reflects the number of common shares underlying unexercised options that are exercisable and that are not reported in Column 3—“Number of Securities Underlying Unexercised Unearned Options.” |
| (2) | On an award-by-award basis, reflects the number of common shares underlying unexercised options that are unexercisable and that are not reported in Column 3—“Number of Securities Underlying Unexercised Unearned Options.” The vesting schedules of the outstanding unvested options are listed below: |
With respect to Mr. Binder, represents the outstanding unvested portion of the time-based option granted on October 5, 2009. The unvested portion is scheduled to vest in increments of 577,500 common shares on July 11 in each of 2011 and 2012, and 157,500 on July 11, 2013.
With respect to Mr. Florin, represents the outstanding unvested portion of the time-based option granted on October 5, 2009 and October 16, 2009. The unvested portion is scheduled to vest in increments of 91,438 common shares on July 11 in each of 2011 and 2012, 24,936 on July 11, 2013, and 12,750 on October 1 in each of 2011, 2012, 2013 and 2014.
With respect to Ms. Anderson, represents the outstanding unvested portion of the time-based option granted on October 5, 2009. The unvested portion is scheduled to vest in increments of 112,500 common shares on October 5 in each of 2011, 2012, 2013 and 2014.
With respect to Mr. Serbousek, represents the outstanding unvested portion of the time-based option granted on October 5, 2009. The unvested portion is scheduled to vest in increments of 116,875 common shares on May 8 in each of 2012 and 2013, and 31,875 on May 8, 2014.
With respect to Mr. Vermeulen, represents the outstanding unvested portion of the time-based option granted on August 5, 2010. The unvested portion is schedule to vest in increments of 80,000 common shares on July 11 in each of 2011 and 2012, and 20,000 on July 11, 2013.
138
Table of Contents
| (3) | Represents, on an award-by-award basis, the total number of common shares underlying unexercised options awarded under any equity incentive plan that have not been earned. Performance awards vest based on our achievement of adjusted EBITDA targets established by the Compensation Committee. |
With respect to Mr. Binder, represents the outstanding unvested portion of the performance-based option granted on October 5, 2009. The unvested portion is eligible to vest in increments of 157,500 common shares on July 11 in each of 2011, 2012 and 2013.
With respect to Mr. Florin, represents the outstanding unvested portion of the performance-based option granted on October 5, 2009 and October 16, 2009. The unvested portion is eligible to vest in increments of 24,938 common shares on July 11 in each of 2011, 2012 and 2013, and 4,250 common shares on October 1 in each of 2011, 2012, 2013 and 2014.
With respect to Ms. Anderson, represents the outstanding unvested portion of the performance-based option granted on October 5, 2009. The unvested portion is eligible to vest in increments of 37,500 common shares on October 5 in each of 2011, 2012, 2013 and 2014.
With respect to Mr. Serbousek, represents the outstanding unvested portion of the performance-based option granted on October 5, 2009. The unvested portion is eligible to vest in increments of 31,875 common shares on May 8 in each of 2012, 2013, and 2014.
With respect to Mr. Vermeulen, represents the outstanding unvested portion of the performance-based option granted on August 5, 2010. The unvested portion is eligible to vest in increments of 20,000 common shares on July 11 in each of 2011, 2012 and 2013.
| (4) | The exercise price, as it was recorded in the applicable stock option award agreement at the time of grant, for each option reported in Columns 1 and 2—“Number of Securities Underlying Unexercised Options” and Column 3—”Number of Securities Underlying Unexercised Unearned Options.” The options have an exercise price that is at least equivalent to fair market value of the underlying shares on the date of grant. Since our common stock is not currently traded on a national securities exchange, fair market value was determined by the Compensation Committee. |
| (5) | Represents the tenth year anniversary for each option award reported in Columns 1 and 2—“Number of Securities Underlying Unexercised Options” and Column 3—“Number of Securities Underlying Unexercised Unearned Options.” For information on the vesting schedule of unvested portions of outstanding option awards, see sub-footnotes (a)-(b) of footnote (2), and footnote (3), above. |
| (a) | Represents time-based options, which generally vest ratably over 5 years or 6 years for modified accreting exercise price options. |
| (b) | Represents performance-based options, which generally vest ratably over 5 years. The performance criteria for options vesting based on the fiscal 2011 results did not meet the target and did not vest. |
Option Exercises and Stock Vested Table
During the 2011 fiscal year, no equity-based awards were exercised by, and no stock awards vested to, Biomet’s named executive officers.
Retirement and Non-Qualified Defined Contribution and Deferred Compensation Plans
Employment Agreements and Potential Post-Termination Payments
We have employment agreements with each of Messrs. Binder, Florin, Vermeulen and Serbousek, and Ms. Anderson, which agreements contain severance and change in control provisions.
139
Table of Contents
Employment Agreement with Jeffrey R. Binder
On June 11, 2008, we entered into an amended and restated employment agreement, which we refer to as the employment agreement, with Mr. Binder, our President and Chief Executive Officer. The employment agreement supersedes our original employment agreement with Mr. Binder dated as of February 26, 2007, which we refer to as the original employment agreement. The employment agreement has an initial three-year term that provides for automatic twelve-month extensions, beginning on the first anniversary of the date of the employment agreement, unless either we or Mr. Binder give prior notice of termination. Mr. Binder will receive a base salary at a rate no less than $650,000 per year, which shall be increased at our discretion. Mr. Binder’s employment agreement provides that he will also have the opportunity to earn an annual cash incentive award in an amount no less than 100% of his base salary for on-target performance, with the possibility of exceeding 100% for high achievement. For a further discussion of our non-equity incentive plan, see “The Elements of Biomet’s Compensation Program—Non-Equity Incentive Plan.”
Mr. Binder’s employment agreement provides that we will arrange, at our expense, for Mr. Binder to fly once per week to and from his Texas home and our headquarters or such other location as may be reasonably specified by us during the term of the employment agreement. We will not provide Mr. Binder with a “gross up” for taxes incurred in connection with these benefits. If, however, Mr. Binder uses a commercial flight and the income imputed in connection with the commercial flight exceeds the amount that would have been imputed to Mr. Binder if he had used our aircraft, we will provide to Mr. Binder a “gross up” for taxes incurred on the amount of such excess. Our incremental costs associated with extending these benefits to Mr. Binder are capped at $500,000 in any twelve month period.
The employment agreement further provides that, upon any termination of Mr. Binder’s employment, his rights with respect to any equity or equity-related awards will be governed by the applicable terms of the related plan or award agreement. Mr. Binder could be entitled to certain severance benefits following a termination of employment prior to a change in control (as defined in the agreement) or within two years following a change in control.
Under the employment agreement, if Mr. Binder’s employment is terminated at any time within the two-year period following a change in control either (1) by us for any reason other than for cause, death or disability, or (2) by Mr. Binder for good reason, then (a) his severance multiple would be increased from 1.5 times his base salary and annual cash incentive award to two times his base salary and annual cash incentive award and (b) his pro rated annual cash incentive award for the year of termination of employment would be based on his target annual cash incentive award for such year rather than the actual annual cash incentive award he would have received for such year (as determined based on the Company’s performance to the date of termination of employment, extrapolated through the end of such fiscal year). The employment agreement further provides that if Mr. Binder is subject to the “golden parachute” excise tax under Section 4999 of the Code, the Company will pay him an additional amount such that he is placed in the same after-tax position as if no excise tax had been imposed. See “Severance Benefits” below.
Employment Agreements with Daniel P. Florin
On February 28, 2008, we entered into employment agreements with Mr. Florin, our Senior Vice President and Chief Financial Officer. Mr. Florin’s agreement has an initial three-year term that provides for automatic twelve-month extensions, beginning on the first anniversary of the date of the agreement, unless either party gives prior notice of termination. Mr. Florin will receive a base salary at a rate no less than $395,850 per year which shall be increased at our discretion. Mr. Florin will also have the opportunity to earn an annual cash incentive award in an amount no less than 80% of his base salary for on-target performance, with the possibility of exceeding 80% for high achievement. For a further discussion of our non-equity incentive plan, see “The Elements of Biomet’s Compensation Program—Non-equity Incentive Plan.”
140
Table of Contents
The agreements further provide that Mr. Florin could be entitled to certain severance benefits following termination of employment prior to a change in control (as defined in the agreements) or within two years following a change in control. See “—Severance Benefits” below.
Employment Agreement with Renaat Vermeulen
On March 1, 2007, our subsidiary Biomet Europe B.V. entered into an employment agreement, which agreement was amended effective July 12, 2010 with Mr. Vermeulen, our Senior Vice President and President of Biomet Europe, Middle East and Africa. The agreement has an indefinite term. Mr. Vermeulen will receive a base salary at a rate no less than €250,000 per year, which shall be increased at our discretion. Mr. Vermeulen will also have the opportunity to earn an annual cash incentive award in an amount no less than 80% of his base salary for on-target performance, with the possibility of exceeding 80% for high achievement. For a further discussion of our non-equity incentive plan, see “The Elements of Biomet’s Compensation Program—Non-equity Incentive Plan.” On August 30, 2010, Biomet, Inc. entered into an employment agreement with Mr. Vermeulen with respect to his duties as a Senior Vice President of Biomet, Inc. The agreement has an initial three-year term that provides for automatic twelve-month extensions, beginning on the first anniversary of the date of the agreement, unless either party gives prior notice of termination.
Employment Agreement with Jon C. Serbousek
On March 3, 2008, we entered into an employment agreement with Mr. Serbousek, our Senior Vice President and President of Biomet Orthopedics, LLC. The agreement has an initial three-year term that provides for automatic twelve-month extensions, beginning on the first anniversary of the date of the agreement, unless either party gives prior notice of termination. Mr. Serbousek will receive a base salary at a rate no less than $390,000 per year, which shall be increased at our discretion. Mr. Serbousek will also have the opportunity to earn an annual cash incentive award in an amount no less than 80% of his base salary for on-target performance, with the possibility of exceeding 80% for high achievement. For a further discussion of our non-equity incentive plan, see “The Elements of Biomet’s Compensation Program—Non-equity Incentive Plan.”
The agreement further provides that Mr. Serbousek could be entitled to certain severance benefits following termination of employment prior to a change in control (as defined in the agreement) or within two years of a change in control. See “—Severance Benefits” below.
Employment Agreement with Maggie Anderson
On August 1, 2009, we entered into an employment agreement with Ms. Anderson, our Senior Vice President and President of Biomet 3i, LLC. The agreement has an initial three-year term that provides for automatic twelve-month extensions, beginning on the first anniversary of the date of the agreement, unless either party gives prior notice of termination. Ms. Anderson will receive a base salary at a rate no less than $375,024 per year, which shall be increased at our discretion. Ms. Anderson will also have the opportunity to earn an annual cash incentive award in an amount no less than 80% of her base salary for on-target performance, with the possibility of exceeding 80% for high achievement. For a further discussion of our non-equity incentive plan, see “The Elements of Biomet’s Compensation Program—Non-equity Incentive Plan.”
The agreement further provides that Ms. Anderson could be entitled to certain severance benefits following termination of employment prior to a change in control (as defined in the agreement) or within two years of a change in control. See “—Severance Benefits” below.
Severance Benefits
Each of our employment agreements with Messrs. Binder, Florin and Serbousek, and Ms. Anderson contains provisions which entitle the executive to certain severance benefits following termination of employment prior to a change in control (as defined in the agreement) or within two years following a change in control. Mr. Vermeulen’s employment agreements with Biomet Europe B.V. and Biomet, Inc. do not provide for severance benefits outside of a three-month notice period of termination.
141
Table of Contents
The following summary provides a description of the severance arrangements contained in our employment agreements with Messrs. Binder, Florin and Serbousek, and Ms. Anderson. Other than with respect to Mr. Binder as described in “Termination Within Two Years Following a Change in Control by Biomet Other Than For Cause, Death or Disability, or by Executive for Good Reason,” the following summary does not discuss the executives’ rights with respect to any equity related awards, as such awards are governed by the applicable terms of the related plan or award agreement.
Termination Prior to a Change in Control by Biomet Other Than For Cause, Death or Disability, or by Executive for Good Reason
With respect to Messrs. Binder, Florin and Serbousek, and Ms. Anderson, in the event of a termination of the executive’s employment prior to a change in control either (1) by us for any reason other than for “cause” (which generally includes the executive’s failure to substantially perform the executive’s duties, willful misconduct or gross negligence, willful or grossly negligent breach of the executive’s fiduciary duties to Biomet, commission of any felony or other serious crime involving moral turpitude, material breach of any agreement between the executive and Biomet or material breach of our written policies), executive’s death or executive’s disability, or (2) by executive for “good reason” (which generally includes any material diminution in duties and responsibilities (but does not include, in the case of Mr. Serbousek, and Ms. Anderson, a change in duties and responsibilities that results from becoming a part of a larger organization following a change in control), reduction in base salary or bonus opportunity or relocation of primary work location by more than 50 miles), our employment agreements with Messrs. Binder, Florin and Serbousek, and Ms. Anderson, provide that such executive would be entitled to the following:
| • | An amount equal to (a) 1.5 times the executive’s base salary in effect at the date of termination (with respect to Messrs. Florin and Serbousek, and Ms. Anderson, the “Severance Benefit,” and with respect to Mr. Binder, the “Base Component”) plus, with respect to Mr. Binder, (b) 1.5 times the average of (x) the annual cash incentive award earned by Mr. Binder for the preceding fiscal year and (y) the annual cash incentive award Mr. Binder would have received for the current fiscal year had his employment not been terminated, based on Biomet’s performance to the date of termination extrapolated through the end of such fiscal year (the “Bonus Component,” and with respect to Mr. Binder, together with the Base Component, the “Severance Benefit”). The total amount of the Severance Benefit will be paid in equal, ratable installments in accordance with our regular payroll policies over the course of the 18 month non-compete period provided for in the agreement. If Mr. Binder becomes employed by another employer during that period, the Bonus Component will cease and his Severance Benefit will be limited to the Base Component; |
| • | An amount equal to the pro rated portion (based on the percentage of Biomet’s current fiscal year preceding the date on which the executive’s employment is terminated) of the annual cash incentive award the executive would have received for the current fiscal year, based on Biomet’s performance to the date of termination extrapolated through the end of the current fiscal year. The total amount of the pro rated annual cash incentive award will be paid in a lump sum at the time we pay annual cash incentive awards to similarly situated active employees; |
| • | If the executive is eligible for and elects continuation coverage pursuant to COBRA, we will pay the premiums for such coverage (or reimburse the executive for such premiums) until the earlier of (a) the end of the 18 month period during which, under the employment agreement, the executive agrees not to engage in certain activities in competition with us or (b) the date the executive becomes eligible for coverage under another group plan; |
| • | Any “accrued benefits” (as defined in the agreement), which generally include any vested compensation deferred by the executive and not yet paid by the Company, any amounts or benefits owing to the executive under the then applicable benefit plans of the Company, and any amounts owing to the executive for reimbursement of expenses properly incurred by the executive; and |
142
Table of Contents
| • | With respect to Mr. Binder, continued payment of Mr. Binder’s company-provided car allowance, if any, for a period of 12 months from the termination date. |
Termination Within Two Years After a Change in Control by Biomet Other Than For Cause, Death or Disability, or by Executive for Good Reason
With respect to Messrs. Binder, Florin and Serbousek, and Ms. Anderson, in the event of a termination of the executive’s employment within two years after a change in control either (1) by us for any reason other than for cause, executive’s death or executive’s disability, or (2) by executive for good reason, such executive would be entitled to the following:
| • | An amount equal to (a) two times the executive’s base salary in effect at the date of termination plus (b) two times the average of (x) the annual cash incentive award earned by executive for the preceding fiscal year and (y) the annual cash incentive award the executive would have received for the current fiscal year had the executive’s employment not been terminated, based on Biomet’s performance to the date of termination extrapolated through the end of such fiscal year (collectively, the “Change-in-Control Severance Benefit”). The total amount of the Change-in-Control Severance Benefit will be paid in a lump sum as soon as administratively practicable following the termination of the executive’s employment; |
| • | An amount equal to the pro rated portion (based on the percentage of Biomet’s current fiscal year preceding the date on which the executive’s employment is terminated) of the annual cash incentive award the executive would have received for the current fiscal year, based on Biomet’s performance to the date of termination extrapolated through the end of the current year. The total amount of the pro rated annual cash incentive award will be paid in a lump sum at the time we pay annual cash incentive awards to similarly situated active employees; |
| • | If the executive is eligible for and elects continuation coverage pursuant to COBRA, we will pay the premiums for such coverage (or reimburse executive for such premiums) until the earlier of (a) the end of the 18 month period during which, under the employment agreement, the executive agrees not to engage in certain activities in competition with us or (b) the date the executive becomes eligible for coverage under another group plan; |
| • | Any “accrued benefits” (as defined in the agreement), which generally include any vested compensation deferred by the executive and not yet paid by the Company, any amounts or benefits owing to the executive under the then applicable benefit plans of the Company, and any amounts owing to the executive for reimbursement of expenses properly incurred by the executive; and |
| • | With respect to Mr. Binder, continued payment of Mr. Binder’s company-provided car allowance, if any, for a period of 12 months from the termination date and immediate vesting of any unvested options held by Mr. Binder as of the date his employment is terminated. |
To receive the severance benefits provided under the agreement, the executive must sign a general release of claims. The agreement contains customary confidentiality, non-competition and non-solicitation provisions. Messrs. Binder’s, Florin’s, Serbousek’s and Vermeulen’s, and Ms. Anderson’s non-competition period is 18 months following the date of termination of employment.
Furthermore, in the event that any payments made to Mr. Binder in connection with a termination of employment would be subject to excise taxes under the Code, subject to certain conditions, Biomet will “gross up” his compensation to fully offset such excise taxes.
Termination Due to Death or Disability
If any of Messrs. Binder, Florin or Serbousek’s, or Ms. Anderson’s employment is terminated due to the executive’s death or disability, the executive is entitled to receive the following:
| • | the executive’s base salary in effect through the date of termination; |
143
Table of Contents
| • | a pro-rated portion (based on the percentage of our fiscal year preceding the date of termination) of the average of (x) the annual cash incentive award earned by such executive for the preceding year and (y) the annual cash incentive award such executive would have received in the current year if the executive’s employment had not been terminated, based on our performance to the date of termination extrapolated through the end of the then current fiscal year; and |
| • | any “accrued benefits” (as defined in the agreement). |
If Mr. Vermeulen’s employment is terminated due to the executive’s death or disability, he is entitled to receive an amount equal to three months of his base salary in effect at the date of termination.
Termination With Cause or Without Good Reason
If any of Messrs. Binder, Florin or Serbousek’s, or Ms. Anderson’s employment is terminated with “cause” or without “good reason” (as defined in the employment agreement) we will pay such executive’s base salary in effect through the termination date and any “accrued benefits” (as defined in the agreement) when due.
If Mr. Vermeulen’s employment is terminated with “cause” or without “good reason”, he is entitled to receive an amount equal to three months of his base salary in effect at the date of termination.
Potential Payments Upon Certain Terminations
This table shows the potential compensation that we would have to pay to certain named executive officers upon a termination of employment – related or unrelated to a change in control – by us without “cause” or by the executive with “good reason” (as defined in the applicable agreements), due to the executive’s death or disability, and by us with “cause” or by the executive without “good reason” (as defined in the applicable agreements). The table excludes certain amounts payable pursuant to plans that are available generally to all salaried employees. In the event of the death or disability of any of the named executive officers listed in the following table, the deceased or disabled named executive officer, or his designated beneficiaries, would also receive a payment pursuant to the terms of Biomet-funded life or disability plans, respectively, in addition to the amounts set forth below. The amounts shown assume that termination of employment was effective May 31, 2011. The amounts shown are only estimates of the amounts that would be payable to the executives upon termination of employment and do not reflect tax positions we may take or the accounting treatment of such payments. Actual amounts to be paid can only be determined at the time of separation. Although the calculations are intended to provide reasonable estimates of the potential benefits, they are based on numerous assumptions and do not represent the actual amount an executive would receive if an eligible termination event were to occur.
144
Table of Contents
POTENTIAL PAYMENTS UPON TERMINATION OR CHANGE IN CONTROL
Potential Payments Upon Termination or Termination in Connection With a Change in Control
| Termination in Connection with a Change in Control |
Termination in Absence of a Change in Control |
|||||||||||||||||||||||||||||||
| Name of Executive Officer |
Termination without Cause or with Good Reason (1) |
Termination with Cause or Resignation without Good Reason (2) |
Disability (3) |
Death (4) |
Termination without Cause or with Good Reason (5) |
Termination with Cause or Resignation without Good Reason (6) |
Disability (7) |
Death (8) |
||||||||||||||||||||||||
| Jeffrey R. Binder (9) |
||||||||||||||||||||||||||||||||
| Estimated Value of Non-Equity Benefits and Accrued Obligations |
$ | 2,952,171 | $ | — | $ | 533,130 | $ | 533,130 | $ | 2,327,088 | $ | — | $ | 533,130 | $ | 533,130 | ||||||||||||||||
| Estimated Value of Options & Equity Awards |
8,500,000 | — | — | — | — | — | — | — | ||||||||||||||||||||||||
| Total |
11,452,171 | — | 533,130 | 533,130 | 2,327,088 | — | 533,130 | 533,130 | ||||||||||||||||||||||||
| Daniel P. Florin (9) |
||||||||||||||||||||||||||||||||
| Estimated Value of Non-Equity Benefits and Accrued Obligations |
1,588,154 | — | 256,667 | 256,667 | 863,761 | — | 256,667 | 256,667 | ||||||||||||||||||||||||
| Estimated Value of Options & Equity Awards |
1,750,000 | — | — | — | — | — | — | — | ||||||||||||||||||||||||
| Total |
3,338,154 | — | 256,667 | 256,667 | 863,761 | — | 256,667 | 256,667 | ||||||||||||||||||||||||
| Maggie Anderson |
||||||||||||||||||||||||||||||||
| Estimated Value of Non-Equity Benefits and Accrued Obligations |
1,577,885 | — | 253,291 | 253,291 | 878,166 | — | 253,291 | 253,291 | ||||||||||||||||||||||||
| Estimated Value of Options & Equity Awards |
1,600,000 | — | — | — | — | — | — | — | ||||||||||||||||||||||||
| Total |
3,177,885 | — | 253,291 | 253,291 | 878,166 | — | 253,291 | 253,291 | ||||||||||||||||||||||||
| Jon C. Serbousek (9) |
||||||||||||||||||||||||||||||||
| Estimated Value of Non-Equity Benefits and Accrued Obligations |
1,568,010 | — | 268,876 | 268,876 | 823,343 | — | 268,876 | 268,876 | ||||||||||||||||||||||||
| Estimated Value of Options & Equity Awards |
1,750,000 | — | — | — | — | — | — | — | ||||||||||||||||||||||||
| Total |
3,318,010 | — | 268,876 | 268,876 | 823,343 | — | 268,876 | 268,876 | ||||||||||||||||||||||||
| Renaat Vermeulen (9) |
||||||||||||||||||||||||||||||||
| Estimated Value of Non-Equity Benefits and Accrued Obligations |
94,276 | 94,276 | 94,276 | 94,276 | 94,276 | — | 94,276 | 94,276 | ||||||||||||||||||||||||
| Estimated Value of Options & Equity Awards |
1,250,000 | — | — | — | — | — | — | — | ||||||||||||||||||||||||
| Total |
1,344,276 | 94,276 | 94,276 | 94,276 | 94,276 | — | 94,276 | 94,276 | ||||||||||||||||||||||||
| (1) | With respect to Messrs. Binder, Florin and Serbousek, and Ms. Anderson: |
Non-Equity Benefits and Accrued Obligations represents: (i) an amount equal to (a) two times the executive’s base salary in effect at the date of termination plus (b) two times the average of (x) the annual cash incentive award earned by the executive for the preceding fiscal year and (y) the annual cash incentive award the executive would have received for the current fiscal year had the executive’s employment not been terminated, based on Biomet’s performance to the date of termination extrapolated through the end of such fiscal year; (ii) an amount equal to the pro-rated portion of the annual cash incentive award the executive would have received for the current fiscal year, based on Biomet’s performance to the date of termination extrapolated through the end of the current year; (iii) if the executive is eligible for and elects continuation coverage pursuant to COBRA, the premiums for such coverage until the earlier of (a) the end
145
Table of Contents
of the 18-month period during which executive agrees, under the executive’s employment agreement, not to engage in certain activities in competition with us or (b) the date the executive becomes eligible for coverage under another group plan; (iv) any “accrued benefits,” which generally include any vested compensation deferred by the executive and not yet paid by the Company, any amounts or benefits owing to the executive under the then applicable benefit plans of the Company, and any amounts owing to the executive for reimbursement of expenses properly incurred by the executive; and (v) with respect to Mr. Binder, continued payment of Mr. Binder’s company provided car allowance, if any, for a period of 12 months from the termination date.
With respect to Mr. Vermeulen:
Non-equity Benefits and Accrued Obligations represents an amount equal to three months’ of Mr. Vermeulen’s base salary in effect at the date of termination.
With respect to Messrs. Binder, Florin, Serbousek and Vermeulen and Ms. Anderson:
Options and Equity Awards represents the difference between the exercise price and the value of LVB’s common stock on May 31, 2011 and the value of their RSUs as of May 31, 2011, with respect to any vested options held by the executive as of May 31, 2011.
| (2) | With respect to Messrs. Binder, Florin, Serbousek and Vermeulen and Ms. Anderson: |
Non-Equity Benefits and Accrued Obligations represents (i) base salary in effect through the termination date and (ii) any “accrued benefits” (as defined in the employment agreements), which generally include any vested compensation deferred by the executive and not yet paid by the Company, any amounts or benefits owing to the executive under the then applicable benefit plans of the Company and any amounts owing to the executive for reimbursement of expenses properly incurred by the executive.
With respect to Mr. Vermeulen:
Non-equity Benefits and Accrued Obligations represents an amount equal to three months’ of Mr. Vermeulen’s base salary in effect at the date of termination.
| (3) | With respect to Messrs. Binder, Florin and Serbousek, and Ms. Anderson: |
Non-Equity Benefits and Accrued Obligations represents: (i) the executive’s base salary in effect through date of termination; (ii) a pro-rated portion (based on the percentage of our fiscal year preceding the date of termination) of the average of (x) the annual cash incentive award bonus earned by the executive for the preceding year and (y) the annual cash incentive award the executive would have received in the current year if the executive’s employment had not been terminated, based on our performance to the date of termination extrapolated through the end of the current year; and (iii) any “accrued benefits,” which generally include any vested compensation deferred by the executive and not yet paid by the Company, any amounts or benefits owing to the executive under the then applicable benefit plans of the Company, and any amounts owing to the executive for reimbursement of expenses properly incurred by the executive.
With respect to Mr. Vermeulen:
Non-equity Benefits and Accrued Obligations represents an amount equal to three months’ of Mr. Vermeulen’s base salary in effect at the date of termination.
With respect to Messrs. Binder, Florin, Serbousek and Vermeulen and Ms. Anderson:
Options and Equity Awards represents the difference between the exercise price and the value of LVB’s common stock on May 31, 2011 with respect to any vested options held by the executive as of May 31, 2011.
| (4) | With respect to Messrs. Binder, Florin, Serbousek and Vermeulen and Ms. Anderson: |
Non-Equity Benefits and Accrued Obligations represents the payments as described in footnote 3 of this table.
146
Table of Contents
With respect to Messrs. Binder, Florin, Kashuba and Serbousek, and Ms. Anderson:
Options and Equity Awards represents the difference between the exercise price and the value of LVB’s common stock on May 31, 2011 with respect to any vested options held by the executive as of May 31, 2011.
| (5) | With respect to Messrs. Binder, Florin and Serbousek, and Ms. Anderson: |
Non-Equity Benefits and Accrued Obligations represents: (i) an amount equal to (a) 1.5 times the executive’s base salary in effect at the date of termination plus, with respect to Mr. Binder (b) 1.5 times the average of (x) the annual cash incentive award earned by executive for the preceding fiscal year and (y) the annual cash incentive award the executive would have received for the current fiscal year had the executive’s employment not been terminated, based on Biomet’s performance to the date of termination extrapolated through the end of such fiscal year; (ii) an amount equal to the pro-rated portion (based on the percentage of Biomet’s current fiscal year preceding the date on which executive’s employment is terminated) of the annual cash incentive award the executive would have received for the current fiscal year, based on Biomet’s performance to the date of termination extrapolated through the end of the current year; (iii) if the executive is eligible for and elects continuation coverage pursuant to COBRA, the premiums for such coverage (or reimbursement to the executive for such premiums) until the earlier of (a) the end of the 18-month period during which, under the employment agreement, the executive agrees not to engage in certain activities in competition with us or (b) the date the executive becomes eligible for coverage under another group plan; (iv) any “accrued benefits,” which generally include any vested compensation deferred by the executive and not yet paid by the Company, any amounts or benefits owing to the executive under the then applicable benefit plans of the Company, and any amounts owing to the executive for reimbursement of expenses properly incurred by the executive; and (v) with respect to Mr. Binder, continued payment of Mr. Binder’s company provided car allowance, if any, for a period of 12 months from the termination date and immediate vesting of any unvested options held by Mr. Binder as of the date his employment is terminated.
With respect to Mr. Vermeulen:
Non-equity Benefits and Accrued Obligations represents an amount equal to three months’ of Mr. Vermeulen’s base salary in effect at the date of termination.
With respect to Messrs. Binder, Florin, Serbousek and Vermeulen and Ms. Anderson:
Options and Equity Awards represents the difference between the exercise price and the value of LVB’s common stock on May 31, 2011 with respect to any vested options held by the executive as of May 31, 2011.
With respect to Mr. Vermeulen:
Non-equity Benefits and Accrued Obligations represents an amount equal to three months’ of Mr. Vermeulen’s base salary in effect at the date of termination.
| (6) | With respect to Messrs. Binder, Florin, Serbousek and Vermeulen and Ms. Anderson: |
Non-Equity Benefits and Accrued Obligations represents: (i) base salary in effect through the termination date and (ii) any “accrued benefits,” which generally include any vested compensation deferred by the executive and not yet paid by the Company, any amounts or benefits owing to the executive under the then applicable benefit plans of the Company and any amounts owing to the executive for reimbursement of expenses properly incurred by the executive.
| (7) | For Messrs. Binder, Florin and Serbousek, and Ms. Anderson: |
Non-Equity Benefits and Accrued Obligations represents: (i) the executive’s base salary in effect through date of termination; (ii) a pro-rated portion (based on the percentage of our fiscal year preceding the date of termination) of the average of (x) the annual cash incentive award earned by the executive for the preceding year and (y) the annual cash incentive award the executive would have received in the current year if the
147
Table of Contents
executive’s employment had not been terminated, based on our performance to the date of termination extrapolated through the end of the current year; and (iii) any “accrued benefits,” which generally include any vested compensation deferred by the executive and not yet paid by the Company, any amounts or benefits owing to the executive under the then applicable benefit plans of the Company and any amounts owing to the executive for reimbursement of expenses properly incurred by the executive.
With respect to Mr. Vermeulen:
Non-equity Benefits and Accrued Obligations represents an amount equal to three months’ of Mr. Vermeulen’s base salary in effect at the date of termination.
For Messrs. Binder, Florin, Serbousek and Vermeulen and Ms. Anderson:
Options and Equity Awards represents the difference between the exercise price and the value of LVB’s common stock on May 31, 2011 with respect to any vested options held by the executive as of May 31, 2011.
| (8) | With respect to Messrs. Binder, Florin, Serbousek and Vermeulen and Ms. Anderson: |
Non-Equity Benefits and Accrued Obligations represents the payments described in footnote 4 of this table.
With respect to Messrs. Binder, Florin, Serbousek and Vermeulen and Ms. Anderson:
Options and Equity Awards represents the difference between the exercise price and the value of LVB’s common stock on May 31, 2011 with respect to any vested options held by the executive as of May 31, 2011.
Non-Employee Director Compensation and Benefits
Our directors have not received cash retainers, committee fees, or stock option awards for their services as our directors.
Business Expenses
The directors are reimbursed for their business expenses related to their attendance at our meetings, including room, meals and transportation to and from Board and committee meetings. On rare occasions, a director’s spouse may accompany a director when traveling on Biomet business. At times, a director may travel to and from our meetings on our corporate aircraft. Directors are also eligible to be reimbursed for attendance at qualified director education programs.
Director and Officer Liability (or D&O) Insurance and Travel Accident Insurance
D&O insurance individually insures our directors and officers against certain losses that they are legally required to bear as a result of their actions while performing duties on our behalf. Our D&O insurance policy does not break out the premium for directors versus officers and, therefore, a dollar amount cannot be assigned to the coverage provided for individual directors.
We also maintain an Aviation Insurance Policy that provides benefits to each director in the event of death or disability (permanent and total) during travel on our corporate aircraft. This policy also covers employees and others while traveling on our corporate aircraft and, therefore, a dollar amount cannot be assigned to the coverage provided for individual directors.
Non-Employee Directors’ Compensation Table
The following table shows information regarding the compensation of our non-employee directors for the 2011 fiscal year. Mr. Binder is not included in the table below because, as President and Chief Executive Officer,
disclosure in respect of his compensation is presented in the Summary Compensation Table. Furthermore, as an employee director, Mr. Binder did not receive compensation in his capacity as a director.
148
Table of Contents
DIRECTOR COMPENSATION
| Name |
Fees Earned or Paid in Cash ($) |
Stock Awards ($) |
Option Awards ($) |
Non-Equity Incentive Plan Compensation ($) |
Change in Pension Value and Nonqualified Deferred Compensation Earnings ($) |
All Other Compensation ($) |
Total ($) | |||||||||||||||||||||
| Jonathon J. Coslet |
$ | — | $ | $ | — | $ | — | $ | — | $ | — | $ | — | |||||||||||||||
| Michael Dal Bello |
— | — | — | — | — | — | ||||||||||||||||||||||
| Adrian Jones |
— | — | — | — | — | — | ||||||||||||||||||||||
| Michael Michelson |
— | — | — | — | — | — | ||||||||||||||||||||||
| Dane A. Miller, Ph.D. (1) |
— | — | — | — | 250,000 | 250,000 | ||||||||||||||||||||||
| Max Lin |
— | — | — | — | — | — | ||||||||||||||||||||||
| Todd Sisitsky |
— | — | — | — | — | — | ||||||||||||||||||||||
| David McVeigh |
— | — | — | — | — | — | ||||||||||||||||||||||
| Andrew Y. Rhee |
— | — | — | — | — | — | ||||||||||||||||||||||
| (1) | On January 14, 2010, the Company entered into a consulting agreement with Dr. Dane A. Miller Ph.D., pursuant to which it will pay Dr. Miller a consulting fee of $0.25 million per fiscal year for Dr. Miller’s consulting services and will reimburse Dr. Miller for out-of-pocket fees and expenses relating to an off-site office and administrative support in an amount of $0.1 million per year. The term of the agreement extends through the earlier of September 1, 2011, an initial public offering or a change of control. The agreement also contains certain restrictive covenants prohibiting Dr. Miller from competing with the Company and soliciting employees of the Company during the term of the agreement and for a period of one year following such term. Dr. Miller received $0.25 million of payment, under the consulting agreement during the year ended May 31, 2011. |
| Item 12. | Security Ownership of Certain Beneficial Owners and Management and Related Stockholder Matters. |
Parent owns all of our issued and outstanding capital stock. Holding owns 97.0% of the issued and outstanding capital stock of Parent. All equity interests in Holding are owned, directly or indirectly, by the Sponsor Funds and the Co-Investors.
The following table sets forth information with respect to the ownership of as of May 31, 2011 for (a) each person known by us to own beneficially more than a 5% equity interest in Holdings, (b) each member of our board of directors, (c) each of our named executive officers, and (d) all of our executive officers and directors as a group. Biomet, Inc. has 1,000 shares of common stock outstanding, all of which are owned directly by Parent. Share amounts indicated below reflect beneficial ownership, through Holding, by such entities or individuals of these 1,000 shares of Biomet, Inc.
The amounts and percentages of shares beneficially owned are reported on the basis of SEC regulations governing the determination of beneficial ownership of securities. Under SEC rules, a person is deemed to be a “beneficial owner” of a security if that person has or shares voting power or investment power, which includes the power to dispose of or to direct the disposition of such security. A person is also deemed to be a beneficial owner of any securities of which that person has a right to acquire beneficial ownership within 60 days. Securities that can be so acquired are deemed to be outstanding for purposes of computing such person’s ownership percentage, but not for purposes of computing any other person’s percentage. Under these rules, more than one person may be deemed to be a beneficial owner of the same securities and a person may be deemed to be a beneficial owner of securities as to which such person has no economic interest.
Except as otherwise indicated in the footnotes below, each of the beneficial owners has, to our knowledge, sole voting and investment power with respect to the indicated shares. Unless otherwise noted, the address of each beneficial owner is c/o Biomet, Inc., 56 East Bell Drive, Warsaw, Indiana 46582.
149
Table of Contents
| Name and Address of Beneficial Owner |
Beneficial Ownership of Biomet Common Shares |
Percentage Owned |
||||||
| The Blackstone Group(1) |
228.7 | 22.91 | % | |||||
| The Goldman Sachs Group, Inc.(2) |
228.7 | 22.91 | % | |||||
| KKR Biomet, LLC(3) |
234.3 | 23.47 | % | |||||
| TPG Capital(4) |
228.7 | 22.91 | % | |||||
| Jeffrey R. Binder |
* | * | ||||||
| Daniel P. Florin |
* | * | ||||||
| Jon C. Serbousek |
* | * | ||||||
| Renaat Vermeulen |
* | * | ||||||
| Maggie Anderson |
* | * | ||||||
| Jonathan J. Coslet(5) |
228.7 | 22.91 | % | |||||
| Michael Dal Bello(6) |
228.7 | 22.91 | % | |||||
| Adrian Jones(7) |
228.7 | 22.91 | % | |||||
| Max Lin(8) |
234.3 | 23.47 | % | |||||
| David McVeigh(6) |
228.7 | 22.91 | % | |||||
| Michael Michelson(8) |
234.3 | 23.47 | % | |||||
| Dane A. Miller(9) |
21.0 | 2.10 | % | |||||
| Andrew Y. Rhee(7) |
228.7 | 22.91 | % | |||||
| Todd Sisitsky(5) |
228.7 | 22.91 | % | |||||
| All executive officers and directors as a group (21 persons) |
941.4 | 94.31 | % | |||||
| * | Represents less than one percent or one share, as applicable. |
| (1) | Biomet, Inc. shares shown as beneficially owned by The Blackstone Group reflect an aggregate of the following record ownership: (i) 610,123.16500 membership units of Holding held by Blackstone Capital Partners V, L.P., (ii) 97,734.55100 membership units of Holding held by Blackstone Capital Partners V-AC L.P., (iii) 289,050.00000 membership units of Holding held by BCP V-S L.P., (iv) 32,352.75700 membership units of Holding held by Blackstone Family Investment Partnership V L.P., (v) 3,091.54600 membership units of Holding held by Blackstone Family Investment Partnership V-A L.P., (vi) 2,291.27315 membership units of Holding held by Blackstone Participation Partnership V L.P., and (vii) 273,775.86600 membership units of Holding held by BCP V Co-Investors L.P. The address of The Blackstone Group is 345 Park Avenue, New York, NY 10154. |
| (2) | Biomet, Inc. shares shown as beneficially owned by The Goldman Sachs Group, Inc. reflect an aggregate of the following record ownership: (i) 433,679.15808 membership units of Holding held by GS Capital Partners VI Fund, L.P., (ii) 15,413.18755 membership units of Holding held by GS Capital Partners VI GmbH & Co. KG, (iii) 360,718.75833 membership units of Holding held by GS Capital Partners VI Offshore Fund, L.P., (iv) 119,253.84819 membership units of Holding held by GS Capital Partners VI Parallel, L.P., (v) 61,875.99000 membership units of Holding held by GS LVB Co-Invest, L.P., (vi) 63,137.95000 membership units of Holding held by Goldman Sachs BMET Investors, L.P., (vii) 184,785.45000 membership units of Holding held by Goldman Sachs BMET Investors Offshore Holdings, L.P., (viii) 44,463.81600 membership units of Holding held by GS PEP Bass Holdings, L.L.C., (ix) 6,309.80000 membership units of Holding held by Goldman Sachs Private Equity Partners, 2004-Direct Investment Fund, L.P., (x) 9,013.20000 membership units of Holding held by Goldman Sachs Private Equity Partners, 2005-Direct Investment Fund, L.P., and (xi) 9,768.00000 membership units of Holding held by Goldman Sachs Private Equity Partners IX-Direct Investment Fund, L.P. The address of The Goldman Sachs Group, Inc. is c/o Goldman, Sachs & Co., 200 West Street, New York, NY 10282. |
| (3) | The address of KKR Biomet, LLC is c/o Kohlberg Kravis Roberts & Co. L.P., 2800 Sand Hill Road, Suite 200, Menlo Park, CA 94025. |
| (4) | Biomet, Inc. shares shown as beneficially owned by TPG Capital reflect an aggregate of the following record ownership: (i) 50,000.00000 membership units owned by TPG Partners IV, L.P., (ii) 1,015,020.30532 membership units owned by TPG Partners V, L.P., (iii) 2,655.60483 membership units owned by TPG FOF V-A, L.P., (iv) 2,141.61680 membership units owned by TPG FOF V-B, L.P., |
150
Table of Contents
| (v) 235,843.63020 membership units owned by TPG LVB Co-Invest LLC, (vi) 2,758.00100 membership units owned by TPG LVB Co-Invest II LLC. The address of TPG Capital is 345 California Street, Suite 3300, San Francisco, CA 94104. |
| (5) | Includes all shares held by TPG Partners IV, L.P., TPG Partners V, L.P., TPG FOF V-A, L.P., TPG FOF V-B, L.P., TPG LVB Co-Invest LLC, and TPG LVB Co-Invest II LLC. Each of Jonathan J. Coslet and Todd Sisitsky may be deemed to be a beneficial owner of these interests due to his status as a partner of TPG Capital, and each such person disclaims beneficial ownership of any such interests in which he does not have a pecuniary interest. The address of each of Mr. Coslet and Mr. Sisitsky is c/o TPG Capital is 345 California Street, Suite 3300, San Francisco, CA 94104. |
| (6) | Includes all shares held by Blackstone Capital Partners V, L.P., Blackstone Capital Partners V-AC L.P., BCP V-S L.P., Blackstone Family Investment Partnership V L.P., Blackstone Family Investment Partnership V-A L.P., Blackstone Participation Partnership V L.P., and BCP V Co-Investors L.P. Each of Michael Dal Bello, principle, and David McVeigh, executive director, may be deemed to be a beneficial owner of these interests due to his status with The Blackstone Group, and each such person disclaims beneficial ownership of any such interests in which he does not have a pecuniary interest. The address of each of Mr. Dal Bello and Mr. Mc Veigh is c/o The Blackstone Group is 345 Park Avenue, New York, NY 10154. |
| (7) | Includes all shares held by GS Capital Partners VI Fund, L.P., GS Capital Partners VI GmbH & Co. KG, GS Capital Partners VI Offshore Fund, L.P., GS Capital Partners VI Parallel, L.P., GS LVB Co-Invest, L.P., Goldman Sachs BMET Investors, L.P., Goldman Sachs BMET Investors Offshore Holdings, L.P., GS PEP Bass Holdings, L.L.C., Goldman Sachs Private Equity Partners, 2004-Direct Investment Fund, L.P., Goldman Sachs Private Equity Partners, 2005-Direct Investment Fund, L.P., and Goldman Sachs Private Equity Partners IX-Direct Investment Fund, L.P. Each of Adrian Jones, managing director, and Andrew Y. Rhee, Vice President, may be deemed to be a beneficial owner of these interests due to his status with Goldman, Sachs & Co., and each such person disclaims beneficial ownership of any such interests in which he does not have a pecuniary interest. The address of Mr. Jones and Mr. Rhee is c/o Goldman, Sachs & Co., 200 West Street, New York, NY 10282. |
| (8) | Includes all shares held by KKR Biomet, LLC. Each of Michael Michelson and Max C. Lin may be deemed to be a beneficial owner of these interests due to his status with Kohlberg Kravis Roberts & Co. L.P., and each such person disclaims beneficial ownership of any such interests in which he does not have a pecuniary interest. The address of each of Mr. Michelson and Mr. Lin is c/o Kohlberg Kravis Roberts & Co. L.P., 2800 Sand Hill Road, Suite 200, Menlo Park, CA 94025. |
| (9) | The business address of Dane A. Miller, Ph.D. is 700 Park Avenue, Suite G, Winona Lake, IN 46590. |
| Item | 13. Certain Relationships and Related Transactions, and Director Independence. |
A description of our Company’s transactions with related persons is included in Note 17 to the consolidated financial statements.
Pursuant to our Code of Business Conduct and Ethics, all employees and directors (including our named executives) are required to avoid any personal or business influences or relationships that affect their ability to act in the best interests of the Company. If any matter exists that might be or creates the appearance of being a conflict of interest, the matter is required to be referred to our Compliance Department for interpretation and resolution. Additionally, the LLC Agreement requires that affiliated party transactions involving the Sponsors to be approved by a super-majority of Sponsors not involved in the affiliated party transaction.
Other than as described under this heading, we have not adopted any formal policies or procedure for the review, approval or ratification of certain related-party transactions that may be required to be reported under the SEC’s disclosure rules. Such transactions, if and when they are proposed or have occurred, have traditionally been (and will continue to be) reviewed by one or more of the Board of Directors, the Audit Committee or the Compensation Committee (other than the directors or committee members involved, if any) on a case-by-case basis.
151
Table of Contents
| Item | 14. Principal Accountant Fees and Services. |
Fees for professional services provided by Biomet’s independent accountants in each of the last two fiscal years, in each of the following categories are:
| (in millions) | For the Year Ended May 31, 2011 |
For the Year Ended May 31, 2010 |
||||||
| Audit fees |
$ | 2.4 | $ | 2.1 | ||||
| Audit-related fees |
0.5 | 0.1 | ||||||
| Tax fees |
1.4 | 2.1 | ||||||
|
|
|
|
|
|||||
| Total |
$ | 4.3 | $ | 4.3 | ||||
|
|
|
|
|
|||||
Fees for audit services above include those from Deloitte & Touche LLP (audit and consulting related). Fees for audit services include fees associated with the annual audit of consolidated financial statements, the reviews of the Company’s quarterly reports on Form 10-Q and SEC registration statements, audit-related accounting consultations, audit-related acquisition accounting and statutory audits required internationally. Audit-related fees principally included work related to due diligence in connection with acquisitions and assistance with implementation of various rules and standards. Tax fees included tax compliance, tax advice and tax planning. The Audit Committee has adopted policies and procedures for approving in advance all audit and permitted non-audit services to be performed for the Company by its independent accountants, subject to certain de minimis exceptions approved by the Audit Committee. Prior to the engagement of the independent accountants for the next year’s audit, management, with the participation of the independent accountants, submits to the Audit Committee for approval an aggregate request for services expected to be rendered during that year for various categories of services.
152
Table of Contents
| Item 15. | Exhibits, Financial Statement Schedules. |
(a) The following financial statements and financial statement schedules are included in Item 8 herein.
| (1) Consolidated Financial Statements: |
| Report of Independent Registered Public Accounting Firm |
| Consolidated Balance Sheets as of May 31, 2011 and 2010 |
| Consolidated Statements of Operations for the years ended May 31, 2011, 2010 and 2009 |
| Consolidated Statements of Shareholder’s Equity for the years ended May 31, 2011, 2010 and 2009 |
| Consolidated Statements of Cash Flows for the years ended May 31, 2011, 2010 and 2009 |
| Notes to Consolidated Financial Statements |
| (2) Financial Statement Schedules: |
| Schedule II—Valuation and Qualifying Accounts |
| Quarterly Results (Unaudited) |
| (3) Exhibits: |
| Refer to the Index to Exhibits immediately following the signature page of this report, which is incorporated herein by reference. |
153
Table of Contents
Pursuant to the requirements of Section 13 or 15(d) of the Securities Exchange Act of 1934, Biomet, Inc. has duly caused this report to be signed on its behalf by the undersigned, thereunto duly authorized on August 12, 2011.
| BIOMET, INC. | ||
| By: | /S/ JEFFREY R. BINDER | |
| Jeffrey R. Binder | ||
| President and Chief Executive Officer | ||
Pursuant to the requirements of the Securities Exchange Act of 1934, this report has been signed below by the following persons on behalf of Biomet, Inc. and in the capacities indicated on August 12, 2011.
| By: | /S/ JONATHAN J. COSLET | |
| Jonathan J. Coslet, Director | ||
| By: | /S/ MICHAEL DAL BELLO | |
| Michael Dal Bello, Director | ||
| By: | /S/ JEFFREY R. BINDER | |
| Jeffrey R. Binder, President and Chief Executive Officer and Director (Principal Executive Officer) | ||
| By: | /S/ ADRIAN JONES | |
| Adrian Jones, Director | ||
| By: | /S/ MAX C. LIN | |
| Max C. Lin, Director | ||
| By: | /S/ DAVID MCVEIGH | |
| David McVeigh, Director | ||
| By: | /S/ MICHAEL MICHELSON | |
| Michael Michelson, Director | ||
| By: | /S/ DANE A. MILLER | |
| Dane A. Miller, Director | ||
| By: | /S/ ANDREW Y. RHEE | |
| Andrew Y. Rhee, Director | ||
| By: | /S/ TODD SISITSKY | |
| Todd Sisitsky, Director | ||
| By: | /S/ DANIEL P. FLORIN | |
| Daniel P. Florin, Senior Vice President and Chief Financial Officer (Principal Financial Officer) | ||
| By: | /S/ KEVIN J. SIERKS | |
| Kevin J. Sierks, Vice President—Controller (Principal Accounting Officer) | ||
154
Table of Contents
EXHIBIT INDEX
| Exhibit No. |
Exhibit | |
| 2.1 | Agreement and Plan of Merger, dated as of December 18, 2006, amended and restated as of June 7, 2007, among Biomet, Inc., LVB Acquisition, LLC and LVB Acquisition Merger Sub, Inc., incorporated herein by reference to the Company’s Current Report on Form 8-K filed on June 7, 2007. | |
| 3.1 | Amended and Restated Articles of Incorporation, incorporated herein by reference to Exhibit 3.1 to the Company’s Current Report on Form 8-K filed on September 25, 2007. | |
| 3.2 | Amended and Restated Bylaws, incorporated herein by reference to Exhibit 3.2 to the Company’s Current Report on Form 8-K filed on September 25, 2007. | |
| 4.1 | Senior Notes Indenture, dated as of September 25, 2007, among LVB Acquisition Merger Sub, Inc., Biomet, Inc., the Guarantors listed therein and Wells Fargo Bank, National Association, as Trustee, filed as Exhibit 4.1 to the Company’s Registration Statement on Form S-4 dated May 6, 2008 and incorporated herein by reference. | |
| 4.1.1 | First Supplemental Senior Notes Indenture, dated as of October 16, 2007, among Biomet, Inc., the Guarantors listed therein and Wells Fargo Bank, National Association, as Trustee, filed as Exhibit 4.2 to the Company’s Registration Statement on Form S-4 dated May 6, 2008 and incorporated herein by reference. | |
| 4.1.2 | Form of 10% Senior Notes due 2017, filed as Exhibit 4.1 to the Company’s Registration Statement on Form S-4 dated May 6, 2008 and incorporated herein by reference. | |
| 4.1.3 | Form of 10 3/8% / 11 1/8% Senior Toggle Notes due 2017, filed as Exhibit 4.1 to the Company’s Registration Statement on Form S-4 dated May 6, 2008 and incorporated herein by reference. | |
| 4.2 | Senior Subordinated Notes Indenture, dated as of September 25, 2007, among LVB Acquisition Merger Sub, Inc., Biomet, Inc., the Guarantors listed therein and Wells Fargo Bank, National Association, as Trustee, filed as Exhibit 4.3 to the Company’s Registration Statement on Form S-4 dated May 6, 2008 and incorporated herein by reference. | |
| 4.2.1 | First Supplemental Senior Subordinated Notes Indenture, dated as of October 16, 2007, among Biomet, Inc., the Guarantors listed therein and Wells Fargo Bank, National Association, as Trustee, filed as Exhibit 4.4 to the Company’s Registration Statement on Form S-4 dated May 6, 2008 and incorporated herein by reference. | |
| 4.2.2 | Form of 11 5/8% Senior Subordinated Notes due 2017, filed as Exhibit 4.3 to the Company’s Registration Statement on Form S-4 dated May 6, 2008 and incorporated herein by reference. | |
| 4.3 | Registration Rights Agreement, dated as of September 25, 2007, among LVB Acquisition Merger Sub, Inc., Biomet, Inc., the Guarantors listed therein, and Banc of America Securities LLC, Goldman, Sachs & Co., Lehman Brothers Inc., Merrill Lynch, Pierce, Fenner & Smith Incorporated, Wachovia Capital Markets, LLC and Bear, Stearns & Co. Inc., filed as Exhibit 4.8 to the Company’s Registration Statement on Form S-4 dated May 6, 2008 and incorporated herein by reference. | |
| 4.4 | Registration Rights Agreement, dated as of October 16, 2007, among Biomet, Inc., the Guarantors listed therein, and Banc of America Securities LLC, Goldman, Sachs & Co., Lehman Brothers Inc., Merrill Lynch, Pierce, Fenner & Smith Incorporated, Wachovia Capital Markets, LLC and Bear, Stearns & Co. Inc., filed as Exhibit 4.9 to the Company’s Registration Statement on Form S-4 dated May 6, 2008 and incorporated herein by reference. | |
155
Table of Contents
| Exhibit No. |
Exhibit | |
| 10.1 | Credit Agreement, dated as of September 25, 2007, among Biomet, Inc., LVB Acquisition, Inc., Bank of America, N.A. and the Other Lenders party thereto, filed as Exhibit 10.1 to the Company’s Registration Statement on Form S-4 dated May 6, 2008 and incorporated herein by reference. | |
| 10.1.1 | Guaranty (Cash Flow), dated as of September 25, 2007, among LVB Acquisition, Inc., Certain Subsidiaries of Biomet, Inc. identified therein, and Bank of America, N.A., filed as Exhibit 10.2 to the Company’s Registration Statement on Form S-4 dated May 6, 2008 and incorporated herein by reference. | |
| 10.1.2 | Pledge and Security Agreement (Cash Flow), dated as of September 25, 2007, among Biomet, Inc., LVB Acquisition, Inc., Certain Subsidiaries of Biomet, Inc. identified therein, and Bank of America, N.A., filed as Exhibit 10.3 to the Company’s Registration Statement on Form S-4 dated May 6, 2008 and incorporated herein by reference. | |
| 10.1.3 | Intercreditor Agreement, dated as of September 25, 2007, by and among Bank of America, N.A., as ABL Collateral Agent, and Bank of America, N.A., as CF Collateral Agent, filed as Exhibit 10.4 to the Company’s Registration Statement on Form S-4 dated May 6, 2008 and incorporated herein by reference. | |
| 10.1.4 | Patent Security Agreement, dated as of September 25, 2007, among LVB Acquisition, Inc., Biomet, Inc., Certain Subsidiaries of Biomet, Inc. and Bank of America, N.A., filed as Exhibit 10.5 to the Company’s Registration Statement on Form S-4 dated May 6, 2008 and incorporated herein by reference. | |
| 10.1.5 | Trademark Security Agreement, dated as of September 25, 2007, among LVB Acquisition, Inc., Biomet, Inc., Certain Subsidiaries of Biomet, Inc. and Bank of America, N.A., filed as Exhibit 10.6 to the Company’s Registration Statement on Form S-4 dated May 6, 2008 and incorporated herein by reference. | |
| 10.2 | Credit Agreement, dated as of September 25, 2007, among Biomet, Inc., the Several Subsidiary Borrowers Party thereto, LVB Acquisition, Inc., Bank of America, N.A. and the Other Lenders Party thereto, filed as Exhibit 10.7 to the Company’s Registration Statement on Form S-4 dated May 6, 2008 and incorporated herein by reference. | |
| 10.2.1 | Guaranty (ABL), dated as of September 25, 2007 between LVB Acquisition, Inc. and Bank of America, N.A., filed as Exhibit 10.1 to the Company’s Registration Statement on Form S-4 dated May 6, 2008 and incorporated herein by reference. | |
| 10.2.2 | Pledge and Security Agreement (ABL), dated as of September 25, 2007 among Biomet, Inc., LVB Acquisition, Inc., Certain Subsidiaries of Biomet, Inc. identified therein and Bank of America, N.A., filed as Exhibit 10.9 to the Company’s Registration Statement on Form S-4 dated May 6, 2008 and incorporated herein by reference. | |
| 10.3 | Corporate Integrity Agreement, dated as of September 27, 2007, by and between the Office of Inspector General of the Department of Health and Human Services and Biomet, Inc., filed as Exhibit 10.24 to the Company’s Registration Statement on Form S-4 dated May 6, 2008 and incorporated herein by reference. | |
| 10.3.1 | Settlement Agreement, dated as of September 27, 2007, by and between Biomet, Inc. and the Office of Inspector General of the Department of Health and Human Services, filed as Exhibit 10.25 to the Company’s Registration Statement on Form S-4 dated May 6, 2008 and incorporated herein by reference. | |
156
Table of Contents
| Exhibit No. |
Exhibit | |
| 10.4† | Biomet, Inc. Deferred Compensation Plan (Post-409A Plan), effective January 1, 2005, filed as Exhibit 10.2 to the Company’s Quarterly Report on Form 10-Q filed on January 14, 2009 and incorporated herein by reference. | |
| 10.5†* | LVB Acquisition Management Stockholders’ Agreement for Senior Executives, dated as of September 13, 2007, by and among LVB Acquisition, Inc. and the stockholders party thereto. | |
| 10.5.1†* | LVB Acquisition Management Stockholders’ Agreement, dated as of November 6, 2007, by and among LVB Acquisition, Inc. and the stockholders party thereto. | |
| 10.6 | Governance Acknowledgement, dated as of September 25, 2007, by and between LVB Acquisition Holding, LLC, LVB Acquisition, Inc. and Biomet, Inc, filed as Exhibit 10.6 in the Company’s Annual Report on Form 10-K filed on August 25, 2010 and incorporated herein by reference. | |
| 10.7 | Amended and Restated Registration Rights Agreement, dated as of September 27, 2007, by and among LVB Acquisition Holding, LLC, LVB Acquisition, Inc., Biomet, Inc. and the stockholders party thereto, filed as Exhibit 10.7 in the Company’s Annual Report on Form 10-K filed on August 25, 2010 and incorporated herein by reference. | |
| 10.8† | LVB Acquisition, Inc. 2007 Management Equity Incentive Plan, adopted November 16, 2007, filed as Exhibit 10.21 to the Company’s Registration Statement on Form S-4 dated May 6, 2008 and incorporated herein by reference. | |
| 10.8.1† | LVB Acquisition, Inc 2007 Management Equity Incentive Plan Amendment No. 1, adopted December 31, 2010, filed as Exhibit 10.1 to the Company’s Form 8-K on January 6, 2011 and incorporated herein by reference. | |
| 10.9† | Biomet, Inc. Executive Annual Cash Incentive Plan, effective June 1, 2008, filed as Exhibit 10.26 to the Company’s Annual Report on Form 10-K filed on August 28, 2008 and incorporated herein by reference. | |
| 10.10† | Employment Agreement, dated as of June 11, 2008, by and among Biomet, Inc. and Jeffrey R. Binder, filed as Exhibit 99.1 to the Company’s Current Report on Form 8-K filed on June 13, 2008 and incorporated herein by reference. | |
| 10.10.1† | First Amendment to Employment Agreement, dated as of December 31, 2008, by and between Biomet, Inc. and Jeffrey R. Binder, incorporated herein by reference to Exhibit 10.3 to the Company’s Quarterly Report on Form 10-Q filed on January 14, 2009. | |
| 10.11† | Employment Agreement, dated as of February 28, 2008, by and among Biomet, Inc. and Daniel P. Florin, filed as Exhibit 10.16 to the Company’s Annual Report on Form 10-K filed on August 28, 2008 and incorporated herein by reference. | |
| 10.11.1† | First Amendment to Employment Agreement, dated as of December 31, 2008, by and between Biomet, Inc. and Daniel P. Florin, filed as Exhibit 10.4 to the Company’s Quarterly Report on Form 10-Q on January 14, 2009 and incorporated herein by reference. | |
| 10.14† | Employment Agreement, dated as of March 3, 2008, by and between Biomet, Inc. and Jon Serbousek, filed as Exhibit 10.32 to the Company’s Annual Report on Form 10-K filed on August 21, 2009 and incorporated herein by reference. | |
157
Table of Contents
| Exhibit No. |
Exhibit | |
| 10.14.1† | First Amendment to Employment Agreement, dated as of December 31, 2008, by and between Biomet, Inc. and Jon Serbousek, filed as Exhibit 10.33 to the Company’s Annual Report on Form 10-K filed on August 21, 2009 and incorporated herein by reference. | |
| 10.15† | Employment Agreement, dated as of August 1, 2009, by and between Biomet, Inc. and Maggie Anderson, filed as Exhibit 10.15 in the Company’s Annual Report on Form 10-K filed on August 25, 2010 and incorporated herein by reference. | |
| 10.16 † | Consulting Agreement dated as of January 14, 2010 between Company and Dane A. Miller, Ph. D., filed as Exhibit 10.2 to the Company’s Quarterly Report on Form 10-Q filed on January 14, 2010 and incorporated herein by reference. | |
| 10.17 |
Indemnification Priority Agreement, dated as of January 11, 2010, among the Company, LVB Acquisition, Inc., The Blackstone Group, L.P., The Goldman Sachs Group, Inc., Kohlberg Kravis Roberts & Co., L.P. and TPG Capital, L.P. filed as Exhibit 10.1 to the Company’s Quarterly Report on Form 10-Q filed on January 14, 2010 and incorporated herein by reference. | |
| 10.18†* |
Employment Agreement, dated August 30, 2010, by and between Biomet, Inc. and Renaat Vermeulen. | |
| 10.19†* |
Employment Agreement, dated March 1, 2007, by and between Biomet Europe B.V. and Renaat Vermeulen. | |
| 10.19.1†* |
Employment Agreement Amendment, dated October 18, 2010, by and between Biomet Europe B.V. and Renaat Vermeulen. | |
| 10.20† |
LVB Acquisition, Inc. Restricted Stock Unit Plan, filed as Exhibit 10.1 to the Company’s Form 8-K filed on February 15, 2011 and incorporated herein by reference. | |
| 10.20.1† | LVB Acquisition, Inc. Form Restricted Stock Unit Grant Agreement, filed as Exhibit 10.2 to the Company’s Form 8-K filed on February 15, 2011 and incorporated herein by reference. | |
| 12* | Computation of Ratio of Earnings to Fixed Charges. | |
| 14 | Code of Business Conduct and Ethics, as amended on May 6, 2009, filed as Exhibit 14.1 to the Company’s Current Report on Form 8-K filed on May 12, 2009 and incorporated herein by reference. | |
| 21* | Subsidiaries of Biomet, Inc. | |
| 23.1* | Consent of Independent Registered Public Accounting Firm. | |
| 31.1* | Certification of Chief Executive Officer Pursuant to Section 302 of the Sarbanes-Oxley Act of 2002. | |
| 31.2* | Certification of Chief Financial Officer Pursuant to Section 302 of the Sarbanes-Oxley Act of 2002. | |
| 32.1* | Certifications Pursuant to 18 U.S.C. Section 1350, as Adopted Pursuant to Section 906 of the Sarbanes-Oxley Act of 2002. | |
| * | Filed herewith. |
| † | Management contract or compensatory plan or arrangement. |
158