Attached files
| file | filename |
|---|---|
| EX-21 - EXHIBIT 21 - ANAREN INC | ex21.htm |
| EX-32.1 - EXHIBIT 32.1 - ANAREN INC | ex32-1.htm |
| EX-31.1 - EXHIBIT 31.1 - ANAREN INC | ex31-1.htm |
| EX-31.2 - EXHIBIT 31.2 - ANAREN INC | ex31-2.htm |
| EX-23.1 - EXHIBIT 23.1 - ANAREN INC | ex23-1.htm |
| EX-32.2 - EXHIBIT 32.2 - ANAREN INC | ex32-2.htm |
UNITED STATES
SECURITIES AND EXCHANGE COMMISSION
WASHINGTON, D.C. 20549
FORM 10-K
(Mark One)
|
x
|
ANNUAL REPORT PURSUANT TO SECTION 13 OR 15(d) OF THE SECURITIES EXCHANGE ACT OF 1934
|
For the fiscal year ended June 30, 2011
OR
|
o
|
TRANSITION REPORT PURSUANT TO SECTION 13 OR 15(d) OF THE SECURITIES EXCHANGE ACT OF 1934
|
For the transition period from ____________________ to ____________________
Commission File Number 0-6620
|
New York
|
16-0928561
|
|
|
(State or other jurisdiction of
incorporation or organization)
|
(I.R.S. Employer
Identification No.)
|
|
|
|
|
|
|
|
6635 Kirkville Road, East Syracuse, New York 13057
|
|
(Address of principal executive offices) (Zip Code)
|
|
Registrant's telephone number, including area code(315) 432-8909
|
Securities registered pursuant to Section 12(b) of the Act:
|
Title of each class
Common Stock, $0.01 par value
|
Name of each exchange on which registered
The NASDAQ Stock Market LLC
(NASDAQ Global Market)
|
Securities registered pursuant to Section 12(g) of the Act:
|
None
|
Indicate by check mark if the registrant is a well-known seasoned issuer, as defined in Rule 405 of the Securities Act. oYes xNo
Indicate by check mark if the registrant is not required to file reports pursuant to Section 13 or Section 15(d) of the Act. oYes xNo
Indicate by check mark whether the registrant (1) has filed all reports required to be filed by Section 13 or15(d) of the Securities Exchange Act of 1934 during the preceding 12 months (or for such shorter period that the registrant was required to file such reports), and (2) has been subject to such filing requirements for the past 90 days. xYes oNo
1
Indicate by check mark whether the registrant has submitted electronically and posted on its corporate Website, if any, every Interactive Data File required to be submitted and posted pursuant to Rule 405 of Regulation S-T (§ 232.405 of this chapter) during the preceding 12 months (or for such shorter period that the registrant was required to submit and post such files).
xYes oNo
Indicate by check mark if disclosure of delinquent filers pursuant to Item 405 of Regulation S-K (§ 229,405 of this chapter) is not contained herein, and will not be contained, to the best of registrant's knowledge, in definitive proxy or information statements incorporated by reference in Part III of this Form 10-K or any amendment to this Form 10-K.
Indicate by check mark whether the registrant is a large accelerated filer, an accelerated filer, a non-accelerated filer, or a smaller reporting company. See the definitions of “large accelerated filer,” “accelerated filer,” and “smaller reporting company” in Rule12b-2 of the Exchange Act. (Check One):
|
Large accelerated filer o
|
Accelerated filer x
|
| Non-accelerated filer o (Do not checkif a smaller reporting company) | Smaller reporting company o |
Indicate by check mark whether the registrant is a shell company (as defined in Rule 12b-2 of the Act). oYes xNo
The aggregate market value of the registrant’s common stock held by non-affiliates of the registrant, based on the closing sale price of the common stock on December 31, 2010, as reported on the NASDAQ Global Market, was approximately $287,116,760.
The number of shares of the registrant’s common stock, par value $0.01 per share, outstanding on August 8, 2011 was 15,010,463 shares.
DOCUMENTS INCORPORATED BY REFERENCE
Portions of the registrant’s definitive Proxy Statement to be filed with the Securities and Exchange Commission in connection with its 2011 Annual Meeting of Shareholders are incorporated by reference into Part III of this Annual Report on Form 10-K.
2
|
PART I
|
||
|
Item 1.
|
Business
|
|
|
Item 1A.
|
Risk Factors
|
|
|
Item 1B.
|
Unresolved Staff Comments
|
|
|
Item 2.
|
Properties
|
|
|
Item 3.
|
Legal Proceedings
|
|
|
Item 4.
|
Removed and Reserved
|
|
|
PART II
|
||
|
Item 5.
|
Market for Registrant’s Common Equity, Related Stockholder Matters and Issuer Purchases of Equity Securities
|
|
|
Item 6.
|
Selected Financial Data
|
|
|
Item 7.
|
Management’s Discussion and Analysis of Financial Condition and Results of Operations
|
|
|
Item 7A.
|
Quantitative and Qualitative Disclosures About Market Risk
|
|
|
Item 8.
|
Financial Statements and Supplementary Data
|
|
|
Item 9.
|
Changes in and Disagreements with Accountants on Accounting and Financial Disclosure
|
|
|
Item 9A.
|
Controls and Procedures
|
|
|
Item 9B.
|
Other Information
|
|
|
PART III
|
||
|
Item 10.
|
Directors, Executive Officers and Corporate Governance
|
|
|
Item 11.
|
Executive Compensation
|
|
|
Item 12.
|
Security Ownership of Certain Beneficial Owners and Management and Related Stockholder Matters
|
|
|
Item 13.
|
Certain Relationships and Related Transactions, and Director Independence
|
|
|
Item 14.
|
Principal Accountant Fees and Services
|
|
|
PART IV
|
||
|
Item 15.
|
Exhibits, Financial Statement Schedules
|
3
PART I
Item 1. Business
Company Overview
Unless the context otherwise requires, all references in this Annual Report on Form 10-K to the “Company”, “Anaren”, “we”, “our” and “us” refers to Anaren, Inc., a New York corporation, incorporated in 1967, and its consolidated subsidiaries. Our executive offices are located at 6635 Kirkville Road, East Syracuse, New York 13057. Our telephone number is (315) 432-8909.
Anaren is a leading provider of microelectronics, and microwave components and assemblies for the wireless and space and defense electronics markets. Our distinctive engineering, manufacturing and packaging techniques enable us to cost-effectively produce compact, lightweight microwave products for use in wireless communication and space and defense systems covering a broad range of frequencies (from 100 MHz to more than 30 GHz) and power levels (small signal to more than 500 watts).
Using our focused research and development efforts, we design components and subsystems for wireless communication systems including wireless infrastructure, wireless consumer and medical applications, as well as advanced radar, beam-forming, jamming, motion control and receiver applications for the space and defense markets.
We conduct our business in two business segments: The Wireless Group and The Space & Defense Group.
The financial statements included in this Annual Report provide additional information relating to these segments for each of the Company's last three fiscal years. See “Note (15) Segment and Related Information" and “Management's Discussion and Analysis of Financial Condition and Results of Operations” for financial information about our operating segments, including net sales outside the United States.
Our common stock is listed on The NASDAQ Global Market under the symbol “ANEN.”
Distribution of Company Information
We maintain a website at www.anaren.com. We make available, free of charge on our website, our Annual Reports on Form 10-K, Quarterly Reports on Form 10-Q, current reports on Form 8-K, our proxy statement and amendments to those reports or statements filed or furnished pursuant to Section 13(a) or 15(d) of the Securities Exchange Act of 1934, as amended, as soon as reasonably practicable after we electronically file those reports with, or furnish them to, the Securities and Exchange Commission, or the SEC. The SEC’s website, www.sec.gov, contains reports, proxy and information statements and other information regarding issuers that file electronically with the SEC. The content on any website referred to in this Form 10-K is not incorporated by reference into this Annual Report on Form 10-K unless specifically noted.
4
Wireless Group
Industry Overview
The Company’s wireless products are used primarily in communication systems, either in user equipment, such as wireless local area network (WLAN), cellular handsets and Bluetooth devices, or satellite television reception applications, or on the network infrastructure side such as cellular telephone base stations or television broadcast equipment applications.
A typical wireless communications network is comprised of a geographic region containing a number of cells, each of which contains one or more base stations, which are linked in a network to form a service provider's coverage area. Each base station is comprised of the equipment that receives and transmits telephone calls and data traffic to the wireless users within the cell. A base station can process a fixed number of radio channels through the use of multiple transceivers, power amplifiers, filters, and combiners - along with one or more antennas to transmit and receive signals to and from the wireless user.
GSM has been the predominant second generation (2G) wireless network. Third generation networks (3G) were introduced with higher data rates to support greater mobile applications under standards such as UMTS or WCDMA. Enhanced 3G networks have been implemented under umbrellas such as LTE (Long-Term Evolution) which include GSM/EDGE. Presently, there is a move to Advanced LTE which will provide data rates close to the minimum requirements for the true fourth-generation (4G) standard, and are often marketed as such. In the years to come, it is expected that needs for higher data rates and greater bandwidth will continue to put pressure on wireless networks and drive the need for new equipment.
Strategy
The Company's strategy for the Wireless Group is to continue to use its microwave expertise, proprietary technologies, extensive microwave design libraries and low cost manufacturing capabilities to further expand its penetration in the wireless industry. Key components of the Company's strategy include the following:
Pursue Large Addressable Markets. The Company has successfully penetrated the mobile wireless infrastructure market and is using its market position to pursue other wireless industrial markets such as wireless data transmission, mobile handsets, Bluetooth, satellite television, low power wireless, medical and other consumer electronics markets. This is enabled by advances made in the Company’s design and manufacturing of sub miniature Multi-Layer Stripline components.
Focus on value added products. The Company continues to expand its component offerings to enable the Company to increase the number of products addressing each wireless application. In addition, with its Multi-Layer Stripline, and thick film ceramic manufacturing technologies, the Company will continue to increase the functionality of its products, thereby enabling its wireless customers to reduce the size and cost of their platforms.
Strengthen and Expand Customer Relationships. Today, a limited number of large original equipment manufacturers (OEMs) drive the wireless market. The Company has developed, and plans to continue to expand, customer relationships with many of these manufacturers including Ericsson, Huawei, Nokia Siemens Networks, ZTE and Samsung. The Company intends to further strengthen its customer relationships by offering complete outsourcing solutions, from research and development to product design and production, thereby increasing the customers' reliance on the Company.
Pursue Price Leadership Position. The Company aspires to use its technological leadership, low cost manufacturing, and sourcing capabilities to be one of the lowest cost provider of components and higher level assemblies for the wireless markets.
Pursue Strategic Acquisitions. The Company intends to continue to pursue opportunistic acquisitions of companies, product lines and technologies. The Company will focus on acquisitions that compliment its technical expertise and business development resources and provide a competitive advantage for its targeted markets.
Products and Technologies
The Company provides components and assemblies to leading OEMs in the wireless industry. These products range from standard sub-miniature components for consumer electronics to custom assemblies for high power wireless infrastructure applications. Over the last three years, the Company has focused its research and development investments on its standard component product lines and those products now make up more than 80% of the Wireless Group net sales.
5
The Company has developed its product offerings to enable its customers to reduce the size and cost, while enhancing the performance of their equipment. The Company continually invests capital and human resources to enhance existing products and develop new products to address current and future market demands. The Company has developed and continues to market a full line of standard products as well as limited custom products to wireless OEMs. A brief description of the Company's major product categories is as follows:
Passive Surface Mount Components. The Company's Xinger® line of products consists of off-the-shelf surface mount microwave components which provide passive microwave signal distribution functions. These products were developed to provide a low-cost high performance signal distribution component, which could be placed on standard printed circuit boards with automated production equipment. The primary applications of these products are in equipment for cellular base stations and in WLAN, Bluetooth, and satellite television.
In cellular base stations, the Company’s Xinger® surface mount products are utilized in radio frequency (RF) power amplifiers, and are also found in low-noise amplifiers and radios. Based on its research, the Company believes it is currently the market leader in this product area, supplying industry leading OEMs and leading power amplifier manufacturers. The Company continues to invest in the expansion of this product line as well as its addressable market. The Company’s surface mount product line offers significantly improved RF performance and power handling in a package that supports the latest global environmentally friendly initiatives.
The Company also has several products specifically designed to address WLAN, cellular telephone handsets and Bluetooth applications. These innovative products are 1/100th the size of our typical Xinger® type of products and offer performance and cost advantages over traditional consumer electronic components.
Resistive Products. The Company's resistive product line includes resistors, power terminations, and attenuators for use in high power wireless, industrial, and medical applications. These products range from very small components for implantable medical devices to high power products used in power amplifiers. The Company’s resistive products are frequently used in conjunction with our Xinger® surface mount components.
Custom Assembled Products. In addition to the large array of standard component product offerings, the Company has traditionally developed a portfolio of custom splitting and combining products for distribution of signals in wireless base station applications. They have included splitting of signals from the receive antennas to the radios, combining of amplifiers prior to the transmit antennas, and splitting/combining of signals internal to power amplifiers. These assemblies include RF backplanes which incorporate direct current power and digital signal distribution, ferrite based power combiners, low-power radio receive splitter assemblies, and custom ferrite components. The Company’s strategy is to continue to support legacy products and customer platforms as needed, but generally not pursue new opportunities. This is due in large part to the trend towards smaller base stations with limited splitting/combining requirements, and the fact that these products generally do not meet the Company’s gross margin targets. In fiscal year 2011, custom assembled products represented less than 3.2% of the Wireless Group revenue.
Customers
The Company believes that the strength of its customer support and depth of its customer relationships provide the Company a competitive advantage. To this end, the Company endeavors to become an integral part of its key customers’ operations by working closely with them through the entire development and production process. The Company assigns a dedicated multi-disciplined team including project engineering, design engineering and customer service to each customer to ensure a high level of responsiveness and customer service. This team assists the customer from the conceptual design stages through the development and manufacturing process. By maintaining close contact with the customers' design engineering, manufacturing, purchasing and project management personnel, the Company can better understand their needs, rapidly develop customer-specific solutions, and more effectively design the Company's solutions into the customers' systems and networks.
The Company sells its standard line of Xinger® components, custom products and resistive components to leading OEMs in the wireless industry and to a broad range of other wireless equipment contract manufacturers in the industry. In general, customers have purchased the Company’s products directly from the Company or through distributors or sales representatives. During the fiscal year ended June 30, 2011, the Wireless Group accounted for approximately 37% of the Company’s total revenues. There were no Wireless Group customers that accounted for more than 10% of the Company’s fiscal 2011 net sales. The following is a list of customers who generated $3 million or more in net sales for the Company in the fiscal year ended June 30, 2011:
|
● Avnet Electronics
|
● Motorola Solutions
|
|
● EG Components
|
● Nokia-Siemens Networks
|
|
● Huawei Technologies Co., Ltd.
|
● Richardson Electronics, Ltd.
|
6
Competition
The microwave component and assembly industry continues to be highly competitive. Direct competitors of the Company in the wireless market include Aeroflex, Smith Industries, SDP, and Soshin Electric Co. As a direct supplier to OEMs, the Company also faces significant competition from the in-house capabilities of its customers. However, the current trend in the wireless marketplace has been for the OEMs to outsource more of their design and production work.
The principal competitive factors in both the foreign and domestic markets are technical performance, reliability, ability to produce in volume, on-time delivery and most critically, price. It is anticipated that this pricing pressure will continue indefinitely. Based on these factors, the Company believes that it competes favorably within its markets in the wireless industry. The Company believes that it is particularly strong in the area of technical performance in the wireless marketplace. With its manufacturing capability in Suzhou, China, and innovative design techniques, the Company believes that it also competes favorably on price.
Backlog
The Company's backlog of orders for the Wireless Group was $15.2 million as of June 30, 2011, versus $10.5 million as of June 30, 2010, resulting primarily from stronger demand for the Company’s wireless infrastructure components. The backlog for the Wireless Group primarily represents firm orders for component products and signed purchase orders (i.e. orders for specific custom sub-assemblies) for custom components due to ship within eight to twelve weeks. The Company’s backlog as of June 30, 2011 is expected to be shipped within the current year. The Company does not believe that its wireless backlog as of any particular date is representative of actual sales for any succeeding period. Typically, large OEMs including Ericsson, Huawei, and Nokia-Siemens Networks, who use the Company's component and custom products, negotiate set prices for estimated annual volumes. The Company then receives a firm delivery commitment prior to shipment. The Company does not recognize backlog until it has received a firm order.
As part of the Company's close working relationships with major wireless communications customers, the customers expect the Company to respond quickly to changes in the volume and delivery schedule of their orders and, if necessary, to inventory products at its facilities for just-in-time delivery. Therefore, although contracts with these customers typically specify aggregate dollar volumes of products to be purchased over an extended time period, these contracts also provide for delivery flexibility, on short notice. In addition, these customers may cancel orders with some financial penalty or defer orders without significant penalty.
Space & Defense Group
Products and Technology
Our Space & Defense Group principally designs and manufactures advanced microwave-based hardware for use in advanced radar systems, advanced jamming systems, smart munitions, electronic surveillance systems and satellite and ground based communication systems.
Radar Countermeasure Subsystems. Defense radar countermeasure subsystems digitally measure, locate and counter enemy radar systems. Our Digital Radio Frequency Measurement (DRFM) devices are used for storing and retrieving RF signals as part of military aircraft self protection systems. Our Digital Frequency Discriminators (DFD) are employed in electronic warfare (EW) systems to detect and measure the RF signals emitted by enemy radar systems. We also manufacture a suite of electronic subassemblies designed to process radar signals detected by a receiver. This technology is a major component of Electronic Support Measure (ESM) systems used on helicopters and fixed winged aircraft to detect, locate, and identify enemy radar. This technology is called a Passive Ranging Subsystem.
Beamformers. Beamformers determine the number, size and quality of beams that are produced from an antenna array. The Company supplies passive and active beamformers and has a unique expertise in designing and manufacturing high performance beamformers in industry leading small size packages. Passive beamformers produce fixed beam locations while active beamformers allow for real-time reconfiguration of the beam pattern. Beamforming technology is implemented on military and commercial phased array communication systems and radar systems.
Switch Matrices. Switch matrices route RF signals from a single location to one or multiple end user locations. These products allow system operators to allocate capacity as required.
Radar Feed Networks. Radar feed networks distribute RF energy to the antenna elements of the radar. Radar Feed Networks are integrated into radar platforms for airborne, ship borne, ground base radars and missile guidance applications.
7
Analog Hybrid Modules. Analog Hybrid Modules are used in the electronic control and power supply systems for commercial and military aircraft, satellites, communication systems and sensor platforms. Analog components are used to accurately control the movement of flight surfaces on aircraft and missiles, steer antennas for communication systems and provide highly accurate regulated voltages for on board power systems. The product portfolio consists of motor controllers, amplifiers, and power supply components.
Mixed Signal Printed Circuit Boards. Mixed signal printed circuit boards are essential to the operation of all commercial and military aircraft, satellite systems, communication systems and sensor platforms. Mixed signal printed circuits route RF, analog, digital and power signals to mission critical components and systems.
Industry Overview
The US Department of Defense (DOD) and major US Defense OEMs are committed to ensuring a high state of military readiness. The DOD funding priorities focus on the safety and effectiveness of US troops, national defense, homeland security, and battlefield command and communication systems. Advanced radar systems, jamming systems, smart munitions, electronic surveillance and communication systems are important DOD capabilities. The Company’s products and technologies are well positioned to support these critical DOD systems.
Strategy
The Company's strategy for the Space & Defense Group is the continued use of its microwave expertise, proprietary design libraries, technologies, and manufacturing capabilities to continually expand its customer penetration. Key components of the Company's strategy include the following:
Strengthen and Expand Strategic Customer Relationships. Today, a limited number of large OEMs drive the Space & Defense Group’s business. The Company has developed, and plans to continue to expand customer relationships with many of these OEMs including, Raytheon, Lockheed Martin, Northrop Grumman, ITT, Harris, Rockwell, Thales, SRCTec, and Boeing. The Company intends to further strengthen its customer relationships by offering complete solutions, from research and development to product design and manufacturing.
Focus on value added products. The Company will continue to expand its product and technology offerings to increase the added value for next generation space and defense systems. The Company will continue leveraging investments in advanced microwave packaging technologies to meet the demands of our customers for increased levels of integration and functionality.
Pursue Strategic Acquisitions. The Company will continue to pursue opportunistic acquisitions of companies (similar to M. S. Kennedy Corp. (MSK) and Unicircuit, Inc. (Unicircuit) which were acquired in fiscal 2009), as well as product lines and technologies that provide synergistic opportunities for its Space & Defense Group. The Company will focus on acquisitions that compliment its technical expertise and business development resources and provide a competitive advantage for its targeted markets.
Customers
The Company currently sells passive components and electronic subsystems to prime contractors serving the United States and foreign governments. During the fiscal year ended June 30, 2011, the Space & Defense Group accounted for approximately 63% of the Company’s revenues. Lockheed Martin accounted for 14.6% and Raytheon Company accounted for 12.7% of the Company’s net sales. The following is a list of Space & Defense customers who generated $3 million or more in revenues in the fiscal year ended June 30, 2011:
|
● ITT Corporation
|
● Northrop Grumman Corporation
|
|
● Lockheed Martin Corporation
|
● Raytheon Company
|
|
● The Boeing Company
|
● Welking Electronics
|
Competition
As a direct supplier to large defense contractors, the Company faces significant competition from the in-house capabilities of its customers. In some cases, we are approached to supply a solution in parallel with an internal effort as a form of risk mitigation.
8
Direct competitors of the Company in the space and defense market include EMS Technologies, Cobham, Inc., Kratos, KOR Electronics, Smith Industries, TTM Technologies, Crane International Rectifier and Aeroflex.
Backlog
Order backlog for the Space & Defense Group was $90.6 million as of June 30, 2011, versus $89.6 million as of June 30, 2010 due to stronger customer demand. Approximately 75% of the Company’s backlog is expected to be shipped within the current fiscal year. All of the orders included in the Space & Defense Group backlog are covered by signed contracts or purchase orders. However, backlog is not necessarily indicative of future sales. Accordingly, the Company does not believe that its backlog as of any particular date is an indicator of actual sales for any succeeding period.
Government Contracts
The Company’s Space & Defense Group has contracts that are subject to termination at the election of the U.S. Government. However, in the event of termination, the Company would be entitled to a termination fee to recover certain costs incurred. No material contracts were subject to renegotiation of profits at the election of the U.S. government.
Company Operations
Sales and Marketing
The Company markets its products worldwide to OEMs and other industry participants in the wireless and space and defense markets primarily through a sales and marketing force of 45 people as of June 30, 2011. The Company has regional sales offices located in Sacramento, California; Waterlooville, England; and Suzhou and Shenzen, China. In addition, as of June 30, 2011, the Company had contracts with 4 major distributors, with 14 manufacturers' representatives in the United States and Canada, and with 9 international representatives located in Western Europe, the Middle East and Asia. As part of its marketing efforts, the Company advertises in major trade publications and attends major industry shows. The Company has invested significantly in its Internet website which contains an electronic version of its entire catalog. In addition, the website enables users to download important device parameter files. These files contain the performance information for catalog components in a format that is compatible with commonly used computer aided design/computer aided modeling, or CAD/CAM equipment. The Company also provides mechanical drawings and applications notes for proper use of the parts. This service allows designers to get the information they require and to easily incorporate the Company's parts into their designs.
After identifying key potential customers, the Company makes sales calls with its own sales, management and engineering personnel and with manufacturers' representatives. To promote widespread acceptance of the Company's products and provide customers with support for their technical and commercial needs, the Company’s sales and engineering teams work closely with the customers to develop solutions tailored for their particular requirements. The Company believes that its engineering team, comprised of 200 design and engineering professionals as of June 30, 2011, provides the Company with a key competitive advantage.
The Company uses distributors for its standard products, most notably its Xinger® surface mount components. Richardson Electronics is a worldwide distributor of Anaren products. Avnet distributes components in Asia; meanwhile, ACAL Technology ( formerly BFI Optilus) distributes the Company’s products in Europe. The Scandinavian countries are serviced by E.G. Components, Inc., a subsidiary of Elektronikgruppen. Additionally, Anaren's new AIR product line is distributed globally by Arrow and Mouser while Avnet distributes this line in North and South America. Using independent distributors to market and sell its products has become an important part of the Company's sales efforts by providing the Company with a larger sales force to promote its catalog product offerings.
Employees
As of June 30, 2011, the Company employed 1,032 people. Of these employees, 200 were members of the engineering staff, 721 were in manufacturing positions, 45 were in sales and marketing positions, and 66 were in management and support functions. None of these employees are represented by a labor union, and the Company has not experienced any work stoppages. The Company considers its employee relations to be excellent.
Manufacturing
The Company currently maintains manufacturing locations in East Syracuse, New York; Salem, New Hampshire; Liverpool, New York; Littleton, Colorado and Suzhou, China. MSK currently occupies a 43,000 square foot facility in Liverpool, New York, and Unicircuit in Littleton, Colorado, owns 31,000 square feet and leases 18,000 square feet of manufacturing space. The Company’s China subsidiary currently leases a 76,000 square foot facility in Suzhou, China, which is expected to be taken over by the Chinese government sometime in fiscal 2012. The Company’s Suzhou operations have been in the process of working with the landlord to move into a new 107,000 square foot facility. The move to the new facility is expected to take place during fiscal year 2012. The 156,000 square foot, East Syracuse facility houses the Company’s legacy Wireless Group and Space & Defense Group’s manufacturing and engineering areas to support current and future growth. The Company’s 65,000 square foot facility located in Salem, New Hampshire, houses its wholly owned subsidiary, Anaren Ceramics, Inc. This facility includes significantly more space for future expansion and a state-of-the-art Class 10,000 clean room for manufacturing.
9
The Company continues to develop capability and capacity to produce highly engineered, complex microwave subassemblies to support its Space & Defense business. The fiscal 2009 acquisition of MSK added high-reliability hybrid module manufacturing to the Company’s manufacturing capabilities. The Company expects to leverage the capability with the Company’s existing RF design expertise to provide highly integrated multi-function RF and microwave modules to the major space and defense OEMs. The addition of Unicircuit provides the Company with state-of-the art RF and Microwave printed circuit board capability supporting design to print manufacturing for direct OEM business as well as design to specification capability when combined with the Company’s existing RF design expertise.
The Company is committed to providing the lowest cost manufacturing solutions. Part of this strategy has evolved with the continued investment in its Suzhou, China operation. Most high volume, labor intensive wireless product lines from the Syracuse and the Salem operations have been successfully transitioned to Suzhou over the past three years. The Company has also successfully implemented a material sourcing function in Suzhou, facilitating the identification, qualification, and procurement of lower cost raw materials to support the wireless infrastructure products being manufactured in Suzhou.
All of the Company's operational manufacturing facilities (East Syracuse, New York; Salem, New Hampshire; Liverpool, New York; Littleton, Colorado; and Suzhou, China) are ISO 9001 certified.
The Company manufactures its products from standard components, as well as from items which are manufactured by vendors to its specifications. The raw materials utilized in the Company’s various product areas are generally accessible and common to both of the Company's business segments. The Company purchases most of its raw materials from a variety of vendors and most of these raw materials are available from a number of sources. During fiscal year 2011, the Company had no single vendor from which it purchased more than 10% of its total raw materials, and the Company believes that alternate sources of supply are generally available for all raw materials supplied by all Company vendors.
Research and Development
The Company's research and development efforts are focused on the design, development and engineering of both products and manufacturing processes. The Company’s current development efforts include:
|
|
●
|
products for use in mobile and fixed wireless infrastructure applications;
|
|
|
●
|
low power transceiver products for wireless data transmission;
|
|
|
●
|
advanced manufacturing technologies to produce high density microwave structures for next generation military radars, communication and sensor systems;
|
|
|
●
|
thick-film substrates capable of replacing higher cost thick-film circuits;
|
|
|
●
|
miniature components for wireless networking, subscriber and broadcast applications; and
|
|
|
●
|
high performance analog microelectronics including custom hybrids, power hybrids, and multi-chip modules.
|
These activities include customer-funded design and development, as well as efforts funded directly by the Company. Research and development expenses funded by the Company were $16.8 million in fiscal 2011, $14.8 million in fiscal 2010 and $13.0 million in fiscal 2009. Research and development costs are charged to expense as incurred.
Environmental Matters
The Company is subject to increasingly stringent environmental laws and regulations, including those relating to air emissions, wastewater discharges, chemical and hazardous waste management and disposal. Some of these environmental laws hold owners or operators of land or businesses liable for their own and for previous owners’ or operators’ releases of hazardous or toxic substances or wastes. Other environmental laws and regulations require the obtainment and compliance with environmental permits. To date, costs of complying with environmental, health and safety requirements have not been material. The nature of the Company’s operations and its long history of manufacturing activities at certain of its current facilities, as well as those acquired could potentially result in material environmental liabilities.
10
While the Company must comply with existing and pending climate change legislation, regulation, international treaties or accords, current laws and regulations do not have a material impact on its business, capital expenditures or financial position. Future events, including those relating to climate change or greenhouse gas regulation could require the Company to incur expenses related to the medication or curtailment of operations, installation of pollution control equipment, or investigation and cleanup of contaminated sites.
Intellectual Property
The Company's success depends to a significant degree upon the preservation and protection of its proprietary product and manufacturing process designs and other proprietary technology. To protect its proprietary technology and processes, the Company generally limits access to its processes and technology, treats portions of such processes and technology as trade secrets, and obtains confidentiality or non-disclosure agreements from persons with access to such proprietary processes and technology. The Company enters into agreements with its employees prohibiting them from disclosing any confidential information, technology developments and business practices, and from disclosing any confidential information entrusted to the Company by other parties. Consultants engaged by the Company who have access to confidential information generally sign an agreement requiring them to keep confidential and not disclose any non-public confidential information.
The Company currently has 16 active patents and 13 other patent applications that are currently pending before the United States Patent and Trademark Office to protect both the construction and design of its products. The Company also has registered trademarks covering certain products; most notably is the Wireless Group’s Xinger® product family. Anaren®, Xinger®, and What’ll We Think Of Next® are registered trademarks of Anaren, Inc. All rights reserved.
By agreement, Company employees who initiate or contribute to a patentable design or process are obligated to assign their interest in any patent or potential patent to the Company.
Government Regulation
The Company's products are incorporated into wireless communications systems that are subject to regulation domestically by the Federal Communications Commission and internationally by other foreign government agencies. In addition, because of its participation in the defense industry, the Company is subject to audit from time to time for compliance with government contract regulations by various governmental agencies. The Company is also subject to a variety of local, state and federal government regulations relating to environmental laws, as they relate to toxic or other hazardous substances used to manufacture the Company's products. The Company believes that it operates its business in compliance with applicable laws and regulations, however, any failure to comply with existing or future laws or regulations could have a material adverse effect on the Company's business, financial condition and results of operations.
Seasonal Trends
The Company historically has not experienced material seasonality in its business.
Item 1A. Risk Factors
In an effort to provide investors a balanced view of our current condition and future growth opportunities, this Annual Report on Form 10-K includes comments by our management about future performance. These statements which are not historical information, are "forward-looking statements" pursuant to the safe harbor provisions of the Private Securities Litigation Reform Act of 1995. These, and other forward-looking statements are not guarantees of future performance, but rather, are subject to business and economic risks and uncertainties that could cause actual results to differ materially from those discussed. The risks and uncertainties described below are not the only risks and uncertainties that we face. Additional risks and uncertainties not presently known to us or that are currently deemed immaterial may also impair our business operations. If any of the following risks actually occur, our business could be adversely affected, and the trading price of our common stock could decline, and you may lose all or part of your investment. You are encouraged to review our 2011 Annual Report, this Form 10-K for the fiscal year ended June 30, 2011 and exhibits hereto filed with the Securities and Exchange Commission, to learn more about the various risks and uncertainties facing our business and their potential impact on our revenue, earnings and stock price. Unless required by law, we disclaim any obligation to update or revise any forward-looking statement.
11
We depend on a small number of suppliers for many of our component parts and services.
In some cases we rely on a limited group of suppliers and vendors, particularly board fabrication and plating vendors, to provide us with services and materials necessary for the manufacture of our products. Our reliance on a limited group of suppliers involves several risks, including potential inability to timely obtain critical materials or services; potential increase in raw materials costs or production costs; potential delays in delivery of raw material or finished products; and reduced control over reliability and quality of components, and assemblies, as outsourcing continues. We do not have binding contractual commitments or other controls over our suppliers, and therefore cannot always rely upon the guaranteed availability of the materials necessary for the manufacture of our products. If we are required to seek alternative contract manufacturers or suppliers because we are unable to obtain timely deliveries of acceptable quality from existing manufacturers or suppliers, we could be forced to delay delivery of our products to our customers. In addition, if our suppliers and contract manufacturers increase their prices, we could suffer losses because we may be unable to recover these cost increases under fixed price production commitments to our customers. During fiscal 2011, we experienced continuing price increases from many suppliers impacted by rising raw material prices, particularly precious metals and rare earth elements.
Capital expenditures by Wireless service providers for infrastructure equipment are volatile.
Demand for the Company’s Wireless infrastructure equipment products continues to fluctuate and visibility remains relatively unpredictable. Despite strong sales of the Company’s standard and consumer components throughout fiscal year 2011, future decreases in capital expenditures for Wireless infrastructure equipment could significantly adversely impact the success of the Company’s Wireless business.
The Company’s results may be negatively affected by changing interest rates.
The Company is subject to market risk from exposure to changes in interest rates based on the Company’s financing activities. The Company’s $50.0 million dollar demand note agreement with Key Bank National Association (Keybank), which provided the financing for the MSK and Unicircuit acquisitions, bears interest at the Company’s choice at LIBOR, plus 100 to 450 basis points, or at Key Bank’s prime rate, minus 100 to plus 225 basis points, depending upon the Company’s EBITDA performance at the end of each quarter as measured by a defined formula. Therefore, a ten percent change in the LIBOR interest rate at June 30, 2011 would have the effect of increasing or decreasing interest expense by approximately $0.1 million annually. The Company’s current outstanding balance on the demand note stands at $30.0 million.
Changes in funding for defense procurement programs could adversely affect our ability to grow or maintain our revenues and profitability.
The demand for many of our Space & Defense products has been favorably impacted by an upward trend in United States defense spending in the last few years for, among other things, advanced radar systems, advanced jamming systems, smart munitions, electronic surveillance systems and satellite and ground based communication systems. Although the ultimate size of future United States defense budgets remains uncertain, current indications are that the total defense budget may decline over the next few years. This uncertainty could further worsen given the current debate over the United States debt crisis and extreme volatility in the world's capital markets. The specific programs in which we participate, or in which we may seek to participate in the future, must compete with other programs for consideration during the budget formulation and appropriation processes. While we believe that our products are a high priority for national defense, there remains the possibility that one or more of the programs we serve will be reduced, extended or terminated. Reductions in these existing programs, unless offset by other programs and opportunities, could adversely affect our ability to maintain and grow our revenues and profitability.
We face continuing pressure to reduce the average selling price of our Wireless products.
Many of our Wireless customers are under continuous pressure to reduce costs and, therefore, we expect to continue to experience pressure from these customers to reduce our prices. Our customers frequently negotiate volume supply arrangements well in advance of delivery dates, requiring us to commit to price reductions before we can determine whether the assumed manufacturing cost reductions or the negotiated supply volumes can be achieved. To offset declining average sale prices, we believe that we must achieve manufacturing cost reductions and increase our sales volumes. If we are unable to offset declining average selling prices, our gross margins will decline, and this decline could materially harm our business, financial condition and operating results. During fiscal year 2011, this pricing pressure intensified, affecting our component product gross margins. Component pricing pressure is expected to continue in fiscal 2012, despite the increased customer demand.
We depend on the future development of the wireless and satellite communications markets, which is difficult to predict.
We believe that our future growth depends in part on the success of the wireless and satellite communications markets. A number of the markets for our products in the wireless and satellite communications area have only recently begun to develop. It is difficult to predict the rate at which these markets will grow, if at all. Existing or potential wireless and satellite communications applications for our products may fail to develop or may erode. If the markets for our products in wireless and satellite communications fail to grow, or grow more slowly than anticipated, our business, financial condition and operating results would likely be harmed.
12
The markets which we serve are very competitive, and if we do not compete effectively in our markets, we will lose sales and have lower margins.
The markets for our products are extremely competitive and are characterized by rapid technological change, new product development and evolving industry standards. In addition, price competition is intense and significant price erosion generally occurs over the life of a product. We face competition from component manufacturers which have integration capabilities, as well as from the internal capabilities of large communications OEMs and defense prime contractors. Our future success will depend in part upon the extent to which these parties elect to purchase from outside sources rather than manufacture their own microwave components. Many of our current and potential competitors have substantially greater financial, technical, marketing, distribution and other resources than us, and have greater name recognition and market acceptance of their products and technologies. Our competitors may also develop new technologies or products that may offer superior price or performance features.
If we are unable to meet the rapid technological changes in the wireless and satellite communications markets, our existing products could become obsolete.
The markets in which we compete are characterized by rapidly changing technologies, evolving industry standards and frequent improvements in products and services. If technologies supported by our products become obsolete or fail to gain widespread acceptance, as a result of a change in the industry standards or otherwise, our business could be harmed. Our future success will depend in part on factors including our ability to enhance the functionality of our existing products in a timely and cost-effective manner, our ability to establish close working relationships with major customers for the design of their new wireless transmission systems that incorporate our products, our ability to identify, develop and achieve market acceptance of new products that address new technologies and meet customer needs in wireless communications markets, our ability to continue to apply our expertise and technologies to existing and emerging wireless and satellite communications markets, and our ability to achieve acceptable product costs on new products.
We must also continue to make significant investments in research and development efforts in order to develop necessary product enhancements, new designs and technologies. We may not be able to obtain a sufficient number of engineers, or other technical support staff, or the funds necessary to support our research and development efforts when needed. In addition, our research and development efforts may not be successful, and our new products may not achieve market acceptance. Wireless and satellite technologies are complex and new products and enhancements developed by our customers can in turn require long development periods for our new products or for enhancement or adaptation of our existing products. If we are unable to develop and introduce new products or enhancements in a timely manner in response to changing market conditions or customer requirements, or if our new products do not achieve market acceptance, our business, financial condition and operating results could suffer.
We rely on a limited number of OEMs as customers and the loss of one or more of them could harm our business.
We depend upon a small number of customers for a majority of our revenues. During fiscal 2011, we had two customers that accounted for more than 10% of our net sales (Lockheed Martin accounted for 14.6% of net sales and Raytheon Company accounted for 12.7% of net sales). We anticipate that we will continue to sell products to a relatively small group of customers. Delays in manufacturing or supply procurement or other factors, including consolidation of customers, could potentially cause cancellation, reduction or delay in orders by a significant customer or in shipments to a significant customer. Our future success depends significantly on the decision of our current customers to continue to purchase products from us, as well as the decision of prospective customers to develop and market space and defense and wireless communications systems that incorporate our products.
We must continue to attract and retain qualified engineers and other key employees to grow our business.
Our continued success depends on our ability to continue to attract and retain qualified engineers, particularly microwave engineers, and management personnel. Attracting and retaining qualified engineers, including microwave engineers is challenging. If we are unable to successfully hire, train and retain qualified engineers and experienced management personnel, it could jeopardize our ability to develop new products for the wireless and space and defense markets, and could also negatively impact our ability to grow our business.
Failure to meet market expectations could impact our stock price.
The market price for our common stock is based, in part, on market expectations for our sales growth, margin improvement, earnings per share and cash flow. Failure to meet these expectations could cause the market price of our stock to decline, potentially rapidly and sharply.
The Company’s Wireless business significantly depends upon its China operations
To compete globally against low cost manufacturers who primarily operate in the Asia Pacific rim, the Company has established an assembly and test facility in Suzhou, China and also maintains a sales and marketing group based in Suzhou. Conducting operations in China could be impacted by the political environment within China and trade relations between the U.S. and Chinese governments. To the extent products manufactured in Suzhou, China are sold outside of China, the Company may be impacted by currency fluctuations and therefore to the extent the U.S. dollar continues to weaken significantly against Chinese currency, the Company’s results of operations could be adversely affected. The location of the Company’s Suzhou, China facility is in an economic development area which is currently being impacted by expansion of China’s mass transit system. Although there is currently some uncertainty over the Chinese government’s intention with respect to the Suzhou facility, the Company anticipates that it will be required to relocate the Suzhou facility to a new facility in the Suzhou Office Park sometime during fiscal year 2012. The Company’s ability to successfully transition operations to the new facility may adversely impact sales and profitability of the Company’s Wireless Group.
13
The Company could experience an impairment of goodwill or tradenames.
As the result of the acquisitions made in previous years, goodwill and other intangibles incurred as a percentage of the Company’s total assets increased. At June 30, 2011, the total assets of the Company were $252.6 million, which included $45.4 million of goodwill and tradenames. The goodwill arose primarily from the excess of the purchase price of each acquisition over the fair value of the net assets of the business acquired. The tradenames were valued separately from goodwill at the amount which an independent third party would be willing to pay for use of the MSK and Unicircuit names. The Company performs annual evaluations for potential impairment of the carrying value of goodwill and tradenames in accordance with GAAP goodwill and intangible asset accounting rules. To date, these evaluations have not resulted in the need to recognize an impairment charge. However, if the Company’s financial performance were to decline significantly, especially in the Company’s Wireless Group, the Company could incur a non-cash charge in its income statement for the impairment of goodwill or tradenames.
We have been unable to procure a new tenant for our U.K. leased facility.
We lease a 20,000 square foot building in Frimley, England which is currently not used in the Company’s operations. Annual expenditures for this facility is approximately $0.6 million and the Company is currently attempting to sublet the building. The existing lease term on this building expires in February 2014 and the Company has not yet secured a new tenant. It is unlikely that the Company will be able to secure a tenant(s) to take occupancy of the building during the remaining lease term.
Other Risks
In addition to the risks identified above, other risks we face include, but are not limited to, the following:
|
|
●
|
the effect of significant changes in monetary and fiscal policies in the U.S. and abroad, including significant income tax changes, currency fluctuations and unforeseen inflationary pressures, unforeseen intergovernmental conflicts or actions, including but not limited to military conflict and trade wars;
|
|
|
●
|
potential inability to timely ramp up to meet some of our customers', particularly Wireless Group customers increased demands;
|
|
|
●
|
order cancellations or extended postponements;
|
|
|
●
|
unanticipated delays and/or difficulties increasing procurement of raw materials in Asia through our Suzhou, China facility;
|
|
|
●
|
technological shifts away from our technologies and core competencies;
|
|
|
●
|
unanticipated impairments of assets including investment values; and
|
|
|
●
|
litigation involving mergers and acquisitions, antitrust, intellectual property, environmental, product warranty, product liability, and other issues.
|
Item 1B. Unresolved Staff Comments
None.
Item 2. Properties
The principal real estate of the Company is a 159,000 square foot building, which the Company owns, located on a 30-acre parcel in East Syracuse, New York. The Company's wholly owned subsidiary, Anaren Microwave, Inc., utilizes this facility which houses a substantial portion of the Company's marketing, manufacturing, administrative, research and development, systems design and engineering activities. The Company’s senior management team is also headquartered in this facility.
14
Anaren Ceramics, Inc., a wholly owned subsidiary of the Company, operates in a 65,000 square foot building, which is owned by the Company’s subsidiary, Anaren Properties, LLC, situated on approximately 12 acres in Salem, New Hampshire.
MSK, a wholly owned subsidiary of the Company, operates in a 43,000 square foot building which it owns, situated on approximately 5 acres in Liverpool, New York.
Unicircuit, a wholly owned subsidiary of the Company, operates in a 31,000 square foot building which it owns, situated on 3 acres in Littleton, Colorado. Additionally, Unicircuit leases 18,000 square feet in an adjacent facility which houses administrative offices and additional manufacturing space at an annual cost of $0.2 million, with a lease term through November 2011.
Anaren Communications Suzhou Co. Ltd., the Company’s wholly owned subsidiary, currently leases a 76,000 square foot facility in Suzhou, China, which houses light manufacturing and assembly activities. This facility has an annual rent of approximately $0.2 million. Although not totally certain, this facility is expected to be taken over and demolished by the Chinese government in fiscal 2012. The Company’s landlord is currently building a new facility near the current site. The move to the new facility is expected to take place during fiscal year 2012 with an annual rent of approximately $0.3 million and an initial lease term of 5 years, which is renewable for two additional 5-year terms at the Company’s option.
The Company leases a 20,000 square foot building in Frimley, England which is currently not used in its operations. Annual expenditures for this facility are approximately $0.6 million and the Company is currently attempting to sublet the building. The existing lease term on this building expires in February 2014 and the Company has not yet secured a new tenant.
Management considers the foregoing facilities, including the Suzhou, China expansion activity, adequate for the current and anticipated mid-term future requirements of the Company, and expects that suitable additional space will be available to the Company, as needed, at reasonable commercial terms.
Item 3. Legal Proceedings
There are no material legal proceedings pending against the Company.
Item 4. Removed and Reserved
Executive Officers of the Company
Executive officers of Anaren, Inc., their respective ages as of June 30, 2011, and their positions held with the Company are as follows:
|
NAME
|
AGE
|
OFFICE OR POSITION HELD
|
|
Lawrence A. Sala
|
48
|
President, Chief Executive Officer, Chairman and Director
|
|
George A. Blanton
|
50
|
Senior Vice President, Chief Financial Officer, Treasurer
|
|
Mark P. Burdick
|
53
|
President, Wireless Group
|
|
David M. Ferrara
|
56
|
Secretary and General Counsel
|
|
Carl W. Gerst, Jr
|
74
|
Chief Technical Officer, Vice Chairman and Director
|
|
Timothy P. Ross
|
52
|
President, Space & Defense Group
|
|
Amy B. Tewksbury
|
47
|
Senior Vice President, Human Resources
|
|
Gert R. Thygesen
|
56
|
Senior Vice President, Technology
|
Lawrence A. Sala joined the Company in 1984. He has served as President since May 1995, as Chief Executive Officer since September 1997, and as Chairman of the Board of Directors since November 2001. Mr. Sala became a member of the Board of Directors of the Company in 1995. He holds a Bachelor's Degree in Computer Engineering, a Master's Degree in Electrical Engineering and a Master's Degree in Business Administration, all from Syracuse University.
15
Carl W. Gerst, Jr. has served as Chief Technical Officer and Vice Chairman of the Board since May 1995 and served as Treasurer from May 1992 to November 2001. Mr. Gerst previously served as Executive Vice President of the Company from its founding until May 1995, and has been a member of the Company’s Board of Directors since its founding in 1967. He holds a Bachelor's Degree from Youngstown University and a Master's Degree in Business Administration from Syracuse University.
Gert R. Thygesen joined the Company in 1981 and has served as Senior Vice President, Technology since November 2005 and served as Vice President of Technology from September 2000 until November 2005. He previously served as Vice President, Operations from April 1995 to September 2000, and as Operations Manager from 1992 until 1995. Mr. Thygesen holds a Bachelor of Science Degree and a Master's Degree in Electrical Engineering from Aalborg University Center, Denmark.
George A. Blanton joined the Company in 2008 as the Company’s Senior Vice President, Chief Financial Officer and Treasurer. Prior to his appointment, Mr. Blanton served as the Assistant General Manager of Sonic Industries, a subsidiary of Dover Corporation. From 1995 to 2006, Mr. Blanton served as the Chief Financial Officer of Sargent, a subsidiary of Dover Corporation. Mr. Blanton holds a Bachelor of Science Degree in Business Administration from University of Southern California, and a Master's Degree in Business Administration from Loyola Marymount University, Los Angeles, CA.
Mark P. Burdick has been with the Company since 1978, and up until his most recent promotion in June 2011 to President, Wireless Group, he served as Senior Vice President and General Manager since 2005 and as Vice President and General Manager from September 2000 until November 2005. He served as Vice President and General Manager, of the Company’s Wireless Group from November 1999 until September 2000, as Business Unit Manager -- Commercial Products from 1994 to 1999, and as Group Manager of Defense Radar Countermeasure Subsystems from 1991 to 1994. Mr. Burdick holds a Bachelor of Science Degree in Electrical Engineering from the Rochester Institute of Technology, and a Master's Degree of Business Administration from the University of Rochester.
Timothy P. Ross has been with the Company since 1982, and up until his most recent promotion in June 2011 to President, Space & Defense Group, he served as Senior Vice President, Business Development since November 2005 and as Vice President, Business Development from September 2000 until November 2005. He served as Vice President and General Manager, of the Company’s Space & Defense Group, from November 1999 until September 2000. Mr. Ross served as Business Unit Manager, Satellite Communications from 1995 to 1999 and as a Program Manager from 1988 to 1995. Mr. Ross holds an Associate's Degree in Engineering Science, a Bachelor of Science in Electrical Engineering from Clarkson University, and a Master's Degree in Business Administration from the University of Rochester.
Amy Tewksbury has served as Senior Vice President, Human Resources since November 2005 and joined the Company in October 2002 as Vice President, Human Resources. Prior to joining Anaren, Ms. Tewksbury was employed by Wegmans Food Markets, Inc. for 16 years. She held various positions with Wegmans including Human Resources Manager of the Syracuse Division, Corporate Human Resources Project Manager, and Store Operations. Ms. Tewksbury holds a Bachelor of Science Degree in Management from Syracuse University.
David M. Ferrara has served as the Company’s Secretary and General Counsel since February 1996, and became a part-time employee of the Company in January, 2008. Mr. Ferrara is a member of the law firm Bond Schoeneck & King, PLLC, which serves as legal counsel to the Company, and practices in the areas of labor and employment and corporate law. Mr. Ferrara holds a Bachelor’s Degree in Labor Relations from LeMoyne College, a Master’s Degree in Industrial Labor Relations from Michigan State University and a Juris Doctor Degree from Indiana University.
|
Item 5.
|
Market for Registrant's Common Equity, Related Stockholder Matters and Issuer Purchases of Equity Securities
|
The common stock of the Company is traded on the NASDAQ Global Market under the symbol "ANEN." The following table sets forth the range of quarterly high and low sales prices reported on the NASDAQ Global Market for the Company's common stock for the fiscal quarters indicated. Sales prices listed represent prices between dealers and do not include retail mark-ups, mark-downs or commissions.
16
|
1st
Quarter
|
2nd
Quarter
|
3rd
Quarter
|
4th
Quarter
|
|||||||||||||
|
Fiscal 2011
|
||||||||||||||||
| High | $ | 17.36 | $ | 21.78 | $ | 22.67 | $ | 21.37 | ||||||||
|
Low
|
$ | 13.54 | $ | 16.12 | $ | 17.42 | $ | 15.85 | ||||||||
|
Fiscal 2010
|
||||||||||||||||
| High | $ | 18.76 | $ | 17.26 | $ | 15.34 | $ | 15.99 | ||||||||
|
Low
|
$ | 15.08 | $ | 13.38 | $ | 11.15 | $ | 13.11 | ||||||||
The Company had approximately 405 holders of record of its common stock at August 8, 2011.
The Company has never declared or paid any cash dividends on its capital stock. The Company currently intends to retain earnings, if any, to support the development of its business and does not anticipate paying cash dividends for the foreseeable future. Payment of future dividends, if any, will be at the discretion of the Board of Directors after taking into account various factors, including the Company's financial condition, operating results and current and anticipated cash needs.
Issuer Purchases of Equity Securities
On May 11, 2011, the Board of Directors increased by 1,000,000 the number of shares of common stock that the Company was authorized to repurchase in open market or privately negotiated transactions through its previously announced stock repurchase program. The program, which may be suspended at any time without notice, has no expiration date. There were on June 30, 2011, approximately 1.255 million shares remaining for purchase under the current authorization.
|
Period
|
Total Number of Shares (or Units) Purchased
|
Average Price Paid per Share (or Unit)
|
Total Number of Shares (or Units) Purchased as Part of Publicly Announced Plans or Programs
|
Maximum Number (or Approximate Dollar Value) of Shares (or Units) that May Yet Be Purchased Under the Plans or Programs
|
||||||||||||
|
April 2011
|
0 | 0 | 0 | 463,339 | ||||||||||||
|
May 2011
|
15,866 | $ | 17.03 | 15,866 | 1,447,473 | |||||||||||
|
June 2011
|
192,274 | $ | 16.95 | 192,274 | 1,255,199 | |||||||||||
|
Total
|
208,140 | $ | 16.95 | 208,140 | ||||||||||||
17
Performance Graph
The following graph presents the cumulative total shareholder return for the five years ended June 30, 2011 for our common stock, as compared to the NASDAQ Composite Index and to the NASDAQ Electronic Components Index. The starting value of each index and the investment in common stock was $100.00 on June 30, 2006.
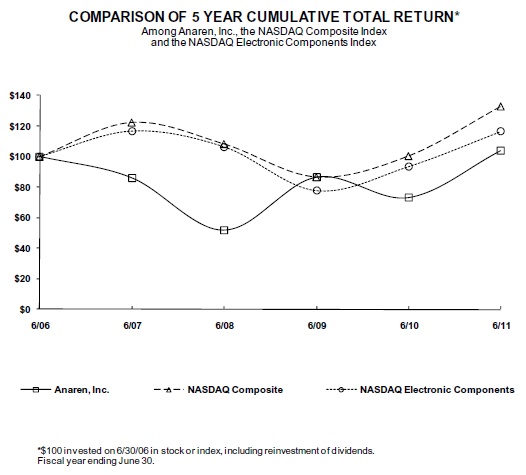
| 6/06 | 6/07 | 6/08 | 6/09 | 6/10 | 6/11 | |||||||||||||||||||
|
Anaren, Inc.
|
$ | 100.00 | $ | 85.94 | $ | 51.59 | $ | 86.29 | $ | 72.91 | $ | 103.71 | ||||||||||||
|
NASDAQ Composite
|
100.00 | 122.33 | 108.31 | 86.75 | 100.42 | 132.75 | ||||||||||||||||||
|
NASDAQ Electronic Components
|
100.00 | 116.80 | 106.44 | 77.55 | 93.33 | 116.37 |
18
Item 6. Selected Consolidated Financial Data
The selected consolidated financial data set forth below with respect to the Company’s statements of operations for each of the years in the five year period ended June 30, 2011, and with respect to the balance sheet data at June 30, 2011, 2010, and 2009 are derived from the consolidated financial statements that have been audited by Deloitte & Touche LLP, an independent registered public accounting firm, which are included elsewhere in this Annual Report on Form 10-K, and is qualified by reference to such consolidated financial statements. For periods ended June 30, 2008 and 2007 were audited by another accounting firm. All other Selected Financial Data set forth below is derived from our audited consolidated financial statements not included in this Annual Report on Form 10-K.
The following selected financial data should be read in conjunction with the audited consolidated financial statements of the Company and the accompanying notes thereto and Management’s Discussion and Analysis of Financial Condition and Results of Operations included elsewhere in this Annual Report.
19
|
For the Years Ended
|
||||||||||||||||||||
|
Statement of Income Data:
|
June 30,
2011
|
June 30,
2010
|
June 30,
2009
|
June 30,
2008
|
June 30,
2007
|
|||||||||||||||
|
(in thousands, except per share amounts)
|
||||||||||||||||||||
|
Net sales
|
$ | 179,170 | $ | 168,789 | $ | 166,905 | $ | 131,316 | $ | 128,987 | ||||||||||
|
Cost of sales
|
111,264 | 106,512 | 112,289 | 90,838 | 83,125 | |||||||||||||||
|
Gross profit
|
67,906 | 62,277 | 54,616 | 40,478 | 45,862 | |||||||||||||||
|
Operating expenses:
|
||||||||||||||||||||
|
Marketing
|
10,592 | 9,671 | 8,967 | 7,019 | 7,416 | |||||||||||||||
|
Research and development
|
16,765 | 14,782 | 12,986 | 10,410 | 9,134 | |||||||||||||||
|
General and administrative
|
19,299 | 19,040 | 18,636 | 13,847 | 12,298 | |||||||||||||||
|
Total operating expenses
|
46,656 | 43,493 | 40,589 | 31,276 | 28,848 | |||||||||||||||
|
Operating income
|
21,250 | 18,784 | 14,027 | 9,202 | 17,014 | |||||||||||||||
|
Other income (expense):
|
||||||||||||||||||||
|
Interest expense
|
(498 | ) | (590 | ) | (1,482 | ) | (79 | ) | (24 | ) | ||||||||||
|
Other income
|
1,174 | 368 | 1,088 | 2,322 | 3,571 | |||||||||||||||
|
Total other income (expense), net
|
676 | (222 | ) | (394 | ) | 2,243 | 3,547 | |||||||||||||
|
Income from continuing operations before income tax expense
|
21,926 | 18,562 | 13,633 | 11,445 | 20,561 | |||||||||||||||
|
Income tax expense
|
5,525 | 4,850 | 3,774 | 2,982 | 5,211 | |||||||||||||||
|
Income from continuing operations
|
16,401 | 13,712 | 9,859 | 8,463 | 15,350 | |||||||||||||||
|
Discontinued operations:
|
||||||||||||||||||||
|
Income from discontinued operations of Anaren Europe
|
- | - | - | - | - | |||||||||||||||
|
Income tax benefit
|
- | - | - | 770 | - | |||||||||||||||
|
Net income from discontinued operations
|
- | - | - | 770 | - | |||||||||||||||
|
Net income
|
$ | 16,401 | $ | 13,712 | $ | 9,859 | $ | 9,233 | $ | 15,350 | ||||||||||
|
Basic earnings per share:
|
||||||||||||||||||||
|
Income from continuing operations
|
$ | 1.17 | $ | .98 | $ | .71 | $ | .57 | $ | .89 | ||||||||||
|
Income from discontinued operations
|
$ | - | $ | - | $ | - | $ | .05 | $ | - | ||||||||||
|
Net income
|
$ | 1.17 | $ | .98 | $ | .71 | $ | .62 | $ | .89 | ||||||||||
|
Diluted earnings per share:
|
||||||||||||||||||||
|
Income from continuing operations
|
$ | 1.11 | $ | .94 | $ | .70 | $ | .56 | $ | .87 | ||||||||||
|
Income from discontinued operations
|
$ | - | $ | - | $ | - | $ | .05 | $ | - | ||||||||||
|
Net income
|
$ | 1.11 | $ | .94 | $ | .70 | $ | .61 | $ | .87 | ||||||||||
|
Shares used in computing net Earnings per share:
|
||||||||||||||||||||
|
Basic
|
13,988 | 14,010 | 13,911 | 14,827 | 17,319 | |||||||||||||||
|
Diluted
|
14,746 | 14,537 | 14,179 | 15,068 | 17,721 | |||||||||||||||
|
Balance Sheet Data:
|
||||||||||||||||||||
|
Cash and cash equivalents
|
$ | 58,388 | $ | 50,521 | $ | 49,893 | $ | 10,711 | $ | 7,912 | ||||||||||
|
Working capital
|
110,099 | 89,472 | 102,212 | 71,163 | 72,858 | |||||||||||||||
|
Total assets
|
252,645 | 241,348 | 237,055 | 172,103 | 191,204 | |||||||||||||||
|
Long-term debt, less current installments
|
20,000 | 30,000 | 40,000 | - | - | |||||||||||||||
|
Stockholders’ equity
|
195,104 | 172,926 | 160,945 | 150,864 | 166,794 | |||||||||||||||
20
Item 7. Management's Discussion and Analysis of Financial Condition and Results of Operations
The following Management's Discussion and Analysis of Financial Condition and Results of Operations should be read in conjunction with the consolidated financial statements and the notes thereto appearing elsewhere in this Form 10-K. The following discussion, other than historical facts, contains forward-looking statements that involve a number of risks and uncertainties. The Company's results could differ materially from those anticipated in these forward-looking statements as a result of various factors, including factors described elsewhere in this Annual Report.
Overview
The consolidated financial statements present the financial condition of the Company as of June 30, 2011 and 2010, and the consolidated results of operations and cash flows of the Company for the years ended June 30, 2011, 2010 and 2009.
The Company designs, develops and markets microwave components and assemblies for the wireless communications, satellite communications and defense electronics markets. The Company’s distinctive manufacturing and packaging techniques enable it to cost-effectively produce compact, lightweight microwave products for use in base stations and subscriber equipment for wireless communications as well as, in satellites and in defense electronics systems. The Company is also a leading provider of high performance analog microelectronics including custom hybrids, power hybrids, and multi-chip modules. The Company sells its products to leading wireless communications equipment manufacturers such as Ericsson, Motorola Solutions, Nokia-Siemens Networks, and Huawei, and to satellite communications and defense electronics companies such as Boeing Satellite, ITT, Lockheed Martin, Northrop Grumman, and Raytheon.
Results of Operations
Net sales from continuing operations for the year ended June 30, 2011 were $179.2 million, up 6.2% from $168.8 million for fiscal 2010. Net income for fiscal 2011 was $16.4 million, or 9.2% of net sales, up $2.7 million, or 19.7% from net income of $13.7 million in fiscal 2010.
The following table sets forth the percentage relationships of certain items from the Company's consolidated statements of operations as a percentage of net sales for the periods indicated:
|
Years Ended June 30,
|
||||||||||||
| 2011 | 2010 | 2009 | ||||||||||
|
Net sales
|
100.0 | % | 100.0 | % | 100.0 | % | ||||||
|
Cost of sales
|
62.1 | 63.1 | 67.3 | |||||||||
|
Gross Profit
|
37.9 | 36.9 | 32.7 | |||||||||
|
Operating expenses:
|
||||||||||||
|
Marketing
|
5.9 | 5.7 | 5.4 | |||||||||
|
Research and development
|
9.3 | 8.8 | 7.8 | |||||||||
|
General and administrative
|
10.8 | 11.3 | 11.1 | |||||||||
|
Total operating expenses
|
26.0 | 25.8 | 24.3 | |||||||||
|
Operating income
|
11.9 | 11.1 | 8.4 | |||||||||
|
Other income (expense):
|
||||||||||||
|
Interest expense
|
(0.3 | ) | (0.3 | ) | (0.9 | ) | ||||||
|
Other income
|
0.7 | 0.2 | 0.7 | |||||||||
|
Total other income (expense)
|
0.4 | (0.1 | ) | (0.2 | ) | |||||||
|
Income before income taxes
|
12.3 | 11.0 | 8.2 | |||||||||
|
Income taxes
|
3.1 | 2.9 | 2.3 | |||||||||
|
Net income
|
9.2 | 8.1 | 5.9 | |||||||||
The following table sets forth the Company’s net sales by industry segment for the periods indicated:
|
Years Ended June 30,
|
||||||||||||||||||||||||
|
2011
|
2010
|
2009
|
||||||||||||||||||||||
|
(In thousands)
|
(In thousands)
|
(In thousands)
|
||||||||||||||||||||||
|
Wireless
|
$ | 66,043 | 36.9 | % | $ | 55,556 | 32.9 | % | $ | 68,622 | 41.1 | % | ||||||||||||
|
Space & Defense
|
113,127 | 63.1 | % | 113,233 | 67.1 | % | 98,283 | 58.9 | % | |||||||||||||||
| $ | 179,170 | 100.0 | % | $ | 168,789 | 100.0 | % | $ | 166,905 | 100.0 | % | |||||||||||||
21
Year Ended June 30, 2011 Compared to Year Ended June 30, 2010
Net sales. Net sales were $179.2 million for the year ended June 30, 2011, compared to $168.8 million for fiscal 2010. Sales of Wireless Group products increased $10.5 million, or 18.9%, while sales of Space & Defense Group products were flat at $113.1 million, in fiscal 2011 compared to fiscal 2010.
The increase in sales of Wireless Group products, which consist of standard components and to a lesser extent, ferrite components and custom subassemblies for use in building wireless base station and consumer equipment, was the result of a substantial increase in demand for standard Wireless component products in fiscal 2011 compared to fiscal 2010. Sales of these products rose $18.7 million in fiscal 2011 over fiscal 2010 levels on the strength of continuing orders from both European OEMs and Asian contract manufacturers. This increase in standard component sales was partially offset by an $8.2 million decline in custom and ferrite basestation products in the current fiscal year compared to the fiscal 2010, which resulted from loss of sales to low cost Asian vendor sources and decreased demand for second generation GSM equipment. Demand for Wireless Group Standard and consumer component products, in fiscal 2012, is expected to increase compared to fiscal 2011 levels.
Space & Defense Group products consist of custom components and assemblies for communication satellites and defense radar, receiver, and countermeasure systems for the military. Sales for the Space & Defense Group were unchanged at $113.1 million in fiscal 2011 compared to the previous fiscal year. Space & Defense Group sales in fiscal 2011 included shipments of counter-improvised explosive devices (IED) related products totaling $10.5 million compared to $7.0 million in fiscal 2010, and a $2.5 million increase in hybrid module sales in fiscal 2011 compared to last year. This increase was partially off-set by a decline in sales of military printed wire board products, which fell $6.4 million in the current year compared to fiscal 2010 due to increased internal use of production and for delays and inefficiencies caused by ongoing capacity expansion and renovations at the Company’s Unicircuit subsidiary. Space & Defense Group product sales continue to benefit from the higher level of business obtained by the Company over the past two fiscal years which has resulted in the Group’s backlog of $90.6 million as of June 30, 2011. We expect approximately 75 percent of this backlog to be shipped in fiscal year 2012.
Through fiscal year 2011, the Company’s defense business has felt little or no impact from the current downturn in the economy as we experienced no cancellations or significant delays in deliveries under specific contracts. Based on the current confused state of the defense budget for fiscal 2012, the Company cannot project any contract cancellations or program discontinuations related to existing or expected orders.
Gross Profit. Cost of sales consists primarily of engineering design costs, materials, material fabrication costs, assembly costs, intangible amortization, direct and indirect overhead, and test costs. Gross profit for fiscal 2011 was $67.9 million, (37.9% of net sales), up from $62.3 million (36.9% of net sales) for the prior year. Gross profit as a percent of sales increased in fiscal 2011 compared to fiscal 2010 due to the higher Wireless Group sales and a more favorable product mix in the Wireless Group. Wireless Group gross margins were enhanced by an $8.2 million reduction in sales of lower margin, high material content custom products which were replaced by $18.7 million of sales of higher margin standard component products in fiscal 2011 compared to fiscal 2010. In the Space & Defense Group, delays in orders, a less favorable sales mix resulting from ongoing new product production start-ups and engineering development programs of $0.4 million, as well as excess inventory write-downs of $0.6 million, due to the reorganization at Anaren Ceramics, resulted in lower gross margins for fiscal 2011 compared to the previous fiscal year. In addition, current inflationary pressures have adversely affected certain raw material costs which negatively impacted our overall margins.
Marketing. Marketing expenses consist mainly of employee related expenses, commissions paid to sales representatives, trade show expenses, advertising expenses and related travel expenses. Marketing expenses were $10.6 million (5.9% of net sales) for fiscal 2011, up $0.9 million from $9.7 million (5.7% of net sales) for fiscal 2010. Marketing expenses in fiscal 2011 rose $0.9 million, or 9.5%, from fiscal 2010 levels due to increased sales personnel, commission costs and travel expenses related to the increase in business levels and additional advertising expenditures related to the AIR product introduction in the current fiscal year. Marketing costs in fiscal 2012 are expected to continue at these higher levels to support both the higher wireless demand and the increasing complexity of the defense marketplace.
Research and Development. Research and development expenses consist of materials and salaries and related overhead costs of employees engaged in ongoing research, design and development activities associated with new products and technology development. Research and development expenses were $16.8 million (9.3% of net sales) in fiscal 2011, up 13.4% from $14.8 million (8.8% of net sales) for fiscal 2010. Research and development expenditures are supporting further development of Wireless Group consumer component opportunities, as well as new technology development in the Space & Defense Group. Research and development expenditures have increased in fiscal 2011 versus fiscal 2010 due to the higher level of opportunities in both the Space & Defense Group and Wireless Group marketplaces. These opportunities have resulted in the hiring of additional engineering and technical personnel to work on both funded and unfunded customer Space & Defense Group development programs, as well as, further development of AIR products. The Company expects to continue its current research and development efforts and spending levels in fiscal 2012, and is presently working on a number of new standard and custom Wireless Group and Space & Defense Group opportunities.
22
General and Administrative. General and administrative (G&A) expenses consist of employee related expenses, professional services, intangible amortization, travel related expenses and other corporate costs. General and administrative expenses were $19.3 million (10.8% of net sales) for fiscal 2011, up 1.4% from $19.0 million (11.3% of net sales) for fiscal 2010. The increase in general and administrative expense in fiscal 2011 compared to last year resulted from the inclusion of $0.4 million in severance costs incurred as a result of the reduction of personnel at the Company’s Salem, New Hampshire subsidiary announced in the fourth quarter of fiscal 2011. G&A expenses are expected to continue at current levels in fiscal 2012.
Operating Income. Operating income increased 13.1% in fiscal 2011 to $21.2 million, (11.9% of net sales), compared to $18.8 million (11.1% of net sales) for fiscal 2010. This increase in operating income in fiscal 2011 compared to fiscal 2010 was due to the $10.5 million increase in sales volume and the favorable product mix caused by the $18.7 million rise in sales of higher margin standard components coupled with the $8.2 million decline in sales of lower margin custom assemblies in the Wireless Group.
On an operating segment basis, Wireless Group operating income was $12.0 million (18.2% of Group sales) for fiscal 2011, up $6.9 million, from the Group’s operating income of $5.1 million (9.2% of Group sales) in fiscal 2010. The increase in Wireless Group operating income in fiscal 2011 compared to fiscal 2010 was a result of the $10.5 million overall increase in Wireless Group sales and the combined impact of the continuing decline in low margin custom assembly sales, which fell $8.2 million in the current fiscal year, and the increased demand for higher margin standard component products which rose $18.7 million in the current fiscal year compared to fiscal 2010. The current high level of demand for Wireless Group standard components, based on current customer demand forecasts, is expected to continue in fiscal 2012.
Space & Defense Group operating income was $9.9 million (8.7% of Group sales) in fiscal 2011, down $4.6 million from $14.5 million (12.8% of net Group sales) for fiscal 2010. Operating margins for this Group decreased in fiscal 2011 due to a less favorable product mix, losses recognized on some initial engineering production contracts, and production yield issues due to ongoing expansion at the Company’s Unicircuit facility. Operating margins were further eroded by increased group R&D spending due to a delay in the IridiumNext contract finalization in the third quarter of fiscal 2011, which resulted in additional engineering personnel being redirected to unfunded development work compared to fiscal 2010. The Company expects the current lower margins we are experiencing in the Space & Defense Group to continue in the first half of fiscal 2012 until current engineering contracts enter production.
Interest Expense. Interest expense in fiscal 2011 was $0.5 million compared to $0.6 million for fiscal 2010. The Company at June 30, 2011 had $30.0 million outstanding on its long-term obligation. These borrowings bear interest at the 90 day LIBOR rate, plus 100 to 425 basis points, depending upon the Company’s rolling twelve month EBITDA performance. The rate is reset quarterly and for the first quarter of fiscal 2012 is expected to be approximately 1.30%.
Other Income. Other income increased to $1.2 million in fiscal 2011 compared to $0.4 million for fiscal 2010. This increase was a result of a lengthening of the maturities of the Company’s investment portfolio resulting in 50% increase in average return as well as higher interest rates on funds held in China. Additionally, in the fourth quarter of fiscal 2011, the Company received a one-time $0.6 million break-up fee payment from AML Communications, Inc. in connection with the Company’s proposed acquisition of AML in April 2011. Other income will fluctuate based on short term market interest rates, the Company’s cash investment strategy and the level of investable cash balances.
Income Taxes. Income taxes for fiscal 2011 were $5.5 million (3.1% of net sales), representing an effective tax rate of 25.2%. This compares to income tax expense of $4.9 million (2.9% of net sales) for fiscal 2010, representing an effective tax rate of 26.1%. The projected effective tax rate for fiscal year 2012, absent one-time events is expected to be approximately 32.0%. The effective tax rate for fiscal 2011 was a result of the adjustments to reserves for uncertain tax positions and the reinstatement of the Research and Experimentation Tax Credit.
Year Ended June 30, 2010 Compared to Year Ended June 30, 2009
Net sales were $168.8 million for the year ended June 30, 2010, compared to $166.9 million for fiscal 2009. Sales of Wireless Group products fell $13.1 million, or 19.0%, and sales of Space & Defense Group products rose $15.0 million, or 15.2%, in fiscal 2010 compared to fiscal 2009.
23
The decline in sales of Wireless Group products was the result of a decline in demand for both custom assemblies and standard component products during fiscal 2010 compared to fiscal 2009. Sales of custom products fell $8.9 million, while sales of standard components fell $4.2 million in the current fiscal year compared to fiscal 2009. The majority of the decline in sales of custom products resulted from a $6.7 million decline in sales to a major OEM due to partial loss of allocations to low cost Asian vendor sources and decreased demand for second generation GSM equipment. The remaining $2.2 million decrease in fiscal 2010 custom shipments and the $4.2 million decrease in standard component shipments resulted from the general decline in wireless infrastructure component demand in fiscal 2010 compared to fiscal 2009 due to the general decline in the worldwide economy and infrastructure capital expenditure levels which was reflected in a general decline in shipments to both OEMs and distributors. The continuing challenging pricing environment for both standard component and custom assembly products also negatively impacted net sales in fiscal 2010 compared to fiscal 2009.
Sales of Space & Defense Group products rose $15.0 million, or 15.2% in fiscal 2010 compared to fiscal year 2009. Sales of Space & Defense Group products in the fiscal year 2010 included twelve months of sales from MSK and Unicircuit, totaling $50.4 million, while sales in fiscal 2009 included eleven months and ten months of sales from MSK and Unicircuit, respectively, amounting to $37.5 million. This increase is attributed to approximately $6.0 million from the additional three months sales not included in fiscal 2009 and a $7.1 million increase in sales of Hybrid modules and RF printed wire boards at MSK and Unicircuit, respectively, above fiscal 2009 levels due to the higher level of order intake for both subsidiaries fiscal 2009 and 2010. Space & Defense Group product sales continued to benefit from the higher level of business won by the Company over fiscal years 2009 and 2010 which has resulted in the Group’s backlog of $89.6 million at June 30, 2010.
Gross Profit. Gross profit for fiscal 2010 was $62.3 million, (36.9% of net sales), up from $54.6 million (32.7% of net sales) for the prior year. Gross profit as a percent of sales increased in fiscal 2010 from fiscal 2009 due to the increase in sales volume and due to the absence in fiscal 2010 of $2.2 million (1.3% of net sales) of amortization of inventory step-up costs related to the acquisition of MSK and Unicircuit, which were included in fiscal 2009 cost of sales. Additionally, gross margins were enhanced by a favorable product mix including the $8.7 million decline in sales of lower margin, high material content custom Wireless Group products which resulted in a $5.0 million reduction in direct material costs and by reduced production overhead costs, including personnel, freight, production supplies, and scrap in fiscal 2010 compared to fiscal 2009.
Marketing. Marketing expenses were $9.7 million (5.7% of net sales) for fiscal 2010, up $0.7 million from $9.0 million (5.4% of net sales) for fiscal 2009. Marketing expenses in fiscal 2010 rose $0.7 million from the previous fiscal year due to the inclusion of $2.6 million of marketing expenses from Unicircuit and MSK in fiscal 2010, compared to $1.9 million for these two subsidiaries in fiscal 2009, which included only eleven months and ten months of expense for MSK and Unicircuit, respectively. Absent these additional costs, marketing expense was flat year over year, with increases in the Space & Defense Group due to higher volume and opportunities being offset by lower expense levels in the Wireless Group.
Research and Development. Research and development expenses were $14.8 million (8.8% of net sales) in fiscal 2010, up 14% from $13.0 million (7.8% of net sales) for fiscal 2009. Research and development expenditures are supporting further development of Wireless Group infrastructure and consumer component opportunities, as well as new technology development in the Space & Defense Group. Research and development expenditures increased in fiscal 2010 versus fiscal 2009 due to the higher level of opportunities in the Space & Defense Group marketplaces which resulted in approximately $1.8 million in additional spending for the Group compared to fiscal 2009.
General and Administrative. General and administrative expenses were $19.0 million (11.3% of net sales) for fiscal 2010, up 2.2% from $18.6 million (11.1% of net sales) for fiscal 2009. The increase in general and administrative expense in fiscal 2010 compared to the prior year was due to the inclusion of $6.1 million of general and administrative expenses from Unicircuit and MSK in fiscal 2010, compared to $5.6 million for these two subsidiaries in fiscal 2009, which included only eleven months and ten months of expense for MSK and Unicircuit, respectively. This increase was partially off-set by a $0.3 million decline in compensation and other administrative expenses due to the timing of the issuance of restricted stock, reduced professional service costs and the consolidation of some administrative functions across all subsidiaries.
Operating Income. Operating income increased 33.9% in fiscal 2010 to $18.8 million, (11.1% of net sales), compared to $14.0 million (8.4% of net sales) for fiscal 2009. The increase in fiscal 2010 operating income compared to fiscal 2009 was due to the absence of $2.2 million of amortization of inventory step-up costs related to the acquisition of MSK and Unicircuit, which were included in fiscal 2009 cost of sales. Operating margins were further enhanced by a favorable product mix which resulted in lower material costs per sales dollar of 27.9% in fiscal 2010 compared to 31.2% in fiscal 2009 due mainly to a $8.7 million reduction in sales of high material content custom Wireless Group products in fiscal 2010 and the effects of ongoing cost reduction initiatives throughout the Company which have had a significant positive effect on overall Company expense levels.
24
On an operating segment basis, Wireless Group operating income was $5.1 million (9.2% of Group sales) for fiscal 2010, down $1.5 million, from the Group’s operating income of $6.6 million (9.7% of Group sales) in fiscal 2009. The decrease in Wireless Group operating income in fiscal 2010 compared to fiscal 2009 was a result of the $13.0 million decline in Wireless Group sales year over year which resulted in a $2.5 million decline in gross margins for this business segment. Despite the large decrease in sales, the Company was able to maintain the level of operating income (9.2% of sales in fiscal 2010) due to the improvement in gross margins as a percent of sales for the Group from 36.7% in fiscal 2009 to 40.9% in fiscal 2010, brought about by a more favorable product mix resulting from the $8.7 million Wireless Group sales decrease being low margin, high material content custom products and reductions in manufacturing costs due to the lower sales volume. Additionally, operating margins were further enhanced by a $1.0 million (9%) decline in marketing and general and administrative expenses within the Group in fiscal 2010 compared to fiscal 2009 due to the decline in the Group’s sales volume.
Space & Defense Group operating income was $14.5 million (12.8% of Group sales) in fiscal 2010, up $6.3 million from $8.2 million (8.3% of net Group sales) for fiscal 2009. Operating margins for this Group improved approximately 50% in fiscal 2010 due to the $14.9 million increase in sales and the inclusion of only $0.9 million of acquisition related intangible amortization costs and no inventory step-up costs in fiscal 2010, compared to $2.9 million of combined acquisition related inventory step-up and intangible amortization costs caused by the acquisition of MSK and Unicircuit in fiscal 2009. Group operating margins were further enhanced as a result of a more favorable product mix which resulted in a 1% decline in material costs as a percent of sales for the Group in fiscal 2010, production economies of scale due to the sales increase and the cost savings achieved through the Company’s cost reduction efforts.
Other Income. Other income decreased to $0.4 million in fiscal 2010 compared to $1.1 million for fiscal 2009. This decrease was caused by the substantial decline in short-term interest rates year over year and a deliberate shortening of the maturities of the Company’s investment portfolio due to the turmoil in the credit market.
Interest Expense. Interest expense in fiscal 2010 was $0.6 million compared to $1.5 million for fiscal 2009. This decrease was due to the substantial decline in the average 90 day London Interbank Offered Rate (LIBOR) interest rate (approx. 0.4%) for fiscal 2010 compared to the average rate (approx. 2.2%) for fiscal 2009. The Company borrowed a total of $49.8 million under its $50.0 million revolving credit facility in the first quarter 2009 and repaid $9.8 million in the first quarter of fiscal 2010. These borrowings bear interest at the 90 day LIBOR rate, plus 100 to 425 basis points, depending upon the Company’s rolling twelve month earnings before interest, taxes, depreciation and amortization (EBITDA) performance. The rate is reset quarterly.
Income Taxes. Income taxes for fiscal 2010 were $4.9 million (2.9% of net sales), representing an effective tax rate of 26.1%. This compares to income tax expense of $3.8 million (2.3% of net sales) for fiscal 2009, representing an effective tax rate of 27.7%. The effective tax rate for fiscal 2010 was a result of the adjustments to reserves for uncertain tax positions related to the results of the IRS examination amounting to a reduction in tax expense of approximately $1.0 million.
25
Critical Accounting Policies and Estimates
The Company prepares the consolidated financial statements in accordance with generally accepted accounting principles (GAAP) in the U.S. In doing so, the Company has to make estimates and assumptions that affect the reported amounts of assets, liabilities, revenues and expenses, as well as related disclosure of contingent assets and liabilities. In some cases, the Company could have reasonably used different accounting policies and estimates. In some cases, changes in the accounting estimates are reasonably likely to occur from period to period. Accordingly, actual results could differ materially from the estimates made in the financial statements. To the extent that there are material differences between these estimates and actual results, the Company’s financial condition or results of operations will be affected. Estimates are based on past experience and other assumptions that the Company believes are reasonable under the circumstances, and they are evaluated on an ongoing basis. The Company refers to accounting estimates of this type as critical accounting policies and estimates, which are discussed further below. The Company has reviewed the critical accounting policies and estimates with the audit committee of the board of directors.
Income Taxes
In accordance with the liability method of accounting for income taxes, the provision for income taxes is the sum of income taxes both currently payable and deferred. The changes in deferred tax assets and liabilities are determined based upon the changes in differences between the bases of assets and liabilities for financial reporting purposes and the tax basis of assets and liabilities as measured by the enacted tax rates that management estimates will be in effect when the differences reverse.
Beginning in fiscal year 2007, the Company adopted the standards that govern the accounting for uncertainty in income taxes, to assess and record income tax uncertainties. The rules prescribe a recognition threshold and measurement attribute for financial statement recognition and measurement of a tax position taken or expected to be taken in a tax return and also provides guidance on various related matters such as derecognition, interest and penalties, and disclosure.
In relation to recording the provision for income taxes, management must estimate the future tax rates applicable to the reversal of temporary differences, make certain assumptions regarding whether book/tax differences are permanent or temporary and if temporary, the related timing of expected reversal. Also, estimates are made as to whether taxable operating income in future periods will be sufficient to fully recognize any gross deferred tax assets. If recovery is not likely, the Company must increase its provision for taxes by recording a valuation allowance against the deferred tax assets that are estimated will not ultimately be recoverable. Alternatively, the Company may make estimates about the potential usage of deferred tax assets that decreases the valuation allowances.
The calculation of our tax liabilities involves dealing with uncertainties in the application of complex tax regulations. Significant judgment is required in evaluating our tax positions and determining our provision for income taxes. During the ordinary course of business, there are many transactions and calculations for which the ultimate tax determination is uncertain. The Company establishes reserves for uncertain tax positions when it believes that certain tax positions do not meet the more likely than not threshold. The Company adjusts these reserves in light of changing facts and circumstances, such as the outcome of a tax audit or the lapse of the statute of limitations. The provision for income taxes includes the impact of reserve provisions and changes to the reserves that are considered appropriate. The Company follows FASB ASC 740, Income Taxes for accounting for its uncertain tax positions.
Changes could occur that would materially affect our estimates and assumptions regarding deferred taxes. Changes in current tax laws and tax rates could affect the valuation of deferred tax assets and liabilities, thereby changing the income tax provision. Also, significant declines in taxable income could materially impact the realizable value of deferred tax assets. At June 30, 2011, we had $14.4 million of deferred tax assets on our balance sheet and a valuation allowance of $4.5 million has been established for certain deferred tax assets as it is more likely than not that they will not be realized.
A 1% increase in the effective tax rate would increase the current year provision by $0.2 million, reducing diluted earnings per share by $0.01 based on shares outstanding at June 30, 2011.
Equity- Based Compensation
The Company records compensation costs related to stock-based awards in accordance with the share-based payment accounting rules and related Securities and Exchange Commission rules. Under the fair value recognition provisions of the guidance, the Company measures stock-based compensation cost at the grant date based on the fair value of the award.
Compensation cost for service-based awards is recognized ratably over the applicable vesting period. Compensation cost for performance-based awards is reassessed each period and recognized based upon the probability that the performance targets will be achieved. The amount of stock-based compensation expense recognized during a period is based on the portion of the awards that are ultimately expected to vest. The total expense recognized over the vesting period will only be for those awards that ultimately vest.
26
The Company utilizes the Black-Scholes Options Pricing Model to determine the fair value of stock options under the stock option guidance. The Company is required to make certain assumptions with respect to selected Black Scholes model inputs, including expected volatility, expected life, expected dividend yield and the risk-free interest rate. Expected volatility is based on the historical volatility of the Company’s stock over the most recent period commensurate with the estimated expected life of the stock options. The expected life of stock options granted, which represents the period of time that the stock options are expected to be outstanding, is based, primarily, on historical data. The expected dividend yield is based on history and the expectation of dividend payouts. The risk-free interest rate is based on the U.S. Treasury yield curve in effect at the time of grant for a period commensurate with the estimated expected life.
For restricted stock and restricted stock unit awards, the fair market value is determined based upon the closing value of the Company's stock price on the grant date.
Compensation cost for performance-based stock options and restricted stock units is reassessed each period and recognized based upon the probability that the performance targets will be achieved. That assessment is based upon the Company’s actual and expected future performance as well as that of the individuals who have been granted performance-based awards.
Stock-based compensation expense is only recorded for those awards that are expected to vest. Forfeiture estimates for determining appropriate stock-based compensation expense are estimated at the time of grant based on historical experience and demographic characteristics. Revisions are made to those estimates in subsequent periods if actual forfeitures differ from estimated forfeitures.
Option pricing models were developed for use in estimating the value of traded options that have no vesting restrictions and are fully transferable. Because our share-based payments have characteristics significantly different from those of freely traded options, and because changes in the subjective input assumptions can materially affect our estimates of fair values, existing valuation models may not provide reliable measures of the fair values of our share-based compensation. Consequently, there is a risk that our estimates of the fair values of our share-based compensation awards may bear little resemblance to the actual values realized upon the exercise, expiration or forfeiture of those share-based payments in the future. Stock options may expire worthless or otherwise result in zero intrinsic value as compared to the fair values originally estimated on the grant date and reported in our consolidated financial statements. Alternatively, value may be realized from these instruments that are significantly in excess of the fair values originally estimated on the grant date and reported in our consolidated financial statements. There are significant differences among valuation models. This may result in a lack of comparability with other companies that use different models, methods and assumptions.
There is a high degree of subjectivity involved in selecting assumptions to be utilized to determine fair value and forfeiture assumptions. If factors change and result in different assumptions in the application of the share-based payment accounting rules in future periods, the expense that we record for future grants may differ significantly from what we have recorded in the current period. Additionally, changes in performance of the Company or individuals who have been granted performance-based awards that affect the likelihood that performance based targets are achieved could materially impact the amount of stock-based compensation expense recognized.
A 1% change in our stock based compensation expense would increase/decrease current year net income by less than $0.1 million, and would have no effect on the earnings per diluted share.
Impairment of Marketable and Non-Marketable Securities
The Company periodically reviews marketable securities, as well as non-marketable securities for impairment. If we conclude that any of these investments are impaired, we determine whether such impairment is “other-than-temporary” as defined under the investment in debt and equity security rules. Factors we consider to make such determination include the duration and severity of the impairment, the reason for the decline in value and the potential recovery period, and our intent and ability to hold an investment. If any impairment is considered “other-than-temporary,” the Company will write down the asset to its fair value and take a corresponding charge to our Consolidated Statement of Income. At June 30, 2011, the Company had no available-for-sale securities.
Valuation of Inventory
Inventories are stated at the lower of cost, determined using the first-in, first-out method, or market. Inventory standard costing requires complex calculations that include assumptions for overhead absorption, scrap, sample calculations, manufacturing yield estimates and the determination of which costs are capitalizable. The valuation of inventory requires the Company to estimate obsolete or excess inventory as well as inventory that is not of saleable quality. Variations in methods or assumptions could have a material impact on the Company’s results. If the Company’s demand forecast for specific products is greater than actual demand and it fails to reduce manufacturing output accordingly, the Company could be required to record additional inventory reserves, which would have a negative impact on net income.
A 1% write-down of our inventory would decrease current year net income by approximately $0.2 million, or approximately $0.01 per diluted share. As of June 30, 2011 we had $33.7 million of inventory recorded on our balance sheet representing 13% of total assets.
27
Employee Benefit Plans
The Company’s noncontributory pension plan (the “Pension Plan”) covers U.S. employees who became eligible after one year of service. The benefit formula is dependent upon employee earnings and years of service. Additionally, certain healthcare benefits are available to eligible domestic employees who are participants in the Pension Plan and meet certain age and service requirements upon termination of employment (the “Postretirement Health Care Benefits Plan”). For eligible employees, the Company offsets a portion of the postretirement medical costs to the retired participant based on length of service. Effective August 15, 2000, the Pension Plan and the Postretirement Health Care Benefits Plan were closed to new participants.
Accounting methodologies use an attribution approach that generally spreads individual events over the service lives of the employees in the plan. Examples of “events” are plan amendments and changes in actuarial assumptions such as discount rate, expected long-term rate of return on plan assets, and rate of compensation increases. The principle underlying the required attribution approach is that employees render service over their service lives on a relatively consistent basis and, therefore, the income statement effects of pension benefits or postretirement health care benefits are earned in, and should be expensed in, the same pattern.
There are various assumptions used in calculating the net periodic benefit expense and related benefit obligations. One of these assumptions is the expected long-term rate of return on plan assets. The required use of expected long-term rate of return on plan assets may result in recognized pension income that is greater or less than the actual returns of those plan assets in any given year. Over time, however, the expected long-term returns are designed to approximate the actual long-term returns and therefore result in a pattern of income and expense recognition that more closely matches the pattern of the services provided by the employees.
The Company uses longer-term historical actual return experience with consideration of the expected investment mix of the plans’ assets, as well as future estimates of long-term investment returns, to develop its expected rate of return assumption used in calculating the net periodic pension cost and the net retirement healthcare expense. The Company’s investment return assumption for the Pension Plan was 8.5% for both fiscal 2011 and 2010. At June 30, 2011, the Pension Plan assets were comprised of approximately 62% equity investments and 38% cash and fixed income investments, while the Postretirement Health Care Benefits Plan was unfunded.
A second key assumption is the discount rate. The discount rate assumptions used for pension benefits and postretirement health care benefits accounting reflects, at June 30 of each year, the prevailing market rates for high-quality, fixed-income debt instruments that, if the obligation was settled at the measurement date, would provide the necessary future cash flows to pay the benefit obligation when due. The Company’s discount rates for measuring its pension obligations were 5.50% and 5.30% at June 30, 2011 and 2010, respectively. The Company’s discount rates for measuring the Postretirement Health Care Benefits Plan obligation were 5.15% and 5.20% at June 30, 2011 and 2010, respectively.
A final set of assumptions involves the cost drivers of the underlying benefits. The rate of compensation increase is a key assumption used in the actuarial model for pension accounting and is determined by the Company based upon its long-term plans for such increases. The Company’s fiscal 2011, 2010 and 2009 rate for future compensation increase for the Pension Plan was 4%. For Postretirement Health Care Benefits Plan accounting, the Company reviews external data and its own historical trends for health care costs to determine the health care cost trend rates. Based on this review, the health care cost trend rates used to determine the June 30, 2011 accumulated postretirement benefit obligation are 7.3% - 10.0% for 2011, with a declining trend rate of about 0.8% - 0.4% each year until it reaches 5% by fiscal 2018, with a flat 5% rate for fiscal 2018 and beyond.
For the fiscal years ended June 30, 2011, 2010 and 2009, the Company recognized net periodic pension expense of $0.8 million, $0.6 million and $0.3 million, respectively, related to its pension plan. Cash contributions of $0.3 million were made to the U.S. pension plan in fiscal 2011. The Company expects to make cash contributions of approximately $1.0 million to its pension plan during fiscal 2012.
The 2011, 2010 and 2009 fiscal year Postretirement Health Care Benefits Plan actual expenses were $0.01 million, $0.1million and $0.2 million, respectively. Cash contributions of $0.1 million were made to this plan in fiscal 2011. The Company expects to make $.1 million in cash contributions to the Postretirement Health Care Benefits Plan in fiscal 2012.
Recent market conditions have resulted in an unusually high degree of volatility and increased the risks and illiquidity associated with certain investments held by the pension plan, which could impact the value of investments after the date of this filing. The Company’s measurement date of its plan assets and obligations is June 30.
Assessment of Recoverability of Intangible and Long-Lived Assets
When the Company makes an acquisition, it allocates the purchase price to the assets that are acquired and liabilities that are assumed based on their estimated fair value at the date of acquisition. The Company then allocates the purchase price in excess of net tangible assets acquired to identifiable intangible assets. Other indefinite lived intangible assets, such as tradenames, are considered non-amortizing intangible assets as they are expected to generate cash flows indefinitely. Goodwill is recorded when the purchase price paid for an acquisition exceeds the estimated fair value of the net identified tangible and intangible assets acquired. Indefinite lived intangibles and goodwill are required to be assessed for impairment on an annual basis or more frequent if certain indicators are present. Definite-lived intangible assets are amortized over their estimated useful lives.
28
The Company bases the fair value of identifiable tangible and intangible assets on detailed valuations that use information and assumptions provided by management. The fair values of the assets acquired and liabilities assumed are determined using one of three valuation approaches: market, income and cost. The selection of a particular method for a given asset depends on the reliability of available data and the nature of the asset, among other considerations. The market approach values the subject asset based on available market pricing for comparable assets. The income approach values the subject asset based on the present value of risk adjusted cash flows projected to be generated by the asset. The projected cash flows for each asset considers multiple factors, including current revenue from existing customers, attrition trends, reasonable contract renewal assumptions from the perspective of a marketplace participant, and expected profit margins giving consideration to historical and expected margins. The cost approach values the subject asset by determining the current cost of replacing that asset with another of equivalent economic utility. The cost to replace a given asset reflects the estimated reproduction or replacement cost for the asset, less an allowance for loss in value due to depreciation or obsolescence, with specific consideration given to economic obsolescence if indicated.
The Company performs an annual review using March 31 as the test date, or more frequently if indicators of potential impairment exist, to determine if the recorded goodwill and other indefinite lived intangible assets are impaired. The Company assesses goodwill for impairment by comparing the fair value of the reporting units to their carrying value to determine if there is potential impairment. If the fair value of a reporting unit is less than its carrying value, an impairment loss is recorded to the extent that the implied fair value of the goodwill within the reporting unit is less than its carrying value. Fair values for reporting units are determined based primarily on the income approach, however where appropriate, the market approach or appraised values are also used. Definite-lived intangible assets such as purchased technology, non-compete agreements, and customer lists are reviewed at least quarterly to determine if any adverse conditions exist or a change in circumstances has occurred that would indicate impairment or a change in their remaining useful life. Indefinite lived intangible assets, such as tradenames, are evaluated for impairment by using the income approach.
The use of alternative valuation assumptions, including estimated cash flows and discount rates, and alternative estimated useful life assumptions could result in different purchase price allocations. Significant changes in these estimates and assumptions could impact the value of the assets and liabilities recorded which would change the amount and timing of future intangible asset amortization expense.
The Company makes certain estimates and assumptions that affect the determination of the expected future cash flows from reporting units for its goodwill impairment testing. These include sales growth, cost of capital, and projections of future cash flows. The fair value exceeded the reporting units’ value for the Company’s 2011 goodwill impairment test by a range of approximately 27% to 67%. Significant changes in these estimates and assumptions could create future impairment losses to goodwill.
For indefinite lived assets, such as tradenames, the Company makes certain estimates of revenue streams, royalty rates and other future benefits. Significant changes in these estimates could create future impairments of these indefinite lived intangible assets.
Estimation of the useful lives of definite-lived intangible assets requires significant management judgment. Events could occur that would materially affect the estimates of the useful lives. Significant changes in these estimates and assumptions could change the amount of future amortization expense or could create future impairments of these definite-lived intangible assets.
A 1% change in the amortization of our intangible assets would have an immaterial impact on net income and earnings per diluted share. As of June 30, 2011 the Company has $51.3 million of intangible assets recorded on our balance sheet representing 20% of total assets. This includes $6.0 million of amortizing intangible assets, $3.0 million of indefinite lived intangible assets and $42.4 million of goodwill.
Liquidity and Capital Resources
Net cash provided by operations for the years ended June 30, 2011, 2010 and 2009 was $24.9 million, $28.1 million and $28.4 million, respectively. The positive cash flow from operations in fiscal 2011 was due to the profit before depreciation and amortization of $10.3 million and equity based compensation expense of $4.1 million amounting to $30.8 million. This amount was partially offset by increases in inventory and accounts receivable of $2.4 and $1.8 million, respectively, due to the increased business levels in the second half of the year as well as an additional $1.7 million used to fund changes in other operating assets and liabilities. The positive cash flow from operations in fiscal 2010 was due to profit before depreciation and amortization of $10.2 million and equity based compensation expense of $3.8 million totaling $27.7 million. This amount was further enhanced by a decrease in inventory of $3.9 million, which was partially off-set by a net increase in receivables of $4.7 million. The positive cash flow from operations in fiscal 2009 was due to income before depreciation and amortization of $9.8 million and equity based compensation of $4.0 million totaling $23.7 million. This amount was further enhanced by a combined decrease in inventory and accounts receivable of $7.9 million which was partially offset by a $2.8 million pay down of accounts payable.
29
Net cash used in investing activities in fiscal 2011 was $7.1 million consisted of funds used to pay for capital additions of $7.1 million, while funds from and maturities and used for purchases of investment securities offset. Net cash used in investing activities in fiscal 2010 was $13.1 million and consisted of $8.5 million from the net purchase of marketable debt securities and $4.9 million used to pay for capital additions. Net cash used in investing activities in fiscal 2009 was $35.7 million and consisted of net maturities of marketable debt securities of $19.3 million, net of capital expenditures of $6.8 million and payments of $48.2 million used to purchase MSK and Unicircuit in the first quarter of that fiscal year. Capital expenditures in fiscal 2012 are expected to range between 4% and 5% of net sales, all of which will be funded from expected cash flows from operations.
Net cash used in financing activities in fiscal 2011 was $10.5 million and consisted of $10.0 million used to pay long-term debt and $4.4 million used to purchase approximately 261,000 treasury shares, net of $3.9 million generated by cash receipts and tax benefits from the exercise of stock options. Net cash used in financing activities in fiscal 2010 was $14.4 million and consisted of $9.8 million used to pay long-term debt and $7.9 million used to purchase approximately 560,000 treasury shares, net of $3.3 million generated by cash receipts and tax benefits from the exercise of stock options. Net cash provided by financing activities in fiscal 2009 was $46.4 million and consisted of $2.7 million received from the exercise of stock options and borrowings of $49.8 million under the Company’s revolving declining line of credit to finance the acquisitions of M S Kennedy and Unicircuit, net of $1.2 million used to pay off an acquired mortgage and $5.0 million used to purchase 471,000 treasury shares.
The Company expects to continue to purchase shares of its common stock in the open market and/or through private negotiated transactions under the current Board authorization, depending on market conditions. At June 30, 2011, there were approximately 1.26 million shares remaining under the current Board repurchase authorization.
At June 30, 2011, the Company had approximately $81.1 million in cash, cash equivalents, and marketable securities and has had positive operating cash flow for over twelve consecutive years. The Company believes that its cash requirements, including cash requirements for capital expenditures for the foreseeable future will be satisfied by currently invested cash balances, expected cash flows from operations and its newly secured line of credit.
At June 30, 2011, as a result of the rise in the stock market over the past 12 months, the assets in the Company’s defined benefit pension plan have increased approximately 12% from July 1, 2007 when the plan was considered to be fully funded. Due to the overall decline in the stock market from 2007 to present, the Company was required to make a $0.1 million deposit into the plan by March 15, 2009 to meet the 92% funding requirement for the July 1, 2008 measurement date and made an additional contributions of approximately $0.6 million and $0.3 million by March 2010 and 2011, respectively, to meet the funding requirement for the July 1, 2009 and 2010 measurement date valuations. Despite the partial recovery in the market in fiscal 2011, it is likely that the Company will have to make additional contributions of approximately $1.0 million to the Pension Plan by March 2012 to meet the current required funding standards as of July 1, 2011. It is expected that the net periodic pension benefit cost will be approximately $0.8 million in fiscal 2012.
At June 30, 2011, the Company had $30.0 million outstanding under its note of which $10.0 million was repayed on July 29, 2011. The Company made this payment from its currently available cash balances in July 2011. Availability of credit under the line declines 20% annually on the anniversary date of the note and any outstanding principal balance in excess of the new line limit is due and payable at that time.
Off-Balance Sheet Arrangements
The Company has no off-balance sheet arrangements within the meaning of Item 303(a) (4) of Reg S-K, other than operating leases which do not represent a significant cost to the Company.
30
Disclosures About Contractual Obligations and Commercial Commitments
Accounting standards require disclosure concerning the Company's obligations and commitments to make future payments under contracts, such as debt and lease agreements, and under contingent commitments, such as debt guarantees. The Company's obligations and commitments are as follows:
| (amounts in thousands) | Payment Due by Period | |||||||||||||||||||
| Total |
Less
Than 1 Year
|
1 - 3 Years | 3 - 5 Years |
More Than
5 Years
|
||||||||||||||||
| Contractual Obligations | ||||||||||||||||||||
| Contractual obligations | ||||||||||||||||||||
|
Debt and Interest Payments
|
$ | 30,423 | $ | 10,271 | $ | 20,152 | $ | - | $ | - | ||||||||||
|
Operating Lease Obligations
|
1,923 | 547 | 1,016 | 320 | 40 | |||||||||||||||
|
Other Long-Term Liabilities(1)
|
399 | 65 | 130 | 130 | 74 | |||||||||||||||
|
Pension Benefits
|
7,993 | 660 | 1,371 | 1,467 | 4,495 | |||||||||||||||
|
Total
|
$ | 40,738 | $ | 11,543 | $ | 22,669 | $ | 1,917 | $ | 4,609 | ||||||||||
The unrecognized tax benefits that are recorded in other long-term liabilities in the Company's condensed consolidated balance sheet are not anticipated to be paid within one year of the balance sheet date; and the time period for when a cash payout on these unrecognized tax benefits cannot be anticipated or estimated do to the uncertainty and as such are not included in the above table.
|
(1)
|
Deferred Compensation
|
Recent Accounting Pronouncements
In October 2009, new accounting guidance was issued related to the accounting for revenue recognition from arrangement with multiple deliverables. This guidance removes the “objective-and-reliable-evidence-of-fair-value” criterion from the separation criteria used to determine whether an arrangement involving multiple deliverables contains more than one unit of accounting, replaces references to “fair value” with “selling price” to distinguish from the fair value measurements required under the “Fair Value Measurements and Disclosures” guidance, provides a hierarchy that entities must use to estimate the selling price, eliminates the use of the residual method for allocation, and expands the ongoing disclosure requirements. This update is effective for the Company beginning July 1, 2011 and can be applied prospectively or retrospectively. Management does not think that this guidance will significantly affect the way the Company currently reports revenue on the Company’s consolidated financial statements when it becomes effective in 2012.
In June 2011, the FASB issued an Accounting Standard Update (“ASU”), bringing amendments to how other comprehensive income (OCI) is presented in the financial statements. This update outlines that OCI and its components cannot be reported in the Company’s consolidated statements of changes in stockholders’ equity. This guidance is effective from the beginning of the Company’s 2013 fiscal year. This update will not have a material impact to the Company and the Company will comply with the OCI disclosure changes required by the update.
Item 7A. Quantitative and Qualitative Disclosures About Market Risk
The following discusses the Company's possible exposure to market risk related to changes in interest rates, equity prices and foreign currency exchange rates. This discussion contains forward-looking statements that are subject to risks and uncertainties. Results could differ materially from those anticipated in these forward-looking statements as a result of various factors, including factors described elsewhere in this Annual Report on Form 10-K.
As of June 30, 2011, the Company had cash, cash equivalents and marketable securities of $81.1 million, all of which consisted of highly liquid investments in marketable debt securities. The marketable debt securities at date of purchase normally have maturities between one and 36 months, are exposed to interest rate risk and will decrease in value if market interest rates increase. A hypothetical decrease in market interest rate of 10.0% from June 30, 2011 rates, or 0.11%, would have reduced net income and cash flow by approximately $25,000, or $0.0017 per diluted share of common stock for the year. Due to the relatively short maturities of these securities and the Company’s ability to hold those investments to maturity, we do not believe that an immediate decrease in interest rates would have a material effect on our financial condition or results of operations. Over time, however, declines in interest rates will reduce the Company's interest income.
31
As of June 30, 2011, the Company had $30.0 million in outstanding debt under its revolving line of credit with Keybank. The line consists of a $50.0 million revolving credit note (See note 7 of the Financial Statements) for which principal amounts are due on July 31, 2011, and on each anniversary date thereafter through July 31, 2013. Borrowings under the Note, at the Company's choice, bear interest at LIBOR, plus 100 to 425 basis points or at the Keybank’s prime rate, minus (100) to plus 225 basis points, depending upon the Company's EBITDA performance at the end of each quarter as measured by the formula: EBITDA divided by the Current Portion of Long-term Debt plus interest expense. For the three months ended June 30, 2011, the weighted average interest rate on the outstanding borrowings was 1.3%. Interest expense for these borrowings is exposed to interest rate risk and will increase if market interest rates rise. A hypothetical increase in market interest rate of 10.0% from June 30, 2011 rates, or 0.13%, would have reduced net income and cash flow by approximately $39,000, or $.0026 per diluted share for the year ending June 30, 2011.
Item 8. Financial Statements and Supplementary Data
The information required by this item 8, is incorporated herein by reference from the report of independent Registered Public Accounting Firm and from our consolidated financial statements, notes to consolidated financial statements and supplementary data: quarterly financial data (unaudited) Note (18) included in this Annual Report on Form 10-K in Part IV, Item 15. Exhibits and Financial Statements Schedules.
Item 9. Changes in and Disagreements with Accountants and Financial Disclosure
Not Applicable.
Item 9A. Controls and Procedures
A. Disclosure Controls and Procedures
An evaluation of the effectiveness of the design and operation of the Company’s disclosure controls and procedures (as defined in Rules 13a-15(e) and 15d-15(e) under the Securities Exchange Act of 1934, as amended (“Exchange Act”)) was carried out under the supervision and with the participation of the Company’s management, including the President and Chief Executive Officer and the Chief Financial Officer (“the Certifying Officers”) as of June 30, 2011. Based on that evaluation, the Certifying Officers concluded that the Company’s disclosure controls and procedures were effective to provide reasonable assurance that information required to be disclosed by the Company in reports filed or submitted under the Exchange Act is recorded, processed, summarized and reported within the time periods specified in SEC rules and forms, and is accumulated and communicated to management, including the principal executive officer and principal financial officer, as appropriate, to allow timely decisions regarding required disclosure.
B. Changes in Internal Control Over Financial Reporting
There were no changes in the Company’s internal control over financial reporting during the year ended June 30, 2011 to which this Annual Report Form 10-K relates that have materially affected, or are reasonably likely to materially affect, internal control over financial reporting.
32
C. Management’s Annual Report On Internal Control Over financial Reporting
Management of Anaren, Inc. is responsible for establishing and maintaining an adequate system of internal control over financial reporting (as defined in Rules 13a – 15(f) and 15d – 15(f)). This system is designed to provide reasonable assurance regarding the reliability of financial reporting and the preparation of financial statements for external purposes in accordance with U.S. generally accepted accounting principles.
The Company’s internal control over financial reporting includes those policies and procedures that (i) pertain to the maintenance of records that, in reasonable detail, accurately and fairly reflect the transactions and dispositions of the assets of the Company; (ii) provide reasonable assurance that transactions are recorded as necessary to permit preparation of financial statements in accordance with generally accepted accounting principles, and that receipts and expenditures of the Company are being made only in accordance with authorizations of management and directors of the Company; and (iii) provide reasonable assurance regarding prevention or timely detection of unauthorized acquisition, use, or disposition of the Company’s assets that could have a material effect on the financial statements.
Because of its inherent limitations, a system of internal control over financial reporting can provide only reasonable assurance and may not prevent or detect all misstatements. Further, because of changes in conditions, effectiveness of internal controls over financial reporting may vary over time. Our system contains self-monitoring mechanisms, and actions are taken to correct deficiencies as they are identified.
Management conducted an evaluation of the effectiveness of the system of internal control over financial reporting based on the framework in Internal Control — Integrated Framework issued by the Committee of Sponsoring Organizations of the Treadway Commission (COSO). Based on this evaluation, management concluded that the Company’s system of internal control over financial reporting was effective as of June 30, 2011. The Company reviewed the results of management’s assessment with the Audit Committee of the Board of Directors.
The effectiveness of the Company’s internal control over financial reporting has been independently assessed by Deloitte and Touche LLP, an independent registered public accounting firm, as stated in their attestation report which is included in Item 8 of this Form 10-K.
33
REPORT OF INDEPENDENT REGISTERED PUBLIC ACCOUNTING FIRM
To the Board of Directors and Stockholders of
Anaren, Inc.
East Syracuse, New York
We have audited the internal control over financial reporting of Anaren, Inc. and subsidiaries (the "Company") as of June 30, 2011, based on criteria established in Internal Control — Integrated Framework issued by the Committee of Sponsoring Organizations of the Treadway Commission. The Company's management is responsible for maintaining effective internal control over financial reporting and for its assessment of the effectiveness of internal control over financial reporting, included in the accompanying Management’s Annual Report on Internal Control Over Financial Reporting. Our responsibility is to express an opinion on the Company's internal control over financial reporting based on our audit.
We conducted our audit in accordance with the standards of the Public Company Accounting Oversight Board (United States). Those standards require that we plan and perform the audit to obtain reasonable assurance about whether effective internal control over financial reporting was maintained in all material respects. Our audit included obtaining an understanding of internal control over financial reporting, assessing the risk that a material weakness exists, testing and evaluating the design and operating effectiveness of internal control based on the assessed risk, and performing such other procedures as we considered necessary in the circumstances. We believe that our audit provides a reasonable basis for our opinion.
A company's internal control over financial reporting is a process designed by, or under the supervision of, the company's principal executive and principal financial officers, or persons performing similar functions, and effected by the company's board of directors, management, and other personnel to provide reasonable assurance regarding the reliability of financial reporting and the preparation of financial statements for external purposes in accordance with generally accepted accounting principles. A company's internal control over financial reporting includes those policies and procedures that (1) pertain to the maintenance of records that, in reasonable detail, accurately and fairly reflect the transactions and dispositions of the assets of the company; (2) provide reasonable assurance that transactions are recorded as necessary to permit preparation of financial statements in accordance with generally accepted accounting principles, and that receipts and expenditures of the company are being made only in accordance with authorizations of management and directors of the company; and (3) provide reasonable assurance regarding prevention or timely detection of unauthorized acquisition, use, or disposition of the company's assets that could have a material effect on the financial statements.
Because of the inherent limitations of internal control over financial reporting, including the possibility of collusion or improper management override of controls, material misstatements due to error or fraud may not be prevented or detected on a timely basis. Also, projections of any evaluation of the effectiveness of the internal control over financial reporting to future periods are subject to the risk that the controls may become inadequate because of changes in conditions, or that the degree of compliance with the policies or procedures may deteriorate.
In our opinion, the Company maintained, in all material respects, effective internal control over financial reporting as of June 30, 2011, based on the criteria established in Internal Control — Integrated Framework issued by the Committee of Sponsoring Organizations of the Treadway Commission.
We have also audited, in accordance with the standards of the Public Company Accounting Oversight Board (United States), the consolidated financial statements as of and for the year ended June 30, 2011 of the Company and our report dated August 11, 2011 expressed an unqualified opinion on those financial statements.
/s/ Deloitte & Touche LLP
Rochester, New York
August 11, 2011
34
Item 9B. Other Information
Not Applicable.
PART III
Item 10. Directors, Executive Officers and Corporate Governance
Except for the information under the heading “Executive Officers of the Company” in Part I, Item 1 of this Annual Report on Form 10-K, which is incorporated by reference in this item and the information about our Code of Ethics and Business Conduct below, the information required by this Item 10 is incorporated by reference from our definitive proxy statement to be filed with the Securities and Exchange Commission in connection with the Annual Meeting of Shareholders to be held on November 3, 2011, which will be filed within 120 days of the end of our fiscal year ended June 30, 2011 (the “2011 Proxy Statement”).
Our Board of Directors adopted Anaren's Code of Ethics and Business Conduct (Code), which outlines the ethical principles that provide the foundation for the Company's dealings with customers, suppliers, shareholders, the investment community and employees. The Code is applicable to all employees including executive officers, and to the Company's directors. The Code, as revised , has been distributed to all employees and is publically available for review on the Company's website, www.anaren.com under Investors/Governance. If the Company makes any substantive amendments to the Code or grants any waiver, including any implicit waiver, from a provision of the Code to an executive officer, the Company will disclose the nature of the amendment or waiver on its website at www.anaren.com under Investors/Governance.
Item 11. Executive Compensation
Information required by this Item is incorporated by reference to the 2011 Proxy Statement.
Item 12. Security Ownership of Certain Beneficial Owners and Management and Related Stockholder Matters
Information required by this Item is incorporated by reference to the Company’s definitive proxy statement to be filed with the Securities and Exchange Commission no later than 40 days before the Annual Meeting of Shareholders to be held on November 3, 2011.
Securities Authorized for Issuance under The 2004 Comprehensive Long Term Incentive Plan, as amended
The number of securities to be issued upon the exercise of stock options under the Company’s equity compensation plans, the weighted average exercise price of the options and the number of securities remaining for future issuance as of June 30, 2011 are as follows.
| (a) | (b) | (c) | ||||||||||
|
Plan category
|
Number of securities to be issued upon exercise of outstanding options, warrants and rights
|
Weighted-average exercise price of outstanding options, warrants and rights
|
Number of securities remaining available for future issuance under equity compensation plans (excluding securities reflected in column (a))
|
|||||||||
|
Equity compensation plans approved by security holders
|
1,207,000 | $ | 14.50 | 1,127,000 | ||||||||
|
Equity compensation plans not approved by security holders
|
____
|
____
|
____
|
|||||||||
|
Total
|
1,207,000 | $ | 14.50 | 1,127,000 | ||||||||
Item 13. Certain Relationships and Related Transactions, and Director Independence
Information required by this Item is incorporated by reference to the 2011 Proxy Statement.
Item 14. Principal Accounting Fees and Services
Information required by this Item is incorporated by reference to the 2011 Proxy Statement.
35
PART IV
Item 15. Exhibits Financial Statement Schedules.
(a) The following documents are filed as part of this Annual Report on Form 10-K:
1. Financial Statements
|
Page
|
||
|
Report of Independent Registered Public Accounting Firm
|
40
|
|
|
Consolidated Balance Sheets as of June 30, 2011 and 2010
|
41
|
|
|
Consolidated Statements of Income for the years ended June 30, 2011, 2010 and 2009
|
42
|
|
|
Consolidated Statements of Stockholders’ Equity and Comprehensive Income for the years ended June 30, 2011, 2010 and 2009
|
43
|
|
|
Consolidated Statements of Cash Flows for the years ended June 30, 2011, 2010 and 2009
|
44
|
|
|
Notes to Consolidated Financial Statements
|
45 - 64
|
2. Financial Statement Schedules
None
3. Exhibits Required by Item 601 of Regulation S-K
The exhibits listed in the accompanying Index to Exhibits are filed or incorporated herein by reference as part of this Annual Report on Form 10K.
36
Pursuant to the requirements of Section 13 or 15 (d) of the Securities Exchange Act of 1934, the registrant has duly caused this report to be signed on its behalf by the undersigned, thereunto duly authorized.
| ANAREN, INC. | |||
| /s/ LAWRENCE A. SALA | |||
| Name: Lawrence A. Sala | |||
| Title: President and Chief Executive Officer | |||
Date: August 11, 2011
Pursuant to the requirements of the Securities Exchange Act of 1934, this report has been signed below by the following persons on behalf of the Registrant and in the capacities and on the dates indicated.
|
Signature
|
Title
|
Date
|
||
|
/s/ Lawrence A. Sala
Lawrence A. Sala
|
President, Chief Executive Officer and Chairman of the Board, Director (Principal Executive Officer)
|
August 11, 2011
|
||
|
/s/ George A. Blanton
George A. Blanton
|
Sr. Vice President , Chief Financial Officer, Treasurer (Principal Financial Officer)
|
August 11, 2011
|
||
|
/s/ Carl W. Gerst, Jr.
Carl W. Gerst, Jr.
|
Chief Technical Officer, Vice Chairman of the Board and Director
|
August 11, 2011
|
||
|
/s/ Dale F. Eck
Dale F. Eck
|
Director
|
August 11, 2011
|
||
|
/s/ Matthew S. Robison
Matthew S. Robison
|
Director
|
August 11, 2011
|
||
|
/s/ David L. Wilemon
David L. Wilemon
|
Director
|
August 11, 2011
|
||
|
/s/ James G. Gould
James G. Gould
|
Director
|
August 11, 2011
|
||
|
/s/ Robert U. Roberts
Robert U. Roberts
|
Director
|
August 11, 2011
|
||
|
/s/ John L. Smucker
John L. Smucker
|
Director
|
August 11, 2011
|
||
|
/s/ Patricia T. Civil
Patricia T. Civil
|
Director
|
August 11, 2011
|
||
|
/s/ Louis J. De Santis
Louis J. De Santis
|
Director
|
August 11, 2011
|
37
ANAREN, INC.
Consolidated Financial Statements
June 30, 2011 and 2010
(With Report of Independent Registered Public Accounting Firm Thereon)
38
ANAREN, INC.
Index
|
The following documents are filed as part of this report:
|
Page
|
|
Report of Independent Registered Public Accounting Firm
|
40
|
|
Consolidated Balance Sheets as of June 30, 2011 and 2010
|
41
|
|
Consolidated Statements of Income for the years ended June 30, 2011, 2010 and 2009
|
42
|
|
Consolidated Statements of Stockholders’ Equity and Comprehensive Income for the years ended June 30, 2011, 2010 and 2009
|
43
|
|
Consolidated Statements of Cash Flows for the years ended June 30, 2011, 2010 and 2009
|
44
|
|
Notes to Consolidated Financial Statements
|
45 - 64
|
39
REPORT OF INDEPENDENT REGISTERED PUBLIC ACCOUNTING FIRM
To the Board of Directors and Stockholders of
Anaren, Inc.
East Syracuse, New York
We have audited the accompanying consolidated balance sheets of Anaren, Inc. and subsidiaries (the "Company") as of June 30, 2011 and 2010, and the related consolidated statements of income, stockholders' equity and comprehensive income, and cash flows for each of the three years in the period ended June 30, 2011. These financial statements are the responsibility of the Company's management. Our responsibility is to express an opinion on the financial statements based on our audits.
We conducted our audits in accordance with the standards of the Public Company Accounting Oversight Board (United States). Those standards require that we plan and perform the audit to obtain reasonable assurance about whether the financial statements are free of material misstatement. An audit includes examining, on a test basis, evidence supporting the amounts and disclosures in the financial statements. An audit also includes assessing the accounting principles used and significant estimates made by management, as well as evaluating the overall financial statement presentation. We believe that our audits provide a reasonable basis for our opinion.
In our opinion, such consolidated financial statements present fairly, in all material respects, the financial position of Anaren, Inc. and subsidiaries at June 30, 2011 and 2010, and the results of their operations and their cash flows for each of the three years in the period ended June 30, 2011 in conformity with accounting principles generally accepted in the United States of America.
We have also audited, in accordance with the standards of the Public Company Accounting Oversight Board (United States), the Company's internal control over financial reporting as of June 30, 2011, based on the criteria established in Internal Control—Integrated Framework issued by the Committee of Sponsoring Organizations of the Treadway Commission and our report dated August 11, 2011 expressed an unqualified opinion on the Company's internal control over financial reporting.
/s/ Deloitte & Touche LLP
Rochester, New York
August 11, 2011
40
|
ANAREN, INC.
|
||||||||
|
Consolidated Balance Sheets
|
||||||||
|
June 30, 2011 and 2010
|
||||||||
|
(in thousands, except per share amounts)
|
||||||||
|
2011
|
2010
|
|||||||
|
ASSETS
|
||||||||
|
Assets:
|
||||||||
|
Cash and cash equivalents
|
$ | 58,388 | $ | 50,521 | ||||
|
Securities held to maturity
|
9,314 | 2,334 | ||||||
|
Receivables, less allowances of $380 and $375 in 2011 and 2010, respectively
|
30,931 | 29,124 | ||||||
|
Inventories
|
33,733 | 31,361 | ||||||
|
Prepaid expenses and other current assets
|
3,769 | 2,916 | ||||||
|
Deferred income taxes
|
2,351 | 1,955 | ||||||
|
Total current assets
|
138,486 | 118,211 | ||||||
|
Securities available-for-sale
|
- | 1,051 | ||||||
|
Securities held to maturity
|
13,441 | 19,756 | ||||||
|
Other assets
|
1,741 | 1,031 | ||||||
|
Property, plant, and equipment, net
|
47,627 | 48,711 | ||||||
|
Goodwill
|
42,389 | 42,435 | ||||||
|
Other intangible assets, net of accumulated amortization
|
8,961 | 10,153 | ||||||
|
Total assets
|
$ | 252,645 | $ | 241,348 | ||||
|
LIABILITIES AND STOCKHOLDERS' EQUITY
|
||||||||
|
Liabilities and Shareholders’ Equity:
|
||||||||
|
Current installments of long-term debt obligation
|
$ | 10,000 | $ | 10,000 | ||||
|
Accounts payable
|
9,535 | 9,271 | ||||||
|
Accrued expenses
|
6,340 | 5,661 | ||||||
|
Customer advance payments
|
222 | 888 | ||||||
|
Other current liabilities
|
2,290 | 2,920 | ||||||
|
Total current liabilities
|
28,387 | 28,740 | ||||||
|
Deferred income taxes
|
1,901 | 726 | ||||||
|
Pension and postretirement benefit obligation
|
5,715 | 7,083 | ||||||
|
Long-term debt obligation
|
20,000 | 30,000 | ||||||
|
Other liabilities
|
1,538 | 1,873 | ||||||
|
Total liabilities
|
57,541 | 68,422 | ||||||
|
Commitments and contingencies (notes 16 and 17)
|
||||||||
|
Stockholders' Equity:
|
||||||||
|
Common stock, $0.01 par value. Authorized 200,000 shares; issued 28,972 and 28,506 at June 30, 2011 and 2010, respectively
|
288 | 285 | ||||||
|
Additional paid-in capital
|
214,179 | 206,193 | ||||||
|
Retained earnings
|
134,512 | 118,111 | ||||||
|
Accumulated other comprehensive loss
|
(603 | ) | (2,813 | ) | ||||
|
Total stockholders’ equity before treasury stock
|
348,376 | 321,776 | ||||||
|
Less 14,072 and 13,811 treasury shares at June 30, 2011 and 2010, respectively, at cost
|
153,272 | 148,850 | ||||||
|
Total stockholders' equity
|
195,104 | 172,926 | ||||||
|
Total liabilities and stockholders' equity
|
$ | 252,645 | $ | 241,348 | ||||
|
See accompanying notes to consolidated financial statements
|
||||||||
41
|
Consolidated Statements of Income
|
||||||||||||
|
Years ended June 30, 2011, 2010 and 2009
|
||||||||||||
|
(in thousands, except per share amounts)
|
||||||||||||
|
2011
|
2010
|
2009
|
||||||||||
|
Net Sales
|
$ | 179,170 | $ | 168,789 | $ | 166,905 | ||||||
|
Cost of Sales
|
111,264 | 106,512 | 112,289 | |||||||||
|
Gross profit
|
67,906 | 62,277 | 54,616 | |||||||||
|
Operating Expenses:
|
||||||||||||
|
Marketing
|
10,592 | 9,671 | 8,967 | |||||||||
|
Research and development
|
16,765 | 14,782 | 12,986 | |||||||||
|
General and administrative
|
19,299 | 19,040 | 18,636 | |||||||||
|
Total operating expenses
|
46,656 | 43,493 | 40,589 | |||||||||
|
Operating income
|
21,250 | 18,784 | 14,027 | |||||||||
|
Other income (expense):
|
||||||||||||
|
Interest expense
|
(498 | ) | (590 | ) | (1,482 | ) | ||||||
|
Other income
|
1,174 | 368 | 1,088 | |||||||||
|
Total other income (expense), net
|
676 | (222 | ) | (394 | ) | |||||||
|
Income from operations before income taxes
|
21,926 | 18,562 | 13,633 | |||||||||
|
Income tax expense
|
5,525 | 4,850 | 3,774 | |||||||||
|
Net income
|
$ | 16,401 | $ | 13,712 | $ | 9,859 | ||||||
|
Basic earnings per share:
|
$ | 1.17 | $ | 0.98 | $ | 0.71 | ||||||
|
Diluted earnings per share:
|
$ | 1.11 | $ | 0.94 | $ | 0.70 | ||||||
|
Weighted average common shares
Outstanding:
|
||||||||||||
|
Basic
|
13,988 | 14,010 | 13,911 | |||||||||
|
Diluted
|
14,746 | 14,537 | 14,179 | |||||||||
|
See accompanying notes to consolidated financial statements
|
||||||||||||
42
|
ANAREN, INC.
|
|||||||||||||||||||||||||
|
Consolidated Statements of Stockholders' Equity and Comprehensive Income
|
|||||||||||||||||||||||||
|
Years ended June 30, 2011, 2010 and 2009
|
|||||||||||||||||||||||||
|
(in thousands)
|
|||||||||||||||||||||||||
|
Comprehensive
Income (loss) |
Common
Stock
Amount |
Additional
Paid-in |
Retained
Earnings |
Accumulated
Other |
Treasury
Stock |
Total
Stockholders’ |
||||||||||||||||
|
Balance at July 1, 2008
|
$ | 274 | $ | 192,314 | $ | 94,540 | $ | (344 | ) | $ | (135,920 | ) | $ | 150,864 | ||||||||
|
Comprehensive income:
|
||||||||||||||||||||||
|
Net income
|
$ | 9,859 | - | - | 9,859 | - | - | 9,859 | ||||||||||||||
|
Other comprehensive loss:
|
||||||||||||||||||||||
|
Foreign currency translation adjustment
|
34 | - | - | - | - | - | - | |||||||||||||||
|
Minimum pension liability adjustment, net of tax of $970
|
(1,883 | ) | - | - | - | - | - | - | ||||||||||||||
|
Mark to market available-for-sale investments
|
(204 | ) | - | - | - | - | - | - | ||||||||||||||
|
Other comprehensive loss
|
(2,053 | ) | - | - | - | (2,053 | ) | - | (2,053 | ) | ||||||||||||
|
Total comprehensive income
|
$ | 7,806 | ||||||||||||||||||||
|
Purchase of treasury stock (471 shares)
|
- | - | - | - | (5,014 | ) | (5,014 | ) | ||||||||||||||
|
Exercise of stock options under the equity plans
|
3 | 3,074 | - | - | - | 3,077 | ||||||||||||||||
|
Issuance of restricted stock
|
3 | (3 | ) | - | ||||||||||||||||||
|
Tax benefit from exercise of stock options
|
- | 200 | - | - | - | 200 | ||||||||||||||||
|
Equity based compensation
|
- | 4,012 | - | - | - | 4,012 | ||||||||||||||||
|
Balance at June 30, 2009
|
$ | 280 | $ | 199,597 | $ | 104,399 | $ | (2,397 | ) | $ | (140,934 | ) | $ | 160,945 | ||||||||
|
Comprehensive income:
|
||||||||||||||||||||||
|
Net income
|
$ | 13,712 | - | - | 13,712 | - | - | 13,712 | ||||||||||||||
|
Other comprehensive loss:
|
||||||||||||||||||||||
|
Foreign currency translation adjustment
|
62 | - | - | - | - | - | - | |||||||||||||||
|
Minimum pension liability adjustment, net of tax of $247
|
(478 | ) | - | - | - | - | - | - | ||||||||||||||
|
Other comprehensive loss
|
(416 | ) | - | - | - | (416 | ) | - | (416 | ) | ||||||||||||
|
Total comprehensive income
|
$ | 13,296 | ||||||||||||||||||||
|
Purchase of treasury stock (560 shares)
|
- | - | - | - | (7,916 | ) | (7,916 | ) | ||||||||||||||
|
Exercise of stock options under the equity plans
|
2 | 2,725 | - | - | - | 2,727 | ||||||||||||||||
|
Issuance of restricted stock
|
3 | (3 | ) | -- | ||||||||||||||||||
|
Tax benefit from exercise of stock options
|
- | 144 | - | - | - | 144 | ||||||||||||||||
|
Equity based compensation
|
- | 3,730 | - | - | - | 3,730 | ||||||||||||||||
|
Balance at June 30, 2010
|
$ | 285 | $ | 206,193 | $ | 118,111 | $ | (2,813 | ) | $ | (148,850 | ) | $ | 172,926 | ||||||||
|
Comprehensive income:
|
||||||||||||||||||||||
|
Net income
|
$ | 16,401 | - | - | 16,401 | - | - | 16,401 | ||||||||||||||
|
Other comprehensive loss:
|
||||||||||||||||||||||
|
Foreign currency translation adjustment
|
556 | - | - | - | - | - | - | |||||||||||||||
|
Mark to market available-for-sale investments
|
389 | - | - | - | - | - | - | |||||||||||||||
|
Minimum pension liability adjustment, net of tax of $652
|
1,265 | - | - | - | - | - | - | |||||||||||||||
|
Other comprehensive income
|
2,210 | - | - | - | 2,210 | - | 2,210 | |||||||||||||||
|
Total comprehensive income
|
$ | 18,611 | ||||||||||||||||||||
|
Purchase of treasury stock (261 shares)
|
- | - | - | - | (4,422 | ) | (4,422 | ) | ||||||||||||||
|
Exercise of stock options under the equity plans
|
3 | 3,725 | - | - | - | 3,728 | ||||||||||||||||
|
Tax benefit from exercise of stock options
|
- | 164 | - | - | - | 164 | ||||||||||||||||
|
Equity based compensation
|
- | 4,097 | - | - | - | 4,097 | ||||||||||||||||
|
Balance at June 30, 2011
|
$ | 288 | $ | 214,179 | $ | 134,512 | $ | (603 | ) | $ | (153,272 | ) | $ | 195,104 | ||||||||
See accompanying notes to consolidated financial statements.
43
|
ANAREN, INC.
|
||||||||||||
|
Consolidated Statements of Cash Flows
|
||||||||||||
|
Years ended June 30, 2011, 2010 and 2009
|
||||||||||||
|
(in thousands)
|
||||||||||||
|
2011
|
2010
|
2009
|
||||||||||
|
CASH FLOWS FROM OPERATING ACTIVITIES:
|
||||||||||||
|
Net income
|
$ | 16,401 | $ | 13,712 | $ | 9,859 | ||||||
|
Adjustments to reconcile net income to net cash provided by operating activities:
|
||||||||||||
|
Depreciation
|
8,337 | 8,716 | 8,400 | |||||||||
|
Loss on disposal of fixed assets
|
- | 262 | 64 | |||||||||
|
Amortization
|
1,935 | 1,471 | 1,425 | |||||||||
|
Deferred income taxes
|
119 | (1,582 | ) | (352 | ) | |||||||
|
Equity-based compensation
|
4,097 | 3,775 | 4,027 | |||||||||
|
Changes in operating assets and liabilities:
|
||||||||||||
|
Receivables
|
(1,807 | ) | (4,658 | ) | 5,056 | |||||||
|
Inventories
|
(2,372 | ) | 3,876 | 2,818 | ||||||||
|
Prepaid expenses and other current assets
|
(1,542 | ) | (325 | ) | (474 | ) | ||||||
|
Accounts payable
|
264 | 2,279 | (2,802 | ) | ||||||||
|
Accrued expenses
|
679 | 454 | 1,646 | |||||||||
|
Customer advance payments
|
(666 | ) | 770 | (1,381 | ) | |||||||
|
Other liabilities
|
(409 | ) | (510 | ) | (2,157 | ) | ||||||
|
Pension and postretirement benefit obligation
|
(105 | ) | (139 | ) | 2,268 | |||||||
|
Net cash provided by operating activities
|
24,931 | 28,101 | 28,397 | |||||||||
|
CASH FLOWS FROM INVESTING ACTIVITIES:
|
||||||||||||
|
Capital expenditures
|
(7,122 | ) | (4,841 | ) | (6,831 | ) | ||||||
|
Escrow claim received (payments made) related to the M. S.
Kennedy and Unicircuit acquisitions, net of cash acquired
|
- | 154 | (48,166 | ) | ||||||||
|
Proceeds from sale of property, plant, and equipment
|
- | 50 | - | |||||||||
|
Maturities of held to maturity and sale of available-for-sale securities
securities
|
3,511 | 12,755 | 22,459 | |||||||||
|
Purchases of held to maturity and available-for-sale securities
|
(3,478 | ) | (21,236 | ) | (3,130 | ) | ||||||
|
Net cash used in investing activities
|
(7,089 | ) | (13,118 | ) | (35,668 | ) | ||||||
|
CASH FLOWS FROM FINANCING ACTIVITIES:
|
||||||||||||
|
Payments on mortgage payable
|
- | - | (1,209 | ) | ||||||||
|
Proceeds from (payments on) note payable
|
(10,000 | ) | (9,800 | ) | 49,800 | |||||||
|
Stock options exercised
|
3,728 | 3,163 | 2,641 | |||||||||
|
Excess tax benefit from exercise of stock options
|
164 | 144 | 200 | |||||||||
|
Purchase of treasury stock
|
(4,422 | ) | (7,916 | ) | (5,014 | ) | ||||||
|
Net cash provided by (used in) financing activities
|
(10,530 | ) | (14,409 | ) | 46,418 | |||||||
|
Effect of exchange rates on cash
|
555 | 54 | 35 | |||||||||
|
Net increase in cash and cash equivalents
|
7,867 | 628 | 39,182 | |||||||||
|
Cash and cash equivalents, beginning of year
|
50,521 | 49,893 | 10,711 | |||||||||
|
Cash and cash equivalents, end of year
|
$ | 58,388 | $ | 50,521 | $ | 49,893 | ||||||
|
See accompanying notes to consolidated financial statements
|
||||||||||||
44
(1) Summary of Significant Accounting Policies:
Principles of Consolidation
The consolidated financial statements include the accounts of Anaren, Inc. and its wholly owned subsidiaries (the Company). Intercompany accounts and transactions have been eliminated.
Operations
The Company is engaged in the design, development, and manufacture of components, assemblies, and subsystems which receive, process, and transmit microwave and radio frequency (RF) signals. The Company is also a leading provider of complex mixed signal multi-layer printed circuit boards and high performance microelectronic power management products. The Company's products primarily service the wireless communications, space and defense electronics markets.
Revenue Recognition
Net sales are derived from sales of the Company’s products to other manufacturers or systems integrators. Net sales are recognized when there is persuasive evidence of an arrangement, delivery has occurred, the selling price is fixed or determinable, and collectability is reasonably assured which generally occurs when units are shipped.
Net sales under certain long-term contracts of the Space & Defense Group, many of which provide for periodic payments, are recognized under the percentage-of-completion method. Estimated manufacturing cost-at-completion for these contracts are reviewed on a routine periodic basis, and adjustments are made periodically to the estimated cost-at-completion, based on actual costs incurred, progress made, and estimates of the costs required to complete the contractual requirements. When the estimated manufacturing cost-at-completion exceeds the contract value, the contract is written down to its net realizable value, and the loss resulting from cost overruns is immediately recognized.
To properly match net sales with costs, certain contracts may have revenue recognized in excess of billings (unbilled revenues), and other contracts may have billings in excess of net sales recognized (billings in excess of contract costs). Under long-term contracts, the prerequisites for billing the customer for periodic payments generally involve the Company’s achievement of contractually specific, objective milestones (e.g., completion of design, testing, or other engineering phase, delivery of test data or other documentation, or delivery of an engineering model or flight hardware). The amount of unbilled accounts receivable at June 30, 2011 and 2010 is $1.7 million and $0.7 million, respectively.
An award or incentive fee is usually variable, based upon specific performance criteria stated in the contract. Award or incentive fees are recognized only upon achieving the contractual criteria and after the customer has approved or granted the award or incentive.
The allowance for sales returns is the Company’s best estimate of probable customer credits for returns of previously shipped products, and is based on historical rates of returns by customers.
Cash and Cash Equivalents
Cash and cash equivalents includes cash on hand and short-term cash investments that are highly liquid in nature and have original maturities of three months or less at the date acquired.
Marketable Securities
The Company classifies its securities as either available-for-sale or held to maturity, as the Company does not hold any securities considered to be trading. Held to maturity securities are those debt securities for which the Company has the positive intent and the ability to hold until maturity. All other securities not included in held to maturity are classified as available-for-sale. Management determines the appropriate classification of securities at the time of purchase and reevaluates such designation as of each balance sheet date.
Held to maturity securities are recorded at amortized cost adjusted for the amortization or accretion of premiums or discounts. Available-for-sale securities are recorded at fair value. Unrealized holding gains and losses, net of the related tax effect, on available-for-sale securities are excluded from earnings and are reported as accumulated other comprehensive income or loss until realized.
The Company invests its excess cash principally in municipal bonds, commercial paper, corporate bonds and notes, and U.S. government agency securities.
A decline in the fair value of any available-for-sale or held to maturity security, that is deemed other than temporary, is charged to earnings resulting in the establishment of a new cost basis for the security, and dividend and interest income are recognized when earned. The Company records its available-for-sale securities at market value through accumulated other comprehensive income (loss). The reduction in market value of the available-for-sale securities at June 30, 2010 was $0.4 million. As of June 30, 2011, there are no available-for-sale securities.
45
Trade Accounts Receivable
Trade accounts receivable are recorded at the invoiced amount and do not bear interest. The allowance for doubtful accounts is the Company’s best estimate of the amount of probable credit losses in the Company’s existing accounts receivable. The Company reviews its allowance for doubtful accounts monthly by reviewing balances over 90 days for collectability. Account balances are charged off against the allowance after all means of collection have been exhausted and the potential for recovery is considered remote. The Company does not have any off-balance-sheet credit exposure related to its customers.
Inventories
Inventories are stated at the lower of cost or market, cost being determined on a first-in, first-out basis. We record a provision for estimated obsolescence of inventory. Our estimates consider the cost of inventory, forecasted demand, the estimated market value, the shelf life of the inventory and our historical experience. Because of the subjective nature of this estimate, it is reasonably likely that circumstances may cause the estimate to change due to any of the factors described previously.
Warranty
The Company provides warranty policies on its products. In addition, the Company incurs costs to service our products in connection with specific product performance issues. Liability for product warranties is based upon expected future product performance and durability, and is estimated largely based upon historical experience. Adjustments are made to accruals as claim data and historical experience warrant. The changes in the carrying amount of product warranty reserves for the year ended June 30, 2011, are as follows:
| (amounts in thousands) | ||||
| Balance as of July 1, 2010 | $ | 320 | ||
| Additions | 503 | |||
| Costs incurred | (399 | ) | ||
| Adjustments | (147 | ) | ||
| Balance as of June 30, 2011 | $ | 277 | ||
Property, Plant, and Equipment
Property, plant, and equipment are stated at cost. Depreciation of land improvements and buildings is calculated by the straight-line method over an estimated service life of 25-30 years. Machinery and equipment, and furniture and fixtures are depreciated by the straight-line method based on estimated useful lives of 5 to 10 years. Leasehold improvements are depreciated over the remaining lives of the improvements or the lease term, whichever is shorter.
Goodwill and Tradenames
Goodwill represents the excess of purchase price over the fair value of the net tangible assets and identifiable intangible assets of businesses acquired. Tradenames represent the estimated fair value of corporate and product names acquired from the MSK and Unicircuit acquisitions, which will be utilized by the Company in the future.
Goodwill and tradenames are tested annually for impairment at the reporting unit level in the fourth quarter, using March 31, 2011 as the test date, of the Company’s fiscal year, or more frequently if there is an indication of an impairment, by comparing the fair value of the reporting unit with its carrying value. Valuation methods for determining the fair value of the reporting unit include reviewing quoted market prices and discounted cash flows. If the goodwill is indicated as being impaired, the fair value of the reporting unit is then allocated to its assets and liabilities in a manner similar to a purchase price allocation in order to determine the implied fair value of the reporting unit goodwill. This implied fair value of the reporting unit goodwill is then compared with the carrying amount of the reporting unit goodwill, and if it is less, the Company would then recognize an impairment loss. During 2011, 2010 and 2009, the Company did not record any impairments on its goodwill; and did not record any impairments on tradenames during fiscal 2011, 2010, and 2009.
Long-Lived Assets
The Company accounts for impairment and disposal of long-lived assets, excluding goodwill and tradenames, in accordance with the accounting rules relating to the impairment or disposal of long-lived assets. The rules set forth criteria to determine when a long-lived asset is held for sale and held for use. Such criteria specify that the asset must be available for immediate sale in its present condition subject only to terms that are usual and customary for sales of such assets. In addition, the sale of the asset must be probable, and its transfer expected to qualify for recognition as a completed sale, generally within one year. The rules require recognition of an impairment loss if the carrying amount of a long-lived asset is not recoverable from its undiscounted cash flows. An impairment loss is measured as the difference between the carrying amount and fair value of the asset. The Company evaluates its long-lived assets if impairment indicators arise. During 2011, 2010 and 2009, the Company did not record any impairment on its long-lived assets.
46
Foreign Currency Translation
The financial statements of the Company’s subsidiary in China have been translated into U.S. dollars in accordance with the foreign currency translation accounting rules. All balance sheet accounts have been translated using the exchange rates in effect at the balance sheet date. Income statement amounts have been translated using the average exchange rate for the year. The resulting cumulative translation adjustment of approximately $2.0 million and $1.5 million at June 30, 2011 and 2010, respectively, is reflected as accumulated other comprehensive income (loss), a component of stockholders’ equity.
Earnings Per Share
Basic earnings per share is based on the weighted average number of common shares outstanding. Diluted earnings per share is based on the weighted average number of common shares outstanding, as well as dilutive potential common shares which, in the Company’s case, comprise shares issuable under the stock option and restricted stock plans. The weighted average number of common shares utilized in the calculation of the diluted earnings per share does not include antidilutive shares aggregating 285,000, 1,071,000, and 792,000 at June 30, 2011, 2010 and 2009, respectively. The treasury stock method is used to calculate the dilutive shares which reduces the gross number of dilutive shares by the number of shares purchasable from the proceeds of the options assumed to be exercised.
The following table sets forth the computation of basic and diluted shares for use in the calculation of earnings per share as of June 30:
|
For the Years Ended
|
||||||||||||
| 2011 | 2010 | 2009 | ||||||||||
|
(amounts in thousands)
|
||||||||||||
|
Numerator:
|
||||||||||||
|
Earnings available to common stockholders
|
$ | 16,401 | $ | 13,712 | $ | 9,859 | ||||||
|
Denominator:
|
||||||||||||
|
Denominator for basic earnings per share outstanding
|
13,988 | 14,010 | 13,911 | |||||||||
|
Denominator for diluted earnings per share:
|
||||||||||||
|
Weighted average shares outstanding
|
13,988 | 14,010 | 13,911 | |||||||||
|
Common stock options and restricted stock
|
758 | 527 | 268 | |||||||||
|
Weighted average shares
|
14,746 | 14,537 | 14,179 | |||||||||
Equity Based Compensation
Option grants were valued using a Black-Scholes option valuation model. The assumptions include the risk-free rate of interest, expected dividend yield, expected volatility, and the expected term of the award. The risk-free rate of interest was based on the zero coupon U.S. Treasury bond rates appropriate for the expected term of the award. There are no expected dividends as the Company does not currently plan to pay dividends on its common stock. Expected stock price volatility was based on historical volatility levels of the Company’s common stock. The expected term is estimated by using the actual contractual term of the awards and the expected length of time for the employees to exercise the awards.
Research and Development Costs
Research and development costs are expensed as incurred. These costs are costs of salaries, support, benefits, and materials used in the research and development of new products or processes.
Restructuring.
Restructuring expense consists of severance, outplacement, and benefit costs associated with the termination of employees. Restructuring expense is recorded when the Company is obligated to pay the above mentioned amounts.
47
Income Taxes
The Company utilizes the asset and liability method of accounting for income taxes. Under this method, deferred tax assets and liabilities are recognized for the future tax consequences attributable to differences between the financial statement carrying amounts of existing assets and liabilities and their respective tax bases and tax credit carryforwards. Deferred tax assets and liabilities are measured using enacted tax rates. The effect on deferred tax assets and liabilities of a change in tax rates is recognized in income in the period that includes the enactment date.
The Company applies the accounting standards as it relates to accounting for uncertainty in income taxes which clarifies the accounting for uncertainty in income taxes recognized in an enterprise's financial statements. The accounting rules prescribe a recognition threshold and measurement attribute for the financial statement recognition and measurement of a tax position taken or expected to be taken on a tax return.
Cash Flow Supplemental Disclosure
|
For the Years Ended
|
||||||||||||
| 2011 | 2010 | 2009 | ||||||||||
|
(amounts in thousands)
|
||||||||||||
|
Cash paid during the year for:
|
||||||||||||
|
Interest
|
$ | 458 | $ | 711 | $ | 1,204 | ||||||
|
Taxes paid (net of refunds)
|
6,886 | 6,145 | 3,470 | |||||||||
|
Fair value of assets acquired, including cash acquired
|
$ | - | $ | - | $ | 59,884 | ||||||
|
Less – liabilities assumed
|
- | - | (8,832 | ) | ||||||||
|
Net assets acquired
|
- | - | 51,052 | |||||||||
|
Less – acquisition costs from fiscal 2008
|
- | - | (330 | ) | ||||||||
|
Less – cash acquired
|
- | - | (2,556 | ) | ||||||||
|
Net cash paid for purchases of businesses
|
$ | - | $ | - | $ | 48,166 | ||||||
Use of Estimates
The preparation of consolidated financial statements in conformity with U.S. generally accepted accounting principles (GAAP) requires management to make estimates and assumptions that affect the reported amounts of certain assets and liabilities and disclosure of contingent assets and liabilities at the date of the financial statements and the reported amounts of sales and expenses during the reporting period. Actual results could differ from those estimates. Significant estimates or assumptions are made in assessing the Company’s accounts receivable allowances, inventory reserves, warranty liability, pension and postretirement liabilities, and valuations of tangible and intangible assets.
Recent Accounting Pronouncements
In October 2009, new accounting guidance was issued related to the accounting for revenue recognition from arrangement with multiple deliverables. This guidance removes the “objective-and-reliable-evidence-of-fair-value” criterion from the separation criteria used to determine whether an arrangement involving multiple deliverables contains more than one unit of accounting, replaces references to “fair value” with “selling price” to distinguish from the fair value measurements required under the “Fair Value Measurements and Disclosures” guidance, provides a hierarchy that entities must use to estimate the selling price, eliminates the use of the residual method for allocation, and expands the ongoing disclosure requirements. This update is effective for the Company beginning July 1, 2011 and can be applied prospectively or retrospectively. Management does not think that this guidance will significantly affect the way the Company currently reports revenue on the Company’s consolidated financial statements when it becomes effective in fiscal 2012.
In June 2011, an Accounting Standard Update ASU, bringing amendments to how other comprehensive income (OCI) is presented in the financial statements. This update outlines that OCI and its components cannot be reported in the Company’s consolidated statements of changes in stockholders’ equity. This guidance is effective from the beginning of the Company’s 2013 fiscal year. This update will not have a material impact to the Company and the Company will remove the presentation of OCI from its consolidated statements of stockholders’ equity.
48
(2) Intangible Assets
The major components of intangible assets are as follows:
|
June 30, 2011
|
June 30, 2010
|
|||||||||||||||
|
Gross
|
Net
|
Gross
|
Net
|
|||||||||||||
|
Carrying
|
Carrying
|
Carrying
|
Carrying
|
|||||||||||||
|
(amounts in thousands)
|
Amount
|
Amount
|
Amount
|
Amount
|
||||||||||||
|
Amortizable intangible assets:
|
||||||||||||||||
|
Customer relationships (10 years)
|
$
|
7,530
|
$
|
5,346
|
$
|
7,530
|
$
|
6,099
|
||||||||
|
Developed technology (5 years)
|
780
|
325
|
780
|
481
|
||||||||||||
|
Non-competition agreements (4 years)
|
1,130
|
310
|
1,130
|
593
|
||||||||||||
|
Total
|
$
|
9,440
|
5,981
|
$
|
9,440
|
7,173
|
||||||||||
|
Nonamortizable intangible assets:
|
||||||||||||||||
|
Tradenames
|
2,980
|
2,980
|
||||||||||||||
|
Total
|
2,980
|
2,980
|
||||||||||||||
|
Total intangible assets
|
$
|
8,961
|
$
|
10,153
|
||||||||||||
Intangible asset amortization expense for the years ended June 30, 2011 and 2010 aggregated $1.2 million and in 2009 aggregated $1.1 million. Amortization expense related to developed technology is recorded in cost of sales, and amortization expense for non-compete agreements and customer relationships is recorded in general and administrative expense.
The following table represents the amortization expense for each of the five succeeding fiscal years and thereafter is as follows:
|
(amounts in thousands)
|
||||
|
2012
|
$
|
1,192
|
||
|
2013
|
937
|
|||
|
2014
|
766
|
|||
|
2015
|
753
|
|||
|
2016
|
753
|
|||
|
Thereafter
|
1,580
|
The changes in the carrying amount of goodwill for the years ended June 30, 2011 and 2010, are as follows:
|
(amounts in thousands)
|
||||
|
Balance, June 30, 2010
|
$ | 42,435 | ||
|
Tax adjustment resulting from acquisition
|
(46 | ) | ||
|
Balance, June 30, 2011
|
$ | 42,389 | ||
(3) Securities
The amortized cost and fair value of securities are as follows:
|
June 30, 2011
|
||||||||||||||||
|
(amounts in thousands)
|
Amortized
cost
|
Gross
unrealized
gains
|
Gross unrealized losses
|
Fair value
|
||||||||||||
|
Securities held to maturity:
|
||||||||||||||||
|
Municipal bonds
|
$ | 18,263 | $ | 57 | $ | - | $ | 18,320 | ||||||||
|
Corporate bonds
|
4,492 | 23 | - | 4,515 | ||||||||||||
|
Federal agency bonds
|
- | - | - | - | ||||||||||||
|
Total securities held to maturity
|
$ | 22,755 | $ | 80 | $ | - | $ | 22,835 | ||||||||
49
|
June 30, 2010
|
||||||||||||||||
|
(amounts in thousands)
|
Amortized
cost
|
Gross
unrealized
gains
|
Gross unrealized losses
|
Fair value
|
||||||||||||
|
Securities available-for-sale:
|
||||||||||||||||
|
Auction rate securities
|
$ | 1,440 | $ | - | $ | (389 | ) | $ | 1,051 | |||||||
|
Securities held to maturity:
|
||||||||||||||||
|
Municipal bonds
|
$ | 21,088 | $ | 353 | $ | - | $ | 21,441 | ||||||||
|
Corporate bonds
|
503 | 4 | - | 507 | ||||||||||||
|
Federal agency bonds
|
499 | 7 | - | 506 | ||||||||||||
|
Total securities held to maturity
|
$ | 22,090 | $ | 364 | $ | - | $ | 22,454 | ||||||||
Contractual maturities of marketable debt securities held to maturity at June 30 are summarized as follows:
| 2011 |
2010
|
|||||||||||||||
|
(amounts in thousands)
|
Cost
|
Fair
market
value
|
Cost
|
Fair
market
value
|
||||||||||||
|
Within one year
|
$ | 9,314 | $ | 9,326 | $ | 2,334 | $ | 2,379 | ||||||||
|
One year to three years
|
13,441 | 13,509 | 19,756 | 20,075 | ||||||||||||
|
Total
|
$ | 22,755 | $ | 22,835 | $ | 22,090 | $ | 22,454 | ||||||||
Contractual maturities of auction rate securities classified as available-for-sale at June 30 are summarized as follows:
| 2011 |
2010
|
|||||||||||||||
|
(amounts in thousands)
|
Cost
|
Fair
market
value
|
Cost
|
Fair
market
value
|
||||||||||||
|
One year to three years
|
$ | - | $ | - | $ | 1,440 | $ | 1,051 | ||||||||
The available-for-sale security was sold during the second quarter ended December 31, 2010. The amount received, based on the escrow agreement that was in place between the Company and M. S. Kennedy Corporation, was the security’s par value of $1.5 million.
(4) Fair Value Measurements
The carrying amount of financial instruments, including cash, trade receivables and accounts payable, approximated their fair value as of June 30, 2011 because of the short maturity of these instruments. Also, the Company’s carrying value for its revolving credit note approximates fair value.
The carrying value of cash equivalents are carried at cost, which approximates fair market value.
Valuations on certain instruments are prioritized into three broad levels as follows. Level 1 inputs are quoted prices (unadjusted) in active markets for identical assets or liabilities. Level 2 inputs are quoted prices for similar assets and liabilities in active markets, quoted prices for identical or similar assets in markets that are not active, inputs other than quoted prices that are observable for the asset or liability, including interest rates, yield curves and credit risks, or inputs that are derived principally from or corroborated by observable market data through correlation. Level 3 inputs are unobservable inputs based on our own assumptions used to measure assets and liabilities at fair value. A financial asset or liability’s classification is determined based on the lowest level input that is significant to the fair value measurement.
50
The following table provides the assets and liabilities carried at fair value as measured on a recurring basis as of June 30, 2011:
|
(amounts in thousands)
|
Level 1
|
Level 2
|
Level 3
|
Total Carrying
Value at
June 30, 2011
|
||||||||||||
|
|
||||||||||||||||
|
Cash equivalents
|
$ | 5,040 | $ | - | $ | - | $ | 5,040 | ||||||||
(5) Inventories
Inventories at June 30 are summarized as follows:
|
(amounts in thousands)
|
2011
|
2010
|
||||||
|
Raw Materials
|
$ | 18,021 | $ | 17,319 | ||||
|
Work in process
|
11,547 | 9,396 | ||||||
|
Finished goods
|
4,165 | 4,646 | ||||||
| $ | 33,733 | $ | 31,361 | |||||
(6) Property, Plant, and Equipment
Components of property, plant, and equipment at June 30 consist of the following:
|
(amounts in thousands)
|
2011
|
2010
|
||||||
|
Land and land improvements
|
$ | 5,167 | $ | 5,167 | ||||
|
Construction in process
|
1,777 | 1,451 | ||||||
|
Buildings, furniture, and fixtures
|
35,023 | 34,052 | ||||||
|
Machinery and equipment
|
67,902 | 62,267 | ||||||
| 109,869 | 102,937 | |||||||
|
Less accumulated depreciation
|
(62,242 | ) | (54,226 | ) | ||||
| $ | 47,627 | $ | 48,711 | |||||
(7) Debt
The following table summarizes the long-term debt of the Company as of June 30, 2011 and June 30, 2010:
|
June 30,
|
June 30,
|
|||||||
|
2011
|
2010
|
|||||||
|
(amounts in thousands)
|
||||||||
|
Revolving credit note
|
$
|
30,000
|
$
|
40,000
|
||||
|
Less current maturities
|
(10,000
|
)
|
(10,000
|
)
|
||||
|
Long-term debt, less current maturities
|
$
|
20,000
|
$
|
30,000
|
||||
The following table summarizes the payments to be made on the long-term debt of the Company for the next three fiscal years:
|
(amounts in thousands)
|
||||
|
2012
|
$
|
10,000
|
||
|
2013
|
$
|
10,000
|
||
|
2014
|
$
|
10,000
|
51
The Company’s current and long-term debt consists of a loan agreement with Keybank National Association. The loan agreement consists of a $50 million revolving credit note (“Note”), for which principal amounts are due on August 1, 2009, and on each anniversary date thereafter through July 31, 2013 in accordance with the above schedule. The Company made a payment of $10 million in July 2011. Availability of credit under the Note declines 20% annually on each anniversary date and any outstanding principal balance in excess of the credit availability is due and payable at that time. The Company’s indebtedness and obligations are guaranteed by three of the Company’s domestic subsidiaries, as well as, an assignment of the Company’s interest in its foreign subsidiary.
Borrowings under the Note, at the Company's choice, bear interest at LIBOR, plus 100 to 425 basis points, or at Keybank prime rate, minus (100) to plus 225 basis points, depending upon the Company's EBITDA performance at the end of each quarter as measured by the formula: EBITDA divided by the Current Portion of Long-term Debt plus interest expense. For the years ended June 30, 2011 and 2010, the weighted average interest rate on the outstanding borrowings was approximately 1.5% and 1.4%, respectively.
Borrowings under the Agreement are subject to operating covenants. The Company was in compliance with covenants as of June 30, 2011 and 2010.
(8) Accrued Expenses
Accrued expenses at June 30 consist of the following:
|
(amounts in thousands)
|
2011
|
2010
|
||||||
|
Compensation
|
$ | 4,724 | $ | 4,483 | ||||
|
Commissions
|
763 | 730 | ||||||
|
Health insurance
|
452 | 423 | ||||||
|
Restructuring
|
380 | - | ||||||
|
Other
|
21 | 25 | ||||||
| $ | 6,340 | $ | 5,661 | |||||
(9) Other Liabilities
Other liabilities as of June 30 consist of the following:
|
(amounts in thousands)
|
2011
|
2010
|
||||||
|
Deferred compensation
|
$ | 385 | $ | 425 | ||||
|
Supplemental retirement plan
|
759 | 670 | ||||||
|
Accrued lease
|
1,247 | 1,107 | ||||||
|
Warranty accrual
|
277 | 320 | ||||||
|
Income tax liability
|
404 | 1,610 | ||||||
|
Deferred grant income
|
375 | 375 | ||||||
|
Interest
|
99 | 131 | ||||||
|
Other
|
282 | 155 | ||||||
| 3,828 | 4,793 | |||||||
|
Less current portion
|
(2,290 | ) | (2,920 | ) | ||||
| $ | 1,538 | $ | 1,873 | |||||
(10) Stock-Based Compensation
The Company applies the fair-value recognition provisions of share-based payment accounting. This requires the Company to measure the cost of employee services received in exchange for equity awards based on the grant-date fair value of the awards. The cost is recognized as compensation expense on a straight-line basis over the requisite service period of the awards.
Total stock-based compensation expense recognized for the years ended June 30, 2011, 2010, and 2009, broken out by operating expense category, is as follows for the year ended:
52
|
June 30, 2011
|
||||||||||||
|
(amounts in thousands)
|
Stock
option
program
|
Restricted
stock
program
|
Total
stock-based
compensation
|
|||||||||
|
Cost of goods sold
|
$ | 130 | $ | 611 | $ | 741 | ||||||
|
Marketing
|
40 | 172 | 212 | |||||||||
|
Research and development
|
95 | 448 | 543 | |||||||||
|
General and administrative
|
172 | 2,429 | 2,601 | |||||||||
|
Net stock-based compensation expense
|
$ | 437 | $ | 3,660 | $ | 4,097 | ||||||
|
Amount of related income tax benefit
recognized in income
|
$ | 157 | $ | 1,318 | $ | 1,475 | ||||||
|
June 30, 2010
|
||||||||||||
|
(amounts in thousands)
|
Stock
option
program
|
Restricted
stock
program
|
Total
stock-based
compensation
|
|||||||||
|
Cost of goods sold
|
$ | 203 | $ | 368 | $ | 571 | ||||||
|
Marketing
|
83 | 150 | 233 | |||||||||
|
Research and development
|
236 | 428 | 664 | |||||||||
|
General and administrative
|
318 | 1,944 | 2,262 | |||||||||
|
Total cost of stock-based compensation
|
840 | 2,890 | 3,730 | |||||||||
|
Amounts expensed out of inventory for the year
|
16 | 29 | 45 | |||||||||
|
Net stock-based compensation expense
|
$ | 856 | $ | 2,919 | $ | 3,775 | ||||||
|
Amount of related income tax benefit
recognized in income
|
$ | 308 | $ | 1,051 | $ | 1,359 | ||||||
|
June 30, 2009
|
||||||||||||
|
(amounts in thousands)
|
Stock
option
program
|
Restricted
stock
program
|
Total
stock-based
compensation
|
|||||||||
|
Cost of goods sold
|
$ | 503 | $ | 388 | $ | 891 | ||||||
|
Marketing
|
157 | 133 | 290 | |||||||||
|
Research and development
|
321 | 248 | 569 | |||||||||
|
General and administrative
|
726 | 1,536 | 2,262 | |||||||||
|
Total cost of stock-based compensation
|
1,707 | 2,305 | 4,012 | |||||||||
|
Amounts expensed out of inventory for the year
|
9 | 6 | 15 | |||||||||
|
Net stock-based compensation expense
|
$ | 1,716 | $ | 2,311 | $ | 4,027 | ||||||
|
Amount of related income tax benefit
recognized in income
|
$ | 381 | $ | 1,211 | $ | 1,592 | ||||||
Stock Option Plans
In November 2004, the shareholders approved the amendment and restatement of the Company’s three existing stock option plans, which combined these plans under one single consolidated equity compensation plan, the Anaren, Inc. Comprehensive Long-Term Incentive Plan. The effect of the amendment and restatement was to combine the separate share pools available for grant under the three existing plans into a single grant pool, expand the type of equity-based awards the Company may grant, and extend the term of the combined plan to October 31, 2014. On June 30, 2011, the Company had 1,127,000 shares available for grant under the plan. No options have been issued under this plan during 2011, 2010, and 2009.
Information with respect to this plan is as follows:
53
|
(in thousands, except per share amounts)
|
Total
shares
|
Option
price
|
Weighted
average
exercise price
|
|||||||||
|
Outstanding at June 30, 2009
|
1,869 | $ | 9.51 to 53.00 | $ | 17.45 | |||||||
|
Exercised
|
(219 | ) |
9.51 to 15.00
|
12.44 | ||||||||
|
Expired
|
(15 | ) |
12.05 to 53.00
|
23.15 | ||||||||
|
Forfeited
|
(1 | ) |
11.97 to 19.56
|
16.52 | ||||||||
|
Outstanding at June 30, 2010
|
1,634 | $ | 9.51 to 53.00 | $ | 18.84 | |||||||
|
Exercised
|
(267 | ) |
9.51 to 19.56
|
19.29 | ||||||||
|
Expired
|
(159 | ) |
14.05 to 53.00
|
51.80 | ||||||||
|
Forfeited
|
(1 | ) | 19.56 | 19.56 | ||||||||
|
Outstanding at June 30, 2011
|
1,207 | $ | 9.51 to 21.15 | $ | 14.50 | |||||||
|
Shares exercisable at June 30, 2011
|
1,181 | $ | 9.51 to 21.15 | $ | 14.39 | |||||||
The following table summarizes significant ranges of outstanding and exercisable options at June 30, 2011 (in thousands, except per share amounts):
|
Options outstanding
|
Options exercisable
|
|||||||||||||
|
Range of
exercise
prices
|
Shares
|
Weighted
average
remaining
life in years
|
Weighted
Average
Exercise
price
|
Shares
|
Weighted
average
exercise
price
|
|||||||||
|
|
$9.51 - $13.00
|
365
|
2.4
|
$
|
11.09
|
365
|
$
|
11.09
|
||||||
|
13.01 – 16.00
|
582
|
2.7
|
14.48
|
582
|
14.48
|
|||||||||
|
16.01 – 21.15
|
260
|
3.3
|
19.49
|
234
|
19.48
|
|||||||||
|
1,207
|
1,181
|
|||||||||||||
Nonvested Shares Issued Under the Plan
| (amounts in thousands) |
Number
of
shares
|
Weighted-average
share price
|
||||||
|
Nonvested at June 30, 2010
|
110 | $ | 16.78 | |||||
|
Granted
|
- | - | ||||||
|
Forfeited
|
(1 | ) | 19.56 | |||||
|
Vested
|
(83 | ) | 16.81 | |||||
|
Nonvested at June 30, 2011
|
26 | $ | 19.56 |
The compensation expense, as determined on respective grant dates using a Black-Scholes option valuation model, was recognized in fiscal year 2011. The aggregate intrinsic value of both vested and unvested options outstanding are $7.9 million, at June 30, 2011.
Share activity and value for the years ending:
|
June 30,
|
||||||||||||
|
(amounts in thousands)
|
2011
|
2010
|
2009
|
|||||||||
|
Forfeited or expired options
|
160 | 16 | 110 | |||||||||
|
Exercised options
|
297 | 219 | 264 | |||||||||
|
Aggregate intrinsic value of exercised options
|
$ | 1,517 | $ | 870 | $ | 1,068 | ||||||
Restricted Stock Program
The following table summarizes the restricted stock issuances that have not yet vested:
54
|
(in thousands, except per share amounts)
|
Total
shares
|
Share
price
|
Weighted
average
share price
|
|||||||||
|
Outstanding at June 30, 2009
|
710 | $ | 9.09 to 21.15 | $ | 13.56 | |||||||
|
Issued
|
282 |
14.28 to 16.32
|
14.32 | |||||||||
|
Vested
|
(91 | ) |
9.09 to 19.56
|
15.23 | ||||||||
|
Forfeited
|
(1 | ) | 19.56 | 19.56 | ||||||||
|
Outstanding at June 30, 2010
|
900 | $ | 9.09 to 21.15 | $ | 13.64 | |||||||
|
Issued
|
233 |
14.31 to 21.03
|
16.28 | |||||||||
|
Vested
|
(138 | ) |
9.09 to 16.27
|
14.48 | ||||||||
|
Forfeited
|
(145 | ) |
9.09 to 21.15
|
18.72 | ||||||||
|
Outstanding at June 30, 2011
|
850 | $ | 9.09 to 21.03 | $ | 13.16 | |||||||
At June 30, 2011, the aggregate value of unvested restricted stock compensation expense yet to be recognized, as determined by the market value on the respective grant dates, was $4.3 million (net of forfeitures) The remaining cost is expected to be recognized over a period of approximately three years.
(11) Accumulated Other Comprehensive Income (Loss)
The cumulative balance of each component of accumulated other comprehensive income (loss) is as follows:
|
Foreign
currency
translation
adjustment
|
Defined benefit pension plan
liability
|
Mark to
Market
Available for Sale Securities
|
Accumulated
other
comprehensive
income (loss)
|
|||||||||||||
| (amounts in thousands) | ||||||||||||||||
|
Balances at June 30, 2009
|
$ | 1,404 | $ | (3,412 | ) | $ | (389 | ) | $ | (2,397 | ) | |||||
|
Period change
|
62 | (478 | ) | - | (416 | ) | ||||||||||
|
Balances at June 30, 2010
|
$ | 1,466 | $ | (3,890 | ) | $ | (389 | ) | $ | (2,813 | ) | |||||
|
Period change
|
556 | 1,265 | 389 | 2,210 | ||||||||||||
|
Balances at June 30, 2011
|
$ | 2,022 | $ | (2,625 | ) | $ | - | $ | (603 | ) |
(12) Shareholder Protection Rights Plan
In April 2001, the board of directors adopted a Shareholder Protection Rights Plan. The Company’s past Shareholder Protection Rights Agreement (Rights Agreement), dated as of April 20, 2001, expired at the close of business on April 27, 2011. The new Rights Agreement became effective as of April 27, 2011 and was not adopted in response to any specific proposal or intention to acquire control of the Company. The plan provides for a dividend distribution of one right on each outstanding share of the Company’s stock, distributed to shareholders of record on April 27, 2011. The rights will be exercisable and will allow the shareholders to acquire common stock at a discounted price if a person or group acquires 20% or more of the outstanding shares of common stock. Rights held by persons who exceed the 20% threshold will be void. In certain circumstances, the rights will entitle the holder to buy shares in an acquiring entity at a discounted price. The board of directors may, at its option, redeem all rights for $0.001 per right at any time prior to the rights becoming exercisable. The rights will expire on April 27, 2021, unless earlier redeemed, exchanged or amended by the Board.
(13) Employee Benefit Plans
The Company applies the standards governing employer's accounting for defined benefit pension and other postretirement plans, which requires balance sheet recognition of the overfunded or underfunded status of pension and postretirement benefit plans. Under these rules, actuarial gains and losses, prior service costs or credits, and any remaining transition assets or obligations that have not been recognized under previous accounting standards must be recognized in accumulated other comprehensive income (loss), net of tax effects, until they are amortized as a component of net periodic benefit cost. In addition, the measurement date, the date at which plan assets and the benefit obligation are measured, is required to be the Company's fiscal year end.
Defined Benefit Plan
The Company has a noncontributory defined benefit pension plan covering eligible employees. Effective August 15, 2000 the plan was closed for new participants. Benefits under this plan generally are based on the employee’s years of service and compensation. The following table presents the changes in the defined benefit pension plan and the fair value of the Plan’s assets for the years ended June 30:
55
|
(amounts in thousands)
|
2011
|
2010
|
||||||
|
Change in benefit obligation:
|
||||||||
|
Benefit obligation at beginning of year
|
$ | 16,108 | $ | 13,004 | ||||
|
Service cost
|
370 | 279 | ||||||
|
Interest cost
|
849 | 791 | ||||||
|
Actuarial (gain) loss
|
(244 | ) | 2,432 | |||||
|
Benefits paid
|
(430 | ) | (398 | ) | ||||
|
Benefit obligation at end of year
|
$ | 16,653 | $ | 16,108 | ||||
|
Change in plan assets:
|
||||||||
|
Fair value of plan assets at beginning of year
|
$ | 10,410 | $ | 9,080 | ||||
|
Actual return on plan assets
|
2,063 | 860 | ||||||
|
Employer contributions
|
307 | 868 | ||||||
|
Benefits paid
|
(430 | ) | (398 | ) | ||||
|
Fair value of plan assets at end of year
|
$ | 12,350 | $ | 10,410 | ||||
|
Unfunded status
|
$ | (4,303 | ) | $ | (5,698 | ) | ||
|
Amounts Recognized in Accumulated Other Comprehensive Income (Loss)
|
||||||||
|
Net actuarial loss
|
3,385 | 4,659 | ||||||
|
Weighted average assumptions:
|
||||||||
|
Discount rate at year-end
|
5.50 | % | 5.30 | % | ||||
|
Rate of increase in compensation levels at year end
|
4.00 | % | 4.00 | % | ||||
|
Expected return on plan assets during the year
|
8.50 | % | 8.50 | % | ||||
|
Measurement date
|
June 30
|
June 30
|
||||||
Components of net periodic pension cost for the years ended June 30 are as follows:
|
(amounts in thousands)
|
2011
|
2010
|
2009
|
|||||||||
|
Service cost
|
$ | 370 | $ | 279 | $ | 264 | ||||||
|
Interest cost
|
849 | 791 | 760 | |||||||||
|
Expected return on plan assets
|
(875 | ) | (762 | ) | (849 | ) | ||||||
|
Amortization of unrecognized loss
|
495 | 305 | 102 | |||||||||
|
Net periodic pension cost
|
$ | 839 | $ | 613 | $ | 277 | ||||||
|
Weighted average assumptions:
|
||||||||||||
|
Discount rate
|
5.30 | % | 6.28 | % | 6.85 | % | ||||||
|
Expected increase in compensation levels at year end
|
4.00 | % | 4.00 | % | 4.00 | % | ||||||
|
Expected return on plan assets during the year
|
8.50 | % | 8.50 | % | 8.50 | % | ||||||
The estimated amount of net actuarial loss that will be amortized from accumulated other comprehensive income into net periodic pension cost in 2012 is $0.3 million.
Plan Assets
| 2011 |
2010
|
|||||||||||||||
|
Actual
allocation
|
Percentage
allocation
|
Actual
allocation
|
Percentage
allocation
|
|||||||||||||
|
(amounts in thousands)
|
||||||||||||||||
|
Money market
|
$ | 264 | 2.14 | % | $ | 386 | 3.71 | % | ||||||||
|
Corporate debt securities
|
1,900 | 15.38 | 1,546 | 14.85 | ||||||||||||
|
Government debt securities
|
2,418 | 19.58 | 2,375 | 22.82 | ||||||||||||
|
Global equity mutual fund
|
1,149 | 9.30 | 841 | 8.08 | ||||||||||||
|
Closed end equity mutual funds
|
6,286 | 50.90 | 5,072 | 48.73 | ||||||||||||
|
Closed end global equity mutual funds
|
333 | 2.70 | 189 | 1.81 | ||||||||||||
| $ | 12,350 | 100.00 | % | $ | 10,409 | 100.00 | % | |||||||||
56
Fair value of plan assets – The following table presents the fair value of the assets by asset category and their level within the fair value hierarchy as of June 30, 2011 and 2010. See note 4 for the description of each level within the fair value hierarchy.
|
(amounts in thousands)
|
Level 1
|
Level 2
|
Level 3
|
Total Carrying
Value at
June 30, 2011
|
||||||||||||
|
Cash and cash equivalents:
|
||||||||||||||||
|
Money market
|
$ | 264 | $ | - | $ | - | $ | 264 | ||||||||
|
Fixed income:
|
- | - | ||||||||||||||
|
Corporate debt securities
|
1,900 | - | - | 1,900 | ||||||||||||
|
Government debt securities
|
2,418 | - | - | 2,418 | ||||||||||||
|
Mutual funds:
|
||||||||||||||||
|
Global equity mutual fund
|
1,149 | - | - | 1,149 | ||||||||||||
|
Closed equity mutual fund
|
6,286 | - | - | 6,286 | ||||||||||||
|
Closed end global equity mutual fund
|
333 | - | - | 333 | ||||||||||||
|
Total
|
$ | 12,350 | $ | - | $ | - | $ | 12,350 | ||||||||
|
(amounts in thousands)
|
Level 1
|
Level 2
|
Level 3
|
Total Carrying
Value at
June 30, 2010
|
||||||||||||
|
Cash and cash equivalents:
|
||||||||||||||||
|
Money market
|
$ | 386 | $ | - | $ | - | $ | 386 | ||||||||
|
Fixed income:
|
- | |||||||||||||||
|
Corporate debt securities
|
1,546 | - | - | 1,546 | ||||||||||||
|
Government debt securities
|
2,375 | - | - | 2,375 | ||||||||||||
|
Mutual funds:
|
||||||||||||||||
|
Global equity mutual fund
|
841 | - | - | 841 | ||||||||||||
|
Closed equity mutual fund
|
5,072 | - | - | 5,072 | ||||||||||||
|
Closed end global equity mutual fund
|
189 | - | - | 189 | ||||||||||||
|
Total
|
$ | 10,409 | $ | - | $ | - | $ | 10,409 | ||||||||
Plan’s Investment Policy: Investments shall be made pursuant to the following objectives: 1) preserve purchasing power of plan’s assets base adjusted for inflation; 2) provide long term growth; 3) avoid significant volatility. Asset allocation shall be determined based on a long-term target allocation having 30% of assets invested in Large-Cap domestic equities, 11% in mid-cap domestic equities, 11% in small-cap domestic equities, 8% international equities, and 40% in the broad bond market, with little or none invested in cash. Both investment allocation and performance shall be reviewed periodically.
Determination of Assumed Rate of Return
The Corporation has selected the assumed rate of return based on the following:
|
Target
percentage
allocation
|
Expected
compound
annualized
5-year
(index) return
|
Expected
weighted
average
return
|
||||||||||
|
Large-cap stocks
|
30.0 | % | 9.6 | % | 2.9 | % | ||||||
|
Mid-cap stocks
|
11.0 | 11.8 | 1.3 | |||||||||
|
Small-cap stocks
|
11.0 | 12.2 | 1.3 | |||||||||
|
International common stocks
|
8.0 | 9.4 | 0.8 | |||||||||
|
Broad bond market
|
40.0 | 2.8 | 1.1 | |||||||||
|
Total
|
100.0 | % | 7.4 | % | ||||||||
The actual percentage allocation approximates the targeted allocations at June 30, 2011. The Company estimated investment expenses to be approximately 0.5% of the portfolio annually.
57
Expected Contributions
The Company had pension contributions amounting to approximately $0.3 million during fiscal 2011. Expected contributions for fiscal 2012 are approximately $1.0 million.
Estimated Future Benefit Payments
| (amounts in thousands) | ||||
| The following estimated benefit payments, which reflect future service, as appropriate, are expected to be paid: | ||||
|
July 1, 2011– June 30, 2012
|
$ | 660 | ||
|
July 1, 2012– June 30, 2013
|
671 | |||
|
July 1, 2013– June 30, 2014
|
700 | |||
|
July 1, 2014– June 30, 2015
|
718 | |||
|
July 1, 2015– June 30, 2016
|
749 | |||
|
Years 2017 – 2021
|
4,495 |
Defined Contribution Plan
The Company maintains a voluntary contributory salary savings plan to which participants may contribute. The Company’s matching contribution is 100% of the participants’ contribution up to a maximum of 5% of the participants’ compensation. During fiscal 2011, 2010, and 2009 the Company contributed $1.8 million, $1.6 million, and $1.5 million, respectively, to this plan. The Company also contributed approximately $0.2 million, $0.2 million, and $0.1 million in fiscal 2011, 2010, and 2009, respectively, to purchase Company’s stock for each participant.
Profit Sharing Plan
The Company maintains a profit sharing plan which provides an annual contribution by the Company based upon a percentage of operating earnings, as defined. Eligible employees are allocated amounts under the profit sharing plan based upon their respective earnings, as defined. Contributions under the plan were approximately $1.0 million, $0.7 million, and $0.6 million in fiscal 2011, 2010, and 2009, respectively. While the Company intends to continue this plan, it reserves the right to terminate or amend the plan at any time.
Postretirement Health Benefit Plan
The Company has a contributory postretirement health benefit plan covering eligible employees. Effective August 15, 2000 the plan was closed for new participants. The Company provides medical coverage for current and future eligible retirees of the Company plus their eligible dependents. Employees generally become eligible for retiree medical coverage by retiring from the Company after attaining at least age 55 with 15 years of service (active employees at June 27, 1993 were eligible by retiring after attaining at least age 55 with 10 years of service). Retirees at June 27, 1993 pay approximately $30 per month for health care coverage and the Company is responsible for paying the remaining costs. For this group, any increase in health care coverage costs for retired employees will be shared by the Company and retirees on a fifty-fifty basis, while any increase in coverage costs for retiree dependents will be totally paid by the retirees. For eligible employees retiring after June 27, 1993, the Company contributes a fixed dollar amount towards the cost of the medical plan. Any future cost increases for the retiree medical program for these participants will be charged to the retiree.
The following table presents the changes in the postretirement benefit obligation and the funded status of the Plan at June 30:
|
(amounts in thousands)
|
2011
|
2010
|
||||||
|
Benefit obligation at beginning of year
|
$ | 1,385 | $ | 2,573 | ||||
|
Service cost
|
32 | 52 | ||||||
|
Interest cost
|
68 | 110 | ||||||
|
Plan participants’ contributions
|
137 | 124 | ||||||
|
Actuarial (gain)
|
(80 | ) | (1,349 | ) | ||||
|
Benefits paid
|
(143 | ) | (125 | ) | ||||
|
Medicare Part D prescription drug subsidy
|
13 | - | ||||||
|
Benefit obligation at the end of year
|
$ | 1,412 | $ | 1,385 | ||||
|
Fair value of plan assets
|
$ | - | $ | - | ||||
|
Under funded status
|
(1,412 | ) | (1,385 | ) | ||||
|
Accrued postretirement benefit cost
|
$ | (1,412 | ) | $ | (1,385 | ) | ||
|
Amounts Recognized in Accumulated Other Comprehensive Income (Loss)
|
||||||||
|
Net actuarial (income)
|
$ | (760 | ) | $ | (769 | ) | ||
58
Net periodic postretirement benefit cost includes the following components:
|
(amounts in thousands)
|
2011
|
2010
|
2009
|
|||||||||
|
Service cost
|
$ | 32 | $ | 52 | $ | 70 | ||||||
|
Interest cost
|
68 | 110 | 157 | |||||||||
|
Amortized loss
|
(73 | ) | (27 | ) | 3 | |||||||
|
Amortization of unrecognized prior service cost
|
(17 | ) | (18 | ) | (18 | ) | ||||||
|
Net periodic postretirement benefit cost
|
$ | 10 | $ | 117 | $ | 212 | ||||||
The weighted average discount rate used in determining the accumulated postretirement benefit obligation was 5.20%, 5.20%, and 6.37%, at the end of fiscal 2011, 2010, and 2009, respectively.
|
Assumed health care cost trend rates are as follows:
|
||||||||
|
2011
|
2010
|
|||||||
|
Health care cost trend rate assumed for next year
|
7.3 – 10.0% | 7.3 – 10.0% | ||||||
|
Rate that the cost trend rate gradually declines to
|
5% | 5% | ||||||
|
Year that the rate reaches the rate it is assumed to remain at
|
2018 | 2017 | ||||||
A one-percentage point change in assumed health care cost trend rates would have the following effects:
|
(amounts in thousands)
|
1% increase
|
1% decrease
|
||||||
|
Effect on total of service and interest cost components
|
$7 | $6 | ||||||
|
Effect on postretirement benefit obligation
|
67 | 61 | ||||||
Estimated Future Benefit Payments
Shown below are the expected gross benefit payments (including prescription drug benefits) and the expected gross amount of subsidy receipts.
|
(amounts in thousands)
|
Gross
payments
|
Subsidy
receipts
|
||||||
|
2012
|
$ | 110 | $ | (23 | ) | |||
|
2013
|
98 | (16 | ) | |||||
|
2014
|
104 | (16 | ) | |||||
|
2015
|
99 | (17 | ) | |||||
|
2016
|
103 | (17 | ) | |||||
|
Years 2017 - 2021
|
592 | (79 | ) | |||||
(14) Income Taxes
The following table presents the Domestic and Foreign components of income before income taxes and the expense (benefit) for income taxes as well as the taxes charged or credited to stockholders’ equity:
59
|
Year ended June 30
|
||||||||||||
|
(amounts in thousands)
|
2011
|
2010
|
2009
|
|||||||||
|
Income (loss) before income taxes and
discontinued operations:
|
||||||||||||
|
Domestic
|
$ | 21,880 | $ | 19,180 | $ | 12,075 | ||||||
|
Foreign
|
46 | (618 | ) | 1,558 | ||||||||
| $ | 21,926 | $ | 18,562 | $ | 13,633 | |||||||
|
Income tax expense (benefit) charged to the income statement from continuing operations:
|
||||||||||||
|
Current:
|
||||||||||||
|
Federal
|
$ | 5,073 | $ | 5,848 | $ | 4,218 | ||||||
|
State and local
|
244 | 184 | (204 | ) | ||||||||
|
Benefit applied to reduce goodwill
|
46 | 46 | 42 | |||||||||
|
Foreign
|
43 | 354 | 70 | |||||||||
|
Total current
|
5,406 | 6,432 | 4,126 | |||||||||
|
Deferred:
|
||||||||||||
|
Federal
|
143 | (921 | ) | (544 | ) | |||||||
|
State and local
|
(149 | ) | (271 | ) | (74 | ) | ||||||
|
Foreign
|
125 | (390 | ) | 266 | ||||||||
|
Total deferred
|
119 | (1,582 | ) | (352 | ) | |||||||
|
Total income tax expense charged to the income statement
|
$ | 5,525 | $ | 4,850 | $ | 3,774 | ||||||
|
Income taxes charged (credited) to Stockholders’ equity:
|
||||||||||||
|
Current benefit of stock based compensation
|
$ | (164 | ) | $ | (144 | ) | $ | (200 | ) | |||
|
Deferred tax expense (benefit) from recognition of pension liability
|
652 | (247 | ) | (970 | ) | |||||||
|
Income taxes charged (credited) to
Stockholders’ equity
|
$ | 488 | $ | (391 | ) | $ | (1,170 | ) | ||||
A reconciliation of the expected consolidated income tax expense, computed by applying a 35% U.S. Federal corporate income tax rate to income before income taxes, to income tax expense, is as follows:
|
(amounts in thousands)
|
2011
|
2010
|
2009
|
|||||||||
|
Consolidated income tax expense at 35%
|
$ | 7,674 | $ | 6,497 | $ | 4,772 | ||||||
|
State taxes, net of Federal benefit
|
(4 | ) | (94 | ) | (233 | ) | ||||||
|
Nontaxable interest income
|
(67 | ) | (83 | ) | (289 | ) | ||||||
|
Change in valuation allowance
|
100 | (35 | ) | 81 | ||||||||
|
Effect of foreign operations
|
153 | 180 | (210 | ) | ||||||||
|
Non-deductible stock-based compensation
|
(107 | ) | (25 | ) | 180 | |||||||
|
Research credits
|
(1,148 | ) | (258 | ) | (854 | ) | ||||||
|
Domestic production tax benefit
|
(619 | ) | (470 | ) | (325 | ) | ||||||
|
Change in uncertain tax positions
|
(419 | ) | (891 | ) | 732 | |||||||
|
Other
|
(38 | ) | 29 | (80 | ) | |||||||
| $ | 5,525 | $ | 4,850 | $ | 3,774 | |||||||
The tax effects of temporary differences that give rise to the deferred tax assets and deferred tax liabilities at June 30, are presented below:
|
(amounts in thousands)
|
2011
|
2010
|
||||||
|
Deferred tax assets:
|
||||||||
|
Inventories
|
$ | 1,801 | $ | 1,575 | ||||
|
Deferred compensation
|
412 | 394 | ||||||
|
Retirement benefits
|
1,055 | 1,515 | ||||||
|
Postretirement benefits
|
921 | 918 | ||||||
|
Stock-based compensation
|
4,263 | 3,684 | ||||||
|
Nondeductible reserves
|
1,234 | 990 | ||||||
|
Unrealized losses on securities available-for-sale
|
- | 140 | ||||||
|
Federal and state tax attribute carryforwards
|
4,416 | 4,304 | ||||||
|
State net operating loss carryforwards
|
280 | 227 | ||||||
|
Gross deferred tax assets
|
14,382 | 13,747 | ||||||
|
Valuation allowance
|
(4,483 | ) | (4,523 | ) | ||||
|
Net deferred tax assets
|
9,899 | 9,224 | ||||||
|
Deferred tax liabilities:
|
||||||||
|
Plant and equipment, principally due to differences in depreciation
|
(4,513 | ) | (3,343 | ) | ||||
|
Intangible assets including goodwill
|
(4,889 | ) | (4,626 | ) | ||||
|
Gross deferred tax liabilities
|
(9,402 | ) | (7,969 | ) | ||||
|
Net deferred tax assets
|
$ | 497 | $ | 1,255 | ||||
|
(amounts in thousands)
|
2011 | 2010 | ||||||
|
Presented as:
|
||||||||
|
Current deferred tax asset
|
$ | 2,351 | $ | 1,955 | ||||
|
Long-term deferred tax asset
|
47 | 26 | ||||||
|
Long-term deferred tax liability
|
(1,901 | ) | (726 | ) | ||||
|
Net deferred tax assets
|
$ | 497 | $ | 1,255 | ||||
60
In assessing the realizable value of the deferred tax assets, the Company considers whether it is more likely than not that some portion or all of the deferred tax assets will not be realized. The ultimate realization of deferred tax assets is dependent upon the generation of future taxable income during the periods in which those temporary differences become deductible. The Company considers the scheduled reversal of deferred tax liabilities, projected future taxable income, and tax planning strategies in making this assessment. Based on the level of historical taxable income and projections for future taxable income, the Company believes it is more likely than not that it will realize the benefits of the deferred tax assets, net of the existing valuation allowance.
At June 30, 2010, the Company had unrealized losses on securities available-for-sale of $0.4 million. If realized, these losses would have been characterized as capital losses, which can only be used to offset capital gains, resulting in capital loss carryforwards which would have begun to expire in five years. As a result of the limitations at June 30, 2010, the Company had a valuation allowance with respect to the unrealized losses of $0.1million. These securities were sold during the second quarter of the fiscal year ending June 30, 2011.
At June 30, 2011 and 2010, the Company has $5.6 million and $4.0 million of gross state net operating loss carryforwards, respectively, which begin to expire in 2020. The Company does not believe it is more likely than not that it will realize the full deferred tax benefits of the state net operating losses and at June 30, 2011 and 2010 has a valuation allowance of $0.3 million.
At June 30, 2011, the Company has gross state tax credit carryforwards of $6.5 million, which will begin to expire in 2012. $0.2 million of the state tax credits may only be realized after utilization of the net operating loss carryforwards. The Company does not believe it is more likely than not that it will realize the deferred tax benefits of the state tax credits before their expiration. At June 30, 2011, the Company had a valuation allowance with respect to the state tax credits of $4.2 million
The Company’s subsidiary in China is eligible for a tax holiday providing reduced tax rates for the first five tax years after it generates taxable income in excess of its existing net operating loss carryforwards. The tax benefit varies over the remaining years of the holiday. Fiscal year ended June 30, 2010, was the fifth and final year of its tax holiday, which ended on December 31, 2009. The effect of the tax holiday for the year ended June 30, 2010 was approximately $0.2 million, or $0.01, per diluted share. United States income taxes have not been provided on undistributed earnings of the China subsidiary because such earnings are considered to be permanently reinvested and it is not practicable to estimate the amount of tax that may be payable upon distribution.
A reconciliation of beginning and ending unrecognized tax benefits is as follows:
|
(amounts in thousands)
|
||||
|
Balance at June 30, 2010
|
$
|
639
|
||
|
Lapse of statute of limitations
|
(228
|
)
|
||
|
Audit settlements
|
(44
|
)
|
||
|
Decreases related to prior years’ tax positions
|
(128
|
)
|
||
|
Balance at June 30, 2011
|
$
|
239
|
||
As of June 30, 2011 and June 30, 2010, the Company had $0.2 million and $0.6 million, respectively, of unrecognized tax benefits that would affect the Company’s effective tax rate if recognized.
61
In accordance with the Company’s accounting policy, the Company recognizes accrued interest and penalties related to unrecognized tax benefits as a component of income tax expense. This policy did not change as a result of the accounting standards related to uncertain tax positions. For the year ended June 30, 2011 the Company recognized a decrease of $19,000 in accrued interest and penalties, which was recognized as a reduction in tax expense. As of June 30, 2011 and June 30, 2010, the Company had $9,000 and $28,000, net of tax benefit respectively, included in the liability for uncertain tax positions for the possible payment of interest and penalties.
During 2011, one of the Companies’ subsidiaries settled an IRS exam for a pre-acquisition year, with no adjustments or cash payments. The Company remains subject to income tax examinations for its U.S. federal taxes for fiscal years 2009 through 2011, and for foreign and state and local taxes for the fiscal years 2008 through 2011. It is reasonably possible that the liability associated with the Company’s unrecognized tax benefits will increase or decrease within the next twelve months as a result of possible examinations or the expiration of the statutes of limitations. At this time, an estimate of the range of reasonably possible outcomes cannot be made. Of the $0.2 million of unrecognized tax benefit liabilities, interest, and penalties at June 30, 2011, the Company has classified all as non-current liabilities on the Company’s consolidated balance sheet.
(15) Segment and Related Information
(a) Segments
The Company operates predominately in the wireless communications, satellite communications, and space and defense electronics markets. The Company’s two reportable segments are the Wireless Group and the Space & Defense Group. These segments have been determined based upon the nature of the products and services offered, customer base, technology, availability of discrete internal financial information, homogeneity of products, and delivery channel, and are consistent with the way the Company organizes and evaluates financial information internally for purposes of making operating decisions and assessing performance.
The Wireless Group designs, manufactures, and markets commercial products used mainly by the wireless communications market. The Space & Defense Group of the Company designs, manufactures, and markets specialized products for the radar and communications markets. The Company’s Space & Defense Group aggregates certain operating segments into one reportable segment, as the operating segments depict similar products, customers, industries and experience similar margins on products.
The following table reflects the operating results of the segments consistent with the Company’s internal financial reporting process. The following results are used in part, by management, both in evaluating the performance of, and in allocating resources to, each of the segments:
|
(amounts in thousands)
|
Wireless
|
Space &
Defense
|
Unallocated
|
Consolidated
|
||||||||||||
|
Net sales
|
||||||||||||||||
|
2011
|
$ | 66,043 | $ | 113,127 | $ | - | $ | 179,170 | ||||||||
|
2010
|
55,556 | 113,233 | - | 168,789 | ||||||||||||
|
2009
|
68,622 | 98,283 | - | 166,905 | ||||||||||||
|
Operating income (4)
|
||||||||||||||||
|
2011
|
12,036 | 9,884 | (670 | ) | 21,250 | |||||||||||
|
2010
|
5,102 | 14,456 | (774 | ) | 18,784 | |||||||||||
|
2009
|
6,649 | 8,202 | (824 | ) | 14,027 | |||||||||||
|
Goodwill and intangible assets
|
||||||||||||||||
|
June 30, 2011
|
30,716 | 20,634 | - | 51,350 | ||||||||||||
|
June 30, 2010
|
30,716 | 21,872 | - | 52,588 | ||||||||||||
|
Identifiable assets (1)
|
||||||||||||||||
|
June 30, 2011
|
21,237 | 62,222 | 117,836 | 201,295 | ||||||||||||
|
June 30, 2010
|
16,337 | 69,686 | 102,737 | 188,760 | ||||||||||||
|
Depreciation (2)
|
||||||||||||||||
|
2011
|
3,971 | 4,366 | - | 8,337 | ||||||||||||
|
2010
|
4,415 | 4,301 | - | 8,716 | ||||||||||||
|
2009
|
4,933 | 3,467 | - | 8,400 | ||||||||||||
|
Intangibles amortization (3)
|
||||||||||||||||
|
2011
|
- | 1,191 | - | 1,191 | ||||||||||||
|
2010
|
- | 1,191 | - | 1,191 | ||||||||||||
|
2009
|
- | 1,076 | - | 1,076 | ||||||||||||
62
|
(1)
|
Segment assets primarily include receivables, inventories and assets related to the Company’s subsidiaries, MSK and Unicircuit. The Company does not segregate other assets on a products and services basis for internal management reporting and, therefore, such information is not presented. Assets included in corporate and unallocated principally are cash and cash equivalents, marketable securities, other receivables, prepaid expenses, deferred income taxes, and property, plant and equipment not specific to the segments.
|
|
(2)
|
Depreciation expense related to acquisition—specific property, plant, and equipment is included in the segment classification of the acquired business. Depreciation expense related to non-segment assets is allocated departmentally based on an estimate of capital equipment employed by each department. Depreciation expense is then further allocated within the department as it relates to the specific business segment impacted by the consumption of the capital resources utilized. Due to the similarity of the property, plant, and equipment utilized, the Company does not specifically identify these assets by individual business segment for internal reporting purposes.
|
|
(3)
|
Amortization of intangible assets arising from business combinations is allocated to the segments based on the segment classification of the acquired or applicable operation.
|
|
(4)
|
Unallocated amounts relates to the lease expense incurred on the London lease
|
(b) Geographic Information
Net sales by geographic region are as follows:
|
(amounts in thousands)
|
United
States
|
Asia
Pacific
|
Europe
|
Americas
|
Other
|
Consolidated
Net sales
|
||||||||||||||||||
|
2011
|
$ | 119,336 | $ | 46,067 | $ | 13,438 | $ | 287 | $ | 42 | $ | 179,170 | ||||||||||||
|
2010
|
124,610 | 30,975 | 8,912 | 878 | 3,414 | 168,789 | ||||||||||||||||||
|
2009
|
104,152 | 37,430 | 15,650 | 2,627 | 7,046 | 166,905 | ||||||||||||||||||
(c) Customers
In 2011, sales to two customers (Lockheed Martin Corp. and Raytheon Company) both individually exceeded 10% of consolidated net sales, totaling approximately $48.8 million (Space & Defense Group). In 2010, sales to two customers (Lockheed Martin Corp. and Raytheon Company) both individually exceeded 10% of consolidated net sales, totaling approximately $46.5 million (Space & Defense Group). In 2009, sales to Lockheed Martin Corp. exceeded 10% of consolidated net sales, totaling $24.7 million (Space & Defense Group).
(16) Commitments
The Company is obligated under contractual obligations and commitments to make future payments such as lease agreements and contingent commitments. The Company’s obligations and commitments are as follows:
|
(amounts in thousands)
|
Operating
|
Other
|
||||||
|
Year ending June 30:
|
Leases
|
Long-Term(1)
|
||||||
|
2012
|
$ | 547 | $ | 65 | ||||
|
2013
|
578 | 65 | ||||||
|
2014
|
438 | 65 | ||||||
|
2015
|
160 | 65 | ||||||
|
2016
|
160 | 65 | ||||||
|
Thereafter
|
40 | 74 | ||||||
|
Total
|
$ | 1,923 | $ | 399 | ||||
|
|
(1)
|
– Deferred Compensation
|
Net rent expense for the years ended June 30, 2011, 2010, and 2009 was $1.3 million, $1.2 million, and $1.2 million, respectively.
The minimum lease payments for the Company’s operating leases are recognized on a straight-line basis over the minimum lease term. The Company’s China operation building lease has a step rent provision. Rent expense is recognized on a straight line basis over the lease term.
63
(17) Concentrations
The Company and others, which are engaged in supplying defense-related equipment to the United States Government (the Government), are subject to certain business risks related to the defense industry. Sales to the Government may be affected by changes in procurement policies, budget considerations, changing concepts of national defense, political developments abroad, and other factors. Sales to direct contractors of the Government accounted for approximately 46%,59%, and 50% of consolidated net sales in fiscal 2011, 2010, and 2009, respectively. While management believes there is a high probability of continuation of the Company’s current defense-related programs, it is attempting to reduce its dependence on sales to direct contractors of the Government through development of its commercial electronics business.
The Company maintains and operates a facility in Suzhou, China. Included in the Company’s total assets, as of June 30, 2011, includes $11.7 million of cash and cash equivalents deposited in a bank in China. As of June 30, 2011, there is no reason to believe that any of the Company’s foreign assets or future operations will be impaired.
(18) Quarterly Financial Data (Unaudited)
The following table sets forth certain unaudited quarterly financial information for the years ended June 30, 2011 and 2010:
|
2011 quarter ended
|
||||||||||||||||
|
(in thousands, except per share amounts)
|
September 30
|
December 31
|
March 31
|
June 30 **
|
||||||||||||
|
Net sales
|
$ | 44,539 | $ | 43,443 | $ | 44,015 | $ | 47,173 | ||||||||
|
Gross profit
|
17,633 | 16,294 | 16,087 | 17,892 | ||||||||||||
|
Net income
|
4,105 | 4,654 | 3,398 | 4,244 | ||||||||||||
|
Income from continuing operations:
|
||||||||||||||||
|
Basic earnings per share
|
$ | 0.30 | $ | 0.33 | $ | 0.24 | $ | 0.30 | ||||||||
|
Diluted earnings per share
|
0.28 | 0.32 | 0.23 | 0.29 | ||||||||||||
|
2010 quarter ended
|
||||||||||||||||
|
(in thousands, except per share amounts)
|
September 30
|
December 31
|
March 31 *
|
June 30
|
||||||||||||
|
Net sales
|
$ | 40,337 | $ | 41,019 | $ | 42,181 | $ | 45,252 | ||||||||
|
Gross profit
|
14,664 | 14,306 | 16,825 | 16,482 | ||||||||||||
|
Net income
|
2,857 | 2,522 | 4,561 | 3,772 | ||||||||||||
|
Income from continuing operations:
|
||||||||||||||||
|
Basic earnings per share
|
$ | 0.20 | $ | 0.18 | $ | 0.33 | $ | 0.27 | ||||||||
|
Diluted earnings per share
|
0.19 | 0.17 | 0.32 | 0.26 | ||||||||||||
Income per share amounts for each quarter are required to be computed independently, and as a result, their sum does not necessarily equal the total year income per share amounts.
* The inclusion of the effects of the settlement of the IRS examination of the Company’s fiscal 2007 and 2008 returns, as well as, adjustments to reserves for uncertain tax positions related to the results of the examination amounting to a reduction in tax expense of approximately $1.0 million, or $0.07 per diluted share in the third quarter.
** The effects of the restructuring activities amounted to additional expense of approximately $0.4 million, or $0.01 per diluted share in the fourth quarter.
64
INDEX TO EXHIBITS
|
Exhibit No.
|
Description
|
||
|
2.1
|
Agreement and Plan of Merger, dated August 18, 2008, among the Company, Anaren Acquisition, Inc., Unicircuit and Owen Agency, LLC, as the Stockholders’ Agent (1)
|
||
|
3.1
|
Certificate of Incorporation, as amended (2)
|
||
|
3.2
|
Amended and Restated By-Laws (3)
|
||
|
4.1
|
Specimen Certificate of Common Stock (4)
|
||
|
4.2
|
Shareholder Protection Rights Agreement, dated as of April 8, 2011, between the Company and American Stock Transfer & Trust Company, LLC, including forms of Rights Certificate and Election to Exercise (5)
|
||
|
10.1
|
Employment Agreement, dated as of June 28, 2011, between the Company and Lawrence A. Sala (6)*
|
||
|
10.2
|
Pension Plan and Trust (7)*
|
||
|
10.3
|
Anaren Microwave, Inc. Incentive Stock Option Plan, (as amended) (8)*
|
||
|
10.4
|
Anaren Microwave, Inc. 1989 Nonstatutory Stock Option Plan, (as amended) (9)*
|
||
|
10.5
|
Anaren Microwave, Inc. Incentive Stock Option Plan for Key Employees (10)*
|
||
|
10.6
|
Anaren Microwave, Inc. Stock Option Plan (11)*
|
||
|
10.7
|
Reserved
|
||
|
10.8
|
Employment Agreement, dated as of February 14, 2004, between the Company and Carl W. Gerst, Jr. (13)*
|
||
|
10.9
|
Anaren, Inc. Comprehensive Long-Term Incentive Plan (14)*
|
||
|
10.10
|
Amendment #1 to Anaren, Inc. 2004 Comprehensive Long-Term Incentive Plan, (15) *
|
||
|
10.11
|
Addendum to the Employment Agreement with Carl W. Gerst, Jr., dated as of May 16, 2007, between the Company and Carl W. Gerst, Jr. (16)*
|
||
|
10.12
|
Amendment #2 to the Employment Agreement with Carl W. Gerst, Jr., dated as of June 16, 2008, between the Company and Carl W. Gerst, Jr. (17)*
|
||
|
10.13
|
Loan Agreement, dated as of July 31, 2008, between the Company and KeyBank National Association (18)
|
||
|
10.14
|
Promissory Note Revolving Credit LIBOR Rate, dated July 31, 2008, issued by the Company to KeyBank National Association (18)
|
||
|
10.15
|
364 Day LIBOR Grid Note Loan Agreement, dated as of May 1, 2008, issued by the Company to Manufacturers and Traders Trust Company (19)
|
||
|
10.16
|
Stock Purchase Agreement, dated July 30, 2008, among the Company, M. S. Kennedy Corp. and the individual shareholders and seller’s representative party thereto (20)
|
||
|
10.17
|
Reserved
|
||
|
10.18
|
Amendment #3 to Carl W. Gerst, Jr. Employment Agreement, dated December 30, 2008, by and between Carl W. Gerst, Jr. and the Company (22)*
|
||
|
10.19
|
Amendment #4 to Employment Agreement, dated May 13, 2009, by and between Carl W. Gerst, Jr. and the Company (23) *See Attachments for inserts.
|
||
65
|
10.20
|
Anaren, Inc. 2004 Comprehensive Long-Term Incentive Plan, as Amended (25)*
|
|
|
10.21
|
Amendment #5 to the Employment Agreement, dated June 8, 2010, by and between Carl W. Gerst, Jr. and the Company (26)*
|
|
|
10.22
|
Amendment #6 to the Employment Agreement, dated June 28, 2011 by and between Carl W. Gerst, Jr. and the Company (27)*
|
|
|
16.1
|
Letter from KPMG, LLP, dated December 10, 2008 (24)
|
|
|
21
|
Subsidiaries of the Company
|
|
|
23.1
|
Consent of Deloitte & Touche LLP, Independent Registered Public Accounting Firm
|
|
|
31.1
|
Certifications of Chief Executive Officer Pursuant to Section 302 of the Sarbanes-Oxley Act of 2002**
|
|
|
31.2
|
Certifications of Chief Financial Officer Pursuant to Section 302 of the Sarbanes-Oxley Act of 2002**
|
|
|
32.1
|
Certifications of Chief Executive Officer Pursuant to Section 906 of the Sarbanes-Oxley Act of 2002
|
|
|
32.2
|
Certifications of Chief Financial Officer Pursuant to Section 906 of the Sarbanes-Oxley Act of 2002
|
|
|
*
|
Indicates Management contract or compensatory plan or arrangement
|
|
|
**
|
Furnished herewith.
|
|
|
(1)
|
Incorporated herein by reference to Exhibit 10.1 to the Company’s Current Report on Form 8-K (Commission File No. 0-6620) filed with the Securities and Exchange Commission on August 20, 2008.
|
|
|
(2)
|
Restated Certificate of Incorporation of the Company, filed on September 17, 1968, is incorporated herein by reference to Exhibit 3(a) to Company's Registration Statement on Form S-1 (Registration No. 2-42704); (B) Amendment, filed on December 19, 1980 by the New York Department of State, is incorporated herein by reference to Exhibit 4.1(ii) to the Company's Registration Statement on Form S-2 (Registration No. 2-86025); (C) Amendment, filed on March 18, 1985 by the New York Department of State, is incorporated herein by reference to Exhibit 3.1 to the Company's Annual Report on Form 10-K (Commission File No. 0-6620) for the fiscal year ended June 30, 1987; (D) Amendment, filed on December 14, 1987 by the New York Department of State, is incorporated herein by reference to Exhibit 4(a)(iv) to the Company's Registration Statement on Form S-8 (Registration No. 33-19618); (E) Amendment, filed on April 8, 1999 by the New York Department of State, is incorporated herein by reference to Exhibit 3.1 to the Company's Annual Report on Form 10-K (Commission File No. 0-6620) for the fiscal year ended June 30, 1999 filed with the Securities and Exchange Commission on September 27, 1999; (F) Amendment, filed on February 8, 2000 by the New York Department of State, is incorporated herein reference to Exhibit 4.1 to the Company's Registration Statement on Form S-3 (Registration No. 333-31460) filed with the Securities and Exchange Commission on March 2, 2000; (G) Amendment, filed on November 22, 2000 by the New York Department of State, is incorporated by reference to Exhibit 3.1 to the Company's Quarterly Report on Form 10-Q (Commission File No. 0-06620) filed with the Securities and Exchange commission on February 12, 2001; and (H) Amendment, filed on December 20, 2002 by the New York Department of State, is incorporated by reference to Exhibit 3 to the Company's Quarterly Report on Form 10-Q (Commission File No. 0-6620) filed with the Securities and Exchange Commission on January 29, 2003.
|
|
|
(3)
|
Incorporated herein by reference to Exhibit 3.2 to the Company's Current Report on Form 8-K (Commission File No. 0-06620) filed with the Securities and Exchange Commission on December 20, 2007.
|
|
|
(4)
|
Incorporated herein by reference to Exhibit 4.3 to the Company's Registration Statement on Form S-3 (Registration No. 333-31460) filed with the Securities and Exchange Commission on March 2, 2000.
|
|
66
|
(5)
|
Incorporated herein by reference to Exhibit 4.1 to the Company's Registration Statement on Form 8-A (Commission File No. 0-06620) filed with the Securities and Exchange Commission on April 27, 2011.
|
|
|
(6)
|
Incorporated herein by reference to Exhibit 10.1 to the Company's Current Report on Form 8-K, (Commission File No. 0-06620), filed with the Securities and Exchange Commission on July 1, 2011.
|
|
|
(7)
|
Incorporated herein by reference to Exhibit 4(b) to the Company's Registration Statement on Form S-8 (Registration No. 33-19618).
|
|
|
(8)
|
Incorporated herein by reference to Appendix A to the Company's definitive proxy statement for its 1998 annual meeting of the shareholders (Commission File No. 0-06620), filed with the Securities and Exchange Commission on September 25, 1998.
|
|
|
(9)
|
Incorporated herein by reference to Appendix B to the Company's definitive proxy statement for its 1998 annual meeting of the shareholders (Commission File No. 0-06620), filed with the Securities and Exchange Commission on September 25, 1998.
|
|
|
(10)
|
Incorporated herein by reference to Appendix A to the Company's definitive proxy statement for its 2000 annual meeting of the shareholders (Commission File No. 0-06620), filed with the Securities and Exchange Commission on September 18, 2000.
|
|
|
(11)
|
Incorporated herein by reference to Appendix B to the Company's definitive proxy statement for its 2000 annual meeting of the shareholders (Commission File No. 0-06620), filed with the Securities and Exchange Commission on September 18, 2000.
|
|
|
(12)
|
Reserved.
|
|
|
(13)
|
Incorporated herein by reference to Exhibit 10.1 to the Company's Quarterly Report on Form 10-Q (Commission File No. 0-06620) filed with the Securities and Exchange Commission on May 3, 2004.
|
|
|
(14)
|
Incorporated herein by reference to Appendix A to the Company's definitive proxy statement for its 2004 annual meeting of the shareholders (Commission File No. 0-06620), filed with the Securities and Exchange Commission on September 17, 2004.
|
|
|
(15)
|
Incorporated herein by reference to Appendix A to the Company's definitive proxy statement for its 2006 annual meeting of the shareholders (Commission File No. 0-06620), filed with the Securities and Exchange Commission on September 15, 2006.
|
|
|
(16)
|
Incorporated herein by reference to Exhibit 10.1 to the Company’s Current Report on Form 8-K (Commission File No.0-06620) filed with the Securities and Exchange Commission on July 25, 2007.
|
|
|
(17)
|
Incorporated herein by reference to Exhibit 10.1 to the Company’s Current Report on Form 8-K (Commission File No.0-06620) filed with the Securities and Exchange Commission on June 20, 2008.
|
|
|
(18)
|
Incorporated herein by reference to Exhibit 10.2 and 10.3 to the Company’s Current Report on Form 8-K (Commission File No. 0-06620) filed with the Securities and Exchange Commission on August 1, 2008.
|
|
|
(19)
|
Incorporated herein by reference to Exhibit 99.1 to the Company’s Quarterly Report on Form 10-Q (Commission File No.0-06620) filed with the Securities and Exchange Commission on May 12, 2008.
|
67
|
(20)
|
Incorporated herein by reference to Exhibit 10.1 to the Company’s Current Report on Form 8-K (Commission File No. 0-06620) filed with the Securities and Exchange Commission on August 1, 2008.
|
|
|
(21)
|
Reserved.
|
|
|
(22)
|
Incorporated herein by reference to Exhibit 10.2 to the Company’s Current Report on Form 8-K (Commission File No. 0-06620) filed with the Securities and Exchange Commission on January 5, 2009.
|
|
|
(23)
|
Incorporated herein by reference to Exhibit 10.1 to the Company’s Current Report on Form 8-K (Commission File No. 0-06620) filed with the Securities and Exchange Commission on May 14, 2009.
|
|
|
(24)
|
Incorporated herein by reference to Exhibit 16.1 to the Company’s Current Report on Form 8-K (Commission File No. 0-06620) filed with the Securities and Exchange Commission on December 10, 2008.
|
|
|
(25)
|
Incorporated herein by reference to Exhibit 10.1 to the Company’s Quarterly Report on Form 10-Q (Commission File No. 0-06620) filed with the Securities and Exchange Commission on January 29, 2010.
|
|
|
(26)
|
Incorporated herein by reference to Exhibit 10.1 to the Company’s Current Report on Form 8-K (Commission file No. 0-06620) filed with the Securities and Exchange Commission on June 8, 2010.
|
|
|
(27)
|
Incorporated herein by reference to Exhibit 10.2 to the Company’s Current Report on Form 8-K (Commission File No. 0-06620) filed with the Securities and exchange Commission on July 1, 2011.
|
68