Attached files
UNITED STATES
SECURITIES AND EXCHANGE COMMISSION
Washington, D.C. 20549
Form 10-Q
| x | QUARTERLY REPORT PURSUANT TO SECTION 13 OR 15 (d) OF THE SECURITIES EXCHANGE ACT OF 1934 |
For the Quarterly Period Ended June 30, 2011
OR
| ¨ | TRANSITION REPORT PURSUANT TO SECTION 13 OR 15 (d) OF THE SECURITIES EXCHANGE ACT OF 1934 |
Commission File Number 000-54374
RENEWABLE ENERGY GROUP, INC.
(Exact name of registrant as specified in its charter)
| DELAWARE | 26-4785427 | |
| (State of other jurisdiction of incorporation or organization) |
(I.R.S. Employer Identification No.) |
416 South Bell Avenue Ames, Iowa 50010
(Address of principal executive offices)
(515) 239-8000
(Registrant’s telephone number, including area code)
Indicate by check mark whether the registrant: (1) has filed all reports required to be filed by Section 13 or 15 (d) of the Securities Exchange Act of 1934 during the preceding 12 months (or for such shorter period that the registrant was required to file such reports), and (2) has been subject to such filing requirements for the past 90 days. YES x NO ¨
Indicate by check mark whether the registrant has submitted electronically and posted on its corporate Web site, if any, every Interactive Data file required to be submitted and posted pursuant to Rule 405 of Regulation S-T (§232.405 of this chapter) during the preceding 12 months (or for such shorter period that the registrant was required to submit and post such files). YES x NO ¨
Indicate by check mark whether the registrant is a large accelerated filer, an accelerated filer, non-accelerated filer, or a smaller reporting company. See the definitions of “large accelerated filer,” “accelerated filer” and “smaller reporting company” in Rule 12b-2 of the Exchange Act:
| Large accelerated filer | ¨ | Accelerated filer | ¨ | |||
| Non-accelerated filer | x | Smaller reporting company | ¨ | |||
Indicate by check mark whether the registrant is a shell company (as defined in Rule 12b-2 of the Exchange Act). YES ¨ NO x
As of July 31, 2011, there was no public trading market for the Company’s stock. There were 34,834,372 shares of the Company’s common stock and 13,455,522 shares of the Company’s preferred stock outstanding on July 31, 2011.
| ITEM 1. | CONDENSED CONSOLIDATED FINANCIAL STATEMENTS |
RENEWABLE ENERGY GROUP, INC. AND SUBSIDIARIES
CONDENSED CONSOLIDATED BALANCE SHEETS (Unaudited)
AS OF JUNE 30, 2011 AND DECEMBER 31, 2010
(IN THOUSANDS, EXCEPT SHARE AMOUNTS)
| June 30, 2011 |
December 31, 2010 |
|||||||
| ASSETS |
||||||||
| CURRENT ASSETS: |
||||||||
| Cash and cash equivalents |
$ | 9,125 | $ | 4,259 | ||||
| Restricted cash |
2,268 | 2,667 | ||||||
| Accounts receivable, net (includes amounts owed by related parties of $234 and $1,146 as of June 30, 2011 and December 31, 2010, respectively) |
26,132 | 18,801 | ||||||
| Inventories |
41,024 | 28,985 | ||||||
| Prepaid expenses and other assets |
10,437 | 3,933 | ||||||
|
|
|
|
|
|||||
| Total current assets |
88,986 | 58,645 | ||||||
|
|
|
|
|
|||||
| Property, plant and equipment, net |
165,055 | 166,391 | ||||||
| Property, plant and equipment, net - variable interest entities |
47,833 | 42,692 | ||||||
| Goodwill |
84,864 | 84,864 | ||||||
| Intangible assets, net |
3,778 | 3,169 | ||||||
| Deferred income taxes |
1,500 | 1,500 | ||||||
| Investments |
3,545 | 4,259 | ||||||
| Other assets |
8,084 | 7,821 | ||||||
| Restricted cash |
304 | 302 | ||||||
|
|
|
|
|
|||||
| TOTAL ASSETS |
$ | 403,949 | $ | 369,643 | ||||
|
|
|
|
|
|||||
| LIABILITIES AND EQUITY |
||||||||
| CURRENT LIABILITIES: |
||||||||
| Revolving line of credit |
$ | 10,550 | $ | 9,550 | ||||
| Current maturities of notes payable |
24,463 | 25,551 | ||||||
| Current maturities of notes payable - variable interest entities |
797 | — | ||||||
| Accounts payable (includes amounts owed to related parties of $13,265 and $3,827 as of June 30, 2011 and December 31, 2010, respectively) |
27,270 | 14,237 | ||||||
| Accrued expenses and other liabilities |
4,831 | 3,549 | ||||||
| Deferred revenue |
1,616 | 9,339 | ||||||
|
|
|
|
|
|||||
| Total current liabilities |
69,527 | 62,226 | ||||||
| Unfavorable lease obligation |
10,729 | 11,293 | ||||||
| Preferred stock embedded conversion feature derivatives |
78,849 | 61,761 | ||||||
| Seneca Holdco liability, at fair value |
11,629 | 10,406 | ||||||
| Notes payable |
23,989 | 24,774 | ||||||
| Notes payable - variable interest entities |
40,118 | 36,250 | ||||||
| Other liabilities |
6,741 | 5,381 | ||||||
|
|
|
|
|
|||||
| Total liabilities |
241,582 | 212,091 | ||||||
|
|
|
|
|
|||||
| COMMITMENTS AND CONTINGENCIES |
||||||||
| Redeemable preferred stock ($.0001 par value; 60,000,000 shares authorized; 13,455,522 shares outstanding at June 30, 2011 and December 31, 2010; redemption amount $222,016 at June 30, 2011 and December 31, 2010) |
134,512 | 122,436 | ||||||
| EQUITY: |
||||||||
| Company stockholders’ equity: |
||||||||
| Common stock ($.0001 par value; 140,000,000 shares authorized; 33,150,511 and 33,129,553 shares issued and outstanding at June 30, 2011 and December 31, 2010) |
3 | 3 | ||||||
| Common stock - additional paid-in-capital |
73,708 | 82,634 | ||||||
| Warrants - additional paid-in-capital |
3,698 | 4,820 | ||||||
| Accumulated deficit |
(49,554 | ) | (52,341 | ) | ||||
|
|
|
|
|
|||||
| Total stockholders’ equity |
27,855 | 35,116 | ||||||
|
|
|
|
|
|||||
| TOTAL LIABILITIES AND EQUITY |
$ | 403,949 | $ | 369,643 | ||||
|
|
|
|
|
|||||
See notes to condensed consolidated financial statements.
2
RENEWABLE ENERGY GROUP, INC. AND SUBSIDIARIES
CONDENSED CONSOLIDATED STATEMENTS OF OPERATIONS (Unaudited)
FOR THE THREE AND SIX MONTHS ENDED JUNE 30, 2011 AND 2010
(IN THOUSANDS, EXCEPT PER SHARE AMOUNTS)
| Three
Months Ended June 30, 2011 |
Three
Months Ended June 30, 2010 |
Six
Months Ended June 30, 2011 |
Six
Months Ended June 30, 2010 |
|||||||||||||
| REVENUES: |
||||||||||||||||
| Biodiesel sales |
$ | 182,998 | $ | 45,290 | $ | 280,960 | $ | 76,885 | ||||||||
| Biodiesel sales - related parties |
1,349 | 879 | 3,461 | 2,259 | ||||||||||||
| Biodiesel government incentives |
11,926 | 22 | 16,266 | 3,674 | ||||||||||||
|
|
|
|
|
|
|
|
|
|||||||||
| 196,273 | 46,191 | 300,687 | 82,818 | |||||||||||||
| Services |
15 | 77 | 16 | 398 | ||||||||||||
| Services - related parties |
24 | 69 | 44 | 610 | ||||||||||||
|
|
|
|
|
|
|
|
|
|||||||||
| 196,312 | 46,337 | 300,747 | 83,826 | |||||||||||||
|
|
|
|
|
|
|
|
|
|||||||||
| COSTS OF GOODS SOLD: |
||||||||||||||||
| Biodiesel |
84,713 | 15,969 | 137,411 | 28,237 | ||||||||||||
| Biodiesel - related parties |
81,182 | 25,156 | 124,673 | 47,712 | ||||||||||||
| Services |
24 | 118 | 42 | 242 | ||||||||||||
| Services - related parties |
— | — | — | 291 | ||||||||||||
|
|
|
|
|
|
|
|
|
|||||||||
| 165,919 | 41,243 | 262,126 | 76,482 | |||||||||||||
|
|
|
|
|
|
|
|
|
|||||||||
| GROSS PROFIT |
30,393 | 5,094 | 38,621 | 7,344 | ||||||||||||
| SELLING, GENERAL, AND ADMINISTRATIVE EXPENSES |
7,812 | 5,731 | 14,090 | 10,817 | ||||||||||||
| IMPAIRMENT OF ASSETS |
— | — | — | 141 | ||||||||||||
|
|
|
|
|
|
|
|
|
|||||||||
| INCOME (LOSS) FROM OPERATIONS |
22,581 | (637 | ) | 24,531 | (3,614 | ) | ||||||||||
|
|
|
|
|
|
|
|
|
|||||||||
| OTHER INCOME (EXPENSE), NET: |
||||||||||||||||
| Change in fair value of preferred stock conversion feature embedded derivatives |
(19,645 | ) | 5,001 | (17,088 | ) | 5,001 | ||||||||||
| Change in fair value of interest rate swap |
166 | 116 | 332 | 188 | ||||||||||||
| Change in fair value of Seneca Holdco liability |
(2,250 | ) | (371 | ) | (1,523 | ) | (371 | ) | ||||||||
| Interest expense (includes related party amounts of $168 and $228 for the three and six months ended June 30, 2011, respectively, and $151 and $204 for the three and six months ended June 30, 2010, respectively) |
(1,751 | ) | (1,394 | ) | (3,459 | ) | (1,735 | ) | ||||||||
| Other income (includes related party amounts of $180 for the six months ended June 30, 2010) |
34 | 59 | 142 | 273 | ||||||||||||
| Impairment of investments |
— | (400 | ) | — | (400 | ) | ||||||||||
|
|
|
|
|
|
|
|
|
|||||||||
| (23,446 | ) | 3,011 | (21,596 | ) | 2,956 | |||||||||||
|
|
|
|
|
|
|
|
|
|||||||||
| INCOME (LOSS) BEFORE INCOME TAXES AND LOSS FROM EQUITY INVESTMENTS |
(865 | ) | 2,374 | 2,935 | (658 | ) | ||||||||||
| INCOME TAX BENEFIT (EXPENSE) |
— | (2,600 | ) | — | 3,728 | |||||||||||
| LOSS FROM EQUITY INVESTMENTS |
(83 | ) | (166 | ) | (148 | ) | (381 | ) | ||||||||
|
|
|
|
|
|
|
|
|
|||||||||
| NET INCOME (LOSS) |
(948 | ) | (392 | ) | 2,787 | 2,689 | ||||||||||
|
|
|
|
|
|
|
|
|
|||||||||
| EFFECTS OF RECAPITALIZATION |
— | — | — | 8,521 | ||||||||||||
| ACCRETION OF PREFERRED STOCK TO REDEMPTION VALUE |
(6,180 | ) | (5,178 | ) | (12,076 | ) | (16,246 | ) | ||||||||
| LESS - UNDISTRIBUTED DIVIDENDS ALLOCATED TO PREFERRED STOCKHOLDERS |
(3,185 | ) | (2,926 | ) | (6,246 | ) | (4,073 | ) | ||||||||
|
|
|
|
|
|
|
|
|
|||||||||
| NET LOSS ATTRIBUTABLE TO THE COMPANY’S COMMON STOCKHOLDERS |
$ | (10,313 | ) | $ | (8,496 | ) | $ | (15,535 | ) | $ | (9,109 | ) | ||||
|
|
|
|
|
|
|
|
|
|||||||||
| NET LOSS PER SHARE ATTRIBUTABLE TO COMMON STOCKHOLDERS: |
||||||||||||||||
| BASIC |
$ | (0.31 | ) | $ | (0.28 | ) | $ | (0.47 | ) | $ | (0.34 | ) | ||||
|
|
|
|
|
|
|
|
|
|||||||||
| DILUTED |
$ | (0.31 | ) | $ | (0.28 | ) | $ | (0.47 | ) | $ | (0.34 | ) | ||||
|
|
|
|
|
|
|
|
|
|||||||||
| WEIGHTED AVERAGE SHARES USED TO COMPUTE NET LOSS PER SHARE ATTRIBUTABLE TO COMMON STOCKHOLDERS: |
||||||||||||||||
| BASIC |
33,193,874 | 30,337,302 | 33,171,531 | 26,686,936 | ||||||||||||
|
|
|
|
|
|
|
|
|
|||||||||
| DILUTED |
33,193,874 | 30,337,302 | 33,171,531 | 26,686,936 | ||||||||||||
|
|
|
|
|
|
|
|
|
|||||||||
See notes to condensed consolidated financial statements.
3
RENEWABLE ENERGY GROUP, INC. AND SUBSIDIARIES
CONDENSED CONSOLIDATED STATEMENTS OF REDEEMABLE PREFERRED STOCK AND EQUITY (DEFICIT) (Unaudited)
FOR THE SIX MONTHS ENDED JUNE 30, 2011 AND 2010 (IN THOUSANDS, EXCEPT SHARE AMOUNTS)
| Company Stockholders’ Equity | ||||||||||||||||||||||||||||||||||||
| Redeemable Preferred Stock Shares |
Redeemable Preferred Stock |
Common Stock Shares |
Common Stock |
Common Stock - Additional Paid-in Capital |
Warrants - Additional Paid-in Capital |
Accumulated Deficit |
Noncontolling Interest |
Total | ||||||||||||||||||||||||||||
| BALANCE, December 31, 2009 |
12,464,357 | $ | 149,122 | 19,575,117 | $ | 2 | $ | 15,676 | $ | 4,619 | $ | (60,905 | ) | $ | 13,477 | $ | (27,131 | ) | ||||||||||||||||||
| Exchange of REG Holdco preferred stock, common stock, and common stock warrants |
(12,464,357 | ) | (158,475 | ) | (19,575,117 | ) | (2 | ) | (6,323 | ) | (4,619 | ) | — | — | (10,944 | ) | ||||||||||||||||||||
| Issuance of preferred stock, common stock, and common stock warrants to REG Holdco, net of $52,394 for embedded derivatives |
13,164,357 | 102,287 | 18,875,117 | 2 | 14,221 | 4,619 | — | — | 18,842 | |||||||||||||||||||||||||||
| Issuance of common stock in acquisitions |
— | — | 11,006,141 | 1 | 66,366 | — | — | — | 66,367 | |||||||||||||||||||||||||||
| Issuance of preferred stock in acquisitions, net of $1,158 for embedded derivatives |
291,165 | 2,263 | — | — | — | — | — | — | — | |||||||||||||||||||||||||||
| Issuance of warrants in acquisition |
— | — | — | — | — | 1,269 | — | — | 1,269 | |||||||||||||||||||||||||||
| Issuance of common stock |
— | — | 500,000 | — | 3,015 | — | — | — | 3,015 | |||||||||||||||||||||||||||
| Blackhawk Biofuels LLC deconsolidation transition adjustment |
— | — | — | — | 1,192 | — | 30,152 | (13,477 | ) | 17,867 | ||||||||||||||||||||||||||
| Stock compensation expense |
— | — | — | — | 68 | — | — | — | 68 | |||||||||||||||||||||||||||
| Accretion of preferred stock to redemption value |
— | 16,246 | — | — | (16,246 | ) | — | — | — | (16,246 | ) | |||||||||||||||||||||||||
| Net income |
— | — | — | — | — | — | 2,689 | — | 2,689 | |||||||||||||||||||||||||||
|
|
|
|
|
|
|
|
|
|
|
|
|
|
|
|
|
|
|
|||||||||||||||||||
| BALANCE, June 30, 2010 |
13,455,522 | $ | 111,443 | 30,381,258 | $ | 3 | $ | 77,969 | $ | 5,888 | $ | (28,064 | ) | $ | — | $ | 55,796 | |||||||||||||||||||
|
|
|
|
|
|
|
|
|
|
|
|
|
|
|
|
|
|
|
|||||||||||||||||||
| BALANCE, December 31, 2010 |
13,455,522 | $ | 122,436 | 33,129,553 | $ | 3 | $ | 82,634 | $ | 4,820 | $ | (52,341 | ) | $ | — | $ | 35,116 | |||||||||||||||||||
| Warrants exercised |
— | — | 20,958 | — | 128 | (80 | ) | — | — | 48 | ||||||||||||||||||||||||||
| Warrants expired |
— | — | — | — | 1,042 | (1,042 | ) | — | — | — | ||||||||||||||||||||||||||
| Stock compensation expense |
— | — | — | — | 1,980 | — | — | — | 1,980 | |||||||||||||||||||||||||||
| Accretion of preferred stock to redemption value |
— | 12,076 | — | — | (12,076 | ) | — | — | — | (12,076 | ) | |||||||||||||||||||||||||
| Net income |
— | — | — | — | — | — | 2,787 | — | 2,787 | |||||||||||||||||||||||||||
|
|
|
|
|
|
|
|
|
|
|
|
|
|
|
|
|
|
|
|||||||||||||||||||
| BALANCE, June 30, 2011 |
13,455,522 | $ | 134,512 | 33,150,511 | $ | 3 | $ | 73,708 | $ | 3,698 | $ | (49,554 | ) | $ | — | $ | 27,855 | |||||||||||||||||||
|
|
|
|
|
|
|
|
|
|
|
|
|
|
|
|
|
|
|
|||||||||||||||||||
See notes to condensed consolidated financial statements.
4
RENEWABLE ENERGY GROUP, INC. AND SUBSIDIARIES
CONDENSED CONSOLIDATED STATEMENTS OF CASH FLOWS (Unaudited)
FOR THE SIX MONTHS ENDED JUNE 30, 2011 AND 2010
(IN THOUSANDS)
| Six Months Ended June 30, 2011 |
Six Months Ended June 30, 2010 |
|||||||
| CASH FLOWS FROM OPERATING ACTIVITIES: |
||||||||
| Net income |
$ | 2,787 | $ | 2,689 | ||||
| Adjustments to reconcile net income to net cash flows from operating activities: |
||||||||
| Depreciation expense |
3,394 | 2,230 | ||||||
| Amortization expense of assets and liabilities, net |
637 | 68 | ||||||
| Provision (benefit) for doubtful accounts |
595 | (45 | ) | |||||
| Stock compensation expense |
1,980 | 68 | ||||||
| Loss from equity method investees |
148 | 381 | ||||||
| Deferred tax benefit |
— | (3,728 | ) | |||||
| Impairment of investments |
— | 400 | ||||||
| Impairment of long lived assets |
— | 141 | ||||||
| Change in fair value of preferred stock conversion feature embedded derivatives |
17,088 | (5,001 | ) | |||||
| Change in fair value of Seneca Holdco liability |
1,223 | 371 | ||||||
| Distributions received from equity method investees |
— | 50 | ||||||
| Changes in asset and liabilities, net of effects from mergers and acquisitions: |
||||||||
| Accounts receivable |
(7,926 | ) | 8,211 | |||||
| Inventories |
(12,039 | ) | (527 | ) | ||||
| Prepaid expenses and other assets |
(6,688 | ) | (61 | ) | ||||
| Accounts payable |
12,074 | (5,357 | ) | |||||
| Accrued expenses and other liabilities |
1,376 | 3,485 | ||||||
| Deferred revenue |
(7,723 | ) | (5,480 | ) | ||||
|
|
|
|
|
|||||
| Net cash flows from operating activities |
6,926 | (2,105 | ) | |||||
|
|
|
|
|
|||||
| CASH FLOWS FROM INVESTING ACTIVITIES: |
||||||||
| Cash paid for purchase of property, plant and equipment |
(1,206 | ) | (2,064 | ) | ||||
| Proceeds from the sale of fixed assets |
— | 320 | ||||||
| Change in restricted cash |
397 | 152 | ||||||
| Consolidation of Bell, LLC |
22 | — | ||||||
| Deconsolidation of Blackhawk |
— | (206 | ) | |||||
| Cash provided through Blackhawk acquisition |
— | 1 | ||||||
| Cash provided through Central Iowa Energy acquisition |
— | 403 | ||||||
|
|
|
|
|
|||||
| Net cash flows from investing activities |
(787 | ) | (1,394 | ) | ||||
|
|
|
|
|
|||||
| CASH FLOWS FROM FINANCING ACTIVITIES: |
||||||||
| Borrowings on line of credit |
1,000 | — | ||||||
| Cash paid on notes payable |
(1,965 | ) | (614 | ) | ||||
| Cash proceeds from investment in Seneca Landlord |
— | 4,000 | ||||||
| Cash received upon exercise of warrants |
48 | — | ||||||
| Cash paid for pending issuance of common and preferred stock |
(283 | ) | — | |||||
| Cash paid for debt issuance costs |
(73 | ) | (457 | ) | ||||
|
|
|
|
|
|||||
| Net cash flows from financing activities |
(1,273 | ) | 2,929 | |||||
|
|
|
|
|
|||||
| NET CHANGE IN CASH AND CASH EQUIVALENTS |
4,866 | (570 | ) | |||||
| CASH AND CASH EQUIVALENTS, Beginning of period |
4,259 | 5,855 | ||||||
|
|
|
|
|
|||||
| CASH AND CASH EQUIVALENTS, End of period |
$ | 9,125 | $ | 5,285 | ||||
|
|
|
|
|
|||||
(continued)
5
RENEWABLE ENERGY GROUP, INC. AND SUBSIDIARIES
CONDENSED CONSOLIDATED STATEMENTS OF CASH FLOWS (Unaudited)
FOR THE SIX MONTHS ENDED JUNE 30, 2011 AND 2010
(IN THOUSANDS)
| Six Months Ended June 30, 2011 |
Six Months Ended June 30, 2010 |
|||||||
| SUPPLEMENTAL DISCLOSURES OF CASH FLOWS INFORMATION: |
||||||||
| Cash (received) paid for income taxes |
$ | (211 | ) | $ | 579 | |||
|
|
|
|
|
|||||
| Cash paid for interest |
$ | 2,553 | $ | 1,602 | ||||
|
|
|
|
|
|||||
| SUPPLEMENTAL DISCLOSURE OF NON-CASH INVESTING AND FINANCING ACTIVITIES: |
||||||||
| Effects of recapitalization |
$ | 8,521 | ||||||
|
|
|
|||||||
| Accretion of preferred stock to redemption value |
$ | 12,076 | $ | 16,246 | ||||
|
|
|
|
|
|||||
| Amounts included in period-end accounts payable for: |
||||||||
| Purchases of property, plant and equipment |
$ | 304 | $ | 412 | ||||
|
|
|
|
|
|||||
| Debt issuance costs |
$ | 5 | ||||||
|
|
|
|||||||
| Equity issuance costs |
$ | 856 | ||||||
|
|
|
|||||||
| Incentive common stock liability for supply agreement |
$ | 682 | ||||||
|
|
|
|||||||
| Removal of cost method investee as a result of consolidation |
$ | 1,000 | ||||||
|
|
|
|||||||
| Removal of equity method investee as a result of consolidation |
$ | 3,969 | ||||||
|
|
|
|||||||
| Issuance of common stock for debt financing cost |
$ | 3,015 | ||||||
|
|
|
|||||||
| Property, plant and equipment acquired through the assumption of liabilities |
$ | 36,650 | ||||||
|
|
|
|||||||
| Assets (liabilities) acquired through consolidation of 416 Bell, LLC |
||||||||
| Cash |
$ | 22 | ||||||
| Property, plant and equipment |
5,881 | |||||||
| Other noncurrent assets |
4 | |||||||
| Other current liabilities |
(17 | ) | ||||||
| Debt |
(4,757 | ) | ||||||
| Other noncurrent liabilities |
(567 | ) | ||||||
|
|
|
|||||||
| Removal of equity method investee as a result of consolidation |
$ | 566 | ||||||
|
|
|
|||||||
| Assets (liabilities) acquired through the issuance of stock: |
||||||||
| Cash |
$ | 404 | ||||||
| Restricted cash |
2,302 | |||||||
| Other current assets |
1,342 | |||||||
| Property, plant, and equipment |
87,406 | |||||||
| Goodwill |
69,059 | |||||||
| Other noncurrent assets |
231 | |||||||
| Line of credit |
(900 | ) | ||||||
| Other current liabilities |
(5,548 | ) | ||||||
| Debt |
(72,668 | ) | ||||||
| Other noncurrent liabilities |
(11,729 | ) | ||||||
|
|
|
|||||||
| $ | 69,899 | |||||||
|
|
|
|||||||
(concluded)
See notes to condensed consolidated financial statements.
6
RENEWABLE ENERGY GROUP, INC. AND SUBSIDIARIES
NOTES TO THE CONDENSED CONSOLIDATED FINANCIAL STATEMENTS - Unaudited
For The Three and Six Months Ended June 30, 2011 and 2010
(In Thousands, Except Share and Per Share Amounts)
NOTE 1 — ORGANIZATION, PRESENTATION, AND NATURE OF THE BUSINESS
The consolidated financial statements have been prepared by Renewable Energy Group, Inc. and its subsidiaries (the Company), without audit, pursuant to the rules and regulations of the U.S. Securities and Exchange Commission (SEC). Certain information and footnote disclosures normally included in annual financial statements prepared in accordance with accounting principles generally accepted in the United States of America (GAAP) have been condensed or omitted as permitted by such rules and regulations. All adjustments, consisting of normal recurring adjustments, have been included. Management believes that the disclosures are adequate to present fairly the financial position, results of operations and cash flows at the dates and for the periods presented. It is suggested that these interim financial statements be read in conjunction with the consolidated financial statements and the notes thereto appearing in the Company’s latest annual report on Form 10-K. Results for interim periods are not necessarily indicative of those to be expected for the fiscal year.
As of June 30, 2011, the Company owned biodiesel production facilities with a total of 182 million gallons per year (mmgy) of nameplate production capacity, which includes a 60 mmgy biodiesel facility in Seneca, Illinois leased by the Company from a consolidated Variable Interest Entity (VIE).
On February 26, 2010, the Company merged with Blackhawk Biofuels, LLC (Blackhawk) adding a biodiesel production facility with 45 mmgy of production capacity. On March 8, 2010 the Company acquired substantially all of the assets and liabilities of Central Iowa Energy, LLC (CIE) adding a biodiesel production facility with 30 mmgy of production capacity. On April 9, 2010 the Company entered into a series of agreements related to the asset purchase agreement with Nova Biofuels, Inc. (Nova) that resulted in the consolidation of a VIE, Seneca Landlord, LLC (Landlord). Landlord’s primary asset includes a biodiesel production facility with a 60 mmgy production capacity. On July 15, 2010, the Company acquired certain assets from Tellurian Biodiesel, Inc. (Tellurian) and American BDF, LLC (ABDF). ABDF was a joint venture owned by Golden State Service Industries, Restaurant Technologies, Inc. (RTI) and Tellurian. Finally, on September 21, 2010 the Company acquired substantially all of the assets of Clovis Biodiesel, LLC (Clovis) consisting primarily of a partially completed biodiesel production facility.
Prior to February 26, 2010, the Company refers to the business, results of operations and cash flows of REG Biofuels, Inc. (Biofuels), which is considered the accounting predecessor to the Company. For the period after February 26, 2010, the Company refers to the business, results of operations and cash flows of Renewable Energy Group, Inc. (formerly, REG Newco, Inc.) and its consolidated subsidiaries, including Biofuels, REG Danville, LLC (REG Danville) and REG Newton, LLC.
In 2007, the Company commenced construction of a 60 mmgy production capacity facility near New Orleans, Louisiana and a 60 mmgy production capacity facility in Emporia, Kansas. In 2008, the Company halted construction of these facilities as a result of conditions in the biodiesel industry and the credit markets. The Company continues to pursue financing and intends to finish the New Orleans, Louisiana facility, which is approximately 45% complete, and the facility in Emporia, Kansas, which is approximately 20% complete, when industry conditions improve and financing becomes available. The city incentive package for the Emporia construction project was renewed for an additional three years starting July 1, 2010. Additionally, as a result of halting construction, the Company performed an analysis to evaluate if the assets under construction were impaired. Based on the projected gross cash flows of the projects, the Company determined that no impairment has occurred. The Company continues to be in discussions with lenders in an effort to obtain financing for facilities under construction and capital improvement projects.
During 2007, the Company invested, through a wholly-owned subsidiary, in 416 South Bell, LLC (Bell, LLC), whereby the Company owns 50% of the outstanding units. Bell, LLC owns and leases to the Company its corporate office building located in Ames, Iowa. On January 1, 2011, the Company determined it was the primary beneficiary of Bell, LLC and consolidated Bell, LLC into the Company’s financial statements in accordance with ASC Topic 810, Consolidation (ASC Topic 810). See “Note 5 – Variable Interest Entities” for a description of the consolidation.
As of June 30, 2011, the Company managed one other biodiesel production facility that was owned primarily by an independent investment group with an aggregate of 30 mmgy capacity. During July 2011, the Company completed its purchase of substantially all the assets of SoyMor Biodiesel, LLC and SoyMor Cooperative. See “Note 13 – Subsequent Events” for a description of the transaction.
7
NOTE 2 — SUMMARY OF SIGNIFICANT ACCOUNTING POLICIES
Basis of Consolidation
The accompanying condensed consolidated financial statements include the accounts of the Company, consolidated with the accounts of all of its subsidiaries and affiliates in which the Company holds a controlling financial interest as of the financial statement date. Normally, a controlling financial interest reflects ownership of a majority of the voting interests. Other factors considered in determining whether a controlling financial interest is held include whether the Company possesses the authority to purchase or sell assets or make other operating decisions that significantly affect the entity’s results of operations and whether the Company is the primary beneficiary of the economic benefits and financial risks of the entity. Intercompany accounts and transactions have been eliminated.
Accounts Receivable
Accounts receivable are carried on a gross basis, less allowance for doubtful accounts. Management estimates the allowance for doubtful accounts based on existing economic conditions, the financial conditions of customers and the amount and age of past due accounts. Receivables are considered past due if full payment is not received by the contractual due date. Past due accounts are generally written off against the allowance for doubtful accounts only after reasonable collection attempts have been exhausted.
Inventories
Inventories consist of raw materials, work in process and finished goods and are valued at the lower of cost or market. Inventory values as of June 30, 2011 and December 31, 2010 include adjustments to reduce inventory to the lower of cost or market in the amount of $1 and $35, respectively. Cost is determined based on the first-in, first-out method.
Valuation of Preferred Stock Conversion Feature Embedded Derivatives
The Series A Preferred Stock terms provide for voluntary and, under certain circumstances, automatic conversion of the Series A Preferred Stock to Common Stock based on a prescribed formula. In addition, shares of Series A Preferred Stock are subject to redemption at the election of the holder beginning February 26, 2014. The redemption price is equal to the greater of (i) an amount equal to $13.75 per share of Series A Preferred Stock plus any and all accrued dividends, not to exceed $16.50 per share, or (ii) the fair market value of the Series A Preferred Stock. In accordance with ASC Topic 815, Derivatives and Hedging (ASC Topic 815), the Company is required to bifurcate and account for as a separate liability certain derivatives embedded in its contractual obligations. An “embedded derivative” is a provision within a contract, or other instrument, that affects some or all of the cash flows or the value of that contract, similar to a derivative instrument. Essentially, the embedded provision within the contract contains all of the attributes of a free-standing derivative, such as an underlying market variable, a notional amount or payment provision and can be settled “net,” but the contract, in its entirety, does not meet the ASC Topic 815 definition of a derivative.
The Company has determined that the conversion feature of the Series A Preferred Stock is an embedded derivative because the redemption feature allows the holder to redeem Series A Preferred Stock for cash at a price which can vary based on the fair market value of the Series A Preferred Stock, which effectively provides the holders with a mechanism to “net settle” the conversion option. Consequently, the embedded conversion option must be bifurcated and accounted for separately because the economic characteristics of this conversion option are not considered to be clearly and closely related to the economic characteristics of the Series A Preferred Stock, which is considered more akin to a debt instrument than equity.
Upon issuance of the Series A Preferred Stock, the Company recorded a liability representing the estimated fair value of the right of holders of the Series A Preferred Stock to receive the fair market value of the Common Stock issuable upon conversion of the Series A Preferred Stock on the redemption date. This liability is adjusted each quarter based on changes in the estimated fair value of such right, and a corresponding income or expense is recorded in change in fair value of the Series A Preferred Stock conversion feature embedded derivatives in the Company’s statements of operations.
The Company uses the option pricing method to value the embedded derivative. The Company used the Black-Scholes options pricing model to estimate the fair value of the conversion option embedded in each series of Biofuels preferred stock prior to February 26, 2010 and the Series A Preferred Stock as of and subsequent to February 26, 2010. The Black-Scholes options pricing model requires the development and use of highly subjective assumptions. These assumptions include the expected volatility of the value of the Company’s equity, the expected conversion date, an appropriate risk-free interest rate and the estimated fair value of the Company’s equity. The expected volatility of the Company’s equity is estimated based on the volatility of the value of the equity of publicly traded companies in a similar industry and general stage of development as the Company. The expected term of the conversion option is based on the period remaining until the contractually stipulated redemption date of February 26, 2014. The risk-free interest rate is based on the yield on U.S. Treasury STRIPs with a remaining term equal to the expected term of the conversion option. The development of the estimated fair value of the Company’s equity is discussed below in “Valuation of the Company’s Equity.”
8
The significant assumptions utilized in the Company’s valuation of the embedded derivative are as follows:
| June 30, 2011 |
December 31, 2010 |
|||||||
| Expected volatility |
40.00 | % | 40.00 | % | ||||
| Risk-free rate |
4.10 | % | 4.10 | % | ||||
Valuation of Seneca Holdco Liability
Associated with the Company’s transaction with Nova Biosource Fuels, LLC, the Company has the option to purchase (Call Option) and Seneca Holdco, LLC (Seneca Holdco) has the option to require the Company to purchase (Put Option) the membership interest of Landlord whose assets consist primarily of a biodiesel plant located in Seneca, Illinois. Both the Put Option and the Call Option have a term of seven years and are exercisable by either party at a price based on a pre-defined formula. The Company has determined the fair value of the amounts financed by Seneca Holdco, the Put Option and the Call Option using an option pricing model. The fair value represents the probability weighted present value of the gain, or loss, that is realized upon exercise of each option. The option pricing model requires the development and use of highly subjective assumptions. These assumptions include (i) the value of Landlord’s equity, (ii) expectations regarding future changes in the value of Landlord’s equity, (iii) expectations about the probability of either option being exercised, including the Company’s ability to list its securities on an exchange or complete a public offering and (iv) an appropriate risk-free rate. Company management considered current public equity markets, relevant regulatory issues, industry conditions and the Company’s position within the industry when estimating the probability that the Company will raise additional capital. Differences in the estimated probability and timing of this event may significantly impact the fair value assigned to the Seneca Holdco liability as management has determined it is not likely that the Put Option will become exercisable in the absence of this event.
The significant assumptions utilized in the Company’s valuation of the Seneca Holdco liability are as follows:
| June 30, 2011 |
December 31, 2010 |
|||||||
| Expected volatility |
50.00 | % | 50.00 | % | ||||
| Risk-free rate |
2.05 | % | 2.45 | % | ||||
| Probability of IPO |
75.00 | % | 70.00 | % | ||||
Preferred Stock Accretion
Beginning October 1, 2007, the date that the Company determined that there was a more than remote likelihood that the then issued and outstanding preferred stock would become redeemable, the Company commenced accretion of the carrying value of the preferred stock over the period until the earliest redemption date, which is August 1, 2011, to the Biofuels preferred stock’s redemption value, plus accrued but unpaid dividends using the effective interest method. This determination was based upon the state of the public equity markets which was restricting the Company’s ability to execute a qualified public offering, the Company’s historical operating results and the volatility in the biodiesel industry which resulted in lower projected profitability. Prior to October 1, 2007, the Company had determined that it was not probable that the preferred stock would become redeemable; therefore, the carrying value was not adjusted in accordance with ASC Topic 480-10-S99, Classification and Measurement of Redeemable Securities (ASC Topic 480-10-S99).
On February 26, 2010, the date the Company determined that there was a more than remote likelihood that the Series A Preferred Stock would become redeemable, the Company commenced accretion of the carrying value of the Series A Preferred Stock over the period until the earliest redemption date (February 26, 2014) to the Series A Preferred Stock’s redemption value, plus accrued but unpaid dividends using the effective interest method. This determination was based on the state of the public equity markets at the time which was restricting the Company’s ability to execute a qualified public offering, the Company’s historical operating results and the volatility in the biodiesel industry which have resulted in lower projected profitability.
Accretion of $6,180 and $12,076 for the three and six months ended June 30, 2011, respectively, and $5,178 and $16,246 for the three and six months ended June 30, 2010, respectively, has been recognized as a reduction to income available to common stockholders in accordance with paragraph 15 of ASC Topic 480-10-S99.
Valuation of the Company’s Equity
The Company considered three generally accepted valuation approaches to estimate the fair value of the aggregate equity of the Company: the income approach, the market approach and the cost approach. Ultimately, the estimated fair value of the aggregate equity of the Company was developed using the Income Approach - Discounted Cash Flow (DCF) method.
Material underlying assumptions in the DCF analysis include the gallons produced and managed, gross margin per gallon, expected long-term growth rates and an appropriate discount rate. Gallons produced and managed as well as the gross margin per gallon were determined based on historical and forward-looking market data.
9
The discount rate used in the DCF analysis is based on macroeconomic, industry and Company-specific factors and reflects the perceived degree of risk associated with realizing the projected cash flows. The selected discount rate represents the weighted average rate of return that a market participant investor would require on an investment in the Company’s debt and equity. The percent of total capital assumed to be comprised of debt and equity when developing the weighted average cost of capital was based on a review of the capital structures of the Company’s publicly traded industry peers. The cost of debt was estimated utilizing the adjusted average Baa-rated corporate bond rate during the previous 12 months representing a reasonable market participant rate based on the Company’s publicly traded industry peers. The Company’s cost of equity was estimated utilizing the capital asset pricing model, which develops an estimated market rate of return based on the appropriate risk-free rate adjusted for the risk of the alternative energy industry relative to the market as a whole, an equity risk premium and a company specific risk premium. The risk premiums included in the discount rate were based on historical and forward looking market data.
Discount rates utilized in the Company’s DCF model are as follows:
| June 30, 2011 |
December 31, 2010 |
|||||||
| Discount rate |
19.50 | % | 16.00 | % | ||||
Valuations derived from this model are subject to ongoing verification and review. Selection of inputs involves management’s judgment and may impact net income. This analysis is performed on a regular basis and takes into account factors that have changed from the last measurement date or the time of the last Common Stock issuance. Other factors affecting our assessment of price include recent purchases or sales of our Common Stock, if available.
Non-Monetary Exchanges
The Company records assets acquired and liabilities assumed through the exchange of non-monetary assets based on the fair value of the assets and liabilities acquired or the fair value of the consideration exchanged, whichever is more readily determinable.
10
Property, Plant and Equipment
Property, plant and equipment is recorded at cost, including applicable construction-period interest, less accumulated depreciation. Maintenance and repairs are expensed as incurred. Depreciation expense is computed on a straight-line method based upon estimated useful lives of the assets. Estimated useful lives are as follows:
| Automobiles and trucks |
5 years | |
| Computers and office equipment |
5 years | |
| Office furniture and fixtures |
7 years | |
| Machinery and equipment |
5-30 years | |
| Leasehold improvements |
the lesser of the lease term or 30 years | |
| Buildings and improvements |
30-40 years |
Goodwill
The Company accounts for goodwill in accordance with ASC Topic 350, Intangibles – Goodwill and Other. Goodwill is reviewed for impairment by reporting unit annually on July 31 or between annual periods when management believes impairment indicators exist. If the carrying value of the reporting unit goodwill is considered impaired, a loss is recognized based on the amount by which the carrying value exceeds the fair market value of the reporting unit goodwill. Fair value is determined using a discounted cash flow methodology involving a significant level of judgment in the assumptions used. Changes to the Company’s strategy or market conditions could significantly impact these judgments and require adjustments to recorded amounts of goodwill. There was no impairment of goodwill recorded in the periods presented.
Impairment of Assets
The Company reviews long-lived assets, including property, plant and equipment and definite-lived assets, for impairment in accordance with ASC Topic 360, Property, Plant and Equipment. Asset impairment charges are recorded for long-lived assets and intangible assets subject to amortization when events and circumstances indicate that such assets may be impaired and the undiscounted net cash flows estimated to be generated by those assets are less than their carrying amounts. If estimated future undiscounted cash flows are not sufficient to recover the carrying value of the assets, an impairment charge is recorded for the amount by which the carrying amount of the assets exceeds its fair value. Fair value is determined by management estimates using discounted cash flow calculations.
The Company impaired capitalized expenses related to various capital investment projects. There were no asset impairment charges for the six months ended June 30, 2011. Asset impairment charges of $141 were recorded for the six months ended June 30, 2010.
Other Noncurrent Assets
Other noncurrent assets include costs related to the issuance of debt, spare parts inventory and a raw material supply agreement. The debt issuance costs are amortized to interest expense over the life of the related debt agreement. The supply agreement is amortized over the term of the agreement according to the volume of feedstock used in operation.
Revenue Recognition
The Company recognizes revenues from the following sources:
| • | the sale of biodiesel and its co-products, as well as Renewable Identification Numbers (RINs) and raw material feedstocks, purchased by us or produced by us at owned and leased manufacturing facilities and manufacturing facilities with which we have tolling arrangements |
| • | fees received under toll manufacturing agreements with third parties |
| • | fees received from federal and state incentive programs for renewable fuels |
| • | fees received for the marketing and sales of biodiesel produced by third parties and from managing operations of third party facilities |
Biodiesel and raw material feedstock revenues are recognized where there is persuasive evidence of an arrangement, delivery has occurred, the price has been fixed or is determinable and collectability can be reasonably assured.
Fees received under toll manufacturing agreements with third parties are generally established as an agreed upon amount per gallon of biodiesel produced. The fees are recognized where there is persuasive evidence of an arrangement, delivery has occurred, the price has been fixed or is determinable and collectability can be reasonably assured.
11
Revenues associated with the governmental incentive programs are recognized when the amount to be received is determinable, collectability is reasonably assured and the sale of product giving rise to the incentive has been recognized.
Fees for managing ongoing operations of third party plants, marketing biodiesel produced by third party plants and from other services are recognized as services are provided. The Company also has performance based incentive agreements that are included as management service revenues. These performance incentives are recognized as revenues when the amount to be received is determinable and collectability is reasonably assured.
During 2010, the Company acted as a sales agent for certain third parties, thus the Company recognized these revenues on a net basis in accordance with ASC Topic 605-45, Revenue Recognition (ASC Topic 605-45).
Stock-Based Compensation
The Company has two stock incentive plans. Eligible award recipients are employees, non-employee directors and advisors who provide service to the Company. The Company accounted for stock-based compensation in accordance with ASC Topic 718, Stock Compensation (ASC Topic 718). Compensation expense of $990 and $1,980 for the three and six months ended June 30, 2011, respectively, and $32 and $68 for the three and six months ended June 30, 2010, respectively, was recorded for stock options and restricted stock units awarded to employees and non-employee directors in return for services. Compensation expense is measured at the grant-date fair value of the award and recognized as compensation expense over the vesting period.
Income Taxes
The Company recognizes deferred taxes by the asset and liability method. Under this method, deferred income taxes are recognized for differences between the financial statement and tax bases of assets and liabilities at enacted statutory tax rates in effect for the years in which differences are expected to reverse. The effect on deferred taxes of a change in tax rates is recognized in income in the period that includes the enactment date. In addition, the carrying amount of deferred tax assets are reviewed to determine whether the establishment of a valuation allowance is necessary. If it is more-likely-than-not that all or a portion of the Company’s deferred tax assets will not be realized, based on all available evidence, a deferred tax valuation allowance would be established. Consideration is given to positive and negative evidence related to the realization of the deferred tax assets. Judgment is required in making this assessment.
In evaluating the available evidence, the Company considers, among other factors, historical financial performance, expectation of future earnings, length of statutory carry forward periods, experience with operating loss and tax credit carry forwards not expiring unused, tax planning strategies and timing of reversals of temporary differences. The Company concluded that recent historical book and tax losses that result in cumulative losses represent negative evidence that cannot be overcome by positive and objectively verifiable evidence. Based on this evaluation, the Company concluded a valuation allowance was required. As of June 30, 2011 and December 31, 2010, respectively, the Company had net deferred income tax assets of $31,177 and $39,220 with an offsetting valuation allowance of $29,677 and $37,720, which resulted in a net deferred tax asset of $1,500 and $1,500. The net amount is offset by an accrued liability for uncertain tax benefits in the amount of $1,500 as of June 30, 2011 and December 31, 2010.
Loss Per Share
Basic and diluted net loss per common share are presented in conformity with the two-class method required for participating securities. The two-class method includes an earnings allocation formula that determines earnings for each class of common stock according to dividends declared and undistributed earnings for the period.
The holders of the Series A Preferred Stock accrue dividends at the rate of $0.88 per share per annum. Dividends are cumulative, accrue on a daily basis from the date of issuance and compound annually from the date of issuance. If dividends on the Series A Preferred Stock have not been paid or declared, the deficiency shall be paid or declared before any dividend is declared for Common Stock. Dividends in arrears do not bear interest. Holders of the Series A Preferred Stock are allowed to participate in the dividends to common stockholders in the event that dividends on Common Stock exceed that of the Series A Preferred Stock as if the Series A Preferred Stock had been converted to Common Stock at the beginning of the year.
The Company calculates the effects of the convertible Series A Preferred Stock on diluted EPS under the if-converted method unless the conversion of the convertible preferred stock is anti-dilutive to basic EPS. The effects of Common Stock options, warrants and restricted stock units on diluted EPS are calculated using the treasury stock method unless the effects are anti-dilutive to EPS.
12
The following potentially dilutive weighted average securities were excluded from the calculation of diluted net loss per share attributable to common stockholders during the periods presented as the effect was anti-dilutive:
| Three Months Ended June 30, 2011 |
Three Months Ended June 30, 2010 |
Six Months Ended June 30, 2011 |
Six Months Ended June 30, 2010 |
|||||||||||||
| Options to purchase common stock |
218,143 | 2,208,492 | 218,478 | 2,208,522 | ||||||||||||
| Restricted stock units |
2,885,113 | — | 2,885,168 | — | ||||||||||||
| Warrants to purchase common stock |
981,241 | 1,313,359 | 1,017,829 | 1,209,427 | ||||||||||||
| Redeemable preferred shares |
13,455,522 | 13,455,522 | 13,455,522 | 13,140,107 | ||||||||||||
|
|
|
|
|
|
|
|
|
|||||||||
| Total |
17,540,019 | 16,977,373 | 17,576,997 | 16,558,056 | ||||||||||||
|
|
|
|
|
|
|
|
|
|||||||||
Use of Estimates
The preparation of financial statements in conformity with GAAP requires management to make estimates and assumptions that affect the reported amounts of assets and liabilities, disclosure of contingent assets and liabilities at the dates of the financial statements and reported amounts of revenues and expenses during the reporting periods. These estimates are based on information that is currently available to management and on various assumptions that the Company believes to be reasonable. Actual results could differ from those estimates.
New Accounting Pronouncements
In January 2010, the FASB issued Accounting Standards Update (ASU) No. 2010-06, Fair Value Measurements and Disclosures (ASU 2010-06), which amends ASC Topic 820, adding new requirements for disclosures for Levels 1 and 2, separate disclosures of purchases, sales issuances and settlements related to Level 3 measurements and clarification of existing fair value disclosures. ASU 2010-06 is in effect for interim and annual periods beginning after December 15, 2009, except for the requirement to provide Level 3 activity of purchases, sales, issuances and settlements on a gross basis, which was effective for the interim period beginning January 1, 2011. The adoption of this guidance did not have a material effect on the Company’s financial statements. See “Note 10 – Fair Value Measurement”.
NOTE 3 — STOCKHOLDERS’ EQUITY OF THE COMPANY
Common Stock
On February 26, 2010, the Company filed its restated certificate of incorporation with the Secretary of State of Delaware. The restated certificate of incorporation authorized 140,000,000 shares of Common Stock at a par value of $0.0001 per share.
Each holder of Common Stock is entitled to one vote for each share of Common Stock held on all matters submitted to a vote of stockholders. Subject to preferences that may apply to shares of outstanding Series A Preferred Stock as outlined below, the holders of outstanding shares of Common Stock are entitled to receive dividends. After the payment of all preferential amounts required to the holders of Series A Preferred Stock, all of the remaining assets of the Company available for distribution shall be distributed ratably among the holders of Common Stock.
Common Stock Warrants
Under the Company’s outstanding warrants, the holder may purchase the number of shares of Common Stock underlying each warrant held for a purchase price ranging from $4.47 to $11.00 per share. The warrant holder may “net exercise” the warrants and use the common shares received upon exercise of the warrants outstanding as the consideration for payment of the exercise price.
The warrant holders are generally protected from anti-dilution by adjustments for any stock dividends, stock split, combination or other recapitalization.
During June 2011, certain warrant holders exercised 20,958 warrants to purchase common shares and 270,176 warrants expired during the month without being exercised.
NOTE 4 — REDEEMABLE PREFERRED STOCK
The Company’s restated certificate of incorporation filed on February 26, 2010 authorizes 60,000,000 shares of preferred stock with a par value of $0.0001. The Company’s Board of Directors has discretion, subject to the approval of certain shareholders, as to the designation of voting rights, dividend rights, redemption price, liquidation preference and other provisions of each issuance.
Dividend Provisions
The holders of the Series A Preferred Stock accrue dividends at the rate of $0.88 per share per annum. Dividends are cumulative, accrue on a daily basis from the date of issuance and compound annually from the date of issuance. If dividends on the
13
Series A Preferred Stock have not been paid or declared, the deficiency shall be paid or declared before any dividend is declared for Common Stock. Dividends in arrears do not bear interest. Holders of the Series A Preferred Stock are allowed to participate in the dividends to common stockholders in the event that dividends on Common Stock exceed that of the Series A Preferred Stock as if the Series A Preferred Stock had been converted to Common Stock at the beginning of the year. Holders of at least seventy-five percent of the outstanding shares of the Series A Preferred Stock that were issued (Preferred Supermajority) may vote to waive the timing or amount of any dividend payment. The Company has not declared any dividends on the Series A Preferred Stock outstanding. There were $16,273 and $10,027 of the Series A Preferred Stock dividends in arrears as of June 30, 2011 and December 31, 2010, respectively.
Liquidation Rights
Upon the occurrence of a voluntary or involuntary liquidation (including consolidations, mergers or sale of assets as defined by the preferred stock agreement), if the remaining net assets of the Company are sufficient, the holders of the Series A Preferred Stock shall be paid no less than liquidation value plus all dividends in arrears (whether or not declared), out of the assets of the Company legally available for distribution to its stockholders, before any payment or distribution is made to any holders of Common Stock.
If upon any liquidation or dissolution, the remaining net assets of the Company are insufficient to pay the amount that the Series A Preferred Stock holders are due as indicated above, the holders of Series A Preferred Stock will share ratably in any distribution of the remaining assets of the Company.
Conversion Rights
All shares of the Series A Preferred Stock will be converted into shares of Common Stock at a 1 to 1 conversion ratio:
| a) | upon a closing of the sale of shares of Common Stock at a level at or exceeding $22.00, in a Qualified Public Offering (QPO), requiring aggregate proceeds to the Company of at least $40 million, or |
| b) | if specified in a written contract or agreement of the Preferred Supermajority, or |
| c) | if the shares of Common Stock have a closing price on NASDAQ or any national securities exchange in excess of $24.75 per share for ninety (90) consecutive trading days with an average daily trading volume on such trading days of at least US $8,000. |
Voting Rights
Each holder of the Series A Preferred Stock is entitled to the number of votes equal to the number of shares of Common Stock into which the Series A Preferred Stock held by such holder are convertible.
Additionally, the Company is prohibited, without obtaining the approval of the Preferred Supermajority, from performing certain activities including, but not limited to, amending shareholder agreements, redeeming or purchasing any outstanding shares of the Company, declaring dividends, making certain capital expenditures and merging or consolidating with other entities.
Redemption Rights
On or after February 26, 2014, the Preferred Supermajority may require that the Company redeem all or part of the issued and outstanding shares of the Series A Preferred Stock out of funds lawfully available; provided, however, that any such redemptions equal in the aggregate $5,000. The redemption price is the greater of the fair market value per share at the date of the redemption election or $13.75 per share of the Series A Preferred Stock, plus accrued and unpaid preferred stock dividends, not to exceed $16.50 per share.
NOTE 5 — VARIABLE INTEREST ENTITIES
In June 2009, the FASB amended its guidance on accounting for VIEs through the issuance of ASU No. 2009-17. The new accounting guidance resulted in a change in our accounting policy effective January 1, 2010. Among other things, the new guidance requires a qualitative analysis to determine the primary beneficiary of a VIE, requires continuous assessments of whether an enterprise is the primary beneficiary of a VIE and amends certain guidance for determining whether an entity is a VIE. Under the new guidance, a VIE must be consolidated if the enterprise has both (a) the power to direct the activities of the VIE that most significantly impact the entity’s economic performance and (b) the obligation to absorb losses or the right to receive benefits from the VIE that could potentially be significant to the VIE. This new accounting guidance was effective for the Company on January 1, 2010 and was applied prospectively.
The Company has invested in four plants owned by independent investment groups. Those companies are SoyMor Biodiesel, LLC (SoyMor), Western Iowa Energy, LLC (WIE), Western Dubuque Biodiesel, LLC (WDB) and East Fork Biodiesel, LLC (EFB). During 2010, the Company impaired the remaining investment balance in EFB. See “Note 7 – Investments” for the investment amounts and the related condensed financial information of these investments. The Company evaluated each investment and determined we do not hold an interest in any of our investments in third party network plants that would give us the power to direct
14
the activities that most significantly impact the economic performance of the network plant. As a result, the Company is not the primary beneficiary and does not consolidate these VIE’s. During July 2011, the Company completed its purchase of substantially all the assets of SoyMor. See “Note 13 – Subsequent Events” for a description of the transaction.
The carrying values and maximum exposure for all unconsolidated VIE’s are as follows:
| June 30, 2011 | December 31, 2010 | |||||||||||||||
| Investment: |
Investments | Maximum Exposure |
Investments | Maximum Exposure |
||||||||||||
| SoyMor |
$ | 964 | $ | 977 | $ | 1,107 | $ | 1,119 | ||||||||
| WIE |
576 | 576 | 576 | 576 | ||||||||||||
| WDB |
2,005 | 2,005 | 2,005 | 2,005 | ||||||||||||
| Bell, LLC |
— | — | 571 | 2,949 | ||||||||||||
|
|
|
|
|
|
|
|
|
|||||||||
| $ | 3,545 | $ | 3,558 | $ | 4,259 | $ | 6,649 | |||||||||
|
|
|
|
|
|
|
|
|
|||||||||
On April 8, 2010, the Company determined that Landlord was a VIE and was consolidated into the Company’s financial statements as it is the primary beneficiary. The Company has a put/call option with Seneca Holdco to purchase Landlord and currently leases the plant for production of biodiesel, both of which represent a variable interest in Landlord that are significant to the VIE. Although the Company does not have an ownership interest in Seneca Holdco, it was determined that the Company is the primary beneficiary due to the related party nature of the entities involved, the Company’s ability to direct the activities that most significantly impact Landlord’s economic performance and the design of Landlord that ultimately gives the Company the majority of the benefit from the use of Seneca’s assets. The Company has elected the fair value option available under ASC Topic 825 on the $4,000 investment made by Seneca Holdco and the associated put /call option (the Seneca Holdco liability). Changes in the fair value after the date of the transaction are recorded in earnings. Those assets are owned by, and those liabilities are obligations of, Landlord, not the Company.
The Company has 50% ownership in Bell, LLC, a VIE joint venture that owns and leases to the Company its corporate office building in Ames, Iowa. Commencing January 1, 2011, the Company has the right to execute a call option with the joint venture member, Dayton Park, LLC, to purchase Bell, LLC; therefore, the Company determined it was the primary beneficiary of Bell, LLC and consolidated Bell, LLC into the Company’s financial statements. The Company is the primary beneficiary due to its ownership interest and having an exercisable call option that allows the Company to direct the activities that most significantly impact Bell, LLC’s economic performance and gives the Company the majority of the benefit from the use of Bell, LLC’s assets. Through consolidation of Bell, LLC on January 1, 2011, the Company had an outstanding promissory note balance of $4,757 with interest accrued monthly at a rate of 5.7% per annum, with a maturity date of February 15, 2013. The note is secured by a mortgage interest in the office building.
The following table summarizes the fair values of the assets and liabilities recorded by the Company as a result of the consolidation of Bell, LLC:
| Final Allocation at January 1, 2011 |
||||
| Assets/(liabilities) acquired: |
||||
| Cash |
$ | 22 | ||
| Property, plant and equipment |
5,881 | |||
| Noncurrent assets |
4 | |||
| Other current liabilities |
(17 | ) | ||
| Debt |
(4,757 | ) | ||
| Other noncurrent liabilities |
(567 | ) | ||
|
|
|
|||
| Carrying value of previously held equity method investment |
$ | 566 | ||
|
|
|
|||
15
NOTE 6 — INVENTORIES
Inventories consist of the following:
| June 30, 2011 |
December 31, 2010 |
|||||||
| Raw materials |
$ | 16,062 | $ | 7,297 | ||||
| Work in process |
891 | 281 | ||||||
| Finished goods |
24,071 | 21,407 | ||||||
|
|
|
|
|
|||||
| Total |
$ | 41,024 | $ | 28,985 | ||||
|
|
|
|
|
|||||
NOTE 7 — INVESTMENTS
Investments consist of the following:
| June 30, 2011 | December 31, 2010 | |||||||||||||||
| Ownership | Balance | Ownership | Balance | |||||||||||||
| Investment and accumulated earnings in: |
||||||||||||||||
| SoyMor (a) |
9 | % | $ | 964 | 9 | % | $ | 1,107 | ||||||||
| WIE (b) |
2 | % | 576 | 2 | % | 576 | ||||||||||
| WDB (c) |
8 | % | 2,005 | 8 | % | 2,005 | ||||||||||
| Bell, LLC (d) |
— | 50 | % | 571 | ||||||||||||
|
|
|
|
|
|||||||||||||
| Total (e) |
$ | 3,545 | $ | 4,259 | ||||||||||||
|
|
|
|
|
|||||||||||||
| (a) | During July 2011, the Company completed its purchase of substantially all the assets of SoyMor. See “Note 13 – Subsequent Events” for a description of the transaction. |
| (b) | As of May 2010, the accounting method for this investment changed from equity method to cost method due to the Company no longer having the ability to significantly influence the operations of WIE. |
| (c) | As of August 2010, the accounting method for this investment was changed from equity method to cost method due to the Company no longer having the ability to significantly influence the operations of WDB. |
| (d) | As of January 1, 2011, the Company consolidated Bell, LLC. Due to the consolidation, the investment was eliminated. |
| (e) | The investments include deferred tax assets of $942 as of June 30, 2011 and December 31, 2010, respectively, fully offset by a valuation allowance. |
The condensed financial information of equity method investments is as follows:
| June 30, 2011 |
December 31, 2010 |
|||||||
| CONDENSED BALANCE SHEET: |
||||||||
| Total current assets |
$ | 142 | $ | 352 | ||||
|
|
|
|
|
|||||
| Total noncurrent assets |
$ | 16,479 | $ | 23,407 | ||||
|
|
|
|
|
|||||
| Total current liabilities |
$ | 468 | $ | 585 | ||||
|
|
|
|
|
|||||
| Total noncurrent liabilities |
$ | 657 | $ | 5,270 | ||||
|
|
|
|
|
|||||
| CONDENSED STATEMENT OF OPERATIONS: |
||||||||||||||||
| Three Months Ended June 30, 2011 |
Three Months Ended June 30, 2010 |
Six Months Ended June 30, 2011 |
Six Months Ended June 30, 2010 |
|||||||||||||
| Sales |
$ | — | $ | 2,667 | $ | — | $ | 6,378 | ||||||||
| Costs of goods sold |
— | (123 | ) | — | (5,201 | ) | ||||||||||
| Operating and other expenses |
(837 | ) | (3,746 | ) | (1,545 | ) | (5,274 | ) | ||||||||
|
|
|
|
|
|
|
|
|
|||||||||
| Net loss |
$ | (837 | ) | $ | (1,202 | ) | $ | (1,545 | ) | $ | (4,097 | ) | ||||
|
|
|
|
|
|
|
|
|
|||||||||
16
NOTE 8 — RELATED PARTY TRANSACTIONS
Related parties include certain investors as well as entities in which the company has an equity method investment or an investment combined with a MOSA or board seat. Investors defined as related parties include (i) the investor having ten percent or more ownership, including convertible preferred stock, in the Company or (ii) the investor holding a board seat on the Company’s Board of Directors.
Summary of Related Party Transactions
| Three Months Ended June 30, 2011 |
Three Months Ended June 30, 2010 |
Six Months Ended June 30, 2011 |
Six Months Ended June 30, 2010 |
|||||||||||||||||||||||
| Revenues - Biodiesel sales |
$ | 1,349 | (a) | $ | 879 | (a) | $ | 3,461 | (a) | $ | 2,259 | (a) | ||||||||||||||
| Revenues - Services |
$ | 24 | (b) | $ | 69 | (b) | $ | 44 | (b) | $ | 610 | (b) | ||||||||||||||
| Cost of goods sold - Biodiesel |
$ | 81,182 | (c) | $ | 25,156 | (c) | $ | 124,673 | (c) | $ | 47,712 | (c) | ||||||||||||||
| Cost of goods sold - Services |
$ | — | (d) | $ | — | (d) | $ | — | (d) | $ | 291 | (d) | ||||||||||||||
| Selling, general, and administrative expenses |
$ | 394 | (e) | $ | 454 | (e) | $ | 703 | (e) | $ | 814 | (e) | ||||||||||||||
| Interest expense |
$ | 168 | (f) | $ | 151 | (f) | $ | 228 | (f) | $ | 204 | (f) | ||||||||||||||
| Interest income |
$ | — | (g) | $ | — | (g) | $ | — | (g) | $ | 180 | (g) | ||||||||||||||
| (a) |
Represents transactions with related parties as follows: |
|||||||||||||||||||||||||
| West Central |
$ | 1 | $ | 3 | $ | 3 | $ | 5 | ||||||||||||||||||
| E D & F Man |
1,348 | 876 | 1,358 | 2,254 | ||||||||||||||||||||||
| Bunge |
— | — | 2,100 | — | ||||||||||||||||||||||
|
|
|
|
|
|
|
|
|
|||||||||||||||||||
| $ | 1,349 | $ | 879 | $ | 3,461 | $ | 2,259 | |||||||||||||||||||
|
|
|
|
|
|
|
|
|
|||||||||||||||||||
| (b) |
Represents transactions with Third Party Network Plants |
|||||||||||||||||||||||||
| (c) |
Represents transactions with related parties as follows: |
|||||||||||||||||||||||||
| West Central |
$ | 13,292 | $ | 511 | $ | 24,271 | $ | 6,446 | ||||||||||||||||||
| Third Party Network plants |
— | — | — | 1,493 | ||||||||||||||||||||||
| Bunge |
60,201 | 24,645 | 91,746 | 39,773 | ||||||||||||||||||||||
| E D & F Man |
7,689 | — | 8,656 | — | ||||||||||||||||||||||
|
|
|
|
|
|
|
|
|
|||||||||||||||||||
| $ | 81,182 | $ | 25,156 | $ | 124,673 | $ | 47,712 | |||||||||||||||||||
|
|
|
|
|
|
|
|
|
|||||||||||||||||||
| (d) |
Represents transactions with Third Party Network Plants |
|||||||||||||||||||||||||
| (e) |
Represents transactions with related parties as follows: |
|||||||||||||||||||||||||
| West Central |
$ | 29 | $ | 47 | $ | 70 | $ | 93 | ||||||||||||||||||
| 416 S. Bell, LLC |
— | 86 | — | 172 | ||||||||||||||||||||||
| Bunge |
365 | 272 | 633 | 472 | ||||||||||||||||||||||
| E D & F Man |
— | 49 | — | 77 | ||||||||||||||||||||||
|
|
|
|
|
|
|
|
|
|||||||||||||||||||
| $ | 394 | $ | 454 | $ | 703 | $ | 814 | |||||||||||||||||||
|
|
|
|
|
|
|
|
|
|||||||||||||||||||
| (f) |
Represents transactions with related parties as follows: |
|||||||||||||||||||||||||
| West Central |
$ | 35 | $ | 32 | $ | 65 | $ | 77 | ||||||||||||||||||
| Bunge |
133 | 119 | 163 | 127 | ||||||||||||||||||||||
|
|
|
|
|
|
|
|
|
|||||||||||||||||||
| $ | 168 | $ | 151 | $ | 228 | $ | 204 | |||||||||||||||||||
|
|
|
|
|
|
|
|
|
|||||||||||||||||||
| (g) |
Represents transactions with Blackhawk Biofuels |
|||||||||||||||||||||||||
17
Summary of Related Party Balances
| As
of June 30, 2011 |
As of December 31, 2010 |
|||||||||||||
| Accounts receivable |
$ | 234 | (a) | $ | 1,146 | (a) | ||||||||
| Accounts payable |
$ | 13,265 | (b) | $ | 3,827 | (b) | ||||||||
| (a) |
Represents balances with related parties as follows: |
|||||||||||||
| West Central |
$ | 20 | $ | 22 | ||||||||||
| Third Party Network Plants |
18 | 12 | ||||||||||||
| Bunge |
— | 46 | ||||||||||||
| E D & F Man |
196 | 1,066 | ||||||||||||
|
|
|
|
|
|||||||||||
| $ | 234 | $ | 1,146 | |||||||||||
|
|
|
|
|
|||||||||||
| (b) |
Represents balances with related parties as follows: |
|||||||||||||
| West Central |
$ | 2,566 | $ | 2,539 | ||||||||||
| Third Party Network Plants |
— | 2 | ||||||||||||
| Bunge |
10,399 | 1,286 | ||||||||||||
| E D & F Man |
300 | — | ||||||||||||
|
|
|
|
|
|||||||||||
| $ | 13,265 | $ | 3,827 | |||||||||||
|
|
|
|
|
|||||||||||
West Central Cooperative
The Company purchases once-refined soybean oil from West Central Cooperative (West Central) and is required to pay interest for amounts owed on extended trade terms. The Company also had biodiesel and co-product sales.
West Central leases the land under the Company’s production facility at Ralston, Iowa to the Company at an annual cost of one dollar. The Company is responsible for the property taxes, insurance, utilities and repairs for the facility relating to this lease. The lease has an initial term of twenty years and the Company has options to renew the lease for an additional thirty years.
At the time of the signing of the contribution agreement, the Company executed an asset use agreement with West Central to provide for the use of certain assets, such as office space, maintenance equipment and utilities. The agreement requires the Company to pay West Central its proportionate share of certain costs incurred by West Central. This agreement has the same term as the land lease.
At the time of the signing of the contribution agreement, the Company entered into a contract for services with West Central, to provide certain corporate and administrative services such as human resources, information technology and accounting. The agreement requires the Company to pay West Central the proportionate share of the costs associated with the provision of services, plus a 15% margin. The agreement had an initial one-year term and is cancellable thereafter upon six months notice by either party.
Bunge North America
The Company purchases feedstocks from Bunge North America, Inc. (Bunge) for the production of biodiesel. The costs associated with the purchased feedstocks are reflected in costs of goods sold – biodiesel when sold to the end customer. The Company also made sales of biodiesel and raw materials to Bunge.
During July 2009, the Company entered into an agreement for Bunge to provide services related to the procurement of raw materials and the purchase and resale of biodiesel produced by the Company. The Company is required to pay interest for the aggregate outstanding amounts owed to Bunge. The agreement has a three-year term and either party has the ability to cancel the agreement after the term ends. Also, as part of the agreement, the Company is required to pay an incentive fee to Bunge for meeting certain hedging goals utilizing Bunge’s advice.
E D & F Man Holdings Ltd.
In August 2006, at the time of the initial closing of its preferred stock investment, the Company entered into a glycerin marketing agreement and various terminal lease agreements with one of E D & F Man Holdings Ltd’s (E D & F) then wholly-owned subsidiaries, Westway Feed Products, Inc. (Westway). Under the glycerin marketing agreement, Westway has an exclusive right to market the glycerin produced at each of the Company’s owned and managed facilities. This contract has a term of five years and automatically renews in one-year periods thereafter unless terminated by either party.
The Company also entered into a tolling agreement with E D & F for biodiesel to be produced out of the Company’s Houston, Texas biodiesel production facility. Additionally, the Company purchased biodiesel from E D & F.
18
Third Party Network Plants
The Company receives certain fees for the marketing and sale of product produced by and the management of Third Party Network Plants’ operations, in which the Company has also invested. As an additional incentive to the Company and additional compensation for the marketing, sales and management services being rendered, the Third Party Network Plant pays a bonus to the Company on an annual basis equal to a percentage of the net income of the Third Party Network Plant, as defined by the management agreement. As of June 30, 2011, the Company managed one other biodiesel production facility owned primarily by an independent investment group with an aggregate of 30 mmgy capacity. During July 2011, the Company completed its purchase of substantially all the assets of SoyMor. See “Note 13 – Subsequent Events” for a description of the transaction.
Bell, LLC
The Company rents a building for administrative uses under an operating lease from Bell, LLC.
NOTE 9 — DERIVATIVE INSTRUMENTS
The Company has entered into derivatives to hedge its exposure to price risk related to feedstock inventory and biodiesel finished goods inventory. Additionally, the Company has entered into an interest rate swap with the objective of managing risk caused by fluctuations in interest rates associated with the REG Danville note payable. The Company does not enter into derivative transactions for trading purposes.
These derivative contracts are accounted for in accordance with ASC Topic 815. ASC Topic 815 requires that an entity recognize and record all derivatives on the balance sheet at fair value. All of the Company’s derivatives are designated as non-hedge derivatives and are utilized to manage cash flow. Although the contracts may be effective economic hedges of specified risks, they are not designated as, nor accounted for, as hedging instruments. Unrealized gains and losses on commodity futures, swaps and options contracts used to hedge feedstock purchases or biodiesel inventory are recognized as a component of biodiesel costs of goods sold reflected in current results of operations. Commodity hedge gains and losses are generally offset by other corresponding changes in gross margin through changes in either biodiesel sales price and/or feedstock price. Unrealized gains and losses on the interest rate swap are recorded in change in fair value of interest rate swap in the Company’s statements of operations. ASC 815 requires all derivative financial instruments to be recorded on the balance sheet at fair value. The Company’s derivatives are not designated as hedges and are utilized to manage cash flow. The changes in fair value of the derivative instruments are recorded through earnings in the period of change.
As of June 30, 2011, the Company has entered into heating oil and soybean oil derivative instruments and an interest rate swap agreement. The Company has entered into heating oil and soybean oil commodity-based derivatives in order to protect gross profit margins from potentially adverse effects of price volatility on biodiesel sales where the prices are set at a future date. As of June 30, 2011, the Company had 1,253 open commodity contracts. In addition, the Company manages interest rate risk associated with the REG Danville variable interest rate note payable using a fixed rate swap. The interest rate swap agreement had outstanding notional values of $19,515 and $20,747 as of June 30, 2011 and December 31, 2010, respectively. The agreement effectively fixes the variable component of the interest rate on the Term Loan at 3.67% through November 2011. The fair value of the interest rate swap agreement was $280 and $612 at June 30, 2011 and December 31, 2010, respectively, and is recorded in accrued expense and other liabilities and other noncurrent liabilities, respectively. The interest rate swap was not designated as an accounting hedge under ASC Topic 815 and thus all gains and losses are recorded currently in earnings.
REG Danville’s interest rate swap contains a credit support arrangement that is directly linked to the notes payable with the same counterparty. Therefore, the interest rate swap counterparty would have access to the debt service fund or other collateral posted by REG Danville as a result of any failure to perform under the interest rate swap agreement. As of June 30, 2011 and December 31, 2010, the Company posted $4,377 and $2,119, respectively, of collateral associated with its commodity-based derivatives with a net liability position of $572 and $483, respectively.
The Company’s preferred stock embedded conversion feature is further discussed in “Note 2 – Summary of Significant Accounting Policies”.
19
The following tables provide details regarding the Company’s derivative financial instruments:
| As of December 31, 2010 |
||||||||||||
| Asset Derivatives |
Liability Derivatives |
|||||||||||
| Balance Sheet Location |
Fair Value |
Balance Sheet Location |
Fair Value |
|||||||||
| Embedded derivative | Preferred stock embedded conversion feature derivatives | $ | 61,761 | |||||||||
| Interest rate swap | Other liabilities | 612 | ||||||||||
| Commodity swaps | Prepaid expenses and other assets | $ | 78 | Prepaid expenses and other assets | 561 | |||||||
|
|
|
|
|
|||||||||
| Total derivatives | $ | 78 | $ | 62,934 | ||||||||
|
|
|
|
|
|||||||||
| As of June 30, 2011 |
||||||||||||
| Asset Derivatives |
Liability Derivatives |
|||||||||||
| Balance Sheet Location |
Fair Value |
Balance Sheet Location |
Fair Value |
|||||||||
| Embedded derivative | Preferred stock embedded conversion feature derivatives | $ | 78,849 | |||||||||
| Interest rate swap | Other liabilities | 280 | ||||||||||
| Commodity swaps | Prepaid expenses and other assets | $ | 1,220 | Prepaid expenses and other assets | 1,766 | |||||||
| Commodity options | Prepaid expenses and other assets | 227 | Prepaid expenses and other assets | 253 | ||||||||
|
|
|
|
|
|||||||||
| Total derivatives | $ | 1,447 | $ | 81,148 | ||||||||
|
|
|
|
|
|||||||||
| Three Months Ended June 30, 2011 |
Three Months Ended June 30, 2010 |
Six Months Ended June 30, 2011 |
Six Months Ended June 30, 2010 |
|||||||||||||||
| Location of Gain (Loss) Recognized in Income |
Amount of Gain (Loss) Recognized in Income on Derivatives |
Amount of Gain (Loss) Recognized in Income on Derivatives |
Amount of Gain (Loss) Recognized in Income on Derivatives |
Amount
of Gain (Loss) Recognized in Income on Derivatives |
||||||||||||||
| Embedded derivative |
Change in fair value of preferred stock conversion feature embedded derivatives | $ | (19,645 | ) | $ | 5,001 | $ | (17,088 | ) | $ | 5,001 | |||||||
| Interest rate swap |
Change in fair value of interest rate swap | 166 | 116 | 332 | 188 | |||||||||||||
| Commodity futures |
Cost of goods sold - Biodiesel | (87 | ) | — | (87 | ) | — | |||||||||||
| Commodity swaps |
Cost of goods sold - Biodiesel | 1,293 | 704 | (2,503 | ) | 498 | ||||||||||||
| Commodity options |
Cost of goods sold - Biodiesel | 466 | — | 525 | — | |||||||||||||
|
|
|
|
|
|
|
|
|
|||||||||||
| Total |
$ | (17,807 | ) | $ | 5,821 | $ | (18,821 | ) | $ | 5,687 | ||||||||
|
|
|
|
|
|
|
|
|
|||||||||||
NOTE 10 — FAIR VALUE MEASUREMENT
ASC Topic 820 establishes a framework for measuring fair value in GAAP and expands disclosures about fair market value measurements. ASC Topic 820 clarifies that fair value is an exit price, representing the amount that would be received to sell an asset or paid to transfer a liability in an orderly transaction between market participants. As such, fair value is a market-based measurement that should be determined based on assumptions that market participants would use in pricing an asset or liability. As a basis for considering assumptions, ASC Topic 820 establishes a three-tier fair value hierarchy, which prioritizes the inputs used in measuring fair value as follows:
| • | Level 1 — Quoted prices for identical instruments in active markets. |
20
| • | Level 2 — Quoted prices for similar instruments in active markets, quoted prices for identical or similar instruments in markets that are not active and model-derived valuations, in which all significant inputs are observable in active markets. |
| • | Level 3 — Unobservable inputs in which there is little or no market data, which require the reporting entity to develop its own assumptions. |
In addition, ASC Topic 820 requires disclosures about the use of fair value to measure assets and liabilities to enable the assessment of inputs used to develop fair value measures, and for unobservable inputs, to determine the effects of the measurements on earnings.
A summary of assets (liabilities) measured at fair value as of December 31, 2010 and June 30, 2011 is as follows:
| As of December 31, 2010 | ||||||||||||||||
| Total | Level 1 | Level 2 | Level 3 | |||||||||||||
| Preferred stock embedded derivatives |
$ | (61,761 | ) | $ | — | $ | — | $ | (61,761 | ) | ||||||
| Interest rate swap |
(612 | ) | — | (612 | ) | — | ||||||||||
| Seneca Holdco liability |
(10,406 | ) | — | — | (10,406 | ) | ||||||||||
| Restricted cash |
401 | 401 | — | — | ||||||||||||
| Commodity derivatives |
(483 | ) | — | (483 | ) | — | ||||||||||
|
|
|
|
|
|
|
|
|
|||||||||
| $ | (72,861 | ) | $ | 401 | $ | (1,095 | ) | $ | (72,167 | ) | ||||||
|
|
|
|
|
|
|
|
|
|||||||||
| As of June 30, 2011 | ||||||||||||||||
| Total | Level 1 | Level 2 | Level 3 | |||||||||||||
| Preferred stock embedded derivatives |
$ | (78,849 | ) | $ | — | $ | — | $ | (78,849 | ) | ||||||
| Interest rate swap |
(280 | ) | — | (280 | ) | — | ||||||||||
| Seneca Holdco liability |
(11,629 | ) | — | — | (11,629 | ) | ||||||||||
| Cash and cash equivalents |
312 | 312 | — | — | ||||||||||||
| Restricted cash |
2,008 | 2,008 | — | — | ||||||||||||
| Commodity swaps |
(546 | ) | — | (546 | ) | — | ||||||||||
| Commodity options |
(26 | ) | — | (26 | ) | — | ||||||||||
|
|
|
|
|
|
|
|
|
|||||||||
| $ | (89,010 | ) | $ | 2,320 | $ | (852 | ) | $ | (90,478 | ) | ||||||
|
|
|
|
|
|
|
|
|
|||||||||
The following is a reconciliation of the beginning and ending balances for liabilities measured at fair value on a recurring basis using significant unobservable inputs (Level 3) during the six months ended June 30, 2011 and 2010:
| Preferred Stock Embedded Derivatives |
Seneca Holdco Liability |
Blackhawk Subordinated Debt |
Blackhawk Unit Interest |
|||||||||||||
| Ending balance - December 31, 2009 |
$ | (4,104 | ) | $ | — | $ | — | $ | — | |||||||
| Total unrealized gains (losses) |
— | — | — | — | ||||||||||||
| Deconsolidation of Blackhawk |
— | — | 24,298 | 3,678 | ||||||||||||
| Purchases, issuance, and settlements, net |
(49,448 | ) | — | — | 291 | |||||||||||
| Purchase accounting consolidation |
— | — | (24,298 | ) | (3,969 | ) | ||||||||||
|
|
|
|
|
|
|
|
|
|||||||||
| Ending balance - March 31, 2010 |
(53,552 | ) | — | — | — | |||||||||||
| Total unrealized gains (losses) |
5,001 | (371 | ) | — | — | |||||||||||
| Purchases, issuance, and settlements, net |
— | — | — | — | ||||||||||||
| Purchase accounting consolidation |
(1 | ) | (7,096 | ) | — | — | ||||||||||
|
|
|
|
|
|
|
|
|
|||||||||
| Ending balance - June 30, 2010 |
$ | (48,552 | ) | $ | (7,467 | ) | $ | — | $ | — | ||||||
|
|
|
|
|
|
|
|
|
|||||||||
| Ending balance - December 31, 2010 |
$ | (61,761 | ) | $ | (10,406 | ) | $ | — | $ | — | ||||||
| Total unrealized gains |
2,557 | 727 | — | — | ||||||||||||
| Purchases |
— | — | — | — | ||||||||||||
| Issuance |
— | — | — | — | ||||||||||||
| Settlements |
— | 150 | — | — | ||||||||||||
|
|
|
|
|
|
|
|
|
|||||||||
| Ending balance - March 31, 2011 |
(59,204 | ) | (9,529 | ) | — | — | ||||||||||
| Total unrealized gains |
(19,645 | ) | (2,250 | ) | — | — | ||||||||||
| Purchases |
— | — | — | — | ||||||||||||
| Issuance |
— | — | — | — | ||||||||||||
| Settlements |
— | 150 | — | — | ||||||||||||
|
|
|
|
|
|
|
|
|
|||||||||
| Ending balance - June 30, 2011 |
$ | (78,849 | ) | $ | (11,629 | ) | $ | — | $ | — | ||||||
|
|
|
|
|
|
|
|
|
|||||||||
21
The company used the following methods and assumptions to estimate fair value of its financial instruments:
Valuation of Preferred Stock embedded conversion feature derivatives: The estimated fair value of the derivative instruments embedded in the Company’s outstanding preferred stock is determined using the option pricing method to allocate the fair value of the underlying stock to the various components comprising the security, including the embedded derivative. The allocation was performed based on each class of preferred stock’s liquidation preference and relative seniority. Derivative liabilities are adjusted to reflect fair value at each period end. The effects of interactions between embedded derivatives are calculated and accounted for in arriving at the overall fair value of the financial instruments.
Interest rate swap: The fair value of the interest rate swap was determined based on a discounted cash flow approach using market observable swap curves.
Restricted cash: This instrument consists of money market mutual funds whose fair value is based on quoted prices of identical assets in an active exchange-traded market and are reflected in Level 1.
Commodity derivatives: The instruments held by the Company consist primarily of futures contracts, swap agreements, purchased put options and written call options. The fair value of contracts based on quoted prices of identical assets in an active exchange-traded market is reflected in Level 1. Contracts whose fair value is determined based on quoted prices of similar contracts in over-the-counter markets are reflected in Level 2.
Seneca Holdco liability: The liability represents the combination of the Call Option and the Put Option related to the purchase of the membership interest of Landlord. The fair value of the Seneca Holdco liability is determined using an option pricing model and represents the probability weighted present value of the gain that is realized upon exercise of each option.
Notes payable and lines of credit: The fair value of long-term debt and lines of credit was established using discounted cash flow calculations and current market rates.
The estimated fair values of the Company’s financial instruments, which are not recorded at fair value, are as follows:
| June 30, 2011 | December 31, 2010 | |||||||||||||||
| Asset
(Liability) Carrying Amount |
Fair Value | Asset (Liability) Carrying Amount |
Fair Value | |||||||||||||
| Financial Liabilities: |
||||||||||||||||
| Notes payable and lines of credit |
$ | (99,917 | ) | $ | (100,133 | ) | $ | (96,125 | ) | $ | (96,228 | ) | ||||
NOTE 11 — SEGMENTS
The Company reports its operating segments based on services provided to customers, which include Biodiesel, Services and Corporate and other activities. The accounting policies of the segments are the same as those described in the summary of significant accounting policies. The Company has chosen to differentiate the segments based on the products and services each segment offers.
The Biodiesel segment processes waste vegetable oils, inedible animal fats, virgin vegetable oils and other feedstocks and methanol into biodiesel. The Biodiesel segment also includes the Company’s purchases and resale of biodiesel and raw material feedstocks produced by third parties. Revenue is derived from the sale of the processed biodiesel, fees from toll manufacturing arrangements, related byproducts, RINs and renewable energy government incentive payments. The Services segment offers services for managing the construction of biodiesel production facilities and managing ongoing operations of third party plants and collects fees related to the services provided. The Company does not allocate items that are of a non-operating nature or corporate expenses to the business segments. Intersegment revenues are reported by the Services segment, which manages the construction and operations of facilities included in the Biodiesel segment. Revenues are recorded by the Services segment at cost. Corporate expenses consist of corporate office expenses including compensation, benefits, occupancy and other administrative costs, including management service expenses.
22
The following table represents the significant items by segment for the results of operations for the three and six months ended June 30, 2011 and 2010 and as of June 30, 2011 and December 31, 2010:
| Three Months Ended June 30, 2011 |
Three Months Ended June 30, 2010 |
Six Months
Ended June 30, 2011 |
Six Months Ended June 30, 2010 |
|||||||||||||
| Revenues: |
||||||||||||||||
| Biodiesel |
$ | 196,273 | $ | 46,191 | $ | 300,687 | $ | 82,818 | ||||||||
| Services |
1,792 | 890 | 3,916 | 2,538 | ||||||||||||
| Intersegment revenues |
(1,753 | ) | (744 | ) | (3,856 | ) | (1,530 | ) | ||||||||
|
|
|
|
|
|
|
|
|
|||||||||
| $ | 196,312 | $ | 46,337 | $ | 300,747 | $ | 83,826 | |||||||||
|
|
|
|
|
|
|
|
|
|||||||||
| Income (loss) before income taxes and loss from equity investments: |
||||||||||||||||
| Biodiesel |
$ | 30,378 | $ | 5,066 | $ | 38,603 | $ | 6,869 | ||||||||
| Services |
15 | 28 | 18 | 475 | ||||||||||||
| Corporate and other (a) |
(31,258 | ) | (2,720 | ) | (35,686 | ) | (8,002 | ) | ||||||||
|
|
|
|
|
|
|
|
|
|||||||||
| $ | (865 | ) | $ | 2,374 | $ | 2,935 | $ | (658 | ) | |||||||
|
|
|
|
|
|
|
|
|
|||||||||
| Depreciation and amortization expense: |
||||||||||||||||
| Biodiesel |
$ | 1,702 | $ | 1,373 | $ | 3,716 | $ | 2,298 | ||||||||
| Services |
1 | — | 1 | — | ||||||||||||
| Corporate and other |
314 | — | 314 | — | ||||||||||||
|
|
|
|
|
|
|
|
|
|||||||||
| $ | 2,017 | $ | 1,373 | $ | 4,031 | $ | 2,298 | |||||||||
|
|
|
|
|
|
|
|
|
|||||||||
| Purchases of property, plant, and equipment: |
||||||||||||||||
| Biodiesel |
$ | 255 | $ | 2,003 | $ | 992 | $ | 2,064 | ||||||||
| Services |
33 | — | 33 | — | ||||||||||||
| Corporate and other |
181 | — | 181 | — | ||||||||||||
|
|
|
|
|
|
|
|
|
|||||||||
| $ | 469 | $ | 2,003 | $ | 1,206 | $ | 2,064 | |||||||||
|
|
|
|
|
|
|
|
|
|||||||||
| June 30, 2011 |
December 31, 2010 |
|||||||||||||||
| Goodwill: |
||||||||||||||||
| Biodiesel |
$ | 68,784 | $ | 68,784 | ||||||||||||
| Services |
16,080 | 16,080 | ||||||||||||||
|
|
|
|
|
|||||||||||||
| $ | 84,864 | $ | 84,864 | |||||||||||||
|
|
|
|
|
|||||||||||||
| Assets: |
||||||||||||||||
| Biodiesel |
$ | 323,080 | $ | 310,021 | ||||||||||||
| Services |
20,788 | 20,799 | ||||||||||||||
| Corporate and other (b) |
60,081 | 38,823 | ||||||||||||||
|
|
|
|
|
|||||||||||||
| $ | 403,949 | $ | 369,643 | |||||||||||||
|
|
|
|
|
|||||||||||||
| (a) | Corporate and other includes income/(expense) not associated with the business segments, such as corporate general and administrative expenses, shared service expenses, interest expense and interest income, all reflected on an accrual basis of accounting. |
| (b) | Corporate and other includes cash and other assets not associated with the business segments, including investments. |
NOTE 12 — COMMITMENTS AND CONTINGENCIES
During July 2009 the Company entered into a series of agreements with one of its shareholders, Bunge, whereby Bunge would purchase raw material inputs for later resale to the Company and use in producing biodiesel. Additionally, the agreements provide for Bunge to purchase biodiesel produced by the Company for resale to the Company’s customers. These agreements provide financing for the Company’s raw material and finished goods inventory not to exceed aggregate amounts outstanding of $10,000. In exchange for this financing, Bunge will receive fees equal to the greater of 30 day LIBOR plus 7.5% or 10% as determined based on the amount of inventory financed, plus a monthly service fee of $40 and incentive fees not to exceed $1,500 per annum. As of June 30, 2011 and December 31, 2010, there was $245 and $280, respectively, in incentive fees due to Bunge.
The Company is involved in legal proceedings in the normal course of business. The Company currently believes that any ultimate liability arising out of such proceedings will not have a material effect on the Company’s financial position, results of operations or cash flows.
23
The Company was in compliance with all restrictive financial covenants associated with its borrowings as of June 30, 2011.
NOTE 13 — SUBSEQUENT EVENTS
The Company has performed an evaluation of subsequent events through the date the financial statements were issued.
On July 12, 2011, the Company and REG Albert Lea, LLC (REG Albert Lea), a subsidiary of the Company, completed its asset acquisition of SoyMor Cooperative and SoyMor Biodiesel, LLC (collectively known as SoyMor Assets). Pursuant to the Asset Purchase Agreement, dated June 8, 2011, the Company issued 1,850,000 shares of its Common Stock in exchange for the transfer of substantially all of the SoyMor Assets and assumed certain liabilities. The assets of SoyMor consisted primarily of a 30 mmgy nameplate capacity biodiesel facility located in Albert Lea, Minnesota, as well as, a co-located soy lecithin production facility. Of the 1,850,000 shares issued, REG will own 166,139 shares due to its original investment in SoyMor Biodiesel, LLC.
On July 15, 2011, holders of the Company’s Series A Preferred Stock approved a second amended and restated certificate of incorporation, to be effective immediately prior to the completion of the Company’s proposed initial public offering, to, among other things, convert and redeem the Company’s outstanding Series A Preferred Stock for a combination of Common Stock, Series B preferred stock and a contingent cash payment.
On July 18, 2011, the Company issued a press release pursuant to Rule 134 under the Securities Act of 1933, as amended, announcing the filing of its registration statement on Form S-1 with the Securities and Exchange Commission for the purposes of an initial public offering.
On August 4, 2011, REG Albert Lea entered into a Loan Agreement with USRG Holdco IX, LLC (“USRG”) and USRG Management Company, LLC, under which USRG agreed to loan REG Albert Lea $10 million (the “Loan”) for the purpose of purchasing feedstocks and chemicals for REG Albert Lea’s biodiesel production facility located in Freeborn County, Minnesota. The Loan is secured by the assets and operations of the facility.
******
| ITEM 2. | MANAGEMENT’S DISCUSSION AND ANALYSIS OF FINANCIAL CONDITION AND RESULTS OF OPERATIONS |
This report contains forward-looking statements regarding Renewable Energy Group, Inc., or we or the Company, that involve risks and uncertainties such as anticipated financial performance, business prospects, technological developments, products, possible strategic initiatives and similar matters. In some cases, you can identify forward-looking statements by terms such as “may,” “might,” “objective,” “intend,” “should,” “could,” “can,” “would,” “expect,” “believe,” “estimate,” “predict,” “potential,” “plan,” or the negative of these terms, and similar expressions intended to identify forward-looking statements.
These forward-looking statements include, but are not limited to, statements about facilities currently under development progressing to the construction and operational stages, including planned capital expenditures and our ability to obtain financing for such construction; existing or proposed legislation affecting the biodiesel industry, including governmental incentives and tax credits; expectations regarding our REG Danville bank debt non-compliance; our utilization of forward contracting and hedging strategies to minimize feedstock and other input price risk; anticipated future revenue sources from our operational management and facility construction services; the expected effect of current and future environmental laws and regulations on our business and financial condition; our ability to renew existing and expired contracts at similar or more favorable terms; expected technological advances in biodiesel production methods; our competitive advantage relating to input costs relative to our competitors; the market for biodiesel and potential biodiesel consumers; our ability to further develop our financial, managerial and other internal controls and reporting systems to accommodate future growth; expectations regarding the realization of deferred tax assets and the establishment and maintenance of tax reserves and anticipated trends; expectations regarding our expenses and sales; anticipated cash needs and estimates regarding capital requirements and needs for additional financing; and challenges in our business and the biodiesel market.
These statements reflect current views with respect to future events and are based on assumptions and subject to risks and uncertainties. We note that a variety of factors could cause actual results and experience to differ materially from the anticipated results or expectations expressed in our forward-looking statements. Given these uncertainties, you should not place undue reliance on these forward-looking statements. Forward-looking statements are subject to risks and uncertainties that could cause actual results to differ materially from those expected. These risks and uncertainties include, but are not limited to, those risks discussed in Item 1A under “Risk Factors” in Part I of our Annual Report on Form 10-K for the year ended December 31, 2010. We encourage you to read this Management’s Discussion and Analysis of Financial Condition and Results of Operations in conjunction with the accompanying condensed consolidated financial statements and related notes.
24
Overview
We are the largest producer of biodiesel in the United States. We have been a leader of the biodiesel industry since 1996. We have transitioned from a single plant production facility, then being primarily an operator of a third party-owned network of facilities, and now we own five operating biodiesel production facilities and lease a sixth biodiesel facility. We own biodiesel production facilities with nameplate capacities consisting of: a 12 mmgy facility in Ralston, Iowa, a 35 mmgy facility near Houston, Texas, or the Houston Facility, a 45 mmgy facility in Danville, Illinois and a 30 mmgy facility in Newton, Iowa. As part of our acquisition strategy, in April 2010, we signed a seven year lease for a 60 mmgy facility in Seneca, Illinois, and on July 12, 2011, we completed our acquisition of SoyMor Biodiesel, LLC’s, or SoyMor, 30 mmgy biodiesel production facility in Albert Lea, Minnesota, bringing our total nameplate production capacity to 212 mmgy. During 2010, we sold 68 million gallons of biodiesel, including five million gallons we purchased from third parties and resold, and including eight million gallons we manufactured for others. The 68 million gallons we sold in 2010 represented approximately 22% of the total biodiesel produced in the United States in 2010.
As noted above, on July 12, 2011, we acquired SoyMor’s production facility, now named REG Albert Lea, LLC. We built and operated this facility under a management and operation services agreement, or MOSA, until SoyMor idled the facility in February 2008. We intend to recommence operations of the facility using soybean oil feedstock immediately and to upgrade the facility to process a wide variety of lower cost feedstocks as project financing becomes available and market conditions warrant. See “Note 13 – Subsequent Events” for a description of the transaction.
The recent implementation of the Renewable Fuel Standard, or RFS2, has led to a significant year-over-year increase in demand and substantial increase in sales price per gallon. Over the last three years, prior to the implementation of RFS2, challenging biodiesel industry conditions have had a significant effect on our results of operations. The United States biodiesel industry experienced a downturn beginning in 2008 as a result of a variety of factors, including the imposition of extensive anti-dumping tariffs and countervailing duties on exports of United States biodiesel to the European Union, or EU, the worldwide economic crisis, falling petroleum-based diesel fuel prices, an uncertain regulatory environment and high soybean oil prices. As a result of these factors, the average price for B100 Upper Midwest Biodiesel as reported by The Jacobsen fell from $4.47 per gallon in 2008 to $3.07 per gallon in 2009.
In response to these industry dynamics, we reduced expenses in our biodiesel business by shifting production to lower cost feedstocks such as inedible animal fat, used cooking oil and inedible corn oil. In addition, we periodically idled our plants when there was insufficient demand. Over this three-year period, the services segment of our business became significantly less active as construction of new biodiesel production facilities largely stopped and the third party-owned facilities managed by us also saw decreased volume from poor industry conditions. However, in anticipation of increased demand for biodiesel as a result of RFS2, we elected to use our available resources and our position as an industry leader to acquire two plants with lower cost feedstock processing capabilities which we then managed. We also leased and obtained an option to buy a third lower cost feedstock facility and focused on developing sufficient and reliable supplies of lower cost feedstocks.
During the second half of 2010, we and the biodiesel industry began to benefit from RFS2, which became effective July 1, 2010 and requires Obligated Parties to use specified amounts of biomass-based diesel, as discussed further below. In addition, the $1.00 per gallon federal blenders’ tax credit, which had expired as of December 31, 2009, was reinstated in December 2010 retroactively for all of 2010 and prospectively for 2011. As a result of these regulatory changes, as well as improving general economic conditions and relatively high petroleum prices, the price of and demand for biodiesel have increased significantly. In the first six months of 2010, prior to the effectiveness of RFS2 and the reinstatement of the blenders’ tax credit, our average price for B100 was $3.14 per gallon. In the first six months of 2011, our average price per gallon of B100 was $4.88, or 55% higher than the average price during the first six months of 2010, and we sold approximately 53 million gallons of biodiesel, compared to approximately 68 million gallons sold in all of 2010.
We have completed eight acquisitions since the beginning of 2010, which include the acquisition of five biodiesel plants, and we intend to continue to seek opportunities to acquire biodiesel production facilities located in the United States and in international markets. We own three partially completed biodiesel production facilities. In 2007, we began construction of two 60 mmgy nameplate production capacity facilities, one near New Orleans, Louisiana and the other in Emporia, Kansas. In February 2008, we halted construction of these facilities as a result of conditions in the biodiesel industry and our inability to obtain financing necessary to complete construction of the facilities. Construction of the New Orleans facility is approximately 45% complete and construction of the Emporia facility is approximately 20% complete. Further, during the third quarter of 2010, we acquired a 15 mmgy nameplate biodiesel production capacity facility in Clovis, New Mexico which is approximately 50% complete. We plan to complete construction of these facilities as financing becomes available, subject to market conditions. We expect that the aggregate cost to complete construction and commence operations of these three facilities is in the range of approximately $130 to $140 million, excluding working capital.
25
We derive revenues from two reportable business segments: Biodiesel and Services
Biodiesel Segment
Our Biodiesel segment, as reported herein, includes:
| • | the operations of the following biodiesel production facilities: |
| • | a 12 mmgy nameplate biodiesel production facility located in Ralston, Iowa; |
| • | a 35 mmgy nameplate biodiesel production facility located near Houston, Texas, since its acquisition in June 2008; |
| • | a 45 mmgy nameplate biodiesel production facility located in Danville, Illinois, since its acquisition in February 2010; |
| • | a 30 mmgy nameplate biodiesel production facility located in Newton, Iowa, since its acquisition in March 2010; |
| • | a leased 60 mmgy nameplate biodiesel production facility located in Seneca, Illinois, which began production in August 2010, since commencement of the lease in April 2010; |
| • | a 30 mmgy nameplate biodiesel production facility located in Albert Lea, Minnesota, since its acquisition in July 2011; |
| • | purchases and resale of biodiesel and raw material feedstocks produced by third parties; |
| • | our sales of biodiesel produced under toll manufacturing arrangements with third party facilities using our feedstocks; and |
| • | our production of biodiesel under toll manufacturing arrangements with third parties using their feedstocks at our facilities. |
We derive a small portion of our revenues from the sale of glycerin, free fatty acids and other co-products of the biodiesel production process. In 2009 and 2010, our revenues from the sale of co-products were less than five percent of our total Biodiesel segment revenues.
When we produce a gallon of biodiesel, we generate 1.5 Renewable Identification Numbers, or RINs, per gallon. RINs are used to track compliance with RFS2. RFS2 allows us to attach between zero and 2.5 RINs to any gallon of biodiesel. When we sell a gallon of biodiesel we generally attach 1.5 RINs. As a result, a portion of our selling price for a gallon of biodiesel is generally attributable to RINs.
Services Segment
Our Services segment includes:
| • | biodiesel facility management and operational services, whereby we provide day-to-day management and operational services to biodiesel production facilities as well as other clean-tech companies; and |
| • | construction management services, whereby we act as the construction management and general contractor for the construction of biodiesel production facilities. |
Historically, we provided facility operations management services to owners of biodiesel production facilities. Pursuant to a MOSA with a facility owner, we provided a broad range of management and operations services, typically for a monthly fee based on gallons of biodiesel produced or marketed and a contingent payment based on the facility’s net income. We do not recognize revenues from the sale of biodiesel produced at managed facilities, which is sold for the account of the third party owner. In 2009, we provided notice of termination of our five remaining third party MOSAs because we determined the terms were not favorable to us. During 2010, we ceased providing services to three of these facilities, acquired one and continue to provide limited services to the other facility. We do not anticipate the termination of our MOSAs will have a significant impact on our financial statements.
In addition, historically we have provided construction management services to the biodiesel industry, including assistance with pre-construction planning, such as site selection and permitting, facility and process design and engineering, engagement of subcontractors to perform construction activity and supply biodiesel processing equipment and project management services. Because we do not have internal construction capabilities and do not manufacture biodiesel processing equipment, we rely on our prime subcontractors, Todd & Sargent, Inc. and its joint venture with the Weitz Company, TSW, LLC, to fulfill the bulk of our obligations to our customers. Payments to these prime subcontractors historically represented most of the costs of goods sold for our Services segment.
26
Demand for our construction management and facility management and operational services depends on capital spending by potential customers and existing customers, which is directly affected by trends in the biodiesel industry. Due to the current economic climate, overcapacity in the biodiesel industry and reduced demand for biodiesel, we have not received any orders or provided services to outside parties for new facility construction services since 2009. We have, however, utilized our construction management expertise internally to upgrade two of our facilities during the last three years. We anticipate revenues derived from construction management services will be minimal in future periods.
Factors Influencing Our Results of Operations
Our results of operations are primarily affected by industry-wide factors affecting the profitability of biodiesel production. The principal factors affecting our segments are the market prices for biodiesel and the feedstocks used to produce biodiesel, as well as governmental programs designed to create incentives for the production and use of biodiesel.
Governmental programs favoring biodiesel production and use
Biodiesel has been more expensive to produce than petroleum-based diesel fuel and as a result the industry depends on federal and, to a lesser extent, state usage requirements and tax incentives. On July 1, 2010, RFS2 was implemented, stipulating volume requirements for the amount of biomass based diesel that must be utilized in the United States each year. Under RFS2, Obligated Parties – including petroleum refiners and fuel importers – must show compliance with these standards. Currently, biodiesel meets two categories of an Obligated Party’s annual renewable fuel volume requirement, or RVO – biomass-based diesel and advanced biofuel. Today, biodiesel is the only significant commercially available domestically produced advanced biofuel that meets the RFS2 standard. Consistent with the RFS2 program, the EPA announced it would require the domestic use of 800 million gallons of biodiesel in 2011 and one billion gallons in 2012. The EPA recently proposed a requirement for domestic use of biodiesel by Obligated Parties of 1.28 billion gallons in 2013. Our sales volumes have increased during 2011 as a result of RFS2-generated demand.
The federal blenders’ tax credit provides a $1.00 refundable tax credit per gallon of 100% pure biodiesel, or B100, to the first blender of biodiesel with petroleum-based diesel fuel. The blenders’ tax credit expired on December 31, 2009, but was reinstated on December 17, 2010, retroactively for 2010 and prospectively for 2011. As a result of the uncertainty about the reinstatement of the blenders’ tax credit for most of 2010, we elected to sell mostly unblended biodiesel. Accordingly, we were not entitled to claim the blenders’ tax credit for these gallons on a retroactive basis. The absence of the blenders’ tax credit during most of 2010 also affected our ability to cost effectively sell biodiesel and as a consequence, we idled several of our plants for various periods of time. Most of our facilities operated at less than 50% utilization due to decreased demand for biodiesel.
Biodiesel and feedstock price fluctuations
Our operating results generally reflect the relationship between the price of biodiesel and the price of feedstocks used to produce biodiesel.
Biodiesel is a low carbon, renewable alternative to petroleum-based diesel fuel and is primarily sold to the end user after it has been blended with petroleum-based diesel fuel. Biodiesel prices have historically been correlated to petroleum-based diesel fuel prices. Accordingly, biodiesel prices have generally been impacted by the same factors that affect petroleum prices, such as worldwide economic conditions, wars and other political events, OPEC production quotas, changes in refining capacity and natural disasters. Recently enacted government requirements and incentive programs, such as RFS2 and the blenders’ tax credit, have reduced this correlation, although it remains a significant factor in the market price of our product.
During late 2010 and 2011, we have seen regulatory and legislative factors influencing the price of biodiesel, in addition to petroleum prices. RIN pricing, a value component that was introduced via RFS2, has had a significant impact on our biodiesel pricing. During the first six months of 2011, RIN value represented almost a third of the price of each gallon of biodiesel that we sold.
During 2010, feedstock expense accounted for 76% of our costs of goods sold, while methanol and chemical catalysts expense accounted for 5% and 3% of our costs of goods sold, respectively. Methanol, a reactant in the production process, represents our second largest cost, the price of which is correlated to the cost of natural gas.
27
Feedstocks for biodiesel production, such as inedible animal fat, used cooking oil, inedible corn oil and soybean oil are commodities and market prices for them will be affected by a wide range of factors unrelated to the supply and demand for biodiesel and petroleum-based diesel fuels. The following table outlines some of the factors influencing supply in a given area:
| Feedstock |
Factors Influencing Supply | |
| Inedible Animal Fat | Export demand | |
| Number of slaughter kills in the United States | ||
| Demand for inedible animal fat from other markets | ||
| Used Cooking Oil | Export demand | |
| Population | ||
| Number of restaurants in the vicinity of collection facilities and terminals which is dependent on population density | ||
| Eating habits, which can be impacted by the economy | ||
| Inedible Corn Oil | Implementation of inedible corn oil separation systems into existing and new ethanol facilities | |
| Extraction system yield | ||
| Soybean Oil | Export demand | |
| Weather conditions | ||
| Farmer planting decisions | ||
| Government policies and subsidies | ||
| Crop disease | ||
During 2010, 91% of our feedstocks were comprised of inedible animal fats, used cooking oil and inedible corn oil while in 2007 we used 100% refined vegetable oil. We have increased the use of these feedstocks because they are lower cost than refined vegetable oils.
Historically, most biodiesel in the United States has been made from soybean oil. Soybean oil prices have fluctuated greatly, but have generally remained at historically high levels since early 2007 due to higher overall commodity prices. Over the period January 2006 to June 2011, soybean oil prices (based on daily closing nearby futures prices on the CBOT for crude soybean oil) have ranged from $0.21 per pound, or $1.58 per gallon, in January 2006 to $0.70 per pound, or $5.28 per gallon, in March 2008, assuming 7.5 pounds of soybean oil yields one gallon of biodiesel. The average closing price for soybean oil during 2010 was $0.42 per pound, or $3.16 per gallon, in 2010, compared to $0.25 per pound, or $1.88 per gallon, in 2006, $0.36 per pound, or $2.72 per gallon, in 2007 and $0.51 per pound, or $3.85 per gallon, in 2008, assuming 7.5 pounds of soybean oil yields one gallon of biodiesel.
Over the period from January 2008 to June 2011, the price of choice white grease, an inedible animal fat (based on daily closing nearby futures prices for The Jacobsen reported Missouri River delivery of choice white grease), have ranged from $0.0950 per pound, or $0.76 per gallon, in December 2008 to $0.5250 per pound, or $4.20 per gallon, in June 2011, assuming 8.0 pounds of choice white grease yields one gallon of biodiesel. The average closing price for choice white grease during 2010 was $0.29 per pound, or $2.34 per gallon, compared to $0.33 per pound, or $2.64 per gallon, in 2008, assuming 8.0 pounds of choice white grease yields one gallon of biodiesel.
28
The graph below illustrates the spread between the cost of producing one gallon of biodiesel made from soybean oil to the cost of producing one gallon of biodiesel made from a lower cost feedstock. The results were derived using assumed conversion factors for the yield of each feedstock and subtracting the cost of producing one gallon of biodiesel made from each respective lower cost feedstock from the cost of producing one gallon of biodiesel made from soybean oil.
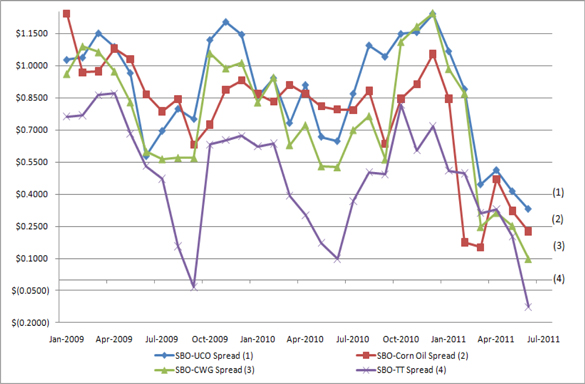
| • | Soybean oil (crude) prices are based on the monthly average of the daily closing sale price of the nearby soybean oil contract as reported by CBOT (Based on 7.5 pounds per gallons) |
| (1) | Used cooking oil prices are based on the monthly average of the daily low sales price of Missouri River yellow grease as reported by The Jacobsen (Based on 8.5 pounds per gallon) |
| (2) | Inedible corn oil prices are reported as the monthly average of the daily market values delivered to Illinois (Based on 8.2 pounds per gallon) |
| (3) | Choice white grease prices are based on the monthly average of the daily low prices of Missouri River choice white grease as reported by The Jacobsen (Based on 8.0 pounds per gallon) |
| (4) | Edible/tech tallow prices are based on the monthly average of the daily low sales prices of Missouri River tech tallow as reported by The Jacobsen (Based on 7.6 pounds per gallon) |
Our results of operations generally will benefit when the spread between biodiesel prices and feedstock prices widens and will be harmed when this spread narrows. The following graph shows feedstock cost data of choice white grease and soybean oil on a per gallon basis compared to the sale price data for biodiesel, and the spread between the two, from January 2008 to June 2011.
29
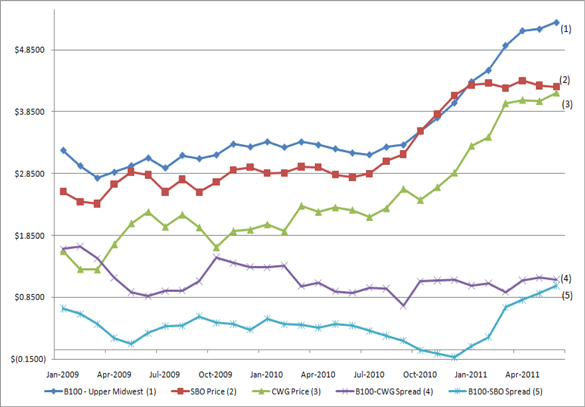
| (1) | Biodiesel prices are based on the monthly average of the midpoint of the high and low prices of B100 (Upper Midwest) as reported by The Jacobsen |
| (2) | Soybean oil (crude) prices are based on the monthly average of the daily closing sale price of the nearby soybean oil contract as reported by CBOT (Based on 7.5 pounds per gallon) |
| (3) | Choice white grease prices are based on the monthly average of the daily low price of Missouri River choice white grease as reported by The Jacobsen (Based on 8.0 pounds per gallon) |
| (4) | Spread between biodiesel price and choice white grease price |
| (5) | Spread between biodiesel price and soybean oil (crude) price |
Components of Revenues and Expenses
We derive revenues in our Biodiesel segment from the following sources:
| • | sales of biodiesel produced at our wholly-owned facilities, including transportation, storage and insurance costs to the extent paid for by our customers; |
| • | fees from toll manufacturing arrangements; |
| • | revenues from our sale of biodiesel produced by third parties through toll manufacturing arrangements with us; |
| • | resale of finished biodiesel acquired from others; |
| • | sales of glycerin, other co-products of the biodiesel production process and RINs; and |
| • | incentive payments from federal and state governments, including the federal biodiesel blenders’ tax credit, which we receive directly when we sell our biodiesel blended with petroleum-based diesel, primarily as B99.9, a less than one percent petroleum-based diesel mix with biodiesel, rather than in pure form or B100. |
We derive revenues in our Services segment from the following sources:
| • | fees received from operations management services that we provide for biodiesel production facilities, typically based on production rates and profitability of the managed facility; and |
| • | amounts received for services performed by us in our role as general contractor and construction manager for biodiesel production facilities. |
Cost of goods sold for our Biodiesel segment includes:
| • | with respect to our wholly-owned production facilities, expenses incurred for feedstocks, catalysts and other chemicals used in the production process, leases, utilities, depreciation, salaries and other indirect expenses related to the production process, and, when required by our customers, transportation, storage and insurance; |
30
| • | with respect to biodiesel acquired from third parties produced under toll manufacturing arrangements, expenses incurred for feedstocks, transportation, catalysts and other chemicals used in the production process and toll processing fees paid to the facility producing the biodiesel; |
| • | with respect to finished goods acquired from third parties, the purchase price of biodiesel on the spot market or under contract, and related expenses for transportation, storage, insurance, labor and other indirect expenses; and |
| • | changes during the applicable accounting period in the market value of derivative and hedging instruments, such as exchange traded contracts, related to feedstocks and commodity fuel products. |
Cost of goods sold for our Services segment includes:
| • | our facility management and operations activities, primarily salary expenses for the services of management employees for each facility and others who provide procurement, marketing and various administrative functions; and |
| • | our construction management services activities, primarily our payments to subcontractors constructing the production facility and providing the biodiesel processing equipment, and, to a much lesser extent, salaries and related expenses for our employees involved in the construction process. |
Selling, general and administrative expense consists of expenses generally involving corporate overhead functions and operations at our Ames, Iowa headquarters.
Other income (expense), net is primarily comprised of the changes in fair value of the embedded derivative related to the Series A preferred stock conversion feature, changes in fair value of interest rate swap, interest expense, interest income, the impairment of investments we made in biodiesel plants owned by third parties and the changes in valuation of the Seneca Holdco, LLC liability associated with the put and call options on the equity interest in Landlord.
Accounting for Investments
We use the equity method of accounting to account for the operating results of entities over which we have significant influence. Significant influence may be reflected by factors such as our significant operational influence due to our management of biodiesel operations at a third party owned facility and participation by one of our employees on the facility’s board of directors. As of June 30, 2011, we accounted for our interest in SoyMor under the equity method and in the past used this method to account for our interests in other entities where we had a significant management roll under a MOSA and had board participation. One of our wholly-owned subsidiaries acquired substantially all of the assets of SoyMor in July 2011; therefore, in future periods we will no longer account for our interest under the equity method, instead we will consolidate our interest in SoyMor like all of our other wholly-owned subsidiaries in our consolidated financial statements. We use the cost method of accounting to account for our minority investment in three previously managed plants, East Fork Biodiesel, LLC, or EFB, Western Iowa Energy, LLC, or WIE, since May, 2010, and Western Dubuque Biodiesel, LLC, or WDB, since August 2010. Because we do not have the ability to influence the operating and financial decisions of EFB, WIE, or WDB, and do not maintain a position on the board of directors, the investment is accounted for using the cost method. Under the cost method, the initial investment is recorded at cost and assessed for impairment. There was $0.4 million impairment recorded during 2010, relating to the wind up and liquidation of EFB, which fully impaired the remaining investment. We have not recorded any impairment of our investments in WIE or WDB.
In June 2009, the Financial Accounting Standards Board, or FASB, amended its guidance on accounting for variable interest entities, or VIEs. As of January 1, 2010, we evaluated each investment and determined we do not hold a controlling interest in any of our investments in third party owned plants that would empower us to direct the activities that most significantly impact economic performance. As a result, we are not the primary beneficiary and do not consolidate these VIE’s. See “Note 5 – Variable Interest Entities” to our audited consolidated financial statements for more information.
On April 8, 2010, we determined that Landlord was a VIE and it was consolidated into our financial statements as we are the primary beneficiary. See “Note 5 – Variable Interest Entities” for a description of the transaction. We have a put/call option with Seneca Holdco, LLC to purchase Landlord and currently lease the plant for production of biodiesel, both of which represent a variable interest in Landlord that is significant to the VIE. Although we do not have an ownership interest in Seneca Holdco, LLC, it was determined that we are the primary beneficiary due to the related party nature of the entities involved, our ability to direct the activities that most significantly impact Landlord’s economic performance and the design of Landlord that ultimately gives us the majority of the benefit from the use of Landlord’s assets.
31
During 2007, we invested, through a wholly-owned subsidiary, in Bell, LLC, a VIE joint venture, whereby we own 50% of the outstanding units. Bell, LLC owns and leases to us its corporate office building located in Ames, Iowa, which we use as our corporate headquarters. We currently have the right to exercise a call option with the other joint venture member, Dayton Park, LLC, to purchase Bell, LLC; therefore, we have determined we are the primary beneficiary of Bell, LLC and have consolidated Bell, LLC into our financial statements in accordance with ASC Topic 810, Consolidation (ASC Topic 810). See “Note 5 – Variable Interest Entities” to our condensed consolidated financial statements for a description of the consolidation.
Risk Management
The profitability of the biodiesel production business largely depends on the spread between prices for feedstocks and for biodiesel fuel. We actively monitor changes in prices of these commodities and attempt to manage a portion of the risks of these price fluctuations. However, the extent to which we engage in risk management activities varies substantially from time to time, and from feedstock to feedstock, depending on market conditions and other factors. Adverse price movements for these commodities directly affect our operating results. As a result of our recent acquisitions, our exposure to these risks has increased. In making risk management decisions, we receive input from others with risk management expertise and utilize research conducted by outside firms to provide additional market information.
We manage feedstock supply risks related to biodiesel production in a number of ways, including, where available, through long-term supply contracts. For example, most of the feedstock requirements for our Ralston facility were supplied under a three-year agreement with West Central that expired on July 8, 2010. However, we continue to purchase under, and expect to renegotiate terms similar to, the expired agreement. The purchase price for soybean oil under this agreement is indexed to prevailing Chicago Board of Trade, or CBOT, soybean oil market prices with a negotiated market basis. We utilize futures contracts and options to hedge, or lock in, the cost of portions of our future soybean oil requirements generally for varying periods up to one year.
Inedible animal fat is the primary feedstock that we used to produce biodiesel in 2010. We have increased our use of inedible animal fat as a result of the tolling arrangements with plants with animal fat processing capabilities and our acquisition of the Danville and Newton facilities. We utilize several varieties of inedible animal fat, such as beef tallow, choice white grease derived from pork and poultry fat. We manage inedible animal fat supply risks related to biodiesel production through supply contracts with inedible animal fat suppliers/producers. There is no established futures market for inedible animal fat. The purchase price for inedible animal fat is generally set on a negotiated flat price basis or spread to a prevailing market price reported by the United States Department of Agriculture price sheet. Our limited efforts to hedge against changing inedible animal fat prices have involved entering into futures contracts or options on other commodity products, such as soybean oil or heating oil. However, these products do not always experience the same price movements as animal fats, making risk management for these feedstocks challenging.
Our ability to mitigate our risk of falling biodiesel prices is limited. We have entered into forward contracts to supply biodiesel. However, pricing under these forward sales contracts generally has been indexed to prevailing market prices, as fixed price contracts for long periods on acceptable terms have generally not been available. There is no established market for biodiesel futures in the United States. Our efforts to hedge against falling biodiesel prices, which have been relatively limited to date, generally involve entering into futures contracts and options on other commodity products, such as diesel fuel and heating oil. However, these products do not always experience the same price movements as biodiesel.
Changes in the value of these futures or options instruments are recognized in current income or loss.
See “Critical Accounting Policies.”
Critical Accounting Policies
Our discussion and analysis of our financial condition and results of operations is based upon our financial statements, which have been prepared in accordance with accounting principles generally accepted in the United States. The preparation of these financial statements requires us to make estimates and judgments that affect the reported amount of assets, liabilities, equities, revenues and expenses and related disclosure of contingent assets and liabilities. We evaluate our estimates on an ongoing basis. We base our estimates on historical experience and on various other assumptions that we believe to be reasonable under the circumstances, the results of which form the basis for judgments we make about the carrying values of assets and liabilities that are not readily apparent from other sources. Because these estimates can vary depending on the situation, actual results may differ from the estimates.
32
We believe the following critical accounting policies affect our more significant judgments used in the preparation of our consolidated financial statements:
Revenue recognition.
We recognize revenues from the following sources:
| • | The sale of biodiesel and its co-products, including attached RINs, purchased by us or produced by us at owned manufacturing facilities, leased manufacturing facilities and manufacturing facilities with which we have tolling arrangements; |
| • | Fees received under toll manufacturing agreements with third parties; |
| • | Fees received from federal and state incentive programs for renewable fuels; |
| • | Fees from construction, operations and project management; and |
| • | Fees received for the marketing and sales of biodiesel produced by third parties. |
Biodiesel sales revenues are recognized when there is persuasive evidence of an arrangement, delivery has occurred, the price has been fixed or is determinable and collectability can be reasonably assured.
Fees received under toll manufacturing agreements with third parties are generally established as an agreed upon amount per gallon of biodiesel produced. The fees are recognized where there is persuasive evidence of an arrangement, delivery has occurred, the price has been fixed or is determinable and collectability can be reasonably assured. Revenues associated with the governmental incentive programs are recognized when the amount to be received is determinable, collectability is reasonably assured and the sale of product giving rise to the incentive has been recognized.
Historically, we have provided consulting and construction services under turnkey contracts. These jobs require design and engineering effort for a specific customer purchasing a unique facility. We record revenues on these fixed-price contracts on the percentage of completion basis using the ratio of costs incurred to estimated total costs at completion as the measurement basis for progress toward completion and revenue recognition. The total contract price includes the original contract plus any executed change orders only when the amounts have been received or awarded.
Contract costs include all direct labor and benefits, materials unique to or installed in the project and subcontract costs. Contract accounting requires significant judgment relative to assessing risks, estimating contract costs and making related assumptions for schedule and technical issues. We routinely review estimates related to contracts and reflect revisions to profitability in earnings on a current basis. If a current estimate of total contract cost indicates an ultimate loss on a contract, we would recognize the projected loss in full when it is first determined. We recognize additional contract revenue related to claims when the claim is probable and legally enforceable.
Changes relating to executed change orders, job performance, construction efficiency, weather conditions and other factors affecting estimated profitability may result in revisions to costs and revenues and are recognized in the period in which the revisions are determined.
Billings in excess of costs and estimated earnings on uncompleted contracts represents amounts billed to customers prior to providing related construction services.
Fees for managing ongoing operations of third party plants, marketing biodiesel produced by third party plants and from other services are recognized as services are provided. We also have performance-based incentive agreements that are included as management service revenues. These performance incentives are recognized as revenues when the amount to be received is determinable and collectability is reasonably assured.
We act as a sales agent for certain third parties and recognize revenues on a net basis in accordance with ASC Topic 605-45, “Revenue Recognition”.
33
Impairment of Long-Lived Assets and Certain Identifiable Intangibles. We review long-lived assets, including property, plant and equipment and definite-lived intangible assets, for impairment in accordance with ASC Topic 360-10, “Property, Plant, and Equipment.” Asset impairment charges are recorded for long-lived assets and intangible assets subject to amortization when events and circumstances indicate that such assets may be impaired and the undiscounted net cash flows estimated to be generated by those assets are less than their carrying amounts. If estimated future undiscounted cash flows are not sufficient to recover the carrying value of the assets, an impairment charge is recorded for the amount by which the carrying amount of the assets exceeds its fair value. Fair value is determined by management estimates using discounted cash flow calculations. The estimate of cash flows arising from the future use of the asset that are used in the impairment analysis requires judgment regarding what we would expect to recover from the future use of the asset. Changes in judgment that could significantly alter the calculation of the fair value or the recoverable amount of the asset may result from, but are not limited to, significant changes in the regulatory environment, the business climate, management’s plans, legal factors, commodity prices and the use of the asset or the physical condition of the asset. There were no asset impairment charges for the six months ended June 30, 2011. There was $0.1 million of asset impairments recorded during the six months ended June 30, 2010.
Goodwill asset valuation. While goodwill is not amortized, it is subject to periodic reviews for impairment. As required by ASC Topic 350, “Intangibles – Goodwill and Other”, we review the carrying value of goodwill for impairment annually on July 31 or when we believe impairment indicators exist. The analysis is based on a comparison of the carrying value of the reporting unit to its fair value, determined utilizing a discounted cash flow methodology. Additionally, we review the carrying value of goodwill whenever events or changes in business circumstances indicate that the carrying value of the assets may not be recoverable. Changes in estimates of future cash flows caused by items such as unforeseen events or sustained unfavorable changes in market conditions could negatively affect the fair value of the reporting unit’s goodwill asset and result in an impairment charge. There has been no impairment of goodwill recorded in the periods presented.
Income taxes. We recognize deferred taxes by the asset and liability method. Under this method, deferred income taxes are recognized for differences between the financial statement and tax bases of assets and liabilities at enacted statutory tax rates in effect for the years in which differences are expected to reverse. The effect on deferred taxes of a change in tax rates is recognized in income in the period that includes the enactment date. In addition, valuation allowances are established if necessary to reduce deferred tax assets to amounts expected to be realized.
On December 31, 2009, we determined that it is unlikely that our deferred tax assets will be fully realized in the future based on available evidence; therefore, a full valuation allowance was established against the assets. On a quarterly basis, any deferred tax assets are reviewed to determine the probability of realizing the assets. At June 30, 2011, we had net deferred income tax assets of approximately $31.2 million with a valuation allowance of $29.7 million, which resulted in a net deferred tax asset of $1.5 million and is offset by an accrued liability for uncertain tax benefits. We believe there is a reasonable basis in the tax law for all of the positions we take on the various federal and state tax returns we file. However, in recognition of the fact that various taxing authorities may not agree with our position on certain issues, we expect to establish and maintain tax reserves. As of June 30, 2011, we had a net deferred tax asset of $1.5 million relating to uncertain tax benefits.
Prior to the merger of our wholly-owned subsidiary with and into Blackhawk, or the Blackhawk Merger, Blackhawk was treated as a partnership for federal and state income tax purposes and generally did not incur income taxes. Instead, its earnings and losses were included in the income tax returns of its members. Therefore, no provision or liability for federal or state income taxes was included in our consolidated financial statements aside from our pro-rata share included on our Schedule K-1 determined based on our ownership interest for the year ending December 31, 2009 and the period ending February 26, 2010 prior to acquisition.
Consolidations. As of June 30, 2010, we determined the acquisition price of Blackhawk and CIE. For the Blackhawk Merger and the acquisition of substantially all of the assets and liabilities of CIE pursuant to the CIE asset purchase agreement, the allocation of the recorded amounts of consideration transferred and the recognized amounts of the assets acquired and liabilities assumed are based on the final appraisals and evaluation and estimations of fair value as of the acquisition date. We determined the goodwill recorded was $44.2 million and $24.6 million for REG Danville and REG Newton, LLC, or REG Newton, respectively.
On April 8, 2010, we determined that Landlord was a VIE and consolidated it into our financial statements as we are the primary beneficiary (ASC Topic 810, “Consolidations”). We have a put/call option with Seneca Holdco, LLC to purchase Landlord and we currently lease the plant for production of biodiesel, both of which represent a variable interest in Landlord that are significant to the VIE. Although we do not have an ownership interest in Seneca Holdco, LLC, we determined that we are the primary beneficiary because the equity owners are our stockholders; our ability to direct the activities that most significantly impact Landlord’s economic performance; and the design of the leasing arrangement that ultimately gives us the majority of the benefit from the use of Landlord’s assets. We have elected the fair value option available under ASC Topic 825, “Financial Instruments” on the $4.0 million investment made by Seneca Holdco, LLC and the associated put and call options. Changes in the fair value after the date of the transaction are recorded in earnings. Those assets are owned by and those liabilities are obligations of Landlord, which we have consolidated as the primary beneficiary.
34
During 2007, we invested, through a wholly-owned subsidiary, in Bell, LLC, a VIE joint venture, whereby we own 50% of the outstanding units. Commencing January 1, 2011, we have the right to execute a call option with the joint venture member, Dayton Park, LLC, to purchase Bell, LLC; therefore, we determined we were the primary beneficiary of Bell, LLC and consolidated Bell, LLC into our financial statements in accordance with ASC Topic 810. See “Note 5—Variable Interest Entities” to our condensed consolidated financial statements for a description of the consolidation.
Valuation of Preferred Stock Embedded Derivatives. The terms of our Series A preferred stock provide for voluntary and, under certain circumstances, automatic conversion of the Series A preferred stock to common stock based on a prescribed formula. In addition, shares of Series A preferred stock are subject to redemption at the election of the holder beginning February 26, 2014. The redemption price is equal to the greater of (i) an amount equal to $13.75 per share of Series A preferred stock plus any and all accrued dividends, not exceeding $16.50 per share, and (ii) the fair market value of the Series A preferred stock. Under ASC Topic 815-40, we are required to bifurcate and account for as a separate liability certain derivatives embedded in our contractual obligations. An “embedded derivative” is a provision within a contract, or other instrument, that affects some or all of the cash flows or the value of that contract, similar to a derivative instrument. Essentially, the embedded terms contain all of the attributes of a free-standing derivative, such as an underlying market value, a notional amount or payment provision, and can be settled “net,” but the contract, in its entirety, does not meet the ASC Topic 815-40 definition of a derivative. For a description of the redemption and liquidation rights associated with Series A preferred stock, see “Note 4—Redeemable Preferred Stock” to our audited consolidated financial statements.
We have determined that the conversion feature of Series A preferred stock is an embedded derivative because the redemption feature allows the holder to redeem Series A preferred stock for cash at a price which can vary based on the fair market value of the Series A preferred stock, which effectively provides the holders of the Series A preferred stock with a mechanism to “net settle” the conversion option. Consequently, the embedded conversion option must be bifurcated and accounted for separately because the economic characteristics of this conversion option are not considered to be clearly and closely related to the economic characteristics of the Series A preferred stock, which is considered more akin to a debt instrument than equity.
Upon issuance of Series A preferred stock, we recorded a liability representing the estimated fair value of the right of preferred holders to receive the fair market value of the common stock issuable upon conversion of the Series A preferred stock on the redemption date. This liability is adjusted each quarter based on changes in the estimated fair value of such right, and a corresponding income or expense is recorded as Other Income in our statements of operations.
We use the option pricing method to value the embedded derivative. We use the Black-Scholes options pricing model to estimate the fair value of the conversion option embedded in the Series A preferred stock. The Black-Scholes options pricing model requires the development and use of highly subjective assumptions. These assumptions include the expected volatility of the value of our equity, the expected conversion date, an appropriate risk-free interest rate, and the estimated fair value of our equity. The expected volatility of our equity is estimated based on the volatility of the value of the equity of publicly traded companies in a similar industry and general stage of development as us. The expected term of the conversion option is based on the period remaining until the contractually stipulated redemption date of February 26, 2014. The risk-free interest rate is based on the yield on United States Treasury STRIPs with a remaining term equal to the expected term of the conversion option. The development of the estimated fair value of our equity is discussed below in the “Valuation of the Company’s Equity.”
The significant assumptions utilized in our valuation of the embedded derivative are as follows:
| June 30, 2011 |
December 31, 2010 |
February 26, 2010 |
December 31, 2009 |
December 31, 2008 |
June 30, 2008 |
|||||||||||||||||||
| Expected volatility |
40.00 | % | 40.00 | % | 40.00 | % | 50.00 | % | 55.00 | % | 55.00 | % | ||||||||||||
| Risk-free rate |
4.10 | % | 4.10 | % | 4.40 | % | 4.11 | % | 4.39 | % | 4.58 | % | ||||||||||||
The estimated fair values of the conversion feature embedded in the Series A preferred stock is recorded as a derivative liability. The derivative liability is adjusted to reflect fair value at each period end, with any increase or decrease in the fair value being recorded in results of operations as change in fair value of Series A preferred stock embedded derivative. The impact of the change in the value of the embedded derivative is not included in the determination of taxable income.
35
Valuation of Seneca Holdco, LLC Liability. In connection with the agreements under which we lease the Seneca facility (See “Note 5—Variable Interest Entities” to our condensed consolidated financial statements), we have the option to purchase, or Call Option, and Seneca Holdco, LLC has the option to require us to purchase, or Put Option, the membership interest of Landlord whose assets consist primarily of a biodiesel plant located in Seneca, Illinois. Both the Put Option and the Call Option have a term of seven years and are exercisable by either party at a price based on a pre-defined formula. We have valued the amounts financed by Seneca Holdco, LLC, the Put Option and the Call Option using an option pricing model. The fair values of the Put Option and the Call Option were estimated using an option pricing model, and represent the probability weighted present value of the gain that is realized upon exercise of each option. The option pricing model requires the development and use of highly subjective assumptions. These assumptions include (i) the value of our equity, (ii) expectations regarding future changes in the value of our equity, (iii) expectations about the probability of either option being exercised, including the our ability to list our securities on an exchange or complete a public offering and (iv) an appropriate risk-free rate. We considered current public equity markets, relevant regulatory issues, biodiesel industry conditions and our position within the industry when estimating the probability that we will raise additional capital. Differences in the estimated probability and timing of this event may significantly impact the fair value assigned to the Seneca Holdco, LLC liability as we determined it is not likely that the Put Option will become exercisable in the absence of this event.
The significant assumptions utilized in our valuation of the Seneca Holdco, LLC liability are as follows:
| June 30, 2011 |
December 31, 2010 |
April 9, 2010 |
||||||||||
| Expected volatility |
50.00 | % | 50.00 | % | 50.00 | % | ||||||
| Risk-free rate |
2.05 | % | 2.45 | % | 3.36 | % | ||||||
| Probability of IPO |
75.00 | % | 70.00 | % | 60.00 | % | ||||||
Preferred Stock Accretion. Beginning October 1, 2007, the date that we determined that there was a more than remote likelihood that our then outstanding preferred stock would become redeemable, we commenced accretion of the carrying value of the preferred stock over the period until the earliest redemption date, which was August 1, 2011, to the preferred stock’s redemption value, plus accrued but unpaid dividends using the effective interest method. This determination was based upon the current state of the public equity markets which restricted our ability to execute a qualified public offering, our historical operating results and the volatility in the biodiesel and renewable fuels industries which have resulted in lower projected profitability. Prior to October 1, 2007, we had determined that it was not probable that the preferred stock would become redeemable; therefore, the carrying value was not adjusted in accordance with ASC Topic 480-10-S99, “Classification and Measurement of Redeemable Securities.”
On February 26, 2010, after issuance of the Series A preferred stock, we determined that there was a more than remote likelihood that the Series A preferred stock would become redeemable and we commenced accretion of the carrying value of the Series A preferred stock over the period until the earliest redemption date (February 26, 2014) to the Series A preferred stock’s redemption value, plus dividends, using the effective interest method. This determination was based upon the state of the public equity markets at the time which restricted our ability to execute a qualified public offering, our historical operating results and the volatility in the biodiesel and renewable fuels industries.
Accretion of $6.2 and $12.1 million for the three and six months ended June 30, 2011, respectively, and $5.2 and $16.2 million for the three and six months ended June 30, 2010, respectively, has been recognized as a reduction to income available to common stockholders in accordance with paragraph 15 of ASC Topic 480-10-S99.
Valuation of the Company’s Equity. We considered three generally accepted valuation approaches to estimate the fair value of our aggregate equity: the income approach, the market approach and the cost approach. Ultimately, the estimated fair value of our aggregate equity is developed using the Income Approach—Discounted Cash Flow, or DCF, method. The value derived using this approach is supported by a variation of the Market Approach, specifically comparisons of the implied multiples derived using the DCF method to the multiples of various metrics calculated for guideline public companies.
Material underlying assumptions in the DCF analysis include the gallons produced and managed, gross margin per gallon, expected long-term growth rates and an appropriate discount rate. Gallons produced and managed as well as the gross margin per gallon were determined based on historical and forward-looking market data.
The discount rate used in the DCF analysis is based on macroeconomic, industry and company-specific factors and reflects the perceived degree of risk associated with realizing the projected cash flows. The selected discount rate represents the weighted average rate of return that a market participant investor would require on an investment in our debt and equity. The percent of total capital assumed to be comprised of debt and equity when developing the weighted average cost of capital was based on a review of the capital structures of our publicly traded industry peers. The cost of debt was estimated utilizing the adjusted average 20-Year B-rated corporate bond rate during the previous 12 months representing a reasonable market participant rate based on our publicly traded industry peers. Our cost of equity was estimated utilizing the capital asset pricing model, which develops an estimated market rate of return based on the appropriate risk-free rate adjusted for the risk of the industry relative to the market as a whole, an equity risk premium and a company specific risk premium. The risk premiums included in the discount rate were based on historical and forward looking market data.
36
Discount rates utilized in our DCF model are as follows:
| June 30, 2011 |
December 31, 2010 |
February 26, 2010 |
December 31, 2009 |
December 31, 2008 |
June 30, 2008 |
|||||||||||||||||||
| Discount rate |
19.50 | % | 16.00 | % | 15.00 | % | 13.00 | % | 15.00 | % | 13.50 | % | ||||||||||||
Valuations derived from this model are subject to ongoing internal and external verification and review. Selection of inputs involves management’s judgment and may impact net income. This analysis is done on a regular basis and takes into account factors that have changed from the time of the last common stock issuance. Other factors affecting our assessment of price include recent purchases or sales of common stock, if available.
Results of Operations
Three and six months ended June 30, 2011 and June 30, 2010
Set forth below is a summary of certain unaudited financial information (in thousands) for the periods indicated:
| Three Months Ended June 30, |
Six Months Ended June 30, |
|||||||||||||||
| 2011 | 2010 | 2011 | 2010 | |||||||||||||
| Revenues |
||||||||||||||||
| Biodiesel |
$ | 184,347 | $ | 46,169 | $ | 284,421 | $ | 79,144 | ||||||||
| Biodiesel government incentives |
11,926 | 22 | 16,266 | 3,674 | ||||||||||||
|
|
|
|
|
|
|
|
|
|||||||||
| Total biodiesel |
196,273 | 46,191 | 300,687 | 82,818 | ||||||||||||
| Services |
39 | 146 | 60 | 1,008 | ||||||||||||
|
|
|
|
|
|
|
|
|
|||||||||
| Total |
196,312 | 46,337 | 300,747 | 83,826 | ||||||||||||
| Costs of goods sold |
||||||||||||||||
| Biodiesel |
165,895 | 41,125 | 262,084 | 75,949 | ||||||||||||
| Services |
24 | 118 | 42 | 533 | ||||||||||||
|
|
|
|
|
|
|
|
|
|||||||||
| Total |
165,919 | 41,243 | 262,126 | 76,482 | ||||||||||||
|
|
|
|
|
|
|
|
|
|||||||||
| Gross profit |
30,393 | 5,094 | 38,621 | 7,344 | ||||||||||||
| Selling, general and administrative expenses |
7,812 | 5,731 | 14,090 | 10,817 | ||||||||||||
| Impairment of assets |
— | — | — | 141 | ||||||||||||
|
|
|
|
|
|
|
|
|
|||||||||
| Income (loss) from operations |
22,581 | (637 | ) | 24,531 | (3,614 | ) | ||||||||||
| Other income (expense), net |
(23,446 | ) | 3,011 | (21,596 | ) | 2,956 | ||||||||||
| Income tax benefit (expense) |
— | (2,600 | ) | — | 3,728 | |||||||||||
| Loss from equity investments |
(83 | ) | (166 | ) | (148 | ) | (381 | ) | ||||||||
|
|
|
|
|
|
|
|
|
|||||||||
| Net income attributable to REG |
(948 | ) | (392 | ) | 2,787 | 2,689 | ||||||||||
| Effects of recapitalization |
— | — | — | 8,521 | ||||||||||||
| Accretion of preferred stock to redemption value |
(6,180 | ) | (5,178 | ) | (12,076 | ) | (16,246 | ) | ||||||||
| Undistributed dividends allocated to preferred stockholders |
(3,185 | ) | (2,926 | ) | (6,246 | ) | (4,073 | ) | ||||||||
|
|
|
|
|
|
|
|
|
|||||||||
| Net income (loss) attributable to the Company’s common stockholders |
$ | (10,313 | ) | $ | (8,496 | ) | $ | (15,535 | ) | $ | (9,109 | ) | ||||
|
|
|
|
|
|
|
|
|
|||||||||
Revenues. Our total revenues increased $150.0 million, or 324%, and $216.9 million, or 259%, to $196.3 million and $300.7 million for the three and six months ended June 30, 2011, respectively, from $46.3 million and $83.8 million for the three and six months ended June 30, 2010, respectively. This increase was due to an increase in biodiesel revenues as follows:
Biodiesel. Biodiesel revenues including government incentives increased $150.1 million, or 325%, and $217.9 million, or 263%, to $196.3 million and $300.7 million during the three and six months ended June 30, 2011, respectively, from $46.2 million and $82.8 million for the three and six months ended June 30, 2010, respectively. This increase in biodiesel revenues was due to an increase in both gallons sold and selling price. Due to higher RIN and energy prices in the first half of 2011, our average B100 sales price per gallon increased $1.96, or 61%, and $1.74, or 55%, to $5.19 and $4.88 during the three and six months ended June 30, 2011, respectively, compared to $3.23 and $3.14 during the three and six months ended June 30, 2010, respectively. Gallons sold, excluding tolled gallons, increased 20.5 million, or 160%, and 30.4 million, or 132%, to 33.3 million and 53.4 million during the three and six months ended June 30, 2011, respectively, compared to 12.8 million and 23.0 million during the three and six months ended June 30, 2010, respectively. We tolled 2.5 million gallons and 5.4 million gallons at the REG Houston Facility for the six months ended June 30, 2011 and 2010, respectively, which are included in the total gallons sold reported above. This increase in gallons sold reflects significantly stronger market demand primarily as a result of RFS2. In response to this demand our Newton, Danville and Seneca facilities produced biodiesel through the entire first half of 2011.
37
Services. Services revenues decreased $0.1 million, or 73%, and $0.9 million, or 94%, to $0 million and $0.1 million for the three and six months ended June 30, 2011, respectively, from $0.1 million and $1.0 million for the three and six months ended June 30, 2010, respectively. This decrease was due to our decision to cancel our remaining MOSAs during 2010.
Costs of goods sold. Our cost of goods sold increased $124.7 million, or 302%, and $185.6 million, or 243%, to $165.9 million and $262.1 million for the three and six months ended June 30, 2011, respectively, from $41.2 million and $76.5 million for the three and six months ended June 30, 2010, respectively. This increase was primarily due to costs associated with the increase in gallons sold in the 2011 period and as follows:
Biodiesel. Biodiesel cost of goods sold increased $124.8 million, or 303%, and $186.1 million, or 245%, to $165.9 million and $262.1 million for the three and six months ended June 30, 2011, respectively, compared to $41.1 million and $75.9 million for the three and six months ended June 30, 2010, respectively. The increase in biodiesel cost of goods sold is primarily the result of the additional gallons sold in the 2011 period as discussed above and an increase in average feedstock prices. Average inedible animal fat costs for the three and six months ended June 30, 2011 were $0.48 and $0.45 per pound, respectively, compared to $0.29 and $0.28 per pound for the three and six months ended June 30, 2010, respectively. Soybean oil costs for the three and six months ended June 30, 2011 were $0.58 and $0.57 per pound, respectively, and were $0.35 and $0.36 per pound for the three and six months ended June 30, 2010, respectively. We had gains of $1.7 million and losses of $2.1 million from hedging activity in the three and six months ended June 30, 2011, respectively, compared to gains of $0.7 million and $0.5 million from hedging arrangements in the three and six months ended June 30, 2010, respectively.
Services. Costs of services decreased $0.1 million and $0.5 million to $0 million for the three and six months ended June 30, 2011, respectively, from $0.1 million and $0.5 million for the three and six months ended June 30, 2010, respectively. Costs incurred to perform services under the MOSAs decreased due to our decision to cancel the MOSAs during 2010.
Selling, general and administrative expenses. Our selling, general and administrative, or SG&A, expenses were $7.8 million and $14.1 million for the three and six months ended June 30, 2011, respectively, compared to $5.7 million and $10.8 million for the three and six months ended June 30, 2010. SG&A expenses increased $2.1 million, or 37%, and $3.3 million, or 31%, for the three and six months ended June 30, 2011, respectively. The increase was primarily related to the additional non-cash stock compensation expense of $1.0 million and $2.0 million for the three and six months ended June 30, 2011, respectively, compared to less than $0.1 million for each of the three and six months ended June 30, 2010. Additionally, depreciation expense increased $0.2 million, the provision for bad debt expense increased $0.6 million and insurance expense increased approximately $0.2 million, or an aggregate of $1.0 million, in the first six months of 2011 when compared to the same period for 2010.
Other income (expense), net. Other expense was $23.4 million and $21.6 million for the three and six months ended June 30, 2011 and other income was $3.0 million for each of the three and six months ended June 30, 2010. Other income is primarily comprised of the changes in fair value of the Series A Preferred Stock conversion feature embedded derivative, changes in fair value of Seneca Holdco liability, interest expense, interest income and the other non-operating items. The change in fair value of the Series A Preferred Stock conversion feature embedded derivative resulted in $19.6 million and $17.1 million of expense for the three and six months ended June 30, 2011, respectively, and $5.0 million for the three and six months ended June 30, 2010, respectively. The change in fair value of the Seneca Holdco liability was $2.3 million and $1.5 million of expense for the three and six months ended June 30, 2011, respectively, and was $0.4 million of expense for each of the three and six months ended June 30, 2010. Interest expense increased $0.4 million and $1.7 million for the three and six months ended June 30, 2011, respectively, from $1.4 million and $1.7 million for the three and six months ended June 30, 2010, respectively. This increase was primarily attributable to the debt related to the consolidation of Landlord during 2010.
Income tax benefit (expense). There was no income tax benefit for the first half of 2011, compared to an income tax expense of $2.6 million and income tax benefit of $3.7 million for the three and six months ended June 30, 2010. Deferred tax liabilities were recorded as a result of the Blackhawk Merger and CIE Asset Acquisition. As the deferred tax liabilities were recorded, the resulting decrease in net deferred tax assets required a lower valuation allowance. The income tax expense for the three months ended June 30, 2010 results from the finalization of the Blackhawk and CIE purchase accounting. The release of the associated valuation allowance resulted in an income tax benefit for the six months ended June 30, 2010.
Loss from equity investments. Loss from equity investments was $0.1 million and $0.4 million for the first half of 2011 and 2010, respectively, due to lower levels of overall production at equity method investees that were generating gross losses during the first half of 2010 and the change of investments from equity method to cost method during the last half of 2010.
Effects of Recapitalization. Net effects of recapitalization were $8.5 million for the six months ended June 30, 2010. This was a one-time item due to the Biofuels Merger share issuances.
38
Preferred stock accretion. Preferred stock accretion was $6.2 million and $12.1 million for the three and six months ended June 30, 2011, respectively, compared to $5.2 and $16.2 million for the three and six months ended June 30, 2010, respectively. During the first quarter of 2010, we accreted two months of the previously issued Holdco preferred stock (redemption date of August 1, 2011) and one month of newly issued Series A Preferred Stock (redemption date February 26, 2014). Monthly accretion expense decreased after the Biofuels Merger in 2010 as a result of the new redemption amount and redemption date of our Series A Preferred Stock.
Undistributed dividends. Undistributed dividends were $3.2 million and $6.2 million for the three and six months ended June 30, 2011, respectively, compared to $2.9 million and $4.1 million for the three and six months ended June 30, 2010, respectively. During the first quarter of 2010, we accrued dividends of the previously issued Holdco preferred stock prior to the Biofuels Merger on February 26, 2010. All prior undistributed dividends were cancelled as part of the merger agreement.
Liquidity and Capital Resources
Sources of liquidity. Since inception, a significant portion of our operations have been financed through the sale of our capital stock. From August 1, 2006 through June 30, 2011, we received cash proceeds of $132.2 million from private sales of preferred stock and common stock. Based on available funds, current plans and business conditions, we believe that our available cash, amounts available under our credit agreement and amounts expected to be generated from future operations will be sufficient to meet our cash requirements for at least the next twelve months. At June 30, 2011 and December 31, 2010, we had cash and cash equivalents of $9.1 million and $4.3 million, respectively. At June 30, 2011, we had total assets of $403.9 million, compared to total assets of $369.6 million at December 31, 2010. At June 30, 2011, we had debt of $99.9 million, compared to debt of $96.1 million at December 31, 2010.
Our borrowings (in millions) are as follows:
| June 30, 2011 |
December 31, 2010 |
|||||||
| Revolving lines of credit |
$ | 10.6 | $ | 9.5 | ||||
| REG Danville term loan |
22.8 | 23.6 | ||||||
| REG Newton term loan |
23.3 | 23.6 | ||||||
| Other |
2.3 | 3.1 | ||||||
|
|
|
|
|
|||||
| Total notes payable |
$ | 59.0 | $ | 59.8 | ||||
|
|
|
|
|
|||||
| Seneca Landlord term loan |
$ | 36.3 | $ | 36.3 | ||||
| Bell, LLC promissory note |
4.6 | — | ||||||
|
|
|
|
|
|||||
| Total notes payable - variable interest entities |
$ | 40.9 | $ | 36.3 | ||||
|
|
|
|
|
|||||
On February 26, 2010, in connection with the Blackhawk Merger, one of our subsidiaries, REG Danville, assumed a $24.6 million term loan and a $5.0 million revolving credit line with Fifth Third Bank. As of June 30, 2011, there was $22.8 million of principal outstanding under the term loan. On November 30, 2010, the revolving credit line expired. The Illinois Finance Authority guarantees 61% of the term loan and the loan is secured by our Danville facility. The term loan bears interest at a fluctuating rate per annum equal to LIBOR plus the applicable margin of 4%. Until June 30, 2010, REG Danville was required to make only monthly payments of accrued interest. Beginning on July 1, 2010, REG Danville was required to make monthly principal payments equal to $135,083 plus accrued interest. In addition to these monthly payments, as a result of the amendment to the loan agreement dated February 26, 2010, REG Danville is required to make annual principal payments equal to 50% of REG Danville’s Excess Cash Flow (as defined in the loan agreement), or the 50% Excess Payment, with respect to each fiscal year until $2.5 million has been paid from the Excess Cash Flow. Thereafter, REG Danville is required to make annual payments equal to 25% of its Excess Cash Flow. Excess Cash Flow is equal to EBITDA less certain cash payments made during the period including principal payments, lease payments, interest payments, tax payments, approved distributions and capital expenditures. REG Danville did not have Excess Cash Flow during 2010 and no amounts have been accrued or paid. REG Danville is subject to various loan covenants that restrict its ability to take certain actions, including prohibiting it from paying any dividend to us until the 50% Excess Payment is made and certain financial ratios are met. We are currently in negotiations to renew the term loan, which matures on November 3, 2011.
39
On March 8, 2010, in connection with the CIE Asset Acquisition, one of our subsidiaries, REG Newton, refinanced a $23.6 million term loan, or the AgStar Loan, and obtained a $2.4 million line of credit, or the AgStar Line, with AgStar Financial Service, PCA, or AgStar. As of June 30, 2011, there was $23.3 million of principal outstanding under the AgStar Loan and $0.6 million of principal outstanding under the AgStar Line. These amounts are secured by our Newton facility. We have guaranteed the obligations under the AgStar Line and have a limited guarantee related to the obligations under the AgStar Loan, which provides that we will not be liable for more than the unpaid interest, if any, on the AgStar Loan that has accrued during an 18-month period beginning on March 8, 2010. The AgStar Loan bears interest at 3% plus the greater of (i) LIBOR or (ii) two percent. Beginning on October 1, 2011, monthly principal payments of approximately $120,000 and accrued interest are due based on a 12-year amortization period. Under the AgStar Loan, REG Newton is required to maintain a debt service reserve account, or the Debt Reserve, equal to 12-monthly payments of principal and interest on the AgStar Loan. Beginning on January 1, 2011 and at each fiscal year end thereafter, until such time as the balance in the Debt Reserve contains the required 12-months of payments, REG Newton must deposit an amount equal to REG Newton’s Excess Cash Flow, which is defined in the AgStar Loan agreement as EBITDA, less the sum of required debt payments, interest expense, any increase in working capital from the prior year until working capital exceeds $6.0 million, up to $0.5 million in maintenance capital expenditure, allowed distributions and payments to fund the Debt Reserve. In the event any amounts are past due, AgStar may withdraw such amounts from the Debt Reserve. REG Newton was not required to make a Debt Reserve deposit for 2010. REG Newton is subject to various standard loan covenants that restrict its ability to take certain actions, including prohibiting REG Newton from making any cash distributions to us in excess of 35% of REG Newton’s net income for the prior year. On November 15, 2010, REG Newton amended the loan agreement to revise certain financial covenants. In exchange for these revisions, REG Newton agreed to begin reduced principal payments of approximately $60,000 per month within two months after the enactment of the reinstated blenders’ tax credit. REG Newton began such principal payments on March 1, 2011. The AgStar Loan matures on March 8, 2013 and the AgStar Line expires on March 5, 2012, which was extended for one year on March 7, 2011. The AgStar Line is secured by REG Newton’s accounts receivable and inventory.
During July 2009, we and certain subsidiaries entered into an agreement with Bunge North America, or Bunge, to provide services related to the procurement of raw materials and the purchase and resale of biodiesel produced. The agreement provides for Bunge to purchase up to $10.0 million in feedstock for, and biodiesel from, us. Feedstock is paid for daily as it is processed. Biodiesel is purchased and paid for by Bunge the following day. In June 2009, we entered into an extended payment terms agreement with West Central to provide up to $3.0 million in outstanding payables for up to 45 days. Both of these agreements provide additional working capital resources to us. As of June 30, 2011, we had $8.0 million outstanding under these agreements.
We and certain of our subsidiaries entered into a Revolving Credit Agreement, or the WestLB Revolver, dated as of April 8, 2010, with WestLB, AG. We guarantee the WestLB Revolver. The initial available credit amount under the WestLB Revolver is $10 million with additional lender increases up to a maximum commitment of $18 million. Advances under the WestLB Revolver are limited to the amount of certain of our qualifying assets that secure amounts borrowed. The WestLB Revolver requires that we maintain compliance with certain financial covenants. The term of the WestLB Revolver is two years. The interest rate varies depending on the loan type designation and is either 2.0% over the higher of 50 basis points above the Federal Funds Effective Rate or the WestLB prime rate for Base Rate loans or 3.0% over adjusted LIBOR for Eurodollar loans. The WestLB Revolver is secured by assets and ownership interests of our subsidiaries. As of June 30, 2011, we had $10.0 million outstanding under the WestLB Revolver.
In connection with our agreement to lease the Seneca Facility, Landlord, or the entity that owns the Seneca Facility, received from Seneca Holdco, which is owned by three of our investors, an investment of $4.0 million at closing to fund certain repairs to the Seneca Facility. Landlord leases the Seneca Facility to our subsidiary, REG Seneca, with rent being set at an amount to cover debt service and other expenses. REG Seneca pays Landlord, who pays the fee to Seneca Holdco, a $600,000 annual fee, payable quarterly, which is guaranteed by us. See “Note 5 – Variable Interest Entities” to our condensed consolidated financial statements for additional information.
On April 8, 2010, Landlord entered into a note payable agreement with West LB. The note requires that interest be accrued at different rates based on whether it is a Base Rate Loan or Eurodollar loan. Interest is at either 2.0% over the higher of 50 basis points above the Federal Funds Effective Rate or the WestLB prime rate for Base Rate loans or 3.0% over adjusted LIBOR for Eurodollar loans. The loan was a Eurodollar loan as of June 30, 2011. The effective rate at June 30, 2011 was 3.19%. Interest is paid monthly. Principal payments have been deferred until February 2012. At that time, Landlord will be required to make monthly principal payments of $201,389, with the remaining unpaid principal due at maturity on April 8, 2017. The note payable is secured by the Seneca Facility. The balance of the note as of June 30, 2011 was $36.3 million.
The Company has 50% ownership in Bell, LLC, a VIE joint venture that owns and leases to the Company its corporate office building located in Ames, Iowa. Commencing January 1, 2011, the Company has the right to execute a call option with the joint venture member, Dayton Park, LLC, to purchase Bell, LLC; therefore, the Company determined it was the primary beneficiary of Bell, LLC and consolidated Bell, LLC into the Company’s financial statements. The Company is the primary beneficiary due to its ownership interest and as a result of having an exercisable call option that allows us to direct the activities that most significantly impact Bell, LLC’s economic performance and gives the Company the majority of the benefit from the use of Bell, LLC’s assets. Through consolidation of Bell, LLC on January 1, 2011, the Company recorded an outstanding promissory note balance of $4.8 million. Bell, LLC makes monthly principal payments of approximately $15,000 plus interest. The note bears interest at a rate of 5.125% per annum and the note matures February 15, 2013. The note is secured by a mortgage interest in the office building and has an outstanding balance of $4.6 million at June 30, 2011.
40
As of June 30, 2011, we and our subsidiaries were in compliance with all restrictive financial covenants associated with the borrowings as of June 30, 2011.
We continue to be in discussions with lenders in an effort to obtain financing for facilities under construction and capital improvement projects for our operating facilities. Since these discussions are ongoing, we are uncertain when or if financing will be available. We are seeking to enter into equity and debt financing arrangements to meet our projected financial needs for operations, upgrades to existing plants and for completion of the New Orleans Facility, the Emporia Facility and the Clovis Facility. The financing may consist of common or preferred stock, debt, project financing or a combination of these financing techniques. Additional debt would likely increase our leverage and interest costs and would likely be secured by certain of our assets. Additional equity or equity-linked financings would likely have a dilutive effect on our existing shareholders. It is likely that the terms of any project financing would include customary financial and other covenants on our project subsidiaries, including restrictions on the ability to make distributions, to guarantee indebtedness and to incur liens on the plants of such subsidiaries.
Cash flow. The following table presents information regarding our cash flows and cash and cash equivalents for the six months ended June 30, 2011 and 2010:
| Six Months Ended June 30, |
||||||||
| 2011 | 2010 | |||||||
| Net cash flows from operating activities |
$ | 6,926 | $ | (2,105 | ) | |||
| Net cash flows from investing activities |
(787 | ) | (1,394 | ) | ||||
| Net cash flows from financing activities |
(1,273 | ) | 2,929 | |||||
| Net change in cash and cash equivalents |
4,866 | (570 | ) | |||||
| Cash and cash equivalents, end of period |
$ | 9,125 | $ | 5,285 | ||||
Operating activities. Net cash provided in operating activities was $6.9 million and net cash used in operating activities was $2.1 million for the six months ended June 30, 2011 and 2010, respectively. The increase in cash provided from operating activities is largely related to improved operating margins realized from an increase in market demand, gallons sold and plant utilization. For the six months ended June 30, 2011, net income was $2.8 million, which includes depreciation and amortization expense of $4.0 million, stock compensation expense of $2.0 million, a increase in the non-cash change in the preferred stock embedded derivative liability of $17.1 million and a increase in the non-cash change in the Seneca Holdco liability of $1.2 million. We also used $20.9 million to fund net working capital requirements, which resulted in a net cash source from operations of $6.9 million.
The net use of cash from operating activities for the six months ended June 30, 2010 of $2.1 million reflects $2.7 million in net income from operations, primarily offset by a deferred tax benefit of $3.7 million, depreciation and amortization expense of $2.3 million, $5.0 million change in the fair value of preferred stock conversion feature embedded derivative, and net working capital increase of $0.3 million.
Investing activities. Net cash used for investing activities for the six months ended June 30, 2011 was $0.8 million, consisting of net cash used to pay for facility construction of $1.2 million and cash provided from the release of restricted cash in the amount of $0.4 million. Net cash used in investing activities for the six months ended June 30, 2010 was $1.4 million, consisting of cash paid for Seneca construction of $2.1 million and partially offset by a certificate of deposit provided from the acquisition of CIE that relates to the Iowa Department of Economic Development loan and is restricted.
Financing activities. Net cash used from financing activities for the six months ended June 30, 2011 was $1.3 million, which represents $1.0 in borrowings on our WestLB Revolver. This was offset by $2.0 in principal payments in connection with the notes payable. Net cash provided from financing activities for the six months ended June 30, 2010 was $2.9 million, which represents $4.0 million cash proceeds received from the Seneca investors. This was partially offset by principal payments in connection with the note payable and amounts paid for debt issuance.
Capital expenditures. We plan to make significant capital expenditures when debt or equity financing becomes available to complete construction of three facilities, our New Orleans Facility, our Emporia Facility and our Clovis Facility, with expected aggregate nameplate production capacity of 135 mmgy. We estimate completion of the New Orleans, Emporia and the Clovis facilities will require an estimated $130 to $140 million, excluding working capital. We also plan to undertake various facility upgrades when funding becomes available to further expand processing capabilities at our existing facilities, most significantly our Houston Facility and our newly acquired Albert Lea facility.
41
Contractual Obligations:
The following table describes our commitments to settle contractual obligations in cash as of December 31, 2010:
| Payments Due by Period | ||||||||||||||||||||
| Total | Less Than 1 Year |
Years 1-3 |
Years 4-5 |
More Than 5 Years |
||||||||||||||||
| (In thousands) | ||||||||||||||||||||
| Long Term Debt (1) |
$ | 99,774 | $ | 30,097 | $ | 36,660 | $ | 7,974 | $ | 25,043 | ||||||||||
| Operating Lease Obligations (2) |
89,214 | 7,268 | 23,799 | 15,005 | 43,142 | |||||||||||||||
| Purchase Obligations (3) |
18,087 | 10,039 | 8,048 | — | — | |||||||||||||||
| Other Long-Term Liabilities (4) |
2,201 | 160 | 301 | 80 | 160 | |||||||||||||||
|
|
|
|
|
|
|
|
|
|
|
|||||||||||
| $ | 209,276 | $ | 47,564 | $ | 68,808 | $ | 23,059 | $ | 68,345 | |||||||||||
|
|
|
|
|
|
|
|
|
|
|
|||||||||||
| (1) | See footnotes to the financial statements for additional detail. Includes fixed interest associated with these obligations. |
| (2) | Operating lease obligations consist of terminals, rail cars, vehicles, ground leases and the Ames office lease. |
| (3) | Purchase obligation for our production facilities and partially completed facilities. |
| (4) | Includes incentive compliance and other facility obligations. Also, represents $1.5 million of liability for unrecognized tax benefits as the timing and amounts of cash payments are uncertain the amounts have not been classified by period. |
Off-Balance Sheet Arrangements
We have no off-balance sheet arrangements.
Recent Accounting Pronouncements
For a discussion of new accounting pronouncements affecting the Company, refer to “Note 2 – Summary of Significant Accounting Policies” to our condensed consolidated financial statements.
| Item 3. | Quantitative and Qualitative Disclosures about Market Risk |
The primary objectives of our investment activity are to preserve principal, provide liquidity and maximize income without significantly increasing risk. Some of the securities we invest in are subject to market risk. This means that a change in prevailing interest rates may cause the principal amount of the investment to fluctuate. To minimize this risk, we maintain a portfolio of cash equivalents in short-term investments in money market funds.
Commodity Price Risk
The primary objectives of our investment activity are to preserve principal, provide liquidity and maximize income without significantly increasing risk. Some of the securities we invest in are subject to market risk. This means that a change in prevailing interest rates may cause the principal amount of the investment to fluctuate. To minimize this risk, we maintain a portfolio of cash equivalents in short-term investments in money market funds.
Over the period from January 2007 through June 2011, average diesel prices based on Platts reported pricing for Group 3 (Midwest) have ranged from a high of approximately $4.10 per gallon reported in July 2008 to a low of approximately $1.03 per gallon in March 2009, with prices averaging $2.34 per gallon during this period. Over the period from January 2006 through June 2011, soybean oil prices (based on closing sales prices on the CBOT nearby futures, for crude soybean oil) have ranged from a high of $0.7040 per pound in March 2008 to a low of $0.2108 per pound in January 2006, with closing sales prices averaging $0.3987 per pound during this period. Over the period from January 2008 through June 2011, animal fat prices (based on prices from The Jacobsen Missouri River, for choice white grease) have ranged from a high of $0.5250 per pound in June 2011 to a low of $0.0950 per pound in December 2008, with sales prices averaging $0.3120 per pound during this period.
Higher feedstock prices or lower biodiesel prices result in lower profit margins and, therefore, represent unfavorable market conditions. Traditionally, we have not been able to pass along increased feedstock prices to our biodiesel customers. The availability and price of feedstocks are subject to wide fluctuations due to unpredictable factors such as weather conditions during the growing season, kill ratios, carry-over from the previous crop year and current crop year yield, governmental policies with respect to agriculture and supply and demand.
42
We have prepared a sensitivity analysis to estimate our exposure to market risk with respect to our sales contracts, lower cost feedstock requirements, soybean oil requirements and the related exchange-traded contracts for 2010. Market risk is estimated as the potential loss in fair value, resulting from a hypothetical 10% adverse change in the fair value of our soybean oil and requirements and biodiesel sales. The results of this analysis, which may differ from actual results, are as follows:
| 2010 Volume (in millions) |
Units | Hypothetical Adverse Change in Price |
Change in Annual Gross Profit (in millions) |
Percentage Change in Gross Profit |
||||||||||||||
| Biodiesel |
67.9 | gallons | 10 | % | $ | 19 | 87.2 | % | ||||||||||
| Lower Cost Feedstocks |
398.3 | pounds | 10 | % | $ | 12 | 53.5 | % | ||||||||||
| Soybean Oil |
40.5 | pounds | 10 | % | $ | 2 | 7.1 | % | ||||||||||
Interest Rate Risk
We are subject to interest rate risk in connection with our $2.0 million loan from the proceeds of Variable Rate Demand Industrial Development Revenue Bonds, or IFA Bonds, issued by the Iowa Finance Authority to finance our Ralston facility. The IFA Bonds bear interest at a variable rate determined by the remarketing agent from time to time as the rate necessary to produce a bid for the purchase of all of the Bonds at a price equal to the principal amount thereof plus any accrued interest at the time of determination, but not in excess of 10% per annum. The interest rate on the bonds was 0.54% for the last week of December 2010. A hypothetical increase in interest rate of 10% would not have a material effect on our annual interest expense.
We are subject to interest rate risk relating to REG Danville’s $24.6 million term debt financing with Fifth Third Bank. The term loan bears interest at a fluctuating rate based on a range of rates above 30-day LIBOR and will mature on November 3, 2011. Interest will accrue on the outstanding balance of the term loan at 30-day LIBOR plus 400 basis points. Interest accrued on the outstanding balance of the loan at December 31, 2010 at 4.26%.
Blackhawk entered into an interest rate swap agreement in connection with the aforementioned term loan in May 2008. The agreement was assumed by REG Danville in the Blackhawk merger. The swap agreement effectively fixes the interest rate at 3.67% on a notional amount of approximately $20.7 million of REG Danville’s term loan through November 2011. The fair value of the interest rate swap agreement was $0.6 million and $1.0 million at December 31, 2010 and 2009, respectively, and is recorded in the other noncurrent liabilities. The interest rate swap agreement is not designated as a cash flow or fair value hedge. Gains and losses based on the fair value change in the interest rate swap agreement are recognized in the statement of operations as a change in the fair value of interest rate swap agreement. A hypothetical increase in interest rate of 10% would not have a material effect on our annual interest.
REG Newton is subject to interest rate risk relating to its $23.6 million term debt financing and its $2.4 million revolving line of credit both from AgStar. Interest will accrue on the outstanding balance of the term loan at 30-day LIBOR or 2.00%, whichever is higher, plus 300 basis points (effective rate at December 31, 2010 of 5.00%). The revolving line of credit accrues interest at 30-day LIBOR or 2.00%, whichever is higher, plus 300 basis points (effective rate at December 31, 2010 of 5.00%). A hypothetical increase in interest rate of 10% would not have a material effect on our annual interest expense.
REG Seneca is subject to interest rate risk relating to its lease payments for the Seneca facility. The lease provides that REG Seneca will pay rent in the amount of the interest payments due to WestLB from Landlord. The note requires that interest be accrued at different rates based on whether it is a Base Rate Loan or Eurodollar loan. Each Base Rate Loan accrues interest at a rate per annum equal to 2% plus the higher of (i) the Federal Funds Effective Rate plus 0.5% and (ii) the rate of interest in effect for such day as publicly announced from time to time by WestLB as its “prime rate”. Each Eurodollar Loan accrues interest at a rate per annum equal to 3.0% plus the greater of (a) one and one half percent (1.5%) per annum, and (b) the rate per annum obtained by dividing (x) LIBOR for such Interest Period and Eurodollar Loan, by (y) a percentage equal to (i) 100% minus (ii) the Eurodollar Reserve Percentage for such Interest Period. The loan was a Eurodollar Loan through December 31, 2010 (effective rate at December 31, 2010 of 3.26%). Interest is paid monthly. A hypothetical increase in interest rate of 10% would not have a material effect on our annual interest expense.
43
REG Marketing and Logistics Group, LLC and REG Services Group, LLC, together the WestLB Loan Parties, are subject to interest rate risk relating to their $10.0 million revolving line of credit from WestLB. The note requires that interest be accrued at different rates based on whether it is a Base Rate Loan or Eurodollar loan. Each Base Rate Loan shall accrue interest at a rate per annum equal to 2% plus the higher of (i) the Federal Funds Effective Rate plus 0.5% and (ii) the rate of interest in effect for such day as publicly announced from time to time by WestLB as its “prime rate”. Each Eurodollar Loan shall accrue interest at a rate per annum equal to 3.0% plus the greater of (a) one and one half percent (1.5%) per annum, and (b) the rate per annum obtained by dividing (x) LIBOR for such Interest Period and Eurodollar Loan, by (y) a percentage equal to (i) 100% minus (ii) the Eurodollar Reserve Percentage for such Interest Period. The loan was a Eurodollar Loan through December 31, 2010 (effective rate at December 31, 2010 of 3.26%). Interest is paid monthly. A hypothetical increase in interest rate of 10% would not have a material effect on our annual interest expense.
Inflation
To date, inflation has not significantly affected our operating results, though costs for petroleum-based diesel fuel, feedstocks, construction, labor, taxes, repairs, maintenance and insurance are all subject to inflationary pressures. Inflationary pressure in the future could affect our ability to sell the biodiesel we produce, maintain our production facilities adequately, build new biodiesel production facilities and expand our existing facilities as well as the demand for our facility construction management and operations management services.
| ITEM 4. | EVALUATION OF DISCLOSURE CONTROLS AND PROCEDURES |
We maintain a system of disclosure controls and procedures that are designed to ensure that information required to be disclosed in the Company’s reports under the Securities Exchange Act of 1934, as amended (the “Exchange Act”), is recorded, processed, summarized and reported within the time periods specified in the SEC’s rules and forms, and that such information is accumulated and communicated to management, including our Chief Executive Officer and the Chief Financial Officer, as appropriate, to allow timely decisions regarding required disclosure. In designing and evaluating the disclosure controls and procedures, management recognized that any controls and procedures, no matter how well designed and operated, can provide only reasonable assurance of achieving the desired control objectives.
Management, with the participation of our Chief Executive Officer and our Chief Financial Officer, has evaluated the effectiveness of our disclosure controls and procedures, as defined in Rule 13a-15(e) of the Exchange Act, as of June 30, 2011. Based on that evaluation, our Chief Executive Officer and Chief Financial Officer concluded that our disclosure controls and procedures were effective as of June 30, 2011.
No change in our internal control over financial reporting (as defined in Rules 13a-15(f) under the Exchange Act) occurred during the quarter ended June 30, 2011 that has materially affected, or is reasonably likely to materially affect, our internal control over financial reporting.
44
PART II. OTHER INFORMATION
| ITEM 1. | LEGAL PROCEEDINGS |
We believe there is no pending or threatened litigation that would have a material adverse effect on our financial position, operations or liquidity.
| ITEM 1A. | RISK FACTORS |
The risk factors listed below are included for the purpose of supplementing the risk factors disclosed in the section entitled “Risk Factors” in Part I, Item 1A of our Annual Report on Form 10-K for the year ended December 31, 2010.
RISKS ASSOCIATED WITH OUR BUSINESS
Loss or reductions of governmental requirements for the use of biofuels could have a material adverse affect on our revenues and operating margins.
The biodiesel industry relies substantially on federal requirements and state policies for use of biofuels. Since biodiesel has been more expensive to produce than petroleum-based diesel fuel over the past few years, the biodiesel industry depends on governmental programs that support a market for biodiesel that might not otherwise exist.
The most important of these government programs in the United States is RFS2, which requires that a certain volume of biomass-based diesel fuel, which includes biodiesel, be consumed. RFS2 became effective on July 1, 2010 and applies through 2022. We believe that the increase in demand for our biodiesel in the first six months of 2011 is directly attributable to the implementation of RFS2. In addition, we believe that biodiesel prices in the first six months of 2011 have benefited significantly from RFS2.
There can be no assurance that Congress or the EPA will not repeal, curtail or otherwise change the RFS2 program in a manner adverse to us. The petroleum industry has opposed the retroactive application of certain provisions of the rule and fundamental fairness in the implementation of policy involved in RFS2 and can be expected to continue to press for changes that eliminate or reduce its impact. Any repeal or reduction in the RFS2 requirements or reinterpretation of RFS2 resulting in our biodiesel failing to qualify as a required fuel would materially decrease the demand for and price of our product, which would materially and adversely harm our revenues and cash flows.
If Congress decides to repeal or curtail RFS2, or if the EPA is not able or willing to enforce RFS2 requirements, the demand for our product based on this program and any increases in demand that we expect due to RFS2 would be significantly reduced or eliminated and our revenues and operating margins would be materially harmed. In addition, although we believe that state requirements for the use of biofuels increase demand for our biodiesel within such states, they generally may not increase overall demand in excess of RFS2 requirements. Rather, existing demand for our biofuel from petroleum refiners and petroleum fuel importers in the 48 contiguous states or Hawaii, which are defined as “Obligated Parties” in the RFS2 regulations, in connection with federal requirements, may shift to states that have use requirements or tax incentive programs.
45
Our gross margins are dependent on the spread between biodiesel prices and feedstock costs.
Our gross margins depend on the spread between biodiesel prices and feedstock costs. Historically, the spread between biodiesel prices and feedstock costs has varied significantly. Although actual yields vary depending on the feedstock quality, the average monthly spread between the price per gallon of 100% pure biodiesel, or B100, as reported by The Jacobsen Publishing Company, or The Jacobsen, and the price for the amount of choice white grease, a common inedible animal fat used by us to make biodiesel was $1.83 in 2008, $1.25 in 2009, $1.06 in 2010, and $1.08 in the first six months of 2011, assuming 8.0 pounds of choice white grease yields one gallon of biodiesel. The average monthly spread for the amount of crude soybean oil required to produce one gallon of biodiesel, based on the nearby futures contract as reported on the Chicago Board of Trade, or CBOT, was $0.61 per gallon in 2008, $0.39 in 2009, and $0.25 per gallon in 2010, and $0.62 in the first six months of 2011, assuming 7.5 pounds of soybean oil yields one gallon of biodiesel. For 2010, approximately 91% of our total feedstock usage was inedible animal fat, used cooking oil or inedible corn oil and 9% was soybean oil, compared to approximately 78% for inedible animal fat, used cooking or inedible corn oil and 22% for soybean oil in 2009.
Biodiesel has traditionally been marketed primarily as an additive or alternative to petroleum-based diesel fuel and as a result biodiesel prices have been influenced by the price of petroleum-based diesel fuel, adjusted for government tax incentives supporting renewable fuels, rather than biodiesel production costs. A lack of correlation between production costs and biodiesel prices means that we may be unable to pass increased production costs on to our customers in the form of higher prices. Any decrease in the spread between biodiesel prices and feedstock costs, whether as a result of an increase in feedstock prices or a reduction in biodiesel prices, including, but not limited to, a reduction in the value of Renewable Identification Numbers, or RINs, would adversely affect our gross margins, cash flow and results of operations.
The costs of raw materials that we use as feedstocks are volatile and our results of operations could fluctuate substantially as a result.
The cost of feedstocks is a significant uncertainty for our business. The success of our operations is dependent on the price of feedstocks and certain other raw materials that we use to produce biodiesel. A decrease in the availability or an increase in the price of feedstocks may have a material adverse effect on our financial condition and operating results. At elevated price levels, these feedstocks may be uneconomical to use, as we may be unable to pass feedstock cost increases on to our customers.
The price and availability of feedstocks and other raw materials may be influenced by general economic, market and regulatory factors. These factors include weather conditions, farming decisions, government policies and subsidies with respect to agriculture and international trade, and global supply and demand. The significance and relative impact of these factors on the price of feedstocks is difficult to predict, especially without knowing what types of feedstock materials will be optimal for use in the future, particularly at new facilities that we construct or acquire.
Since 2009, we have principally used inedible animal fats, used cooking oil and inedible corn oil as our feedstocks for the production of biodiesel. Our decision to shift to these feedstocks resulted from the reduction in profit caused by a significant increase in soybean oil prices, which rose from $0.1435 per pound in February 2001 to $0.7040 per pound in March 2008, based on the closing nearby futures prices on the CBOT, and soybean oil having generally remained at high levels since that time. While less volatile than soybean oil, prices for these alternative feedstocks can also vary significantly based on market conditions. Since January 1, 2008, the cost per pound of choice white grease, an inedible animal fat commonly used by us in the production of biodiesel, has traded in a range of $0.0950 to $0.5250.
46
Historically, the price of animal fat has been affected by the amount of slaughter kills in the United States, as well as demand from other markets. If biodiesel production continues to increase in response to RFS2, we expect that more biodiesel producers will seek to use these lower cost feedstocks, potentially increasing our costs of production. In addition, because the market for animal fat is less well developed than markets for vegetable oils such as soybean oil, we generally are unable to enter into forward contracts at fixed prices. Further, the markets for used cooking oil and inedible corn oil are in their nascent stages. The market for used cooking oil as a feedstock for biodiesel is still developing and supply is limited. While the commercial supply for inedible corn oil is growing as ethanol producers are installing corn oil extraction technology in their ethanol plants, it is not generally available in quantities sufficient to cover all our operations. At present, there are a limited number of ethanol plants with the equipment necessary to extract inedible corn oil that can be used in biodiesel production. If more ethanol plants do not acquire and utilize corn oil extraction equipment or if ethanol plants are idled, we may not be able to obtain additional amounts of inedible corn oil for use in our production of biodiesel and may be forced to utilize higher cost feedstocks to meet increased demand, which may not be economical.
We have limited working capital and a recent history of unprofitable operations; these working capital constraints may limit our growth and may cause us to curtail our operations or forgo sales.
We have a limited amount of working capital to support our operations. We became cash flow positive during fourth quarter of 2010 and were cash flow positive in the first and second quarters of 2011, but we will need to raise additional working capital to be able to take advantage of the anticipated increased demand for biodiesel resulting from RFS2. Rising commodity prices further increase our demand for working capital, as both our feedstock production costs and costs for biodiesel we acquire from third parties and resell have increased in price, requiring more working capital to manage the same volume of sales. If additional working capital is not available, we may find it necessary to curtail operations and forgo sales harming our revenues and profitability.
We and certain subsidiaries have substantial indebtedness which subjects us to potential defaults and could adversely affect our ability to raise additional capital to fund our operations and limit our ability to react to changes in the economy or the biodiesel industry.
Several of our subsidiaries have a significant amount of indebtedness, some of which we have guaranteed. At June 30, 2011, our total term debt was $89.3 million. This includes consolidated term debt owed by our Variable Interest Entities, or VIEs, including Landlord and 416 South Bell, LLC, or Bell, LLC. At June 30, 2011, the amount borrowed by our subsidiaries under our lines of credit was $10.6 million, all of which we guaranteed.
All of the agreements for our indebtedness contain financial covenants the breach of which would result in an event of default by us or our subsidiary obligor. At June 30, 2011, we and our subsidiaries were in compliance with all restrictive financial covenants associated with the borrowings.
47
Our level of indebtedness relative to our size could restrict our operations and make it more difficult for us to satisfy our debt obligations or obtain additional borrowings for working capital to fund operations. In connection with the Seneca facility transaction, one of our subsidiaries leases the Seneca facility from Landlord, an entity owned by certain of our large stockholders. In addition, our subsidiaries are required annually to pay a certain portion of our excess cash flow at our Danville and Newton facilities to their respective lenders, which reduces the cash flow that we receive from these facilities.
Our significant amount of indebtedness could:
| • | require us to dedicate a substantial portion of our cash flow from operations to payments of principal, interest on, and other fees related to such indebtedness, thereby reducing the availability of our cash flow to fund working capital and capital expenditures, and for other general corporate purposes; |
| • | increase our vulnerability to general adverse economic and biodiesel industry conditions; |
| • | limit our flexibility in planning for, or reacting to, changes in our business and the biodiesel industry, which may place us at a competitive disadvantage compared to our competitors that have less debt; and |
| • | limit among other things, our ability to borrow additional funds. |
Loss or reductions of tax incentives for biodiesel production or consumption would have a material adverse affect on our revenues and operating margins.
The biodiesel industry is also substantially aided by federal and state tax incentives. Prior to RFS2, the biodiesel industry relied principally on these tax incentives to bring the price of biodiesel more in line with the price of petroleum-based diesel fuel to the end user. The most significant tax incentive program is the federal blenders’ tax credit. The blenders’ tax credit provides a $1.00 refundable tax credit per gallon of pure biodiesel, or B100, to the first blender of biodiesel with petroleum-based diesel fuel. Congress allowed the blenders’ tax credit to expire as of December 31, 2009 and then re-enacted the credit in December 2010 retroactively for all of 2010 and prospectively for 2011. The blenders’ tax credit is set to expire again on December 31, 2011. Unlike RFS2, the blenders’ tax credit has a direct effect on federal government spending and could be changed or eliminated as a result of changes in the federal tax or budget policy. The absence of and uncertainty around the blenders’ tax credit during most of 2010 materially curtailed demand for biodiesel and our ability to cost effectively produce and sell biodiesel, resulting in our idling production at several of our facilities during that period. Although the blenders’ tax credit was reinstated for all of 2010, we were not able to recapture all of the tax credit we would have been able to receive because we had chosen not to blend a significant portion of our production in 2010 after the credit lapsed. It is uncertain what action, if any, Congress may take with respect to extending the blenders’ tax credit beyond 2011 or when such action might be effective. If Congress eliminates or reduces the blenders’ tax credit before its expiration on December 31, 2011, or does not extend the credit beyond 2011, demand for our biodiesel and the price we are able to charge for our product may be significantly reduced, harming revenues and profitability.
In addition, several states have enacted tax incentives for the use of biodiesel. Like the federal blenders’ tax credit, these tax incentive programs could be changed as a result of state budget considerations or otherwise. Reduction or elimination of such incentives could materially and adversely harm our revenues and profitability.
48
Despite our current debt levels, we and our subsidiaries may incur substantially more debt. This could exacerbate the risks associated with our substantial indebtedness.
We and our subsidiaries may incur substantial additional debt in the future, including secured debt. We and certain of our subsidiaries are not currently prohibited under the terms of our debt from incurring additional debt, pledging assets, recapitalizing our debt or taking a number of other actions that could diminish our ability to make payments thereunder. If new indebtedness is added to our current debt levels, the related risks that we and our subsidiaries now face could intensify.
Our success depends on our ability to manage our growing and changing operations.
Since our formation, our business has grown significantly in size and complexity. This growth has placed, and is expected to continue to place, significant demands on our management, systems, internal controls and financial and physical resources. In addition, we expect that we will need to further develop our financial and managerial controls and reporting systems to accommodate future growth. This will require us to incur expenses related to hiring additional qualified personnel, retaining professionals to assist in developing the appropriate control systems and expanding our information technology infrastructure. Our inability to manage growth effectively could have a material adverse effect on our results of operations, financial position and cash flows.
Risk management transactions could significantly increase our operating costs and working capital requirements if we incorrectly estimate our feedstock demands and biodiesel sales as compared to market conditions.
In an attempt to partially offset the effects of volatility of feedstock costs and biodiesel fuel prices, we may enter into contracts that establish market positions in feedstocks, such as inedible animal fats and soybean oil, and related commodities, such as heating oil and ultra-low sulfur diesel, or ULSD. The financial impact of such market positions will depend on market prices at the time that we are required to perform our obligations under these contracts. Risk management arrangements will also expose us to the risk of financial loss in situations where the counterparty defaults on its contract or, in the case of exchange-traded or over-the-counter futures or options contracts, where there is a change in the expected differential between the underlying price in the contract and the actual prices paid or received by us. Risk management activities can themselves result in losses when a position is purchased in a declining market or a position is sold in a rising market. Changes in the value of these futures instruments are recognized in current income and may result in margin calls. We may also vary the amount of risk management strategies we undertake, or we may choose not to engage in risk management transactions at all. Further, our ability to reduce the risk of falling biodiesel prices and rising feedstock costs will be limited as currently there are no established futures market for biodiesel or the vast majority of our feedstocks, nor are fixed-price long-term contracts generally available. As a result, our results of operations and financial position may be adversely affected by increases in the price of feedstocks or decreases in the price of biodiesel that are not managed effectively.
One customer accounted for a meaningful percentage of revenues and a loss of this customer could have an adverse impact on our total revenues.
One customer, Pilot Travel Centers LLC, or Pilot, accounted for 24% and 29% of our total revenues in 2009 and 2010, respectively. During the first six months of 2011, Pilot accounted for 25% of our total revenues. Our agreements with Pilot have typically had a one-year term and our current agreement with Pilot expires December 31, 2011. In the event we lose Pilot as a customer or Pilot significantly reduces the volume of biodiesel it buys from us, it could be difficult to replace the lost revenues in the short term and potentially over an extended period, and our profitability and cash flow could be materially harmed.
49
Our business is primarily dependent upon one product. As a consequence, we may not be able to adapt to changing market conditions or endure any decline in the biodiesel industry.
Our business is currently focused almost entirely on the production and sale of biodiesel, with glycerin and fatty acid sales and the operations of our Services segment representing only a small portion of revenues. Our reliance on biodiesel means that we may not be able to adapt to changing market conditions or to withstand any significant decline in the biodiesel industry.
Technological advances and changes in production methods in the biodiesel industry could render our plants obsolete and adversely affect our ability to compete.
It is expected that technological advances in biodiesel production methods will continue to occur and new technologies for biodiesel production may develop. Advances in the process of converting oils and fats into biodiesel could allow our competitors to produce biodiesel faster and more efficiently and at a substantially lower cost. If we are unable to adapt or incorporate technological advances into our operations, our production facilities could become less competitive or obsolete. Further, it may be necessary for us to make significant expenditures to acquire any new technology and retrofit our plants in order to incorporate new technologies and remain competitive. There is no assurance that third-party licenses for any new proprietary technologies would be available to us on commercially reasonable terms or that any new technologies could be incorporated into our plants. If we are unable to obtain, implement or finance new technologies, our production facilities could be less efficient than our competitors and our results of operations could be substantially harmed.
If we are unable to respond to changes in ASTM or customer standards, our ability to sell biodiesel may be harmed.
We currently produce biodiesel to conform to or exceed standards established by ASTM. ASTM standards for biodiesel and biodiesel blends may be modified in response to new observations from the industries involved with diesel fuel. New tests or more stringent standards may require us to make additional capital investments in, or modify, plant operations to meet these standards. In addition, some biodiesel customers have developed their own biodiesel standards which are stricter than the ASTM standards. If we are unable to meet new ASTM standards or our biodiesel customers’ standards cost effectively or at all, our production technology may become obsolete, and/or our ability to sell biodiesel may be harmed, negatively impacting our revenues and profitability.
Increases in our transportation costs or disruptions in our transportation services could have a material adverse effect on our business.
Our business depends on transportation services to deliver our products to our customers and to deliver raw materials to us. The costs of these transportation services are affected by the volatility in fuel prices, such as those caused by recent geopolitical and economic events. We have not been in the past, and may not be in the future, able to pass along part or all of any fuel price increases to customers. If we continue to be unable to increase our prices as a result of increased fuel costs charged to us by transportation providers, our gross margins may be materially adversely affected.
If any transportation providers fail to deliver raw materials to us in a timely manner, we may be unable to manufacture products on a timely basis. Shipments of products and raw materials may be delayed due to weather conditions, strikes or other events. Any failure of a third-party transportation provider to deliver raw materials or products in a timely manner could harm our reputation, negatively affect our customer relationships and have a material adverse effect on our business, financial condition and results of operations.
50
We are dependent upon our key management personnel and the loss of any of these persons could adversely affect our results of operations.
We are highly dependent upon key members of our management team for the execution of our business plan. We believe that our future success is highly dependent on the contributions of these key employees. There can be no assurance that any individual will continue in his or her capacity for any particular period of time. The loss of any of these key employees could delay or prevent the achievement of our business objectives and have a material adverse effect upon our results of operations and financial position.
We have partially constructed plants and planned plant upgrades that require capital that we may not be able to raise.
We have three partially constructed plants, one near New Orleans, Louisiana, one in Emporia, Kansas and one in Clovis, New Mexico, that we expect will require additional investments of approximately $130 to $140 million in the aggregate, excluding working capital requirements, before they would be able to commence production. We also have various upgrades planned for our operating facilities. In order to complete construction of these facilities or upgrade our facilities as planned, we will require additional capital. While we intend to finance certain upgrades to our existing facilities in part with a portion of the proceeds of this offering and from our cash flow from operations, we will need to raise significant capital in addition to the proceeds of this offering to complete construction of the three facilities. We continue to be in discussions with lenders in an effort to obtain financing for our facilities, however, it is uncertain when or if financing will be available. It is also likely that the terms of any project financing would include customary financial and other covenants restricting our project subsidiaries, including restrictions on the ability to make distributions, to guarantee indebtedness and to incur liens on the plants of such subsidiaries. If we are unable to obtain such capital on satisfactory terms, or if such capital is otherwise unavailable, or if we encounter cost overruns on these projects such that we have insufficient capital, we may have to postpone completion of these projects indefinitely, which may adversely affect our ability to implement our strategy and our future revenues and cash flow.
We may not successfully identify and complete acquisitions and other strategic relationships on favorable terms or achieve anticipated synergies relating to any such transactions, and integration of acquisitions may disrupt our business and management.
We regularly review domestic and international acquisitions of biodiesel production facilities and have acquired most of our facilities from third parties. However, we may be unable to identify suitable acquisition candidates in the future. Even if we identify appropriate acquisition candidates, we may be unable to complete such acquisitions on favorable terms, if at all. In addition, we may not realize the anticipated benefits of any or all of our past or future transactions and each transaction has numerous risks. These risks include:
| • | difficulty in integrating the operations and personnel of the acquired company; |
| • | difficulty in effectively integrating the acquired technologies, products or services with our current technologies, products or services; |
| • | disruption of our ongoing business and distraction of our management and employees from other opportunities and challenges; |
| • | inability to achieve the financial and strategic goals for the acquired and combined businesses; |
| • | incurring acquisition-related costs or amortization costs for acquired intangible assets that could impact our operating results; |
51
| • | potential failure of the due diligence processes to identify significant problems, liabilities or other shortcomings or challenges of an acquired company or technology, including but not limited to, issues with the acquired company’s intellectual property, product quality, environmental liabilities, data back-up and security, revenue recognition or other accounting practices, employee, customer or partner issues or legal and financial contingencies; |
| • | exposure to litigation or other claims in connection with, or inheritance of claims or litigation risk as a result of, an acquisition, including but not limited to, claims from terminated employees, customers, former stockholders or other third parties; and |
| • | incurring significant exit charges if products or services acquired in business combinations are unsuccessful. |
In addition, one of our strategic goals is to expand our biodiesel production capabilities into international markets. In the event we expand our operations into international markets through acquisitions or otherwise, we may be exposed to additional risks, including unexpected changes in foreign laws and regulations, political and economic instability, challenges in managing foreign operations, increased costs to adapt our systems and practices to those used in foreign countries, export duties, currency restrictions, tariffs and other trade barriers, and the burdens of complying with a wide variety of foreign laws, each of which could have a material adverse effect on our business, financial condition, results of operations and liquidity.
Our business is subject to seasonal fluctuations, which are likely to cause our revenues and operating results to fluctuate.
Our operating results are influenced by seasonal fluctuations in the price of biodiesel. Our sales tend to decrease during the winter season due to perceptions that biodiesel will not perform adequately in colder weather. Colder seasonal temperatures can cause the higher cloud point biodiesel we make from inedible animal fats to become cloudy and eventually gel at a higher temperature than petroleum-based diesel or lower cloud point biodiesel made from soybean, canola or inedible corn oil. Such gelling can lead to plugged fuel filters and other fuel handling and performance problems for customers and suppliers. Reduced demand in the winter for our higher cloud point biodiesel may result in excess supply of such higher cloud point biodiesel and/or lower prices for such higher cloud point biodiesel. In addition, most of our production facilities are located in colder Midwestern states and our costs of shipping biodiesel to warmer climates generally increase in cold weather months. As a result of these seasonal fluctuations, comparisons of operating measures between consecutive quarters may not be as meaningful as comparisons between longer reporting periods.
Failure to comply with governmental regulations, including EPA requirements relating to RFS2, could result in the imposition of penalties, fines, or restrictions on our operations and remedial liabilities.
The biodiesel industry is subject to extensive federal, state and local laws and regulations related to the general population’s health and safety and compliance and permitting obligations, including those related to the use, storage, handling, discharge, emission and disposal of municipal solid waste and other waste, pollutants or hazardous substances, or discharges and air and other emissions as well as land use and development. Existing laws also impose obligations to clean up contaminated properties or to pay for the cost of such remediation, often upon parties that did not actually cause the contamination. Compliance with these laws, regulations and obligations could require substantial capital expenditures. Failure to comply could result in the imposition of penalties, fines or restrictions on operations and remedial liabilities. These costs and liabilities could adversely affect our operations.
52
Changes in environmental laws and regulations occur frequently, and any changes that result in more stringent or costly waste handling, storage, transport, disposal or cleanup requirements could require us to make significant expenditures to attain and maintain compliance and may otherwise have a material adverse effect on our business in general and on our results of operations, competitive position or financial condition. We are unable to predict the effect of additional environmental laws and regulations which may be adopted in the future, including whether any such laws or regulations would significantly increase our cost of doing business or affect our operations in any area.
Under certain environmental laws and regulations, we could be held strictly liable for the removal or remediation of previously released materials or property contamination regardless of whether we were responsible for the release or contamination, or if current or prior operations were conducted consistent with accepted standards of practice. Such liabilities can be significant and, if imposed, could have a material adverse effect on our financial condition or results of operations.
In addition to the regulations mentioned above, we are subject to various laws and regulations related to RFS2, most significantly regulations related to the generation and dissemination of RINs. These regulations are highly complex and evolving, requiring us to periodically update our compliance systems. Any violation of these regulations by us, inadvertently or otherwise, could result in significant fines and harm our customers’ confidence in the RINs we issue, either of which could have a material adverse effect on our business.
We are a holding company and there are limitations on our ability to receive dividends and distributions from our subsidiaries.
All of our principal assets, including our biodiesel production facilities, are owned by subsidiaries and these subsidiaries are subject to loan covenants that generally restrict them from paying dividends, making distributions or making loans to us or to any other subsidiary. These limitations will restrict our ability to repay indebtedness, finance capital projects or pay dividends to stockholders from our subsidiaries cash flows from operations.
Our business may suffer if we are unable to attract or retain talented personnel.
Our success depends on the abilities, expertise, judgment, discretion, integrity, and good faith of our management and employees to manage the business and respond to economic, market and other conditions. We have a relatively small management team and employee base, and the inability to attract suitably qualified replacements or additional staff could adversely affect our business. No assurance can be given that our management team or employee base will continue their employment, or that replacement personnel with comparable skills could be found. If we are unable to attract and retain key personnel and additional employees, our business may be adversely affected.
If we fail to maintain effective internal control over financial reporting, we might not be able to report our financial results accurately or prevent fraud; in that case, our stockholders could lose confidence in our financial reporting, which would harm our business and could negatively impact the value of our stock.
Effective internal controls are necessary for us to provide reliable financial reports and prevent fraud. The process of maintaining our internal controls may be expensive and time consuming and may require significant attention from management. Although we have concluded that our internal control over financial reporting provides reasonable assurance regarding the reliability of financial reporting and the preparation of financial statements for external purposes in accordance with generally accepted accounting principles, because of its inherent limitations, internal control over financial reporting may not prevent or detect fraud or misstatements. Failure to implement required new or improved controls,
53
or difficulties encountered in their implementation, could harm our results of operations or cause us to fail to meet our reporting obligations. If we or our independent registered public accounting firm discover a material weakness, the disclosure of that fact could harm the value of our stock and our business.
A natural disaster, leak, fire or explosion at any of our production plants would increase our costs and liabilities.
Because biodiesel and some of its inputs and outputs are combustible and flammable, a leak, fire or explosion may occur at a plant which could result in damage to the plant and nearby properties, injury to employees and others, and interruption of operations. In addition, our Houston facility, due to its coastal location, is vulnerable to hurricanes, which may cause plant damage, injury to employees and others and interruption of operations and all of our plants could incur damage from other natural disasters. A majority of our facilities are also located in the Midwest, which is subject to tornado activity. If any of the foregoing events occur, we may incur significant additional costs including, among other things, loss of profits due to unplanned temporary or permanent shutdowns of our facilities, clean-up costs, liability for damages or injuries, legal expenses, and reconstruction expenses, which would seriously harm our results of operations and financial condition.
Our insurance may not protect us against our business and operating risks.
We maintain insurance for some, but not all, of the potential risks and liabilities associated with our business. For some risks, we may not obtain insurance if we believe the cost of available insurance is excessive relative to the risks presented. As a result of market conditions, premiums and deductibles for certain insurance policies can increase substantially and, in some instances, certain insurance policies may become unavailable or available only for reduced amounts of coverage. As a result, we may not be able to renew our existing insurance policies or procure other desirable insurance on commercially reasonable terms, if at all. Although we intend to maintain insurance at levels we believe are appropriate for our business and consistent with industry practice, we will not be fully insured against all risks. In addition, pollution, environmental risks and the risk of natural disasters generally are not fully insurable. Losses and liabilities from uninsured and underinsured events and delay in the payment of insurance proceeds could have a material adverse effect on our financial condition and results of operations.
Confidentiality agreements with employees and others may not adequately prevent disclosures of confidential information, trade secrets and other proprietary information.
We rely in part on trade secret protection to protect our confidential and proprietary information and processes. However, trade secrets are difficult to protect. We have taken measures to protect our trade secrets and proprietary information, but these measures may not be effective. For example, we require new employees and consultants to execute confidentiality agreements upon the commencement of their employment or consulting arrangement with us. These agreements generally require that all confidential information developed by the individual or made known to the individual by us during the course of the individual’s relationship with us be kept confidential and not disclosed to third parties. These agreements also generally provide that knowhow and inventions conceived by the individual in the course of rendering services to us are our exclusive property. Nevertheless, these agreements may be breached, or may not be enforceable, and our proprietary information may be disclosed. Further, despite the existence of these agreements, third parties could reverse engineer our processes and others may independently develop substantially equivalent proprietary information and techniques. Accordingly, it may be difficult for us to protect our trade secrets. Costly and time-consuming litigation could be necessary to enforce and determine the scope of our proprietary rights, and failure to obtain or maintain trade secret protection could adversely affect our competitive business position.
54
Moreover, we cannot assure you that our technology does not infringe upon any valid claims of patents that other parties own. In the future, if we were found to be infringing on a patent owned by a third party, we might have to seek a license from such third party to use the patented technology. We cannot assure you that, if required, we would be able to obtain such a license on terms acceptable to us, if at all. If a third party brought a legal action against us or our licensors, we could incur substantial costs in defending ourselves, and we cannot assure you that such an action would be resolved in our favor. If such a dispute were to be resolved against us, we could be subject to significant damages.
We depend on our ability to maintain relationships with industry participants, including our current stockholders and other strategic partners.
Our ability to maintain commercial arrangements with biodiesel customers, feedstock suppliers, and transportation and logistics services providers may depend on maintaining close working relationships with industry participants including some of our current stockholders, including Bunge, ED&F Man and West Central. As we continue to develop our business, we expect to use the business relationships of management and our stockholders in order to form strategic relationships such as contractual arrangements, joint ventures, financings or minority investments. There can be no assurance that we will be able to maintain or establish additional necessary strategic relationships, in which case the opportunity to grow our business may be negatively affected.
We operate in a highly competitive industry and competition in our industry would increase if new participants enter the biodiesel business.
We operate in a very competitive environment. The biodiesel industry is primarily comprised of smaller entities that engage exclusively in biodiesel production and large integrated agribusiness companies that produce biodiesel along with their soybean crush businesses. We face competition for capital, labor, feedstocks and other resources from these companies. In the United States, we compete with soybean processors and refiners, including Archer-Daniels-Midland Company, LLC, Cargill, Inc. and Louis Dreyfus Commodities. These and other competitors that are divisions of larger enterprises may have greater financial resources than we do. We also have many smaller competitors. If our competitors consolidate or otherwise grow and we are unable to similarly increase our scale, our business and prospects may be significantly and adversely affected.
In addition, petroleum companies and diesel retailers have not been engaged in biodiesel production to a large extent. These companies form the primary distribution networks for marketing biodiesel through blended petroleum-based diesel. If these companies seek to engage in direct or indirect biodiesel production, there will be less of a need to purchase biodiesel from independent biodiesel producers like us. Such a shift in the market would materially harm our operations, cash flows and financial position.
In the event we enter into new construction contracts, we may be exposed to a variety of risks that could affect our ability to realize profit.
While our construction services management business has had only limited external operations over the last two years, we intend to continue to pursue opportunities to provide these services. Substantially all of our revenues from our new facility construction services are derived from fixed unit price contracts. Fixed unit price contracts require us to perform the contract for a fixed unit price irrespective of our actual costs. As a result, we realize a profit on these contracts only if we and our subcontractors successfully estimate our costs and then successfully control actual costs and avoid cost overruns. Further, we have historically subcontracted substantially all of our construction work to Todd & Sargent, Inc. and TSW, LLC on a time and materials, rather than fixed, basis. As a result, we have less control over the largest component of our plant construction costs and the risk of cost overruns generally falls on us rather than our subcontractors. If we or our subcontractors do not execute a contract within cost estimates, then cost overruns may cause us to incur losses or cause the contract not to be as profitable as we initially expected. This, in turn, could negatively affect our cash flow, earnings and financial position.
55
The costs incurred and gross profit realized on our plant construction contracts can vary, sometimes substantially, from the original projections due to a variety of factors, including, but not limited to:
| • | onsite conditions that differ from those assumed in the original bid; |
| • | delays caused by weather conditions; |
| • | contract modifications creating unanticipated costs not covered by change orders; |
| • | changes in availability, proximity and costs of materials, including steel, concrete, aggregate and other construction materials; |
| • | availability and skill level of workers in the geographic location of a project; |
| • | our subcontractors’ or suppliers’ failure to perform; |
| • | mechanical problems with our subcontractors’ machinery or equipment; |
| • | citations issued by a governmental authority, including the Occupational Safety and Health Administration; |
| • | difficulties in obtaining required governmental permits or approvals; |
| • | changes in applicable laws and regulations; and |
| • | claims or demands from third parties alleging damages arising from our work. |
For example, if we or our subcontractors perform extra or change order work that is not approved by the customer in advance we may have a dispute with the customer over whether the work performed is beyond the scope of the work included in the original project plans and specifications or, if the customer agrees that the work performed qualifies as extra work, the price that the customer is willing to pay for the extra work. These disputes may result in us not receiving payment for all or a significant portion of work that we or our subcontractors have performed. Even where the customer agrees to pay for the extra work, we may be required to fund the cost of that work for a lengthy period of time until the change order is approved and paid by the customer. To the extent actual recoveries with respect to change orders or amounts subject to contract disputes or claims are less than the estimates used in our financial statements, the amount of any shortfall will reduce our revenues and profits, and this could have a material adverse effect on our working capital and results of operations.
We intend to pursue strategic initiatives to diversify our business that will require significant funding and management attention and these initiatives may not be successful.
We are seeking opportunities to diversify our product lines, both as a commercialization partner for companies engaged in the development of new advanced biofuels and by using our biorefinery platform to produce renewable chemicals from bio-mass feedstocks. There is no assurance that new technologies capable of economically producing advanced biofuels will be developed, that the developers of these technologies will select us as their commercialization partner or that the terms of any such collaborative arrangement will be favorable to us. Further, the renewable chemicals market is underdeveloped. Any chemicals that we produce from renewable sources may not prove to be as effective as chemicals produced from petroleum or other sources and, regardless of their effectiveness, renewable chemicals may not be accepted in the chemical marketplace. These strategic initiatives will require significant funding and management attention, and if we are not successful in implementing them, our financial condition and results of operations may be harmed.
56
RISKS RELATED TO THE BIODIESEL INDUSTRY
The market price of biodiesel is influenced by the price of petroleum-based distillate fuels, such as ultra-low sulfur diesel, and decreases in the price of petroleum-based distillate fuels or renewable identification number, or RIN, values would very likely decrease the price we can charge for our biodiesel, which could harm our revenues and profitability.
Historically, biodiesel prices have been strongly correlated to petroleum-based diesel prices and in particular ULSD regardless of the cost of producing biodiesel itself. We market our biofuel as an alternative to petroleum-based fuels. Therefore, if the price of petroleum-based diesel falls, the price of biodiesel could decline, and we may be unable to produce products that are a commercially viable alternative to petroleum-based fuels. Petroleum prices are volatile due to global factors such as the impact of wars, political uprisings, and other events, Organization of Oil Exporting Countries, or OPEC, production quotas, worldwide economic conditions, changes in refining capacity and natural disasters. Additionally, demand for liquid transportation fuels, including biodiesel, is impacted by economic conditions. Just as a small reduction in the real or anticipated supply of crude oil can have a significant upward impact on the price of petroleum-based fuels, a perceived reduction of such threats can result in a significant reduction in petroleum-based fuel prices. A reduction in petroleum-based fuel prices may have a material adverse affect on our revenues and profits if such price decrease reduces the price we are able to charge for our biodiesel.
Under RFS2 and its increasing required volume obligations, the price of biodiesel has been more sensitive to changes in feedstock costs. Increased RIN values have, in part, offset this premium in price resulting from higher feedstock costs. A reduction in RIN values may have a material adverse affect on our revenues and profits if such price decrease reduces the price we are able to charge for our biodiesel.
The development of alternative fuels and energy sources may reduce the demand for biodiesel, resulting in a reduction in our revenues and profitability.
The development of alternative fuels, including a variety of energy alternatives to biodiesel has attracted significant attention and investment. The construction of several renewable diesel plants by competitors has been announced. Under RFS2, renewable diesel made from biomass meets the definition of biomass-based diesel and thus is eligible, along with biodiesel, to satisfy the RFS2 biomass-based diesel requirement described in “Industry overview—Government Programs Favoring Biodiesel Use.” Furthermore, under RFS2, renewable diesel may receive up to 1.7 RINs per gallon, whereas biodiesel
57
currently receives 1.5 RINs. As the value of RINs increase, this 0.2 RIN advantage may make renewable diesel more cost-effective, both as a petroleum-based diesel substitute and for meeting RFS2 requirements. If renewable diesel proves to be more cost-effective than biodiesel, our revenues and results of operations would be adversely impacted.
The biodiesel industry will also face increased competition resulting from the advancement of technology by automotive, industrial and power generation manufacturers which are developing more efficient engines, hybrid engines and alternative clean power systems. Improved engines and alternative clean power systems offer a technological solution to address increasing worldwide energy costs, the long-term availability of petroleum reserves and environmental concerns. If and when these clean power systems are able to offer significant efficiency and environmental benefits and become widely available, the biodiesel industry may not be able to compete effectively with these technologies and government requirements for the use of biodiesel may not continue.
The development of alternative fuels and renewable chemicals also puts pressure on feedstock supply and availability to the biodiesel industry. If these emerging technologies compete with biodiesel for feedstocks, are more profitable or have greater governmental support than biodiesel does, then the biodiesel industry may have difficulty in procuring the feedstocks necessary to be successful.
The European Commission has imposed anti-dumping and countervailing duties on biodiesel blends imported into Europe, which have effectively eliminated our ability to sell those biodiesel blends in Europe.
In March 2009, as a response to the blenders’ tax credit, the European Commission imposed anti-dumping and anti-subsidy tariffs on biodiesel produced in the United States. These tariffs have effectively eliminated European demand for biodiesel blends of 20% biodiesel blends, or B20, or higher imported from the United States. The European Commission has extended these tariffs through 2014. In May 2011, the European Commission imposed similar anti-dumping and countervailing duties on biodiesel blends below B20. These duties significantly increase the price at which we and other United States biodiesel producers will be able to sell such biodiesel blends in European markets, making it difficult or impossible to compete in the European biodiesel market. These anti-dumping and countervailing duties therefore decrease the demand for biodiesel produced in the United States and increase the supply of biodiesel available in the United States market. Such market dynamics may negatively impact our revenues and profitability.
If automobile manufacturers and other industry groups express reservations regarding the use of biodiesel, our ability to sell biodiesel will be negatively impacted.
Because it is a relatively new product, research on biodiesel use in automobiles is ongoing. Some industry groups have recommended that blends of no more than 5% biodiesel be used for automobile fuel due to concerns about fuel quality, engine performance problems and possible detrimental effects of biodiesel on rubber components and other engine parts. Although some manufacturers have encouraged use of biodiesel fuel in their vehicles, cautionary pronouncements by other manufacturers or industry groups may impact our ability to market our biodiesel.
There is currently excess production capacity and low utilization in the biodiesel industry and if non-operational and underutilized facilities commence or increase operations, our results of operations may be negatively affected.
Many biodiesel plants in the United States do not currently operate, and of those that do, many do not operate at full capacity. The EPA reported as of April 2010 that 2.2 billion gallons per year of biodiesel production capacity in the United States were registered under the RFS2 program. Further, plants under
58
construction and expansion in the United States as of December 2010, if completed, could add an additional several hundred million gallons of annual biodiesel production capacity. The annual production capacity of existing plants and plants under construction far exceeds both historic consumption of biodiesel in the United States and required consumption under RFS2. If this excess production capacity was utilized for biodiesel production, it would increase competition for our feedstocks, increase the volume of biodiesel on the market and may reduce biodiesel gross margins, harming our revenues and profitability.
Perception about “food vs. fuel” could impact public policy which could impair our ability to operate at a profit and substantially harm our revenues and operating margins.
Some people believe that biodiesel may increase the cost of food, as some feedstocks such as soybean oil used to make biodiesel can also be used for food products. This debate is often referred to as “food vs. fuel.” This is a concern to the biodiesel industry because biodiesel demand is heavily influenced by government policy and if public opinion were to erode, it is possible that these policies would lose political support. These views could also negatively impact public perception of biodiesel. Such claims have led some, including members of Congress, to urge the modification of current government policies which affect the production and sale of biofuels in the United States.
Concerns regarding the environmental impact of biodiesel production could affect public policy which could impair our ability to operate at a profit and substantially harm our revenues and operating margins.
Because biodiesel is a new product, the environmental impacts associated with biodiesel production and use have not yet been fully analyzed. Under the 2007 Energy Independence and Security Act, the EPA is required to produce a study every three years of the environmental impacts associated with current and future biofuel production and use, including effects on air and water quality, soil quality and conservation, water availability, energy recovery from secondary materials, ecosystem health and biodiversity, invasive species and international impacts. A draft of the first such triennial report was released in January 2011, with the final report expected to be released in 2012. Should the 2012 study, future EPA triennial studies, or other analyses find that biodiesel production and use has resulted in, or could in the future result in, adverse environmental impacts, such findings could also negatively impact public perception of biodiesel and acceptance of biodiesel as an alternative fuel, which also could result in the loss of political support.
To the extent that state or federal laws are modified or public perception turns against biodiesel, use requirements such as RFS2 and tax incentives such as the blenders’ tax credit may not continue, which could materially harm our ability to operate profitably.
Problems with product performance, in cold weather or otherwise, could cause consumers to lose confidence in the reliability of biodiesel which, in turn, would have an adverse impact on our ability to successfully market and sell biodiesel.
Concerns about the performance of biodiesel could result in a decrease in customers and revenues and an unexpected increase in expenses. Biodiesel typically has a higher cloud point than petroleum-based diesel. The cloud point is the temperature below which a fuel exhibits a noticeable cloudiness and is the conventional indicator of a fuel’s potential for cold weather problems. The lower the cloud point, the better the fuel should perform in cold weather. The cloud point of biodiesel is typically between 30 °F and 60 °F, while the cloud point of the most common form of petroleum-based diesel fuel is typically less than 20 °F. When diesel is mixed with biodiesel to make a two percent biodiesel blend, the cloud point of
59
the blended fuel can be 2 °F to 6 °F higher than petroleum-based diesel and the cloud point of a twenty percent biodiesel blend can be 15 °F to 35 °F higher than petroleum-based diesel, depending on the individual cloud points of the biodiesel and petroleum-based diesel. Cold temperatures can therefore cause biodiesel blended fuel to become cloudy and eventually to gel, and this phenomena can lead to plugged fuel filters and other fuel handling and performance problems for customers and suppliers. The consequences of these higher cloud points may cause demand for biodiesel in northern and eastern United States markets to diminish during the colder months, which are the primary markets in which we currently operate.
The tendency of biodiesel to gel in colder weather may also result in long-term storage problems. In cold climates, fuel may need to be stored in a heated building or heated storage tanks, which result in higher storage costs. This and other performance problems, including the possibility of particulate formation above the cloud point of a blend of biodiesel and petroleum-based diesel, may also result in increased expenses as we try to remedy these performance problems. Remedying these performance problems may result in decreased yields, lower process throughput or both, as well as substantial capital costs. Any reduction in the demand for our biodiesel product, or production capacity of, our facilities will reduce our revenues and have an adverse effect on our cash flows and results of operations.
Growth in the sale and distribution of biodiesel is dependent on the expansion of related infrastructure which may not occur on a timely basis, if at all, and our operations could be adversely affected by infrastructure limitations or disruptions.
Growth in the biodiesel industry depends on substantial development of infrastructure for the distribution of biodiesel. Substantial investment required for these infrastructure changes and expansions may not be made on a timely basis or at all. The scope and timing of any infrastructure expansion are generally beyond our control. Also, we compete with other biofuel companies for access to some of the key infrastructure components such as pipeline and terminal capacity. As a result, increased production of biodiesel or other biofuels will increase the demand and competition for necessary infrastructure. Any delay or failure in expanding distribution infrastructure could hurt the demand for or prices of biodiesel, impede delivery of our biodiesel, and impose additional costs, each of which would have a material adverse effect on our results of operations and financial condition. Our business will be dependent on the continuing availability of infrastructure for the distribution of increasing volumes of biodiesel and any infrastructure disruptions could materially harm our business.
We may face competition from imported biodiesel, which may reduce demand for biodiesel produced by us and cause our revenues to decline.
Biodiesel produced in Canada, South America, Eastern Asia, the Pacific Rim, or other regions may be imported into the United States market to compete with United States produced biodiesel. These regions may benefit from biodiesel production incentives or other financial incentives in their home countries that offset some of their biodiesel production costs and enable them to profitably sell biodiesel in the United States at lower prices than United States-based biodiesel producers. Under RFS2, imported biodiesel may be eligible and, therefore, may compete to meet the volumetric requirements. This could make it more challenging for us to market or sell biodiesel in the United States, which would have a material adverse effect on our revenues.
Nitrogen oxide emissions from biodiesel may harm its appeal as a renewable fuel and increase costs.
In some instances biodiesel may increase emissions of nitrogen oxide as compared to petroleum-based diesel fuel, which could harm air quality. Nitrogen oxide is a contributor to ozone and smog. These emissions may decrease the appeal of biodiesel to environmental groups and agencies who have been historic supporters of the biodiesel industry, potentially harming our ability to market our biodiesel.
60
In addition, several states have acted to regulate potential nitrogen oxide emissions from biodiesel. Texas currently requires that biodiesel blends contain an additive to eliminate this perceived nitrogen oxide increase. California is in the process of formulating biodiesel regulations that may also require such an additive. In states where such an additive is required to sell biodiesel, the additional cost of the additive may make biodiesel less profitable or make biodiesel less cost competitive against petroleum-based diesel or renewable diesel, which would negatively impact our ability to sell our products in such states and therefore have an adverse effect on our revenues and profitability.
Several biofuels companies throughout the United States have filed for bankruptcy over the last several years due to industry and economic conditions.
Unfavorable worldwide economic conditions, lack of credit and volatile biofuel prices and feedstock costs have likely contributed to the necessity of bankruptcy filings by biofuel producers. Our business has been, and in the future may be, negatively impacted by the industry conditions that influenced the bankruptcy proceedings of other biofuel producers, or we may encounter new competition from buyers of distressed biodiesel properties who enter the industry at a lower cost than original plant investors.
| ITEM 2. | UNREGISTERED SALES OF EQUITY SECURITIES AND USE OF PROCEEDS |
On July 1, 2011, we issued 80,000 and 1,770,000 shares of its common stock to SoyMor Cooperative and SoyMor Biodiesel, LLC, respectively, in exchange for substantially all the assets of SoyMor Biodiesel, LLC and SoyMor Cooperative’s soy lecithin assets. Of the 1,850,000 shares issued, REG owns 166,139 shares due to its original investment in SoyMor Biodiesel, LLC. The sales of these securities were deemed to be exempt from registration under the Securities Act in reliance upon Section 4(2) of the Securities Act (or Regulation D or Regulation S promulgated thereunder),
| ITEM 3. | DEFAULTS UPON SENIOR SECURITIES |
None.
| ITEM 4. | (REMOVED AND RESERVED) |
| ITEM 5. | OTHER INFORMATION |
None.
61
| ITEM 6. | EXHIBITS |
(A) Exhibits:
| Exhibit No. |
Description | |
| 10.1 | Investment Agreement, dated as of July 15, 2011, by and among Renewable Energy Group, Inc. (the “Company”) and certain holders of the Company’s Series A Preferred Stock (incorporated by reference to exhibit 10.1 to the Company’s Current Report on Form 8-K). | |
| 10.2 | Second Amendment to Stockholders Agreement, dated as of July 15, 2011, by and among the Company and certain stockholders of the Company (incorporated by reference to exhibit 10.2 to the Company’s Current Report on Form 8-K). | |
| 10.3 | Consent and Amendment to Registration Rights Agreement, dated as of July 15, 2011, by and among the Company and certain stockholders of the Registrant (incorporated by reference to exhibit 10.3 to the Company’s Current Report on Form 8-K). | |
| 10.4 | Loan Agreement, dated as of August 4, 2011, by and among REG Albert Lea, LLC, USRG Holdco IX, LLC and USRG Management Company, LLC. (incorporated by reference to exhibit 10.1 to the Company’s Current Report on Form 8-K). | |
| 10.5 | Note of REG Alberta Lea, LLC. dated August 4, 2011 (incorporated by reference to exhibit 10.2 to the Company’s Current Report on Form 8-K). | |
| 10.6 | Pledge Agreement, dated as of August 4, 2011, by and among Renewable Energy Group, Inc. and USRG Holdco IX, LLC (incorporated by reference to exhibit 10.3 to the Company’s Current Report on Form 8-K). | |
| 10.7 | Guaranty of Renewable Energy Group, Inc. of the obligations of REG Alberta Lea, LLC (incorporated by reference to exhibit 10.4 to the Company’s Current Report on Form 8-K). | |
| 31.1 | Certification of the Chief Executive Officer pursuant to Rule 13a-14(a)/15d-14(a). | |
| 31.2 | Certification of the Chief Financial Officer pursuant to Rule 13a-14(a)/15d-14(a). | |
| 32.1 | Certification of the Chief Executive Officer pursuant to 18 USC Section 1350, as adopted pursuant to Section 906 of the Sarbanes-Oxley Act of 2002. | |
| 32.2 | Certification of the Chief Financial Officer pursuant to 18 USC Section 1350, as adopted pursuant to Section 906 of the Sarbanes-Oxley Act of 2002. | |
| 101 | Pursuant to Rule 405 of Regulation S-T, the following financial information from the Registrant’s Quarterly Report on Form 10-Q for the quarterly period ended June 30, 2011, is formatted in XBRL interactive data files: (i) Condensed Consolidated Statements of Operations; (ii) Condensed Consolidated Balance Sheets; (iii) Condensed Consolidated Statements of Cash Flows; (iv) Condensed Consolidated Statements of Comprehensive Income and (v) Notes to Condensed Consolidated Financial Statements. | |
62
SIGNATURES
Pursuant to the requirements of Section 13 or 15(d) of the Securities Exchange Act of 1934, the registrant has duly caused this report to be signed on its behalf by the undersigned, thereunto duly authorized.
Dated: August 11, 2011
| RENEWABLE ENERGY GROUP, INC. | ||||||||
| By: | /s/ Jeffrey Stroburg | |||||||
| Jeffrey Stroburg | ||||||||
| Chief Executive Officer and Director | ||||||||
| By: | /s/ Chad Stone | |||||||
| Chad Stone | ||||||||
| Principal Financial Officer | ||||||||
| By: | /s/ Chad Baker | |||||||
| Chad Baker | ||||||||
| Principal Accounting Officer | ||||||||
63